1 11/30/02 redox properties of human endothelial nitric oxide
TRANSCRIPT

1
11/30/02
REDOX PROPERTIES OF HUMAN ENDOTHELIAL NITRIC OXIDE SYNTHASE
OXYGENASE AND REDUCTASE DOMAINS PURIFIED FROM YEAST EXPRESSION
SYSTEM
Mei Du, Hui-Chun Yeh, Vladimir Berka*, Lee-Ho Wang and Ah-lim Tsai#
From: Division of Hematology, Department of Internal Medicine, University of Texas Health
Science Center at Houston, Houston, TX 77030
* The first three authors have almost equal contribution to this study.
This work was supported by U.S. Public Health Service Grants GM56818 (A.-L.T.),
# To whom correspondence should be addressed: Division of Hematology, University of Texas
Health Science Center, P. O. Box 20708, Houston, TX 77225. E-mail:[email protected]
Copyright 2002 by The American Society for Biochemistry and Molecular Biology, Inc.
JBC Papers in Press. Published on December 11, 2002 as Manuscript M209606200 by guest on D
ecember 12, 2018
http://ww
w.jbc.org/
Dow
nloaded from

2
FOOTNOTES
1The abbreviations used are: NOS, nitric oxide synthase; eNOS, endothelial nitric oxide
synthase; eNOSox, eNOS oxygenase domain; eNOSred, eNOS reductase domain; FMN, flavin
mononucleotide; FAD, flavin adenine dinucleotide; BH4, (6R)-5,6,7,8-tetrahydro-L-biopterin; 2'
and 3'-AMP, adenosine 2' and 3'-monophosphate; BCA, bicinchoninic acid; EPR, electron
paramagnetic resonance; ICP-MS, Inductively coupled plasma emission mass spectrometry; CPR,
cytochrome P450 reductase; CaM, calmodulin; SDS-PAGE, SDS polyacrylamide gel
electrophoresis; DCPIP, 2,6-dichlorophenol indophenol.
by guest on Decem
ber 12, 2018http://w
ww
.jbc.org/D
ownloaded from

33
ABSTRACT
Characterization of the redox properties of endothelial nitric oxide synthase, eNOS, is fundamental
to understanding the complicated reaction mechanism of this important enzyme participating in
cardiovascular function. Yeast overexpression of both the oxygenase and reductase domains of
human eNOS, i.e. eNOSox and eNOSred, has been established to accomplish this goal. UV-Vis and
EPR spectral characterization for the resting eNOSox and its complexes with various ligands
indicated a standard NOS heme structure as a thiolate hemeprotein. Two low-spin imidazole heme
complexes but not the isolated eNOSox were resolved by EPR indicating slight difference in heme
geometry of the dimeric eNOSox domain. Stoichiometric titration of eNOSox demonstrated that the
heme has a capacity for 1-1.5 reducing equivalent. Additional 1.5 –2.5 reducing equivalents were
consumed before heme reduction occurred indicating the presence of other unknown high-
potential redox centers. There is no indication for additional metal center that could explain this
extra electron capacity of eNOSox. Ferrous eNOSox, in the presence of L-arginine, is fully
functional in forming BH4 radical upon mixing with oxygen as demonstrated by rapid-freeze EPR
measurements. CaM binds eNOSred at 1:1 stoichiometry and high affinity. Stoichiometric titration
and computer simulation enabled the determination for three redox potential separations between
the four half reactions of FMN and FAD. The extinction coefficient could also be resolved for
each flavin for its semiquinone, oxidized and reduced forms at multiple wavelengths. This first
redox characterization on both eNOS domains by stoichiometric titration and the generation of
high-quality EPR spectrum for the BH4 radical intermediate illustrated the usefulness of these tools
in future detailed investigation into the reaction mechanism of eNOS.
by guest on Decem
ber 12, 2018http://w
ww
.jbc.org/D
ownloaded from

4
Nitric oxide synthase (NOS)1 is an uncommon self-sufficient P450-like enzyme catalyzing
nitric oxide (NO) biosynthesis from L-arginine (1-4). There are three mammalian NOS isozymes:
the constitutive neuronal NOS (nNOS) and endothelial NOS (eNOS) require calmodulin for
enzyme activity, whereas the inducible NOS (iNOS) contains tightly bound calmodulin (1-4). All
three isozymes have a common bi-domain structure with the reductase domain containing FAD,
FMN and NADPH binding sites, and the oxygenase domain harboring the heme center and binding
sites for L-arginine and tetrahydrobiopterin (BH4) (1-4). The main function of the reductase
domain is to provide reducing equivalents to the heme center in the oxygenase domain where the
key chemistry of L-arginine conversion occurs. Three substrates and four products are involved in
NOS catalysis. The overall reaction is a complicated 5-electron oxidation of the key guanidine
nitrogen plus three additional electrons from NADPH to reduce 2 molecules of oxygen to water
and form the L-citrulline. Several X-ray crystallographic structures for the iNOS and eNOS
oxygenase domains have been reported (5-7). The X-ray crystallographic data at 1.9 Å resolution
of C-terminal FAD-NADPH binding domain of the nNOS reductase domain was also published
recently (8). These data reveal a three-domain modular design. The FAD and NADPH binding
subdomains are superimposable on those of cytochrome P450 reductase (CPR) with an rms
deviation of 1.3 Å, while the more flexible FMN connecting domain shows a 3.9 Å rms to the α -
chain of CPR. The fourth domain that binds FMN is lost during crystallization but the structure is
projected to be similar to that of CPR. These crystallographic data give firm support for a modular
design of NOS thus provide basis to prepare subdomains for structure/function and reaction
mechanism studies. Investigation into individual break down modules could simplify the data
interpretation for each redox center and should be a useful approach in elucidation of the
by guest on Decem
ber 12, 2018http://w
ww
.jbc.org/D
ownloaded from

55
complicated reaction mechanism for NOS.
Overexpression systems for the individual oxygenase and reductase domain of NOS have
been developed in bacterial and baculovirus systems including our own group (9 - 17). Only few
are related to eNOS (6, 17). Large amount of eNOS were usually obtained by trypsinolysis from
intact bovine eNOS (13, 18). Although the baculovirus system is working (17), it is both time-
consuming and costly. The bacterial expression system (18), although fast, has unpredictable
sudden debilitating mutations in the expression construct and has resisted being scaled up to more
than few liters of culture in our hands for unknown reasons. Yeast expression could be an
alternative vehicle to generate large amount of active mammalian enzymes (19). Yeast has been
shown to be effective in overexpressing eNOS and the reductase domain of nNOS (14, 20). In this
study, we report the overexpression in yeast the oxygenase, eNOSox, and reductase, eNOSred,
domains of human eNOS and the characterization for their oxidation-reduction activities. Both
domains show behaviors very similar to the domains present in the whole eNOS and should be
useful tools for future biophysical and mechanistic investigations.
by guest on Decem
ber 12, 2018http://w
ww
.jbc.org/D
ownloaded from

66
EXPERIMENTAL PROCEDURES
Materials-- L-[2,3,4,5-3H]Arginine and 2',5'-ADP-Sepharose 4B were purchased from
Amersham Pharmacia Biotech. Inc. (17). BH4 was obtained from Schircks Laboratories (Jona,
Switzerland). Plasmids containing human eNOS cDNA in pGEM3Z and human eNOS polyclonal
antibodies were kindly provided by Dr. Pei-Feng Chen in our division (21). PCR kits, Expand
High Fidelity PCR System were the product of Roche Bioscience. Restriction enzyme PmeI was
purchased from New England Biolabs and the other restriction enzymes were from Life
Technologies, Inc. All reagents and devices for DNA extraction and isolation were products of
Qiagen. Easyselect Pichia Expression Kit containing the expression vector pPICZB, Pichia strain
GS115 and E. coil strain TOP10F’ was purchased from Invitrogen and used for the expression of
both eNOS domains. Reagents for electrophoresis and Western-blot were from Bio-Rad. The other
chemicals were from Sigma.
Expression of human eNOS domains--- Polymerase chain reaction (PCR) was used to
amplify the cDNA product. Human eNOS cDNA in pGEM3Z was used as template and DNA
fragments encoding oxygenase (amino acid 1-491) and reductase domain (amino acid 482-1204)
were amplified with specific primers. For oxygenase domain, the forward primer was 5’-
CGGAATTCAACATGCATCACCATCACCATCACGGCAACTTGAAGAGCGTG-3’
(translation start codon is underlined), and the backward primer was 5’-
GCTCTAGATCAGGTGATGCCGGTGCCCTTGGC-3’(translation stop codon is underlined).
For reductase domain, the forward primer was 5’-
CGGAATTCAACATGCATCACCATCACCATCACGG GAGTGCCGCCAAGGGC-3’, and the
backward primer was 5’-GCTCTAGATCAGGGGCTGTT GGTGTCTGAGCC-3’. In both
by guest on Decem
ber 12, 2018http://w
ww
.jbc.org/D
ownloaded from
7
forward primers, the EcoRI site and His6 tag were added, and in each backward primer an XbaI
site was added. The correct sequences of the PCR products were confirmed by primer extension
sequencing. Both PCR products were double-digested with EcoRI and XbaI and subcloned
separately into the corresponding sites of an AOX promoter-driven expression vector pPICZB to
obtain a 1.5 kb insert of eNOSox and a 2.1 kb insert of eNOSred. The constructs were linearized
with PmeI, transformed into yeast P. pastoris GS115, and selected by growing on the
YPDS/Zeocin plates containing 1% yeast extract, 2% peptone, 2% dextrose, 1M sorbitol and 100
µg/ml Zeocin. The colony that grew fastest was inoculated into 25 ml buffered minimal glycerol
medium (100 mM potassium phosphate, pH 6.0, 1 % yeast extract, 2 % peptone, 1.34 % yeast
nitrogen base with ammonium sulfate without amino acids, 4 x 10⁻⁵ % biotin and 1 % glycerol) and
cultured at 30 oC overnight. This culture was then transferred to a 250 ml buffered minimal
glycerol medium and grown at 30 oC overnight to A600 = 7~10. Cells were harvested and
resuspended in 250 ml buffered minimal methanol medium (100 mM potassium phosphate, pH
6.0, 1 % yeast extract, 2 % peptone, 1.34 % yeast nitrogen base with ammonium sulfate without
amino acids, 4 x 10⁻⁵ % biotin and 0.5 % methanol) with 4 mg/liter hemin chloride added and
cultured for 72 hrs at 30 oC to induce protein expression.
Protein purification--Yeast cells were harvested and washed with buffer 1 (50 mM Tris-
HCl, pH 8.0) with protease inhibitors (1 µM Leupeptin, 1 µM Antipain, 1 µM pepstatin A and 1
mM phenylmethylsulfonyl fluoride) and resuspended in equal volume of buffer 1 with protease
inhibitors. An equal volume of glass beads (425-600 microns) was added to the suspension. Cells
were broken by 10 cycles of 30s vortexing and brief chilling on ice. Cell debris and glass beads
were removed by centrifugation at 3400 r.p.m. The supernatant obtained after another
by guest on Decem
ber 12, 2018http://w
ww
.jbc.org/D
ownloaded from

8
centrifugation at 12,000 r.p.m. in microfuge, was applied to a 2-ml Ni-NTA agarose column. The
column was first washed with 50 bed volume of buffer 1 plus protease inhibitors, then ~30 bed
volume buffer 1 plus 0.3 M NaCl and 1 mM L-histidine, then ~20 bed volume buffer 1 plus 0.1 M
NaCl and 5 mM L-histidine. Finally, buffer 1 plus 40 mM L-histidine was used to elute bound
oxygenase domain, and 100 mM L-histidine for the reductase domain. The eluate was concentrated
by Centriprep-50, then applied to a 10-DG column (Bio-Rad) and eluted with 50 mM HEPES, pH
7.4, containing 0.1 M NaCl and 10 % glycerol, to remove histidine.
Biopterin and flavin determination – The content of BH4, FAD and FMN of purified eNOS
domains was measured as described previously (17, 21) and quantified from a standard curve of
authentic BH4, FAD or FMN, respectively. Biopterin determination was done on eNOSox with or
without reconstitution with exogenous BH4. BH4 reconstitution was done similar to the published
procedures (9, 22) under anaerobic condition. The excess amount of BH4 was removed by gel-
filtration and the amount of bound BH4 was determined using our HPLC quantitation similar to the
published procedure using authentic BH4 to build a standard curve (23).
Pyridine hemochromogen Assay – Heme content was determined by the formation of
pyridine hemochromogen as previously described (24). The total heme content was determined
from difference spectrum of bispyridine heme (reduced minus oxidized) using ∆ ε556−538nm = 24
mM-1 cm-1.
Quantification of thiol functional groups – Surface exposed thiol groups were determined
by chemical modification using 4,4’-dithiopyridine to form 4-thiopyridone chromophore with
major absorbance at 343 nm. The 4,4’-dithiopyridine itself has almost no absorption at that
wavelength (25).
by guest on Decem
ber 12, 2018http://w
ww
.jbc.org/D
ownloaded from

9
eNOSred activity assay - Cytochrome c reductase activity was measured as the absorbance
increase at 550 nm using ∆ ε = 21 mM-1 cm-1 as described previously (17). Ferricyanide or 2,6-
dichlorophenol indolphenol oxidation assay was determined by ∆ ε = 1 mM-1 cm-1 at 400 nm and
∆ε = 21 mM-1 cm-1 at 600 nm, respectively (14).
eNOSox Activity in generating biopterin radical. This activity measurement essentially
followed previous published procedure for iNOSox (26, 27). High concentration of BH4-
reconstituted eNOSox was reduced anaerobically in a tonometer by dithionite titration. The ferrous
eNOSox was then reacted with oxygenated buffer using rapid-freeze/EPR technique as we
previously published (28). The rapid-freeze apparatus, System 1000, Update Instrument (Madison,
WI), was placed inside an anaerobic chamber (Coy Laboratory, MI). The oxygen level was lower
than 5 ppm during the whole experiment procedure monitored by an oxygen/hydrogen analyzer
(Model 10, Coy Laboratory). One or two push programs were used to obtain samples freeze
trapped at different reaction time.
Spectrometry - UV-Vis spectra were measured on a HP8453 diode array spectrophotometer
with 1 nm spectral bandwidth. EPR was recorded at liquid helium or liquid nitrogen temperature
on a Bruker EMX. For liquid helium system, a GFS600 transfer line and an ITC503 temperature
controller were used to maintain the temperature. An Oxford ESR900 cryostat was used to
accommodate the sample. For liquid nitrogen transfer, a silver-coated double jacketed glass
transfer line and a BVT3000 temperature controller was used. Data analysis was conducted using
WinEPR and spectral simulation was done using SimFonia programs provided by Bruker. Flavin
fluorescence was measured using SLM SPF-500C spectrofluorometer at ratio mode. About 2 µM
eNOSred in a 1-cm quartz cuvette was excited at 450 nm (5 nm spectral band width) and the
by guest on Decem
ber 12, 2018http://w
ww
.jbc.org/D
ownloaded from

10
emission spectrum between 450 – 650 nm (7.5 nm spectral band width) was collected at 24 oC.
Stoichiometric titration- The redox capacity of eNOSred and eNOSox were determined by
anaerobic stoichiometric titration using sodium dithionite. Stock solution of sodium dithionite was
freshly prepared by dissolving powdered reagent in 50 mM, pH 8.2 pyrophosphate buffer pre-
saturated with pure nitrogen gas. The concentration of sodium dithionite was standardized by
titration against a fixed amount of lumiflavin-3-acetic acid (ε444 = 1.08 x 10⁴ M-1cm-1) anaerobically
before and after individual real sample titration (29). The average concentration was used to
calculate the number of reducing equivalents consumed in the titrations. Each protein sample was
placed in an anaerobic titrator and made anaerobic by 5 cycles of evacuation (30 sec.) and argon
replacement (5 min). Standardized dithionite solution contained in a gas-tight syringe engaged to
the side arm of the titrator was quantitatively delivered and mixed with the protein sample under
argon atmosphere. Electronic spectrum was recorded on an HP 8452 diode spectrophotometer and
to confirm the system was equilibrated after each addition of dithionite reflected by a static
absorbance.
Miscellaneous methods--- Protein content was determined by BCA method (30). Sodium
dodecyl sulfate polyacrylamide gel electrophoresis (SDS-PAGE) was performed on 10 % Ready-
Gels in a Bio-Rad mini-gel apparatus. The gel filtration chromatography was performed on a
Sephacryl 200 HR column (1.5 x 5.0cm). The kit for molecular weight 12,000—200,000 (product
code: MW-GF-200) was used as the gel filtration marker.
Computer modeling
The SCoP program (Simulation Resources Inc., Redlands, CA) was used for simulating the
data obtained from stoichiometric titration, mainly the eNOSred similar to the method used by
by guest on Decem
ber 12, 2018http://w
ww
.jbc.org/D
ownloaded from

11
Iyanagi et al. (31). The absorbance changes at different monitoring wavelength during titration
were simulated against accumulated reducing equivalents added.
Aλ = ε1*F1 + ε2* F1H +ε3*F1H2 + ε4*F2 +ε5*F2H + ε6*F2H2 [1]
Aλ is the observed absorbance at wavelength λ , ε1 - ε6 are the extinction coefficients for each
flavin redox species: F1, F1H, F1H2 as fully oxidized, semiquinone, fully reduced form of the first
flavin, respectively, and F2, F2H, F2H2 are the equivalents for the second flavin. The
concentrations of each flavin intermediate during a stoichiometric titration are expressed by:
F1 = ((x1*x2)/(1 +x2+x1+x2))*f1 [2]
F1H =(x2/(1+x2+x1*x2))*f1 [3]
F1H2 = (1/(1+x2+x1*x2))*f1 [4]
F2 =((x3*x4)/(1+x4+x3*x4))*f2 [5]
F2H =(x4/(1+x4+x3*x4))*f2 [6]
F2H2 = (1/(1+x4+x3*x4))*f2 [7]
Where f1, f2 are the total amount of each flavin and
x1 = exp((F/(R*T))*(Eh-E1)) [8]
x2 = exp((F/(R*T))*(Eh-E2)) [9]
x3 = exp((F/(R*T))*(Eh-E3)) [10]
x4 = exp((F/(R*T))*(Eh-E4)) [11]
E1 – E4 are midpoint potential of the four half reactions of the two flavins in eNOSred, Eh is any
measured redox potential value. F is the Faraday constant, 96,485 C mol-1, R is the gas constant,
8.314 J K-1mol-1, and T is 298K. The total reducing equivalents was simply expressed as:
Equiv. = 2* ((F1H + 2*F1H2 + F2H + 2* F2H2)/ft) [12]
by guest on Decem
ber 12, 2018http://w
ww
.jbc.org/D
ownloaded from
12
Where ft is the total flavin, i.e., sum of f1 and f2.
Simulation was generated by sweeping the Eh values in any desired potential range and seeking
optimal values for E1 –E4 to achieve the best fit to the observed data. It is not possible to achieve a
set of absolute midpoint potentials but could converge the relative midpoint potential values. In
other words, once one of E1 to E4 values is fixed the other three can be located by simulation.
Absorbance extinction coefficient for the fully-oxidized and fully-reduced flavins are readily
available, and those for the flavin semiquinone can be properly estimated from the spectrum at the
stage of 1 and 3-electron reduced states. We also let these two coefficients floating in a narrow
range and optimized via simulation.
by guest on Decem
ber 12, 2018http://w
ww
.jbc.org/D
ownloaded from

136
RESULTS
Expression and purification of eNOS subdomains: The yeast expression vector containing AOX
promoter is promising in over-expressing both domains of eNOS in Pichia pastoris. By
introducing His6 tag in the N-terminus of both domains, purification of target protein can be
conveniently done by Ni-NTA agarose column chromatography. The average yields of purified
oxygenase domain and reductase domain are ~ 8mg/l and ~22mg/l, respectively. Both purified
eNOSox and eNOSred run as a single band on SDS-PAGE with apparent molecular weights of 54
kDa and 82 kDa, respectively (Figure1A) and exhibited immunoreactivity with polyclonal
antibodies against eNOS (Figure 1B).
The heme content determined by pyridine hemochromogen assay was 0.93 ± 0.04 (n = 7),
almost stoichiometric to the protein subunit (Table 1). Replenish hemin or ? -aminolevulinic acid to
the cell medium during yeast growth did not further increase the heme content in purified eNOSox.
The purified oxygenase domain also contained endogenous biopterin at a stoichiometry lower than
0.3/monomer. As our sample buffers did not include DTT, most of these biopterin molecules were
present as dihydrobiopterin, BH2, as analyzed by our HPLC method (data not shown). The
functional form of biopterin, BH4, can be reconstituted back to the purified eNOSox according to
the anaerobic procedure similar to that described by Rusche and Marletta (22). The reconstituted
eNOSox has biopterin content as high as 0.72 per monomer (Table 1) and are present as fully
reduced form, BH4, as analyzed by our HPLC method (data not shown).
The content of both FAD and FMN in purified eNOSred is essentially stoichiometric based
on our HPLC determination against authentic FAD and FMN standards (Table 1). The ratio of
FAD and FMN to that of eNOSred monomer is 1.0 and 1.14, respectively, thus further
reconstitution of flavins is unnecessary.
by guest on Decem
ber 12, 2018http://w
ww
.jbc.org/D
ownloaded from

14
Spectroscopic characteristics of eNOSox. UV-Vis spectrum from 250 – 700 nm of purified eNOSox
showed a Soret peak at 400 - 404 nm, 81 mM-1cm-1, a broad α / β band at 518 nm, 15.4 mM-1cm-1,
and a charge-transfer band at 645 nm, 5.8 mM-1cm-1. Treatment with L-arginine shifted the Soret
peak to 396 nm with comparable amplitude, 82 mM-1cm-1, and only slight changes in the visible
region (Fig. 2). When eNOSox was reduced by dithionite, the Soret band is red-shifted to 413 nm
with sizable decrease in intensity, 66.7 mM-1cm-1. The α / β band also shifted to 552 nm, 13.0 mM-
1cm-1, and the charge-transfer band at about 650 nm is abolished as the lower lying three metal d-
orbital are completely filled. Further addition of CO resulted in the hallmark 444 nm Soret band
for P450 hemeproteins with an extinction of 91.3 mM-1cm-1 with the features at visible region very
similar to that of ferrous eNOSox. These spectral behaviors are very similar to our bacterial-
expressed eNOSox and other NOS oxygenase domains (9, 13, 17). The ratio of 280 nm to the Soret
peak to either the resting or L-arginine-treated eNOSox was ~1.5 which is an index of the purity of
the hemeprotein and is a good number compared with other NOS preparations (9, 13, 17).
Liquid helium temperature EPR of the resting eNOSox showed mixture of high-spin and
low-spin heme structures (Fig. 3, spectrum A). The rhombic high-spin heme has g tensor values of
7.53, 4.23 and 1.83 (the gmin was only observable at somewhat lower temperature, ~ 4K) and the
low-spin heme show conspicuous rhombic g values at 2.43, 2.28 and 1.90. Both sets of parameters
are typical for NOS and other P450 type hemeproteins containing a cysteine thiolate proximal
heme ligand (32, 33). Addition of excess amount of L-arginine essentially wiped out the low-spin
heme signals and substantially increased the high-spin heme signals (Fig. 3, spectrum B). The g
values of the high-spin heme shifted to 7.56, 4.17 and 1.82, corresponding to a small rhombicity
shift from 20.6 to 21.1 %. On the other hand, imidazole converted eNOSox to fully low-spin heme
by guest on Decem
ber 12, 2018http://w
ww
.jbc.org/D
ownloaded from

15
complex (Fig. 3, spectrum C). There are two well-resolved rhombic low-spin heme complexes
with g values of 2.71/2.29/1.75 and 2.60/2.29/1.81. Resolution in EPR spectrum of the two
imidazole low-spin heme is even better than that found for whole eNOS (33).
Stoichiometric titration of the eNOSox. To determine the redox capacity of the purified eNOSox, a
stoichiometric titration was conducted using standardized dithionite solution. L-arginine was added
to make the heme homogeneously high-spin. The spectral conversion from ferric to ferrous heme
during the course of titration appeared to involve only one simple redox reaction as evidenced by
the isosbestic points at 410, 489, 532, 615, and 678 nm for both the absolute and difference spectra
relative to the resting eNOSox spectrum. An isosbestic point at 338 nm was slightly perturbed by
dithionite whose absorption peaks at 314 nm (Fig. 4A and Inset). However, the optical amplitude
changes at 444 – 388 nm showed a long lag for 1.5-2.5 (in three separate titrations) reducing
equivalents before a sharp rise. 1-1.5 reducing equivalents were needed to completely reduce
eNOSox (Fig. 4B). The additional 1.5-2.5 reducing equivalents consumed during titration were not
due to oxygen contamination as assessed by lumiflavin titration using the same titration vessel and
conditions. Furthermore, similar stoichiometric titrations performed on eNOSred did not show an
initial long lag (see below). The extra reducing equivalents used to titrate eNOSox could be due to
oxidized biopterin or free sulfhydryl group at the protein surface. The former may be a
consequence of autooxidation of BH4 and the latter could be due to the loss of the zinc cluster,
which coordinate with four cysteine ligands with two cysteines from each monomer (2, 5, 6).
However, the samples used in these titrations are not BH4-replenished. The content of biopterin
was as low as 0.2-0.3/heme and was preset as BH2, which is not reducible by dithionite. This left
the zinc loss as the most possible cause of the additional consumption of dithionite in the titration.
Three experiments were conducted to assess this hypothesis. Zinc analysis by ICP-mass was
by guest on Decem
ber 12, 2018http://w
ww
.jbc.org/D
ownloaded from

16
carried out using either eNOSox or purified whole eNOS. Sufficient amount of zinc was determined
by ICP-MS analysis (data not shown). Gel-filtration chromatography was conducted to determine
the population of eNOSox monomer and dimer. Molecular sieving using five molecular weight
standards and purified eNOSox indicated that the whole population is present as a dimer with a
molecular weight greater than 100 kDa (Fig. 5). Titration of free thiol by 4,4’-dithiopyridine was
also conducted on eNOSox using free L-cysteine as positive control. Time-dependent modification
of the thiol was monitored in parallel with urea-treated eNOSox and a bovine eNOSox
predetermined to have zinc and present as a dimer (5) (Fig. 6). Both yeast expressed human
eNOSox and eNOSox trypsinolyzed from bacterial expressed bovine eNOS exhibited almost
identical kinetics of chemical modification (Fig. 6). Two to three thiol groups were easily modified
in both protein samples at a rate of 0.5 min-1, but the next six residues were modified much slower
at 0.02 min-1. Pre-treatment of 5 M urea significantly enhanced the extent of chemical modification
in the fast phase as a result of exposure of about additional 2-3 thiol groups. The rates of the two
phases remain similar, 0.5 and 0.02 min-1, respectively, but the contribution of each phase shifted
from 2:5 to 4:2.5 after urea treatment. Moreover, the overall extent of modification after 2-hr
period remained the same as eNOSox sample not treated by urea. In contrast, free L-cysteine
followed simple modification kinetics and the rate, 8 min-1, is even faster than the fast phase of that
observed for eNOSox samples.
Tetrahydrobiopterin radical formation of eNOSox. BH4-reconstituted eNOSox prepared at a
concentration of ~300 µM was premixed with excess L-arginine and reacted with oxygenated
buffer anaerobically at room temperature and freeze trapped at several time points. EPR spectrum
corresponding to 100 ms reaction time is given in Fig. 7. EPR recorded at 11K between 200 - 4200
by guest on Decem
ber 12, 2018http://w
ww
.jbc.org/D
ownloaded from

17
G revealed both the heme component and the radical component (Fig. 7A). EPR spectrum of a
control L-arginine-treated eNOSox was also recorded under the same EPR conditions. Two spectra
are normalized to the same concentration of heme. Approximately 50% of the BH4 is converted to
BH4 radical and other diamagnetic heme intermediates estimated from the decrease of the high-
spin heme signal amplitude. The radical signal observed at g = 2 region was remeasured at 120K
(Fig. 7B). The hyperfine feature pertaining to nitrogen and proton splittings are clearly revealed.
The biopterin radical centered at g = 2.002 and an overall line width of 39 G. Microwave power
dependence indicates a strong magnetic interaction with the heme center with a P1/2 as high as 14
mW at 120 K (data not shown). Spin concentration was estimated by double integration of the EPR
signal, using a copper standard, to be ~ 20 µM. After correction for the ~ 4× dilution factor during
rapid freeze, we essentially observed ~ 80 µM radical, equivalent to about 40 % of the total
biopterin as BH4/heme ratio was ~ 0.7. This radical EPR could be closely simulated by including
one strongly-coupled nitrogen at N5, one alpha-proton at N5 and one beta proton at C6 (dashed
line in Figure 7 B).
Enzyme activities of eNOSred. Cytochrome c reductase activity, DCPIP and ferricyanide reduction
activities were evaluated for eNOSred expressed in yeast (Table 2). Cytochrome c reductase activity
was 70.3 mols/min/mol and was increased about 2-3 fold, 194.3 mols/min/mol, in the presence of
Ca+2/CaM. This effect of CaM was less than we previously observed for baculovirus-expressed
eNOSred (17). However, the absolute activity, both in the presence and absence of CaM, are higher
than the values reported for sf9-expressed eNOSred and eNOS, i.e. 13.8/20.9 and 138/224 without
and with Ca+2/CaM, respectively. Both ferricyanide and DCPIP reductase activities were greater
than that of cytochrome c reductase. Ferricyanide reductase activity increased from 3220 to 4480
by guest on Decem
ber 12, 2018http://w
ww
.jbc.org/D
ownloaded from
1189
min-1 by Ca+2/CaM whereas DCPIP reductase activity was increased from 400 to 800 min-1 by
adding Ca+2/CaM (Table 2). Our data are compatible with literature data for eNOSred or full eNOS
(Table 2). Although there are some variations of cytochrome c and ferricyanide reductase activities
among different eNOS or eNOSred preparations, most of them are within the same order of
magnitude (Table 2). Differences in assay temperature, expression system and buffer composition
could be the reasons that resulted in these variations.
Flavin fluorescence of eNOSred and its interaction with calmodulin, CaM. The emission spectrum
of isolated eNOSred shows a broad band from 470 to 650 nm peaked at ~ 528 nm (Fig. 8). The
intensity of the fluorescence was increased by ~ 30 % in the presence of Ca+2/CaM, but there was
no obvious shift of the peak. Excess EDTA could only reverse ~ 80 % of the fluorescence change
caused by Ca+2/CaM (Fig. 8). This residual fluorescence increase, which is not reversed by EDTA,
could be simply the slight increase of intensity caused by Ca+2 alone (data not shown). This
fluorescence change provided a nice index to determine the CaM binding. Titration of micromolar
level of eNOSred with CaM in the presence of Ca+2 showed a sharp breaking point at 1:1 ratio of
CaM to eNOSred (Inset of Fig. 8). This result indicated that the Kd of CaM is significantly lower
than micromolar and each reductase domain binds one CaM.
Stoichiometric titration of eNOS red. Identical anaerobic titration procedure as eNOSox titration was
applied here to determine the redox capacity in eNOSred using dithionite as titrant. A total of four
reducing equivalents were required to fully reduce eNOSred accounted exactly for the capacity of
two flavin cofactors (Figure 9). No additional redox centers other than the FAD and FMN was
disclosed by this titration. There are three stages of reduction observed in the dithionite titration.
The first stage took one reducing equivalent and the electronic spectra showed isosbestic points (~
by guest on Decem
ber 12, 2018http://w
ww
.jbc.org/D
ownloaded from

19
366 and ~ 508 nm) in this process (Figure 9A), indicating a single redox transformation step. The
absorbance decrease at 456 nm and the corresponding increase at 600 nm are attributed to the
formation of a neutral flavin semiquinone. The second stage took two reducing equivalents. It
appeared to show one isosbestic point (~342 nm) but is not conclusive indicating that this stage is
likely involved at least two chemical reaction steps (Figure 9B). There was a large decrease of 456
nm absorbance accompanied by a small change at 600 nm. The last stage involved one-electron
reduction to reach fully reduced state (Figure 9C). The further bleaching of 456 and 600 nm
absorbance evidenced disappearance of both the oxidized flavins and flavin semiquinone. The
general titration profile is very similar to that published for microsomal CPR and nNOS reductase
domain (14, 31, 34).
Computer simulations for the reductive titration data. The data shown in Figure 9D at three
different wavelengths were simulated by SCoP program according to Eqs. 1 – 12 to obtain three
redox potentials gaps, ∆ E1 – ∆ E3, between four half reactions of two flavins in eNOSred (31).
Computer simulation for the data at 456, 508 and 600 nm was successful as indicated by the close
match of the simulations and the actual data except the initial < 0.3 reducing equivalents (Fig. 9D).
The initial short lag was probably due to residual amount of oxygen in the titrator. This simulation
process was tested using any arbitrary absolute midpoint potential value for one of the four half
reactions and to zoom in the values for ∆ E1 – ∆ E3. The variation for each of the redox potential
gap is not significant as shown in Table 3. The optimal value for ∆ E1 is the biggest, 180 mV, and
a clean conversion from one oxidized flavin to the semiquinone form is expected in the first stage
of titration. In contrast, ∆ E2 is almost zero indicating that the second stage of reduction consisted
of two almost parallel half reactions. The value of ∆ E3, 73 mV, is in the middle and could be used
by guest on Decem
ber 12, 2018http://w
ww
.jbc.org/D
ownloaded from

20
to estimate the cutoff point to obtain the absorbance contribution from only one specific half-
reaction. The extinction coefficients at three different wavelengths were also converged by several
simulation cycles and were shown in Table 4. In principal, we could conduct this simulation
cycles on any wavelength between 300 and 700 nm and to reconstruct the spectrum for each of the
six flavin redox species.
DISCUSSION
We have successfully prepared both eNOSox and eNOSred using yeast expression system.
Purified eNOSox domains appear to have most of the heme characteristics in intact eNOS. The
optical spectra of ferric and ferrous eNOSox and its ferrous-CO complex and the spin-state change
by L-arginine are all typical for eNOS and eNOSox we observed previously (17, 21, 24). The purity
index expressed as the ratio of A280/A396 was as good as 1.3- 1.6 compared to 1.5 –1.7 in our
previous baculovirus expressed recombinant protein (17). This ratio is not as good as recent
iNOSox preparation expressed from E.coli (9) but our oxygenase domain does not have the N-
terminal heterogeneity as observed for iNOSox as only one single peptide band was observed on
SDS-PAGE at ~50 kDa region (9).
EPR spectrum of the isolated eNOSox showed dominant low-spin P450-type heme. Using
the low-field g = 7.5 signal amplitude to estimate the spin-state population against the L-arginine-
treated eNOSox, about 75 % of the heme was present as low-spin. This high proportion of low-spin
heme is at odds with the room temperature optical data (Fig. 2 vs. Fig. 3) judging from the similar
amplitude of the charge-transfer band at 650 nm of the resting eNOSox and eNOSox treated with L-
arginine. Optical data implied that majority of the heme was present as high-spin, thus a
by guest on Decem
ber 12, 2018http://w
ww
.jbc.org/D
ownloaded from

21
temperature-dependent heme spin-state change likely occurred with the low-spin heme electronic
configuration as the ground state. Truth diagram analysis for the correlation between heme
rhombicity and axial ligand field strength for the low-spin heme component put the eNOSox at the
lower right edge of the P zone, indicating a P450-like protein (33). The rhombic distortion (V),
axial perturbation (∆ ) and heme rhombicity (%) obtained were 2.09, 5.75 and 36.4, respectively.
There might be another low-spin component present as indicated by the shoulder at the g = 2.43
signal. However, this additional component is not as visible as that observed for full eNOS and
only the low-rhombicity low-spin heme component appears present in the isolated eNOSox (33). In
contrast, imidazole low-spin heme complex showed two better-resolved EPR species than the
corresponding imidazole complex of full eNOS (compare Fig. 3, spectrum C with Fig. 6a in 33)
with very similar g values for the two sets of low-spin heme complexes. The calculated values of
V, ∆ and % rhombicity for the two low-spin species are 2.52/4.53/56% and 2.63/4.05/65%,
respectively, and places these two heme complex at the center of the P zone. Among the entire
low-spin imidazole heme complex, there was a reciprocal relationship between the heme
rhombicity and the tetragonality, indicating that the heme rhombic distortion attenuate the axial
ligand intensity, possibly via a lengthening of the Fe-S bond.
The extra 1.5 – 2.5 reducing equivalents required to initiate the heme reduction in the
stoichiometric titration is puzzling (Fig. 4). These additional equivalents are not originated from
biopterin as the amount of pterin was too low to account for this amount of reducing equivalents
and dithionite does not reduced BH2 to BH4 due to unfavorable redox thermodynamics (35). The
zinc loss is not the reason as there is plenty of zinc present in isolated eNOSox assessed by ICP
mass analysis. The isolated eNOSox is a perfect dimer as analyzed by gel-filtration. Monomeric
by guest on Decem
ber 12, 2018http://w
ww
.jbc.org/D
ownloaded from

22
form was not even detected. Furthermore, the titration for the surface exposed thiol function group
showed identical modification kinetics as another bovine eNOSox whose crystallographic data
indicates the presence of zinc cluster. Thus the hypothesis that a zinc loss leading to surface
exposed disulfide linkage as that found in the iNOSox crystallographic data does not apply to our
isolated eNOSox (7). Furthermore, the possibility for propensity of zinc loss in recombinant
eNOSox but not in intact eNOS may be unfounded in our yeast expression system. We do not see
additional metal redox centers such as heme, iron-sulfur cluster or copper center by optical or EPR
spectroscopy, thus leave us with no explanation for the extra reducing equivalents which show
much higher redox potential than the heme center. Reduction of the heme center appeared to
consume more than one reducing equivalent (1-1.5 in three experiments). A similar case in iNOSox
was also observed recently (9). The sharp increment of absorbance change at the beginning of the
titration and a curvature and even tailing approaching the end of the titration seems to indicate that
the titrant may not have electron donating power strong enough to completely reduce all the heme
molecules. Considering the very negative midpoint potential of thiolate-ligated heme, it is possible
in the later portion of the titration that only part of the reducing equivalents from dithionite were
donated to the heme center dictated by the midpoint potential difference between the heme and
dithionite (36). We thus put more emphasis in using the initial linear sharp rise to estimate the end
point of titration. By doing this, we get a stoichiometry closer to 1 rather than 1.5.
The biological activity of our eNOSox was demonstrated by its capability in forming
biopterin radical (Fig. 7). We chose this method as it is directly linked to the redox function of the
protein and provide detailed information regarding the reaction mechanism of eNOS. In our study,
the radical signal plateaued at ~100 ms at room temperature. The line shape, intensity and initial
by guest on Decem
ber 12, 2018http://w
ww
.jbc.org/D
ownloaded from

23
kinetics of biopterin radical formation appeared very similar to those published for iNOSox (26,
27). Computer simulation for the BH4 radical indicates a minimal requirement for one nitrogen and
two proton nuclei to match the EPR data. As N5 (or its 4a carbon) is para to the electron-releasing
amino group at C2 and thus has high electronegativity, it is thus more favorable than N8 to give
the first electron. N8 (or its 8a carbon) is meta to C2 and C4; thus electron withdrawal can only
occur via conjugation with 4-oxo group. The pKa of the N5 proton is much higher than neutral and
is not dissociated easily, thus a hyperfine interaction of this proton with the unpaired electron at N5
is expected. The second proton has to come from the C6 beta proton. Such initial trial of
simulation appears fairly promising. Our observed biopterin radical is thus likely a BH4+· cation
radical (37, 38). Although N8 nuclei and its associated proton have been proposed to involve in the
unpaired spin system (37), it remains to be clarified by further spectroscopic studies using isotope
replacement. Nonetheless, we presented here the first high quality EPR spectrum of eNOS
biopterin radical and will pursue the mechanistic role of biopterin using rapid-freeze EPR approach
in parallel with stopped-flow and other kinetic methods.
eNOSred activity was assessed by three different assays. The cytochrome c reduction and
the DCPIP reduction assays require the participation from both flavins and ferricyanide reduction
activities were believed to involve only FAD (39). In all cases, CaM enhanced the activity and the
enhancement for cytochrome c reduction and DCPIP reduction activity to a similar extent. Why we
only see ~ 3 × activity increase for the cytochrome c reductase activity by CaM by our yeast
protein and 10 × increase in our previous sf9 expressed eNOSred is unclear (Table 2). Nonetheless,
CaM appeared to interact both between FMN and the heme as well as between FAD and FMN as
initially observed in nNOS (40). There are many factors that enhance the reductase activity of
eNOS including the CaM binding, the removal of the autoinhibitory peptide and the
by guest on Decem
ber 12, 2018http://w
ww
.jbc.org/D
ownloaded from

24
phosphorylation of the C-terminus of the reductase (1, 39, 41, 42). Furthermore, the presence of
DTT, EDTA and variation in ionic strength during different stage of the purification also affect the
sensitivity of the reductase domain activity to Ca+2/ CaM (17, 39, 41, 42). Compare eNOSred
activity values determined from different laboratories does not yield straightforward conclusions.
The effect of CaM on nNOSred does not appear to shift the midpoint potential of either half
reactions of the two flavins (43) as addition of CaM caused only marginal change on the
FMN/FMNH midpoint potential and essentially no change on the other three half-reactions.
The only redox centers present in eNOSred are the two flavins as exactly four reducing
equivalents were consumed in the stoichiometric titration (Fig. 9D). Optical changes of the flavins
occurring almost immediately after dithionite addition contrasts with the data for eNOSox which
required 1.5 – 2.5 additional reducing equivalents before reduction of heme and supports that
additional redox centers were present in eNOSox (Fig. 4B). In addition to quantifying the redox
capacity of eNOSred, stoichiometric titration also enabled determination of the relative redox
potentials between different half reactions as illustrated in this study (Fig. 9D and Table 3).
Successful simulation in data of all three wavelengths using the same set of difference midpoint
potential values attested to the utility of this approach. The redox potential gap between the first
and second half-reaction was 170 -190 mV, thus a complete separation of the first half-reaction
from the other three is expected. The optical spectrum at the point of addition of one reducing
equivalent should contain one intact flavin (FAD) and one flavin semiquinone (FMNH·) (Fig. 9A,
heavy line). The extinction coefficient for the FMNH· semiquinone could thus be unambiguously
determined. The spectral change at 600 nm is completely due to semiquinone forms of the flavins
as the fully reduced and fully oxidized sample are silent at this region. The titration data indicate
by guest on Decem
ber 12, 2018http://w
ww
.jbc.org/D
ownloaded from

25
that the second semiquinone was gradually reduced to its hydroquinone at the addition of the
fourth reducing equivalent. However, ∆ E3 is only 56 – 90 mV and prohibits clean separation of the
last half-reaction from the other three. As 10(∆ E3
/0.059) = (Ox1 · Red2)/(Ox2 · Red1) for the last two
overlapping half reactions:
Ox1 + e- = Red1
Ox2 + e- = Red2
We expect that only 70 – 80 % of the reaction after addition of the 4th electron is only contributed
by FADH· semiquinone reduction to FADH2. Simulation for the 600 nm data here is very useful to
define the extinction coefficient for the second semiquinone species as the trapezoidal titration
profile is very sensitive to the difference midpoint potential as well as the extinction coefficient
(31) thus greatly assisted in converging the value of the ∆ E values and the extinction for the
second flavin semiquinone by simulation. There is a 20 % difference in the extinction coefficient
at 600 nm for these two flavin semiquinones and almost 3 × difference at 456 nm and ~50 %
difference at 508 nm with the FMNH· having the higher values (Table 4). The middle two half-
reactions, corresponding to that after addition of the 2nd and 3rd reducing equivalents, attributable
to the formation of FAD semiquinone and FMNH· transformation into the fully reduced form are
almost equipotential and were titrated together. The absolute values of the midpoint potential for
all four half-reactions will be determined by potentiometric titration. Once these values are
available, they will be used to validate the ∆ E values obtained in this study and to refine the
accuracy of the extinction coefficient derived in this study. The spectral contribution from each
half reaction at every single wavelength can be reliably determined and will be useful in future
mechanistic studies by stopped-flow measurements.
by guest on Decem
ber 12, 2018http://w
ww
.jbc.org/D
ownloaded from

26
Comparing the ∆ E values with other diflavin reductase proteins (Table 3) eNOSred
resembles closely with rabbit P450 reductase in all three potential gaps. Our results differ from
nNOSred for its 40 mV larger ∆ E1 and 40 mV smaller ∆ E2, and differs from P450BM3 from its
very small ∆ E1 and 80 mV larger ∆ E2, and also differs from sulfite reductase for the 55 mV larger
∆ E2 and 130 mV smaller ∆ E3. These differences have major impact on the thermodynamic control
on electron transfer and the nature of the half-reaction that couples with the heme reduction (30, 43
– 45).
ACKNOWLEDGMENTS
We want to thank Dr. Susan Cates at Rice University, Department of Biochemistry and
Cell Biology, for initial efforts in measurement of eNOSox molecular weight using equilibrium
centrifugations. We also thank Dr. Robert E. Serfass at University of Texas Medical Branch at
Galveston, Department of Preventive Medicine and Community Health to run ICP-mass analysis
for zinc in our eNOSox and eNOS proteins. A gift of bovine eNOSox sample provided by Dr. C.S.
Raman here at UTHSC, Department of Biochemistry and Molecular Biology for our chemical
modification studies is very much appreciated.
by guest on Decem
ber 12, 2018http://w
ww
.jbc.org/D
ownloaded from

27
REFERENCES
1. Roman, L.J., Martásek, P. and Masters, B.S.S. (2002) Chem. Rev. 102, 1179-1189.
2. Raman, C.S., Martásek, P., and Masters, B.S.S. (2000) in The Porphyrin Handbook,
Kadish, K.M.,Smith, K.M., and Guilard, R. eds. Acad. Press, p. 293-327.
3. Feldman, P.L., Griffith, O.W. and Stuehr, D.J. (1993) Chem. Eng. News 71, 26-38.
4. Alderton, W.K., Cooper, C.E., and Knowles, R.G. (2000) Biochem. J. 357, 593-615.
5. Raman, C.S., Li, H., Martásek, P., Král, V., Masters, B.S.S., and Poulos, T.L. (1998) Cell,
95, 1-20.
6. Fischmann, T.O., Hruza, A., Xiao, D.N., Fossetta, J.D., Lunn, C.A., Dolphin, E., Prongay,
A.J., Reichert, P., Lundell, D.J., Narula, S.K., and Weber, P.C. (1999) Nature Struct. Biol.
6, 233-242.
7. Crane, B.R., Arvai, A.S., Ghosh, D.K., Wu, C., Getzoff, E.D., Stuehr, D.J., and Tainer, J.A.
(1998) Science, 279, 2121-2126.
8. Zhang, J., Martásek, P., Paschke, R., Shea, T., Masters, B.S.S., and Kim, J.J. (2001) J. Biol.
Chem. 276, 37506-37513.
9. Hurshman, A.R., Marletta, M.A. (2002) Biochemistry 41, 3439-3456.
10. Perry, J. M., Moon, N., Zhao, Y., Dunham, W. R., and Marletta, M. A. (1998) Chem.
& Biol. 5, 355-364.
11. McMillan, K., Masters, B.S. (1995) Biochemistry 34, 3686-3693.
12. Abu-Soud, H. M., Gachhui, R., Raushel, F. M., and Stuehr, D. J. (1997) J. Biol. Chem.
272, 17349-17353.
13. Ghosh, D. K., and Stuehr, D. J. (1995) Biochemistry 34, 801-807.
by guest on Decem
ber 12, 2018http://w
ww
.jbc.org/D
ownloaded from

28
14. Gachhui, R., Presta, A., Bentley, D.F., Abu-Soud, H.M., McArthur, R., Brudvig, G.,
Ghosh, D.K., Stuehr, D.J. (1996) J. Biol. Chem. 1996 271, 20594-20602.
15. Bec, N., Gorren, A.C.F., Voelker, C., Mayer, B., and Lange, R. (1998) J. Biol. Chem. 273
13502¯13508.
16. Mayer, B., Klatt, P., Harteneck, C., List, B.M., Werner, E.R., and Schmidt, K. (1996)
Methods Neurosci. 31, 130¯139.
17. Chen, P.-F., Tsai, A.-L. Berka, V., and Wu, K.K. (1996) J. Biol. Chem. 271, 14631-14635.
18. Martásek, P., Liu, Q., Liu, J., Roman, L. J., Gross, S. S., Sessa, W. C., and Masters, B. S.
(1996) Biochem. Biophys. Res. Commun. 219, 359-365.
19. Romanos, M.A., Scorer, C.A., and Clare, J.J. (1992) Yeast 8, 423-488.
20. Leber, A., Hemmens, B., Klosch, B., Goessler, W., Raber, G., Mayer, B., Schmidt, K.
(1999) J. Biol. Chem. 274, 37658-37664.
21. Chen, P.-F., Tsai, A.-L., and Wu, K.K. (1995) Biochem. Biophys. Res. Commun. 215,
1119-1129.
22. Rusche, K.M., Marletta, M.A. (2001) J. Biol. Chem. 276, 421-427.
23. Lunte, C.E. and Kissinger, P.T. (1983) Anal. Biochem. 129, 377-386.
24. Berka, V., Palmer, G., Chen, P.-F., and Tsai, A.-L. (1998) Biochemistry, 37, 6136-6144.
25. Grassetti, D.R., Murray, J.F. Jr. (1996) J. Chromatogr. 41, 121-123.
26. Hurshman, A.R., Krebs, C., Edmondson, D.E., Huynh, B.H., and Marletta, M.A. (1999)
Biochemistry. 38, 15689-15696..
27. Wei, C.C., Wang, Z.Q., Wang, Q., Meade, A.L., Hemann, C., Hille, R., and Stuehr, D.J.
(2001) J. Biol. Chem. 276, 315-319.
by guest on Decem
ber 12, 2018http://w
ww
.jbc.org/D
ownloaded from

29
28. Tsai, A.-L., Wu, G., Palmer, G., Bambai, B., Koehn, J.A., Marshall, P.J., and Kulmacz,
R.J. (1999) J. Biol. Chem. 274, 21695-21700.
29. Foust, G. P., Burleigh, Jr., B. D., Mayhew, S. G., Williams, D. H., and Massey, V (1969)
Anal. Biochem. 27, 530-535.
30. Smith, P.K., Krohn, R.I., Hermanson, G.T., Mallia, A.K., Gartner, F.H., Provenzano, M.D.,
Fujimoto, E.K., Goeke, N.M., Olson, B.J., and Klenk, D.C. (1985) Anal. Biochem. 150, 76-
85.
31. Iyanagi, T., Makino, N., and Mason, H.S. (1974) Biochemistry, 13, 1701-1710.
32. Stuehr, D.J., and Ikeda-Saito, M. (1992) J. Biol. Chem. 267, 20547-20550.
33. Tsai, A.-L., Berka, V., Chen, P,-F., and Palmer, G. (1996) J. Biol. Chem. 271, 32563-
32571.
34. Gachhui, R., Presta, A., Bentley, D.F., Abu-Soud, H.M., McArthur, R., Brudvig, G.,
Ghosh, D.K., and Stuehr, D.J. (1996) J. Biol. Chem. 271, 20594-20602.
35. Gorren, A.C.F., Kungl, A.J., Schmidt, K., Werner, E.R., and Mayer, B. (2001) Nitric
Oxide: Biol. and Chem. 5, 176-186.
36. Presta, A., Weber-Main, A.M., Stankovich, M.T., and Stuehr, D.J. (1998) J. Am. Chem.
Soc. 120, 9460-9465.
37. Schmidt, P.P., Lange, R., Gorren, A.C., Werner, E.R., Mayer, B, and Andersson K.K.
(2001) J. Biol. Inorg. Chem. 6,151-158.
38. Archer, M.C., Vonderschmitt, D.J., and Scrimgeour, K.G. (1972) Can. J. Biochem. 50,
1174-1182.
39. Roman, L. J., Martásek, P., Miller, R. T., Harris, D. E., de la Garza, M.A., Shea, T.M.,
Kim, J.-J., and Masters, B.S.S. (2000) J. Biol. Chem. 275, 29225-29232.
by guest on Decem
ber 12, 2018http://w
ww
.jbc.org/D
ownloaded from

330
40. Abu-Soud, H.M., Yoho, L.L., Stuehr, D.J. (1994) J. Biol. Chem. 269, 32047-32050.
41. Chen, P.-F., and Wu, K.K. (2000) J. Biol. Chem. 275, 13155-13163.
42. Nishida, C. R., Montellano, P. R., (1999) J. Biol. Chem. 274, 14692-14698.
43. Noble, M.A., Munro, A.W., Rivers, S.L., Robledo, L., Daff, S.N., Yellowlees, L.J.,
Shimizu, T., Sagami, I., Guillemette, J.G., and Chapman, S.K. (1999) Biochemistry. 38,
16413-16418.
44. Daff, S. N., Chapman, S. K., Turner, K. L., Holt, R. A., Govindaraj, S., Poulos, T. L., and
Munro, A. W. (1997) Biochemistry 36, 13816-13823.
45. Zeghouf, M., Fontecave, M., Macherel, D., and Coves, J. (1998) Biochemistry 37, 6114-
6123.
46. Tsai, A.-L., Berka, V., Kulmacz, R.J., Wu, G., and Palmer G. (1998) Anal. Biochem. 264,
165-171.
by guest on Decem
ber 12, 2018http://w
ww
.jbc.org/D
ownloaded from

31
Table 1: Stoichiometry of the cofactors of purified eNOS subdomains (n = 7)
Heme FAD FMN BH4 0.93 +/− 0.04a
1.0 +/− 0.33b 1.14 +/− 0.21b 0.72 +/− 0.12a
c0.85 +/− 0.09 (A398) 0.71 +/− 0.02 (HPLC)
0.56 +/− 0.06 0.79 +/− 0.08 ND
a This study, for eNOSox.
b This study, for eNOSred.
c Data from Ref. 20 determined for whole eNOS.
Table 2: Catalytic activity of eNOSred and eNOS
Cytochrome c reductase ( mol/min/mol)
Ferricyanide reductase (mol/min/mol)
DCPIP reductase (mol/min/mol)
Sample
−CaM + CaM −CaM + Ca2+/CaM −CaM + Ca2+/CaM
Comments
eNOSred 70.3 +/− 8.0a 194.3 +/− 11.5 3220 +/− 520b 4480 +/−760 400 +/− 60b 800 +/− 80 This study
24 oC, with 0.1 M NaCl eNOSred 13.8 +/− 1.0 137.8 +/− 6.9 Ref. 17
24 oC, with 0.1 M KPi eNOS 20.9 +/− 1.4 224.4 +/− 14.96 Ref.17
24 oC, with 0.1 M KPi eNOSred 237.8 +/− 32.8 795.4 +/− 172.2 1878 +/− 377 2526 +/− 49 Ref. 43
37 oC, with 0.1M NaCl eNOS 72.1 +/− 1.4 299.2 +/− 54.4 924.8 +/− 54.4 3332 +/− 136 Ref. 43
37 oC, with 0.1M NaCl eNOS ND 373.7 +/− 18.6 Ref. 20
37 oC eNOS 173 478 3860 4604 Ref. 44
23 oC, with 0.25M NaCl eNOS ~ 54 ~ 700 482 2250 Ref 45
37 oC a S.D. (n = 3).
b S.D. (n = 5)
by guest on Decem
ber 12, 2018http://w
ww
.jbc.org/D
ownloaded from

32
Table 3. The three difference potentials of the four half-reactions of flavins of eNOS red and
related redox systems.
diflavin reductase ∆ E1 ∆ E2 ∆ E3 ref eNOS red 0.180 +/− 0.012 ~0 0.073 +/− 0.017 this study nNOS red 0.225 -0.042 0.048 39 P450BM3 0.020 0.079 0.080 40 rabbit P450 0.170 -0.005 0.097 30 sulfite reductase 0.175 0.055 -0.060 41
Table 4. Extinction coefficients of the different redox states of flavins in eNOS red at different
wavelengths.
Wavelength /nm Component εFMN /M-1cm-1 εFAD /M-1cm-1 600 semiquinone 5670 +/− 290 a 4430 +/− 310 456 fully oxidized 12100 +/− 790 11300 semiquinone 6000 2030 +/− 400 fully reduced 2570 +/− 110 2600 +/− 100 508 fully oxidized 3670 +/− 670 3670 +/− 670 semiquinone b 3670 +/− 670 2300 fully reduced 1270 +/− 210 1270 +/− 210
a. S.D. n = 3. b. Only refer to FAD semiquinone.
by guest on Decem
ber 12, 2018http://w
ww
.jbc.org/D
ownloaded from

33
FIGURE LEGENDS
Figure 1. Homogeneity of purified eNOSox and eNOSred. Purified eNOSred (Lane 2) and eNOSox
(Lane 3) after Ni-chelate column chromatography were analyzed by SDS-PAGE /Coomassie Blue
staining (A) and Western blotting (B). Molecular weight markers are shown in Lane 1.
Approximately1 µg samples were used for each run.
Figure 2. UV-Vis spectra of eNOSox (solid line) and its L-arginine complex (long dash), ferrous
form (medium dash-dot) and ferrous CO complex (short dash). The spectra between 500 – 700 nm
are enlarged in the INSET. Spectra for a typical preparation were given. Some eNOSox
preparations show a purity index, i.e. A280/A396 in L-arginine complex, as good as 1.3.
Figure 3. EPR spectra of eNOSox (A), L-arginine complex (B) and imidazole complex (C). The
concentration for eNOSox was 25 µM in 50 mM HEPES, pH 7.4, with 10 % glycerol and 0.1M
NaCl, L-arginine was 100 mM and imidazole was 40 mM. EPR conditions were: microwave
frequency, 9.61 gHz; power, 1 mW; modulation, 10 G; temperature, 11K; time constant, 0.33 s,
and each spectrum is the average of two scans.
Figure 4. Stoichiometric titration of eNOS ox by sodium dithionite in the presence of L-arginine.
Purified eNOS ox, not replenished with exogenous BH4, at 18.0 µM, containing 500 µM L-arginine
was titrated by 16.2 mM sodium dithionite anaerobically. A 1.8 mL total volume of reaction
mixture in 50 mM HEPES, pH 7.5, containing 0.1 M NaCl and 10 % glycerol was used in the
titration. Panel A shows the absorption spectra during the reductive titration. The INSET was the
by guest on Decem
ber 12, 2018http://w
ww
.jbc.org/D
ownloaded from

34
difference spectra from panel A (against resting). Panel B is the changes of A444 minus A388 as a
function of reducing equivalent per mole eNOSox. The solid straight lines indicate the initial,
ending levels and the initial slope of the heme titration.
Figure 5. Molecular weight estimation by gel filtration. eNOSox (~ 1 mg) was gel filtered through
a Sephacryl 200 HR column (1.5 × 50 cm), the ratio of sample elution volume (Ve) and column
void volume (Vo) determined by Blue Dextran was plotted with five molecular weight standards:
horse heart cytochrome c (12,400 kDa), bovine erythrocytes carbonic anhydrase (29,000 kDa),
bovine serum albumin (66,000 kDa), yeast alcohol dehydrogenase (150,000 kDa) and sweet potato
β -amylase (200,000 kDa) (Solid circles). The data for eNOSox (solid triangle) was interpolated into
the standard curve to obtain the estimated molecular weight. There was only one protein peak
monitored by A280 absorbance detected for eNOSox in the gel-filtration profile.
Figure 6. Kinetics of chemical modification for thiols by 4,4’-dithiopyridine. 50 µM 4,4’-
dithiopyridine was added individually to 4 µM human eNOSox (solid circles), 4 µM bovine
eNOSox (open circles), 4 µM human eNOSox pretreated with 5 M urea for 2 hrs (cross) and 9 µM
free L-cysteine (open triangles) in 50 mM KPi, pH 7.5. Formation of 4-thiopyridine after reaction
with –SH groups of each sample was monitored at 324 nm (ε = 19.8 mM-1cm-1) on HP8453 diode-
array spectrophotometer for a period of 2 hrs at room temperature. Solid lines are one or two-
exponential fits for each kinetic data.
Figure 7. Transient formation of BH4 radical by eNOSox. 280 µM eNOSox containing 0.7
by guest on Decem
ber 12, 2018http://w
ww
.jbc.org/D
ownloaded from
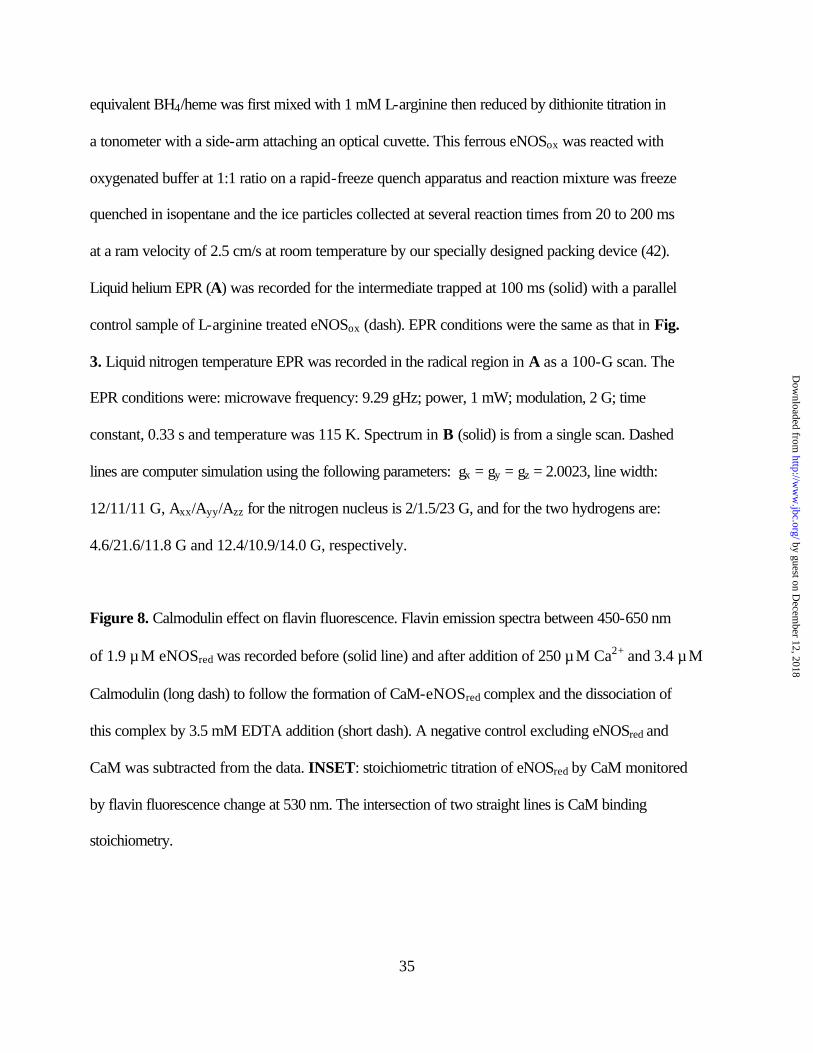
35
equivalent BH4/heme was first mixed with 1 mM L-arginine then reduced by dithionite titration in
a tonometer with a side-arm attaching an optical cuvette. This ferrous eNOSox was reacted with
oxygenated buffer at 1:1 ratio on a rapid-freeze quench apparatus and reaction mixture was freeze
quenched in isopentane and the ice particles collected at several reaction times from 20 to 200 ms
at a ram velocity of 2.5 cm/s at room temperature by our specially designed packing device (42).
Liquid helium EPR (A) was recorded for the intermediate trapped at 100 ms (solid) with a parallel
control sample of L-arginine treated eNOSox (dash). EPR conditions were the same as that in Fig.
3. Liquid nitrogen temperature EPR was recorded in the radical region in A as a 100-G scan. The
EPR conditions were: microwave frequency: 9.29 gHz; power, 1 mW; modulation, 2 G; time
constant, 0.33 s and temperature was 115 K. Spectrum in B (solid) is from a single scan. Dashed
lines are computer simulation using the following parameters: gx = gy = gz = 2.0023, line width:
12/11/11 G, Axx/Ayy/Azz for the nitrogen nucleus is 2/1.5/23 G, and for the two hydrogens are:
4.6/21.6/11.8 G and 12.4/10.9/14.0 G, respectively.
Figure 8. Calmodulin effect on flavin fluorescence. Flavin emission spectra between 450-650 nm
of 1.9 µM eNOSred was recorded before (solid line) and after addition of 250 µM Ca2+ and 3.4 µM
Calmodulin (long dash) to follow the formation of CaM-eNOSred complex and the dissociation of
this complex by 3.5 mM EDTA addition (short dash). A negative control excluding eNOSred and
CaM was subtracted from the data. INSET: stoichiometric titration of eNOSred by CaM monitored
by flavin fluorescence change at 530 nm. The intersection of two straight lines is CaM binding
stoichiometry.
by guest on Decem
ber 12, 2018http://w
ww
.jbc.org/D
ownloaded from
36
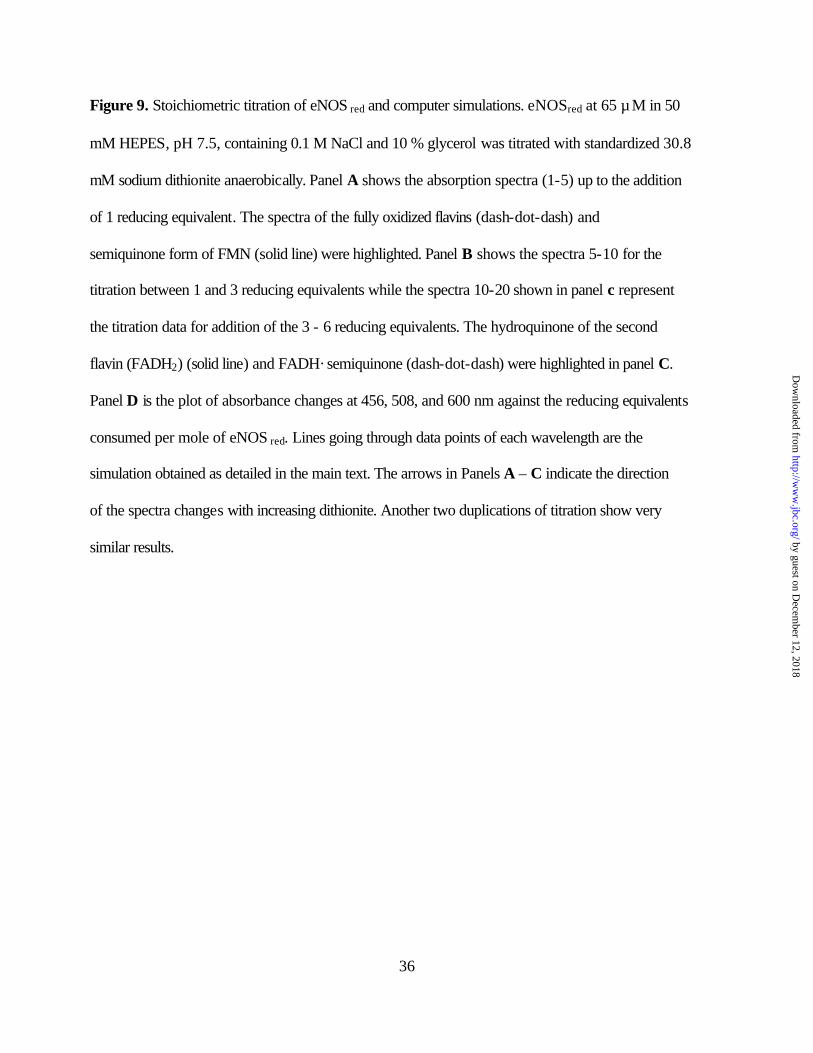
Figure 9. Stoichiometric titration of eNOS red and computer simulations. eNOSred at 65 µM in 50
mM HEPES, pH 7.5, containing 0.1 M NaCl and 10 % glycerol was titrated with standardized 30.8
mM sodium dithionite anaerobically. Panel A shows the absorption spectra (1-5) up to the addition
of 1 reducing equivalent. The spectra of the fully oxidized flavins (dash-dot-dash) and
semiquinone form of FMN (solid line) were highlighted. Panel B shows the spectra 5-10 for the
titration between 1 and 3 reducing equivalents while the spectra 10-20 shown in panel c represent
the titration data for addition of the 3 - 6 reducing equivalents. The hydroquinone of the second
flavin (FADH2) (solid line) and FADH· semiquinone (dash-dot-dash) were highlighted in panel C.
Panel D is the plot of absorbance changes at 456, 508, and 600 nm against the reducing equivalents
consumed per mole of eNOS red. Lines going through data points of each wavelength are the
simulation obtained as detailed in the main text. The arrows in Panels A – C indicate the direction
of the spectra changes with increasing dithionite. Another two duplications of titration show very
similar results.
by guest on Decem
ber 12, 2018http://w
ww
.jbc.org/D
ownloaded from


38
Fig. 2.
Wavelength, nm
300 400 500 600 700
ε (m
M-1
cm
-1)
0
25
50
75
100
125
150
Wavelength, nm500 550 600 650 700
ε (m
M-1
cm-1
)
0
5
10
15
20
by guest on Decem
ber 12, 2018http://w
ww
.jbc.org/D
ownloaded from

39
Fig. 3.
Magnetic Field, gauss
1000 1500 2000 2500 3000 3500 4000
EPR
Am
plitu
de
A
B
C
2.43
2.281.90
7.564.17 1.82
2.712.60
2.29 1.811.75
7.53
4.23
by guest on Decem
ber 12, 2018http://w
ww
.jbc.org/D
ownloaded from


41
B
A
300 400 500 600 700 800
0.0
0.5
1.0
1.5
2.0A
bsor
banc
e
Wavelength /nm
0 1 2 3 4 5 6
0.0
0.4
0.8
1.2
∆ A
444
- 38
8 nm
Reducing Equivalent / eNOS ox
300 400 500 600 700 800-0.8
-0.4
0.0
0.4
∆ A
bs
Wavelength /nm
by guest on Decem
ber 12, 2018http://w
ww
.jbc.org/D
ownloaded from

42
Fig. 5.
Molecular Weight
1e+4 1e+5 1e+60.9
1.0
1.1
1.2
1.3
1.4
1.5
1.6
1.7
Ve/V
0
by guest on Decem
ber 12, 2018http://w
ww
.jbc.org/D
ownloaded from

43
Fig. 6
Time, min
0 25 50 75 100 125
Equ
ival
ents
of -
SH g
roup
0
3
6
9L-Cys
eNOSOX
eNOSOX + Urea
by guest on Decem
ber 12, 2018http://w
ww
.jbc.org/D
ownloaded from


45
Magnetic Field, Gauss
3260 3280 3300 3320 3340 3360 3380
EPR
Am
plitu
de
Magnetic Field, G
500 1000 1500 2000 2500 3000 3500 4000
EPR
Am
plitu
deA
B
by guest on Decem
ber 12, 2018http://w
ww
.jbc.org/D
ownloaded from

46
Fig. 8.
Wavelength, nm
500 550 600 650
Flur
ores
cenc
e In
tens
ity
0.0
0.2
0.4
0.6
CaM/eNOSred
0 1 2Fl
uore
scen
ce, %
0
20
40
60
80
100
by guest on Decem
ber 12, 2018http://w
ww
.jbc.org/D
ownloaded from

47
Fig. 9
C
300 400 500 600 700 800
0.0
0.5
1.0
1.5
Abs
orba
nce
Wavelength /nm
0 1 2 3 4 5 6
0.0
0.6
1.2
1.8
600 nm 508 nm 456 nm
Abs
orba
nce
Reducing equivalent /eNOS red
DB
A
300 400 500 600 700 800
0.0
0.5
1.0
1.5
2.0
Abs
orba
nce
Wavelength /nm
300 400 500 600 700 800
0.0
0.6
1.2
1.8
Abs
orba
nce
Wavelength /nm
by guest on Decem
ber 12, 2018http://w
ww
.jbc.org/D
ownloaded from

Mei Du, Hui-Chun Yeh, Vladimir Berka, Lee-Ho Wang and Ah-lim Tsaidomains purified from yeast expression system
Redox properties of human endothelial nitric oxide synthase oxygenase and reductase
published online December 11, 2002J. Biol. Chem.
10.1074/jbc.M209606200Access the most updated version of this article at doi:
Alerts:
When a correction for this article is posted•
When this article is cited•
to choose from all of JBC's e-mail alertsClick here
by guest on Decem
ber 12, 2018http://w
ww
.jbc.org/D
ownloaded from