1 agri-food sector chapter and the economy
TRANSCRIPT

Agricultural operating surplus
increased by 4% to
€3,055.2 m in 2019.
Ireland exports
almost 90% of the food produced
in the country.
The Agri-food sector accounted for
7.1% of total employment
in 2019
Agri-Food Sector and the Economy
1.1 Overview The Agri-Food sector is Ireland’s most important indigenous industry, playing a vital role in Ireland’s economy. The sector employed over 164,400 people or 7.1% of total employment in 2019. Some 137,500 farms producing over €8 billion in output, over 770,000 hectares of forest, and over 2,000 fishing vessels and aquaculture sites producing fish with an export value of €577 million underpin the sector. Outside of Dublin and the mid-east region, the sector provides between 10% and 14% of employment. The agri-food sector makes a significant contribution to employment in rural and coastal areas in particular.
Beyond direct employment, the sector plays a key role in the wider rural and local economy, with estimates for output multipliers ranging from around 2.5 for beef, 2.0 for dairy and food processing, compared with an average output multiplier of 1.4 for the rest of the economy and 1.2 for foreign owned firms. The Food & Drink sector accounted for 38 % of all exports of Irish-owned client firms in 2018.
1 CHAPTER
10 Annual Review and Outlook for Agriculture, Food and the Marine 2020

1.2 Economic Outlook and Impact of SARS-CoV-2The outbreak of the coronavirus pandemic has resulted in a major shock for all economies around the globe. Given the uncertainty around the future path of the virus outbreak it is not possible to undertake traditional economic forecasts. While the forecasts in table 1.1 refl ect the Department of Finance position in April 2020, much has already changed. The Economic and Social Research Institute (ERSI) in their Summer Quarterly Economic Commentary1 released in late May presented an analysis for the future prospects for the Irish economy under three different scenarios. In their baseline scenario they projected that Ireland’s GDP would be down 12%, exports down 8%, unemployment averaging 17% and a general government defi cit of €28 billion or 9% for 2020.
Table 1.1 Main economic and fi scal variables, per cent change (unless stated)
2018 2019 2020 Forecast
2021 Forecast
Economic Activity
Real GDP 8.2 5.5 -10.5 6
Real GNP 6.5 3.3 -11.7 7.1
Prices
HICP 0.7 0.9 -0.6 0.4
Core HICP (*) 0.2 0.9 -0.2 0.5
GDP defl ator 1.5 1.5 1.2 1.5
Balance of Payments
Trade balance (per cent of GDP) 33.1 14.4 35.7 35.5Current account (per cent of GDP) 10.6 -9.5 10.6 11.1
Labour Market
Total Employment ('000) 2,258 2,323 2,106 2,221
Employment 2.9 2.9 -9.3 5.5
Unemployment (per cent) 5.8 5.0 13.9 9.7
(*) core infl ation excludes energy and unprocessed food from the index.
Source: Department of Finance | Ireland’s Stability Programme, April 2020 Update
The Agri-Food sector is export-orientated, and we export almost ninety percent of the food we produce. In 2019 Irish food and drink was exported to over 180 markets worldwide. Exports of Agri-Food products in 2019 were valued at €14.5 billion, a 63% increase from €8.9 billion in 2010. In 2019 Agri-Food exports represented 9.5% of Irish merchandising exports.
The global food market of the future will be marked by increasing population growth and prosperity in developing countries. Consumers increasingly demand assurances of safety, nutritional value and sustainable production methods for the food they consume; as well as greater choice and convenience in food products. The Irish agri-food sector is well placed to meet these demands, but will need to remain focused on sustainability, competitiveness and innovation in order to grow existing and new markets.
1 ESRI: Quarterly Economic Commentary, Summer 2020
11Annual Review and Outlook for Agriculture, Food and the Marine 2020
Ch
apter O
NE

The EU’s 2020 Economic Forecast2 released in early May 2020 projected that the EU economy is forecast to contract by 7.5% in 2020 and grow by around 6% in 2021. Growth projections for the EU and euro area had been revised down by around nine percentage points compared to the Autumn 2019 Economic Forecast. Each Member State’s economic recovery will depend not only on the evolution of the pandemic in that country, but also on the structure of their economies and their capacity to respond with stabilising policies.
The OECD Economic Outlook is the OECD’s twice-yearly analysis of the major economic trends and prospects for the next two years. The June Outlook focuses on two equally probable scenarios – one in which a second wave of infections, with renewed lock-downs, hits before the end of 2020, and one in which another major outbreak is avoided.
The OECDs Outlook for Irelands predicts that the economy is set to contract strongly in the first half of 2020 amid a strict lockdown. Supportive economic policies are cushioning workers and businesses from the full impact of the shock. However, depressed confidence and impaired household and business balance sheets will hold back the recovery as the economy further reopens.
2 European Commission: Spring 2020 Economic Forecast: A deep and uneven recession, an uncertain recovery
12 Annual Review and Outlook for Agriculture, Food and the Marine 2020

1.3 EU Agricultural economic outlookThe EU Agricultural Outlook for Markets and Income 2019 - 20303 advises that despite labour outfl ow, agriculture remains a key part of the EU’s rural communities and the primary use of land. Due to competition from other sectors of the economy, total agricultural land use in the EU is expected to decline, to approximately 174.4 million hectares by 2030. Although already high on average, EU yields will grow more slowly than in the past. Advances in seed selection, agricultural management and technology will improve farmers’ ability to integrate environmental policy requirements into production systems.
Most of the EU’s produce is expected to be consumed domestically. Consumers in the EU and abroad will become more demanding about the food they consume, increasingly opting for local, organic or other certifi ed products and shifting between food categories. With growing global demand and shifts in global trade fl ows, the EU will have opportunities to gain market shares in some export markets (e.g. dairy products) while facing increased competition in others (e.g. cereals).
EU food market developments are largely driven by consumer demands, whether that is related to perceived health benefi ts, environmental sustainability, climate change or animal welfare. In the short term, increasing demand for organic food is expected to boost EU supply. However, the challenges posed by the conversion to organic farming, as well as further market shifts towards other environmentally-friendly alternatives, could, slow the growth of organic production. Changing work patterns and busy lifestyles have also seen an increase in the sale of prepared and processed food, as well as snacks and on-the-go products. However, during the ‘lockdown’ imposed due to the Covid-19 virus, home cooking and preparing food in the home had a revival, although it is too early to say if it will be sustained in the longer term.
Changing global consumption trends and changes in production levels will affect global trade fl ows. With the increasing concentration of grain production in the main producing regions, global trade in this area is expected to continue to grow. Low per capita dairy consumption levels in Asia and Africa create a great opportunity for further growth of exports towards these regions. Diverging trends in meat consumption are also expected to result in shifts in trade fl ows.
Figure 1.1 highlights how the growth in demand for the key commodity groups is expected to slow over the next decade, sugar being the only exception where growth in demand is expected to be close to 1.5% compared to just over 1.0% in the last decade. Growth in demand for vegetable oil shows the largest drop over the next decade. Most of the growth in demand over the past and next decade is due to population growth.
3 EC (2019), EU agricultural outlook for markets and income, 2019-2030. European Commission, DG Agriculture
and Rural Development, Brussels.
The second wave of virus assumed in the double-hit scenario entails additional business closures and job losses, delaying the recovery and threatening to entrench long-term unemployment and risk aversion by fi rms. If this were to occur, annual GDP would decline by 8.75 per cent in 2020 with virtually no recovery in 2021. If a further outbreak is avoided (the single-hit scenario), GDP would fall by 6.75 per cent in 2020 and then recover by 4.75 per cent in 2021.
Source: OECD Economic Outlook, June 2020
13Annual Review and Outlook for Agriculture, Food and the Marine 2020
Ch
apter O
NE
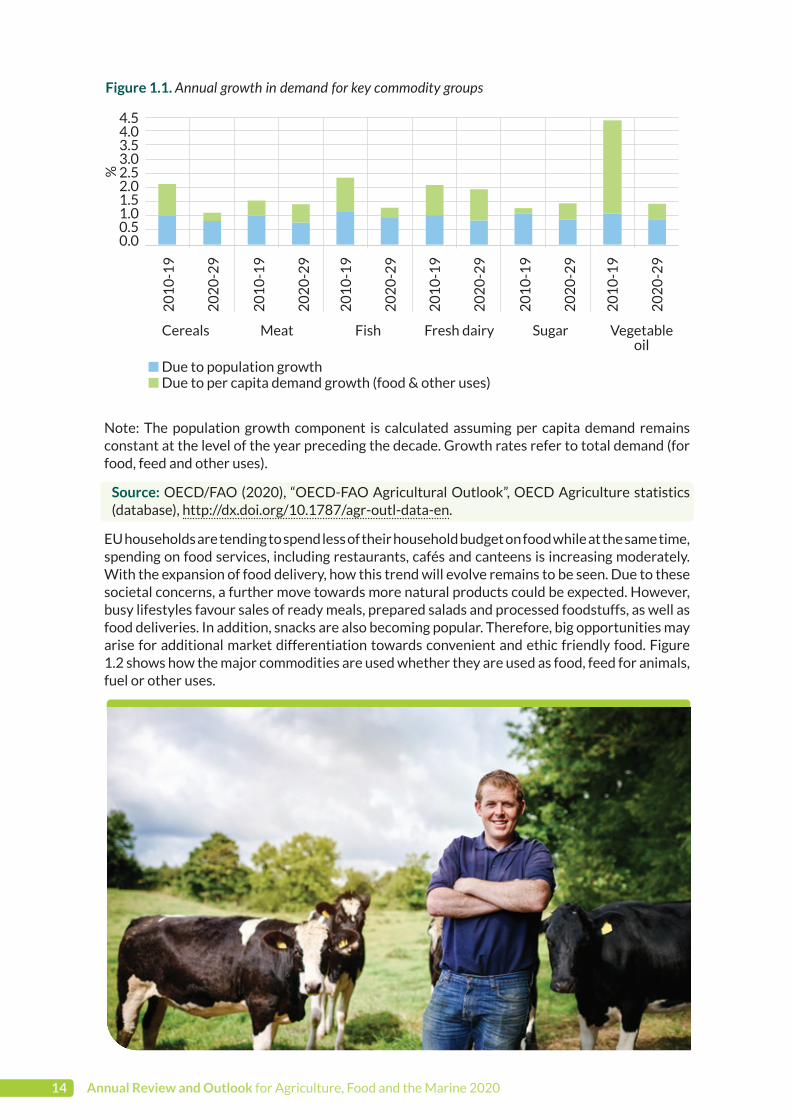
Note: The population growth component is calculated assuming per capita demand remains constant at the level of the year preceding the decade. Growth rates refer to total demand (for food, feed and other uses).
Source: OECD/FAO (2020), “OECD-FAO Agricultural Outlook”, OECD Agriculture statistics (database), http://dx.doi.org/10.1787/agr-outl-data-en.
EU households are tending to spend less of their household budget on food while at the same time, spending on food services, including restaurants, cafés and canteens is increasing moderately. With the expansion of food delivery, how this trend will evolve remains to be seen. Due to these societal concerns, a further move towards more natural products could be expected. However, busy lifestyles favour sales of ready meals, prepared salads and processed foodstuffs, as well as food deliveries. In addition, snacks are also becoming popular. Therefore, big opportunities may arise for additional market differentiation towards convenient and ethic friendly food. Figure 1.2 shows how the major commodities are used whether they are used as food, feed for animals, fuel or other uses.
Figure 1.1. Annual growth in demand for key commodity groups
4.54.03.53.02.52.01.51.00.50.0
%
20
10
-19
Cereals Meat Fish Fresh dairy Sugar Vegetable oil
n Due to population growthn Due to per capita demand growth (food & other uses)
20
10
-19
20
10
-19
20
10
-19
20
10
-19
20
10
-19
20
20
-29
20
20
-29
20
20
-29
20
20
-29
20
20
-29
20
20
-29
14 Annual Review and Outlook for Agriculture, Food and the Marine 2020

Note: Crushing of oilseeds is not reported as the uses of ‘vegetable oil’ and ‘protein meal’ are included in the total; Dairy refers to all dairy products in milk solid equivalent units; Sugar biofuel use refers to sugarcane and sugarbeet, converted into sugar equivalent units.
Source: OECD/FAO (2020), “OECD-FAO Agricultural Outlook”, OECD Agriculture statistics (database), http://dx.doi.org/10.1787/agr-outl-data-en.
1400
1200
1000
800
600
400
200
0
Mt
Maize Othercoarse grain
Rice Wheat Oilseedsand
products
Pulses Roots and
tubers
Meat Dairy Fish Sugar
n Food n Feed n Fuel n Other uses
20
17
-20
19
20
17
-20
19
20
17
-20
19
20
17
-20
19
20
17
-20
19
20
17
-20
19
20
17
-20
19
20
17
-20
19
20
17
-20
19
20
17
-20
19
20
17
-20
19
20
29
20
29
20
29
20
29
20
29
20
29
20
29
20
29
20
29
20
29
20
29
Figure 1.2. Global use of major commoditi es
1.4 Contribution of the Agri-Food Sector to the EconomyGross Value AddedThe agri-food sector is Ireland’s most important indigenous industry, playing a vital role in Ireland’s economy. It is estimated that the agri-food sector which is classifi ed as primary production (agriculture, fi shing and forestry) along with food & beverages and the wood processing sector, accounted for over 4% of Gross Value Added at factor cost in 2019. This is the Gross Value Added at market prices less any indirect taxes plus any subsidies. The table below provides a further breakdown of these preliminary fi gures for 2019.
Table 1.2 Contributi on of the Agri Food Sector to GVA, 2019 (Esti mate)
Preliminary Data 2019 € million
Gross Value Added (GVA) at Factor Cost €333,445
GVA in Primary Agriculture, Fisheries and Forestry at Factor Cost €4,896
GVA in Food & Beverages Sector €9,189
GVA in Wood Processing (estimate) €333
Total €14,418
GVA in Primary Sector as a % of GVA 1.5%
GVA in overall Agri-Food Sector as % of GVA 4.3%
Source: Central Statistics Offi ce, National Income and Expenditure, 2019
15Annual Review and Outlook for Agriculture, Food and the Marine 2020
Ch
apter O
NE

The Gross Value Added at Factor Cost in the primary sector has grown from €9.96 billion in 2010 to €14.42 billion in 2019. However, the relative value of Gross Value Added by the agri-food sector has been gradually dropping since the turn of the century as other sectors of the economy grow more quickly. In 2019 Gross Value Added in the overall agri-food sector represented 4.3% of total Gross Value Added at factor Cost. Modified GNI or GNI* is an indicator that was recommended by the Economic Statistics Review Group and is designed to exclude globalisation effects that are disproportionally impacting the measurement of the size of the Irish economy. In 2019 the agri-food sector accounted for 6.7% of GNI*.
Total expenditure by Department of Agriculture, Food and the Marine was just under €3 billion in 2019.
Table 1.3 Total DAFM Expenditure 2019
€m 2019 Outturn
EAGGF Guarantee direct expenditure €1,251
Basic Payment/Direct Payment Scheme €1,204
Intervention/Aid to Private Storage1 -€12
Other Market Supports €62
Other -€3
Voted Expenditure (excluding Administration) €1,362
Rural Development2 €611
Structural Measures2 €85
State Bodies €266
Horse and Greyhound Fund €84
Animal Health €93
Research Quality and Certification €25
Market Support Costs €8
Forestry and Bio-Fuels €90
Fisheries €42
Food Aid / World Food Programme €25
Brexit Response Loan Scheme €0
Other €32
Administration €280
Total Voted Expenditure (including Administration) €1,641
Total DAFM Expenditure €2,893
Note: (1) This is the amount paid by DAFM on product purchased into intervention in the year. The cost of Intervention purchases is fully recouped from the EU through depreciation of stock value during the year of purchase and at the time of sale of the product.
Note: (2) EAFRD Rural Development measures and certain Structural Development measures are part financed by the EU and the Exchequer. These figures are total expenditure on these measures in the calendar year. Expenditure in 2018 comprises GLAS, REPS, AEOS, Locally-led Environmental Schemes, Early retirement, Areas of Natural Constraint, Organic Farming, Beef Data & Genomics programme (BDGP), TAMS, Knowledge Transfer and Animal Welfare Scheme for Sheep.
Source: Department of Agriculture, Food and the Marine
16 Annual Review and Outlook for Agriculture, Food and the Marine 2020

1.5 Agricultural Accounts in IrelandAccording to the CSO’s, Final Estimate on Output, Input and Income in Agriculture for 2019, agricultural operating surplus showed an annual increase of €110.7m (+4%), up from €2,944.5 million in 2018 to €3,055.2 million in 2019. This increase is in operating surplus is in line with the trends shown by other CSO short-term indicators in agriculture. The agricultural sectors experienced a mixed year, with some sectors performing well, while others experienced diffi culty. The value of cattle production fell by €111.10 million (-5%) while pig producers experienced a very good year, with the value of their output up by €84 million (+18%).
A return to more typical weather in 2019 after the late cold spring and very hot and dry summer in 2018 resulted in a 14% fall in the volume of feeding stuffs consumed on Irish farms. Overall, intermediate consumption costs fell by €390.5 million (-6%) in 2019. See Table 1.4.
A year-on-year analysis of the 2019 results identifi ed the following main changes:
O 2019 saw an increase of 4% in the volume of goods produced; however falling prices resulted in the value of goods output at producer prices decreasing by €258.0 million (-3%), from €8,218.9 million in 2018 to €7,960.9 million in 2019.
O The volume of crops produced by Irish farmers increased by 8%. However, lowered prices resulted in the value of crops falling by €228.9 million (-11%), from €2,126.0 million to €1,897.1 million. The main crops contributing to this decline in production were forage plants which, because of falling prices, decreased in value by €276.3 million (-21%).
O Milk production increased by 5% in terms of volume, lower prices resulted in the value of milk increasing by just €45.2 million (+2%), from €2,556.7 million to €2,601.9 million.
O The volume of cattle produced increased by 2%, lower prices resulted in the value of cattle decreasing by €111.1 million (-5%), from €2,262.2 million to €2,151.1 million.
O There was very little change in the volume of pigs produced in 2019 (+0.4%), but large price increases resulted in the value of pig production increasing by €84.0 million (+18%), from €459.1 million to €543.0 million.
O Total intermediate consumption fell by €390.5 million (-7%), decreasing from €6,038.2 million to €5,647.7 million. The volume of feedingstuffs consumed on Irish farms decreased by 14% and as a result, expenditure on feedingstuffs fell by €184.6 million (-11%) to €1,489.9 million. The volume of fertilisers consumed by Irish farmers fell by 8% in 2019 but price increases resulted in the cost of these fertilisers decreasing by just €3.8 million (-1%), from €582.1 million to €578.3 million.
17
Ch
apter O
NE
Annual Review and Outlook for Agriculture, Food and the Marine 2020

Figure 1.3 Trends in Operating Surplus, Goods Output and Intermediate Consumption, 2012 – 2019
n Goods Output at Producer Pricesn Intermediate Consumptionn Operating Surplus
€9
€8
€7
€6
€5
€4
€3
€2
€1
€0
Bill
ion
s
2012 2013 2014 2015 2016 2017 2018 2019
Source: Central Statistics Office, Output, Input & Income in Agriculture Final Estimates, 2019
Table 1.4 Output, Input and Income in Agriculture, 2016 – 2019
2016 2017 2018 2019 % Change
2018 - 2019
Value €m Value €m Value €m Value €m
Goods Output at Producer Prices
€7,065 €8,086 €8,219 €7,961 -3%
Contract Work €372 €380 €453 €461 2%
Subsidies less Taxes on Products
€7 €11 €14 €100
Agricultural Output at Basic Prices
€7,444 €8,476 €8,686 €8,522 -2%
Intermediate Consumption €5,084 €5,318 €6,038 €5,648 -6%
Gross Value Added at Basic Prices
€2,360 €3,159 €2,648 €2,874 9%
Fixed Capital Consumption €813 €849 €912 €970 6%
Net Value Added at Basic Prices
€1,547 €2,309 €1,736 €1,904 10%
Other Subsidies Less Taxes on Production
€1,594 €1,639 €1,776 €1,738 -2%
Factor Income €3,141 €3,948 €3,512 €3,642 4%
Compensation of Employees €513 €526 €568 €586 3%
Operating Surplus €2,628 €3,422 €2,945 €3,055 4%
Source: Central Statistics Office, Output, Input & Income in Agriculture Final Estimates, 2019
18 Annual Review and Outlook for Agriculture, Food and the Marine 2020

1.6 Food and the consumerThe manufacture of food and drink products is widely recognised as Ireland’s most important indigenous industry. In 2016, the value of all Food and Beverages products was €24.2 billion, which represented 20.4% of all goods produced. The value of the Food and Beverages sectors increased to €26.0 billion in 2017 and the percentage share of total Net Selling Value (NSV) rose to 22.9%. In 2018, the value of such products remained at €26 billion but represented a lower percentage share of total NSV at 21.8%. In 2019, the value of all Food and Beverages products was €25.8 billion and represented a lower percentage share of total NSV at 19.2%, compared to the previous two years.
The impact of the Food and Beverages Sector is dispersed throughout the country and a strong driver of regional development accounting for 2.5% of total employment.
In addition to servicing the domestic grocery and food service markets, the industry is highly internationalised and exports to 180 countries. It maintains substantial market positions in the UK, in EU markets and in international markets.
Employment in the Food and Beverages SectorAccording to the CSO Labour Force Survey, employment in the Food and Beverages sector averaged 34% of agri-food sector workers in 2019, and 2% of all those in employment. Food and Beverage manufacturing employment has increased by 11% between 2009 and 2019 from an average of 50,100 in 2008 to 55,700 in 2019.
Figure 1.4 Employment in the Food and Beverages sector, 2009 – 2019
2009 2010 2011 2012 2013 2014 2015 2016 2017 2018 2019
n NACE 10 manufacture of food productn NACE 11 Manufacture of beveragesn Other Agri-Food Sectors
100
90
80
70
60
50
40
30
20
10
0
%
Source: Central Statistics offi ce, Labour Force Survey.
19Annual Review and Outlook for Agriculture, Food and the Marine 2020
Ch
apter O
NE

Contribution of the Food and Beverages Sector to the Irish EconomyThe Annual Business Survey of Economic Impact is a survey of approximately 4,200 client companies of Enterprise Ireland, IDA Ireland and Údarás na Gaeltachta employing ten or more employees in Ireland and comprises the Manufacturing and Information, Communication and Other Internationally Traded Services sectors. This survey includes a number of Food and Beverage Manufacturers.
Key findings in this report include:
The largest sector for Irish-owned clients is the Food & Drink sector with sales of €15.9 billion in 2018. An increase of 2.4% over 2017 and of 2.8% per annum increase over the 2000 figure of €9.6 billion.
While the Food & Drink sector accounted for 35.6% of the sales in Irish-owned industry in 2018, it accounts for 25.4% of the employment.
Within the Food and Drink sector, Irish raw materials at €8.6 billion accounted for 78.6% of the total materials spend in that sector. Of all the Irish raw materials purchases by Irish-owned firms, the majority or 71.6% related to the Food and Drink sector in 2018.
The Food and Drink sector’s share of Irish services purchases has decreased from 91% in 2000 to 75% in 2018. (Absolute value was €1,382m).
The Food & Drink sector dropped its share of sales over the period 2000 – 2018 from 41.6% of total Irish-owned sales to 35.6%.
The Food & Drink sector accounted for 38.0% of all exports of Irish-owned client firms in 2018. This sector has increased exports from €4.6bn in 2000 to €8.7bn in 2018, a per annum increase of 3.6% in current prices.
The Food & Drink sector purchased the majority or 78.6% of its materials in Ireland in 2018. This represents a decline from the 2000 and 2009 figures of 82.6% and 81.8%. (Absolute value was €8,629m).
20 Annual Review and Outlook for Agriculture, Food and the Marine 2020

Food PricesThe Central Statistics Offi ce gathers and publishes a Consumer Price Index on a monthly basis. The index measures changes in the average level of prices (inclusive of all indirect taxes) paid for consumer goods. Approximately 51,000 prices are collected for a representative basket consisting of 615 item headings in a fi xed panel of retail and service outlets throughout the country. Goods represented in the survey include Meat, Dairy, Fish, Vegetable and Processed food products, along with alcoholic and non-alcoholic beverages.
Irish food costs reduced by 1% between 2018 and 2019. 2019 marked the 6th year in a row that food prices have reduced.
Figure 1.5 Annual average percentage change in Consumer Price Index, 2009 - 2019
The Food and Drink sector maintained the highest share of direct expenditure as a percentage of sales at 74% in 2018 down from 82% in 2000.
The Food & Drink sector, with an 89% share of sales for export in 2018, increased its proportion of exports from 62% in 2000.
8.0%
6.0%
4.0%
2.0%
0.0%
-2.0%
-4.0%
-6.0%
n All items n Food and non-alcoholic beverages
n Alcoholic Beverages and tobacco
2008 2009 2010 2011 2012 2013 2014 2015 2016 2017 2018 2019
Source: Central Statistics Offi ce, Consumer Price Index
21Annual Review and Outlook for Agriculture, Food and the Marine 2020
Ch
apter O
NE

ConsumptionDistribution (retailing sector)
Food industry (processing)
Source: Eurostat – Food Price Monitoring tool
Prices are established along the food chain through transactions between various actors in the chain (e.g. farmers, food processors, wholesalers, retailers and fi nal consumers). The food supply chain may be short and simple for some food products or more complex for others. It may also differ between countries.
Following strong volatility of agricultural commodity and food prices towards the end of the last decade, the need was seen for higher transparency on price developments across the different stages of the food production chains. Consequently, the Food Price Monitoring Tool was developed.
The Food Price Monitoring Tool (FPMT) was developed by Eurostat in order to improve the accessibility of statistical data on prices in successive stages of a number of food supply chains. Today the tool reports on developments for agricultural commodity prices, producer prices, consumer prices and import prices.
A main goal of this project is to further enhance the Food Price Monitoring Tool. This will be accomplished by providing statistics and indicators for the assessment of the price transmission mechanism in the selected Food Monitoring Tool.
These statistics and indicators will provide information regarding:
O The magnitude (degree) of price transmission, i.e. how much of the price stage of the food supply chain will be transmitted to the next stage
O The speed of price transmission, i.e. the pace at which price changes in one stage of the food supply are transmitted to the next stage
O the asymmetry of price transmission, i.e. to what extent price increases and decreases from one stage of the chain to the next are transmitted differently in terms of magnitude and speed.
Food and the EU Eurostat Food Price Monitoring Tool The food supply chain (from farm to consumer) consists of a wide range of products and companies in different markets. The food supply chain connects 3 main sectors: agriculture, the food processing industry and the wholesale and retail sector. Imported agricultural products must also be taken into account.
Figure 1.6 Diagram of the food supply chain
Collection & Transport
Production on farms (agricultural products)
22 Annual Review and Outlook for Agriculture, Food and the Marine 2020

The food supply chain
(from farm to consumer)
consists of a wide
range of products and
companies in different
markets.
23Annual Review and Outlook for Agriculture, Food and the Marine 2020
Ch
apter O
NE

Figure 1.7 Comparison of EU and Irish prices, 2010 – 2019 (2015 = 100)
110
105
100
95
90
85
Producer Price Index European Union - 28 CountriesHarmonised Indes of Consumer Prices European Union - 28 CountriesProducer Price Index IrelandHarmonised Index of consumer prices in Ireland
2010 2011 2012 2013 2014 2015 2016 2017 2018 2019
Source: Eurostat – Food Price Monitoring tool
24 Annual Review and Outlook for Agriculture, Food and the Marine 2020

Dr Eimear GallagherTeagasc
Lead Institution:Teagasc
Collaborating Institutions:University College Cork, Cork Institute of Technology
Funding:€968,038.40
NANS II: Innovative food processing and new technological solutions for the design of novel healthy products for the prepared consumer foods sector. As we live in an obesogenic world, foods that generate satiety sensations have benefi ts for weight management and improved health. InFoTech aims to develop food and beverage formulations with increased satiety modulation for the prepared consumer foods sector, which also have extended shelf-life for exporting to far-reaching international markets. The structure, texture and sensory acceptability of the re-designed products will be fully characterised. Concurrently, microbial safety and in-vitro screening for satiety will be undertaken. Through innovative processing and analytical technologies, this project will build new scientifi c capability and transferable technologies to the food industry. The combined expertise of the project team will generate a project which goes beyond the current state of the art. This project will strengthen the existing knowledge base in food processing by directly addressing current industry needs and economic risks, which include Brexit, environmental sustainability and consumer health.
Professor Joe Kerry University College Cork
Lead Institution:University College Cork
Collaborating Institutions:Teagasc
Funding:€591,557.60
PECTIPACK: Eco-friendly compostable pectin based packaging material derived from waste sources of fruit pulp and its validation in bread packaging. Addressing packaging waste has become one of the most pressing environmental issues facing us globally today. Attempts to reduce, reuse and recycle packaging materials have not had the desired effect in controlling packaging wastes. Therefore, there is an urgent requirement to develop, novel, rapidly-compostable, eco-friendly packaging that is sustainable, but initially, fi t-for-purpose for food packaging applications. Fruit processors in Ireland generate by-product wastes as fruit pulp and is usually discarded. A more sustainable use of such material would be to manufacture simple food packaging materials, suitable for fresh bread packaging, which could be subsequently composted for use as plant fertilizers. The Circular- and Bio-Economies have become key strategies for European economic growth, targeting reduction of CO2 emissions, utilizing sustainability conceptions of reusing materials and reducing wastes by utilizing them for new product manufacture. This project addresses these strategies by converting fruit pulp, to biodegradable packaging, to natural plant fertilizers.
1.7 Research Projects: Food Projects
25Annual Review and Outlook for Agriculture, Food and the Marine 2020
Ch
apter O
NE

Dr Richie HackettTeagasc
Lead Institution:Teagasc
Collaborating Institutions:Institute of Technology Carlow, Technological University Dublin
Funding: €856,745.92
DABBING CAP: Distilling and Brewing – BuildING CAPacity. Substantial amounts of imported grain are used by the Irish drinks industry, particularly maize for whiskey production. Substituting imported maize with Irish wheat would provide an additional market for growers but could cause processing problems within the distilleries. In addition, many of the waste streams from the industry are used in relatively low value end uses such as animal feed. The project aims to develop the knowledge to produce and effectively utilise natively grown cereals, principally wheat but also rye and spelt, in Irish whiskey distilleries. The raw material requirements (grain and water) of the drinks industry and the waste streams and their potential for use in higher value end products will also be investigated. The results of the project will underpin greater utilisation of natively produced grain in the Irish drinks sector as well as identifying higher value end uses for the waste streams from the sector.
Dr Sinead McCarthyTeagasc
Lead Institution:Teagasc
Collaborating Institutions:University College Dublin, University College Cork, Queens University Belfast
Funding: €961,235.25*
SuHeGuide: Food based dietary guidelines for sustainable and healthy lifestyles. Substantial consumer behaviour changes are required to reduce the environmental impact of feeding the growing global population. SuHeGuide will undertake a range of consumer studies from food consumption to sustainable behaviours in the context of sustainable and healthy food lives. In a first-of-its-kind dietary intervention study, we will test the hypothesis that a sustainable diet, which is acceptable to consumers, can reduce greenhouse gas emissions, while simultaneously achieving nutritional requirements, thereby providing an effective solution to the sustainability and food challenge. SuHeGuide will develop food-based dietary guidelines for healthy and sustainable lifestyles that are acceptable to consumers and meet nutritional requirements, while simultaneously, reducing food related GHG emissions and respectful of biodiversity. These outputs will enable regulatory authorities to develop evidence based food and nutrition policies for both healthy and sustainable diets and provide critical information for the food industry to respond to the shift in sustainable food consumption practices. (* denotes project co-funded by DAERA)
26 Annual Review and Outlook for Agriculture, Food and the Marine 2020
1.8 Agri-Food StrategyFood Wise 2025Food Wise 2025 is the current ten year strategy for the agri-food sector and underlines the sector’s unique and special position within the Irish economy and illustrates the potential which exists for the sector to develop further. Food Wise contained a vision of thriving primary producers and agri-food businesses at the heart of vibrant communities across the country and was built upon fi ve cross-cutting themes – environmental sustainability, market development, competitiveness, innovation and human capital as well as specifi c recommendation for key sectors. (www.agriculture.gov.ie/foodwise2025/)
Food Wise 2025 identifi es ambitious and challenging growth projections for the industry over the next ten years including: 85% increase in exports to €19bn; and the creation of 23,000 additional jobs all along the supply chain from producer level to high end value-added product development.
Implementation processThe Implementation Process for Food Wise is driven by the High Level Implementation Committee (HLIC), chaired by the Minister for Agriculture, Food and the Marine, with participation from DAFM, other relevant Government Departments and State agencies. It ensures joined-up action by the Department and its state agencies and provides a platform to meet collectively with industry representatives. The HLIC also seeks to ensure that Food Wise implementation is a live and dynamic process. The HLIC met fi ve times in 2019.
The Environmental Sustainability Committee established to monitor and drive the implementation of the sustainability actions continued to meet during 2019.
In 2019 of the 417 actions under Food Wise, 376 were due to commence or are ongoing actions. Of these 376 actions, 87% have been achieved or substantial action has been undertaken, and a further 13% have commenced and are progressing. A detailed report on the status of all the ongoing actions is available on the Department’s website in Steps to Success 2019.
Figure 1.8 Food Wise 2025 Update on Acti ons, 2019
n 87% Achieved or Substantial Action Undertakenn 13% Commenced and Progressing
376 Actions Commenced or Achieved Actions
Source: Department of Agriculture, Food and the Marine
Agri-Food Strategy 2030The series of ten-year industry-led strategies that the agri-food sector has developed, working with Government, over the last twenty years, have been crucial to the development of the sector. While the Food Wise 2025 strategy has been instrumental in guiding the sector in recent years, like all plans, it must evolve and respond to a rapidly changing context both within and outside the sector.
The process for developing the next ten-year strategy to replace Food Wise 2025 began in 2019 with a public consultation to ascertain the views of all stakeholders on the direction of the
27Annual Review and Outlook for Agriculture, Food and the Marine 2020
Ch
apter O
NE

sector to 2030. In order to facilitate further engagement and discussion on the future strategy, a national stakeholder consultation event was held at the Aviva Stadium in Dublin. This ‘Open Policy Debate’ saw almost 400 delegates coming together to hear from the Taoiseach, Minister for Agriculture, Food and the Marine and plenary speakers from across the globe on some of the key challenges and opportunities facing the sector in the decade ahead. Delegates then participated in a series of six parallel break-out sessions to consider some issues in more detail and this process of dialogue and discussion was a further important element in the development of the strategy.
In November 2019, the Minister established a committee representative of the sector and chaired by Tom Arnold. They have been tasked with developing the agri-food strategy to 2030, taking on board the input from the public consultation and the Open Policy Debate. Their terms of reference are to outline the vision and key objectives, with associated actions, required to ensure the economic, environmental and social sustainability of the agri-food sector in the decade ahead. The Committee’s report will be short, specific and cross-sectoral, with ambitious but realistic actions.
A Strategic Environmental Assessment and Appropriate Assessment will also be conducted in parallel with the work of the committee. This is to ensure that environmental considerations are fully integrated into the preparation of the strategy.
The 2030 stakeholder committee have met on five occasions up to June 2020 and it is anticipated that they will conclude their work towards the end of the year.
28 Annual Review and Outlook for Agriculture, Food and the Marine 2020