1. cancer incidence - kankerregister.org · 2 1. cancer incidence 1.1. number of new diagnoses and...
TRANSCRIPT

22
1. Cancer Incidence 1.1. Number of new diagnoses and incidence rates
Table 1: Corpus Uteri Cancer: Average age at diagnosis, number of new cancer diagnoses (N), crude rate(CR), age-standardised incidence rates (ESR and WSR) and cumulative risk by region, 2015
FemalesAge
(years)N CR ESR WSR CRi
Belgium 68.7 1,458 25.6 17.5 12.1 1.57
Brussels-Capital Region 67.9 110 18.3 15.8 10.8 1.30
Flemish Region 68.7 886 27.2 18.0 12.5 1.63
Walloon Region 69.0 462 25.1 17.0 11.8 1.52
CR=Crude (all ages) Rate (N/100,000 person-years)ESR=Age-Standardised Rate, using the European Standard Population (N/100,000 person-years)WSR=Age-Standardised Rate, using the World Standard Population (N/100,000 person-years)CRi=Cumulative Risk for 0-74 years (%)
Figure 1: Corpus Uteri Cancer: Age-standardised incidence rates by region, 2015
33
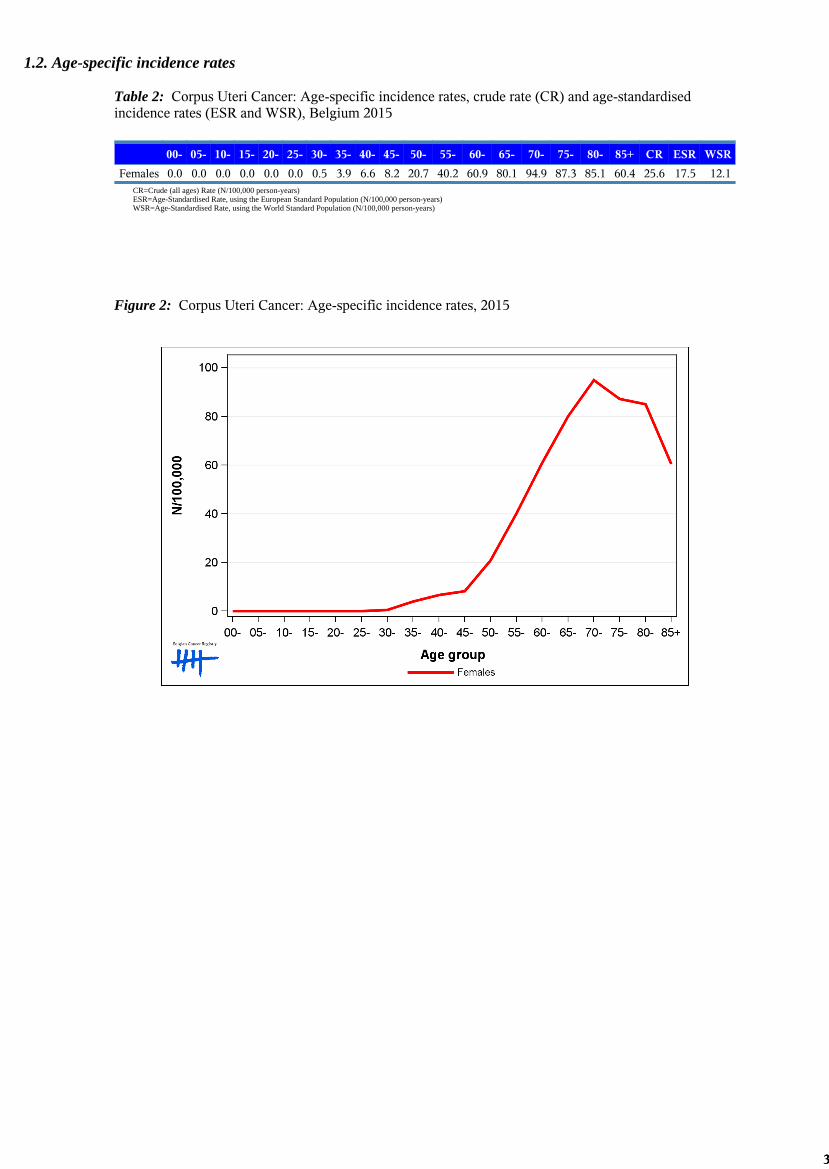
1.2. Age-specific incidence rates
Table 2: Corpus Uteri Cancer: Age-specific incidence rates, crude rate (CR) and age-standardisedincidence rates (ESR and WSR), Belgium 2015
00- 05- 10- 15- 20- 25- 30- 35- 40- 45- 50- 55- 60- 65- 70- 75- 80- 85+ CR ESR WSR
Females 0.0 0.0 0.0 0.0 0.0 0.0 0.5 3.9 6.6 8.2 20.7 40.2 60.9 80.1 94.9 87.3 85.1 60.4 25.6 17.5 12.1CR=Crude (all ages) Rate (N/100,000 person-years)ESR=Age-Standardised Rate, using the European Standard Population (N/100,000 person-years)WSR=Age-Standardised Rate, using the World Standard Population (N/100,000 person-years)
Figure 2: Corpus Uteri Cancer: Age-specific incidence rates, 2015

44
1.3. Combined stage
Table 3: Corpus Uteri Cancer: Distribution of combined stage, Belgium 2015
StageI
StageII
StageIII
StageIV
StageX
StageNA Total
Females
N 924 66 146 88 147 87 1,458
% 63.4 4.5 10.0 6.0 10.1 6.0 100Staging according to the TNM 7th edition (Ref:Sobin LH, Gospodarowicz MK,Wittekind Ch. TNM classification of malignant tumours, UICC 7th edition)Combined TNM stage : compilation of pathological (pTNM) and clinical (cTNM) stage.pTNM prevails over cTNM, except when cTNM stage is IVStage X: diagnoses with an unknown stageStage NA: diagnoses with a histological diagnosis where no stage can be evaluated (NotApplicable)
Figure 3: Corpus Uteri Cancer: Bar chart of known combined stage, Belgium 2015
55
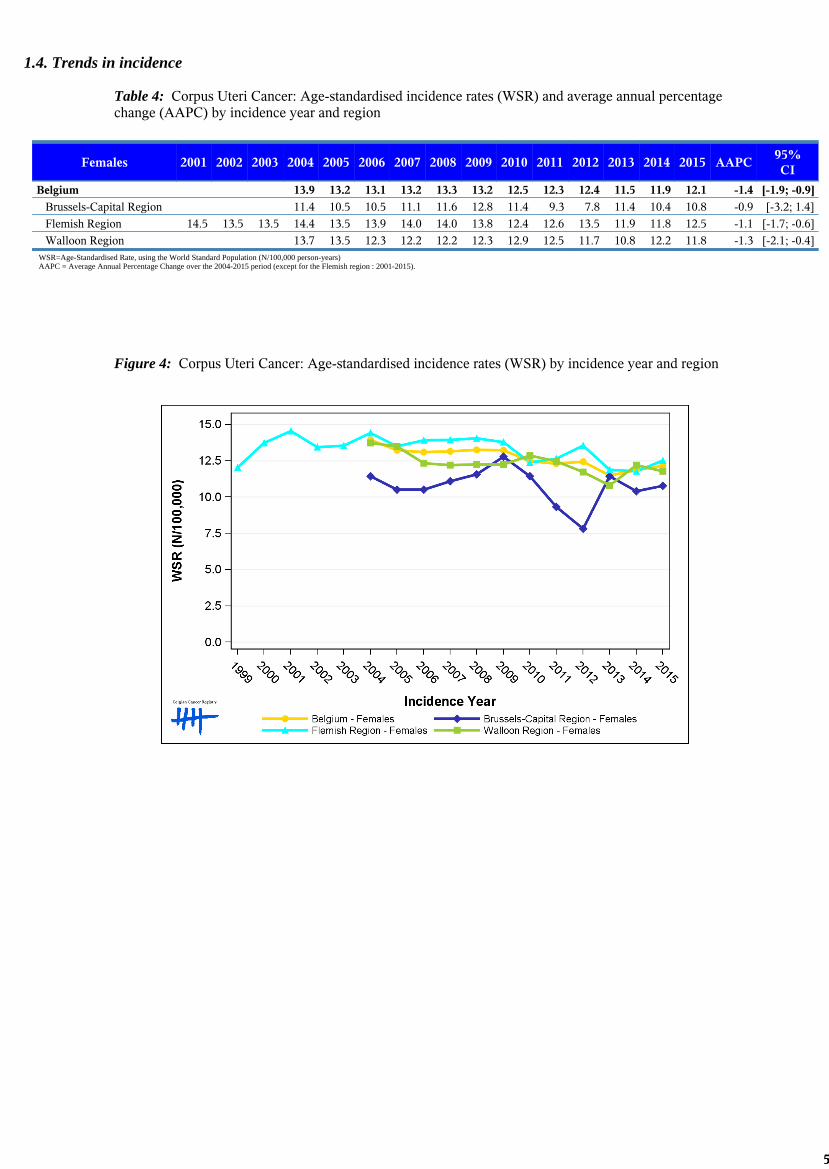
1.4. Trends in incidence
Table 4: Corpus Uteri Cancer: Age-standardised incidence rates (WSR) and average annual percentagechange (AAPC) by incidence year and region
Females 2001 2002 2003 2004 2005 2006 2007 2008 2009 2010 2011 2012 2013 2014 2015 AAPC95%CI
Belgium 13.9 13.2 13.1 13.2 13.3 13.2 12.5 12.3 12.4 11.5 11.9 12.1 -1.4 [-1.9; -0.9]
Brussels-Capital Region 11.4 10.5 10.5 11.1 11.6 12.8 11.4 9.3 7.8 11.4 10.4 10.8 -0.9 [-3.2; 1.4]
Flemish Region 14.5 13.5 13.5 14.4 13.5 13.9 14.0 14.0 13.8 12.4 12.6 13.5 11.9 11.8 12.5 -1.1 [-1.7; -0.6]
Walloon Region 13.7 13.5 12.3 12.2 12.2 12.3 12.9 12.5 11.7 10.8 12.2 11.8 -1.3 [-2.1; -0.4]WSR=Age-Standardised Rate, using the World Standard Population (N/100,000 person-years)AAPC = Average Annual Percentage Change over the 2004-2015 period (except for the Flemish region : 2001-2015).
Figure 4: Corpus Uteri Cancer: Age-standardised incidence rates (WSR) by incidence year and region

66
1.5. Incidence by broad age groups
Table 5: Corpus Uteri Cancer: Number of new diagnoses and age-standardised incidence rates (WSR) bybroad age groups and incidence year, Belgium
N WSR
2006 2007 2008 2009 2010 2011 2012 2013 2014 2015 2006 2007 2008 2009 2010 2011 2012 2013 2014 2015
Females
All ages 1,349 1,394 1,464 1,460 1,416 1,430 1,449 1,388 1,460 1,458 13.1 13.2 13.3 13.2 12.5 12.3 12.4 11.5 11.9 12.1
0-14 y 0 0 0 0 0 0 0 0 0 0 0.0 0.0 0.0 0.0 0.0 0.0 0.0 0.0 0.0 0.0
15-44 y 32 35 39 35 26 28 27 28 35 41 1.1 1.3 1.5 1.3 1.0 1.1 1.1 1.1 1.4 1.5
45-54 y 126 125 124 121 121 112 97 112 114 116 16.6 16.2 15.9 15.2 15.1 13.7 11.8 13.5 13.7 13.9
55-64 y 355 367 356 398 345 352 376 319 316 357 60.7 61.1 56.2 61.5 52.2 51.8 55.0 46.4 45.7 50.6
65-74 y 459 446 461 437 439 454 476 426 453 463 90.5 87.6 93.0 88.7 90.4 90.3 93.7 82.3 85.7 86.0
75+ y 377 421 484 469 485 484 473 503 542 481 69.8 77.6 86.3 82.0 85.4 83.9 80.6 84.6 91.1 80.0N=Number of invasive tumoursWSR=Age-Standardised Rate, using the World Standard Population (N/100,000 person-years)
Figure 5: Corpus Uteri Cancer: Age-standardised incidence rates (WSR) versus incidence year by broadage groups, Belgium

77
2. Relative survival
Table 6: Corpus Uteri Cancer: 5-year relative survival proportion by age group and region, Belgium2011-2015
5-year relative survival2011-2015 (%)
Females
N at risk estimate 95% CI
Overall 7,145 79.9 [78.5, 81.4]
Age group
15-54 years 703 88.0 [84.8, 90.7]
55-69 years 2,870 85.4 [83.7, 87.1]
70+ years 3,572 73.6 [71.0, 76.1]
Region
Brussels-Capital Region 510 79.7 [73.7, 85.2]
Flemish Region 4,373 80.5 [78.8, 82.3]
Walloon Region 2,262 78.9 [76.1, 81.6]
Figure 6: Corpus Uteri Cancer: relative survival proportion, Belgium 2011-2015

88
Figure 7: Corpus Uteri Cancer: relative survival proportion by age group, Belgium 2011-2015
Figure 8: Corpus Uteri Cancer: relative survival proportion by region, Belgium 2011-2015