1. cancer incidence
TRANSCRIPT


22
1. Cancer Incidence 1.1. Number of new diagnoses and incidence rates
Table 1: Melanoma: Average age at diagnosis, number of new cancer diagnoses (N), crude rate (CR),age-standardised incidence rates (ESR and WSR) and cumulative risk by sex and region, 2019
MalesAge
(years)N CR ESR WSR CRi
Belgium 63.3 1,656 29.4 23.0 16.6 1.87
Brussels-Capital Region 65.1 91 15.4 15.0 10.3 1.22
Flemish Region 63.5 1,078 33.1 24.8 17.9 1.99
Walloon Region 62.4 487 27.4 22.1 16.1 1.83
FemalesAge
(years)N CR ESR WSR CRi
Belgium 58.2 2,070 35.7 29.7 23.0 2.36
Brussels-Capital Region 63.2 119 19.3 17.1 12.6 1.38
Flemish Region 58.0 1,403 42.1 34.7 27.0 2.75
Walloon Region 57.5 548 29.5 24.9 19.4 1.98
CR=Crude (all ages) Rate (N/100,000 person-years)ESR (1976)=Age-Standardised Rate, using the European Standard Population (N/100,000 person-years)WSR=Age-Standardised Rate, using the World Standard Population (N/100,000 person-years)CRi=Cumulative Risk for 0-74 years (%)
Figure 1: Melanoma: Age-standardised incidence rates by sex and region, 2019

33
1.2. Age-specific incidence rates
Table 2: Melanoma: Age-specific incidence rates, crude rate (CR) and age-standardised incidence rates (ESRand WSR) by sex, Belgium 2019
00- 05- 10- 15- 20- 25- 30- 35- 40- 45- 50- 55- 60- 65- 70- 75- 80- 85+ CR ESR WSR
Males 0.0 0.0 0.3 0.6 2.4 5.9 8.2 14.4 19.6 24.4 42.6 48.5 49.4 67.7 93.2 88.9 114.4 93.8 29.4 23.0 16.6
Females 0.0 0.0 0.3 1.6 7.0 15.1 23.4 30.0 40.3 55.0 63.8 58.2 56.3 62.8 64.3 62.1 58.4 57.3 35.7 29.7 23.0CR=Crude (all ages) Rate (N/100,000 person-years)ESR (1976)=Age-Standardised Rate, using the European Standard Population (N/100,000 person-years)WSR=Age-Standardised Rate, using the World Standard Population (N/100,000 person-years)
Figure 2: Melanoma: Age-specific incidence rates by sex, 2015-2019

44
1.3. Combined stage
Table 3: Melanoma: Distribution of combined stage by sex, Belgium 2019
StageI
StageII
StageIII
StageIV
StageX
StageNA Total
Males
N 1,181 257 112 41 11 54 1,656
% 71.3 15.5 6.8 2.5 0.7 3.3 100
Females
N 1,627 277 91 20 25 30 2,070
% 78.6 13.4 4.4 1.0 1.2 1.4 100Staging according to the TNM 8th edition (Ref: Brierley JD, Gospodarowicz MK, Wittekind Ch.TNM classification of malignant tumours, UICC 8th edition)Combined TNM stage : compilation of pathological (pTNM) and clinical (cTNM) stage. pTNMprevails over cTNM, except when cTNM stage is IVStage X: diagnoses with an unknown stageStage NA: diagnoses with a histological diagnosis where no stage can be evaluated (NotApplicable)
Figure 3: Melanoma: Bar chart of known combined stage by sex, Belgium 2019

55
1.4. Trends in incidence
Table 4: Melanoma: Age-standardised incidence rates (WSR) and average annual percentage change (AAPC)by incidence year, sex and region
Males 2005 2006 2007 2008 2009 2010 2011 2012 2013 2014 2015 2016 2017 2018 2019 AAPC95%CI
Belgium 8.0 8.1 9.3 9.1 8.8 10.8 11.0 12.8 12.1 13.5 13.0 13.8 15.7 16.1 16.6 5.6 [4.9; 6.3]
Brussels-Capital Region 8.0 7.9 10.2 9.7 11.0 11.7 12.9 11.9 12.0 13.2 10.2 12.3 11.3 13.4 10.3 2.5 [1.4; 3.7]
Flemish Region 8.2 8.4 9.4 8.6 8.0 9.5 10.4 12.3 12.4 13.5 13.1 13.5 15.6 16.9 17.9 5.6 [4.7; 6.5]
Walloon Region 7.7 7.6 8.9 10.2 9.7 13.1 11.8 14.0 11.7 13.7 13.8 15.2 17.5 15.7 16.1 6.1 [5.0; 7.2]
Females 2005 2006 2007 2008 2009 2010 2011 2012 2013 2014 2015 2016 2017 2018 2019 AAPC95%CI
Belgium 12.5 12.4 12.2 14.6 14.5 15.8 15.3 16.7 18.4 20.0 18.8 20.2 21.9 21.9 23.0 4.9 [4.3; 5.5]
Brussels-Capital Region 10.5 11.2 12.4 11.7 13.1 12.8 12.6 13.7 12.1 12.5 11.6 14.7 11.6 13.3 12.6 1.2 [0.3; 2.2]
Flemish Region 12.4 13.0 12.1 14.8 14.9 14.5 14.2 17.2 20.0 20.9 20.3 20.8 23.7 24.4 27.0 5.9 [5.0; 6.8]
Walloon Region 13.5 11.8 12.4 15.0 14.6 19.4 18.0 17.1 17.7 20.8 18.7 21.1 22.1 20.3 19.4 4.0 [2.8; 5.2]WSR=Age-Standardised Rate, using the World Standard Population (N/100,000 person-years)AAPC = Average Annual Percentage Change over the 2005-2019 period
Figure 4: Melanoma: Age-standardised incidence rates (WSR) by incidence year, sex and region

66
1.5. Incidence by broad age groups
Table 5: Melanoma: Number of new diagnoses and age-standardised incidence rates (WSR) by broad agegroups and incidence year by sex, Belgium
N WSR
2010 2011 2012 2013 2014 2015 2016 2017 2018 2019 2010 2011 2012 2013 2014 2015 2016 2017 2018 2019
Males
All ages 880 940 1,083 1,088 1,187 1,196 1,278 1,458 1,544 1,656 10.8 11.0 12.8 12.1 13.5 13.0 13.8 15.7 16.1 16.6
0-14 y 1 1 2 0 0 0 0 2 1 1 <0.1 0.1 0.2 0.0 0.0 0.0 0.0 0.2 <0.1 <0.1
15-44 y 197 165 222 164 212 162 178 201 193 188 8.1 6.7 8.8 6.7 8.6 6.5 7.2 8.1 7.9 7.6
45-54 y 148 164 203 208 224 205 224 237 263 269 18.5 20.2 24.8 25.1 27.4 24.9 27.6 29.4 32.6 32.7
55-64 y 184 208 226 216 235 261 282 347 353 365 28.2 31.3 33.9 31.8 34.2 37.5 40.1 48.2 48.3 49.0
65-74 y 171 194 206 235 249 301 310 376 372 435 38.9 44.8 45.4 50.7 52.4 61.8 61.7 72.2 68.9 77.9
75+ y 179 208 224 265 267 267 284 295 362 398 50.7 59.0 61.4 70.1 69.7 68.2 71.1 74.9 91.0 96.5
Females
All ages 1,249 1,252 1,399 1,551 1,721 1,632 1,783 1,924 1,954 2,070 15.8 15.3 16.7 18.4 20.0 18.8 20.2 21.9 21.9 23.0
0-14 y 4 3 2 2 2 1 2 3 0 1 0.4 0.3 0.2 0.2 0.2 0.1 0.2 0.3 0.0 <0.1
15-44 y 399 391 387 414 432 390 420 453 437 428 17.0 16.3 16.0 16.9 17.6 16.2 17.2 18.8 18.0 17.5
45-54 y 223 240 289 337 367 351 358 430 443 464 28.5 30.2 36.2 42.0 46.2 43.6 45.1 54.1 55.6 59.0
55-64 y 228 191 242 269 342 316 364 339 354 433 34.3 28.1 35.1 38.7 48.9 44.2 50.4 46.0 47.4 57.3
65-74 y 171 176 210 259 237 265 295 334 349 380 34.7 35.8 41.7 49.6 45.1 49.1 53.4 58.4 59.4 63.4
75+ y 224 251 269 270 341 309 344 365 371 364 37.9 40.7 44.7 45.2 56.1 50.9 53.6 58.4 62.2 60.0N=Number of invasive tumoursWSR=Age-Standardised Rate, using the World Standard Population (N/100,000 person-years)
Figure 5: Melanoma: Age-standardised incidence rates (WSR) versus incidence year by broad age groups formales (top) and females (bottom), Belgium

77
2. Relative survival
Table 6: Melanoma: 5-year relative survival proportion by sex, age group and region, Belgium 2015-2019
5-year relative survival 2015-2019 (%)
Males Females
N at risk estimate 95% CI N at risk estimate 95% CI
Overall 6,960 94.3 [92.8, 95.6] 9,194 96.8 [95.8, 97.7]
Age group
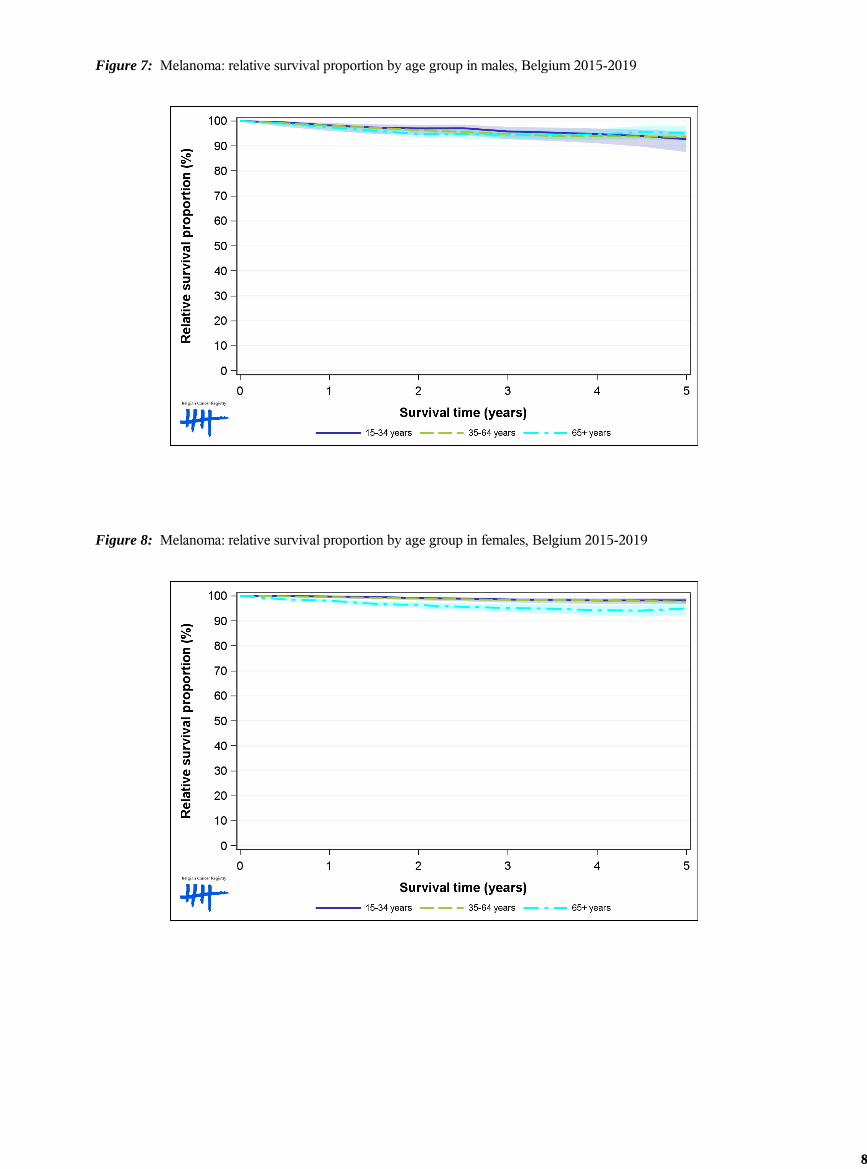
15-34 years 330 92.9 [87.9, 96.0] 846 98.3 [96.9, 99.1]
35-64 years 3,322 93.6 [92.2, 94.8] 5,034 97.7 [96.9, 98.4]
65+ years 3,309 95.4 [92.4, 98.2] 3,315 94.9 [92.2, 97.3]
Region
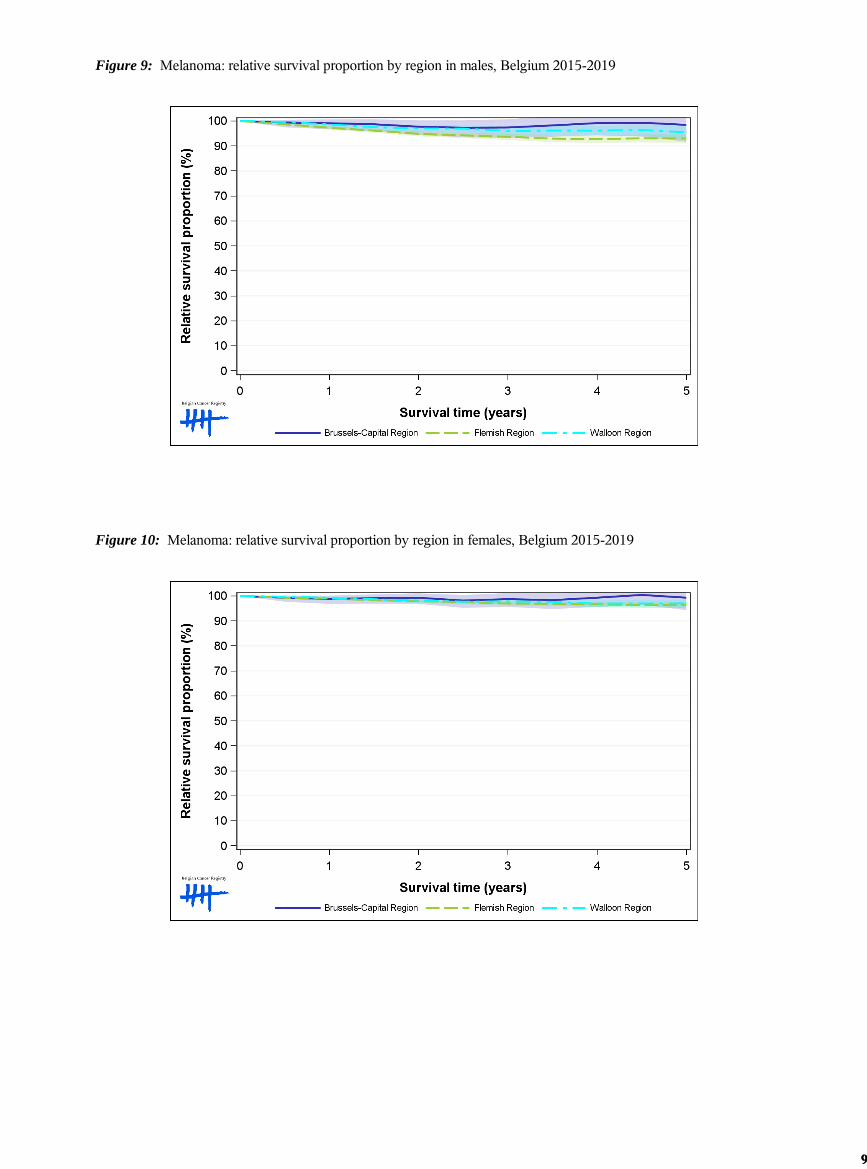
Brussels-Capital Region 461 98.6 [92.0, 103.9] 578 99.3 [94.5, 103.1]
Flemish Region 4,336 93.1 [91.3, 94.8] 5,912 96.4 [95.2, 97.5]
Walloon Region 2,164 95.7 [93.0, 98.2] 2,704 97.1 [95.3, 98.6]
Figure 6: Melanoma: relative survival proportion by sex, Belgium 2015-2019
88
Figure 7: Melanoma: relative survival proportion by age group in males, Belgium 2015-2019
Figure 8: Melanoma: relative survival proportion by age group in females, Belgium 2015-2019
99
Figure 9: Melanoma: relative survival proportion by region in males, Belgium 2015-2019
Figure 10: Melanoma: relative survival proportion by region in females, Belgium 2015-2019