1 © copyrright doug hillman 2000 analysis and interpretation of financial statements
Post on 20-Dec-2015
227 views
TRANSCRIPT

1© Copyrright Doug Hillman 2000
Analysis and Interpretation of
Financial Statements
2© Copyrright Doug Hillman 2000
Financial Statement Analysis
The application of analytical tools and techniques to financial statement data.
Allows users to focus on how numbers are related and how they have changed over time
3© Copyrright Doug Hillman 2000
Objective of Financial StatementAnalysis
External users rely on general purpose financial statements
Make predictions about an organization as an aid in making decisions
Users highlight important trends or changes
4© Copyrright Doug Hillman 2000
Risk and Return
Users try to balance the risk of an investment with its expected return
Generally the greater the risk, the higher the return
Financial statement analysis is one source of information for assessing risk and return

5© Copyrright Doug Hillman 2000
Sources of External Information
Public companies must publish an annual financial report
Government reports› SEC 10K, 10Q
Financial service information› Moody’s, Dow-Jones
Financial newspapers and periodicals› Wall Street Journal
6© Copyrright Doug Hillman 2000
Financial Analysis Tools
Horizontal analysis Vertical analysis Ratio analysis
7© Copyrright Doug Hillman 2000
Horizontal Analysis: Amounts and Percentages
of Change
Amount of change = later year amount - Earlier year amount
Percentage change = Amount of change / Earlier year amount
Look for significant change
8© Copyrright Doug Hillman 2000
Horizontal Analysis: Trend Percentages
Set all amounts in base year at 100% Compute percentages for a number of years
› Divide each statement amount by respective amount in base year
Shows degree of increase or decrease in individual statement items
Used to explain changes in operating performance
9© Copyrright Doug Hillman 2000
Vertical Analysis Shows how each item in a financial
statement compares to the total of that statement
Balance sheet
› Set both total assets and total equities at 100%
Income statement
› Set net sales at 100%

10© Copyrright Doug Hillman 2000
Vertical Analysis
Identify significant dollar and percentage changes
Explain the changes Identify whether they are favorable of
unfavorable
11© Copyrright Doug Hillman 2000
Ratio Analysis
Shows the relative size of one financial statement component to another.
Effective only when used in combination with other ratios, analysis, and information
12© Copyrright Doug Hillman 2000
Ratio Analysis
Short-term liquidity Long-term solvency Profitability Market performance
13© Copyrright Doug Hillman 2000
Short-term Profitability
Current ratio Quick ratio Accounts receivable turnover Days’ sales in receivables Inventory turnover

14© Copyrright Doug Hillman 2000
Current Ratio
Common measure of liquidity
› Ability to pay debts as they come due
› Rule of thumb 2:1
› Consider other factors
Current Assets
Current Liabilities
15© Copyrright Doug Hillman 2000
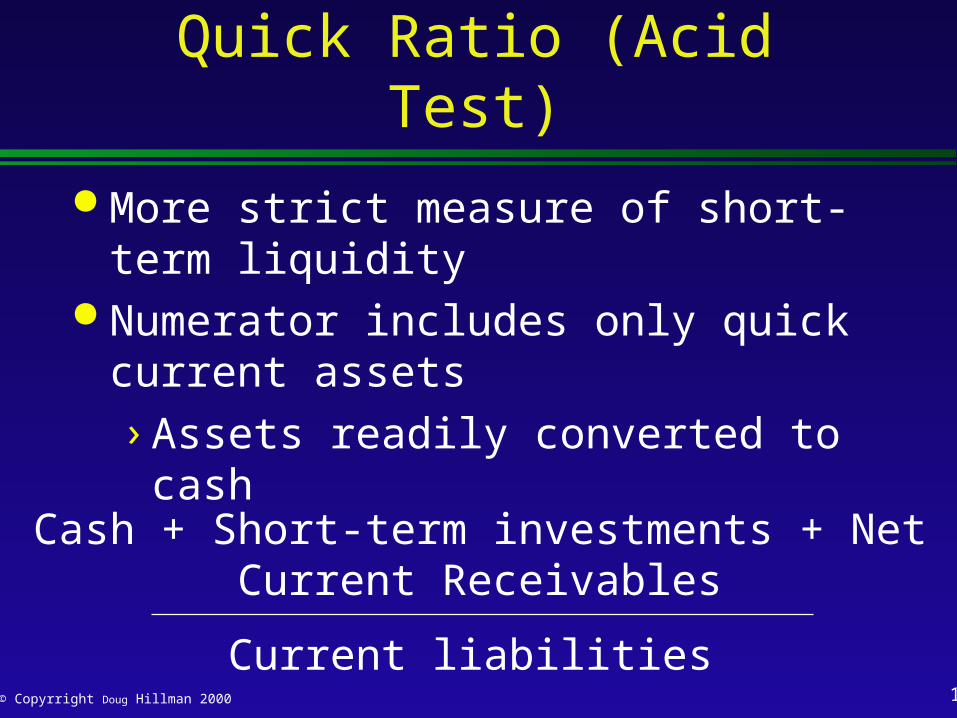
Quick Ratio (Acid Test)
More strict measure of short-term liquidity
Numerator includes only quick current assets
› Assets readily converted to cash
Cash + Short-term investments + NetCurrent Receivables
Current liabilities
16© Copyrright Doug Hillman 2000
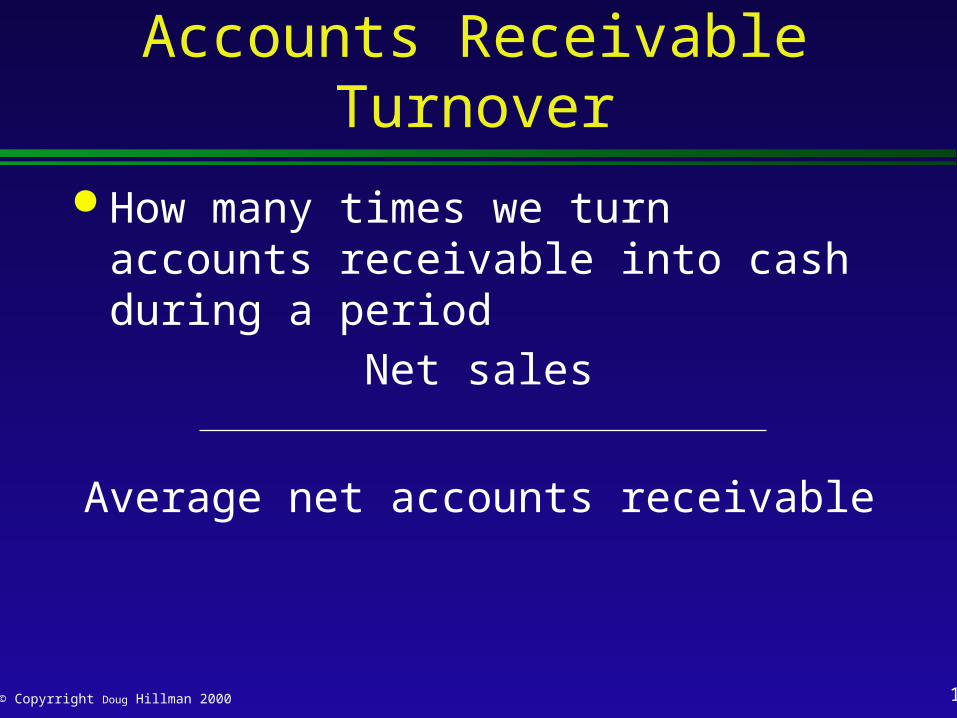
Accounts Receivable Turnover
How many times we turn accounts receivable into cash during a period
Net sales
Average net accounts receivable
17© Copyrright Doug Hillman 2000
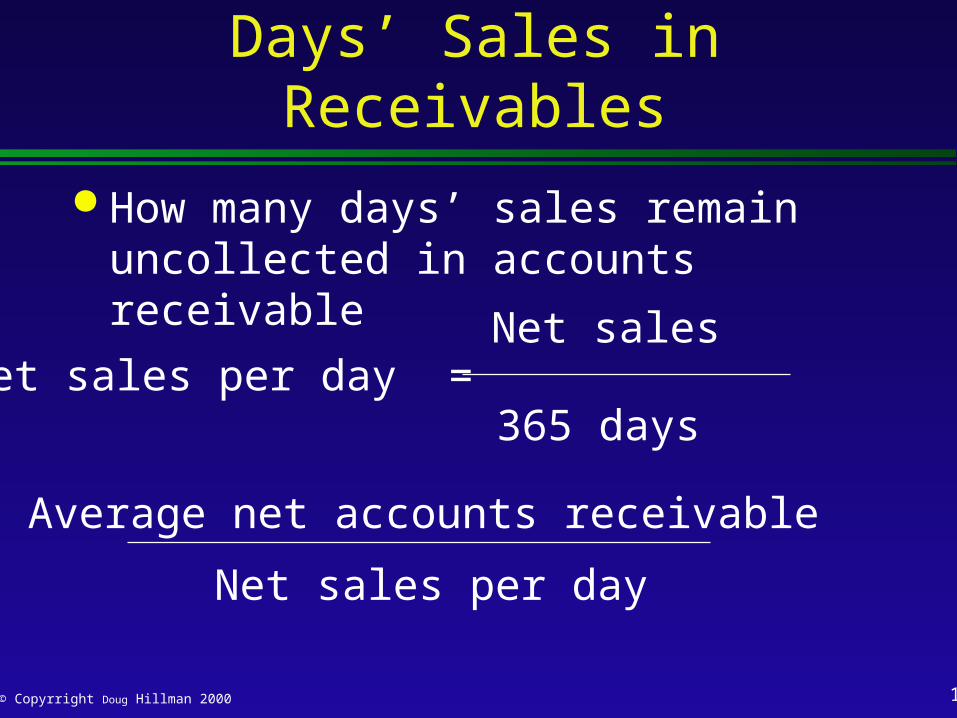
Days’ Sales in Receivables
How many days’ sales remain uncollected in accounts receivable
Net sales per day =Net sales
365 days
Average net accounts receivable
Net sales per day
18© Copyrright Doug Hillman 2000
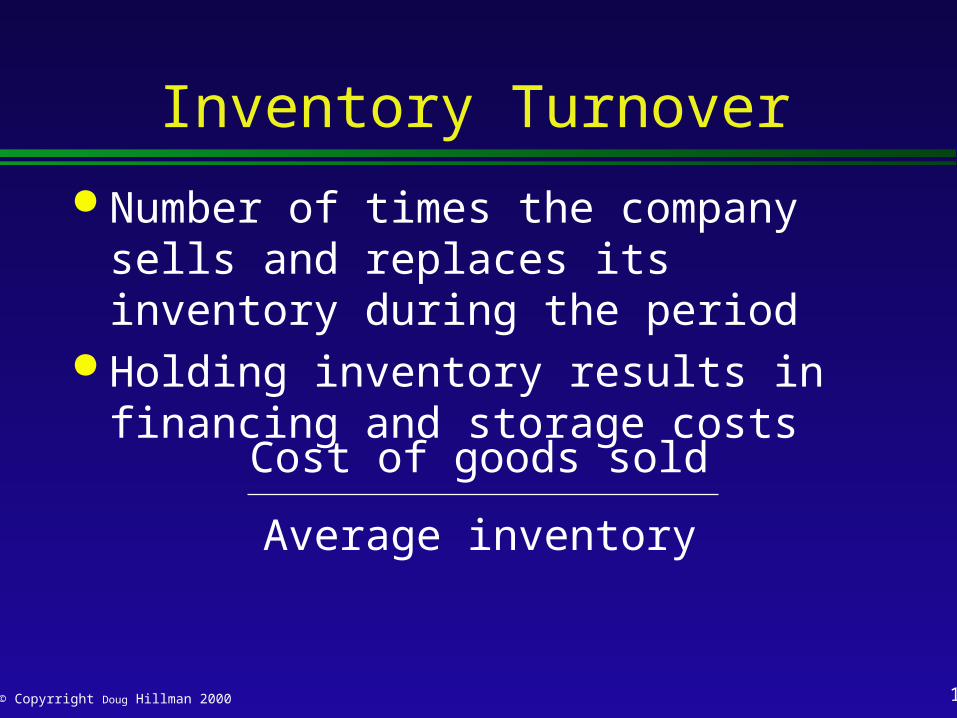
Inventory Turnover
Number of times the company sells and replaces its inventory during the period
Holding inventory results in financing and storage costs
Cost of goods sold
Average inventory
19© Copyrright Doug Hillman 2000
Long-term Solvency
Debt ratio Times Interest Earned
20© Copyrright Doug Hillman 2000
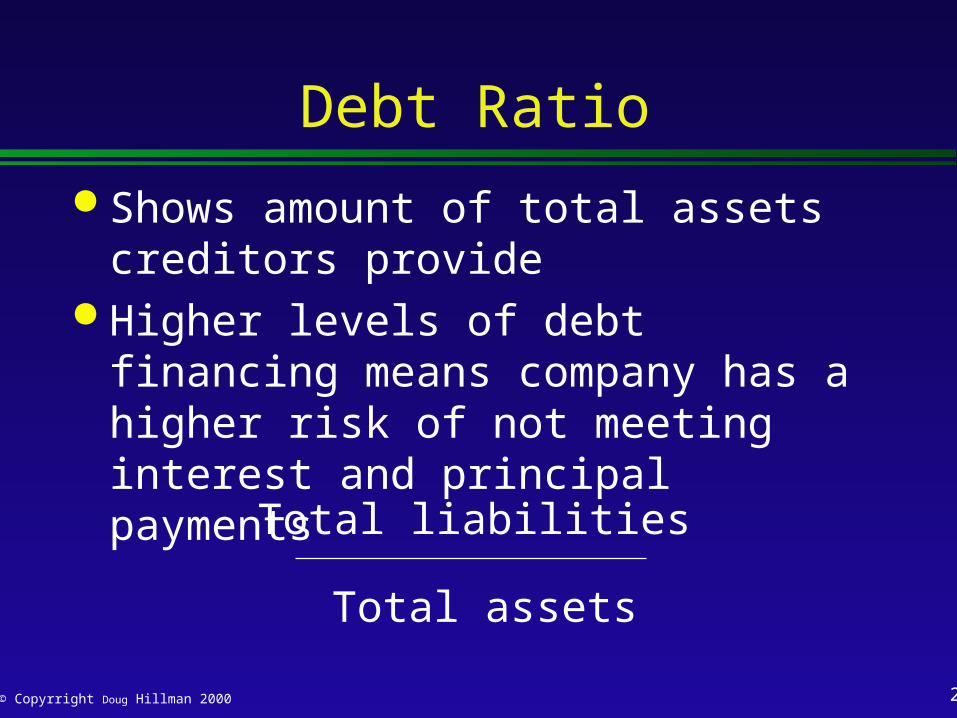
Debt Ratio
Shows amount of total assets creditors provide
Higher levels of debt financing means company has a higher risk of not meeting interest and principal payments
Total liabilities
Total assets
21© Copyrright Doug Hillman 2000
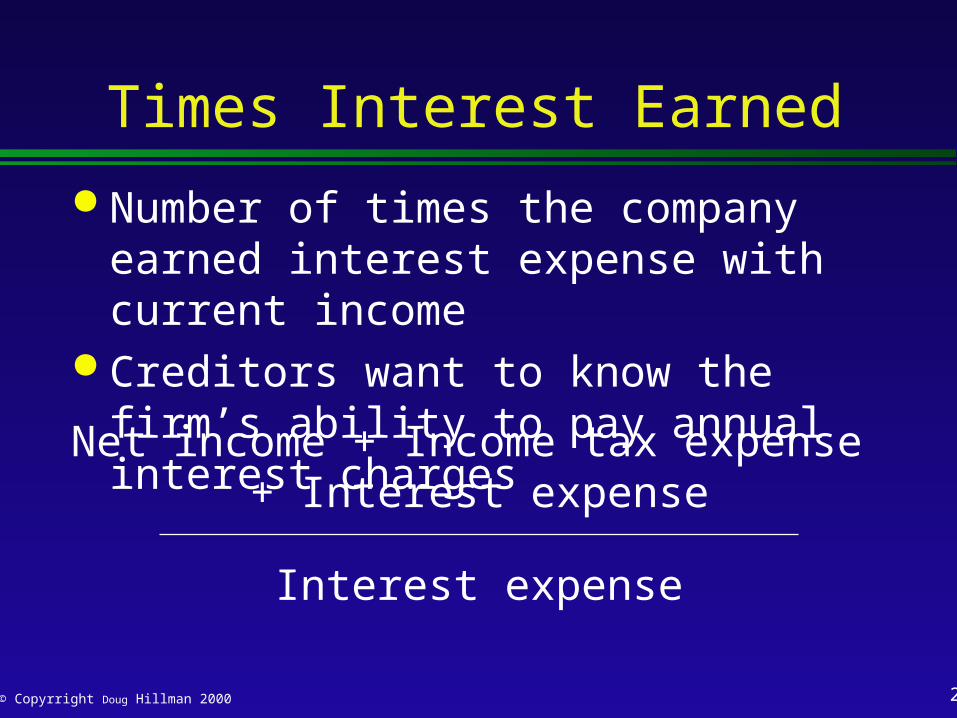
Times Interest Earned
Number of times the company earned interest expense with current income
Creditors want to know the firm’s ability to pay annual interest charges
Net income + Income tax expense + Interest expense
Interest expense
22© Copyrright Doug Hillman 2000
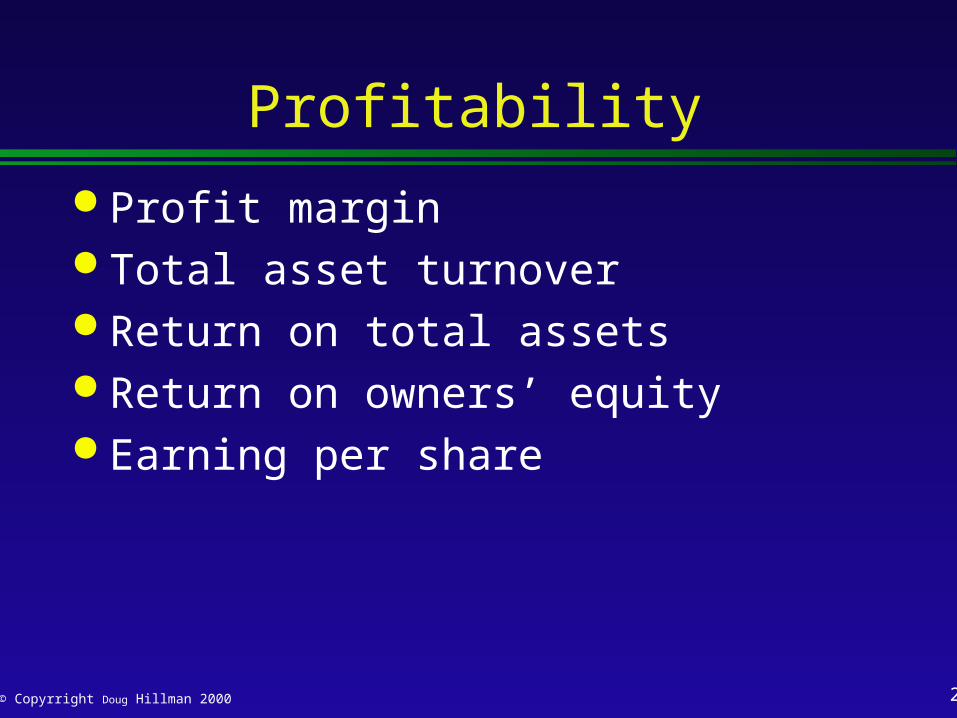
Profitability
Profit margin Total asset turnover Return on total assets Return on owners’ equity Earning per share
23© Copyrright Doug Hillman 2000
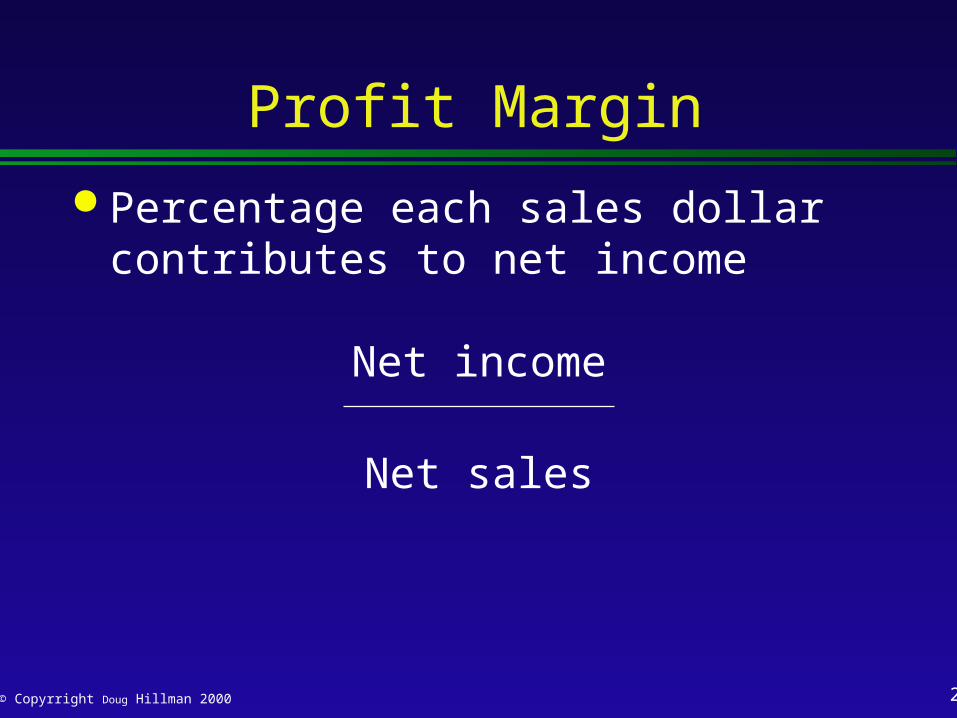
Profit Margin
Percentage each sales dollar contributes to net income
Net income
Net sales

24© Copyrright Doug Hillman 2000
Total Asset Turnover
Measures the efficiency of the company is using its investment in assets to generate sales
Net sales
Average total assets
25© Copyrright Doug Hillman 2000
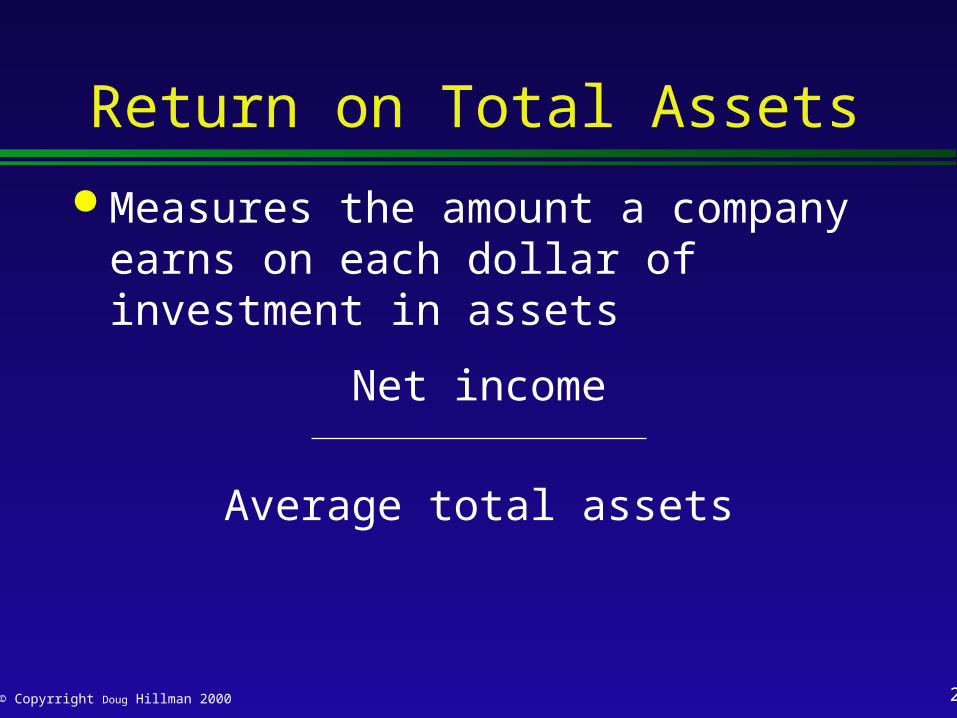
Return on Total Assets
Measures the amount a company earns on each dollar of investment in assets
Net income
Average total assets
26© Copyrright Doug Hillman 2000
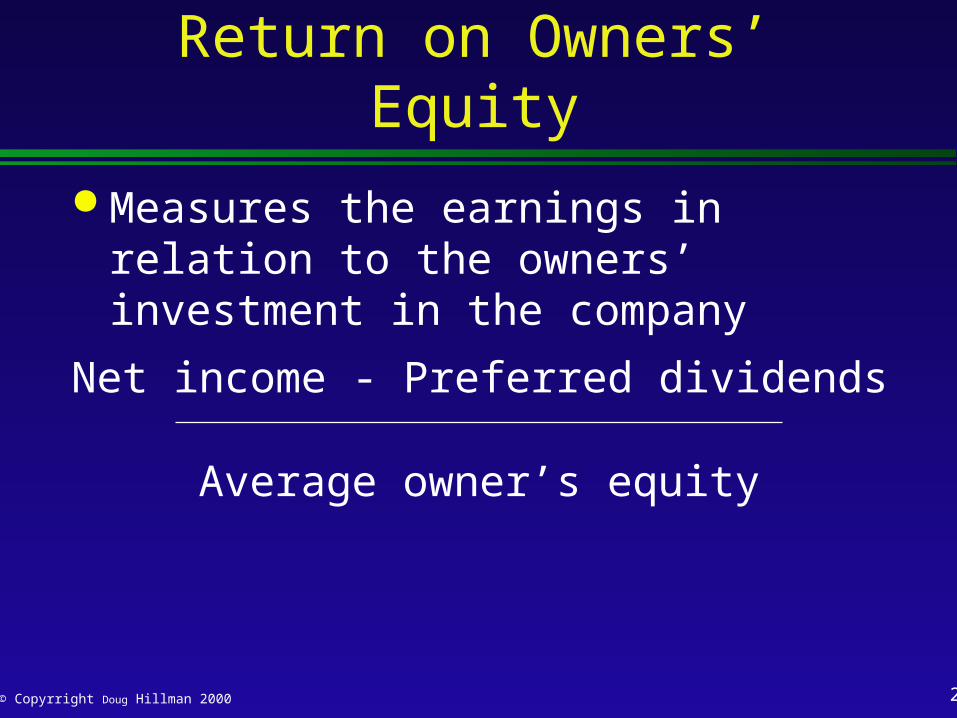
Return on Owners’ Equity
Measures the earnings in relation to the owners’ investment in the company
Net income - Preferred dividends
Average owner’s equity
27© Copyrright Doug Hillman 2000
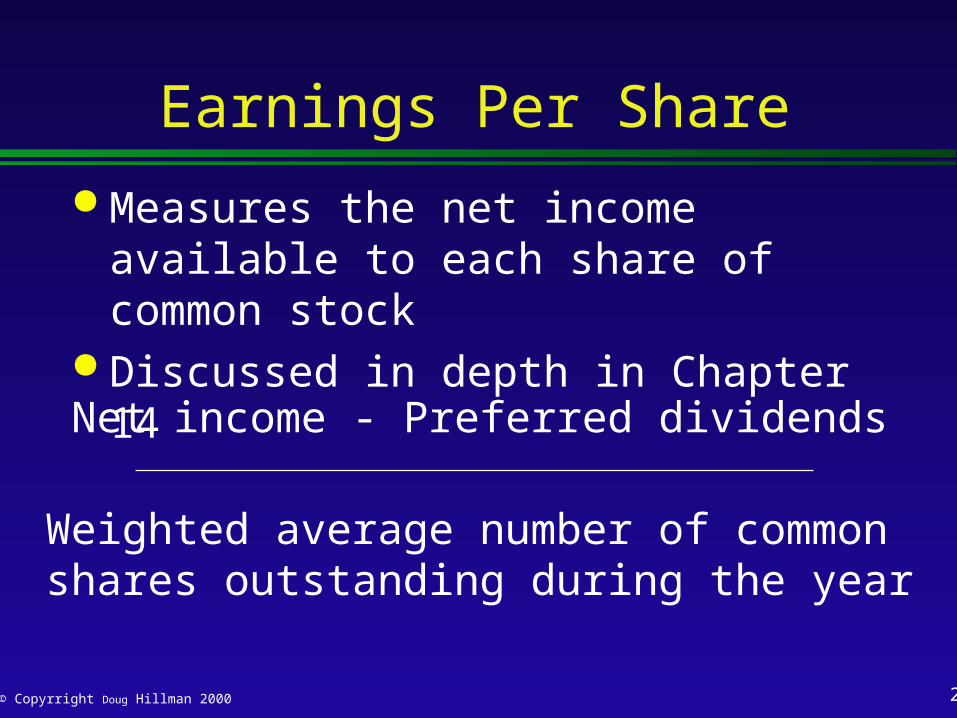
Earnings Per Share
Measures the net income available to each share of common stock
Discussed in depth in Chapter 14
Net income - Preferred dividends
Weighted average number of common shares outstanding during the year
28© Copyrright Doug Hillman 2000
Market Performance
Price/Earnings (P/E) ratio Dividend yield
29© Copyrright Doug Hillman 2000
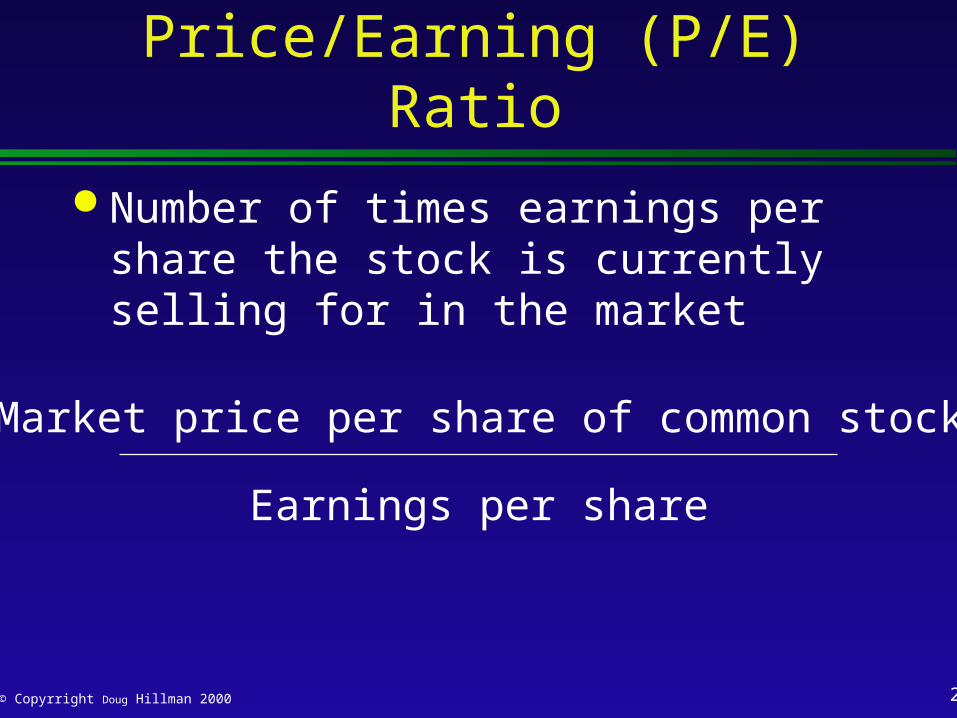
Price/Earning (P/E) Ratio
Number of times earnings per share the stock is currently selling for in the market
Market price per share of common stock
Earnings per share
30© Copyrright Doug Hillman 2000
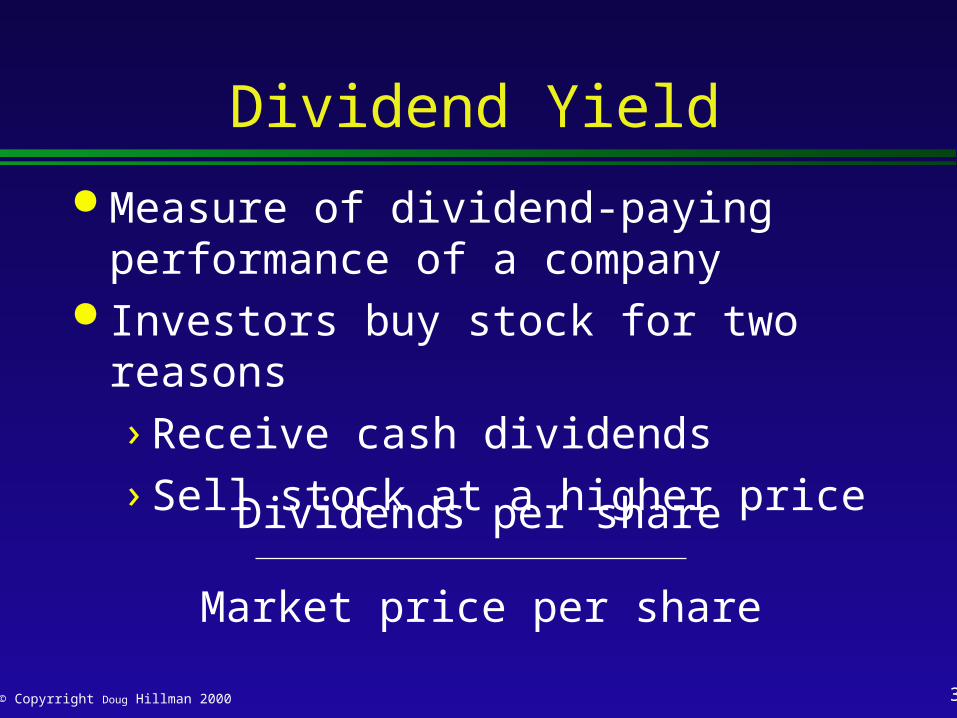
Dividend Yield
Measure of dividend-paying performance of a company
Investors buy stock for two reasons
› Receive cash dividends
› Sell stock at a higher price
Dividends per share
Market price per share

31© Copyrright Doug Hillman 2000
Limitations of Financial Analysis Tools
Historical nature of accounting information
Changing economic conditions Comparisons with industry averages Seasonal factors Quality of reported income
