1 demographic and enrollment information office of the chancellor academic affairs october 2006
Post on 19-Dec-2015
212 views
TRANSCRIPT

1
Demographic and Enrollment Information
Office of the ChancellorAcademic Affairs
October 2006

2
College-Related Demographics

3
LA Basin 9th Graders and High School Graduates
100,000
150,000
200,000
250,000
300,000
350,000
1999-00
2000-01
2001-02
2002-03
2003-04
2004-05
2005-06
2006-07
2007-08
2008-09
2009-10
2010-2011
2011-12
2012-13
2013-14
2014-15
Pub
lic H
S G
radu
ates
HS Graduates Ninth Graders
4
Only 66 of Every 100 in the LA Basin
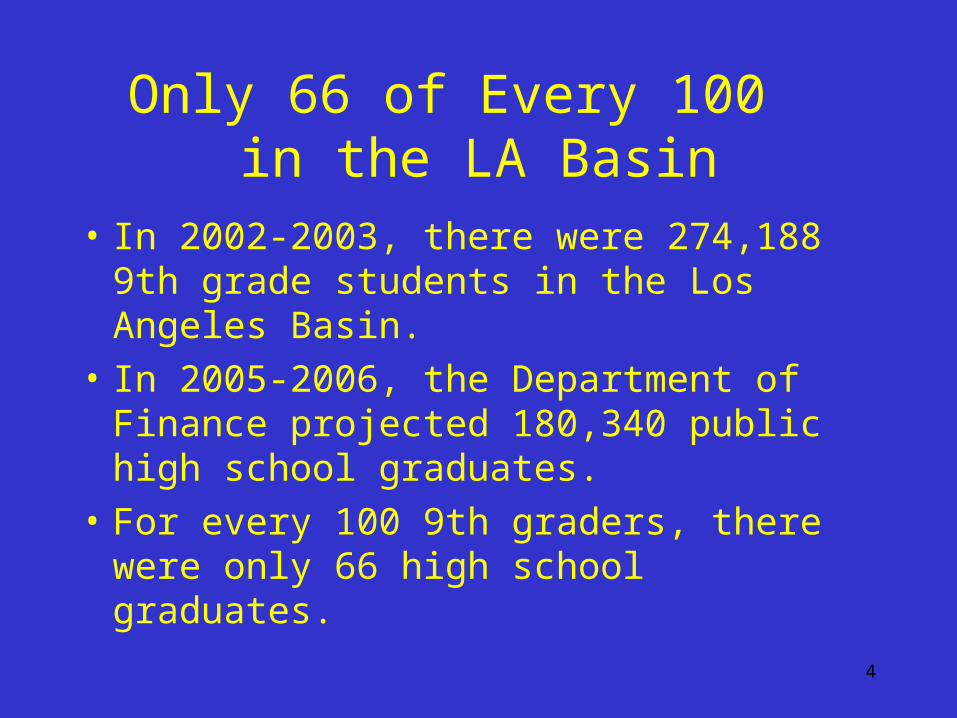
• In 2002-2003, there were 274,188 9th grade students in the Los Angeles Basin.
• In 2005-2006, the Department of Finance projected 180,340 public high school graduates.
• For every 100 9th graders, there were only 66 high school graduates.

5
9th Graders and High School Graduatesin the Rest of the State
100,000
120,000
140,000
160,000
180,000
200,000
220,000
240,000
260,000
280,000
1999-00
2000-01
2001-02
2002-03
2003-04
2004-05
2005-06
2006-07
2007-08
2008-09
2009-10
2010-2011
2011-12
2012-13
2013-14
2014-15
Pub
lic H
S G
radu
ates
HS Graduates Ninth Graders

6
Only 75 of Every 100in the Rest of the State
• In 2002-2003, there were 247,125 9th grade students in the rest of the state.
• In 2005-2006, the Department of Finance projected , 183,895 public high school graduates.
• For every 100 9th graders, there were only 74 high school graduates.

7
9th Graders
• Almost 160K 9th graders in 2002-03 did not graduate with their 360K+ other classmates in 2005-06.
• In 2005-06, 50% of high school graduates were in the LA Basin. If all 9th graders actually made it to the diploma, 53% of graduates would have been from the Basin.
• Improved h.s. graduation must be coupled with academic rigor and expectations.

8
High School Graduates
• “Eligibles” and “Near-Eligibles” become CSU First-Time Freshmen – Admitted Regularly and By Exception
• Others become California Community College Students –Transferring to the CSU 3 to 7 Years Later
9
Community College Transfers
10
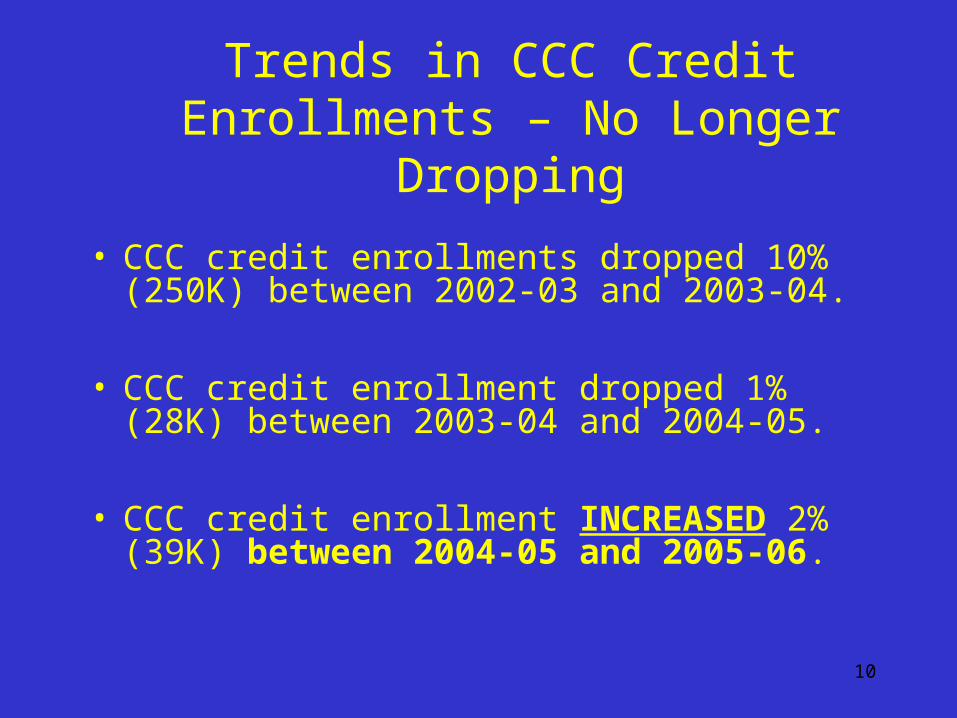
Trends in CCC Credit Enrollments – No Longer
Dropping
• CCC credit enrollments dropped 10% (250K) between 2002-03 and 2003-04.
• CCC credit enrollment dropped 1% (28K) between 2003-04 and 2004-05.
• CCC credit enrollment INCREASED 2% (39K) between 2004-05 and 2005-06.

11
AND
Indicators of CCC trends about students completing coursework to transfer increased throughout the same period.
12
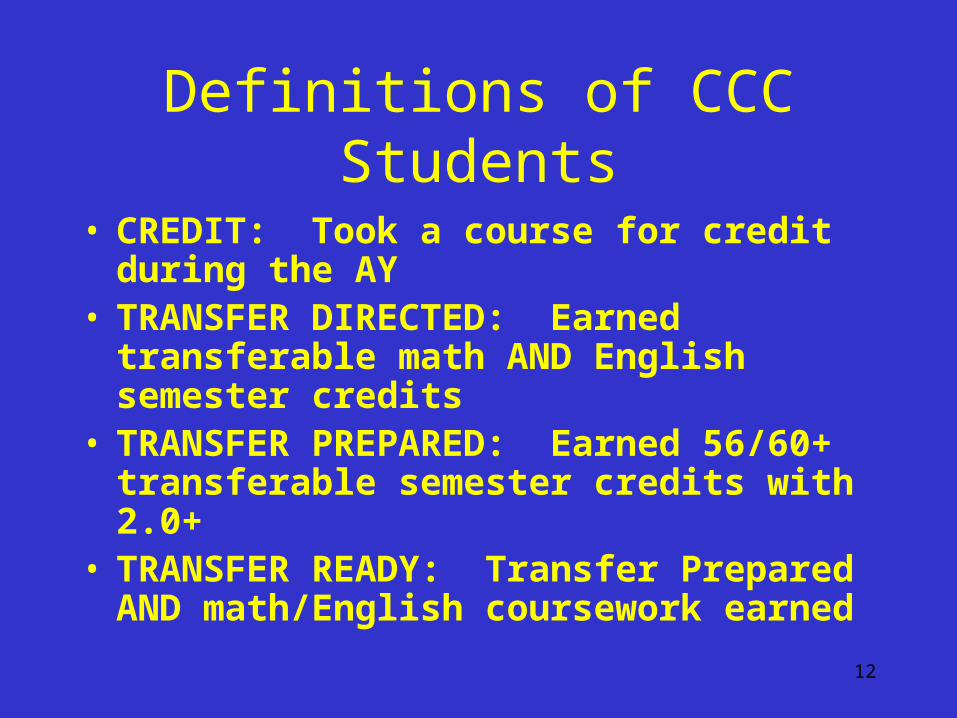
Definitions of CCC Students
• CREDIT: Took a course for credit during the AY
• TRANSFER DIRECTED: Earned transferable math AND English semester credits
• TRANSFER PREPARED: Earned 56/60+ transferable semester credits with 2.0+
• TRANSFER READY: Transfer Prepared AND math/English coursework earned

13
California Community College Students:Credit and Transfer Directed
0
500,000
1,000,000
1,500,000
2,000,000
2,500,000
3,000,000
2000-01 2001-02 2002-03 2003-04 2004-05 2005-06
Stu
den
ts
Credit Student Transfer Directed

14
California Community College Students:Transfer Directed, Prepared, and Ready
50,000
100,000
150,000
200,000
250,000
300,000
2000-01 2001-02 2002-03 2003-04 2004-05 2005-06
Stu
den
ts
Directed Prepared Ready
15
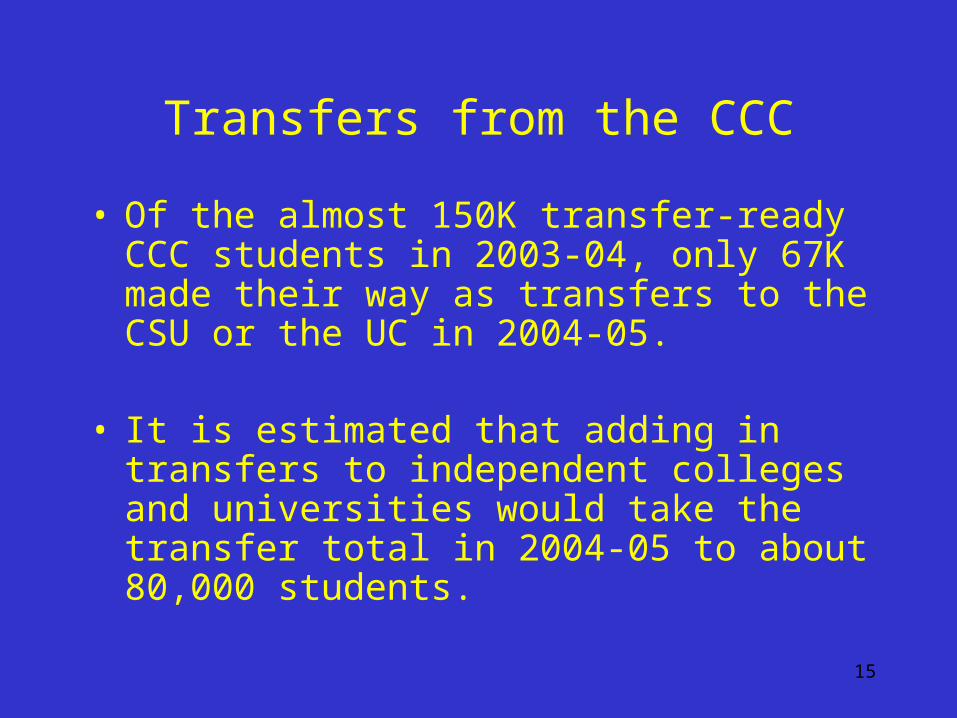
Transfers from the CCC
• Of the almost 150K transfer-ready CCC students in 2003-04, only 67K made their way as transfers to the CSU or the UC in 2004-05.
• It is estimated that adding in transfers
to independent colleges and universities would take the transfer total in 2004-05 to about 80,000 students.

16
• This means that almost half of the CCC students ready for CSU or UC transfer in 2003-04 actually transferred in 2004-05. Preliminary data suggests that the same holds true for 2004-05 transfer-ready students.
• More executive outreach between CSU and CCC regional partners may need to be undertaken.

17
Example 1: Dominguez Hills
• In fall 2005, DH had 11 feeder CCC campuses that provided 20 or more transfers.
• These CCCs sent 906 fall 2005 transfers to DH.
• They sent a total of 4,000+ transfers to the CSU in total and about 1,600+ transfers to the UC in fall 2005.

18
Example 1 Continued
• But altogether the fall 2005 transfers total only (5,600+) 31% of the transfer-ready CCC students at these institutions.
• West LA, Southwest LA, LA Harbor, LB City, El Camino, and Cerritos are CCCs at which DH has a presence on which to build.
19
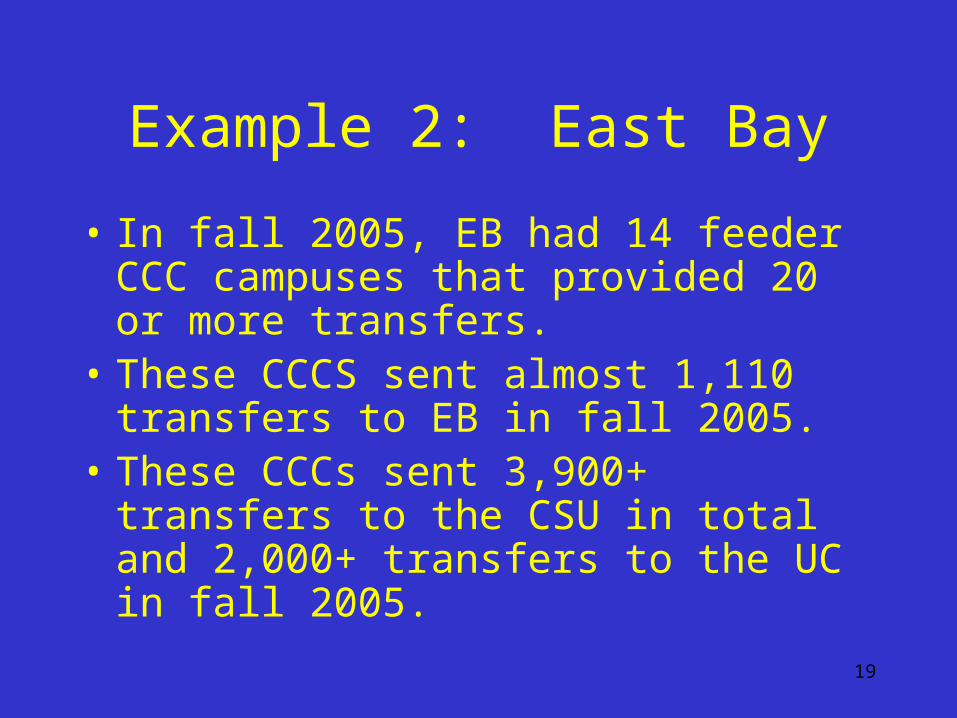
Example 2: East Bay
• In fall 2005, EB had 14 feeder CCC campuses that provided 20 or more transfers.
• These CCCS sent almost 1,110 transfers to EB in fall 2005.
• These CCCs sent 3,900+ transfers to the CSU in total and 2,000+ transfers to the UC in fall 2005.

20
Example 2 Continued
• But altogether the fall 2005 transfer total only (5,900+) 30% of the transfer-ready students at these institutions.
• Chabot, Las Positas, Diablo Valley, Ohlone, and Merritt are CCCs with notable transfer-readies and at which EB has a presence on which to build.

21
First-Time Freshmen

22
28.80%
30.40%
34.80%
36.10%
36.70%
36.80%
39.90%
40.20%
40.50%
0% 10% 20% 30% 40% 50%
Inland Empire
San Joaquin Valley
LA/Ventura
Central Coast
Northern
Sacramento Area
San Diego
Orange County
SF Bay
2001 CSU Eligibility Rates for California Public High School Graduates – By Region
CPEC, Regional Differences in University Eligibility, FS 05-08, December 2005

23
10.8 11.2 11
0.0
2.0
4.0
6.0
8.0
10.0
12.0
LA Basin Rest of State State Total
CSU Freshman Participation Rates for California Public High School Graduates: A Third of a Third

24
Why Only a Third of a Third?
• UC and CSU eligibility overlap: The top eighth (12.5%) tend to matriculate at UC or other more selective institutions in California.
• While other students are leaving the state, CPEC, UC, CSU, and CCC need to track the extent to which UC and CSU eligible students are matriculating at CCC – considered by some to be another primary destination.

25
LA Basin High School Graduates
• In 2004-05, there were 168,219 public high school graduates in the LA Basin. About 51% became California public first-time freshmen in fall 2005.
• Only 18% (a little under 30,000) went to the UC or the CSU. About 18,000 – or 6 of every 10 FTF at a public 4-year -- went to the CSU.
• Almost 56,000 LA Basin graduates went to community colleges – almost double that of the UC/CSU
26
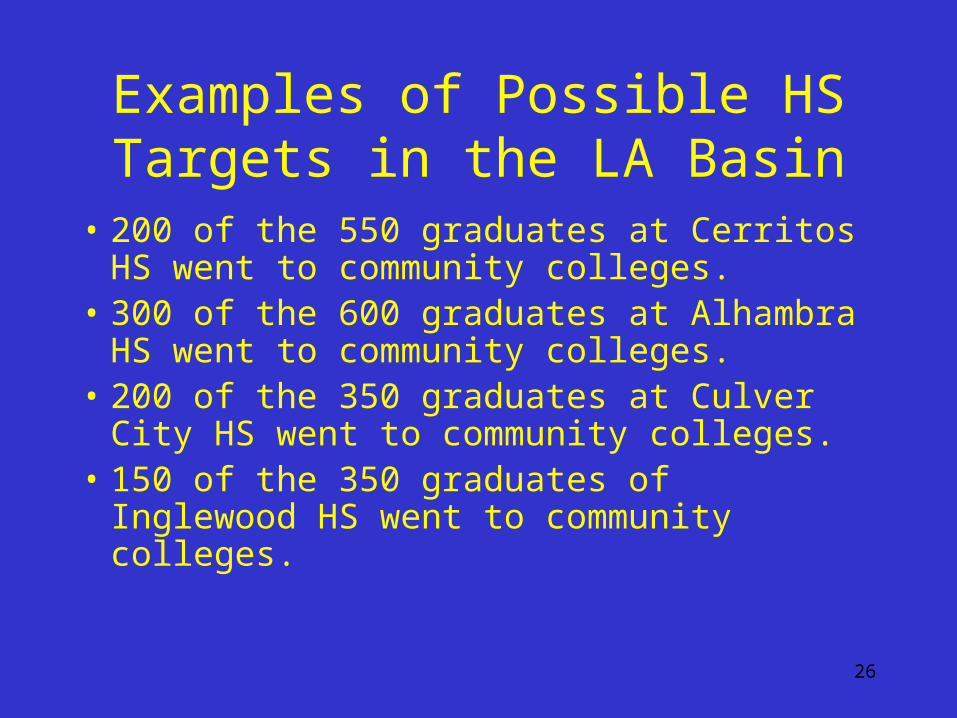
Examples of Possible HS Targets in the LA Basin
• 200 of the 550 graduates at Cerritos HS went to community colleges.
• 300 of the 600 graduates at Alhambra HS went to community colleges.
• 200 of the 350 graduates at Culver City HS went to community colleges.
• 150 of the 350 graduates of Inglewood HS went to community colleges.

27
Bay Area HS Graduates
• In 2004-05, there were 64,533 public high school graduates in the Bay Area. About 53% became California public first-time freshmen in fall 2005.
• A little under a quarter (15K) went to the UC or the CSU – split about evenly.
• A slightly greater number and proportion -- 18.5K Bay Area graduates -- went to community colleges.

28
Examples of Possible Targets in the Bay Area
• 180 of the almost 400 Alameda graduates went to community colleges.
• 200 of the almost 600 Castro Valley graduates went to community colleges.
• 280 of the 390 Oakland graduates went to community colleges.
• 200 of the 500 Mt. Eden graduates went to community colleges.

29
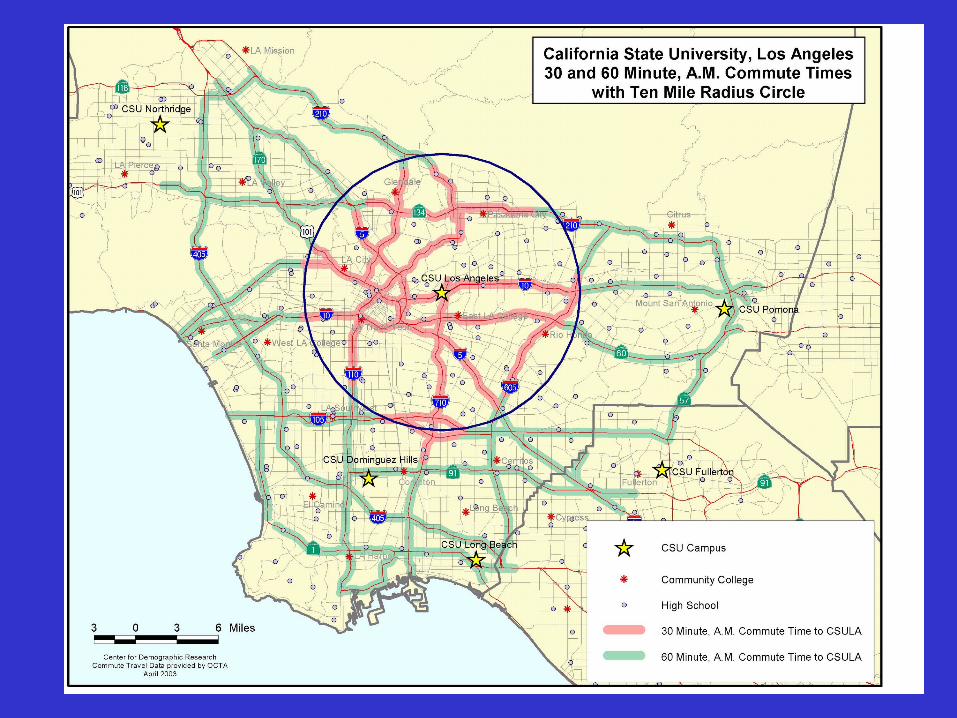
Commuting

30

31

32

33
8.9%
30.3%
53.7%
7.1% Within 10 milesof two CSUCampusesWithin 10 milesof one CSUcampusWithin 20 milesof a CSU campus
Outside 20 mileradius of a CSUCampus
20 Mile Coverage of CA Public High School GraduatesLA Basin
34

35
Summary

36
Summary -- 1
• Academic preparedness varies considerably in the region.
• Commuting patterns matter in the LA Basin (and probably in the Bay Area and the San Diego Area) – with commuting ranges shrinking rapidly.

37
Summary -- 2
• BUT -- Students drive past some campuses or leave the area – for programs, to get away from home and experience a new place, or because the local CSU campus wasn’t a good match.
• To develop increased enrollments, campuses need to: offer and publicize quality programs and opportunities; know and develop the campus culture; and direct outreach to students and families with shared interests.