1 dr. bassam hijawi epidemiologist director of jordan cancer registry director of health promotion
TRANSCRIPT
11
Dr. Bassam HijawiDr. Bassam Hijawi
Epidemiologist Epidemiologist
Director of Jordan Cancer Director of Jordan Cancer RegistryRegistry
Director of Health Director of Health PromotionPromotion

22
In EpidemiologyIn Epidemiology
The most important tool for The most important tool for measuring the risk of occurrence of measuring the risk of occurrence of a particular event in a population a particular event in a population during a given time period are :-during a given time period are :-
33
Rates Rates
Morbiditly Rats:Morbiditly Rats:Measuring the occurrence (probability , Measuring the occurrence (probability ,
risk) of disease (includes illness, injury, or risk) of disease (includes illness, injury, or disability). A term preferably avoided, used disability). A term preferably avoided, used incidence rate or prevalence rate incidence rate or prevalence rate
Mortality Rates: Mortality Rates: Measuring the occurrence of deaths. A Measuring the occurrence of deaths. A
term preferably a voided, many crude and term preferably a voided, many crude and specific death rates used. (indices of health ).specific death rates used. (indices of health ).
44
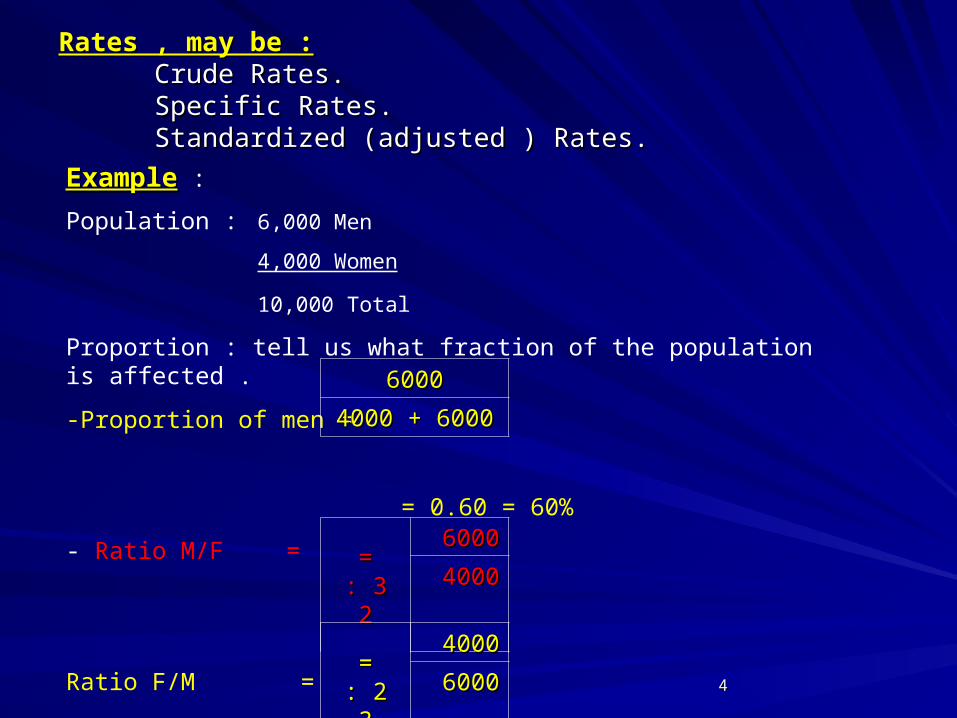
Rates , may be :Rates , may be : Crude Rates.Crude Rates.
Specific Rates.Specific Rates.Standardized (adjusted ) Rates.Standardized (adjusted ) Rates.
ExampleExample :
Population : 6,000 Men
4,000 Women
10,000 Total
Proportion : tell us what fraction of the population is affected .
-Proportion of men =
= 0.60 = 60%
- Ratio M/F =
Ratio F/M =
60006000 = =33 : : 22
40004000
60006000
60006000 + + 40004000
40004000 = =22 : : 33
60006000

55
ExampleExample :
- ( 40) new cancer lung cases reported during the yare 2004 from the previous population (30 among men and 10 among Women ). 6 cases died during the same year .
(5 among men and 1 among women )
Rates : tell us how fast the disease is occurring in a population .
- Lung Cancer Incidence Rate =
- Female Lung cancer Incidence Rate =
- Lung cancer death Rate =
4040X 1000 = 4 /1000X 1000 = 4 /1000
10,00010,000
1010X 10,000 = 25 /10,000X 10,000 = 25 /10,000
40004000
66X 10,000 = 6 /10,000X 10,000 = 6 /10,000
10,00010,000
X 100,000 = 60 /100,000X 100,000 = 60 /100,000
X 1000 = 0.6 /1000X 1000 = 0.6 /1000
66
Measures of Disease Occurrence Measures of Disease Occurrence Morbidity RatesMorbidity Rates
Routinely collected data on illness from different sources :Routinely collected data on illness from different sources :
1.1. Incidence Rate:Incidence Rate:
The number of new cases of a disease that occur during a specified The number of new cases of a disease that occur during a specified
period of time in a population at risk for developing a disease .period of time in a population at risk for developing a disease .
IR per 1000IR per 1000
No. of new cases of a disease occurring in the No. of new cases of a disease occurring in the
population during a specified of timepopulation during a specified of time
= = __________________________________________________________________________________________________________________________________ x 1000 x 1000
No. of persons at risk of developing the disease No. of persons at risk of developing the disease
during that period of time during that period of time
77
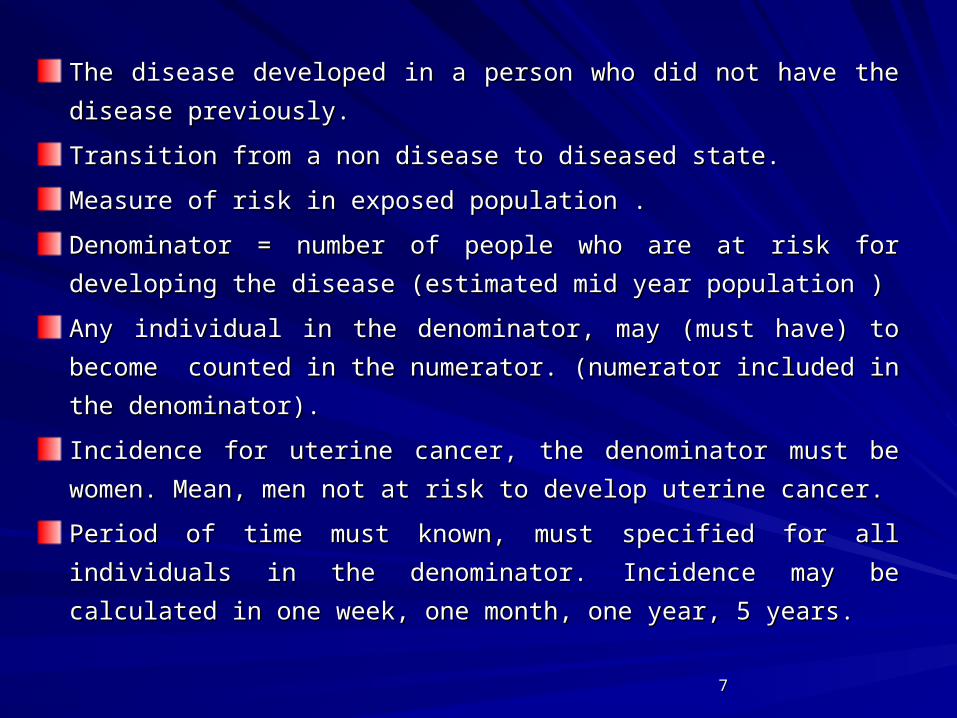
The disease developed in a person who did not have the disease The disease developed in a person who did not have the disease
previously.previously.
Transition from a non disease to diseased state.Transition from a non disease to diseased state.
Measure of risk in exposed population .Measure of risk in exposed population .
Denominator = number of people who are at risk for developing the Denominator = number of people who are at risk for developing the
disease (estimated mid year population )disease (estimated mid year population )
Any individual in the denominator, may (must have) to become Any individual in the denominator, may (must have) to become
counted in the numerator. (numerator included in the denominator).counted in the numerator. (numerator included in the denominator).
Incidence for uterine cancer, the denominator must be women. Mean, Incidence for uterine cancer, the denominator must be women. Mean,
men not at risk to develop uterine cancer.men not at risk to develop uterine cancer.
Period of time must known, must specified for all individuals in the Period of time must known, must specified for all individuals in the
denominator. Incidence may be calculated in one week, one month, denominator. Incidence may be calculated in one week, one month,
one year, 5 years.one year, 5 years.

88
Pupulation at risk in a study of cervix carcinomaPupulation at risk in a study of cervix carcinoma
Defining pop. At risk:Defining pop. At risk:1.1. Improve accuracy ( rate not diluted .Improve accuracy ( rate not diluted .2.2. People who cannot contract the dis. are not included in the denominator.People who cannot contract the dis. are not included in the denominator.3.3. Ex. Ex.
– Occupational injuries occur among working people .Occupational injuries occur among working people .– Brucellosis occur among people handling infected animals .Brucellosis occur among people handling infected animals .
(farms + slaughter houses (farms + slaughter houses
All WOMEN
All
MEN
0-25 Y.
25 -69 Y.
70 + Y.
25 -69 Y.
Total Population Population
At risk
All Women (Age groups

99
Cumulative Incidence :Cumulative Incidence :
ExampleExample : 482 women using oral contraceptive, followed for 3 years . : 482 women using oral contraceptive, followed for 3 years .
27 of them developed Bacterurea.27 of them developed Bacterurea.
C.I of Bacterurea among O.C users =C.I of Bacterurea among O.C users =
( Assume all persons have been followed during the 3 years period )( Assume all persons have been followed during the 3 years period )
Incidence Density : Incidence Density :
– Due to loss of follow up (attrition ) for any reason, different individual in the Due to loss of follow up (attrition ) for any reason, different individual in the
denominator, may be observed for different length of time, person- years used in denominator, may be observed for different length of time, person- years used in
the denominator.the denominator.
– (Unequal Periods of observation )(Unequal Periods of observation )
– Valid under these conditions: Valid under these conditions:
1.1. Risk of disease or death is constant . Throught the study period.Risk of disease or death is constant . Throught the study period.
2.2. Rate of disease or death the same between those lost to follow up and those not.Rate of disease or death the same between those lost to follow up and those not.
3.3. Disease under study must be not rapidly fatal.Disease under study must be not rapidly fatal.
2727X 3 years = 5.6X 3 years = 5.6 person- years during three years. person- years during three years.
482482

1010
Example: 1000 persons followed , (some leave, some Example: 1000 persons followed , (some leave, some dropout some die, some migrate… )end by 800 dropout some die, some migrate… )end by 800
1.1. 2 2
2.2. 33
3.3. 55
4.4. 44
5.5. 2.52.5
Example:
Jan. JulyJan. July
9090
Jan. JulyJan. July
9191
Jan. JulyJan. July
9292
Jan. JulyJan. July
9393
Jan. JulyJan. July
9494
Years followedYears followed
Total years at risk 16.5
ID = 2 cases / 16.5 person years
= 12.1 / 100 person – years observation
( Incidence Density )
1111
Attack RatsAttack Rats
It is incidence rate.It is incidence rate.
Usually expressed as percentage Usually expressed as percentage
Used for particular population .Used for particular population .
Observed for limited period of time.Observed for limited period of time.
Used mostly in outbreaks/ epidemics.Used mostly in outbreaks/ epidemics.

1212
Secondary attack rateSecondary attack rate
Used in propagated spread .Used in propagated spread .Number of new cases in group minus Number of new cases in group minus
initial case (s). initial case (s).
= = ____________________________________________________________________________ x 100 x 100Number of susceptible persons in Number of susceptible persons in
group minus initial case (s) group minus initial case (s)
During a specified time period .During a specified time period .Index case (s) excluded from both numerator and Index case (s) excluded from both numerator and denominator . denominator .

1313
Specification of NumeratorSpecification of Numerator(Number of persons + Number of conditions) (Number of persons + Number of conditions)
More than one event can occur to the same person More than one event can occur to the same person within stated time period .within stated time period .This incidence rate tells us the number of events (colds) This incidence rate tells us the number of events (colds) to be expected among the group of people in that year .to be expected among the group of people in that year .Incidence rate = Incidence rate = Number of coldsNumber of colds PARPAR
In one year period .In one year period .
= = Number of people who developed a coldNumber of people who developed a cold PARPAR
In one year period.In one year period.This incidence rate tells us about the probability that any This incidence rate tells us about the probability that any person will develop a cold in one year.person will develop a cold in one year.
1414
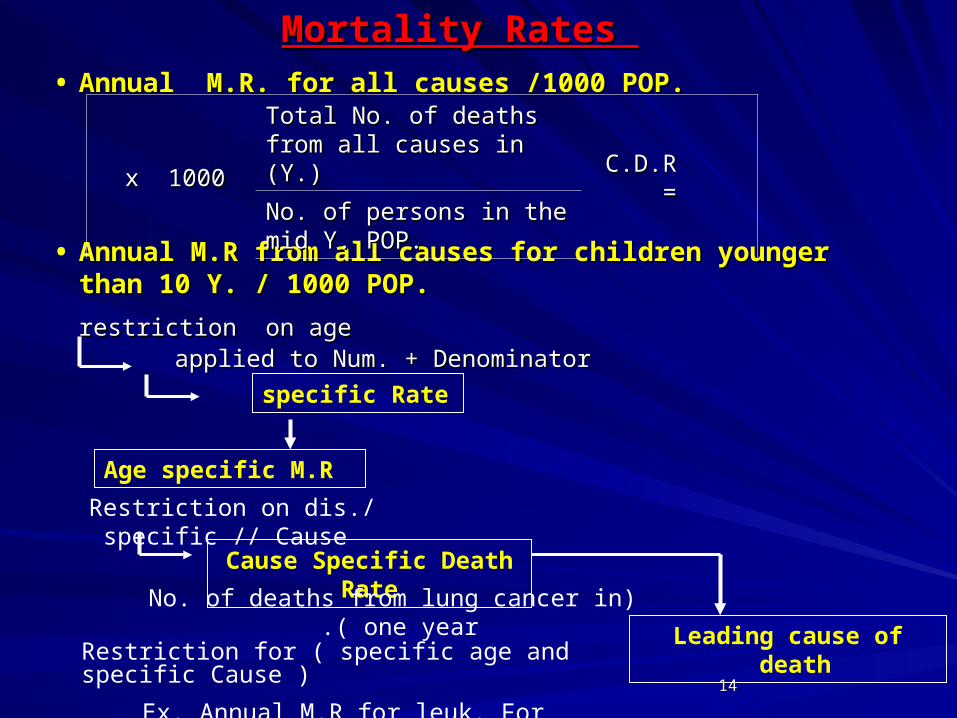
Mortality Rates Mortality Rates • Annual M.R. for all causes /1000 POP.Annual M.R. for all causes /1000 POP.
• Annual M.R from all causes for children younger than 10 Y. / Annual M.R from all causes for children younger than 10 Y. / 1000 POP. 1000 POP.
restriction on age restriction on age applied to Num. + Denominatorapplied to Num. + Denominator
C.D.R =C.D.R =
Total No. of deaths from all Total No. of deaths from all causes in (Y.)causes in (Y.)
x 1000x 1000No. of persons in the mid Y. No. of persons in the mid Y. POP.POP.
Age specific M.R
Restriction on dis./ specific // Cause
Cause Specific Death Rate
) No. of deaths from lung cancer in one year.(
Leading cause of death
specific Rate
Restriction for ( specific age and specific Cause )
Ex. Annual M.R for leuk. For children < 10 Y.
1515
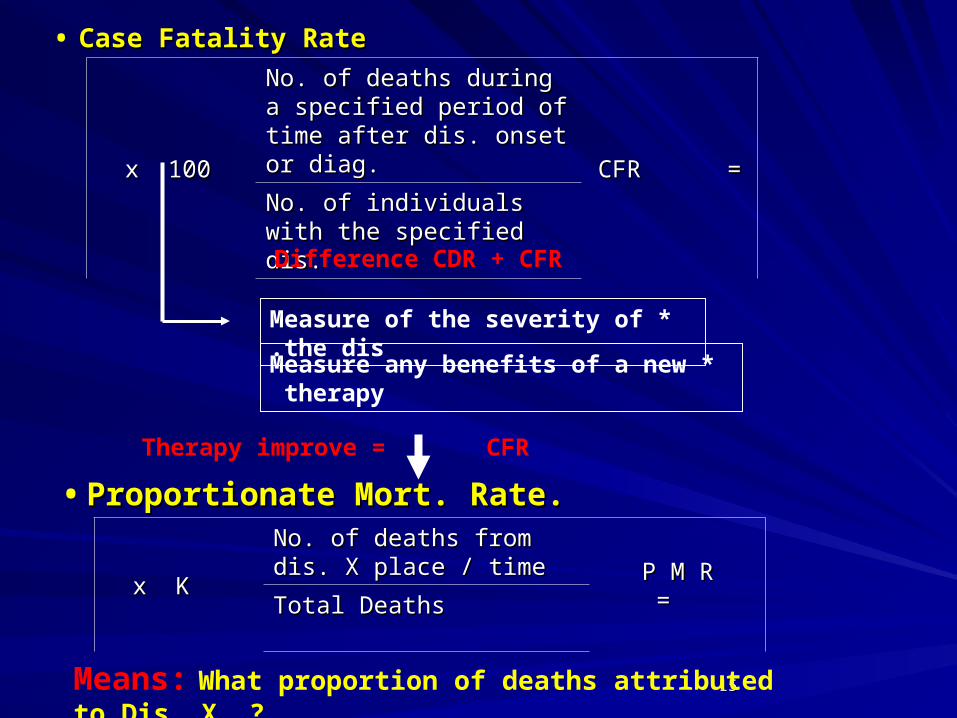
• Case Fatality RateCase Fatality Rate
CFR =CFR =
No. of deaths during a No. of deaths during a specified period of time after specified period of time after dis. onset or diag.dis. onset or diag. x 100x 100
No. of individuals with the No. of individuals with the specified dis. specified dis.
Difference CDR + CFR
*Measure of the severity of the dis.
*Measure any benefits of a new therapy
Therapy improve = CFR
• Proportionate Mort. Rate. Proportionate Mort. Rate.
P M R =P M R =
No. of deaths from dis. X No. of deaths from dis. X place / time place / time x Kx KTotal Deaths Total Deaths
Means: What proportion of deaths attributed to Dis. X. ?
1616
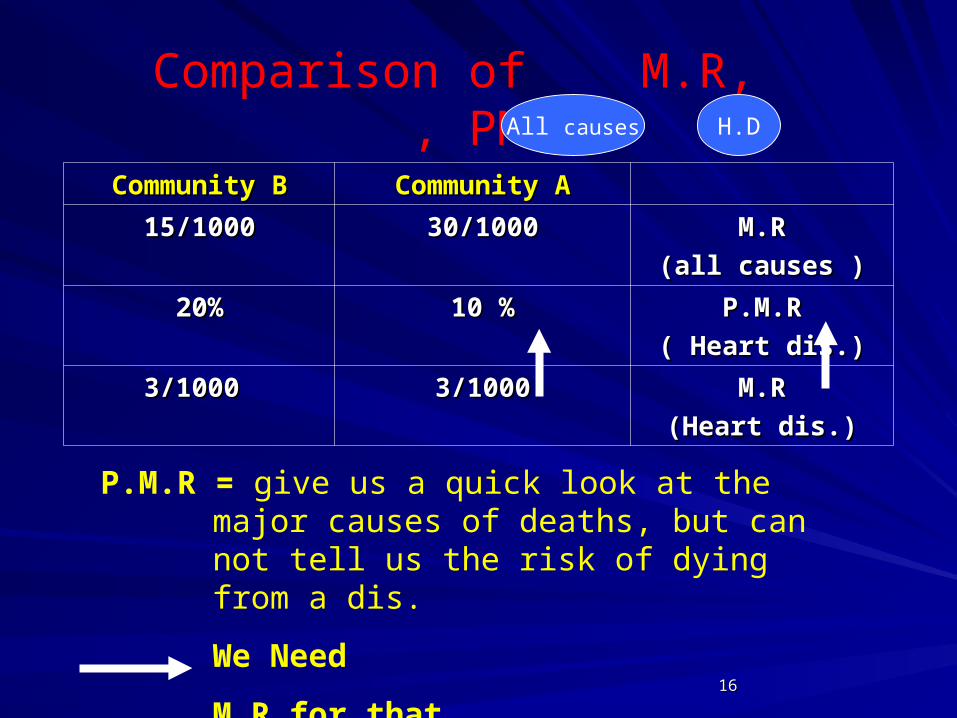
Comparison of M.R, PMR,
All causes H.D
Community ACommunity ACommunity BCommunity B
M.RM.R
(all causes )(all causes )
30/100030/100015/100015/1000
P.M.RP.M.R
( Heart dis.)( Heart dis.)
10 %10 %20%20%
M.RM.R
(Heart dis.)(Heart dis.)
3/10003/10003/1000 3/1000
P.M.R = give us a quick look at the major causes of deaths, but can not tell us the risk of dying from a dis.
We Need
M R for that .

1717
Years of Potential Life LostYears of Potential Life LostYPLLYPLL
In younger age In younger age Injuries, accidents, cancer…Injuries, accidents, cancer…
HIV Younger
Involves a greater loss of future productive years than were it to occur at an older age.
Cause specific M.R 10th
YPLL 6th
1818
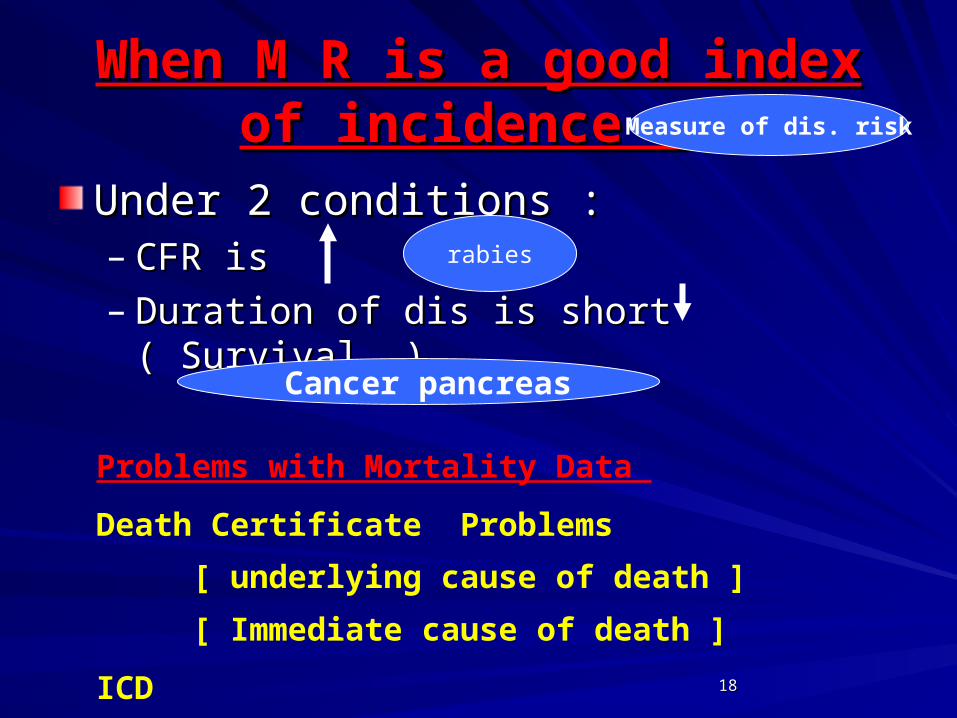
When M R is a good index of When M R is a good index of incidence ?incidence ?
Under 2 conditions :Under 2 conditions :– CFR is CFR is – Duration of dis is short ( Survival )Duration of dis is short ( Survival )
Measure of dis. risk
rabies
Cancer pancreas
Problems with Mortality Data
Death Certificate Problems
[ underlying cause of death ]
[ Immediate cause of death ]
ICD
1919
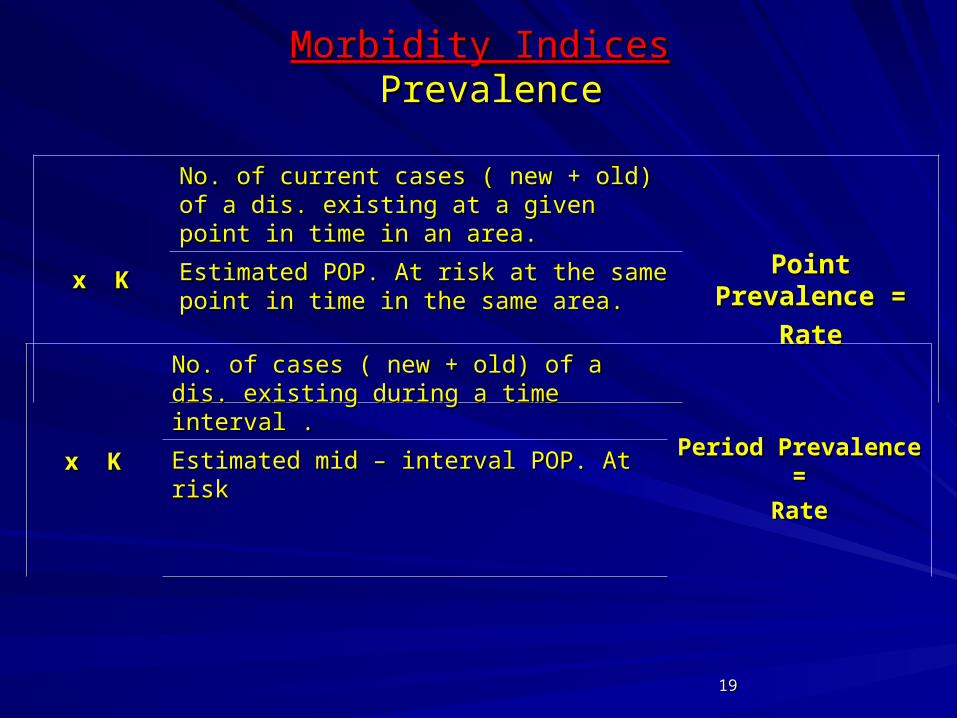
Morbidity IndicesMorbidity Indices PrevalencePrevalence
Point Prevalence Point Prevalence ==
RateRate
No. of current cases ( new + old) of a dis. No. of current cases ( new + old) of a dis. existing at a given point in time in an area. existing at a given point in time in an area.
x Kx KEstimated POP. At risk at the same point in Estimated POP. At risk at the same point in time in the same area.time in the same area.
Period Prevalence =Period Prevalence =
RateRate
No. of cases ( new + old) of a dis. existing No. of cases ( new + old) of a dis. existing during a time interval .during a time interval .
x Kx K Estimated mid – interval POP. At risk Estimated mid – interval POP. At risk
2020
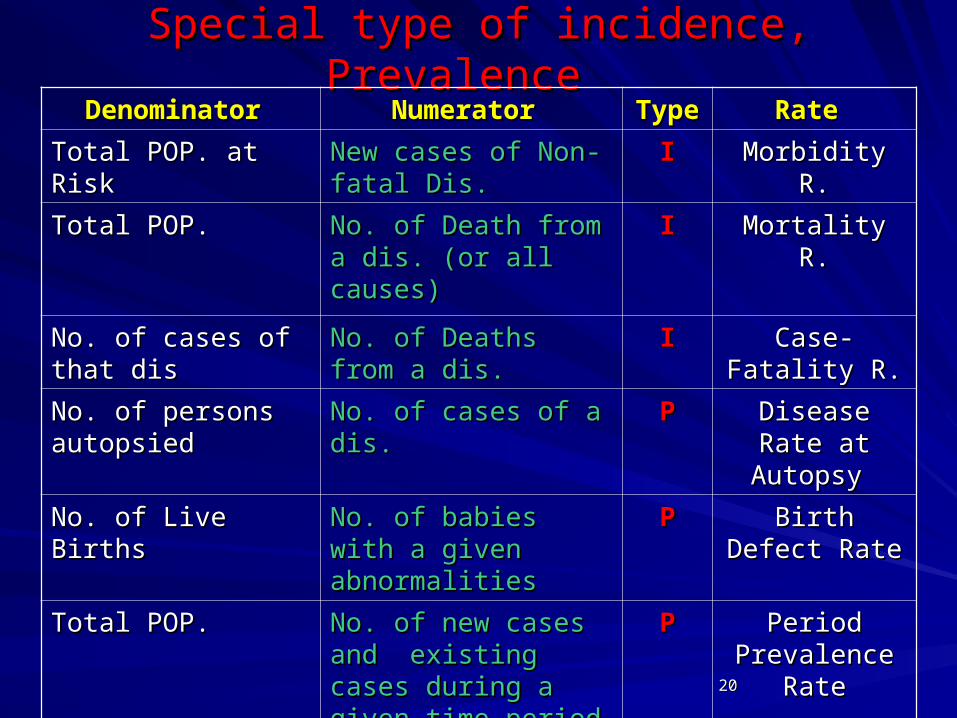
Special type of incidence, Prevalence Special type of incidence, Prevalence Rate Rate TypeTypeNumerator Numerator Denominator Denominator
Morbidity R.Morbidity R.IINew cases of Non- fatal New cases of Non- fatal Dis.Dis.
Total POP. at RiskTotal POP. at Risk
Mortality R.Mortality R.IINo. of Death from a dis. No. of Death from a dis. (or all causes)(or all causes)
Total POP.Total POP.
Case- Fatality R.Case- Fatality R.IINo. of Deaths from a dis.No. of Deaths from a dis.No. of cases of that disNo. of cases of that dis
Disease Rate at Disease Rate at Autopsy Autopsy
PPNo. of cases of a dis.No. of cases of a dis.No. of persons No. of persons autopsiedautopsied
Birth Defect Birth Defect RateRate
PPNo. of babies with a given No. of babies with a given abnormalities abnormalities
No. of Live BirthsNo. of Live Births
Period Period Prevalence RatePrevalence Rate
PPNo. of new cases and No. of new cases and existing cases during a existing cases during a given time period given time period
Total POP.Total POP.
Attack RateAttack RateIINo. of cases of dis.No. of cases of dis.Total POP. at Total POP. at
Risk for a limited Risk for a limited period of observation period of observation

2121
Ex. Breast Cancer I.R. in Women by age Ex. Breast Cancer I.R. in Women by age
Distinction betweenDistinction between – Distribution of dis.Distribution of dis.– Proportion of cases Proportion of cases – I.R (risk of the dis.).I.R (risk of the dis.).
0
100
200
300
400
35 25 30 35 40 45 50 55 60 65 70 75 80 85
An
nu
al R
ate
/
100,0
00
percentof totalcases
Age
2222
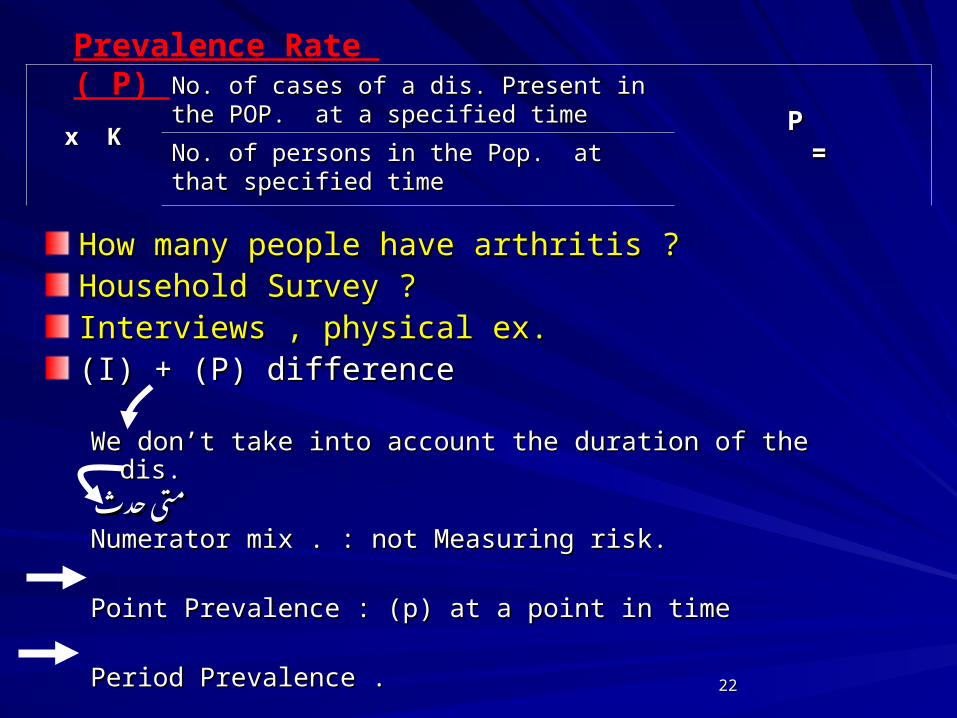
Prevalence Rate ( P)
P =P =
No. of cases of a dis. Present in the POP. at No. of cases of a dis. Present in the POP. at a specified time a specified time
x Kx KNo. of persons in the Pop. at that specified No. of persons in the Pop. at that specified time time
How many people have arthritis ?How many people have arthritis ?Household Survey ?Household Survey ?Interviews , physical ex. Interviews , physical ex. ((II) + (P) difference ) + (P) difference
We don’t take into account the duration of the dis.We don’t take into account the duration of the dis.حدث حدث متى متىNumerator mix . : not Measuring risk.Numerator mix . : not Measuring risk.
Point Prevalence : (p) at a point in time Point Prevalence : (p) at a point in time
Period Prevalence .Period Prevalence .

2323
Ex. Ex. QuestionsQuestions regarding regarding asthmaasthma
Do you currently have asthma. ?Do you currently have asthma. ?Point Prevalence .Point Prevalence .
Have you had asthma during the last (n) years?Have you had asthma during the last (n) years?Period Prevalence .Period Prevalence .
Have you ever had asthma. ?Have you ever had asthma. ?باألزمة اصبت باألزمة عمرك اصبت عمرك
Cumulative IncidenceCumulative Incidence
2424
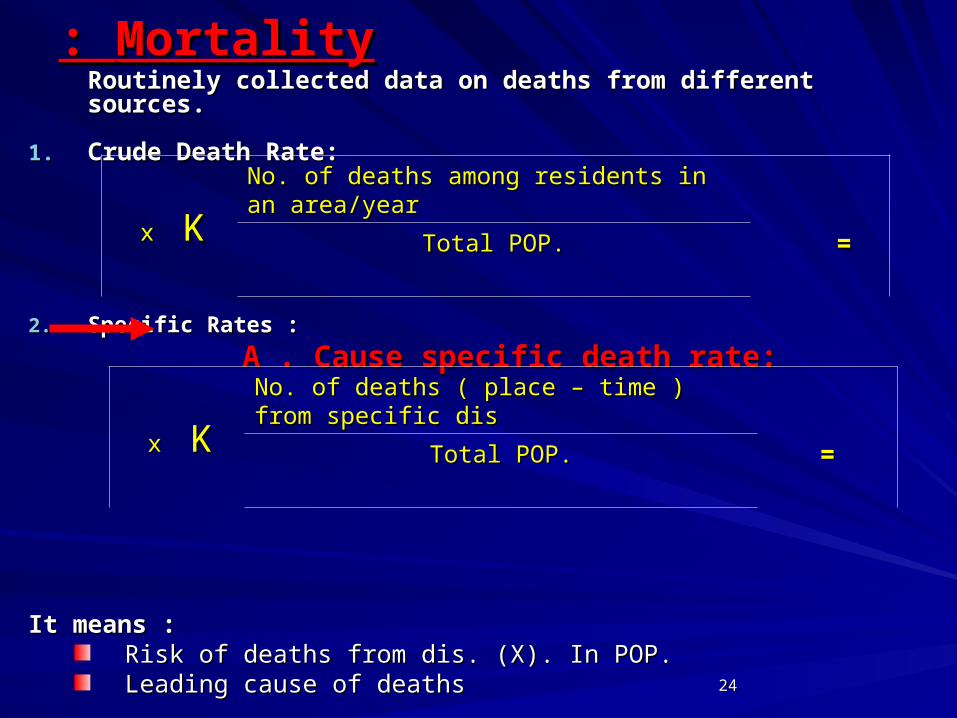
MortalityMortality: : Routinely collected data on deaths from different Routinely collected data on deaths from different
sources.sources.
1.1. Crude Death Rate:Crude Death Rate:
2.2. Specific Rates :Specific Rates :
A . Cause specific death rate:A . Cause specific death rate:
It means :It means :Risk of deaths from dis. (X). In POP.Risk of deaths from dis. (X). In POP.Leading cause of deaths Leading cause of deaths
==No. of deaths among residents in an area/year No. of deaths among residents in an area/year
x x KK Total POP.Total POP.
==No. of deaths ( place – time ) from specific disNo. of deaths ( place – time ) from specific dis
x x KKTotal POP.Total POP.
2525
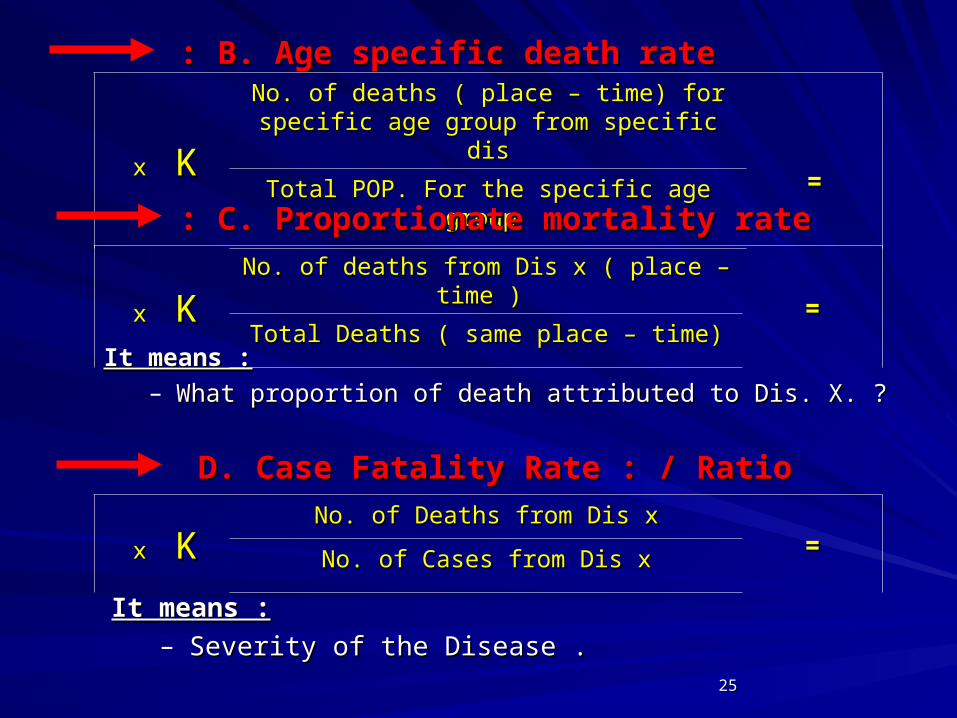
B. Age specific death rateB. Age specific death rate: :
==
No. of deaths ( place – time) for specific age No. of deaths ( place – time) for specific age group from specific disgroup from specific dis
x x KK Total POP. For the specific age group Total POP. For the specific age group
C. Proportionate mortality rateC. Proportionate mortality rate: :
==No. of deaths from Dis x ( place – time ) No. of deaths from Dis x ( place – time )
x x KK Total Deaths ( same place – time)Total Deaths ( same place – time)
It means :It means :– What proportion of death attributed to Dis. X. ?What proportion of death attributed to Dis. X. ?
D. Case Fatality Rate : / RatioD. Case Fatality Rate : / Ratio
==No. of Deaths from Dis xNo. of Deaths from Dis x
x x KK No. of Cases from Dis xNo. of Cases from Dis x
It means :It means :– Severity of the Disease .Severity of the Disease .

2626
Factors influencing observe
Prevalence Rate
Increased Increased Longer duration of dis.Longer duration of dis.Prolongation of life of patients Prolongation of life of patients without cure .without cure .
In new cases ( incidence )In new cases ( incidence )In – migration of cases.In – migration of cases.Out –migration of healthy Out –migration of healthy people .people .In – migration of susceptible In – migration of susceptible people.people.Improved diagnostic facilities ( Improved diagnostic facilities ( better reporting )better reporting )
Decreased by Decreased by
Shorter duration of dis.Shorter duration of dis.
Case – fatality rate from dis.Case – fatality rate from dis.
In new cases ( incidence )In new cases ( incidence )
In – migration of healthy In – migration of healthy people people
Out – migration of cases Out – migration of cases
Improved cure rate of cases Improved cure rate of cases
2727
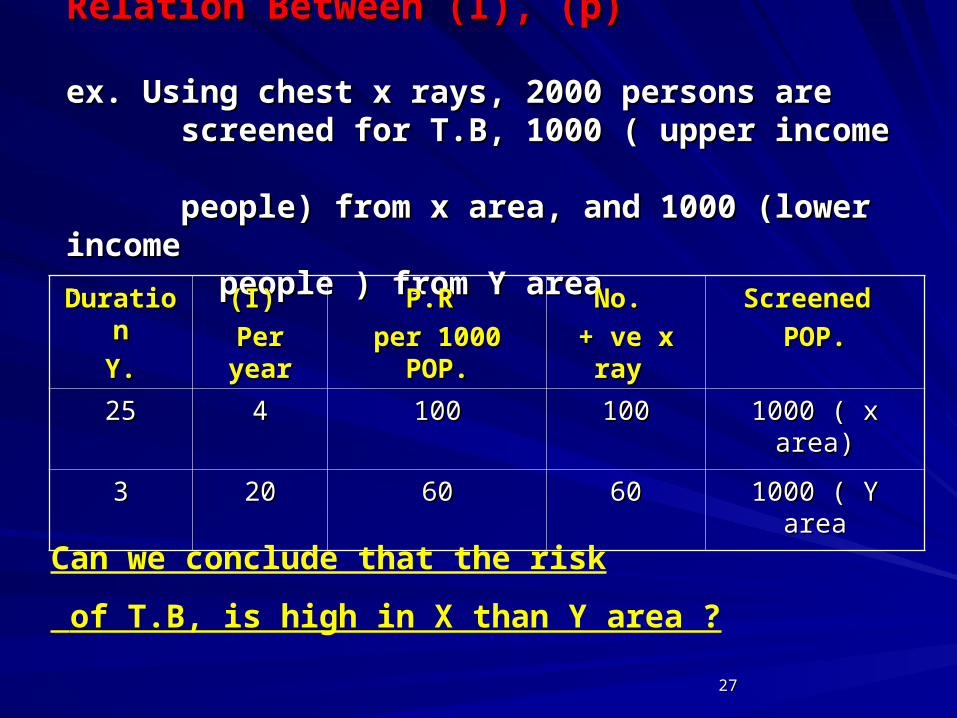
Relation Between (I), (p)Relation Between (I), (p)
ex. Using chest x rays, 2000 persons are ex. Using chest x rays, 2000 persons are screened for T.B, 1000 ( upper income screened for T.B, 1000 ( upper income people) from x area, and 1000 (lower income people) from x area, and 1000 (lower income
people ) from Y area people ) from Y area. .
Screened Screened
POP.POP.
No. No.
+ ve x ray + ve x ray
P.R P.R
per 1000 POP.per 1000 POP.
(I) (I)
Per yearPer year
DurationDuration
Y.Y.
1000 ( x area)1000 ( x area)100100100100442525
1000 ( Y area1000 ( Y area60606060202033
Can we conclude that the risk
of T.B, is high in X than Y area ?

2828
Descriptive EpidemiologyDescriptive Epidemiology
Study the distribution of disease within a Study the distribution of disease within a population by population by personperson, , placeplace, and , and timetime..
Identify non-random variations in the distribution Identify non-random variations in the distribution of disease to enable an investigator to generate of disease to enable an investigator to generate testable hypotheses regarding etiology.testable hypotheses regarding etiology.
- Who is getting the disease?- Who is getting the disease?
- Where are the rats of disease highest and - Where are the rats of disease highest and lowest?lowest?
- When does disease occur commonly or rarely?- When does disease occur commonly or rarely?

2929
Descriptive EpidemiologyDescriptive EpidemiologyDescribe patterns of disease: (or) distribution of dis. within a Describe patterns of disease: (or) distribution of dis. within a population by person place time.population by person place time.
PersonPerson Who is getting the dis.? Who is getting the dis.?
Age, sex, Ethnic status, Age, sex, Ethnic status,
Religion, Marital status, occupation, social class, Religion, Marital status, occupation, social class, Education, … Education, … othersothers
PlacePlace where are the rates of dis. Highest and lowest? where are the rates of dis. Highest and lowest? Geographical Geographical distribution. distribution.
TimeTime when Does the dis. Occur commonly or rarely? when Does the dis. Occur commonly or rarely?
3030
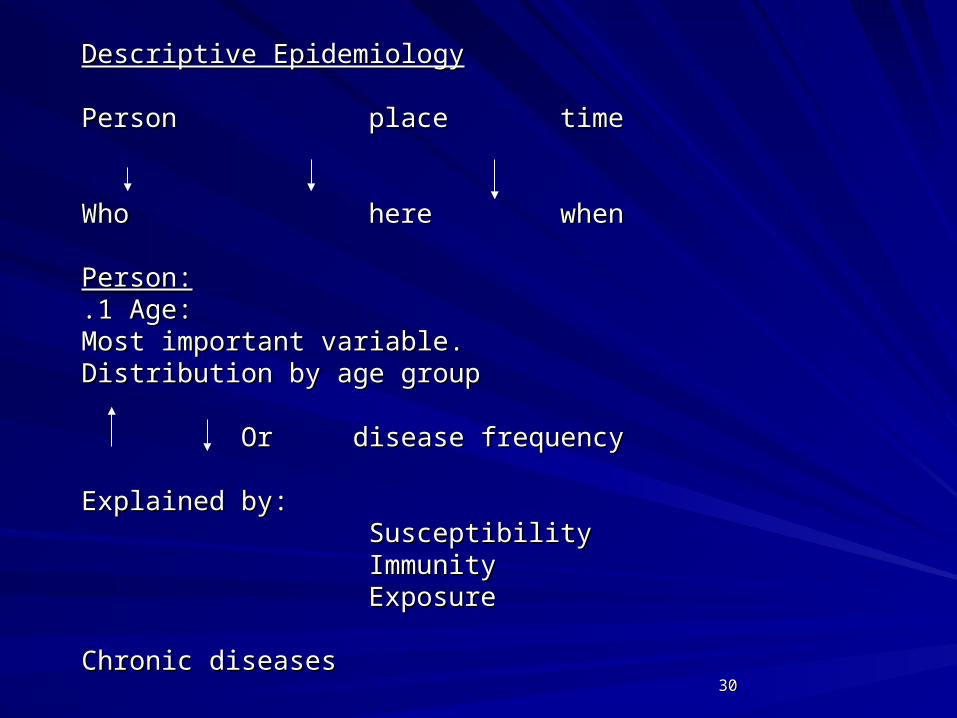
Descriptive EpidemiologyDescriptive Epidemiology
PersonPerson placeplace timetime
Who Who herehere whenwhen
Person:Person:.1 Age:.1 Age:Most important variable.Most important variable.Distribution by age groupDistribution by age group Or disease frequency Or disease frequency Explained by:Explained by:
SusceptibilitySusceptibilityImmunityImmunityExposure Exposure
Chronic diseasesChronic diseases
3131
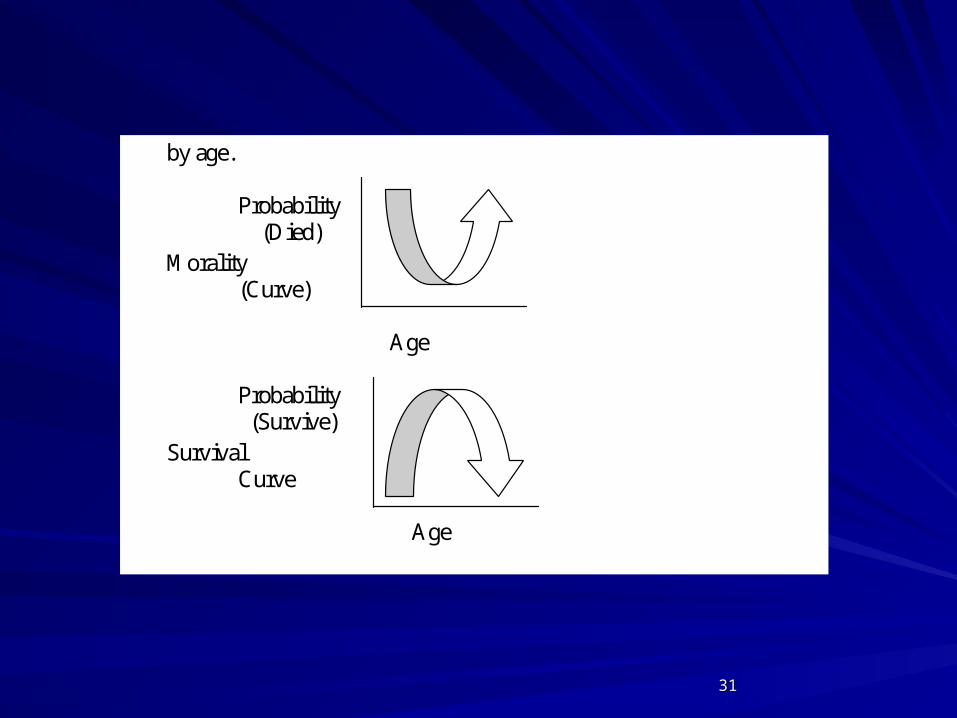
- by age. Probability (Died)
- Morality (Curve)
Age
Probability (Survive)
- Survival Curve
Age

3232
-Some dis. Occur exclusively in one -Some dis. Occur exclusively in one particular age group.particular age group.Ex. Ca.Prostate, chronic conditions Ex. Ca.Prostate, chronic conditions by age.by age.Ex.Aarthritis is, 10 times more Ex.Aarthritis is, 10 times more common in 45 – 46 than < 45 years.common in 45 – 46 than < 45 years.Ex.Dental problems by age.Ex.Dental problems by age.Ex.Skin wrinkling by age skin Ex.Skin wrinkling by age skin elasticityelasticity
3333
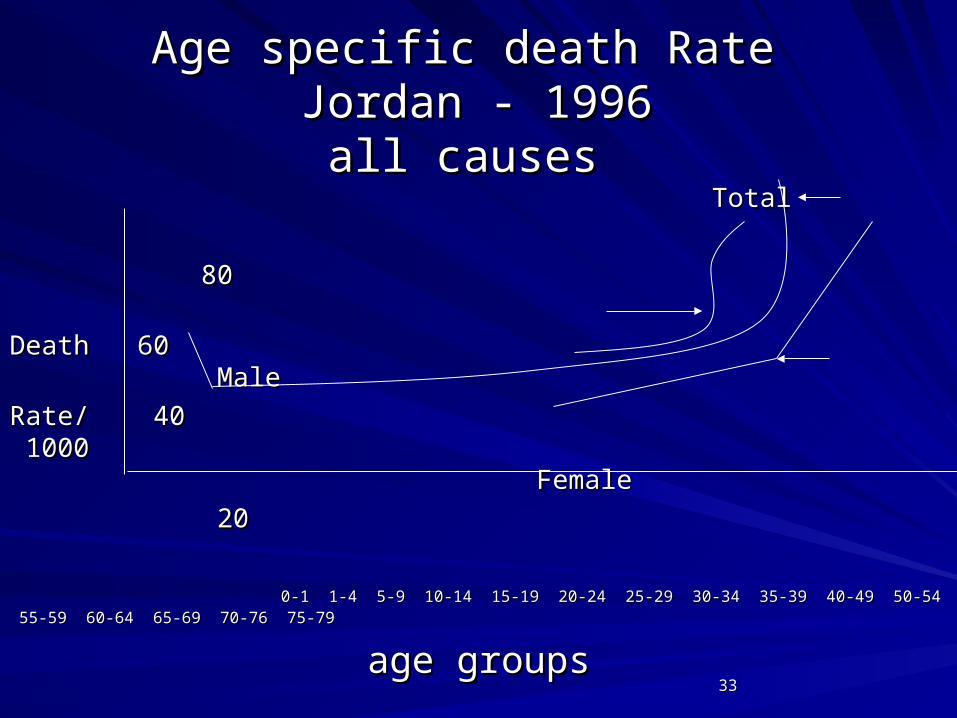
Age specific death RateAge specific death Rate Jordan - 1996 Jordan - 1996
all causesall causes TotalTotal
8080
Death 60Death 60 Male Male
Rate/ 40Rate/ 40 1000 1000 Female Female
2020
0-1 1-4 5-9 10-14 15-19 20-24 25-29 30-34 35-39 40-49 50-54 55-59 60-64 65-69 70-76 75-790-1 1-4 5-9 10-14 15-19 20-24 25-29 30-34 35-39 40-49 50-54 55-59 60-64 65-69 70-76 75-79
age groupsage groups
3434
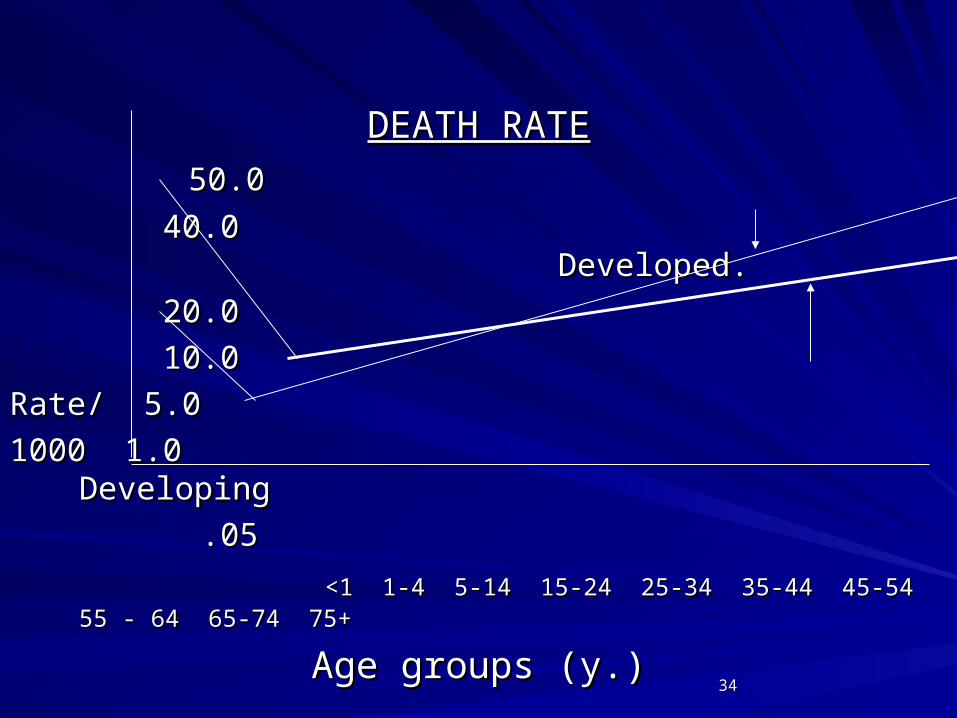
DEATH RATEDEATH RATE
50.050.0
40.040.0 Developed. Developed.
20.020.0
10.010.0
Rate/ 5.0Rate/ 5.0
1000 1.01000 1.0 Developing Developing
.05.05
<1 1-4 5-14 15-24 25-34 35-44 45-54 55 - 64 65-74 75+<1 1-4 5-14 15-24 25-34 35-44 45-54 55 - 64 65-74 75+
Age groups (y.)Age groups (y.)
3535
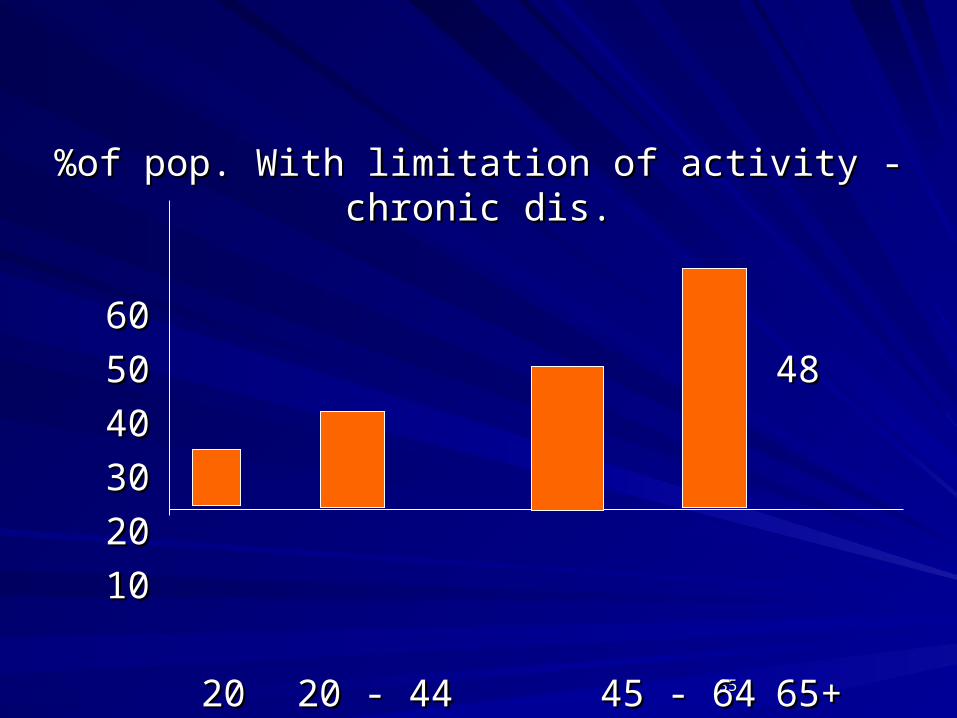
%of pop. With limitation of activity - chronic dis.%of pop. With limitation of activity - chronic dis.
6060
5050 4848
4040
3030
2020
1010
2020 20 - 4420 - 44 45 - 64 45 - 64 65+65+
Age Groups (y.)Age Groups (y.)

3636
22 . .GenderGender::
Death Rates higher for Males than Death Rates higher for Males than Females.Females.Sex Linked inheritance.Sex Linked inheritance.Difference in hormonal balance.Difference in hormonal balance.Environmental … Occupation.Environmental … Occupation.
… … exposure.exposure.… … habit patterns.habit patterns.
HereditaryHereditary
3737
High Morbidity + Low mortality in F.High Morbidity + Low mortality in F.
May be due to:May be due to:- F. seek medical care more freely and at F. seek medical care more freely and at
early stage of dis.early stage of dis.- Dis.Dis. Tend to have less lethal course in Tend to have less lethal course in
F.than M.F.than M.- Expectation of life more in F. than M.Expectation of life more in F. than M.
3838
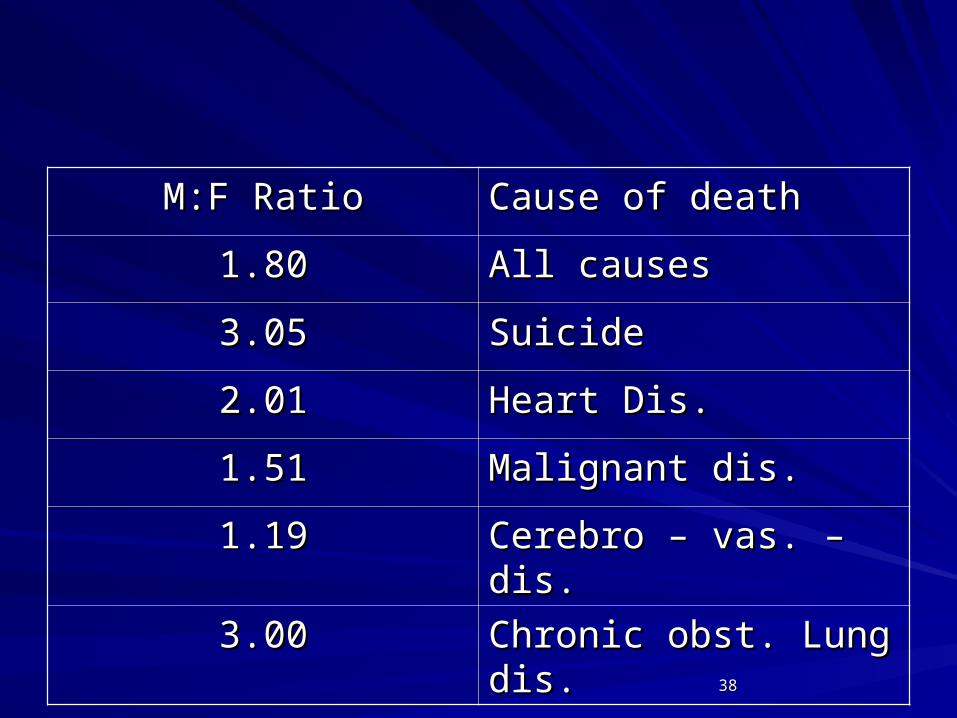
Cause of deathCause of deathM:F RatioM:F Ratio
All causesAll causes1.801.80
SuicideSuicide3.053.05
Heart Dis.Heart Dis.2.012.01
Malignant dis.Malignant dis.1.511.51
Cerebro – vas. – dis.Cerebro – vas. – dis.1.191.19
Chronic obst. Lung dis.Chronic obst. Lung dis.3.003.00
3939
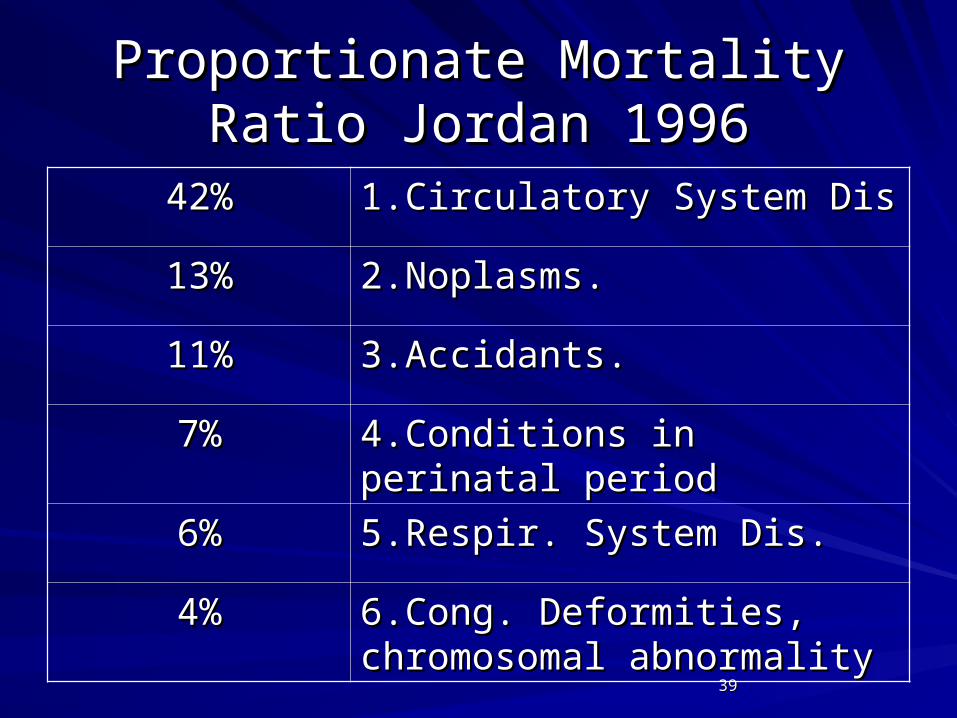
Proportionate Mortality Ratio Proportionate Mortality Ratio Jordan 1996Jordan 1996
1.Circulatory System Dis1.Circulatory System Dis42%42%
2.Noplasms.2.Noplasms.13%13%
3.Accidants.3.Accidants.11%11%
4.Conditions in perinatal period4.Conditions in perinatal period7%7%
5.Respir. System Dis.5.Respir. System Dis.6%6%
6.Cong. Deformities, 6.Cong. Deformities, chromosomal abnormalitychromosomal abnormality
4%4%
4040
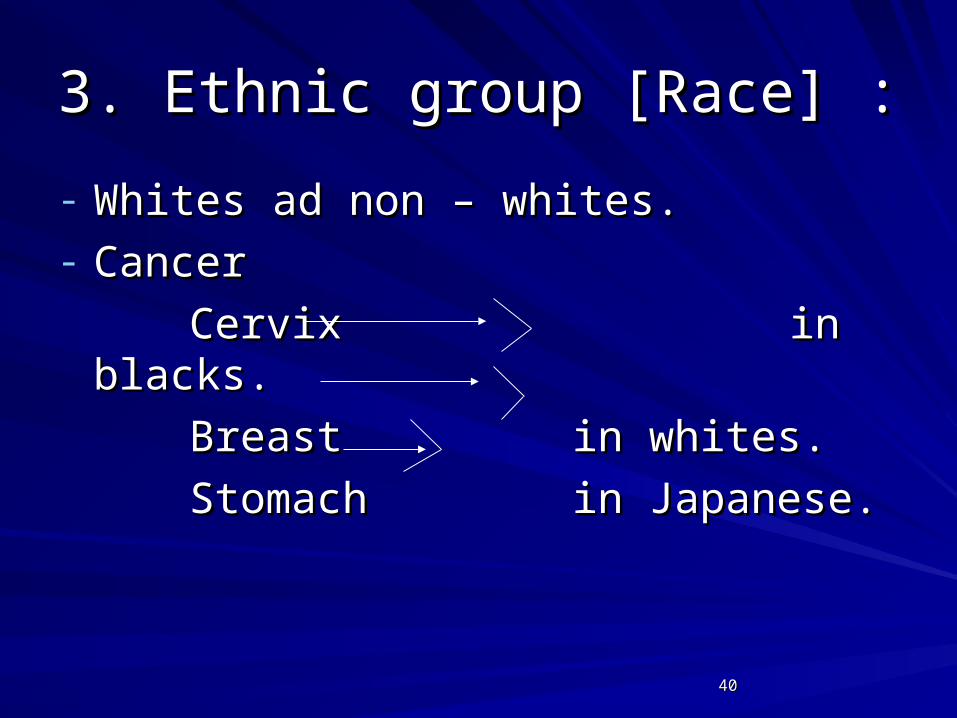
3. Ethnic group [Race] :3. Ethnic group [Race] :
- Whites ad non – whites.Whites ad non – whites.- CancerCancer
Cervix Cervix in blacks. in blacks.
BreastBreast in whites.in whites.
Stomach Stomach in Japanese.in Japanese.
4141
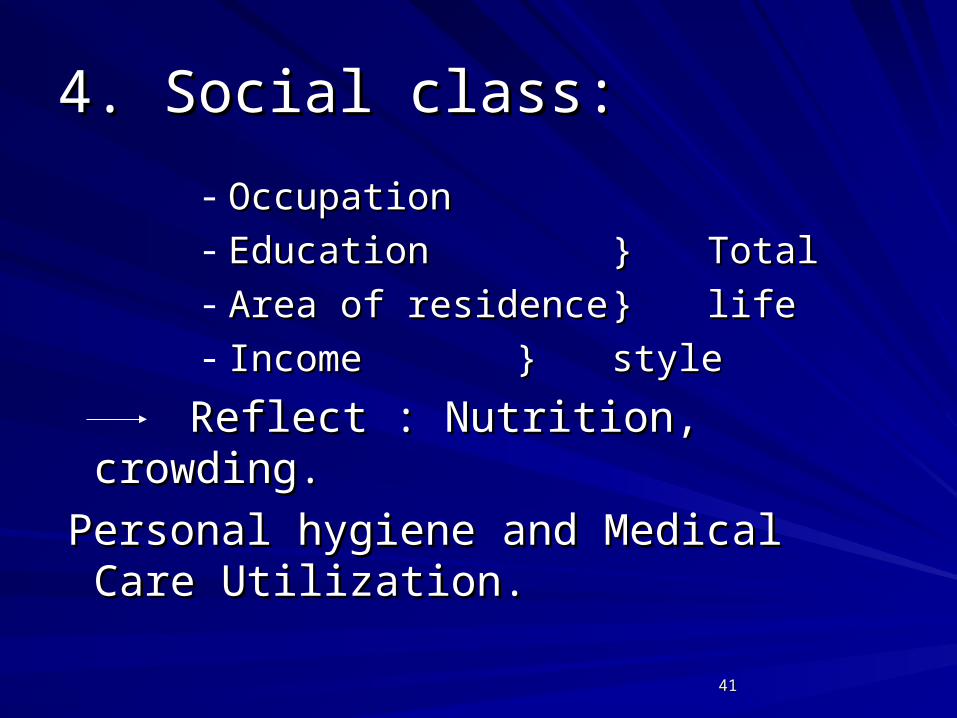
4. Social class:4. Social class:
- OccupationOccupation- EducationEducation }} TotalTotal- Area of residenceArea of residence }} lifelife- IncomeIncome }} stylestyle
Reflect : Nutrition, crowding.Reflect : Nutrition, crowding.
Personal hygiene and Medical Care Personal hygiene and Medical Care Utilization.Utilization.
4242
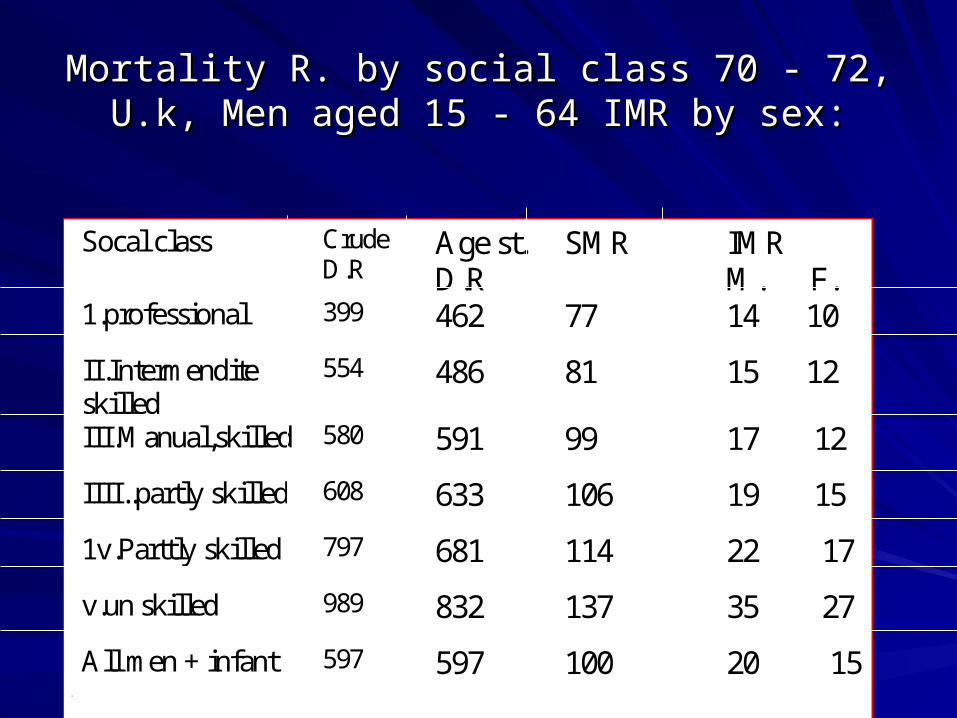
Mortality R. by social class 70 - 72, U.k, Men aged Mortality R. by social class 70 - 72, U.k, Men aged 15 - 64 IMR by sex:15 - 64 IMR by sex:
Socal class CrudeD.R
Age st.D.R
SMR IMRM. F.
1.professional 399 462 77 14 10
II.Intermenditeskilled
554 486 81 15 12
III.Manual,skilled 580 591 99 17 12
IIII..partly skilled 608 633 106 19 15
1v.Parttly skilled 797 681 114 22 17
v.un skilled 989 832 137 35 27
All men + infant 597 597 100 20 15597
4343
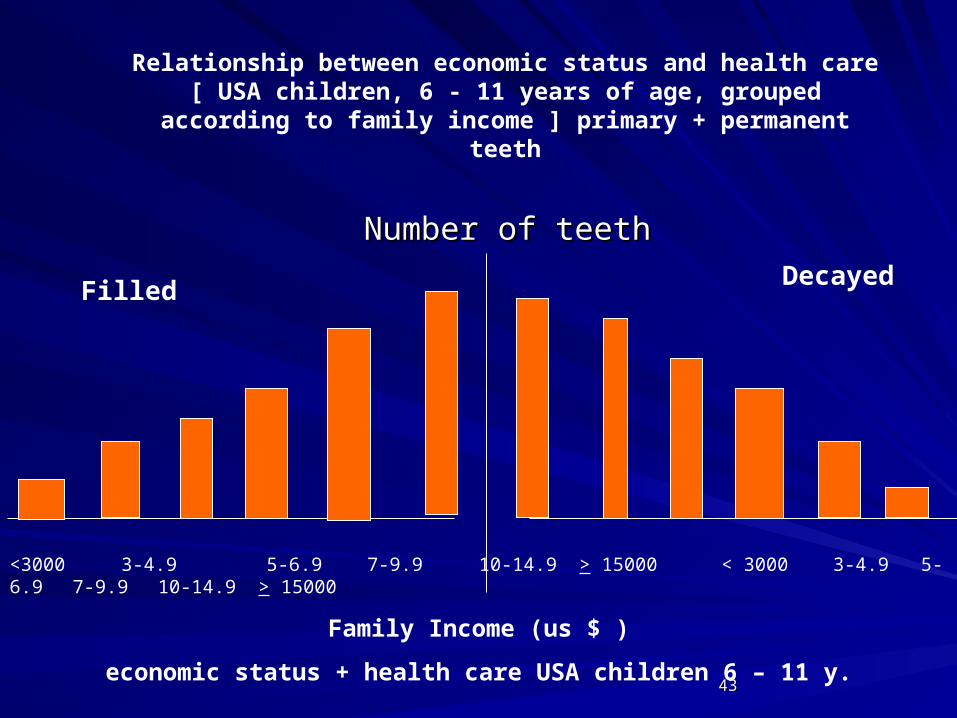
Number of teethNumber of teeth
Decayed
<3000 3-4.9 5-6.9 7-9.9 10-14.9 > 15000 < 3000 3-4.9 5-6.9 7-9.9 10-14.9 > 15000
Filled
Family Income (us $ )
economic status + health care USA children 6 – 11 y.
Relationship between economic status and health care[ USA children, 6 - 11 years of age, grouped according to family
income ] primary + permanent teeth
4444
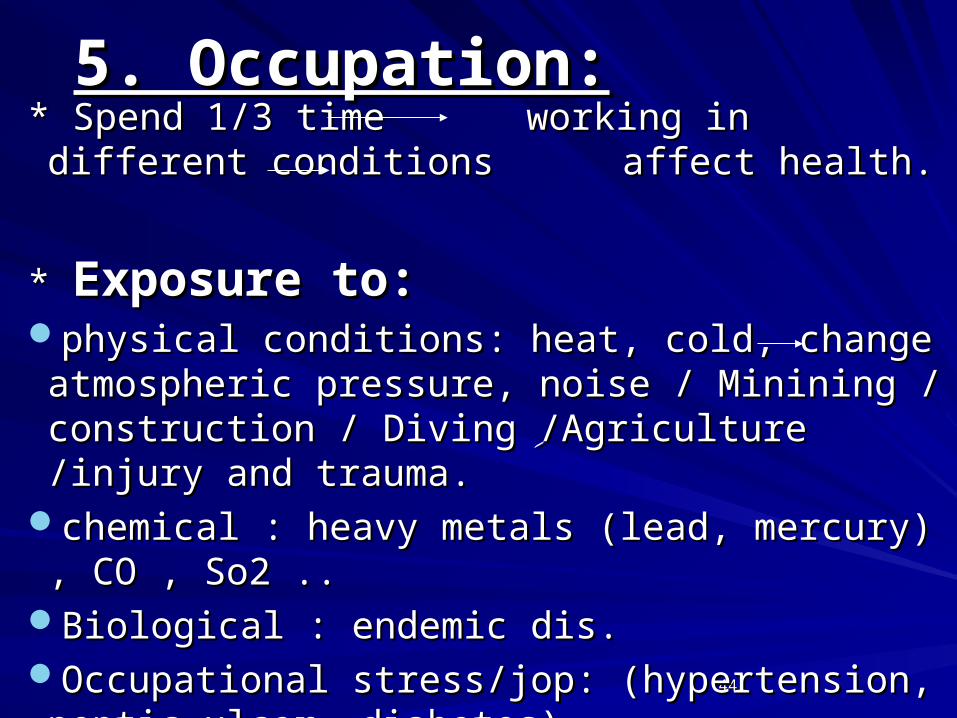
5. Occupation:5. Occupation:* Spend 1/3 time* Spend 1/3 time working in different conditionsworking in different conditions
affect health.affect health.
* * Exposure to:Exposure to:physical conditions: heat, cold, change atmospheric physical conditions: heat, cold, change atmospheric
pressure, noise / Minining / construction / Divingpressure, noise / Minining / construction / Diving ِِ/Agriculture /injury and trauma./Agriculture /injury and trauma.
chemical : heavy metals (lead, mercury) , CO , So2 ..chemical : heavy metals (lead, mercury) , CO , So2 ..Biological : endemic dis.Biological : endemic dis.Occupational stress/jop: (hypertension, peptic ulcer, Occupational stress/jop: (hypertension, peptic ulcer,
diabetes).diabetes).

4545
Exposure toExposure to::
SilicaSilica Pul. FibrosisPul. Fibrosis
AsbestosAsbestos mesothelioma, ca. Lungmesothelioma, ca. Lung
Aniline dyesAniline dyes bladder cancerbladder cancer
chromatechromate Lung cancerLung cancer

4646
6. Marital Status:6. Marital Status:for women (sexual exposure, pregnancy, for women (sexual exposure, pregnancy, childbearing, Lactation..)childbearing, Lactation..)
((SingleSingle, , marriedmarried, , divorceddivorced))
Cancer Cervix: > in married than single women.Cancer Cervix: > in married than single women.Cancer Breast: > in single than married women.Cancer Breast: > in single than married women.Cancer Breast: > in early age at first pregnancy.Cancer Breast: > in early age at first pregnancy.
(Protected by Lactation).(Protected by Lactation).

4747
77..Family VariableFamily Variable::
Family Size.Family Size.Birth order.Birth order.Present of both parents, or parent. Present of both parents, or parent. deprivation.deprivation.Maternal age.Maternal age.Religion of parents.Religion of parents.Position of index person.Position of index person.
4848
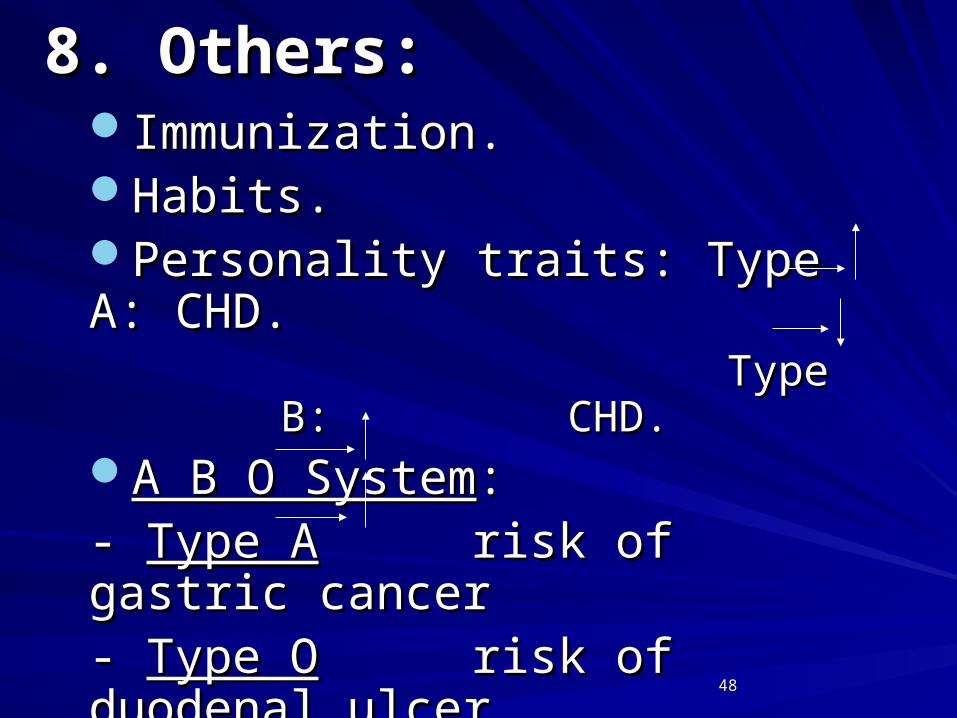
8. Others:8. Others:Immunization.Immunization.Habits.Habits.Personality traits: Type A: CHD. Personality traits: Type A: CHD.
Type B:Type B:CHD.CHD.
A B O SystemA B O System::- - Type AType A risk of gastric cancerrisk of gastric cancer- - Type OType O risk of duodenal ulcerrisk of duodenal ulcer- - Sickle cell traitSickle cell trait:: risk of malaria. risk of malaria. (plas. falciparum.)(plas. falciparum.)

4949
PLACEPLACE
Freq. of disFreq. of dis. can be related to place of . can be related to place of occurrence in terms of areas set off occurrence in terms of areas set off either by either by naturalnatural barriersbarriers as: as: mountains, rivers, deserts, and political mountains, rivers, deserts, and political boundaries.boundaries.
Or of certain dis. Due to Or of certain dis. Due to particular env., climate,….particular env., climate,….
Temp., humidity., rainfall, water supply Temp., humidity., rainfall, water supply … etc.… etc.

5050
- E.g. Tropical diseases.- E.g. Tropical diseases.- Endemic diseases.- Endemic diseases.- Certain fungal dis.- Certain fungal dis.- Endemic goiter in (iodine def. - Endemic goiter in (iodine def. areas). areas).- Mottled dental enamel … fluoride - Mottled dental enamel … fluoride content of drinking water. content of drinking water.- Melanoma of skin … sunlight.- Melanoma of skin … sunlight.- Burkitts lymphoma … endemic in - Burkitts lymphoma … endemic in equatorial Africa. equatorial Africa. (Epstein – Barr Virus.) (Epstein – Barr Virus.)

5151
Political subdivisionsPolitical subdivisions::Reflect: … water supply, air pollution, vector control, Reflect: … water supply, air pollution, vector control, medical care.medical care.
Mapping of Env. FactorsMapping of Env. Factors::
Water supply, milk routes, school buses, oven, Water supply, milk routes, school buses, oven, wind direction, wind direction, provide a clue about mode of spread.provide a clue about mode of spread.
Comparison:Comparison:InternationalInternationalRegional.Regional.:National:National Urban Rural bedwin Urban Rural bedwin differences reflect(habit) differences reflect(habit) and reflect and reflect (crowding, Social class)(crowding, Social class)

5252
....
Rural areas: disadvantages:Rural areas: disadvantages: - - Illiteracy.Illiteracy.- Lack of job opportunities.- Lack of job opportunities.- Malnutrition.- Malnutrition.- Diseases.- Diseases.- Shortage of medical facilities and medical - Shortage of medical facilities and medical personnel.personnel.- Hazards of agricultural work.- Hazards of agricultural work.- Exposure to pesticides- Exposure to pesticides
Urban areas: disadvantagesUrban areas: disadvantages- Urbanization problems - Urbanization problems - Modernization problems. … pollution … - Modernization problems. … pollution … homicide … .. etc.. homicide … .. etc..
5353
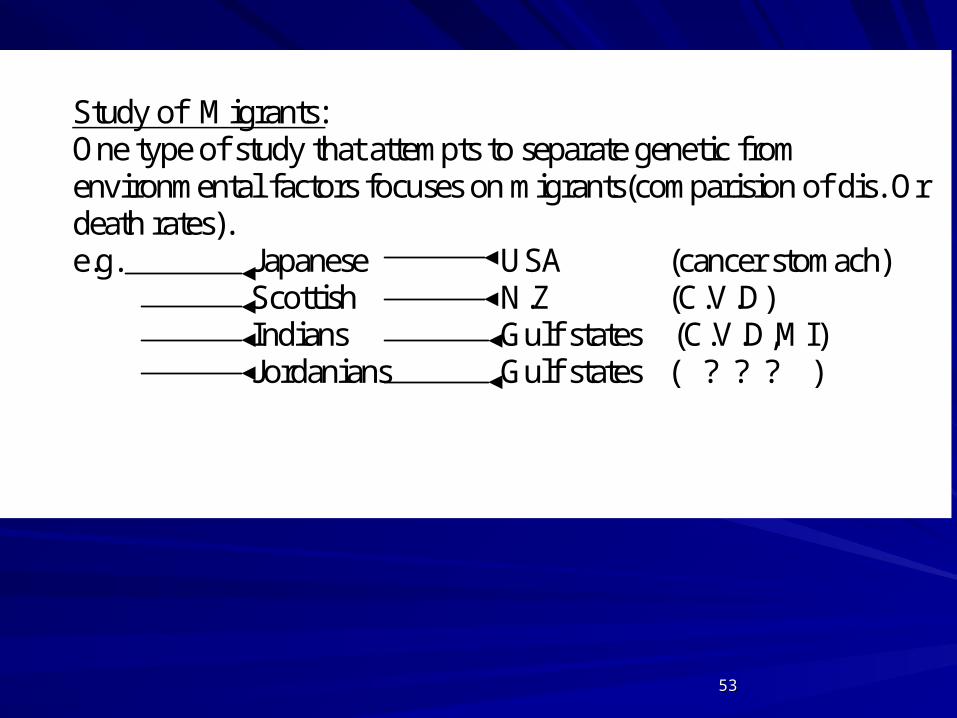
Study of Migrants:
One type of study that attempts to separate genetic from environmental factors focuses on migrants(comparision of dis. Or death rates). e.g. Japanese USA (cancer stomach) Scottish N.Z (C.V.D) Indians Gulf states (C.V.D,MI) Jordanians Gulf states ( ? ? ? )

5454
Diarrhea Mortality Rate / 1000Diarrhea Mortality Rate / 1000Population distributed by Governorates:Population distributed by Governorates:
Ref.Ref. UNICEF 1991< 5 y. Survey:UNICEF 1991< 5 y. Survey:
AmmanAmman 0.000.00
BalqaBalqa 2.902.90
ZarqaZarqa 0.610.61
IrbidIrbid 0.000.00
KarakKarak 4.624.62
MafraqMafraq 0.600.60
MaanMaan 0.000.00
JordanJordan 0.500.50

5555
Geographical areas of highest + Lowest Geographical areas of highest + Lowest incidence of selected cancer sitesincidence of selected cancer sites
Ref.Ref. R. Doll 1982R. Doll 1982
Cancer siteCancer site incidenceincidence incidenceincidence ratioratio
BladderBladder USAUSA JapanJapan 6:16:1ColonColon USAUSA NigeriaNigeria 10:110:1EsophagusEsophagus IRANIRAN NigeriaNigeria 300:1300:1LiverLiver MozambMozamb EnglandEngland 100:1100:1LungLung EnglandEngland NigeriaNigeria 35:135:1UterusUterus USAUSA JapanJapan 30:130:1PancreasPancreas N.ZN.Z IndiaIndia 8:18:1ProstateProstate USA(Black)USA(Black) JapanJapan 40:140:1StomachStomach JapanJapan UgandaUganda 25:125:1OvaryOvary DenmarkDenmark JapanJapan 6:16:1
5656
TimeTime
Study of dis. Occur. By timeStudy of dis. Occur. By time basic aspect of basic aspect of epidemiological analysis.epidemiological analysis.
Occurrence is usually expressed onOccurrence is usually expressed on monthly monthly or annual basis.or annual basis.
Major kind of changes with time:Major kind of changes with time:
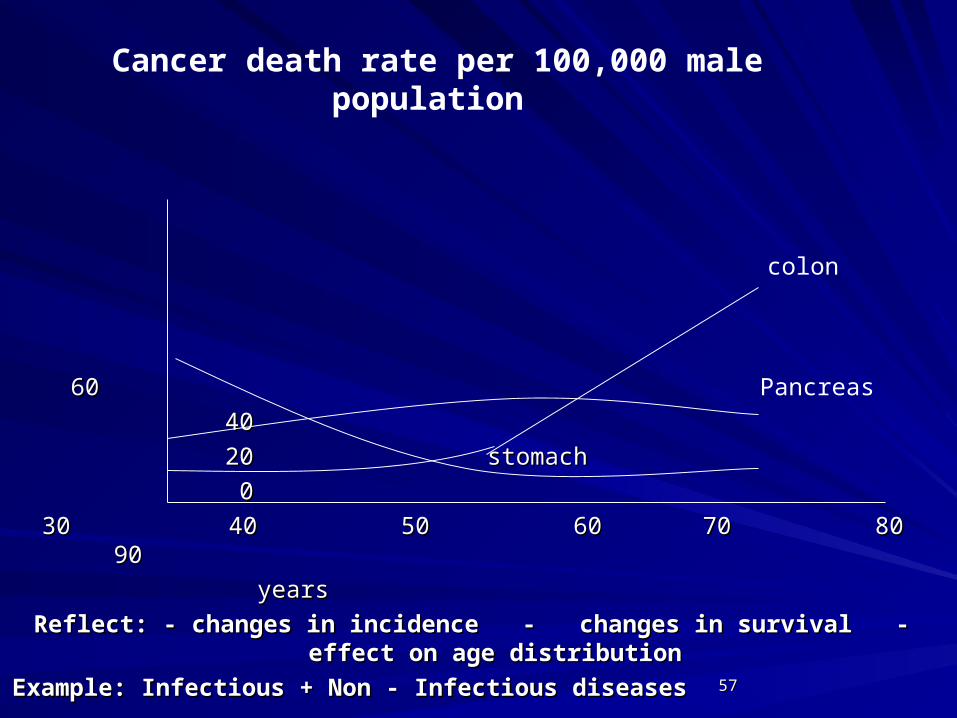
1.1. Secular trends:Secular trends: Long termLong term نزعات جيليةنزعات جيلية
Changes over a long period of time, years or Changes over a long period of time, years or decades. … occur both in infectious and non decades. … occur both in infectious and non infections dis.infections dis.
تبدالت عبر امد طويل من الزمنتبدالت عبر امد طويل من الزمن
5757
6060
4040
20 20 stomach stomach
0 0
30 40 50 60 70 80 9030 40 50 60 70 80 90
yearsyears
Reflect: - changes in incidence - changes in survival - effect on age Reflect: - changes in incidence - changes in survival - effect on age distributiondistribution
Example: Infectious + Non - Infectious diseasesExample: Infectious + Non - Infectious diseases
Cancer death rate per 100,000 male population
colon
Pancreas

5858
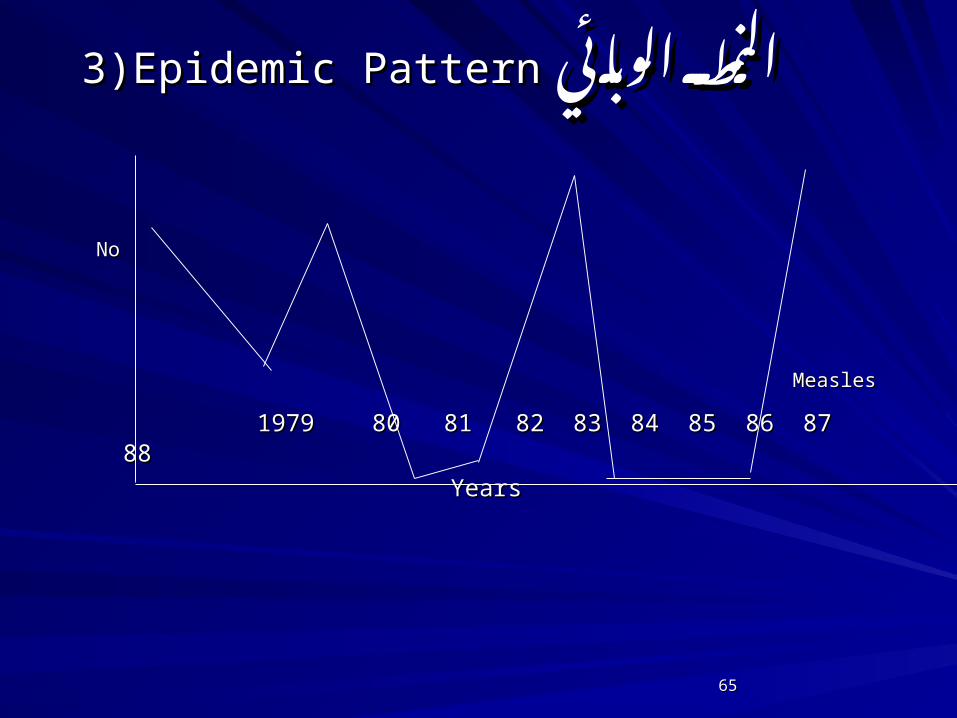
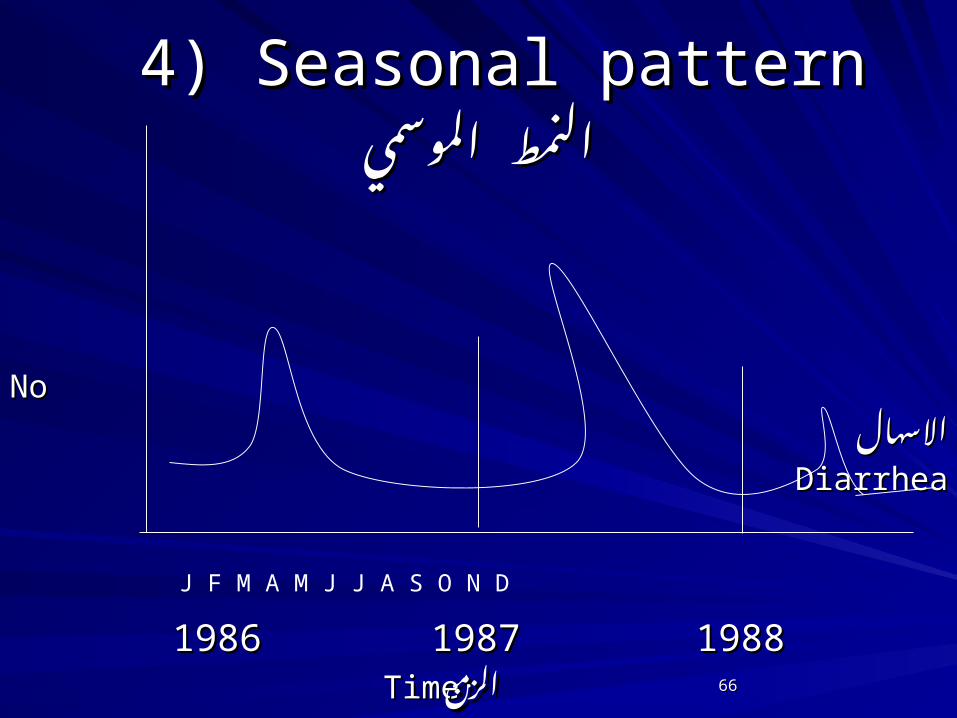
2)Cyclic Changes: 2)Cyclic Changes: تغيرات تغيراتفصليةفصلية
Changes refers to recurrent alterations in the Changes refers to recurrent alterations in the frequency of dis. Cycles, may be annual (seasonal) or frequency of dis. Cycles, may be annual (seasonal) or other periodicity.other periodicity.
e.g. - measles epidemic.e.g. - measles epidemic.
- influenza (A , B ).- influenza (A , B ).
- Diarrhea- Diarrhea
- infectious + non infectious.- infectious + non infectious.
No seasonal pattern in onset of cancer (in general) …. No seasonal pattern in onset of cancer (in general) …. Exception (melanoma of upper extremities)Exception (melanoma of upper extremities)
Seasonal ….. Drowning, skiing injuries.Seasonal ….. Drowning, skiing injuries.

5959
(Cyclic Trends)(Cyclic Trends)Study of disease occurrence by time during the course of days/ Study of disease occurrence by time during the course of days/ weeks,months,seasons or years.weeks,months,seasons or years.Ex: R.Tr.Accidants, Measles EpidemicEx: R.Tr.Accidants, Measles Epidemic
1 II III 1 II III 8080 150150 170 170
accidentaccident
No No
1 a.m 1 a.m 8 a.m8 a.m 1 pm 4 pm 1 pm 4 pm 12 pm 12 pmhours of the dayhours of the day

6060
Investigation of an epidemicInvestigation of an epidemic
1.1. Verify DiagnosisVerify Diagnosis::
Do clinical, lab., epid. Studies autopsy.Do clinical, lab., epid. Studies autopsy.
Establish criteria for labeling personsEstablish criteria for labeling persons
as cases (symptoms., lab. Or both)as cases (symptoms., lab. Or both)
2.2. Verify the existence of an epidemicVerify the existence of an epidemic::
Compare current incidence with past levels of Compare current incidence with past levels of the disease. (epidemic curve, mapping)the disease. (epidemic curve, mapping)

6161
3) 3) Describe the epidemic: (Person,Describe the epidemic: (Person, Place, Time)Place, Time)
Epidemic curve.Epidemic curve.Spot Map.Spot Map.Calculate Rates …(PAR)…by Age, sex, Occup., exposure to Calculate Rates …(PAR)…by Age, sex, Occup., exposure to specific foodspecific food
4) Formulate and test hypotheses:4) Formulate and test hypotheses:Identify type of epidemic; common source+propagated.Identify type of epidemic; common source+propagated.Identify the possible source from which disease may Identify the possible source from which disease may have been contracted.have been contracted.Compare ill pop. (cases) with well pop. (control) with Compare ill pop. (cases) with well pop. (control) with regard to exposure to the postulated source.regard to exposure to the postulated source.Calculate R.R for exposed+non exposed persons.Calculate R.R for exposed+non exposed persons.Carry out statistical test to determine probable source.Carry out statistical test to determine probable source.Confirm epid. Findings by lab. Tests (samples of blood, Confirm epid. Findings by lab. Tests (samples of blood, feces, suspected foodfeces, suspected food))
6262
55 ( (Search for additional casesSearch for additional cases::(you have to locate unrecognized or unreproted (you have to locate unrecognized or unreproted
cases) by:cases) by:Contracting physicians, hospitals or any other Contracting physicians, hospitals or any other health facilities in the area.health facilities in the area.Intensive investigation of a symptomatic persons Intensive investigation of a symptomatic persons or those with mild illness who may be contact of or those with mild illness who may be contact of cases.cases.
6) Analysis of data, interpreting of 6) Analysis of data, interpreting of findings.findings.

6363
77((Management of the epidemicManagement of the epidemic::Prepare facilities.Prepare facilities.Treatment of cases.Treatment of cases.Prevention of spreadPrevention of spreadImmediate control measures.Immediate control measures.Permanent control measures.Permanent control measures.
8) Report the investigation: include:8) Report the investigation: include:Discussion of factors leading to the epidemicDiscussion of factors leading to the epidemicEvaluation of measures used for control Evaluation of measures used for control Recommendations for prevention of similar episodes in Recommendations for prevention of similar episodes in the future.the future.
9) Continued surveillance9) Continued surveillanceKeep the community under serve. To detect further rise Keep the community under serve. To detect further rise in incidence and the effectiveness of control measures.in incidence and the effectiveness of control measures.

6464
S S. M T W. T. F
17%16%
10%
R. T. A s by day of the week
6565
3)Epidemic Pattern3)Epidemic Pattern الوبائي الوبائي النمط النمط
NoNo
MeaslesMeasles
1979 80 81 82 83 84 85 86 87 881979 80 81 82 83 84 85 86 87 88
YearsYears
6666
4) Seasonal pattern4) Seasonal patternالموسمي الموسمي النمط النمط
NoNo
االسهالاالسهال
DiarrheaDiarrhea
19861986 1987 1987 1988 1988TimeTimeالزمنالزمن
J F M A M J J A S O N D

6767
5) Short-term fluctuations:5) Short-term fluctuations:
Found in epidemic of infectious dis. common Found in epidemic of infectious dis. common
source epidemic + Propagated or source epidemic + Propagated or
progressive epidemic progressive epidemic
Clusters by Clusters by TimeTime + + PlacePlace : :
والمكان الزمان في احداث او لمرض تجمع او والمكان تعنقد الزمان في احداث او لمرض تجمع او تعنقد
6868
..changes in dis. Freq. With time are changes in dis. Freq. With time are represented byrepresented by
- - Histograms.
- - Frequency polygons.
- Epidemics:
- * Common source (point source):
- * Propagated (progressive) epidemic
6969
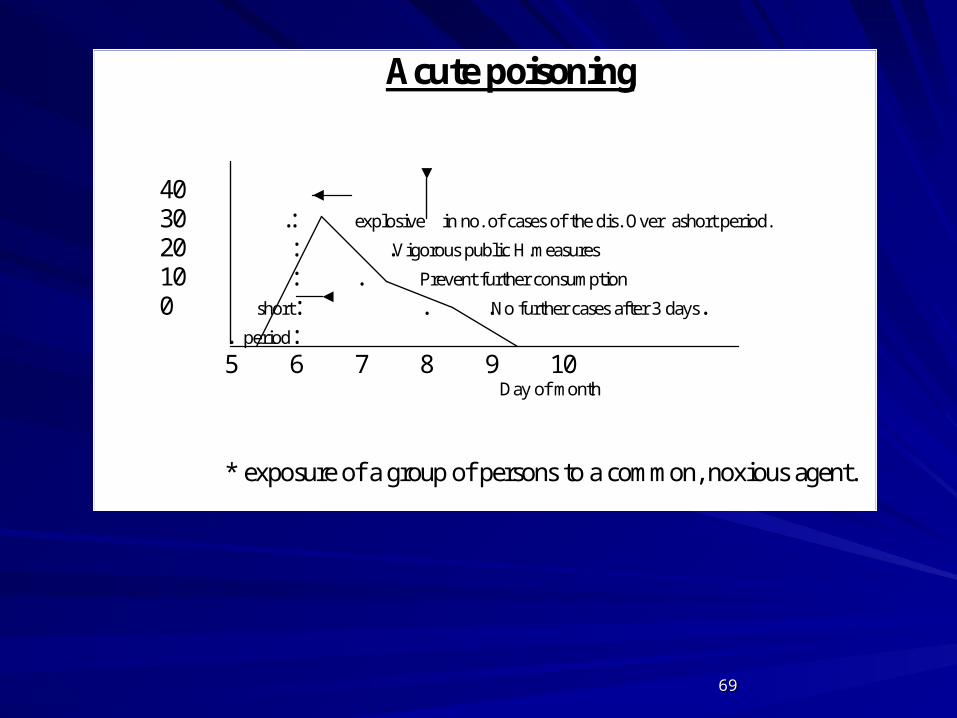
Acute poisoning
40 30 .: explosive in no. of cases of the dis. Over ashort period. 20 : .Vigorous public H.measures
10 : . Prevent further consumption 0 short: . .No further cases after 3 days.
. period: 5 6 7 8 9 10
Day of month
* exposure of a group of persons to a common, noxious agent.

7070
Propagated, Propagated, progressive,contagiousprogressive,contagious
300300
200 200 . . initial rise is less abrupt initial rise is less abrupt .Cases steadily….. As vacc.Cases steadily….. As vacc Org. propagated in community. campaigns became effectiveOrg. propagated in community. campaigns became effective100 by 100 by Pass from person-personPass from person-person
. . . . . . . .
0 sep nov dec jan feb mar apr may0 sep nov dec jan feb mar apr may
Month of year (small pox) Month of year (small pox)

7171
الوبائي المنحنى شكل يختلف الوبائي اذا المنحنى شكل يختلف اذابسبببسبب
.1.1 : بالمرض لالصابة القابلين : عدد بالمرض لالصابة القابلين عدد))H.ImmunityH.Immunity((
.2.2 : المرض حضانة : فترة المرض حضانة MIP MIP((فترةMIPMIP((
للمرض المسبب للمرض كمية المسبب كمية
المسبب المسبب عدوانية عدوانية
لالصابة العائل لالصابة قابلية العائل قابلية

7272
Propagated, progressive, Propagated, progressive, contagious epidemiccontagious epidemic
Most often of infectious originMost often of infectious origin
Result from transmission of infectious Result from transmission of infectious agent from one susceptible host to agent from one susceptible host to another.another.
Transmission continues until susceptible Transmission continues until susceptible depleted.depleted.
Examples. (HAV, Small pox).Examples. (HAV, Small pox).

7373
* Presence of several peaks * Presence of several peaks separated in time but within the separated in time but within the I.P. of IHV. I.P. of IHV.
* No. of susceptible is low, or * No. of susceptible is low, or insufficient contact (exposure insufficient contact (exposure between susceptible and infected between susceptible and infected cases. cases.

7474