1 executive summary - national oceanic and atmospheric ... · 1 executive summary ... (table1) in...
TRANSCRIPT
1 Executive Summary
1.1 Process
Assessments for 191 of the 20 groundfish stocks (Table 1) in the New England Fishery Manage-ment Council’s (NEFMC) Multispecies Groundfish Fisheries Management Plan were updated andreviewed during September 11-15, 2017 at the Northeast Fisheries Science Center (NEFSC), WoodsHole, MA. This represents the fifth assessment of the status of groundfish stocks since 2001. Thefirst three assessments were produced through the Groundfish Assessment Review Meeting (GARM)process (NEFSC 2002, 2005, 2008). Thirteen of the groundfish stocks were updated through theOperational Assessment process in 2012 (NEFSC 2012). All 20 groundfish stocks were updatedusing operational assessments in 2015 (NEFSC 2015). Operational assessments, first describedby the Northeast Regional Coordinating Council (NRCC) in 2011, rely on decisions of previousbenchmarks for model formulation and definition of biological reference points (BRPs). The termsof reference for the operational assessments are provided in Section 21.1. The efficiency of theOperational Assessment process increases the frequency of assessments, but reduces the ability tomodify model structure either in response to new data or external inputs. Major modifications ofthe assessment models are restricted to benchmark assessments that can incorporate a much greaterrange of information but for far fewer stocks. The scope of admissible changes in the assessment isdescribed in Section 21.4 and in guidelines that were initially developed by the NRCC in 2015 andrevised in 2017 through collaborative discussions among the NEFSC, NEFMC, and the AssessmentOversight Panel. The Assessment Oversight Panel (AOP) considered those guidelines in its July24, 2017, review of the plans for each assessment prepared by the individual analysts, making rec-ommendations regarding both planned changes to the assessments as well as plans for how scientificadvice would be provided for each stock if the primary analytical assessment was not accepted bythe peer review panel (sometimes referred to as “Plan B” assessment advice). See Section 21.3 fora summary of the AOP meeting.
Of particular note this year, newly available cooperative research on survey catchability of flatfishspecies was incorporated into the process, with modified catchability coefficients applied directlyin several assessments that use empirical models and catchability information shared for contextand diagnostic consideration for several assessments that use analytical models (Appendix 21.4).Prior to its use in these assessments, the cooperative research study was peer reviewed on July 18,2017 (summary available online). Those reviewers concluded the cooperative research surveys werewell designed, the results well supported, and sample sizes were generally appropriate for use inestimating catchability for flatfish species in the 2017 Operational Assessments. The Peer ReviewPanel for the Operational Assessments did not repeat this earlier peer review of the catchabilitystudies; rather it considered how the results were applied in relevant empirical assessments andtheir use in diagnostic evaluations of relevant analytical assessments.
In August and September, 2017 the NEFSC held 8 port-based outreach meetings for fishermen andother stakeholders. These occurred in Maine (Portland), New Hampshire (Portsmouth), RhodeIsland (Narragansett), New York (Montauk) and Massachusetts (Gloucester, Plymouth, New Bed-ford, and Chatham). NEFSC personnel met with attendees at each location to learn more about
1Atlantic halibut is being assessed separately
Groundfish Operational Assessments 2017 2 Executive Summary
recent observations from the fleet and ports that might help focus future research to improve as-sessments and interpret patterns in the current assessments. Each meeting started with a briefintroduction on the timeline for the assessments, what new information would be considered, andhow the results would be reviewed before use in the fishery management process.
A summary report of the outreach meetings discusses relevant insights from those meetings, whichwere shared during the peer review. Much of the substantive feedback from the outreach meetingsfocused on future research needs and opportunities as well as stakeholder questions about process,data, and outputs.
Following the established process associated with groundfish operational assessments, the NEFSCprovided a data-rich dedicated website to supplement the information provided in individual speciesassessment reports.
The Peer Review Panel (i.e., Panel) consisted of the following individuals:
• Pat Sullivan (Co-chair), Cornell University, NEFMC Scientific and Statistical Committee
• Patrick Lynch (Co-chair), NMFS Office of Science and Technology, Silver Spring, MD.
• Gary Nelson, Massachusetts Division of Marine Fisheries, Gloucester, MA
• Jim Berkson, NMFS Office of Science and Technology, Silver Spring, MD.
The Panel was responsible for reviewing each of the stock assessments. Primary and supportingdocuments for each assessment were available prior to the meeting. Each lead assessment scien-tist (Table 2) prepared a short presentation to describe the past and updated assessment resultsand address key sources of uncertainty (see agenda). Following the presentation, the Panel wasresponsible for addressing five terms of reference (TOR):
• Accept/ Not Accept the assessment as a basis for setting Overfishing Limit (OFL).
• If the assessment is not accepted, then recommend an alternative basis for setting OFL.
• Include qualitative written statements about the condition of the stock that will help to informNOAA Fisheries about stock status.
• Identify key sources of uncertainty.
• Identify important research needs.
If an assessment was not considered suitable for estimation of OFL the Panel was responsible forrecommending an alternative basis. Additionally, the Peer Review panel was asked to recommendwhat the stock status appears to be without reference to analytical assessment results. NOAAFisheries has final responsibility for making the stock status determination based on best avail-able scientific information, which in the absence of an accepted quantitative assessment, may bequalitative.
Groundfish Operational Assessments 2017 3 Executive Summary
The individual assessment sections within this report are standardized and designed to capture themost relevant information for reviewers and fishery managers. The report structure was developedwith, and approved by, a subcommittee of the NRCC, followed by NRCC feedback about the reportstructure. Each assessment is supported by an online set of companion tables, figures and maps,which provide primary users of the assessment information (e.g., Plan Development Teams, Scienceand Statistical Committee) with necessary details. The online data portal (SASINF) also containsmodel inputs and outputs that can be used directly in NOAA Fisheries Toolbox applications.
The meeting was broadcast as a webinar using Adobe Connect and all sessions were open to thepublic. The meeting agenda included a daily public comment period. Members of the audience andindividuals on the phone were included in the discussions of the panel at the discretion of the PanelCo-chairs. However, the tight timeline for completing the assessments required a strong adherenceto the terms of reference and the description of the operational assessment process developed bythe NRCC. Onsite participants in Woods Hole are listed in Section 21.5.
1.2 Data
The groundfish updates used the following standard procedures for updating data from landings,discards and surveys (Table 3). The US commercial landings are estimated by market categoryfrom the area allocation (“AA”) tables, which combine dealer and vessel trip reports to deter-mine where fish were caught. The US commercial discards are estimated by gear types using theStandardized Bycatch Reporting Methodology (SBRM), which combines observer data (includingat-sea monitors) and dealer landings. The US recreational landings and discards come from theMarine Recreational Information Program (MRIP), including recent revisions to historical data.Both commercial and recreational discards have species-specific discard mortality rates applied tothe discarded fish. Catch-at-age is estimated using age-length keys applied to expanded lengthfrequency distributions. For white hake, which is landed headed, the age-length key is applied topredicted lengths based on dorsal fin to caudal fin length. Additional sources of catch for somespecies come from Canadian or other foreign fishing.
The NEFSC spring and fall bottom trawl surveys are the most common source of information forpopulation trends (Table 3). These surveys are calibrated to “Albatross units” in most cases toallow for the longest time series possible. NOAA ship Henry B. Bigelow replaced the Albatross IV asthe primary bottom trawl survey vessel in spring 2009. In some instances the calibration coefficientvaries by length but in others a simple scalar adjustment is applied to all length classes. Othersurveys used include the Massachusetts Division of Marine Fisheries spring and fall bottom trawlsurveys, the Maine-New Hampshire spring and fall bottom trawl surveys, the Canadian Departmentof Fisheries and Oceans February survey, and some additional state surveys. Catch per unit effortis not typically used as a source of population trends due to the many regulatory changes that haveoccurred over time in the Northeast that influence fishing behavior and catch rates. All updatedassessments used a consistent quality assurance criterion (known as TOGA; Politis et al. 2014) forsurveys conducted by the NOAA ship Henry B. Bigelow.
Groundfish Operational Assessments 2017 4 Executive Summary
1.3 Models
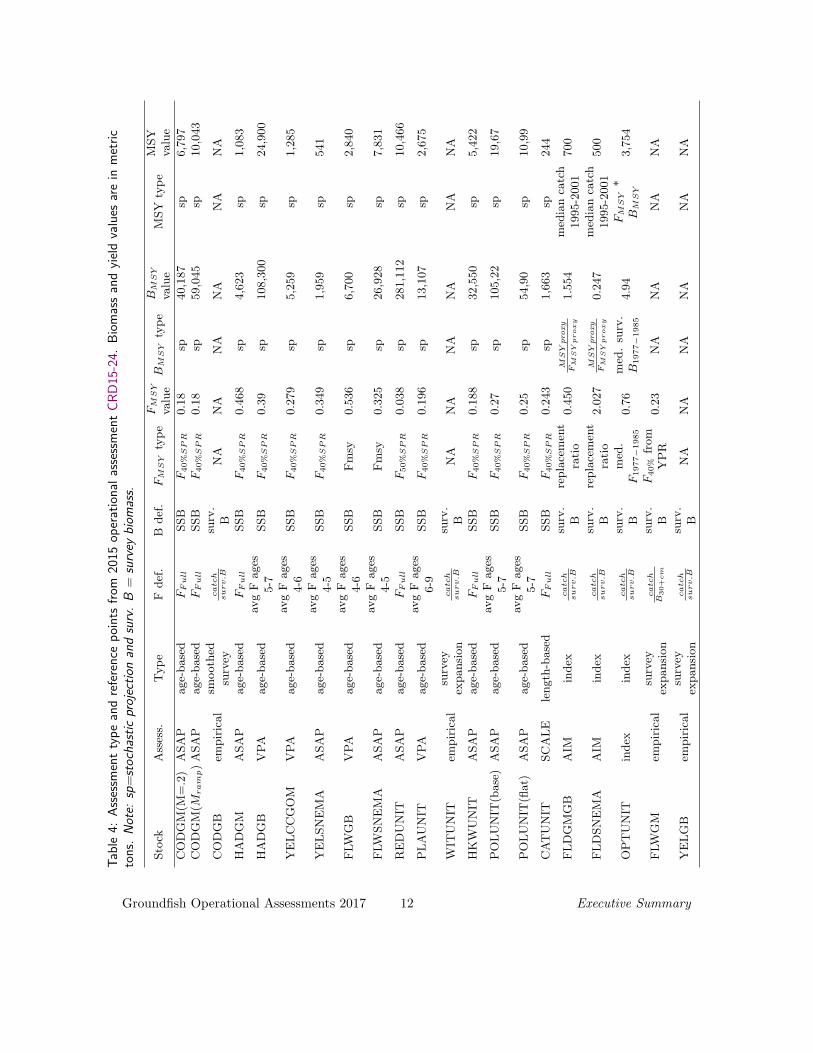
Based on previous 2015 operational assessments (Table 4; NEFSC, 2015), there are 12 stocksassessed with an age-based approach. Eight use the statistical catch-at-age model ASAP while4 others use virtual population analysis (VPA). For the 4 VPA stocks, the 2017 spring surveyinformation was included in the model. The remaining 7 stocks are assessed with a range of modeltypes including length-based (SCALE), index (AIM), and direct survey expansion. The referencepoints for the age- and length-based assessments were derived from stochastic projections of theFMSY (or FMSY proxy) for many years (typically 100), while the other assessment types usestock-specific rules for deriving the reference points. Technical descriptions of the biomass, fishingmortality and reference point estimators used for each stock are shown in Table 4. Informationfrom a newly revived industry-based cod survey in the Gulf of Maine was considered for context ina few relevant assessments and discussed with the Peer Review Panel but was not directly includeddue to limited time series and Operational Assessment guidelines.
1.4 Results
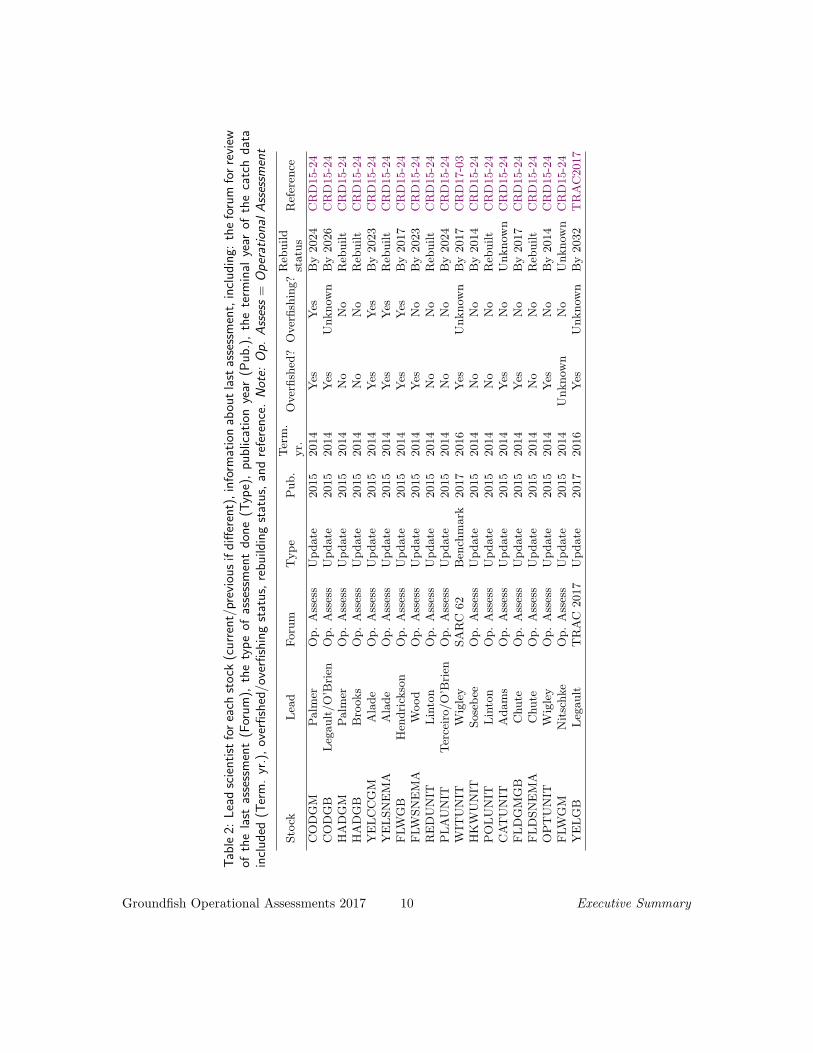
Operational Assessments were conducted in 2017 for 19 of the 20 stocks in the Northeast Multi-species Fishery Management Plan (Table 1). The updates replicated the methods recommendedin the most recent benchmark decisions, as modified by any subsequent operational assessmentsor updates (Table 2). Information supplemental to the assessment report for each stock can befound on the Stock Assessment Support Information (SASINF) website. The Panel accepted all ofthe assessments as a scientific basis for management and provided catch advice for all 19 stocks.Recommended stock status did not change for 18 of the 19 stocks, and improved for 1 stock (Table5).
Each of the 19 species chapters contains the assessment results provided to the Panel for peer reviewfollowed by a section entitled “Reviewer Comments,” which describes final Panel decisions at theconclusion of the peer review. In this Executive Summary, tables and figures related to stock statusfrom the 2017 review reflect the Panel recommendations (Tables 5 - 6; Figures 1 - 2).
The number of stocks with retrospective adjustments (also called rho adjustments) applied increasedfrom the last assessment from 7 to 8 (Table 7). Decisions to apply a retrospective adjustment toestimates of terminal year biomass and fishing mortality rates were based on whether the rhoadjusted value was outside the 90% joint confidence region for the model estimates. This principlewas supported by the AOP and was applied to adjust biomass estimates for Georges Bank haddock,Southern New England yellowtail flounder, Cape Cod/Gulf of Maine yellowtail flounder, GeorgesBank winter flounder, American plaice, white hake, pollock and redfish (Table 8). Gulf of Maine codwas an exception because of earlier guidance from the SARC 55 review panel. Despite the presenceof a significant retrospective pattern at that meeting no adjustments were made; the OperationalAssessments panel followed that precedent.
Stock status recommendations for the 19 groundfish stocks are summarized in Tables 5 and 6. Fourstocks are experiencing overfishing: Southern New England yellowtail flounder, Cape Cod Gulf ofMaine yellowtail flounder, Gulf of Maine cod and Georges Bank yellowtail flounder. Ten groundfishstocks are overfished (Table 5). Based on these recommendations, the number of overfished stocks
Groundfish Operational Assessments 2017 5 Executive Summary
and stocks experiencing overfishing has generally decreased since GARM III in 2007 (Figure 3),and the magnitude of overfishing or depletion for several stocks has generally decreased (Figures 1and 2).
Simultaneous assessments of 19 groundfish stocks allowed a comprehensive examination of trendsin spring and fall survey indices (Figures 4 and 5, respectively). For the majority of stocks theaverage of the most recent 5 years is below the time series mean for that stock.
Estimates of overall (aggregate) groundfish minimum swept area biomass are at or near an all-timehigh (Figures 6 and 7). However, the current stock diversity of the overall groundfish biomass isless than that seen in the 1960s and 1970s. Current groundfish biomass is dominated by only a fewstocks. For example, the combined biomass of the Georges Bank haddock, Gulf of Maine haddock,pollock, and redfish stocks currently constitute more than 90% of the overall groundfish biomassobserved in NEFSC spring surveys (Figure 6). It is important to note that the minimum swept areabiomass estimates assume a common capture efficiency of 1.0 across all years. Actual biomasses,as derived from models, are adjusted for catchability and selectivity estimates and are higher thanthe minimum swept area estimates. Unfortunately model-based estimates are not available for allstocks over the entire time period of the surveys (i.e. since 1963); the primary limitation is theavailability of age information from the commercial catches that would be needed to support fullage-based assessments.
For 12 stocks, model-based biomass estimates can be computed from 1985 onward. The strikingincrease in abundance since 1985 is driven primarily by redfish, Georges Bank haddock, and pollock(Figure 8). Pollock biomass from the stock assessment is much higher than the swept area estimatesbecause of a dome-shaped selectivity pattern in both the survey and catch data. This suggests thata substantial fraction of the stock biomass is unavailable to either the fishery or survey gear. Thechapter describing the pollock assessment includes a sensitivity run in which the assumption ofdome-shaped selectivity is removed, resulting in a biomass estimate that is about half as large. Theincrease in model based estimates of overall biomass, with or without pollock, is consistent withthe trends revealed in the swept area estimates (Figures 6, 7 and 8).
An advantage of conducting multiple assessments simultaneously is that measures of productivitycan be compared over time. Reductions in average weight-at-age, declines in recruitment and shiftsin age-at-maturity all influence the estimated biomass at maximum sustainable yield and totalMSY . As such, the combined single species stock assessments provide valuable measures of ecosys-tem productivity, irrespective of the underlying environmental or ecological causes. Reductions inaverage weights-at-age have occurred for stocks at high abundance, such as Georges Bank haddock,but also for stocks at low abundance, such as witch flounder. Hence, density dependence alone isinsufficient to explain this across all stocks. Reductions in recruitment are often associated withdeclines in stock size but inter-annual variation often masks trends. Aggregate estimates of totalBMSY are available for 10 stocks over the past decade (Figure 9). Total BMSY for these stocksdeclined by 12% between 2008 and 2015 from 668 kt to 521 kt. Estimates further declined by about7% between 2015 and 2017 to 483 kt (Figure 9).
An ecosystem report provided a climate vulnerability assessment for each of the 19 groundfishspecies. Current ecosystem considerations were summarized in a risk analysis framework to pro-vide ecological context to the stock status of each species, including condition factor, productivityanalyses and habitat modeling as an alternative index of biomass. Potential impacts of the recent
Groundfish Operational Assessments 2017 6 Executive Summary

record high fall bottom and sea surface temperatures with subsequent thermal habitat reductionsand range shifts were assessed for each stock, taking into account each stock’s thermal preferencesand vulnerability to climate change.
1.5 Reviewer Comments: Overview
The operational assessment meeting that took place at the Northeast Fisheries Science CenterSeptember 11-15 went well and all of the individual operational assessments were approved for usein developing management decisions for the SSC and Council. However, in the process of evaluatingthe 19 groundfish stocks certain patterns were notable in the data and in the model responses tothat data. These patterns would suggest that some higher-level integrated analysis should takeplace in order to improve the assessment process as a whole while maintaining the integrity of theindividual assessments, which meet the requirements for the present. Among the patterns thatemerge were the number of assessments that displayed some kind of retrospective pattern and thatrequired a retrospective adjustment. Unfortunately, numerous factors can individually or in unioncause retrospective patterns to emerge in assessment estimates. Examples of such influential factorsinclude changes in natural mortality, changes in selectivity, changes in size at age, underreportingof landings or discards, immigration or emigration, as well as factors affecting recruitment.
One recognizes that the Ecosystem Group, who gave a short presentation the afternoon of the firstday of the week-long groundfish meeting, are in the position of providing at least some insighton environmental factors that could influence ecosystem health as well as those which might inother ways confound the assessment. The presentations focused on some general metrics likely toinfluence fish health and behavior, but more proactive approaches might also be considered. Duringthe meeting the review panel noticed general patterns in reductions in size at age across severalstocks. And while such changes could be driven by density-dependent effects, these changes mayalso be precipitated by ecosystem level changes. The management response to these two differentdeterminants could be very different. The panel also noted something that seemed to be commonknowledge, namely that 2013 stood out as it was a good year for producing strong recruitmentyear classes (other years, such as 2007, may also have been conducive to recruitment across stocks).Further, the review panel observed situations where fisheries stocks seemed unable to respondpositively to management restrictions on catch.
Broadly, these changes in the biology, in the ecosystem and in contrast to what is happening inmanagement suggest that an integrated approach that not only examines ecosystem trends butalso tries to account for other aspects of fisheries systems such as the quality and nature of thesurvey and catch data, the magnitude of unreported catch, and long term effects on fishing behaviorof changing management actions would be highly beneficial. On a related cross-assessment note,working towards assessments that better represent the level of uncertainty in the estimates wouldalso be of value. This will take time as this is an evolving area of research, but the outcome wouldlikely benefit fisheries management as the risk in decision making given constraints in how data arecollected and how the ecosystem is changing becomes better known.
The review panel was pleased to see the work coming out of the Cooperative Research SurveyProgram. In this review, the data were used to help validate existing model-based trends as well asprovide direct input into catchability estimates for empirical approaches when no integrated model
Groundfish Operational Assessments 2017 7 Executive Summary

was available for use. The assessment community is encouraged to continue to use these data forsuch purposes. One must recognize, however, that such data are most useful when consideredin the longer term. More specifically, the review panel notes that individual surveys must beviewed in the context of long-term data collection efforts and extensive integrated assessment thatundergo ongoing review. One should not expect that a single experiment should overturn years ofsystematic analysis, but should be instrumental in providing validation and by contrast challengesto the existing methods. Such studies should also point to where additional work is needed.
References
Politis PJ, Galbraith JK, Kostovick P, Brown RW. 2014. Northeast Fisheries Science Center bottomtrawl survey protocols for the NOAA Ship Henry B. Bigelow. US Dept Commer, Northeast FishSci Cent Ref Doc. 14-06; 138 p. Available from: National Marine Fisheries Service, 166 WaterStreet, Woods Hole, MA 02543-1026. CRD14-06
Miller, T.J., Richardson, D.E., Politis P.J., Blaylock, J. In press. Northeast Fisheries Science Centerbottom trawl catch efficiency and biomass estimates for 2009-2017 for 8 flatfish stocks included inthe 2017 Northeast Groundfish Operational Assessments. US Dept Commer, Northeast Fish SciCent Ref Doc. In press; 26 p. Available from: National Marine Fisheries Service, 166 Water Street,Woods Hole, MA 02543-1026.
Northeast Fisheries Science Center. 2015. Operational Assessment of 20 Northeast GroundfishStocks, Updated Through 2014. US Dept Commer, Northeast Fish Sci Cent Ref Doc. 15-24; 251p. CRD15-24
Northeast Fisheries Science Center. 2012. Assessment or Data Updates of 13 Northeast GroundfishStocks through 2010. US Dept Commer, Northeast Fish Sci Cent Ref Doc. 12-06; 789 p. Availablefrom: National Marine Fisheries Service, 166 Water Street, Woods Hole, MA 02543-1026 CRD12-06
Northeast Fisheries Science Center. 2008. Assessment of 19 Northeast Groundfish Stocks through2007: Report of the 3rd Groundfish Assessment Review Meeting (GARM III), Northeast FisheriesScience Center, Woods Hole, Massachusetts, August 4-8, 2008. US Dep Commer, NOAA FIsheries,Northeast Fish Sci Cent Ref Doc. 08-15; 884 p + xvii. CRD08-15
Mayo RK, Terceiro M, editors. 2005. Assessment of 19 Northeast groundfish stocks through 2004.2005 Groundfish Assessment Review Meeting (2005 GARM), Northeast Fisheries Science Center,Woods Hole, Massachusetts, 15-19 August 2005. U.S. Dep. Commer., Northeast Fish. Sci. Cent.Ref. Doc. 05-13; 499 p. CRD05-13
Groundfish Operational Assessments 2017 8 Executive Summary
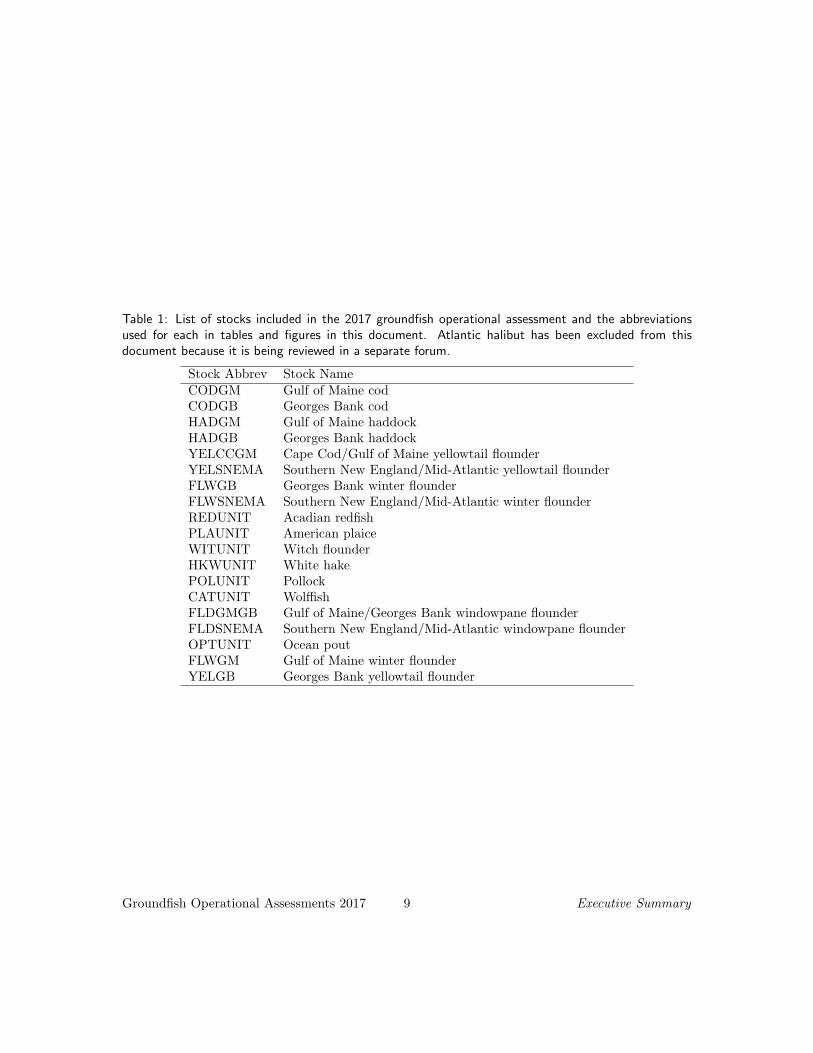
Table 1: List of stocks included in the 2017 groundfish operational assessment and the abbreviationsused for each in tables and figures in this document. Atlantic halibut has been excluded from thisdocument because it is being reviewed in a separate forum.
Stock Abbrev Stock NameCODGM Gulf of Maine codCODGB Georges Bank codHADGM Gulf of Maine haddockHADGB Georges Bank haddockYELCCGM Cape Cod/Gulf of Maine yellowtail flounderYELSNEMA Southern New England/Mid-Atlantic yellowtail flounderFLWGB Georges Bank winter flounderFLWSNEMA Southern New England/Mid-Atlantic winter flounderREDUNIT Acadian redfishPLAUNIT American plaiceWITUNIT Witch flounderHKWUNIT White hakePOLUNIT PollockCATUNIT WolffishFLDGMGB Gulf of Maine/Georges Bank windowpane flounderFLDSNEMA Southern New England/Mid-Atlantic windowpane flounderOPTUNIT Ocean poutFLWGM Gulf of Maine winter flounderYELGB Georges Bank yellowtail flounder
Groundfish Operational Assessments 2017 9 Executive Summary
Tab
le2:
Lea
dsc
ien
tist
for
each
sto
ck(c
urr
ent/
prev
iou
sif
diff
eren
t),
info
rmat
ion
abou
tla
stas
sess
men
t,in
clu
din
g:th
efo
rum
for
revi
ewof
the
last
asse
ssm
ent
(For
um
),th
ety
pe
ofas
sess
men
td
one
(Typ
e),
pu
blic
atio
nye
ar(P
ub
.),
the
term
inal
year
ofth
eca
tch
dat
ain
clu
ded
(Ter
m.
yr.)
,ov
erfi
shed
/ove
rfish
ing
stat
us,
reb
uild
ing
stat
us,
and
refe
ren
ce.
Not
e:O
p.
Ass
ess
=O
per
atio
nal
Ass
essm
ent
Sto
ckL
ead
Foru
mT
yp
eP
ub.
Ter
m.
yr.
Over
fish
ed?
Over
fish
ing?
Reb
uild
statu
sR
efer
ence
CO
DG
MP
alm
erO
p.
Ass
ess
Up
date
2015
2014
Yes
Yes
By
2024
CR
D15-2
4C
OD
GB
Leg
ault/O
’Bri
enO
p.
Ass
ess
Up
date
2015
2014
Yes
Unknow
nB
y2026
CR
D15-2
4H
AD
GM
Palm
erO
p.
Ass
ess
Up
date
2015
2014
No
No
Reb
uilt
CR
D15-2
4H
AD
GB
Bro
oks
Op.
Ass
ess
Up
date
2015
2014
No
No
Reb
uilt
CR
D15-2
4Y
EL
CC
GM
Ala
de
Op.
Ass
ess
Up
date
2015
2014
Yes
Yes
By
2023
CR
D15-2
4Y
EL
SN
EM
AA
lade
Op.
Ass
ess
Up
date
2015
2014
Yes
Yes
Reb
uilt
CR
D15-2
4F
LW
GB
Hen
dri
ckso
nO
p.
Ass
ess
Up
date
2015
2014
Yes
Yes
By
2017
CR
D15-2
4F
LW
SN
EM
AW
ood
Op.
Ass
ess
Up
date
2015
2014
Yes
No
By
2023
CR
D15-2
4R
ED
UN
ITL
into
nO
p.
Ass
ess
Up
date
2015
2014
No
No
Reb
uilt
CR
D15-2
4P
LA
UN
ITT
erce
iro/O
’Bri
enO
p.
Ass
ess
Up
date
2015
2014
No
No
By
2024
CR
D15-2
4W
ITU
NIT
Wig
ley
SA
RC
62
Ben
chm
ark
2017
2016
Yes
Unknow
nB
y2017
CR
D17-0
3H
KW
UN
ITSose
bee
Op.
Ass
ess
Up
date
2015
2014
No
No
By
2014
CR
D15-2
4P
OL
UN
ITL
into
nO
p.
Ass
ess
Up
date
2015
2014
No
No
Reb
uilt
CR
D15-2
4C
AT
UN
ITA
dam
sO
p.
Ass
ess
Up
date
2015
2014
Yes
No
Unknow
nC
RD
15-2
4F
LD
GM
GB
Chute
Op.
Ass
ess
Up
date
2015
2014
Yes
No
By
2017
CR
D15-2
4F
LD
SN
EM
AC
hute
Op.
Ass
ess
Up
date
2015
2014
No
No
Reb
uilt
CR
D15-2
4O
PT
UN
ITW
igle
yO
p.
Ass
ess
Up
date
2015
2014
Yes
No
By
2014
CR
D15-2
4F
LW
GM
Nit
schke
Op.
Ass
ess
Up
date
2015
2014
Unknow
nN
oU
nknow
nC
RD
15-2
4Y
EL
GB
Leg
ault
TR
AC
2017
Up
date
2017
2016
Yes
Unknow
nB
y2032
TR
AC
2017
Groundfish Operational Assessments 2017 10 Executive Summary

Tab
le3:
Dat
au
sed
inea
chas
sess
men
t.T
he
colu
mn
hea
ds
are
US
com
mer
cial
lan
din
gs(U
Sc-
lnd
),U
Sco
mm
erci
ald
isca
rds
(US
c-d
is),
US
recr
eati
onal
lan
din
gs(U
Sr-
lnd
),U
Sre
crea
tion
ald
isca
rds
(US
r-d
is),
Can
adia
nca
tch
(CA
cat)
,N
orth
east
Fis
her
ies
Sci
ence
Cen
ter
spri
ng,
fall
and
win
ter
surv
eys
(NE
S,
NE
Fan
dN
EW
),M
assa
chu
sett
ssp
rin
gan
dfa
llsu
rvey
s(M
AS
and
MA
F),
Mai
ne/
New
Ham
psh
ire
spri
ng
and
fall
surv
eys
(ME
/NH
San
dM
E/N
HF
)an
dC
anad
ian
Dep
artm
ent
ofF
ish
erie
san
dO
cean
sF
ebru
ary
surv
ey(D
FO
S).
Catc
hSurv
eys
Sto
ckU
Sc-
lnd
US
c-dis
US
r-ln
dU
Sr-
dis
CA
Cat
NE
SN
EF
NE
WM
AS
MA
FM
E/N
HS
ME
/N
HF
DF
OS
CO
DG
MY
esY
esY
esY
esN
oY
esY
esN
oY
esN
oN
oN
oN
oC
OD
GB
Yes
Yes
Yes
Yes
Yes
Yes
Yes
No
No
No
No
No
No
HA
DG
MY
esY
esY
esY
esN
oY
esY
esN
oN
oN
oN
oN
oN
oH
AD
GB
Yes
Yes
No
No
Yes
Yes
Yes
No
No
No
No
No
Yes
YE
LC
CG
MY
esY
esN
oN
oN
oY
esY
esN
oY
esY
esY
esY
esN
oY
EL
SN
EM
AY
esY
esN
oN
oN
oY
esY
esY
esN
oN
oN
oN
oN
oF
LW
GB
Yes
Yes
No
No
Yes
Yes
Yes
No
No
No
No
No
Yes
FLW
SN
EM
AY
esY
esY
esY
esN
oY
esY
esY
esY
esN
oN
oN
oN
oR
ED
UN
ITY
esY
esN
oN
oN
oY
esY
esN
oN
oN
oN
oN
oN
oP
LA
UN
ITY
esY
esN
oN
oY
esY
esY
esN
oY
esY
esN
oN
oN
oW
ITU
NIT
Yes
Yes
No
No
No
Yes
Yes
No
No
No
No
No
No
HK
WU
NIT
Yes
Yes
No
No
Yes
Yes
Yes
No
No
No
No
No
No
PO
LU
NIT
Yes
Yes
Yes
Yes
No
Yes
Yes
No
No
No
No
No
No
CA
TU
NIT
Yes
Yes
Yes
No
No
Yes
Yes
No
Yes
No
No
No
No
FL
DG
MG
BY
esY
esN
oN
oN
oN
oY
esN
oN
oN
oN
oN
oN
oF
LD
SN
EM
AY
esY
esN
oN
oN
oN
oY
esN
oN
oN
oN
oN
oN
oO
PT
UN
ITY
esY
esN
oN
oN
oY
esN
oN
oN
oN
oN
oN
oN
oF
LD
WG
MY
esY
esY
esY
esN
oY
esY
esN
oY
esY
esY
esY
esN
oY
EL
GB
Yes
Yes
No
No
Yes
Yes
Yes
No
No
No
No
No
Yes
Groundfish Operational Assessments 2017 11 Executive Summary
Tab
le4:
Ass
essm
ent
typ
ean
dre
fere
nce
poi
nts
from
2015
oper
atio
nal
asse
ssm
ent
CR
D15
-24.
Bio
mas
san
dyi
eld
valu
esar
ein
met
ric
ton
s.N
ote:
sp=
sto
chas
tic
proj
ecti
onan
dsu
rv.
B=
surv
eyb
iom
ass.
Sto
ckA
sses
s.T
yp
eF
def
.B
def
.F
MS
Yty
pe
FM
SY
valu
eB
MS
Yty
pe
BM
SY
valu
eM
SY
typ
eM
SY
valu
e
CO
DG
M(M
=.2
)A
SA
Page-
base
dF
Fu
llSSB
F40%
SP
R0.1
8sp
40,1
87
sp6,7
97
CO
DG
M(M
ra
mp)
ASA
Page-
base
dF
Fu
llSSB
F40%
SP
R0.1
8sp
59,0
45
sp10,0
43
CO
DG
Bem
pir
ical
smooth
edsu
rvey
ca
tch
su
rv.B
surv
.B
NA
NA
NA
NA
NA
NA
HA
DG
MA
SA
Page-
base
dF
Fu
llSSB
F40%
SP
R0.4
68
sp4,6
23
sp1,0
83
HA
DG
BV
PA
age-
base
dav
gF
ages
5-7
SSB
F40%
SP
R0.3
9sp
108,3
00
sp24,9
00
YE
LC
CG
OM
VP
Aage-
base
dav
gF
ages
4-6
SSB
F40%
SP
R0.2
79
sp5,2
59
sp1,2
85
YE
LSN
EM
AA
SA
Page-
base
dav
gF
ages
4-5
SSB
F40%
SP
R0.3
49
sp1,9
59
sp541
FLW
GB
VP
Aage-
base
dav
gF
ages
4-6
SSB
Fm
sy0.5
36
sp6,7
00
sp2,8
40
FLW
SN
EM
AA
SA
Page-
base
dav
gF
ages
4-5
SSB
Fm
sy0.3
25
sp26,9
28
sp7,8
31
RE
DU
NIT
ASA
Page-
base
dF
Fu
llSSB
F50%
SP
R0.0
38
sp281,1
12
sp10,4
66
PL
AU
NIT
VP
Aage-
base
dav
gF
ages
6-9
SSB
F40%
SP
R0.1
96
sp13,1
07
sp2,6
75
WIT
UN
ITem
pir
ical
surv
eyex
pansi
on
ca
tch
su
rv.B
surv
.B
NA
NA
NA
NA
NA
NA
HK
WU
NIT
ASA
Page-
base
dF
Fu
llSSB
F40%
SP
R0.1
88
sp32,5
50
sp5,4
22
PO
LU
NIT
(base
)A
SA
Page-
base
dav
gF
ages
5-7
SSB
F40%
SP
R0.2
7sp
105,2
2sp
19,6
7
PO
LU
NIT
(flat)
ASA
Page-
base
dav
gF
ages
5-7
SSB
F40%
SP
R0.2
5sp
54,9
0sp
10,9
9
CA
TU
NIT
SC
AL
Ele
ngth
-base
dF
Fu
llSSB
F40%
SP
R0.2
43
sp1,6
63
sp244
FL
DG
MG
BA
IMin
dex
ca
tch
su
rv.B
surv
.B
repla
cem
ent
rati
o0.4
50
MS
Ypro
xy
FM
SY
pr
ox
y1.5
54
med
ian
catc
h1995-2
001
700
FL
DSN
EM
AA
IMin
dex
ca
tch
su
rv.B
surv
.B
repla
cem
ent
rati
o2.0
27
MS
Ypro
xy
FM
SY
pr
ox
y0.2
47
med
ian
catc
h1995-2
001
500
OP
TU
NIT
index
index
ca
tch
su
rv.B
surv
.B
med
.F
1977−
1985
0.7
6m
ed.
surv
.B
1977−
1985
4.9
4F
MS
Y*
BM
SY
3,7
54
FLW
GM
empir
ical
surv
eyex
pansi
on
ca
tch
B30+
cm
surv
.B
F40%
from
YP
R0.2
3N
AN
AN
AN
A
YE
LG
Bem
pir
ical
surv
eyex
pansi
on
ca
tch
su
rv.B
surv
.B
NA
NA
NA
NA
NA
NA
Groundfish Operational Assessments 2017 12 Executive Summary
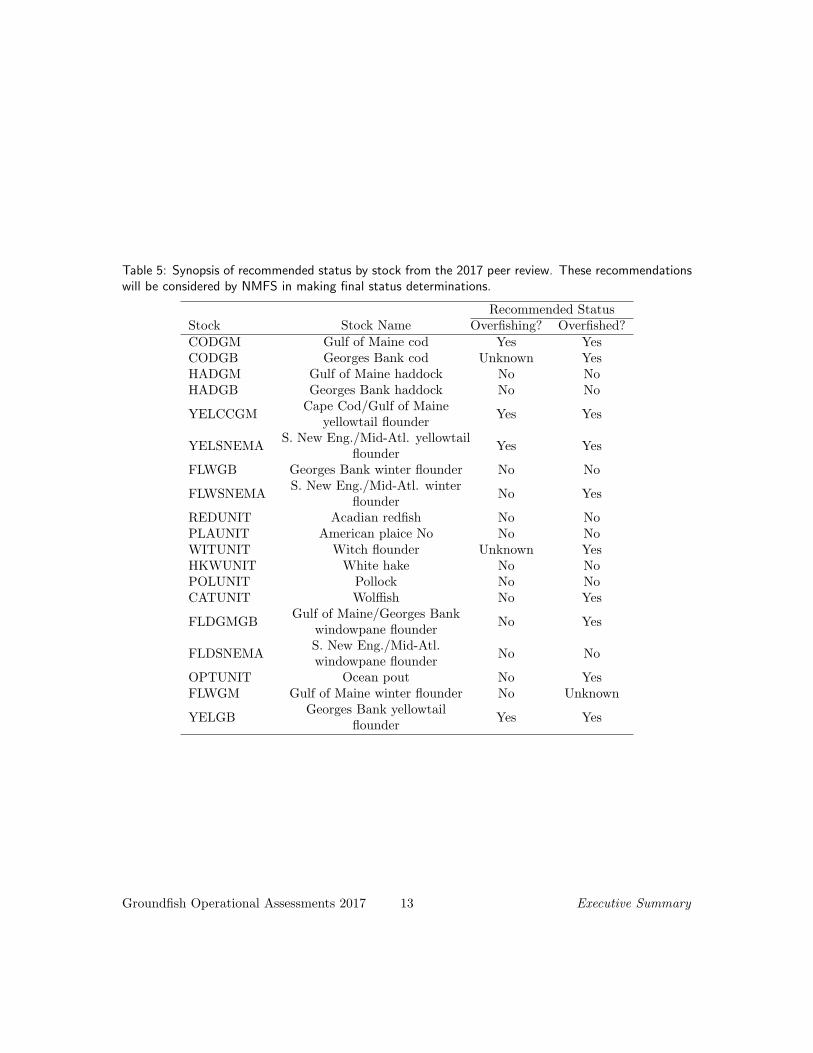
Table 5: Synopsis of recommended status by stock from the 2017 peer review. These recommendationswill be considered by NMFS in making final status determinations.
Recommended StatusStock Stock Name Overfishing? Overfished?CODGM Gulf of Maine cod Yes YesCODGB Georges Bank cod Unknown YesHADGM Gulf of Maine haddock No NoHADGB Georges Bank haddock No No
YELCCGMCape Cod/Gulf of Maine
yellowtail flounder Yes Yes
YELSNEMAS. New Eng./Mid-Atl. yellowtail
flounder Yes Yes
FLWGB Georges Bank winter flounder No No
FLWSNEMAS. New Eng./Mid-Atl. winter
flounder No Yes
REDUNIT Acadian redfish No NoPLAUNIT American plaice No No NoWITUNIT Witch flounder Unknown YesHKWUNIT White hake No NoPOLUNIT Pollock No NoCATUNIT Wolffish No Yes
FLDGMGBGulf of Maine/Georges Bank
windowpane flounder No Yes
FLDSNEMAS. New Eng./Mid-Atl.windowpane flounder No No
OPTUNIT Ocean pout No YesFLWGM Gulf of Maine winter flounder No Unknown
YELGBGeorges Bank yellowtail
flounder Yes Yes
Groundfish Operational Assessments 2017 13 Executive Summary
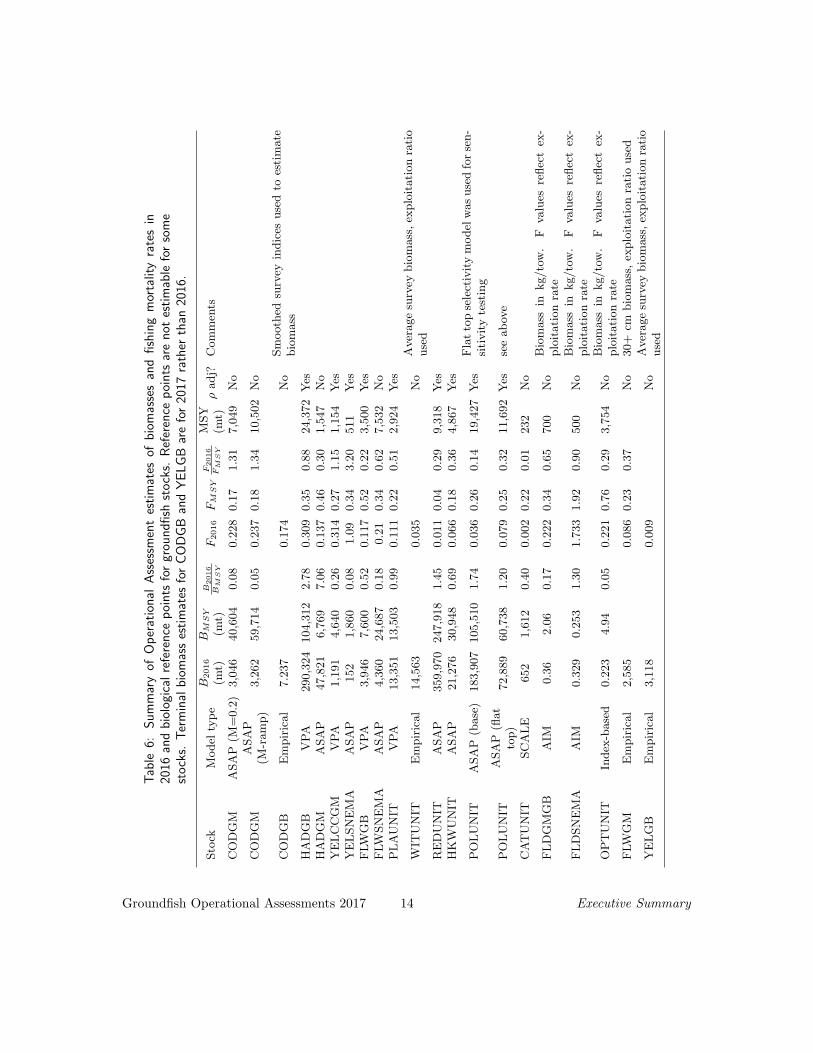
Tab
le6:
Su
mm
ary
ofO
per
atio
nal
Ass
essm
ent
esti
mat
esof
bio
mas
ses
and
fish
ing
mor
talit
yra
tes
in20
16an
db
iolo
gica
lre
fere
nce
poi
nts
for
grou
nd
fish
sto
cks.
Ref
eren
cep
oin
tsar
en
otes
tim
able
for
som
est
ock
s.T
erm
inal
bio
mas
ses
tim
ates
for
CO
DG
Ban
dY
EL
GB
are
for
2017
rath
erth
an20
16.
Sto
ckM
odel
typ
eB
2016
(mt)
BM
SY
(mt)
B2016
BM
SY
F2016F
MS
YF2016
FM
SY
MSY
(mt)
ρadj?
Com
men
ts
CO
DG
MA
SA
P(M
=0.2
)3,0
46
40,6
04
0.0
80.2
28
0.1
71.3
17,0
49
No
CO
DG
MA
SA
P(M
-ram
p)
3,2
62
59,7
14
0.0
50.2
37
0.1
81.3
410,5
02
No
CO
DG
BE
mpir
ical
7.2
37
0.1
74
No
Sm
ooth
edsu
rvey
indic
esuse
dto
esti
mate
bio
mass
HA
DG
BV
PA
290,3
24
104,3
12
2.7
80.3
09
0.3
50.8
824,3
72
Yes
HA
DG
MA
SA
P47,8
21
6,7
69
7.0
60.1
37
0.4
60.3
01,5
47
No
YE
LC
CG
MV
PA
1,1
91
4,6
40
0.2
60.3
14
0.2
71.1
51,1
54
Yes
YE
LSN
EM
AA
SA
P152
1,8
60
0.0
81.0
90.3
43.2
0511
Yes
FLW
GB
VP
A3,9
46
7,6
00
0.5
20.1
17
0.5
20.2
23,5
00
Yes
FLW
SN
EM
AA
SA
P4,3
60
24,6
87
0.1
80.2
10.3
40.6
27,5
32
No
PL
AU
NIT
VP
A13,3
51
13,5
03
0.9
90.1
11
0.2
20.5
12,9
24
Yes
WIT
UN
ITE
mpir
ical
14,5
63
0.0
35
No
Aver
age
surv
eybio
mass
,ex
plo
itati
on
rati
ouse
dR
ED
UN
ITA
SA
P359,9
70
247,9
18
1.4
50.0
11
0.0
40.2
99,3
18
Yes
HK
WU
NIT
ASA
P21,2
76
30,9
48
0.6
90.0
66
0.1
80.3
64,8
67
Yes
PO
LU
NIT
ASA
P(b
ase
)183,9
07
105,5
10
1.7
40.0
36
0.2
60.1
419,4
27
Yes
Fla
tto
pse
lect
ivit
ym
odel
was
use
dfo
rse
n-
siti
vit
yte
stin
g
PO
LU
NIT
ASA
P(fl
at
top)
72,8
89
60,7
38
1.2
00.0
79
0.2
50.3
211,6
92
Yes
see
ab
ove
CA
TU
NIT
SC
AL
E652
1,6
12
0.4
00.0
02
0.2
20.0
1232
No
FL
DG
MG
BA
IM0.3
62.0
60.1
70.2
22
0.3
40.6
5700
No
Bio
mass
inkg/to
w.
Fva
lues
reflec
tex
-plo
itati
on
rate
FL
DSN
EM
AA
IM0.3
29
0.2
53
1.3
01.7
33
1.9
20.9
0500
No
Bio
mass
inkg/to
w.
Fva
lues
reflec
tex
-plo
itati
on
rate
OP
TU
NIT
Index
-base
d0.2
23
4.9
40.0
50.2
21
0.7
60.2
93,7
54
No
Bio
mass
inkg/to
w.
Fva
lues
reflec
tex
-plo
itati
on
rate
FLW
GM
Em
pir
ical
2,5
85
0.0
86
0.2
30.3
7N
o30+
cmbio
mass
,ex
plo
itati
on
rati
ouse
d
YE
LG
BE
mpir
ical
3,1
18
0.0
09
No
Aver
age
surv
eybio
mass
,ex
plo
itati
on
rati
ouse
d
Groundfish Operational Assessments 2017 14 Executive Summary

Tab
le7:
Com
par
ison
ofb
iom
ass
(B)
and
fish
ing
mor
talit
yra
te(F
)M
ohn
’srh
ova
lues
(ρ)
byst
ock
bet
wee
nth
epr
evio
us
asse
ssm
ent
(ρlast)
and
the
2017
(ρ2016)
up
dat
es.
Th
eb
iom
ass
(B2016)
and
fish
ing
mor
talit
yra
te(B
2016)
poi
nt
esti
mat
esan
dρ
adju
sted
valu
es(A
dj.
)ar
epr
ovid
edfo
rth
e20
17op
erat
ion
alas
sess
men
ts.
Sto
cks
usi
ngρ
adju
sted
valu
esin
the
last
asse
ssm
ent
and
the
2017
asse
ssm
ents
(ρad
j.vs
.p
t.es
t.fo
rth
ose
sto
cks
that
did
not
use
theρ
adju
stm
ent)
are
iden
tifi
ed,
alon
gw
ith
the
typ
eofρ
adju
stm
ent
use
din
the
2017
asse
ssm
ent
(NA
A=
nu
mb
ers
atag
e,S
SB
=sp
awn
ing
sto
ckb
iom
ass
app
lied
toal
lag
es),
are
also
prov
ided
.O
nly
age-
bas
edan
dle
ngt
h-b
ased
sto
cks
that
cou
ldex
hib
itre
tros
pec
tive
pat
tern
sar
ein
clu
ded
inth
ista
ble
.M
issi
ngρ
valu
esin
dic
ate
am
inor
retr
osp
ecti
vep
atte
rnw
asfo
un
dan
dn
ore
tros
pec
tive
adju
stm
ents
wer
em
ade.
Sto
ckM
odel
typ
eρ
lastρ2016
B2016
Adj.
ρla
stρ2016F
2016
Adj.
Last
Ass
ess.
2017
Pro
j.A
dj.
CO
DG
MA
SA
P(M
=0.2
)0.5
40.5
33046
1,9
97
-0.3
1-0
.31
0.2
30.3
3pt.
est.
pt.
est.
none
CO
DG
MA
SA
P(M
-ram
p)
0.2
00.3
03262
2,5
02
-0.0
8-0
.17
0.2
40.2
8pt.
est.
pt.
est.
none
HA
DG
MA
SA
P-0
.04
47821
NA
0.0
30.1
4pt.
est.
pt.
est.
none
HA
DG
BV
PA
0.5
00.8
9549938
290,3
24
-0.3
4-0
.63
0.1
10.3
1ρ
adj.
ρadj.
SSB
YE
LC
CG
MV
PA
0.9
80.7
62093
1,1
91
-0.4
5-0
.39
0.1
90.3
1ρ
adj.
ρadj.
NA
AY
EL
SN
EM
AA
SA
P1.0
60.9
7300
152
-0.5
3-0
.47
0.5
81.0
9pt.
est.
ρadj.
NA
AF
LW
GB
VP
A0.8
30.5
46083
3,9
46
-0.5
1-0
.31
0.0
80.1
2ρ
adj.
ρadj.
SSB
FLW
SN
EM
AA
SA
P0.2
14360
NA
-0.2
50.2
1pt.
est.
pt.
est.
none
RE
DU
NIT
ASA
P0.2
60.2
1435852
359,9
70
-0.1
9-0
.18
0.0
10.0
1ρ
adj.
ρadj.
NA
AP
LA
UN
ITV
PA
0.3
20.1
415148
13,3
51
-0.3
2-0
.32
0.0
70.1
1ρ
adj.
ρadj.
NA
AH
KW
UN
ITA
SA
P0.1
80.2
025638
21,2
76
-0.1
3-0
.12
0.0
60.0
7pt.
est.
ρadj.
NA
AP
OL
UN
ITA
SA
P(b
ase
)0.2
80.2
3226371
183,9
07
-0.2
8-0
.28
0.0
30.0
4ρ
adj.
ρadj.
NA
AP
OL
UN
ITA
SA
P(fl
at)
0.4
1102571
72,8
89
-0.3
50.0
50.0
8ρ
adj.
ρadj.
NA
A
Groundfish Operational Assessments 2017 15 Executive Summary

Table 8: The biomass (B) and exploitation rate (F ) values used for status determination may be adjustedto account for a retrospective pattern in some stocks. In general, when the B or F values adjustedfor restrospective pattern (Bρ and Fρ) were outside of the approximate 90% confidence interval (Conf.limits) of the model-estimated B2016 and F2016, the adjusted values were used to determine stock status(Adj. = Yes). There can be exceptions however, such as YELSNEMA and CODGM(M=0.2) in OA2017 and details regarding each decision can be found in the report and reviewer comments sectionsfor each stock in OA 2017. Only stocks that had both an estimable 7-year Mohn’s ρ for B and F andestimable approximate 90% confidence limits on terminal year B and F values are included here.
Stock B2016 Bρ Conf. limits F2016 Fρ Conf. limits Adj?CODGM(M=0.2) 3,046 1,997 2,464 - 4,025 0.228 0.332 0.169 - 0.316 No
CODGM(M ramp) 3,262 2,502 2,487 - 4,270 0.237 0.285 0.172 - 0.331 NoHADGB 549,938 290,324 383,166 - 801,643 0.113 0.309 0.079 - 0.164 Yes
YELSNEMA 300 152 217 - 459 0.58 1.09 0.362 - 0.843 YesYELCCGM 2,093 1,191 1,722 - 2,626 0.193 0.314 0.15 - 0.26 Yes
FLWGB 6,083 3,946 4,898 - 7,812 0.081 0.117 0.064 - 0.106 YesPLAUNIT 15,148 13,351 13,582 - 17,009 0.075 0.111 0.065 - 0.088 YesHKWUNIT 25,638 21,276 21,466 - 30,052 0.058 0.066 0.048 - 0.07 Yes
POLUNIT(base) 226,371 183,907 76,914 - 293,256 0.026 0.036 0.037 - 0.034 YesREDUNIT 435,852 359,970 394,927 - 481,018 0.009 0.011 0.008 - 0.01 Yes
Groundfish Operational Assessments 2017 16 Executive Summary
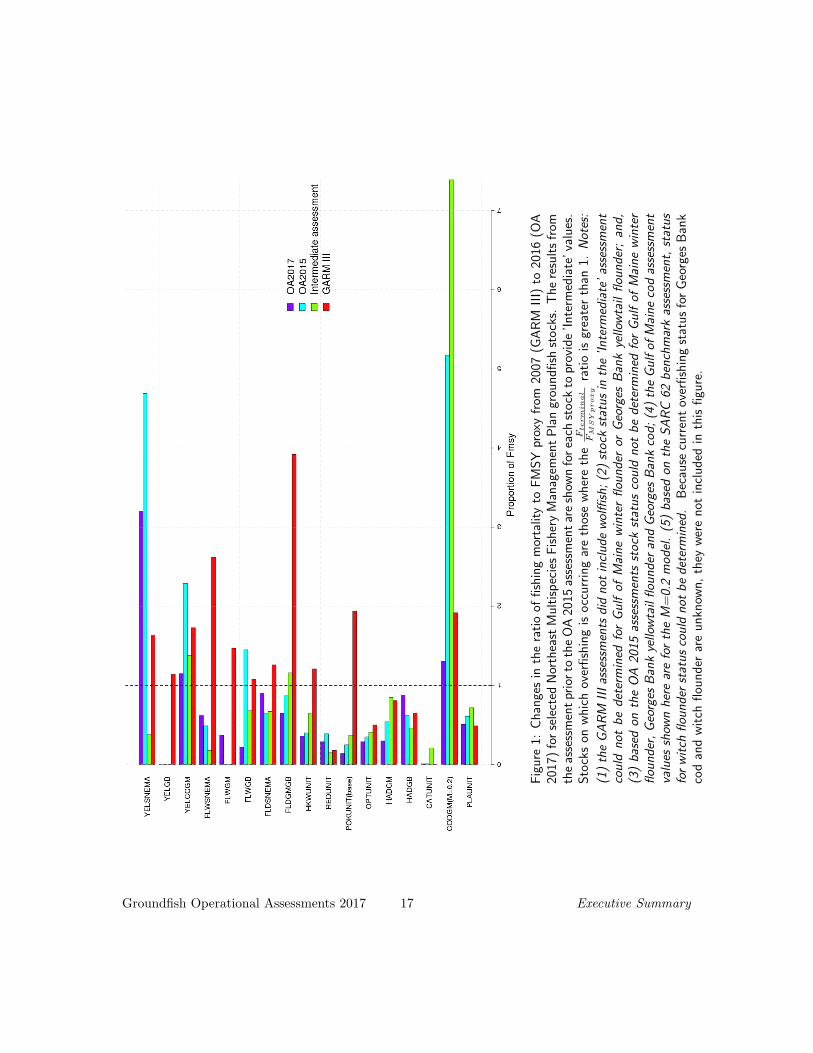
Fig
ure
1:C
han
ges
inth
era
tio
offi
shin
gm
orta
lity
toF
MS
Ypr
oxy
from
2007
(GA
RM
III)
to20
16(O
A20
17)
for
sele
cted
Nor
thea
stM
ult
isp
ecie
sF
ish
ery
Man
agem
ent
Pla
ngr
oun
dfi
shst
ock
s.T
he
resu
lts
from
the
asse
ssm
ent
prio
rto
the
OA
2015
asse
ssm
ent
are
show
nfo
rea
chst
ock
topr
ovid
e’I
nte
rmed
iate
’va
lues
.S
tock
son
wh
ich
over
fish
ing
iso
ccu
rrin
gar
eth
ose
wh
ere
the
Fte
rm
in
al
FM
SY
pr
ox
yra
tio
isgr
eate
rth
an1.
Not
es:
(1)
the
GA
RM
III
asse
ssm
ents
did
not
incl
ud
ew
olffi
sh;
(2)
sto
ckst
atu
sin
the
’In
term
edia
te’
asse
ssm
ent
cou
ldn
otb
ed
eter
min
edfo
rG
ulf
ofM
ain
ew
inte
rfl
oun
der
orG
eorg
esB
ank
yello
wta
ilfl
oun
der
;an
d,
(3)
bas
edon
the
OA
2015
asse
ssm
ents
sto
ckst
atu
sco
uld
not
be
det
erm
ined
for
Gu
lfof
Mai
ne
win
ter
flou
nd
er,
Geo
rges
Ban
kye
llow
tail
flou
nd
eran
dG
eorg
esB
ank
cod
;(4
)th
eG
ulf
ofM
ain
eco
das
sess
men
tva
lues
show
nh
ere
are
for
the
M=
0.2
mo
del
.(5
)b
ased
onth
eS
AR
C62
ben
chm
ark
asse
ssm
ent,
stat
us
for
wit
chfl
oun
der
stat
us
cou
ldn
otb
ed
eter
min
ed.
Bec
ause
curr
ent
over
fish
ing
stat
us
for
Geo
rges
Ban
kco
dan
dw
itch
flou
nd
erar
eu
nkn
own
,th
eyw
ere
not
incl
ud
edin
this
figu
re.
Groundfish Operational Assessments 2017 17 Executive Summary

Fig
ure
2:C
han
ges
inth
era
tio
ofst
ock
bio
mas
stoBMSY
prox
yfr
om20
07(G
AR
MII
I)to
2016
(OA
2017
)fo
rse
lect
edN
orth
east
Mu
ltis
pec
ies
Fis
her
yM
anag
emen
tP
lan
grou
nd
fish
sto
cks.
Th
ere
sult
sfr
omth
eas
sess
men
tpr
ior
toth
eO
A20
15as
sess
men
tar
esh
own
for
each
sto
ckto
prov
ide
’In
term
edia
te’
valu
es.
Sto
cks
that
are
over
fish
edst
ock
sar
eth
ose
wh
ere
the
Bte
rm
in
al
BM
SY
pr
ox
yra
tio
isle
ssth
an0.
5.N
otes
:
(1)
the
GA
RM
III
asse
ssm
ents
did
not
incl
ud
ew
olffi
sh;
(2)
sto
ckst
atu
sin
the
’In
term
edia
te’
asse
ssm
ent
cou
ldn
otb
ed
eter
min
edfo
rG
ulf
ofM
ain
ew
inte
rfl
oun
der
orG
eorg
esB
ank
yello
wta
ilfl
oun
der
;an
d,
(3)
bas
edon
the
OA
2015
asse
ssm
ents
sto
ckst
atu
sco
uld
not
be
det
erm
ined
for
Gu
lfof
Mai
ne
win
ter
flou
nd
er,
Geo
rges
Ban
kye
llow
tail
flou
nd
eran
dG
eorg
esB
ank
cod
;(4
)th
eG
ulf
ofM
ain
eco
das
sess
men
tva
lues
show
nh
ere
are
for
the
M=
0.2
mo
del
.(5
)b
ased
onth
eS
AR
C62
ben
chm
ark
asse
ssm
ent,
stat
us
for
wit
chfl
oun
der
stat
us
cou
ldn
otb
ed
eter
min
ed.
Bec
ause
Geo
rges
Ban
kco
dan
dw
itch
flou
nd
erd
on
otcu
rren
tly
hav
eq
uan
tita
tive
bio
mas
sre
fere
nce
poi
nts
,th
eyw
ere
not
incl
ud
edin
this
figu
re.
Groundfish Operational Assessments 2017 18 Executive Summary
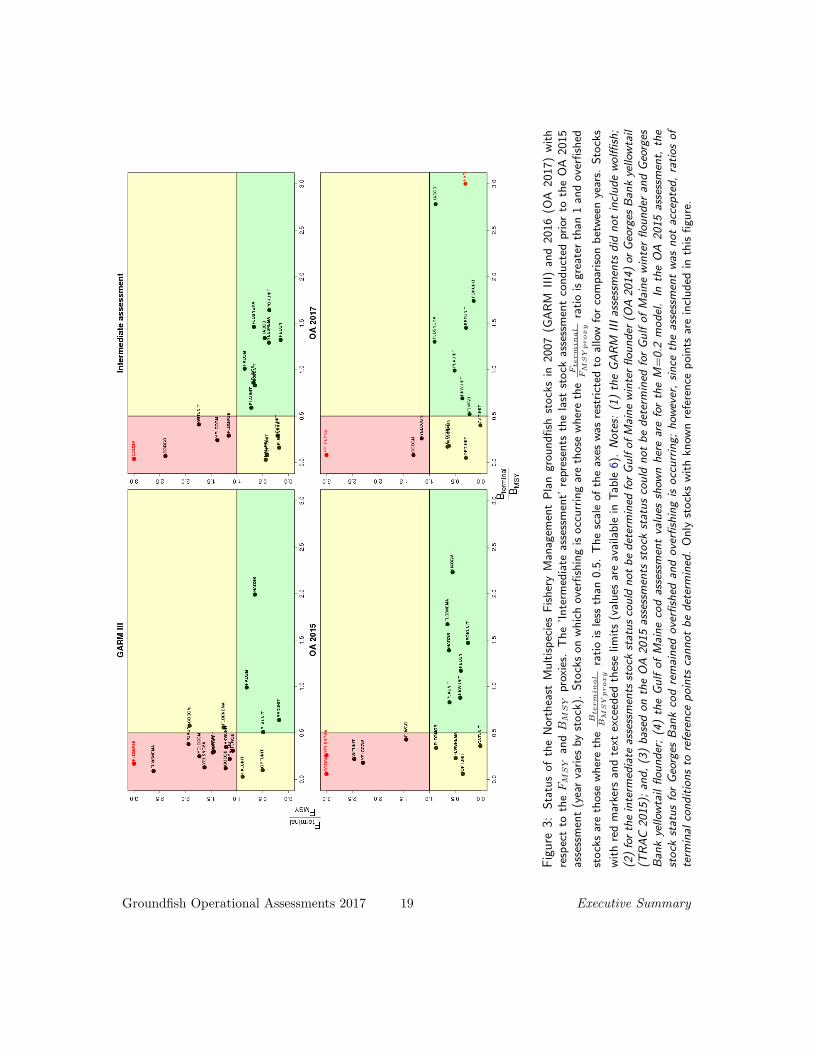
Fig
ure
3:S
tatu
so
fth
eN
orth
east
Mu
ltis
pec
ies
Fis
her
yM
anag
emen
tP
lan
gro
un
dfi
shst
ock
sin
20
07
(GA
RM
III)
and
20
16
(OA
20
17
)w
ith
resp
ect
toth
eF
MS
Yan
dB
MS
Ypr
oxie
s.T
he
’In
term
edia
teas
sess
men
t’re
pres
ents
the
last
sto
ckas
sess
men
tco
nd
uct
edpr
ior
toth
eO
A2
01
5as
sess
men
t(y
ear
vari
esby
sto
ck).
Sto
cks
on
wh
ich
ove
rfish
ing
iso
ccu
rrin
gar
eth
ose
wh
ere
the
Fte
rm
in
al
FM
SY
pr
ox
yra
tio
isg
reat
erth
an1
and
ove
rfish
ed
sto
cks
are
tho
sew
her
eth
eB
te
rm
in
al
BM
SY
pr
ox
yra
tio
isle
ssth
an0
.5.
Th
esc
ale
of
the
axes
was
rest
rict
edto
allo
wfo
rco
mp
aris
on
bet
wee
nye
ars.
Sto
cks
wit
hre
dm
arke
rsan
dte
xtex
ceed
edth
ese
limit
s(v
alu
esar
eav
aila
ble
inT
able
6).
No
tes:
(1)
the
GA
RM
III
asse
ssm
ents
did
no
tin
clu
de
wo
lffish
;(2
)fo
rth
ein
term
edia
teas
sess
men
tsst
ock
stat
us
cou
ldn
ot
be
det
erm
ined
for
Gu
lfo
fM
ain
ew
inte
rfl
ou
nd
er(O
A2
01
4)
orG
eorg
esB
ank
yello
wta
il(T
RA
C2
01
5);
and
,(3
)b
ased
on
the
OA
20
15
asse
ssm
ents
sto
ckst
atu
sco
uld
no
tb
ed
eter
min
edfo
rG
ulf
of
Mai
ne
win
ter
flo
un
der
and
Geo
rges
Ban
kye
llow
tail
flo
un
der
;(4
)th
eG
ulf
of
Mai
ne
cod
asse
ssm
ent
valu
essh
own
her
ear
efo
rth
eM
=0
.2m
od
el.
Inth
eO
A2
01
5as
sess
men
t,th
est
ock
stat
us
for
Geo
rges
Ban
kco
dre
mai
ned
ove
rfish
edan
do
verfi
shin
gis
occ
urr
ing
;h
owev
er,
sin
ceth
eas
sess
men
tw
asn
ot
acce
pte
d,
rati
os
of
term
inal
con
dit
ion
sto
refe
ren
cep
oin
tsca
nn
ot
be
det
erm
ined
.O
nly
sto
cks
wit
hkn
own
refe
ren
cep
oin
tsar
ein
clu
ded
inth
isfi
gu
re.
Groundfish Operational Assessments 2017 19 Executive Summary
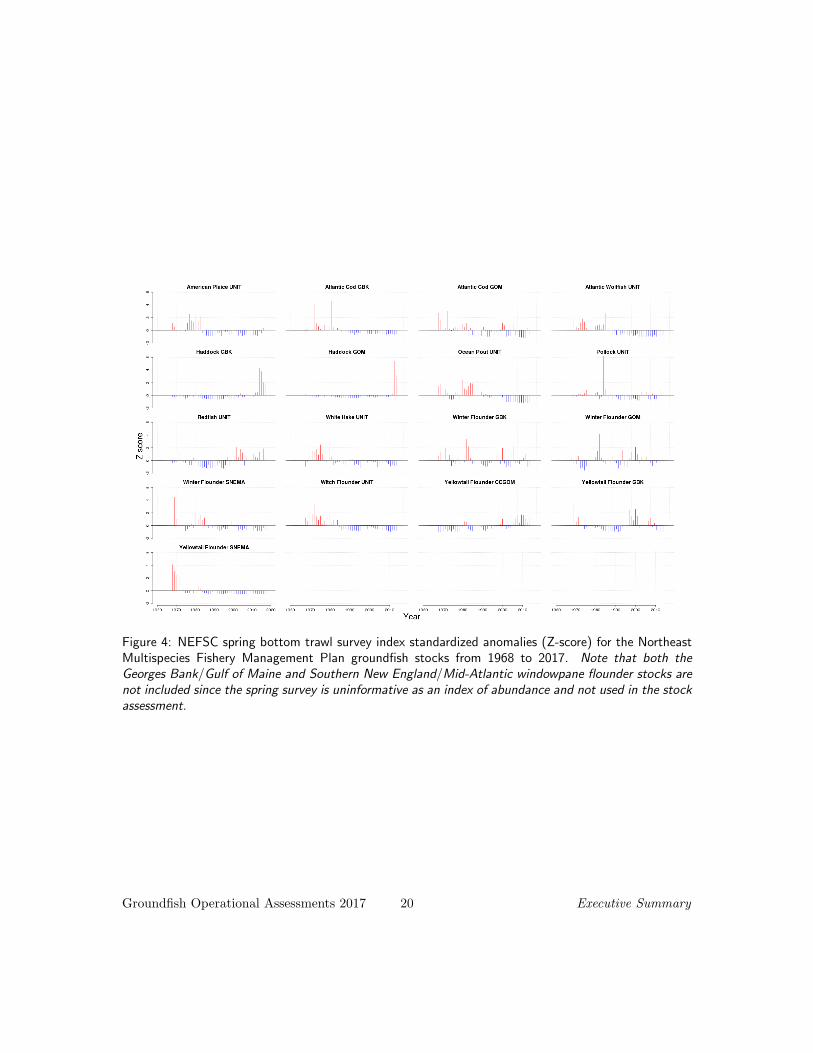
Figure 4: NEFSC spring bottom trawl survey index standardized anomalies (Z-score) for the NortheastMultispecies Fishery Management Plan groundfish stocks from 1968 to 2017. Note that both theGeorges Bank/Gulf of Maine and Southern New England/Mid-Atlantic windowpane flounder stocks arenot included since the spring survey is uninformative as an index of abundance and not used in the stockassessment.
Groundfish Operational Assessments 2017 20 Executive Summary
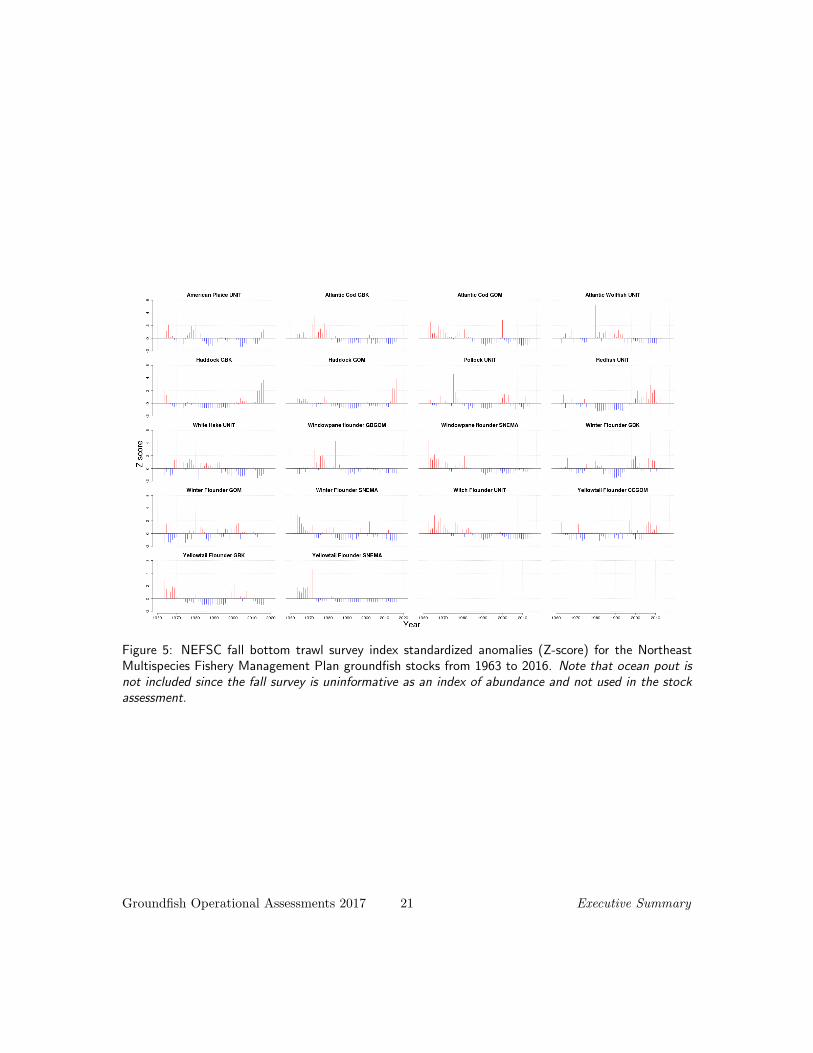
Figure 5: NEFSC fall bottom trawl survey index standardized anomalies (Z-score) for the NortheastMultispecies Fishery Management Plan groundfish stocks from 1963 to 2016. Note that ocean pout isnot included since the fall survey is uninformative as an index of abundance and not used in the stockassessment.
Groundfish Operational Assessments 2017 21 Executive Summary
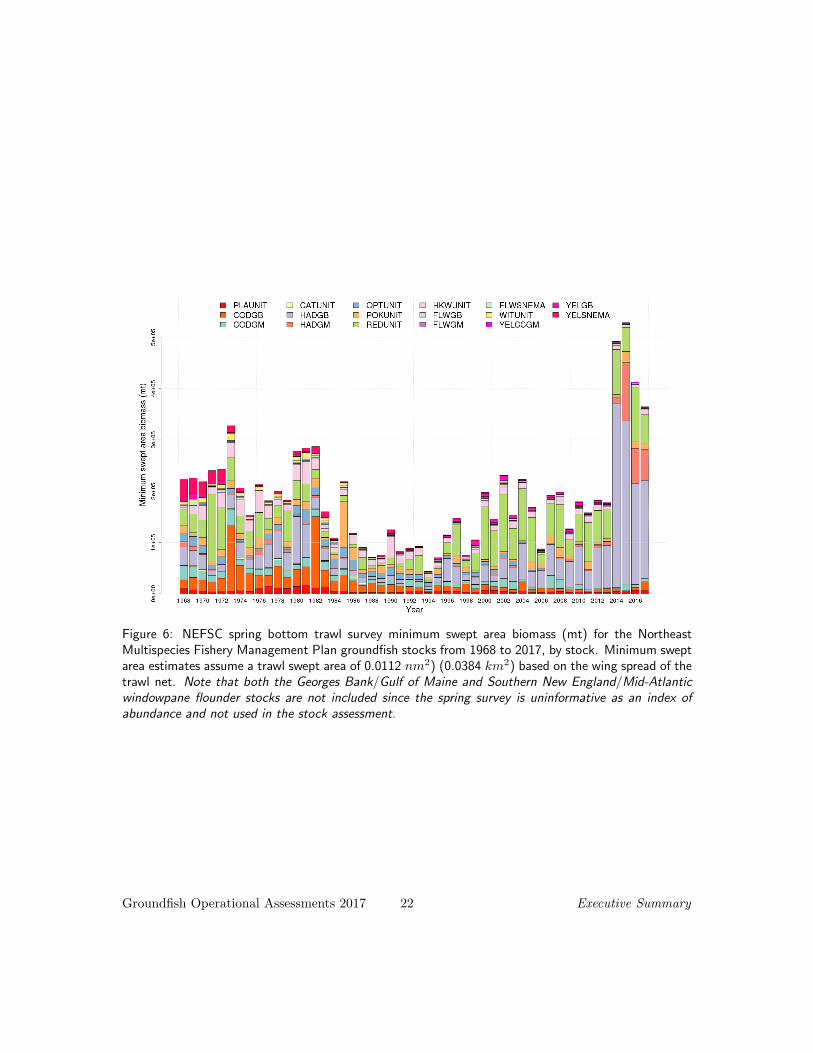
Figure 6: NEFSC spring bottom trawl survey minimum swept area biomass (mt) for the NortheastMultispecies Fishery Management Plan groundfish stocks from 1968 to 2017, by stock. Minimum sweptarea estimates assume a trawl swept area of 0.0112 nm2) (0.0384 km2) based on the wing spread of thetrawl net. Note that both the Georges Bank/Gulf of Maine and Southern New England/Mid-Atlanticwindowpane flounder stocks are not included since the spring survey is uninformative as an index ofabundance and not used in the stock assessment.
Groundfish Operational Assessments 2017 22 Executive Summary
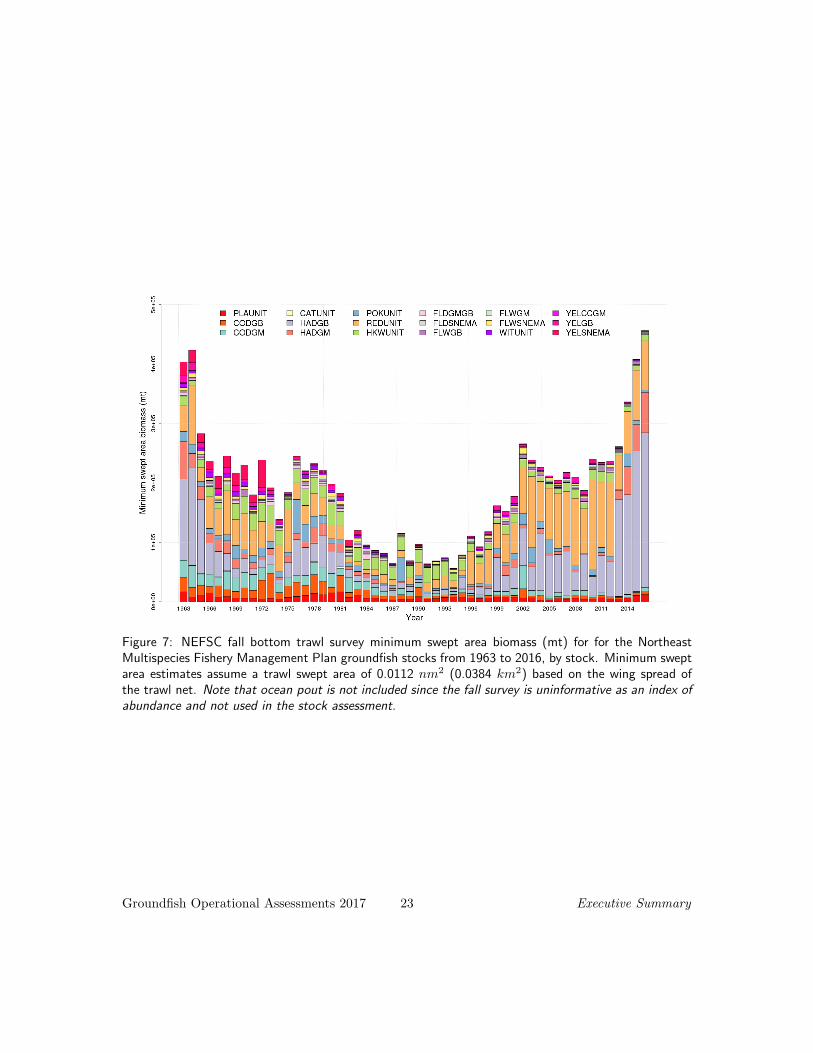
Figure 7: NEFSC fall bottom trawl survey minimum swept area biomass (mt) for for the NortheastMultispecies Fishery Management Plan groundfish stocks from 1963 to 2016, by stock. Minimum sweptarea estimates assume a trawl swept area of 0.0112 nm2 (0.0384 km2) based on the wing spread ofthe trawl net. Note that ocean pout is not included since the fall survey is uninformative as an index ofabundance and not used in the stock assessment.
Groundfish Operational Assessments 2017 23 Executive Summary
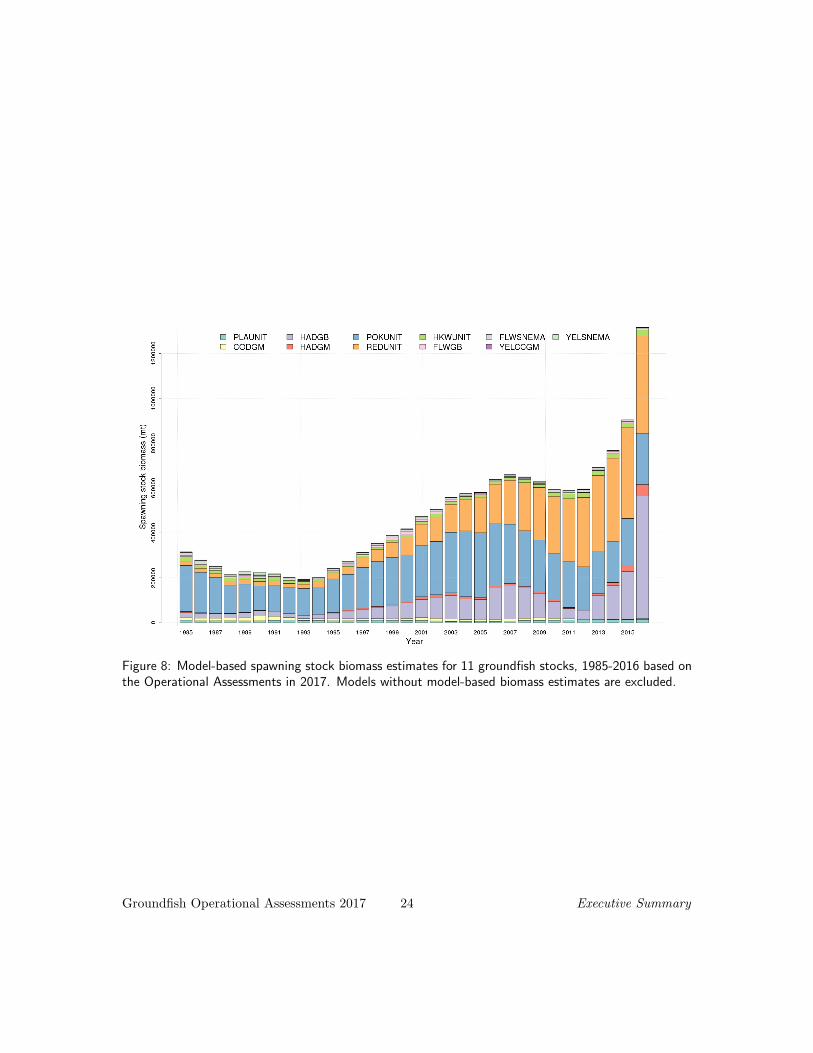
Figure 8: Model-based spawning stock biomass estimates for 11 groundfish stocks, 1985-2016 based onthe Operational Assessments in 2017. Models without model-based biomass estimates are excluded.
Groundfish Operational Assessments 2017 24 Executive Summary
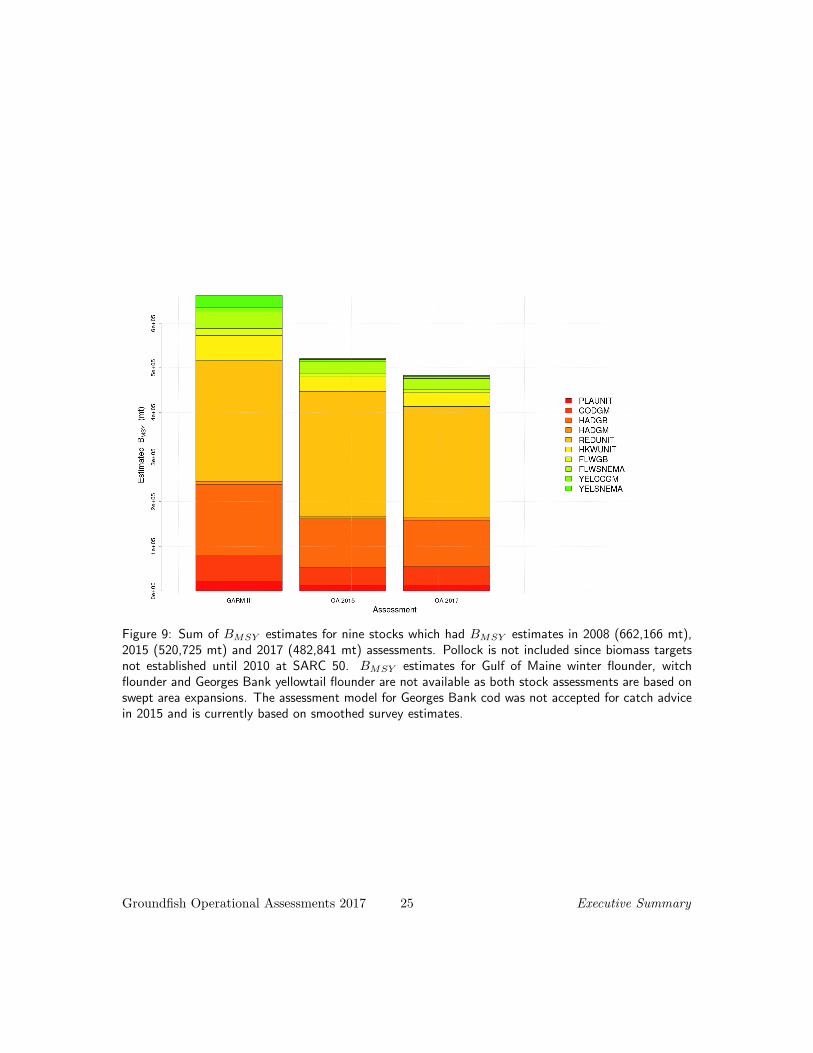
Figure 9: Sum of BMSY estimates for nine stocks which had BMSY estimates in 2008 (662,166 mt),2015 (520,725 mt) and 2017 (482,841 mt) assessments. Pollock is not included since biomass targetsnot established until 2010 at SARC 50. BMSY estimates for Gulf of Maine winter flounder, witchflounder and Georges Bank yellowtail flounder are not available as both stock assessments are based onswept area expansions. The assessment model for Georges Bank cod was not accepted for catch advicein 2015 and is currently based on smoothed survey estimates.
Groundfish Operational Assessments 2017 25 Executive Summary