1 gujarat energy transmission corporation limited grid related issues in case of wind/solar based...
TRANSCRIPT
1
GUJARAT ENERGY TRANSMISSION CORPORATION LIMITED
Grid related issues in case of Wind/Solarbased Generation in Gujarat
07th February, 2009
S. K. NegiManaging Director
2
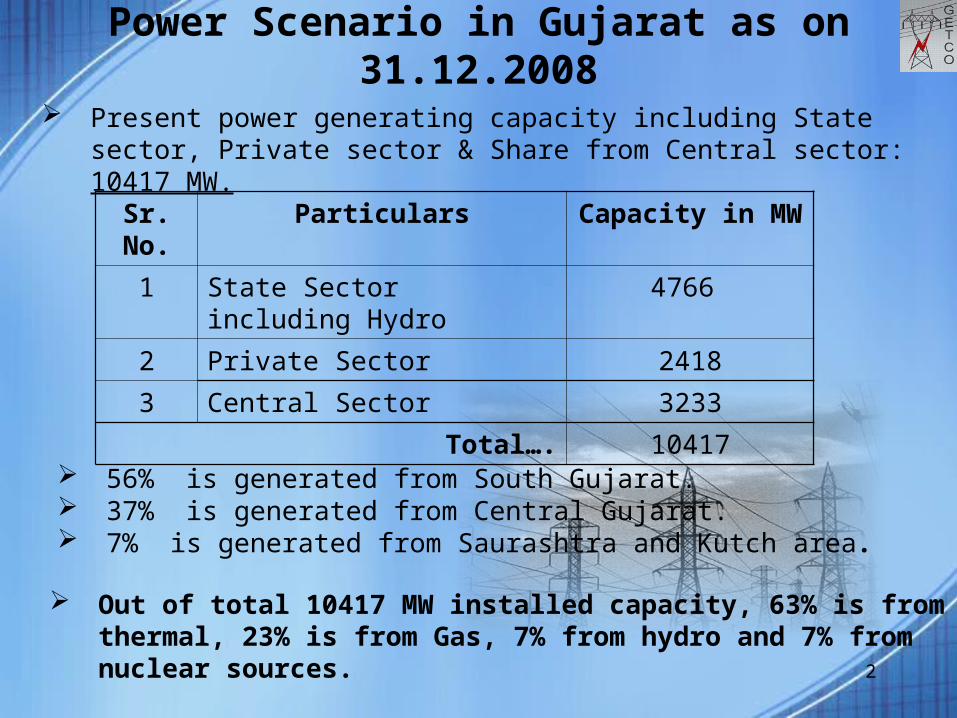
Power Scenario in Gujarat as on 31.12.2008
Present power generating capacity including State sector, Private sector & Share from Central sector: 10417 MW.
Sr. No.
Particulars Capacity in MW
1 State Sector including Hydro 4766
2 Private Sector 2418
3 Central Sector 3233
Total…. 10417
56% is generated from South Gujarat. 37% is generated from Central Gujarat. 7% is generated from Saurashtra and Kutch area.
Out of total 10417 MW installed capacity, 63% is from thermal, 23% is from Gas, 7% from hydro and 7% from nuclear sources.
3
Future Power Scenario in Gujarat
Sr. No.
Particulars Capacity addition during 11th FYP in MW
Capacity in MW
1 State Sector including Hydro
1785 6551
2 Private Sector 5690 8108
3 Central Sector 2042 5275
Total…. 9752 19934
4 After March-2012 3000 (1900 MW Private sector + 1100 MW Central
sector)
22934
Total…. 12752 22934 52% is generated from South Gujarat. 31% is generated from Central Gujarat. 27% is generated from Saurashtra and Kutch area. 4000 MW Mundra, UMPP is also located at Mundra in Dist: Kutch. Out of total 19934 MW installed capacity, 67% is from thermal, 26%
is from Gas, 4% from hydro and 3% from nuclear sources.
4
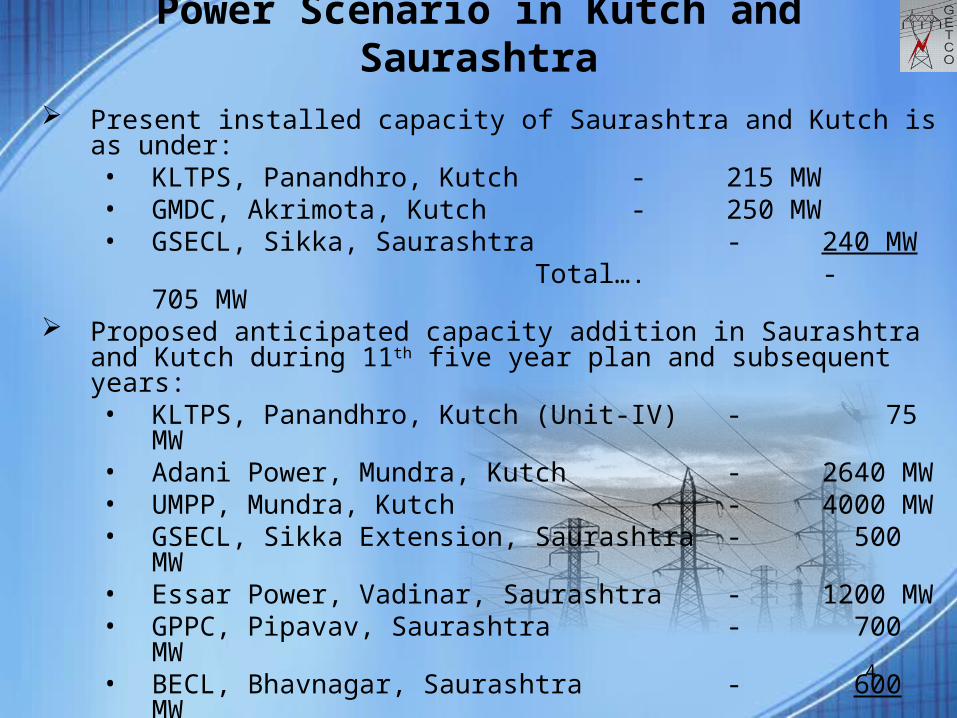
Power Scenario in Kutch and Saurashtra
Present installed capacity of Saurashtra and Kutch is as under:• KLTPS, Panandhro, Kutch - 215 MW• GMDC, Akrimota, Kutch - 250 MW• GSECL, Sikka, Saurashtra - 240 MW
Total…. - 705 MW Proposed anticipated capacity addition in Saurashtra and Kutch during
11th five year plan and subsequent years:• KLTPS, Panandhro, Kutch (Unit-IV) - 75 MW• Adani Power, Mundra, Kutch - 2640 MW• UMPP, Mundra, Kutch - 4000 MW• GSECL, Sikka Extension, Saurashtra - 500 MW• Essar Power, Vadinar, Saurashtra - 1200 MW• GPPC, Pipavav, Saurashtra - 700 MW• BECL, Bhavnagar, Saurashtra - 600 MW
Total…. - 9715 MW In addition to this, in Western Gujarat itself the approved proposals for
integration of Wind power are around 3600 MW.
5
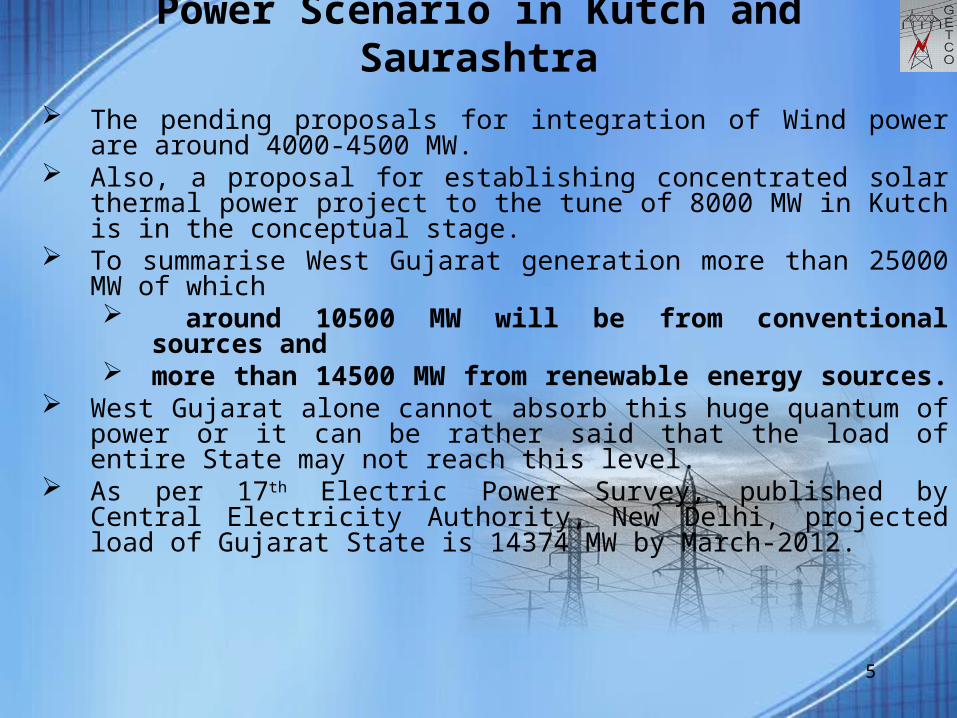
Power Scenario in Kutch and Saurashtra
The pending proposals for integration of Wind power are around 4000-4500 MW.
Also, a proposal for establishing concentrated solar thermal power project to the tune of 8000 MW in Kutch is in the conceptual stage.
To summarise West Gujarat generation more than 25000 MW of which around 10500 MW will be from conventional sources and more than 14500 MW from renewable energy sources.
West Gujarat alone cannot absorb this huge quantum of power or it can be rather said that the load of entire State may not reach this level.
As per 17th Electric Power Survey, published by Central Electricity Authority, New Delhi, projected load of Gujarat State is 14374 MW by March-2012.

6
Amendment in Wind Farm Policy 2007• The Government of Gujarat through GR No: WND 11–2008–2321–B dated 7th January 2009, has made
amendments in the Wind Power Policy – 2007 notified earlier through GR No: EDA-102001-3054-B dated 13th June 2007 .Wheeling of power to consumption site at 66 KV voltage level and above:-
• The wheeling of electricity generated from the Wind Turbine Generators (WTGs), to the desired location(s) within the State, shall be allowed on payment of transmission charges, and transmission losses otherwise applicable to normal Open Access Customer.Wheeling of power to consumption site below 66 KV voltage level.
• The wheeling of electricity generated from the WTGs, to the desired location(s) within the State, shall be allowed on payment of transmission charges, otherwise applicable to normal Open Access Consumer, and transmission and wheeling losses @ 10% of the energy fed to the grid.
• The wheeling of electricity generated by smaller investors, having only one WTG in the State, to the desired location(s), shall be allowed on payment of transmission charges, otherwise applicable to normal open access consumer, and transmission and wheeling losses @7% of the energy fed to the grid.
• Wind farm owner desiring to wheel electricity to more than two locations shall pay 5 paise per unit on energy fed in the grid to concerned Distribution Company in whose area, power is consumed in addition to above mentioned transmission charges and losses, as applicable
• The electricity generated from the WTGs commissioned from 1st April, 2009, may be sold to GUVNL and/or any Distribution Licensee within the state, at a rate of Rs. 3.50 per unit of electricity for the entire period of PPA .
• GUVNL and / or any Distribution licensee may purchase surplus power from WTGs wheeling power for their captive use after adjustment of energy against consumption at recipient unit (s) at a rate of 85% of tariff applicable to WTGs (commissioned in same tariff block) selling power to GUVNL and /or any Distribution licensee.
• GETCO is required to erect evacuation facilities beyond 100 kms between Wind Farm sub-station to GETCO sub-station
• As per the amended Wind Power Policy -2007, GETCO is required to collect Bank Guarantee @ Rs. 5 lacs per MW based on allotment of transmission capacity and in case the Developer fails to achieve Commercial Operation within the one year period in case of installed capacity up to 100 MW, two years in case of installed capacity from 201 MW to 400 MW and three years in case of installed capacity from 401 MW to 600 MW, the Bank Guarantee shall be forfeited by GETCO.
7
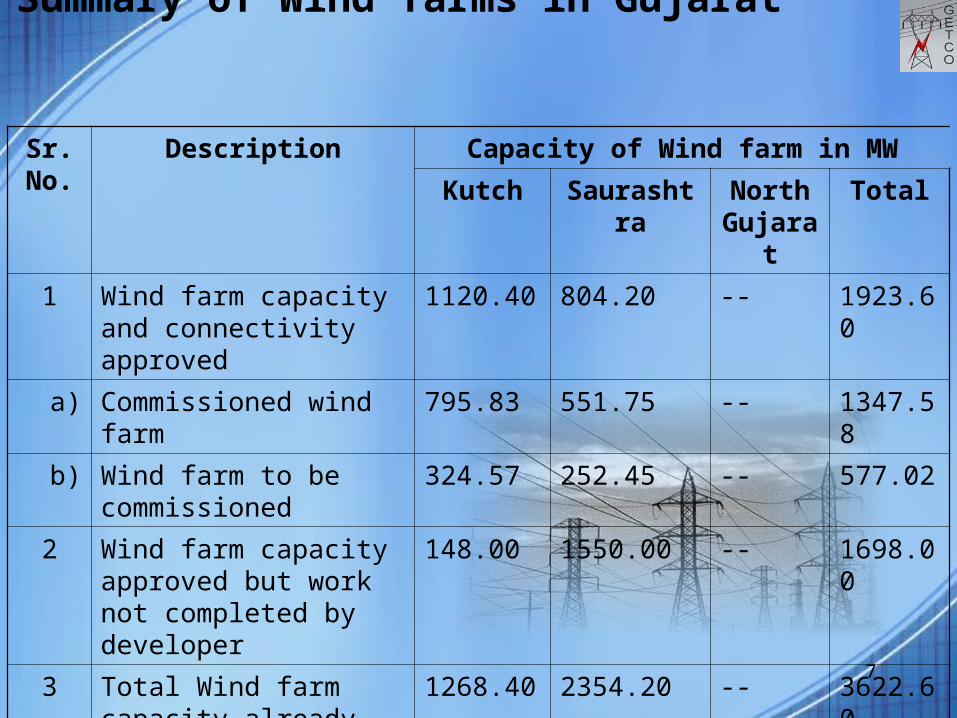
Summary of Wind farms in Gujarat
Sr. No.
Description Capacity of Wind farm in MW
Kutch Saurashtra North Gujarat
Total
1 Wind farm capacity and connectivity approved
1120.40 804.20 -- 1923.60
a) Commissioned wind farm 795.83 551.75 -- 1347.58
b) Wind farm to be commissioned
324.57 252.45 -- 577.02
2 Wind farm capacity approved but work not completed by developer
148.00 1550.00 -- 1698.00
3 Total Wind farm capacity already approved (1+2)
1268.40 2354.20 -- 3622.60
4 Pending proposals 1925.00 2335.00 650.00 4910.00

8
Sr. No.
Name of Wind Farms Name of S/SApproved
Capacity in MWInstalled
Capacity in MW
1 Shikarpur, Kutch 132 KV Samakhiali 85.4 46.10
2 Shikarpur, Kutch 66 KV Shivlakha 50.0 16.50
3 Changadai, Kutch 66 KV Bayath 25.0 25.00
4 Vanku, Kutch 66 KV Kothara 50.0 47.90
5 Jangi, Kutch 66 KV Samakhiali 100.0 76.50
6 Layja, Kutch 66 KV Don 50.0 37.50
7 Chandrodi, Kutch 66 KV Shivlakha 55.0 + 55.0 26.03
8 Vandhiya, Kutch 220 KV Shivlakha 150.0 75.60
9 Suthari & Sindhori, Kutch 220 KV Nanikhakhar 500.0 444.70
10 Patelka, Jamnagar 66 KV Kalyanpur 15.0 13.73
11 Ukharala, Bhavnagar 66 KV Mamsa 13.2 13.20
12 Mervadar, Junagadh 66 KV Sardargadh 30.0 20.72
13 Bamansa, Jamnagar 132 KV Bhatia 170.0 92.23
14 Navadara, Jamnagar 66 KV Bhatia 45.0 35.88
15 Bhogat, Jamnagar 66 KV Bhatia & Lamba 30.0 24.85
16 Lambha & Gandhavi, Jamnagar 66 KV Bhatia 60.0 54.20
17 Dhank, Junagadh 66 KV Sardargadh 60.0 32.94
18 Okha, Okhamadhi, Jamnagar 66 KV Bhatia 4.0 4.00
19 Samana, Junagadh220 KV Motipaneli & Sardargadh
340.0 238.40
20 Kuchhadi, Porbandar 66 KV Bokhira 25.0 21.60
21 Sanodar, Junagadh 66 KV Tansa 12.0 0.00
Total 1923.6 1347.58
Existing Wind farms in Gujarat

9
Sr. No.
Name of Wind Farms Name of S/S MW
1 Bita Valadiya, Kutch 66 KV Khedoi 50
2 Bayath, Kutch 66 KV Bayath 18
3 Mithi Rohar, Kutch 66 KV Mithirohar 80
Total in Kutch 148 MW1 Bojapuri, Rajkot 66 KV Sardhar 70
2 Korana, Rajkot 66 KV Kuvadava 70
3 Pipadia Agaba, Rajkot 66 KV Kagadadi 70
4 Amarsar, Rajkot 66 KV Mahika 70
5 Pipadia Agaba, Rajkot 66 KV Taraghadi 60
6 Pratapgadh, Rajkot 66 KV Bangavadi 60
7 Kotda Nayani, Rajkot 66 KV Jadeshwar 60
8 Momana, Jamnagar 66 KV Morvadi 50
9 Baradiya, Jamnagar 66 KV Varvala 25
10 Wankia, Gondal 66 KV Jasdan-II 50
11 Visavada, Porbandar 66 KV Visavada 25
12 Varvala, Jamnagar 66 KV Varvala 35
Proposed Wind farms in Gujarat (Approved and work under progress)
10
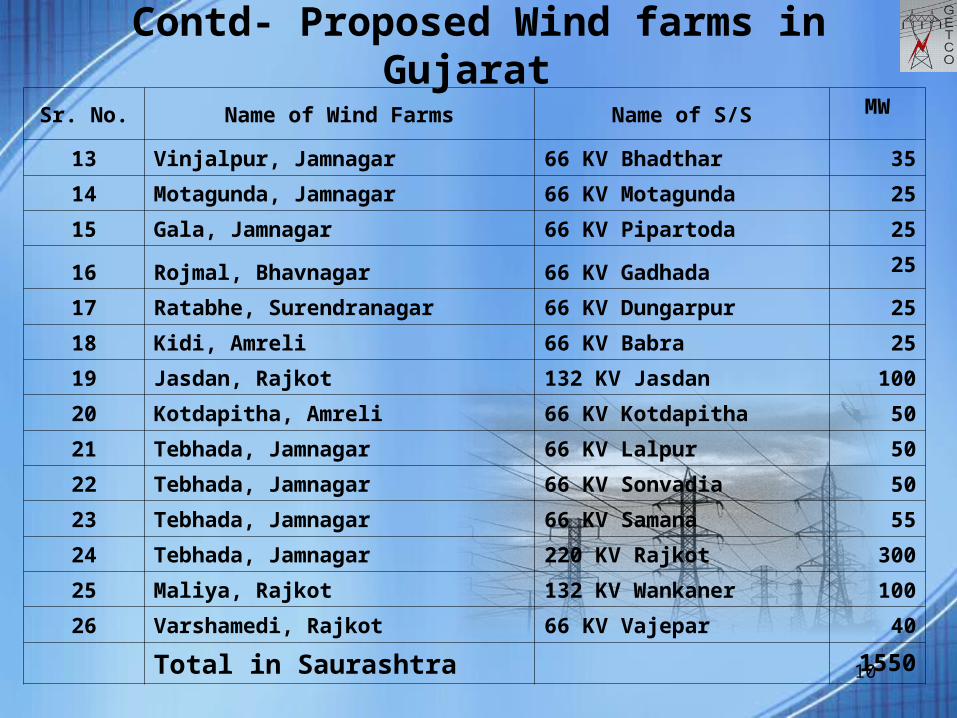
Contd- Proposed Wind farms in Gujarat
Sr. No. Name of Wind Farms Name of S/S MW
13 Vinjalpur, Jamnagar 66 KV Bhadthar 35
14 Motagunda, Jamnagar 66 KV Motagunda 25
15 Gala, Jamnagar 66 KV Pipartoda 25
16 Rojmal, Bhavnagar 66 KV Gadhada 25
17 Ratabhe, Surendranagar 66 KV Dungarpur 25
18 Kidi, Amreli 66 KV Babra 25
19 Jasdan, Rajkot 132 KV Jasdan 100
20 Kotdapitha, Amreli 66 KV Kotdapitha 50
21 Tebhada, Jamnagar 66 KV Lalpur 50
22 Tebhada, Jamnagar 66 KV Sonvadia 50
23 Tebhada, Jamnagar 66 KV Samana 55
24 Tebhada, Jamnagar 220 KV Rajkot 300
25 Maliya, Rajkot 132 KV Wankaner 100
26 Varshamedi, Rajkot 66 KV Vajepar 40
Total in Saurashtra 1550

11
Sr. No. Name of Wind Farms Name of S/S as per proposal MW
1 Kutch Belt 400 KV Halvad 1000
2 Khodasar, Kutch 66 KV Shivlakha 100
3 Adesar, Kutch 66 KV Bhimasar 25
4 Vinjahan, Kutch 66 KV Gsdhshisa 50
5 Ghunai, Kutch 66 KV Dahisara 50
6 Mothala, Kutch 66 KV Mothala 50
7 Suthari, Kutch -- 300
8 Adesar, Kutch 66 KV Bhimasar 100
9 Vandhiya, Kutch 220 KV Shivlakha 150
10 Naliya Timba, Kutch 66 KV Pragpar 50
11 Shivlakha, Kutch 66 KV Shivlakha 50
Total in Kutch-1925 MW
1 Thala, Surendranagar 220 KV Dhrangadhra 300
2 Chotila, Surendranagar 66 KV Mahika 50
3 Gorser, Porbandar 66 KV Madhavpur 25
4 Samana, Jamnagar 220 KV Jetpur 270
5 Jamjodhpur, Jamnagar 220 KV Sardargadh 180
6 Charbara, Jamnagar 66 KV Vadatara 50
7 Sultanpur, Jamnagar 66 KV Babarzar 70
8 Datha, Bhavnagar 66 KV Datha 100
9 Matalpur, Bhavnagar 66 KV Bagdana 100
Proposed Wind farms in Gujarat Not approved wind farm projects)
12
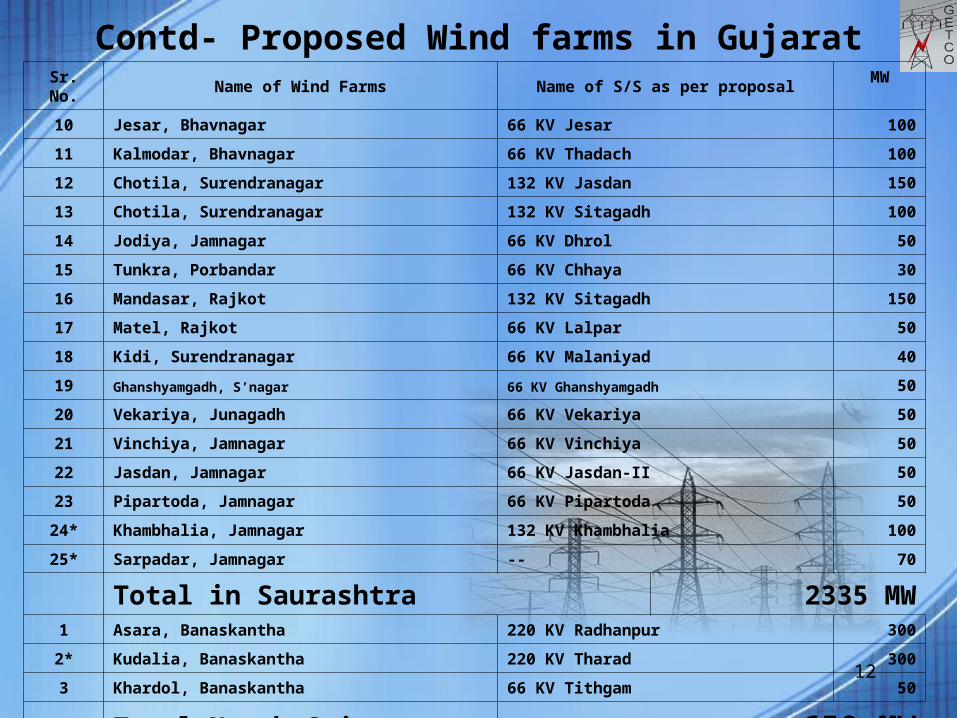
Contd- Proposed Wind farms in GujaratSr. No. Name of Wind Farms Name of S/S as per proposal MW
10 Jesar, Bhavnagar 66 KV Jesar 100
11 Kalmodar, Bhavnagar 66 KV Thadach 100
12 Chotila, Surendranagar 132 KV Jasdan 150
13 Chotila, Surendranagar 132 KV Sitagadh 100
14 Jodiya, Jamnagar 66 KV Dhrol 50
15 Tunkra, Porbandar 66 KV Chhaya 30
16 Mandasar, Rajkot 132 KV Sitagadh 150
17 Matel, Rajkot 66 KV Lalpar 50
18 Kidi, Surendranagar 66 KV Malaniyad 40
19 Ghanshyamgadh, S’nagar 66 KV Ghanshyamgadh 50
20 Vekariya, Junagadh 66 KV Vekariya 50
21 Vinchiya, Jamnagar 66 KV Vinchiya 50
22 Jasdan, Jamnagar 66 KV Jasdan-II 50
23 Pipartoda, Jamnagar 66 KV Pipartoda 50
24* Khambhalia, Jamnagar 132 KV Khambhalia 100
25* Sarpadar, Jamnagar -- 70
Total in Saurashtra 2335 MW1 Asara, Banaskantha 220 KV Radhanpur 300
2* Kudalia, Banaskantha 220 KV Tharad 300
3 Khardol, Banaskantha 66 KV Tithgam 50
Total North Gujarat 650 MW
13
Growing concern for the environmental degradation has led to the world’s interest in renewable energy resources. Wind is commercially and operationally the most viable renewable energy resource and accordingly, emerging as one of the largest source in terms of the renewable energy sector.
Wind is the natural movement of air across the land or sea. Wind is caused by uneven heating and cooling of the earth’s surface and by the earth’s rotation. Land and water areas absorb and release different amount of heat received from the sun. As warm air rises, cooler air rushes in to take its place, causing local winds. The rotation of the earth changes the direction of the flow of air.
This type of energy harnesses the power of the wind to propel the blades of wind turbines. These turbines cause the rotation of magnets, which creates electricity.
Wind Energy
14
Wind Energy as a source of electricity has following advantages:
Wind power produces no water or air pollution that can contaminate the environment,
Power from the wind does not contribute to global warming because it does not generate greenhouse gases,
Wind generation is a renewable source of energy, which means that we will never run out of it. Fuel source is free, abundant and inexhaustible,
Extremely low operating cost, Less commissioning period, Creates employment, regional growth and innovation, Reduces poverty through improved energy access, It is very good as a fuel saver.
Wind Energy

15
At the same time, wind has some peculiar characteristics :
Wind is unpredictable; therefore, wind power is not predictably available. When the wind speed decreases less electricity is generated. This makes wind power unsuitable for base load generation.
Limited control or no control on generation. Drastic variation in generation due to variation in wind speed.
(As shown in the graph). Electricity produced by wind power sometimes fluctuates in voltage
and power factor, which can cause difficulties in linking its power to a utility system.
Because winds do not blow strongly enough to produce power all the time, energy from wind machines is considered “intermittent,” that is, it comes and goes. Thus, the average plant load factor of wind generators is very low to the tune of 15-20%. Therefore, utility companies can use it for only part of their total energy needs.
Wind Energy
16
The maximum wind generation is available during monsoon / off-peak period of the year when the total system demand crashes by about 40-50% and it becomes very difficult for the load dispatcher to handle the system effectively. In other words, it can be said that the wind energy is available in abundance when not needed and not available when needed most.
Wind energy being green power and excessively available in monsoon, the load dispatcher is compelled to back down even the cheaper, firm and reliable power from thermal and hydro power stations.
Depends upon wind velocity. Geographical locations , potential of wind. Limited potential area. Proximity to the load centre. In Gujarat, Kutch & Saurashtra are identified has a good potential
of wind energy.
Wind Energy
17
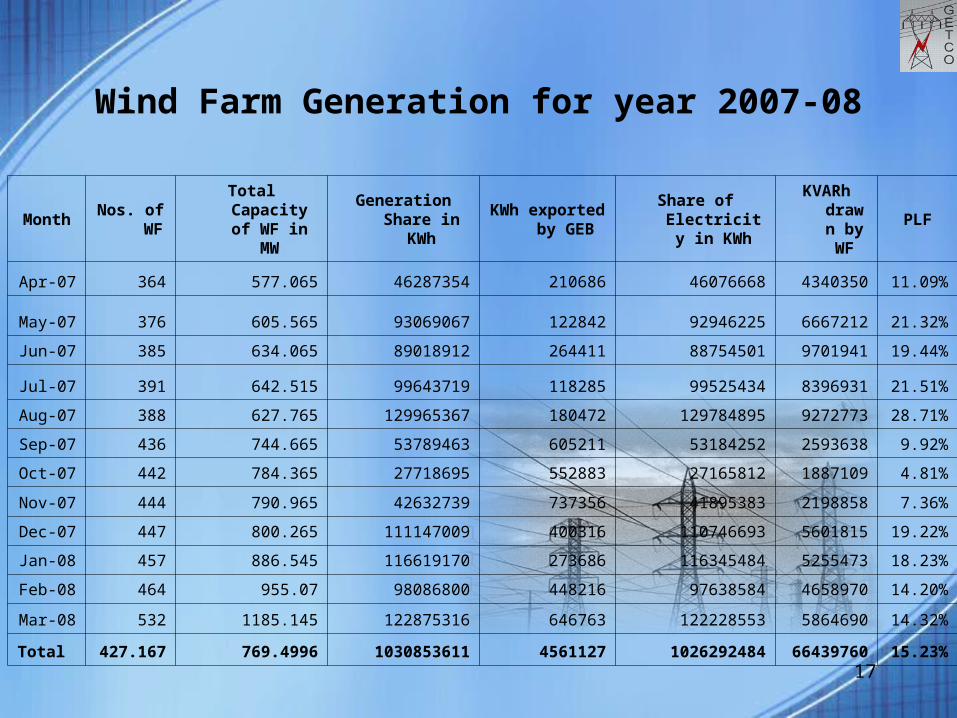
Wind Farm Generation for year 2007-08
MonthNos. of
WFTotal Capacity of
WF in MW
Generation Share in
KWh
KWh exported by GEB
Share of Electricity in
KWh
KVARh drawn
by WF
PLF
Apr-07 364 577.065 46287354 210686 46076668 4340350 11.09%
May-07 376 605.565 93069067 122842 92946225 6667212 21.32%
Jun-07 385 634.065 89018912 264411 88754501 9701941 19.44%
Jul-07 391 642.515 99643719 118285 99525434 8396931 21.51%
Aug-07 388 627.765 129965367 180472 129784895 9272773 28.71%
Sep-07 436 744.665 53789463 605211 53184252 2593638 9.92%
Oct-07 442 784.365 27718695 552883 27165812 1887109 4.81%
Nov-07 444 790.965 42632739 737356 41895383 2198858 7.36%
Dec-07 447 800.265 111147009 400316 110746693 5601815 19.22%
Jan-08 457 886.545 116619170 273686 116345484 5255473 18.23%
Feb-08 464 955.07 98086800 448216 97638584 4658970 14.20%
Mar-08 532 1185.145 122875316 646763 122228553 5864690 14.32%
Total 427.167 769.4996 1030853611 4561127 1026292484 66439760 15.23%

18
Wind Farm Generation for the year 2008-09
MonthNos. of
WF
Total Capacity of WF in
MW
Generation Share
in KWh
KWh exported by GEB
Share of Electricity
in KWh
KVARh drawn by WF
PLF
Apr-08 533 1190.745 104559255 302460 104256795 3696991 12.16%
May-08 534 1197.395 300960710 133629 300827081 14928605 34.89%
Jun-08 538 1238.655 314187928 241993 313945935 18651514 35.20%
Jul-08 533 1234.255 270744515 214470 270530045 18502400 30.44%
Aug-08 537 1242.255 243055282 364994 242690288 13050890 27.13%
Sep-08 548 1346.505 170767145 724145 170043000 4982236 17.54%
Oct-08 549 1351.205 57047080 1206331 55840749 1627660 5.74%
Nov-08 549 1365.305 128661753 1081498 127580255 4588240 12.98%
Dec-08 550 1380.305 176665649 718690 175946959 6392367 17.70%
19
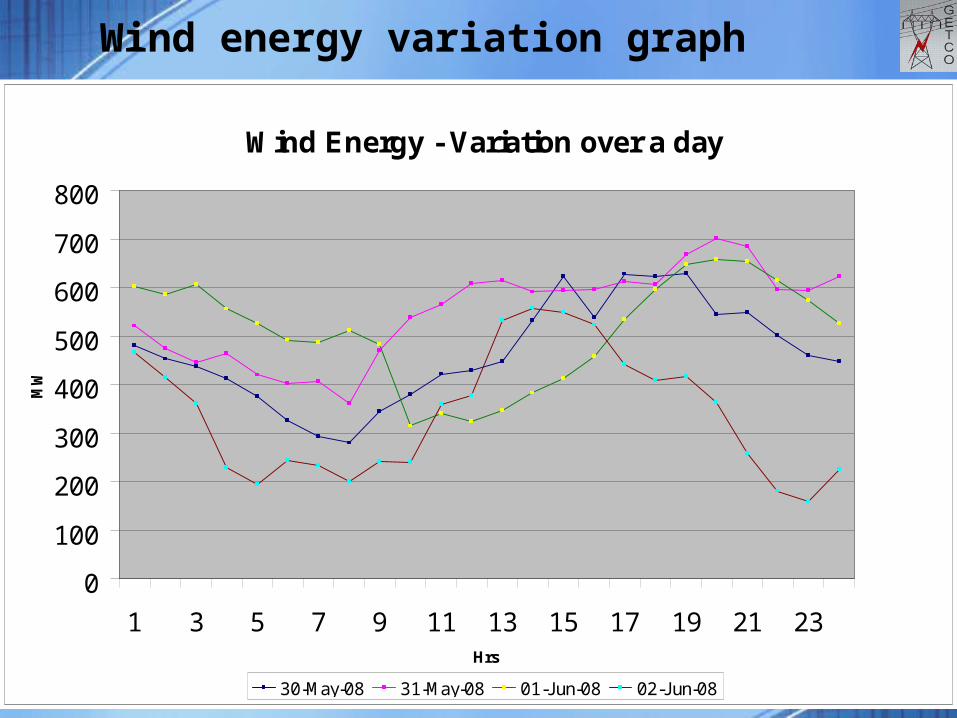
Wind energy variation graph
Wind Energy - Variation over a day
0
100
200
300
400
500
600
700
800
1 3 5 7 9 11 13 15 17 19 21 23Hrs
MW
30-May-08 31-May-08 01-Jun-08 02-Jun-08
20
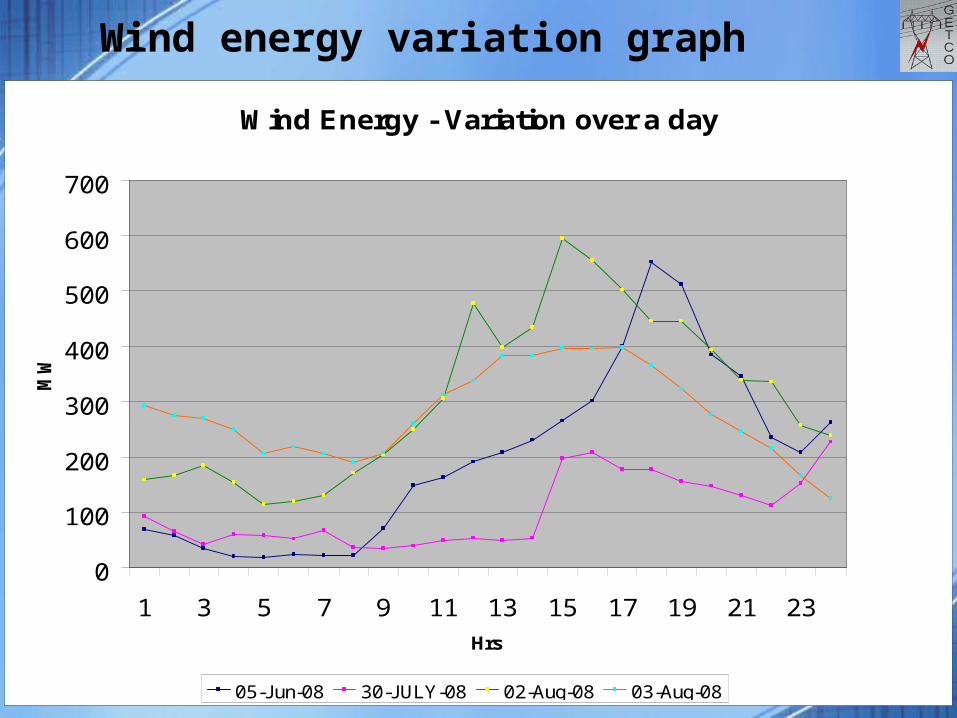
Wind energy variation graph
Wind Energy - Variation over a day
0
100
200
300
400
500
600
700
1 3 5 7 9 11 13 15 17 19 21 23
Hrs
MW
05-Jun-08 30-JULY-08 02-Aug-08 03-Aug-08

21
Wind Generation on 19-11-08
WIND GENERATION FOR THE DATE 19.11.2008
0
100
200
300
400
500
600
700
1 2 3 4 5 6 7 8 9 10 11 12 13 14 15 16 17 18 19 20 21 22 23 24
HOUR
GENE
RATI
ON IN
MW
WIND GEN IN MW
22
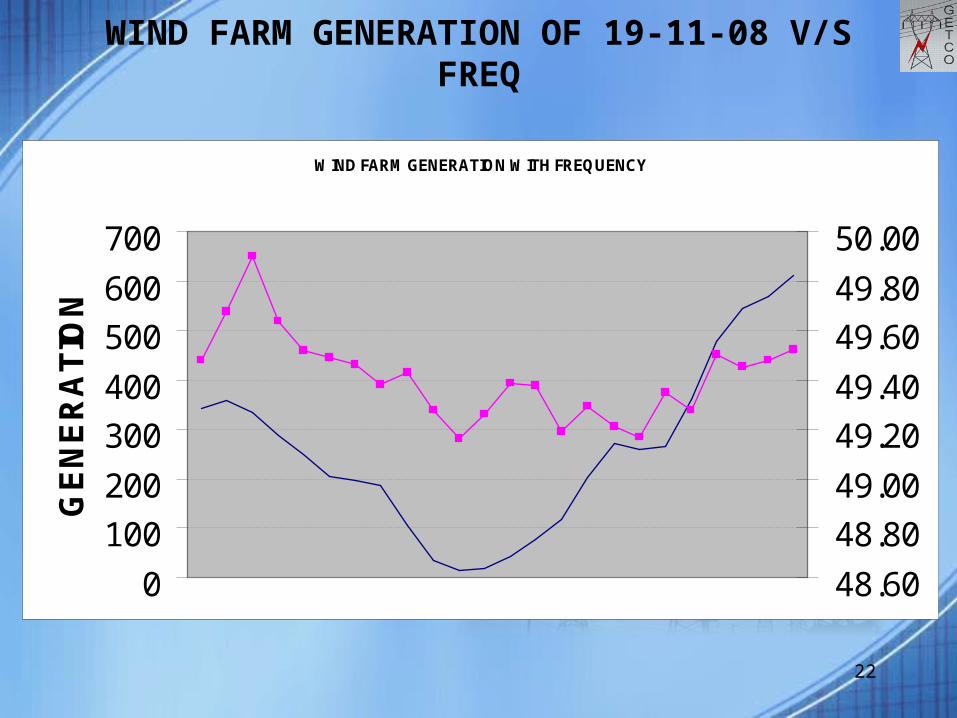
WIND FARM GENERATION OF 19-11-08 V/S FREQ
WIND FARM GENERATION WITH FREQUENCY
0
100
200
300
400
500
600
700
GE
NE
RA
TIO
N
48.60
48.80
49.00
49.20
49.40
49.60
49.80
50.00
23
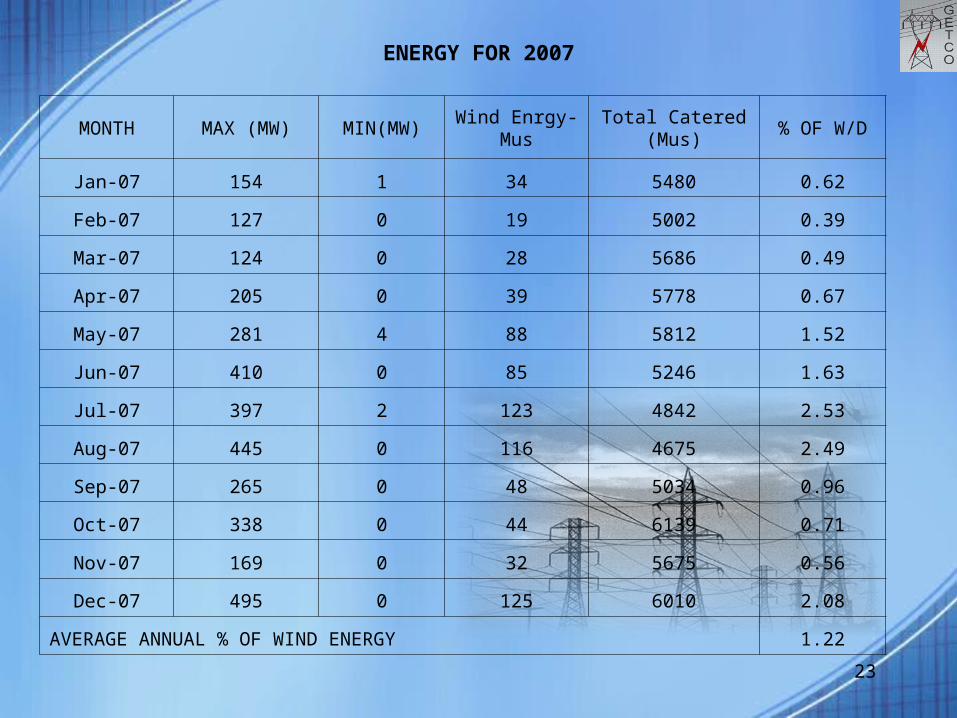
ENERGY FOR 2007
MONTH MAX (MW) MIN(MW)Wind Enrgy-
MusTotal Catered
(Mus)% OF W/D
Jan-07 154 1 34 5480 0.62
Feb-07 127 0 19 5002 0.39
Mar-07 124 0 28 5686 0.49
Apr-07 205 0 39 5778 0.67
May-07 281 4 88 5812 1.52
Jun-07 410 0 85 5246 1.63
Jul-07 397 2 123 4842 2.53
Aug-07 445 0 116 4675 2.49
Sep-07 265 0 48 5034 0.96
Oct-07 338 0 44 6139 0.71
Nov-07 169 0 32 5675 0.56
Dec-07 495 0 125 6010 2.08
AVERAGE ANNUAL % OF WIND ENERGY 1.22
24
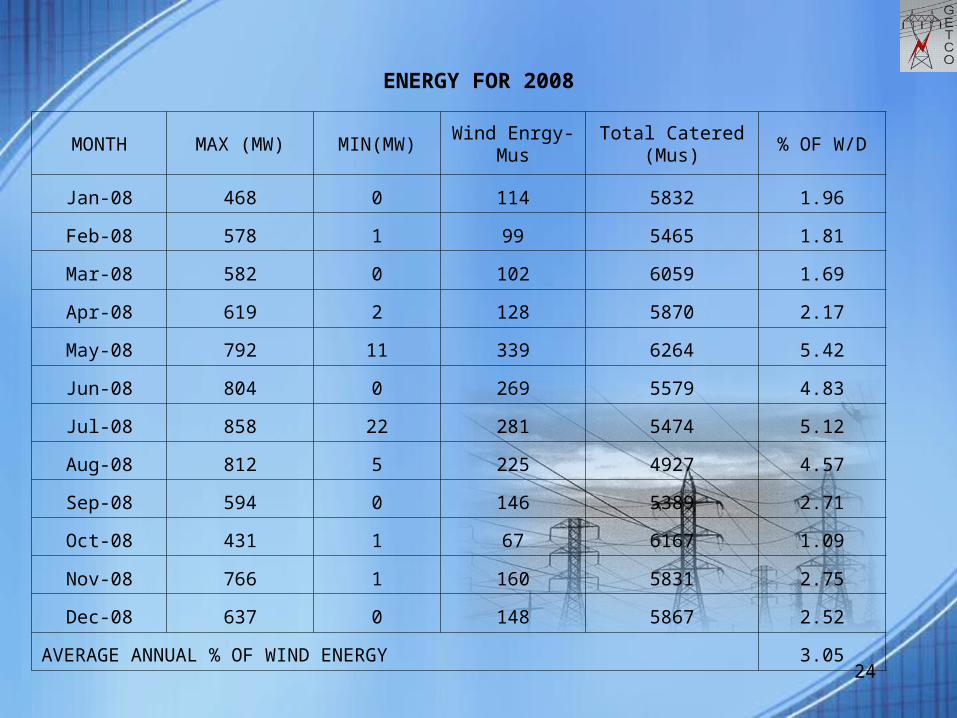
ENERGY FOR 2008
MONTH MAX (MW) MIN(MW)Wind Enrgy-
MusTotal Catered
(Mus)% OF W/D
Jan-08 468 0 114 5832 1.96
Feb-08 578 1 99 5465 1.81
Mar-08 582 0 102 6059 1.69
Apr-08 619 2 128 5870 2.17
May-08 792 11 339 6264 5.42
Jun-08 804 0 269 5579 4.83
Jul-08 858 22 281 5474 5.12
Aug-08 812 5 225 4927 4.57
Sep-08 594 0 146 5389 2.71
Oct-08 431 1 67 6167 1.09
Nov-08 766 1 160 5831 2.75
Dec-08 637 0 148 5867 2.52
AVERAGE ANNUAL % OF WIND ENERGY 3.05

25
MONTHLY ENERGY CATERED & FREQUENCY
47.50
48.00
48.50
49.00
49.50
50.00
50.50
51.00
Jan-08 Feb-08 Mar-08 Apr-08 May-08 Jun-08 Jul-08 Aug-08 Sep-08 Oct-08 Nov-08 Dec-08
Month
Freq
.(Hz.
)
0
1000
2000
3000
4000
5000
6000
7000
Ener
gy-M
us
Max Freq.Min Freq.Monthly Energy -Mus

26
Voltage of 220kV Anjar & Wind Energy for the Month Jun-08
205
210
215
220
225
230
235
240
245
1 2 3 4 5 6 7 8 9 10 11 12 13 14 15 16 17 18 19 20 21 22 23 24 25 26 27 28 29 30
Date
Volta
ge
0
2
4
6
8
10
12
14
16
18
Win
d En
ergy
-Mus
Max Volt.Min VoltWind Energy Mus
27
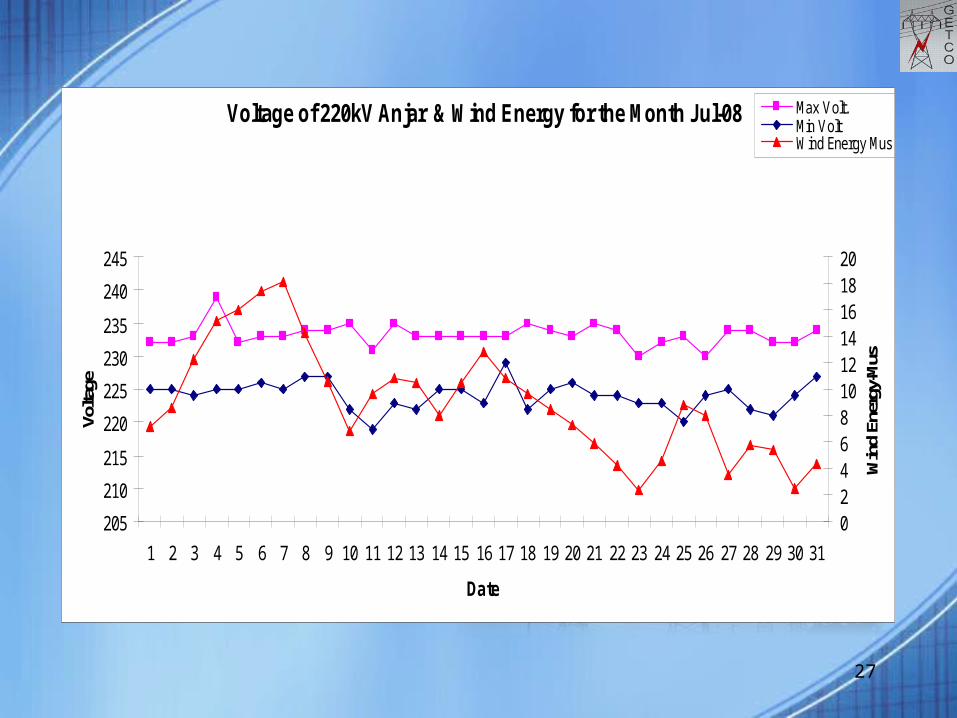
Voltage of 220kV Anjar & Wind Energy for the Month Jul-08
205
210
215
220
225
230
235
240
245
1 2 3 4 5 6 7 8 9 10 11 12 13 14 15 16 17 18 19 20 21 22 23 24 25 26 27 28 29 30 31
Date
Volta
ge
02468101214161820
Win
d En
ergy
-Mus
Max Volt.Min VoltWind Energy Mus
28
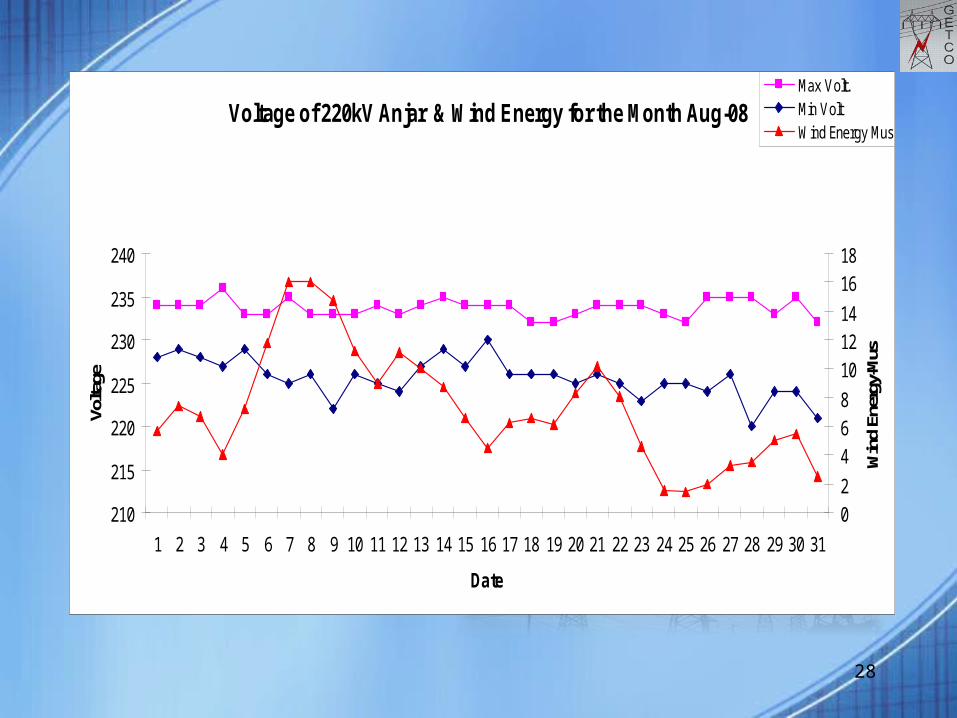
Voltage of 220kV Anjar & Wind Energy for the Month Aug-08
210
215
220
225
230
235
240
1 2 3 4 5 6 7 8 9 10 11 12 13 14 15 16 17 18 19 20 21 22 23 24 25 26 27 28 29 30 31
Date
Volta
ge
02
468
101214
1618
Win
d En
ergy
-Mus
Max Volt.Min VoltWind Energy Mus

29
Voltage of 220kV Anjar & Wind Energy for the Month Sept.-08
200
205
210
215
220
225
230
235
240
245
1 2 3 4 5 6 7 8 9 10 11 12 13 14 15 16 17 18 19 20 21 22 23 24 25 26 27 28 29 30
Date
Volta
ge
0
2
4
6
8
10
12
14
Win
d En
ergy
-Mus
Max Volt.Min VoltWind Energy Mus
30
31
There are number of unresolved technical, institutional and regulatoryquestions concerning distributed generation in general and windgeneration in particular.
On the technical level, major barriers are..
Novelty and unfamiliarity of distributed technologies. Lack of substantial field experience with these technologies. Costs and complexity associated with thorough engineering
evaluations. Weak evacuations network as well as onward transmission
networks. Less availability of evacuations corridors. Less consumptions in local area due to wide variation in load
due to variable load in agriculture, less and variable industrial demand and low demand on staggering day.
Variable local load pattern leads to overloading of transformers and main transmission lines which requires high capacity of strengthening of transmission network.
Average PLF observed 15-20% which leads to inefficient occupation of transformer capacity and non utilization of infrastructures.
Integration with grid
32
Electrical power grid is an unique one in which generation and demands are balanced instantaneously and continuously.
Fluctuations in power consumed by the consumers and variations in uncontrolled generators are compensated by the controlled generators.
When generation equal to load, frequency operates at 50 Hz. Variation in frequency indicates rise of load or generation vice versa is term as a balancing.
In the grid system, it is not necessary for compensating each and every variation from individual consumers / generators.
Only aggregate variation in the control area is balanced. Aggregation is the powerful tools with the power system
operators. When wind power plants are introduced into the power system, an
additional source of variation is added to the already variable nature of system.
Electrical grid
33
Load-Generation balance
In large interconnected system, load generation is reflected with change in tie line flows.
In a small system, load generation balance is reflected with variation in frequency.
Variation in frequency is limiting factor for capacity addition of the wind farms.
In predominantly hydro and gas generation system with good ramp rate will be positive factor, helping for compensating variation of wind generation.
34
Balancing
Balancing in power system occurs over wide time frames: Years in advance : Enough generation has to be planned and built
so that there is sufficient capacity available to meet load requirements Day Ahead : Select which available generator can reliably meet
expected requirements at lowest cost. Real Time : Real time balancing can be obtained by two different
methodology:• Load Following (Backing down)• Load Regulation (Load Shedding)
35
Balancing by Load Following
Load following requirement are highly correlated ….
24 hours power supply to rural under JGY scheme. 24 hours power supply to urban area. 8 hours committed agriculture supply in various groups. High demand during summer due to domestic & commercial
cooling load. High demand agriculture demand during Ravi crop. Demand variation due to festival & seasons. Load demand during morning & evening peak.
36
Balancing by Load Regulations
Load Regulation requirement are correlated by….
Availability of generation on bar. Ramping rate of generating stations. Variable cost of generating stations. Technical Minimum of generating stations. Peak and off peak demand, required generation to be kept in
reserve. The random variation in demand OR generation is adjusted
instantaneously by primary response generators.
37
Grid operation with Wind Generation
Scenario 1:
An increase in load along with increase in wind generation OR drop in load along with drop of wind generation – Additional generation required for frequency maintenance is less.
System Operator:
It is a safe operation for grid operators. Most favorable condition for grid operators. During evening peak, maximum wind energy available and it helps to
meet peak demand.
38
Grid operation with Wind Generation
Scenario 2(A) :
A drop in load along with increase in wind generation.
System Operator:
Backing down of other generators. High Voltage problem and switching off lines. System operation
with critical loading. If local load is very low, overloading of associated transmission
lines.

39
GETCO grid operation with Wind Generation
Scenario 2(A) :
A drop in load along with increase in wind generation .
System Operator:
When load is very low and wind generation is maximum, system operator has to back down cheaper generation at Panandhro and Akrimota to control loading of 220 KV Sivlakha-Morbi line.
In case of contingency of tripping of either Morbi-Sivlakha OR Anjar-Deodar OR Sivlakha-Sankhari lines, total generation at Panadhro and Akrimota affected badly.
In Kutch area, due to high wind energy generation, voltage remains high causing frequent failure of lines disturbing parameters while synchronizing, delaying in synchronization.
40
Grid operation with Wind GenerationScenario 2(B) :
An increase in load along with drop in wind generation .
System Operator :
Increasing load along with decrease in wind generation is a very critical nature of situation for system operator.
Additional generation is to be brought into system very quickly. If no generation available, heavy load shading to be resorted. If frequency permits, overdrawl at that prevailing rate. Requisition of costly generation i.e. on SPOT gas , Naphtha if
available
Remedies :
Additional generation capacity is required for maintenance of load generation balancing especially gas based and hydro based.

41
Power Quality with Wind Generation
Generally it is believed that with increase in wind generation, the power quality suffers.
Main power quality problems are:o Voltage Regulation,o Harmonics.• Old WTG machines with induction generators have not been required
to participate in system voltage regulation. Their reactive power demand are compensated by switched shunt capacitors.
• New WTG machines with variable frequency drives have inherent control of reactive power output and can participate in voltage regulation.
• If wind farm is far from generation source, high voltage witnessed near to wind farms with increase in wind generation.
• The variable frequency generators in WTGs use AC-DC converter for connection with Grid, which increases the Harmonics level in the system.

42
Wind Penetration
Energy penetration is the ratio of the amount of energy delivered from the wind generation to the total energy delivered. For example, if 200 megawatthours (MWh) of wind energy is supplied and 1,000 MWh is consumed during the same period, wind’s energy penetration is 20%.
Capacity Penetration is the ratio of the nameplate rating of the wind plant capacity to the peak load. For example, if a 300-MW wind plant is operating in a zone with a 1,000-MW peak load, the capacity penetration is 30 %. The capacity penetration is related to the energy penetration by the ratio of the system load factor to the wind plant capacity factor. Say that the system load factor is 60% and the wind plant capacity factor is 40%. In this case, and with an energy penetration of 20%, the capacity penetration would be 20% x 0.6/0.4, or 30%.
Instantaneous penetration is the ratio of wind plant output to load at a specific point in time, or over a short period of time.

43
Conclusion
If the share of wind generation instantaneous penetration at any point of time is excessively high compared to the total system demand, then, following new operating methodology need to be adopted for ensuing reliability and stability of system:
– Methodology for accurate long term & short term forecasting.– Real time data from wind farm to system operator to be made
available for effective grid operation.– Reserve capacity with high ramp up generators such as a hydro
and gas shall be kept.– All wind energy generation be brought under regulations of ABT
which means elimination of generation in case of high frequency or system constraints.
– Reinforcement of main transmission network and power corridors.– Augmentation and reinforcement of voltage regulating equipments
such as reactors, switched capacitors including FACTS devices.

44
Thank you