1, id 2 - pure. · pdf filesensors article crack monitoring of operational wind turbine...
TRANSCRIPT

sensors
Article
Crack Monitoring of Operational WindTurbine Foundations
Marcus Perry 1,* ID , Jack McAlorum 2, Grzegorz Fusiek 2, Pawel Niewczas 2, Iain McKeeman 2
and Tim Rubert 2
1 Department of Civil & Environmental Engineering, University of Strathclyde, Glasgow G1 1XJ, UK2 Department of Electronic & Electrical Engineering, University of Strathclyde, Glasgow G1 1XQ, UK;
[email protected] (J.M.); [email protected] (G.F.); [email protected] (P.N.);[email protected] (I.M.); [email protected] (T.R.)
* Correspondence: [email protected]
Received: 20 July 2017; Accepted: 19 August 2017; Published: 21 August 2017
Abstract: The degradation of onshore, reinforced-concrete wind turbine foundations is usuallyassessed via above-ground inspections, or through lengthy excavation campaigns that suspendwind power generation. Foundation cracks can and do occur below ground level, and whilesustained measurements of crack behaviour could be used to quantify the risk of water ingressand reinforcement corrosion, these cracks have not yet been monitored during turbine operation.Here, we outline the design, fabrication and field installation of subterranean fibre-optic sensors formonitoring the opening and lateral displacements of foundation cracks during wind turbine operation.We detail methods for in situ sensor characterisation, verify sensor responses against theoretical towerstrains derived from wind speed data, and then show that measured crack displacements correlatewith monitored tower strains. Our results show that foundation crack opening displacementsrespond linearly to tower strain and do not change by more than ±5µm. Lateral crack displacementswere found to be negligible. We anticipate that the work outlined here will provide a startingpoint for real-time, long-term and dynamic analyses of crack displacements in future. Our findingscould furthermore inform the development of cost-effective monitoring systems for ageing windturbine foundations.
Keywords: fiber optic sensing; fiber Bragg gratings; concrete cracks; displacement sensors; structuralhealth monitoring; life extension; field trial
1. Introduction
Onshore wind turbines currently supply 10% of Europe’s electricity [1]. As this proportion isonly expected to increase [2,3], structural health monitoring is needed to ensure that the infrastructurearound wind power remains reliable [4]. On land, wind turbines are typically supported bygravity-based, reinforced-concrete foundations. These foundations can undergo degradation andcracking for numerous reasons, including under-reinforcement during design; shrinkage and thermalgradients during casting; or subsistence and freeze-thaw during service [5]. The sheer diversity ofcauses suggests that foundation cracking could be common, but, so far, structural health monitoringresearch has mainly focussed on the rotating and electrical components of wind turbines [6,7].Foundation monitoring is usually either inferred from models [8,9], or limited to the interface betweenthe foundation and the tower [10,11]. The sparsity of foundation monitoring research is perhapsunsurprising: site surveys suggest that the failure of purely structural elements (the foundation andtower) account for only 1–4% of wind turbine failures [12,13]. It is not prudent to generalise thesefindings, however, as the root causes of concrete cracks are usually human errors made during planning,design and construction [14]. The repetition of these errors can cause higher failure probabilities to
Sensors 2017, 17, 1925; doi:10.3390/s17081925 www.mdpi.com/journal/sensors

Sensors 2017, 17, 1925 2 of 20
propagate locally over a fleet of turbines. Furthermore, because the impact of a foundation failure iscatastrophic, the event poses an increased safety and operational risk [5].
Onshore wind turbine foundations are typically monitored via visual inspections of above-groundsurfaces, and in some cases, excavation and more detailed (and costly) inspection of foundation walls(while the turbine is switched off). Neither of these traditional techniques allow underground cracksto be monitored during turbine operation, and they could both be streamlined and improved withthe use of modern sensor technology. In other areas of civil engineering, optical fiber sensors suchas fiber Bragg gratings (FBGs) have eclipsed the subjective and infrequent nature of inspections byproviding quasi-distributed, high-resolution measurements of strains and temperatures in buriedconcrete structures such as piles, tunnels and foundations [15–17]. Retrofitted and surface-mountedsensors in particular have a track-record of detecting strains and crack displacements in existingstructures above ground [18–20].
In this work, we outline the design, construction, characterisation, installation and verification ofFBG sensor modules for monitoring lateral and opening crack displacements of a buried foundationduring wind turbine operation. Crack displacement results are correlated with the strains measuredby a second series of FBG sensors affixed to the turbine tower, and verified against wind speed andturbine data from the operator. To our knowledge, this is the first time that below-ground cracks havebeen monitored in a wind turbine foundation during operation. We anticipate that these measurementscould be used to better quantify the risks of water ingress and subsequent corrosion of the foundation’ssteel reinforcement. Furthermore, by demonstrating that such a real-time monitoring system is feasible,we hope to provide engineers and wind farm operators with a new tool to inform decisions aboutcurrent asset lifetime, and the design and construction of foundations in future.
2. Wind Turbine: Expected Response to Loads
The wind turbine monitored in this work consists of a tubular steel tower affixed to an octagonalgravity foundation using prestressing bolts (Figure 1). Sensors for monitoring tower strain andfoundation crack displacements cannot be designed or verified without some prior knowledge of thetypical response of the wind turbine system to wind loads. This response can be estimated using finiteelement models [9], but here we opt to use a mathematical approach to aid simplicity and transparency.
Figure 1. The loads on the wind turbine that contribute to the overturning moment.

Sensors 2017, 17, 1925 3 of 20
2.1. Tower Strain
As shown in Figure 1, the wind turbine can be modelled as a fixed-free cantilever, where theoverturning moment at the base of the tower occurs due to (i) the thrust acting on the rotor athub height, H; and (ii) the interaction between the tower and a distributed wind profile, V(z) [21].Under stationary conditions, and for a given wind speed, V0, and air density, ρ, the total moment isdescribed by [22]:
M = 12 ρCT AV2
0 H + 12 ρDTCFx
∫ H
0V(z)2zdz. (1)
The first component of Equation (1) includes the thrust coefficient, CT , which describes thestrength of the interaction between the wind and the spinning rotor [23,24]. The parameter, A = πR2,is the area of the circular disc swept by the turbine blades, each of which has a length R.
The second component of Equation (1) describes how the turbine tower of diameter, DT , interactswith the wind via a drag coefficient, CFx. During stable wind conditions, the wind profile in theintegral can be approximated by [25]:
V(z) = V0
( zH
) 17 . (2)
Substitution of Equation (2) into Equation (1) reveals a simpler expression for the moment:
M = 12 ρV2
0 (CT AH + 716 DTCFx H2), (3)
which can be converted to the maximum strain at the base of the tower using the second moment ofarea, I, and the Young’s Modulus, E, of the tower:
εmax =MDT2IE
. (4)
Table 1 lists the parameter values used for the wind turbine studied in this work. Substitution ofthese values into Equation (3) reveals that the overturning moment, plotted for various wind speedsin Figure 2b, rarely exceeds M = 50 × 106 Nm. This suggests that the strains measured in the towershould not exceed εmax ≈ 250 µε.
Note that Equation (4) can be generalised for any wind direction and tower sector as:
ε = εmaxcos(α − θs), (5)
where α is the wind direction (or equivalently, the turbine yaw) and θs is the direction that the towersector of interest faces.
Table 1. Parameter values used to estimate tower strain using Equations (3) and (4).
Description Value Notes
ρ Air density 1.225 kg/m3
V0 Wind Speed 3–25 m/s Range for rotor cut-in and cut-out [26]CT Thrust coefficient 0–0.83 Parametric dependence shown in Figure 2a [26]R Rotor blade length 54 mH Hub height 80 mDT Tower diameter 5 m Assumed constant at all heights for simplificationCFx Tower drag coefficient 0.5 An average value taken from [27]I Tower second moment of area 2.454 m3 I ≈ π
8 D3Ttt for thin-walled tubes of thickness tt
tt Tower wall thickness 5 cmE Tower Young’s modulus 200 GPa Value for structural steel

Sensors 2017, 17, 1925 4 of 20
Figure 2. Theoretical values of (a) the rotor’s thrust coefficient [26] and (b) the overturning momentacting at the turbine base, calculated using Equation (3) and the parameters in Table 1.
2.2. Foundation Crack Displacement
The concrete gravity foundation monitored in this work is of a steel-rib-reinforced, slab design,with a central octagonal plinth (as illustrated in Figure 3). The multiple-stage concrete pour used toconstruct this particular design can cause thermal cracking to initiate at the interface between theplinth and the ribs. These cracks can, in some cases, be propagated by overturning moments in theprevailing wind direction and by discontinuities in the levels of steel reinforcement. The cracks areminor, but still warrant measurement as cyclic opening and propagation increases the likelihood ofwater ingress and rebar corrosion.
Figure 3. Illustration of the octagonal gravity foundation studied in this work. The cracking patternthat can occur for this design is also shown.

Sensors 2017, 17, 1925 5 of 20
In general, the sides of the foundation that face the wind are subjected to tensile stresses, causingcracks to open, while the opposite side of the foundation is placed into compression. There shouldtherefore be a correlation between the strains measured in the tower and the opening of cracks. Theexact form of this dependence cannot be quantified at this stage, as it could depend on the depth ofthe cracks, their locations, the degradation of the structure and whether there is an internal networkof cracks within the foundation. Measured changes in relative crack displacements could, however,be used to infer a degradation in structural health over time.
3. Sensor Design and Characterisation
3.1. Fiber Bragg Gratings
In this work, fiber Bragg grating (FBG) sensors were used to monitor strains, temperatures anddisplacements in the structural components of the wind turbine system. As Figure 4 illustrates,FBGs are formed from a 10–20 mm long step-like and periodic variation in the refractive index of aglass optical fiber. When broadband light, guided through the fiber, encounters the FBG, a narrowdistribution of wavelengths is reflected back towards the light source. The peak position of thiswavelength distribution, termed the Bragg peak, λB, shifts when the FBG is subjected to strain,εz, or temperature changes, ∆T:
∆λBλB
= kεεz + kT∆T; (6)
here, kε = 0.78 and kT = 6 ppm/◦C are the strain and temperature sensitivity of the FBG,respectively [28]. To decouple the strain and temperature in Equation (6), it is common practiceto place a second, strain-isolated FBG (a thermometer) in thermal contact with each strain sensor [29].
Figure 4. The (a) structure and (b) reflected spectrum of a fiber Bragg grating. Modulation between high(n2) and low (n1) refractive index values with a periodicity Λ = L1 + L2 creates partial back-reflectionswhich sum to create a Bragg peak at λB.

Sensors 2017, 17, 1925 6 of 20
3.2. Sensor Fabrication
Three types of FBG sensors were deployed in this work: wind turbine tower strain gauges,FBG thermometers for temperature compensation and custom-built foundation crack-displacementsensor modules. These three sensor types allowed movements in the turbine and foundation to becorrelated independently of thermal effects. All FBGs used in this work were of 10 mm length, and wereside-written into 20 mm-long, mechanically-stripped sections of acrylate-coated, single-mode opticalfiber. The bare fiber sections containing the FBGs were epoxied directly to their relevant packagingor substrate, as this reduces the degradation of strain transfer in the presence of any weakly-bondedacrylate recoating [30].
3.2.1. Strain Gauges and Thermometers
Strains were monitored near the base of the turbine tower, 50 cm above the plinth, by epoxyingbare FBGs to stripped and cleaned steel surfaces on the inside of the tower, as shown in Figure 5.Each FBG strain gauge was installed running along the turbine tower axis, so that the strainscaused by overturning moments could be captured. Thermometers were constructed in-house byencapsulating FBGs in two layers of copper capillaries, as outlined in previous work [31]. This provideda strain-isolated reference for the thermal compensation of nearby tower strains.
Figure 5. Epoxied strain sensor and adjacent copper-encapsulated temperature sensor prior to adhesivecoating and painting.
3.2.2. Crack Displacement Modules
Photographs of crack-displacement sensor modules are provided in Figures 6 and 7.Each bidirectional sensor module allows one crack to be monitored at two nearby locations, and alongtwo directions that are 60◦ apart. This means that similarities in the response of the two sensor armscan be used to measure crack opening (mode I) displacements with more confidence [32]. Lateral(mode III, shear or tearing) movements in cracks can also be extracted from the differences betweenthe two arms (using trigonometry). This design is known to provide reliable measurements of crackdisplacement, as similar designs have been laboratory tested in our previously published work [33,34].

Sensors 2017, 17, 1925 7 of 20
Figure 6. Photograph of foundation sensor module arms with FBGs attached.
Figure 7. The (a) concrete facing and (b) soil facing sides of a displacement sensor module, showingthe protective housing.
Sensors 2017, 17, 1925 8 of 20
To fabricate each module, stainless steel bolts (length 25 mm) were inserted through holes in twocarbon-steel arms of length Lh = 10 cm. These components were joined by induction brazing, with thearms at a 60◦ angle to each other. After pieces were cleaned of oxidization, a fiber array (made up ofan FBG thermometer and two strain sensors) was epoxied to the steel arms. Armoured protection wasalso affixed to protect the addressing fiber from mechanical damage during installation and service.As shown in Figure 7, the assembly was then housed within an aluminium and acrylic enclosure,with the bolts protruding through a perspex window. Interfaces between materials and the regionaround the bolts were then sealed in stages using a combination of epoxy, silicone sealant and spraypaint. This prevents moisture ingress, which can degrade both steel and glass fiber components [35].
In total, four crack-displacement sensor modules (denoted A, B, C and D) were fabricated.To install each module, three 6 mm diameter holes were drilled either side of a crack in the concreteface of the foundation. The bolts, labelled in Figure 7, were then fixed into these holes using aconstruction-grade injectable epoxy mortar.
3.3. Characterisation
3.3.1. Thermal Response
Thermometers and foundation sensor modules were thermally characterised by heating themwithin an environmental chamber from 0.5 ◦C to 30 ◦C in 5 ◦C steps. The thermal responses of allsensors lay in the range 11–17 ppm/◦C . Note that these thermal coefficients are all higher than forbare FBGs (kT = 6 ppm/◦C ) due to the added thermal expansion of the adjoined steel and coppercomponents. Differences in sensitivity can be attributed to the fact that sensors were manufacturedby hand. Once these differences are characterised and known, they do not significantly degrademeasurement performance.
FBG tower strain gauges could not be characterised in the lab, as bonding them to the turbinetower has a strong and initially unknown influence on their response (the temperature coefficient isdependent on the tower’s material properties, the quality of the bond and the type of epoxy used).As such, these sensors were characterised during operation, using local air temperatures availablefrom the operator (see Section 5.1). We used a Bayesian approach [36,37], where we made the priorassumption that the tower strain gauges would have a thermal sensitivity of Kπ = 11 ± 0.5 ppm/◦C ,i.e., comparable to the FBG components bonded to steel in the lab. Following this, fluctuations in theBragg peak of the strain gauges were correlated with the operator’s measurements of air temperatureusing linear regression. This provided real-time observations of thermal sensitivity, denoted Ko.The prior and observed distributions of sensitivity were then combined to calculate posterior valuesfor strain gauge thermal sensitivity:
Kp = ΣpΣ−1π Kπ + ΣpΣ−1
o Ko, (7)
where Σπ and Σo are the covariance matrices of the prior and observed sensitivity and:
Σp = (Σ−1π + Σ−1
o )−1 (8)
is the covariance matrix of the posterior. Using these methods, the calculated posterior thermalsensitivities of tower strain gauges were typically found to be ≈10 ppm/◦C . These sensitivities werethen used to compensate for thermal effects on tower strain measurements. Overall, the uncertainty inthe strain due to this compensation method was less than 5 µε.

Sensors 2017, 17, 1925 9 of 20
3.3.2. Displacement Response of Foundation Modules
FBGs are short-gauge sensors of 10 mm length. This means that they effectively monitor the strainat the centre of each steel arm of a crack displacement module. Each arm, however, is a long-gaugesensor of length Lh = 10 cm, with a strain described by [38]:
εh =∆LhLh
=1Lh
∫ xB
xA
εc(x)dx +1Lh
∑j
∆wj. (9)
Surface strains or the opening of existing cracks lead to a relative displacement ∆Lh of theanchoring bolts, which are grouted into the concrete foundation at locations xA,B. The strains due tothe opening or closing of existing cracks are captured by the integral in Equation (9). These strainsare ‘predictable’, in the sense that changes in crack displacement are expected to correlate with windloads and directions. The quantities ∆wj, meanwhile, are a set of added and less predictable straindiscontinuities caused by the propagation of new cracks [38]. These new cracks will appear as small,permanent step changes in the strain data: negative or positive depending on whether the cracksoccur at or between the anchoring bolts, respectively. In this paper, we focus on the strains caused bychanges in existing cracks. Indeed, we have not yet witnessed small, discontinuous changes, but thesewill be investigated in more detail in future work.
The integral in Equation (9) furthermore shows that each sensor arm provides an averagemeasurement of the concrete strain between its two attachment points, resulting in a reduced strainand spatial resolution. This long-gauge sensing is, however, required in this case because concrete isan inhomogeneous material. Monitoring over small length scales may provide measurements of singlecrack growth, but long-gauge sensors are essential for monitoring multiple cracks, large cracks andbulk physical properties.
During service, opening displacements in cracks will give rise to analogous ‘crack strains’,εc, which are imperfectly transferred to the sensor module arms and the FBGs (i.e., the strain transfer,γ = εFBG/εc < 1). Strain losses occur at two interfaces. The first interface is that between the FBGand the steel arm of the sensor module. To ensure strain losses at this interface were low, the straintransfer was calculated from the results of thermal calibration data obtained from Section 3.3.1.As the thermal expansion of silica fibers is negligible, bare FBG temperature sensitivity is primarily athermo-optic effect (recall that kT = 6 ppm/◦C ) [28]. An FBG bonded to a steel substrate, meanwhile,has an additional contribution from the thermal expansion of the steel substrate, αsteel =11 ppm/◦C .This means that the strain transfer from the steel to the FBG, γ1, can be calculated from the measuredthermal sensitivity of the overall assembly [39–41]:
kT,measured = kT + γ1αsteel. (10)
Solving Equation (10) for γ1 revealed that the strain transfer values for all sensor arms werebetween 0.7 and 0.95. The reasons for this variation are: (i) the sensors were manufactured by hand;and (ii) relatively short (20 mm long) sections of bare fibre were bonded to the steel arms, and thisshort bonding length amplifies natural variations in workmanship [42].
The second interface that affects crack displacement measurements is that between the boltsand the mortared holes within the concrete. The strain transfer at this interface will be governedby the installation procedures and the mortar used to grout the bolts. Our previous work hasshown that similar displacement sensors tested in the lab provided valid and reliable readings ofcrack displacement [33]. However, unlike the lab experiments in the cited work, the exact straintransfer cannot be quantified directly after field installation. This means that absolute values of crackdisplacements may be subject to small, variable and unknown errors. These errors will have no impacton monitoring the relative changes of crack displacements over time, provided they remain constantover time.

Sensors 2017, 17, 1925 10 of 20
4. Field Trial
4.1. Sensor Installation
For reference purposes, each foundation cell was numbered 0–7, sequentially and clockwise fromthe entrance door to the tower (see Figure 8). This figure shows the location of the installed towerstrain sensors (S1, S2, S3 and S4 and their associated fibre thermometers) and foundation modulesA–D. After excavation and inspection of the foundation, it was found that there was visible crackingon cell faces 3, 4 and 5. The wind rose in Figure 8 shows that these cells face the prevailing winddirection. Crack-displacement sensor modules were placed over one crack in cell 3, two cracks incell 4 (denoted 4L and 4R) and over one crack in cell 5. An example of the orientation of the arms of asensor module relative to a crack is shown in Figure 9. Two fully installed and hermetically sealedsensor modules are shown in Figure 10.
It should be noted that the foundation monitored in this work was in a relatively good conditionand presented only minor superficial cracking, as shown in the photograph in Figure 11. This presentschallenges for monitoring, as it pushes the sensor technology to monitor foundation cracks even whendisplacement signals are expected to be small.
Figure 8. Wind rose for the turbine instrumented in this work. The location of tower strain gaugesS (1–4) relative to north is projected onto a unit circle. The octagon represents the directions of thefoundation cells (0–7), and the foundation sensor module installation locations are shown (A–D).

Sensors 2017, 17, 1925 11 of 20
Figure 9. An example of the configuration of the foundation sensor module arms over a crack.
Figure 10. The two completed and sealed sensor modules in cell 4.

Sensors 2017, 17, 1925 12 of 20
Figure 11. Photograph of cell 3 with image thresholding on vertical face to highlight the locationof cracking.
4.2. Interrogation and Measurement Range
The FBG sensors, at wavelengths between 1520 nm and 1580 nm, were interrogated at a 50 Hzsampling rate. The sensors were serially multiplexed with eight FBGs per interrogator channel.As the Bragg peaks of each sensor cannot be allowed to overlap, the available bandwidth of theinterrogator is mainly what defines the allowable measurement range of each sensor. It was assumedthat temperatures on site would not exceed the range [−30, +40] ◦C . Tower strain gauges, meanwhile,were conservatively given enough bandwidth to undergo ±1000µε of strain, while foundation sensormodules could measure ±0.5 mm of crack displacement before spectral overlap. Crack openingdisplacements exceeding this range were not expected, and would in any case surpass the 5 mεmechanical tensile strength of the FBGs [43].
5. Results
At the time of writing, four of the eight installed sensors have been brought on line: tower sensorsS2 and S3, and foundation sensor modules B and D. The results in this section are presented for thesesensors only.
5.1. Temperatures
Figure 12 shows that there is generally good agreement between the temperature changesmeasured by FBG thermometers and temperature changes measured by the operator’s supervisorycontrol and data acquisition (SCADA) system. Discrepancies between tower and air temperaturesmay be due to the effects of solar heating of the tower and because air temperatures are measuredat a nearby weather tower. Foundation thermometers, meanwhile, match the long-term trends intemperature changes above ground, but undergo thermal damping from the surrounding soil [44].

Sensors 2017, 17, 1925 13 of 20
Figure 12. Changes in temperature measured by SCADA air sensors and a FBG thermometers locatedaround the wind turbine tower and foundation.
5.2. Tower Strains and Crack Displacements
Figures 13–15 show a collection of time series, histograms and scatter plots of the relationshipsbetween the measured tower strain and the measured foundation crack opening displacements.The results highlight that the sensors tend to favour positive strains and crack displacements(i.e., tensile tower strain and crack opening). This is a consequence of the fact that these sensorsare close to or on the path of the prevailing wind direction.
Note that the comparisons between the model and the strain data outlined in this section canonly provide us with an indication of the validity of the measurements at this stage. This is because themodel used to calculate theoretical tower strain values is simple, and it is based on several assumptions,the most important of which only allows the model to make predictions during stationary operatingconditions. Nevertheless, we can see that the measured tower strains, shown for sensor S3 in Figure 13and Figure 14a, rarely exceed 200µε, an expected result based on the analysis outlined in Section 2.The fact that measured strains are generally lower than the 250µε value predicted in Section 2could suggest that there is imperfect strain transfer between the tower and the FBG strain gauges.This strain transfer can be estimated if we can predict the theoretical tower strain during stationarywind conditions. Such perfect conditions rarely (if ever) occur in reality, but Figure 16a, shows datathat is close to stationary. Here, the strain is predicted using wind speed and yaw data from SCADA,and Equations (3)–(5) . This is compared with the measured strain (after correcting for the effects ofwind angle using Equation (5)) for a one hour window which demonstrates near-stationarity. The plotreveals that the strain transfer from the tower to the sensor S3 is around 0.76, and that there is a slightcompressive offset in the sensor (likely due to curing and shrinkage of the epoxy). After correcting forthese effects, the measured and predicted strain show good agreement, as highlighted by Figure 16b.Some small discrepancies remain, but this is likely because our model is simple: it does not capturedynamic effects, nor does it capture changes in blade pitch or the effects of torque.
Sensors 2017, 17, 1925 14 of 20
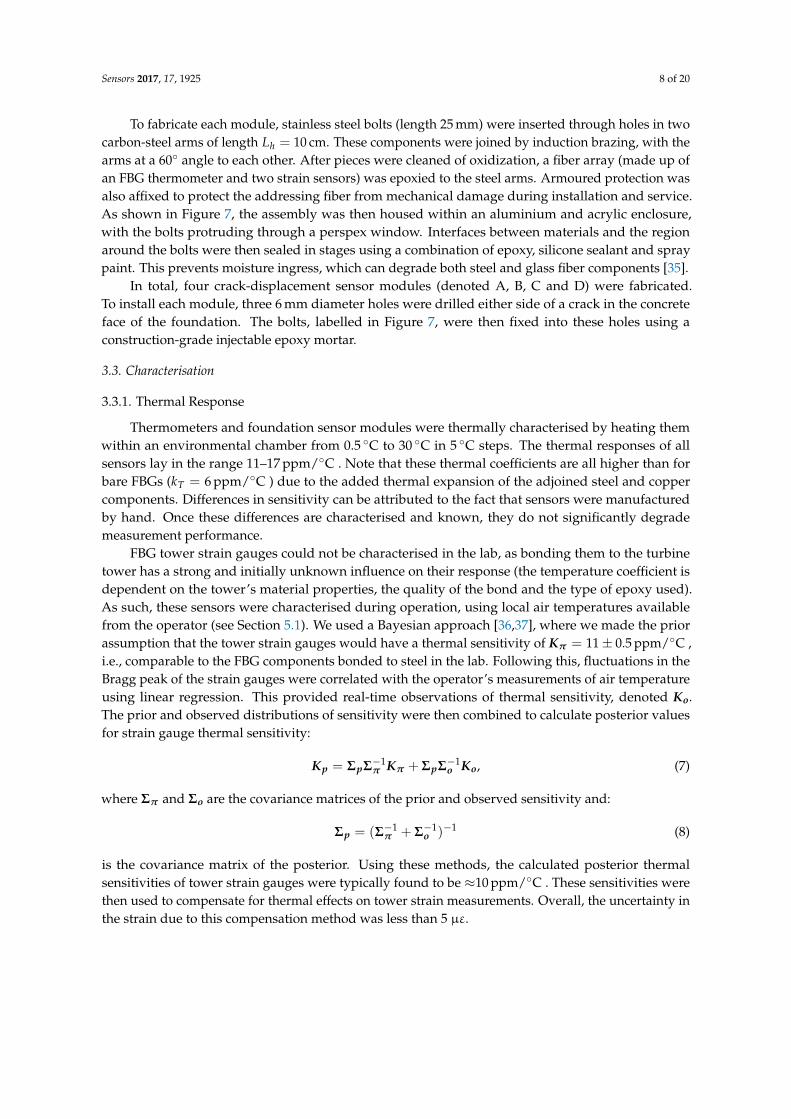
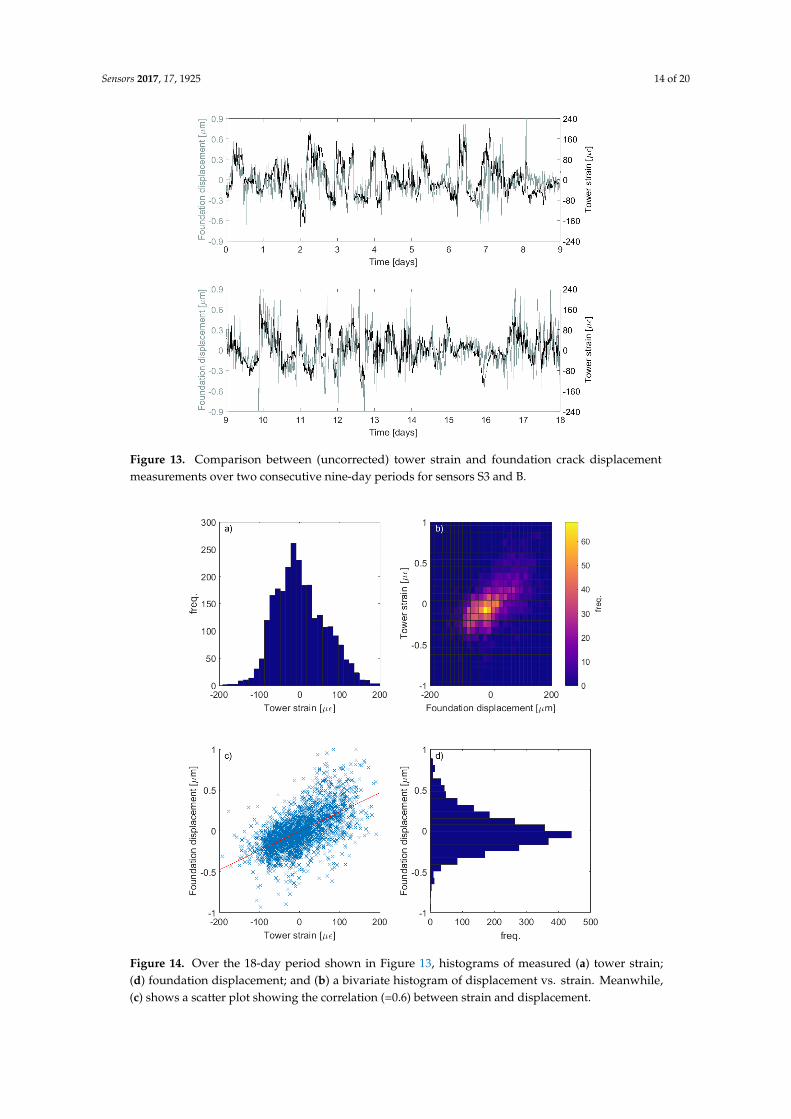
Figure 13. Comparison between (uncorrected) tower strain and foundation crack displacementmeasurements over two consecutive nine-day periods for sensors S3 and B.
Figure 14. Over the 18-day period shown in Figure 13, histograms of measured (a) tower strain;(d) foundation displacement; and (b) a bivariate histogram of displacement vs. strain. Meanwhile,(c) shows a scatter plot showing the correlation (=0.6) between strain and displacement.

Sensors 2017, 17, 1925 15 of 20
Figure 15. 20-hour period showing how transitions to wind turbine operation affect the strains andcrack displacements measured by sensors S2 and D.
Figure 16. (a) the predicted vs. measured strain in the base of the tower during a one-hour window ofsteady-state, stationary wind conditions and (b) time series of predicted strains and measured strainsafter correcting for offsets and strain transfer.

Sensors 2017, 17, 1925 16 of 20
Visual assessments of Figures 13 and 15 suggest that the correlations between the measuredtower strain and crack opening displacement are reasonable. This is numerically confirmed by thecorrelation values ≈0.6 (as shown, for example, in Figure 14c). For the two cracks analysed in thispaper, the relationship between the tower strain, ε, and the crack displacement, ∆Lh, was found to beapproximated by the following linear model:
∆Lh = Jpε, (11)
where the values of parameters are JpA = 0.008 and JpB = 0.004 for foundation modules A and B,respectively. The fact that the dependence is close to linear may be a consequence of the fact that crackdisplacements are so small (displacements do not exceed ±5µm in either crack). This could indicatethat the cracks are only superficial and sub-surface (a conclusion which is backed up by our visualassessments in Figure 11). Figure 14 does make it clear, however, that there is some spread in the data,and some values do depart from the linear correlation shown. This could indicate that a nonlinearcrack response is already occuring, particularly at higher loads.
5.3. Dynamic Behaviour and Lateral Movement
Figure 15 also highlights interesting dynamic behaviour: sudden increases in tower strain(a consequence of the turbine powering on and off) are transferred into the foundation, causingsimilar jumps in crack opening displacement. These dynamic events are fairly common, and areresponsible for some of the largest tower strains and crack opening displacements. Their behaviourcannot be described by Equation (3), which is only valid for steady-state conditions, but they present aclear signal that can be picked out using a thresholding algorithm. How these events relate to crackopening over the long-term is a question that warrants investigation in future work.
Finally, Figure 17 shows the overlaid plots of the displacements measured by arm 1 and arm 2 offoundation sensor module B. The responses are comparable, which provides verification of the crackopening measurement. In this example, because the differences between the arms are so small, lateralcrack displacements are too small to measure with a high level of confidence. The majority of themovement in the measured cracks is therefore a uniform, mode-I crack opening.
Figure 17. Comparison of displacements measured by both arms of sensor module B.

Sensors 2017, 17, 1925 17 of 20
6. Discussion
The results presented in this paper have mainly focussed on sensor design, manufacture,calibration, installation and a basic validation of response. The long-term analysis of crackdisplacements over time, the fusion of sensor data, and verification of dynamic behaviour (wind gustsand sudden changes in wind direction) all represent more significant analyses tasks that will be dealtwith in future work. The sensor network installed in this work acquires data at a 50 Hz samplingrate, which is more than enough to capture transient and dynamic effects in wind loads [45]. A fullmodel linking the strain measured to the wind speeds during dynamic conditions in real time couldtherefore be feasible, but this will require several changes to Equation (3) (outlined in Section 2),which is only valid during steady state, stationary conditions. As more sensors are gradually broughton line, correlation of sensor readouts should provide a clearer picture of the tower and foundation’sstress state. If the same wind loading conditions begin to lead to larger crack displacements, then thismay indicate that a crack has degraded. At this point, further consideration will be required to definewhat levels of crack displacement are indicative of significant damage. More specifically, we will needto decide upon what level of crack displacement allows significant levels of reinforcement corrodingagents to penetrate the structure. Such decisions will be made in future work, in part, using the windturbine operator’s expert knowledge and analysis tools such as logistic regression [46].
The in situ characterisation of the exact strain and temperature response of sensors that areinstalled in the field remains a challenge in many areas of structural health monitoring. In this work,we have outlined a methodology that we hope provides a template for in-the-field characterisation,at least for a wind turbine system. The advantage of using the Bayesian approach that we opted forhere is that as more data becomes available, predictions of the true strain transfers and temperaturecoefficients can be made with a higher level of confidence. Confidence in the measured tower strainscould be further enhanced by using a more detailed model then that presented here. However,we believe it is more preferable to verify validity using more measurements, perhaps thorough furtherinstrumentation of the turbine tower using a combination of conventional and fibre-based strainsensors and accelerometers at various heights, as shown in [47,48]. Recall, however, from Section 3.3.2that accurate measurements of absolute crack widths would require knowledge of the strain transferbetween the bolts of the foundation sensor modules and the mortared holes in the concrete. It couldtherefore be argued that detailed knowledge of the absolute tower strains is not required for this work,especially if the future goal is to correlate tower strains with relative changes in crack width over time.Thus, provided strain transfers in the system do not change over time, these relative changes can bemeasured. This is why efforts were made to produce robust, hermetically-sealed sensors and useindustrial epoxies that are suitable for long-term use in construction.
7. Conclusions
This work has outlined the design, characterisation and field installation of fiber-optic sensormodules for monitoring the crack displacements of a wind turbine foundation during operation.A model to verify sensor behaviour under stationary wind conditions has been developed, as havemethods that allow in situ characterisation of sensors in the field. This has allowed for more confidencein the measured strain response of the turbine tower, and in turn, more confidence in the measuredbehaviour of the foundation’s cracks. The results from the sensors interrogated so far suggest thatfoundation crack opening displacements respond linearly to tower strains and are consistently below±5µm. Meanwhile, lateral crack displacements are negligibly small. In future, this work could allowfor long-term and dynamic analyses of crack opening to be linked to the penetration rate of waterinto the foundation. This could inform rebar corrosion models, and allow operators to take informeddecisions about asset life extension. The work could also inform the design and construction processesfor the world’s growing population of onshore wind turbines.

Sensors 2017, 17, 1925 18 of 20
Acknowledgments: This work described in this paper was supported by the EPSRC (Grant No. EP/G037728/1),and by ScottishPower Renewables and SSE. Due to commercial confidentiality, the datasets supporting this workcannot be made openly available.
Author Contributions: M.P. wrote the paper, M.P. and J.M. designed the model and algorithms required toanalyse and interpret data, M.P. and G.F. conceived, designed and built the sensors and interrogation systemsused, M.P., G.F. and P.N. installed the sensors during the field trial, I.M. designed the in situ characterisationtechniques, and T.R. contributed knowledge to the wind turbine overturning moment model.
Conflicts of Interest: The authors declare no conflict of interest. The founding sponsors had no role in the designof the study; in the collection, analyses, or interpretation of data; in the writing of the manuscript, and in thedecision to publish the results.
Abbreviations
The following abbreviations are used in this manuscript:
FBG Fiber Bragg gratingSCADA Supervisory control and data acquisition
References
1. EWEA. European Wind Energy Association Wind in Power: 2015 European Statistics; Technical Report;EWEA: Brussels, Belgium, 2016.
2. GWEC. Global Wind Eneregy Council Global Wind Report: Annual Market Update; Technical Report;GWEC: Brussels, Belgium, 2015.
3. IREA. International Renewable Energy Agency: Renewable Energy Target Setting; Technical Report;IREA: Sedalia, CO, USA, 2015.
4. Staffell, I.; Green, R. How does wind farm performance decline with age? Renew. Energy 2014, 66, 775–786.5. Hassanzadeh, M. Cracks in Onshore Wind Power Foundations: Causes and Consequences, Elforsk Rapport 11:56;
Technical Report; Elforsk: Stockholm, Sweden, 2012.6. Hyers, R.W.; Mcgowan, J.G.; Sullivan, K.L.; Manwell, J.F.; Syrett, B.C. Condition monitoring and prognosis
of utility scale wind turbines. Energy Mater. 2006, 1, 187–203.7. Ciang, C.C.; Lee, J.R.; Bang, H.J. Structural health monitoring for a wind turbine system: A review of damage
detection methods. Meas. Sci. Technol. 2008, 19, 122001.8. Tim, T.C.; Ueda, T.; Mueller, H.S.; Fujiyama, C.; Yonetsu, K.; Maeshima, T.; Koda, Y. Identifiable Stress State
of Wind Turbine Tower-foundation System Based on Field Measurement and FE Analysis. Proced. Eng. 2014,95, 279–289.
9. Lavassas, I.; Nikolaidis, G.; Zervas, P.; Efthimiou, E.; Doudoumis, I.N.; Baniotopoulos, C.C. Analysis anddesign of the prototype of a steel 1-MW wind turbine tower. Eng. Struct. 2003, 25, 1097–1106.
10. Currie, M.; Saafi, M.; Tachtatzis, C.; Quail, F. Structural health monitoring for wind turbine foundations.Proc. ICE Energy 2013, 166, 162–169.
11. Currie, M.; Saafi, M.; Tachtatzis, C.; Quail, F. Structural integrity monitoring of onshore wind turbineconcrete foundations. Renew. Energy 2015, 83, 1131–1138.
12. Hahn, B.; Durstewitz, M.; Rohrig, K. Reliability of Wind Turbines Experiences of 15 Years with 1500 W;Springer: Berlin, Germany, 2007.
13. Ribrant, J.; Bertling, L.M. Survey of Failures in Wind Power Systems. IEEE Trans. Energy Convers. 2007,22, 167–173.
14. Expedition Engineering. Get It Right Initiative: Research Report Revision 3; Technical Report; ExpeditionEngineering: London, UK, 2016.
15. Li, H.N.; Li, D.S.; Song, G.B. Recent applications of fiber optic sensors to health monitoring in civilengineering. Eng. Struct. 2004, 26, 1647–1657.
16. Leung, C.K.Y.; Wan, K.T.; Inaudi, D.; Bao, X.; Habel, W.; Zhou, Z.; Ou, J.; Ghandehari, M.; Wu, H.C.; Imai, M.Review: Optical fiber sensors for civil engineering applications. Mater. Struct. 2013, 48, 871–906.
17. Glisic, B.; Inaudi, D.; Nan, C. Pile Monitoring with Fiber Optic Sensors During Axial Compression, Pullout,and Flexure Tests. Transp. Res. Rec. J. Transp. Res. Board 2002, 1808, 11–20.

Sensors 2017, 17, 1925 19 of 20
18. Merzbacher, C.I.; Kersey, A.D.; Friebele, E.J. Fiber optic sensors in concrete structures: A review.Smart Mater. Struct. 1996, 5, 196.
19. Leung, C.K.; Wan, K.T.; Jiang, Y. A Fiber Optic Sensor for Cracks in Concrete Structures. In Role of CementScience in Sustainable Development-International Symposium Celebrating Concrete: People and Practice; Universityof Dundee: Scotland, UK, 2003; p. 79.
20. Glisic, B.; Inaudi, D. Crack monitoring in concrete elements using long-gage fiber optic sensors.In Proceedings of the 1st International Workshop on SHM of Innovative Civil Engineering Structures,Winnipeg, MB, Canada, 19–20 September 2002.
21. Woude, C.; Narasimhan, S. Dynamic Structural Modelling of Wind Turbines Using COMSOL Multiphysics.In Proceedings of the COMSOL Conference 2010, Boston, MA, USA, 7–9 October 2010.
22. Kawai, H.; Michishita, K.; Deguchi, A. Design Wind Loads on a Wind Turbine for Strong Wind.In Proceedings of the BBAA VI International Colloquium on: Bluff Bodies Aerodynamics & Applications,Milano, Italy, 20–24 July 2008.
23. Burton, T.; Jenkins, N.; Sharpe, D.; Bossanyi, E. Wind Energy Handbook, 2nd ed.; Wiley: Hoboken, NJ,USA, 2011.
24. Brondsted, P.; Nijssen, R.P.L. Advances in Wind Turbine Blade Design and Materials; Elsevier: Amsterdam,The Netherlands, 2013.
25. Irwin, J.S. A theoretical variation of the wind profile power-law exponent as a function of surface roughnessand stability. Atmos. Environ. 1979, 13, 191–194.
26. Montavon, C.; Jones, I.; Staples, C.; Strachan, C.; Gutierrez, I. Practical issues in the use of CFD for modellingwind farms. In Proceedings of the European Wind Energy Conference & Exhibition 2009, Marseille, France,16–19 March 2009.
27. Kono, T.; Nebucho, S.; Kogaki, T.; Kiwata, T.; Kimura, S.; Komatsu, N. Numerical Analysis of the Effects ofRotating Wind Turbine Blades on the Aerodynamic Forces Acting on Tower. Energies 2017, 10, 121.
28. Hill, K.O.; Meltz, G. Fiber Bragg grating technology fundamentals and overview: Fiber gratings,photosensitivity, and poling. J. Light. Technol. 1997, 15, 1263–1276.
29. Othonos, A.; Kalli, K. Fiber Bragg Gratings: Fundamentals and Applications in Telecommunications and Sensing;Artech House: London, UK, 1999.
30. Her, S.C.; Huang, C.Y. Effect of Coating on the Strain Transfer of Optical Fiber Sensors. Sensors 2011,11, 6926–6941.
31. Perry, M.; Saafi, M.; Fusiek, G.; Niewczas, P. Hybrid optical-fibre/geopolymer sensors for structural healthmonitoring of concrete structures. Smart Mater. Struct. 2015, 24, 045011.
32. Irwin, G.R.; Kies, J.A. Critical energy rate analysis of fracture strength. SPIE Milest. Ser. MS 1997,137, 136–141.
33. Perry, M.; Livina, V.; Niewczas, P. Tipping point analysis of cracking in reinforced concrete. Smart Mater.Struct. 2016, 25, 015027.
34. Perry, M.; McKeeman, I.; Saafi, M.; Niewczas, P. Wireless surface acoustic wave sensors for displacementand crack monitoring in concrete structures. Smart Mater. Struct. 2016, 25, 035035.
35. Kurkjian, C.R.; Krause, J.T.; Matthewson, M.J. Strength and fatigue of silica optical fibers. J. Light. Technol.1989, 7, 1360–1370.
36. Bernardo, J.; Smith, A. Bayesian Theory, 1st ed.; Wiley: Chichester, UK, 2000.37. Vanik, M.; Beck, J.; Au, S. Bayesian Probabilistic Approach to Structural Health Monitoring. J. Eng. Mech.
2000, 126, 738–745.38. Glisic, B. Influence of the gauge length on the accuracy of long-gauge sensors employed in monitoring of
prismatic beams. Meas. Sci. Technol. 2011, 22, 035206.39. McKeeman, I.; Fusiek, G.; Perry, M.; Niewczas, P. In-situ temperature calibration procedure for temperature
and strain fibre Bragg grating sensors for monitoring pre-stressing tendons. In Proceedings of SPIE—TheInternational Society for Optical Engineering; SPIE: Bellingham, WA, USA, 2015.
40. Chen, W.T.; Nelson, C.W. Thermal Stress in Bonded Joints. IBM J. Res. Dev. 1979, 23, 179–188.41. Her, S.C.; Huang, C.Y. Thermal Strain Analysis of Optic Fiber Sensors. Sensors 2013, 13, 1846–1855.42. Wan, K.T. Quantitative Sensitivity Analysis of Surface Attached Optical Fiber Strain Sensor. IEEE Sens. J.
2014, 14, 1805–1812.

Sensors 2017, 17, 1925 20 of 20
43. Yoon, H.J.; Kim, C.G. The mechanical strength of fiber Bragg gratings under controlled UV laser conditions.Smart Mater. Struct. 2007, 16, 1315–1319.
44. Gallo, K.; Hale, R.; Tarpley, D.; Yu, Y. Evaluation of the Relationship between Air and Land SurfaceTemperature under Clear- and Cloudy-Sky Conditions. J. Appl. Meteor. Climatol. 2010, 50, 767–775.
45. DNV. Det Norske Veritas: Guidelines for Design of Wind Turbines, 2nd ed.; DNV: Oslo, Norway, 2002.46. Worden, K.; Manson, G. The application of machine learning to structural health monitoring. Philos. Trans.
R. Soc. Lond. Math. Phys. Eng. Sci. 2007, 365, 515–537.47. Bang, H.J.; Kim, H.I.; Lee, K.S. Measurement of strain and bending deflection of a wind turbine tower using
arrayed FBG sensors. Int. J. Precis. Eng. Manuf. 2012, 13, 2121–2126.48. Benedetti, M.; Fontanari, V.; Zonta, D. Structural health monitoring of wind towers: Remote damage
detection using strain sensors. Smart Mater. Struct. 2011, 20, 055009.
c© 2017 by the authors. Licensee MDPI, Basel, Switzerland. This article is an open accessarticle distributed under the terms and conditions of the Creative Commons Attribution(CC BY) license (http://creativecommons.org/licenses/by/4.0/).