1 myths and realities about governance and corruption: global evidence and lessons for ukraine...
DESCRIPTION
3 Salient Points for Presentation The ‘Power of Data’ [on Governance & Institutions] – while ‘sensitive’, & margins of error (not uniquely), data informs and empowers From Attaining Macro-Stability to Sustaining it: complementary governance reforms–key to growth World Average shows disappointing progress on Governance: It is a binding constraint nowadays Significant variance: some countries show that it is feasible to improve governance in the short term Some strategies and interventions have not worked – vs. what may work better in future? Implications for the next stage: re-focus, franklyTRANSCRIPT
1
Myths and realities about Governance and Corruption:
Global evidence and lessons for Ukraine
Daniel Kaufmann, The World Bank Institute
www.worldbank.org/wbi/governance
Special Seminar Presentation at ICPS, Kyiv, Ukraine, June 15th, 2005
2
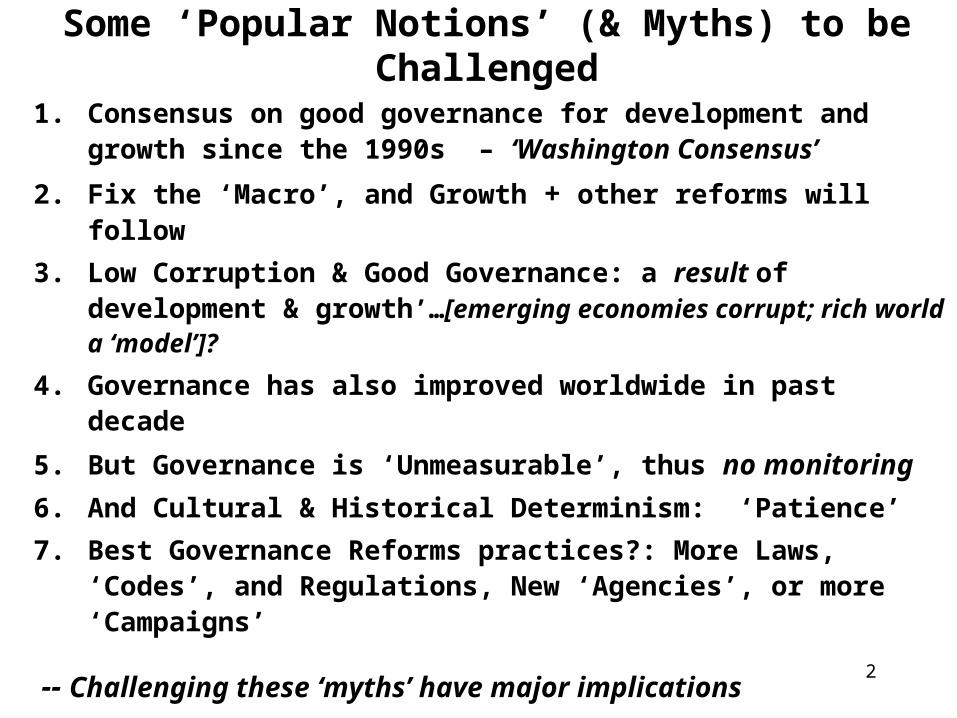
Some ‘Popular Notions’ (& Myths) to be Challenged
1. Consensus on good governance for development and growth since the 1990s – ‘Washington Consensus’
2. Fix the ‘Macro’, and Growth + other reforms will follow3. Low Corruption & Good Governance: a result of development
& growth’…[emerging economies corrupt; rich world a ‘model’]?
4. Governance has also improved worldwide in past decade5. But Governance is ‘Unmeasurable’, thus no monitoring6. And Cultural & Historical Determinism: ‘Patience’ 7. Best Governance Reforms practices?: More Laws, ‘Codes’,
and Regulations, New ‘Agencies’, or more ‘Campaigns’
-- Challenging these ‘myths’ have major implications

3
Salient Points for Presentation • The ‘Power of Data’ [on Governance & Institutions] –
while ‘sensitive’, & margins of error (not uniquely), data informs and empowers
• From Attaining Macro-Stability to Sustaining it: complementary governance reforms–key to growth
• World Average shows disappointing progress on Governance: It is a binding constraint nowadays
• Significant variance: some countries show that it is feasible to improve governance in the short term
• Some strategies and interventions have not worked – vs. what may work better in future?
• Implications for the next stage: re-focus, frankly
4
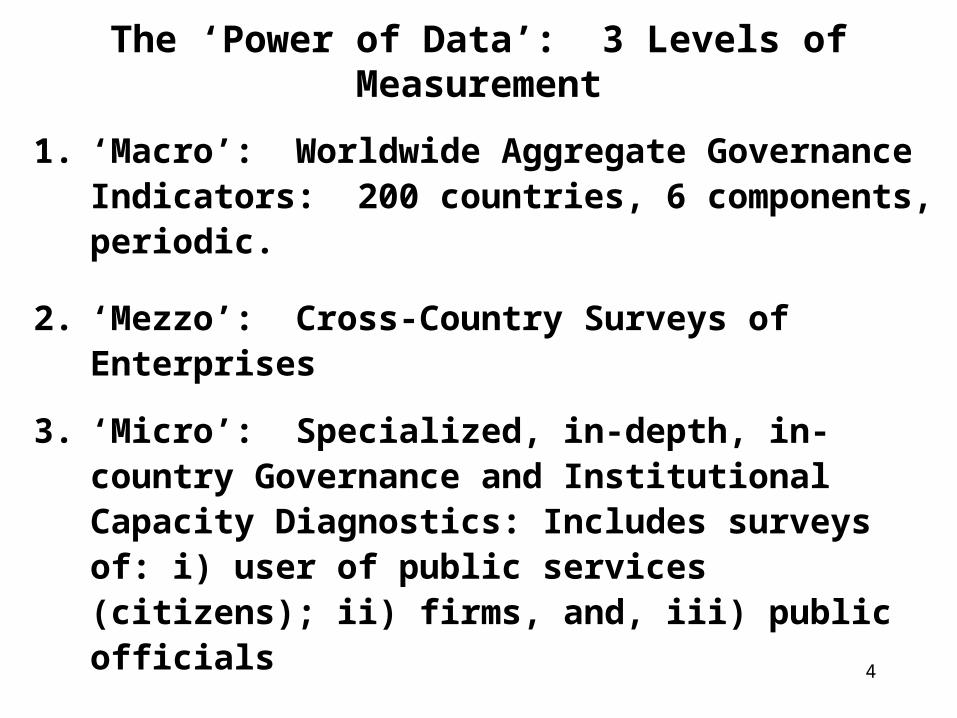
The ‘Power of Data’: 3 Levels of Measurement
1. ‘Macro’: Worldwide Aggregate Governance Indicators: 200 countries, 6 components, periodic.
2. ‘Mezzo’: Cross-Country Surveys of Enterprises
3. ‘Micro’: Specialized, in-depth, in-country Governance and Institutional Capacity Diagnostics: Includes surveys of: i) user of public services (citizens); ii) firms, and, iii) public officials

6
Six Dimensions of Governance
• The process by which those in authority are selected and replaced – VOICE AND ACCOUNTABILITY – POLITICAL STABILITY & ABSENCE OF
VIOLENCE/TERRORISM• The capacity of government to formulate and implement
policies– GOVERNMENT EFFECTIVENESS– REGULATORY QUALITY
• The respect of citizens and state for institutions that govern interactions among them – RULE OF LAW – CONTROL OF CORRUPTION
Governance as the set of traditions and institutions by which authority in a country is exercised – specifically:

7
Governance Data
• “Perceptions” data on governance from 37 different sources constructed by 31 different organizations– 12 new data sources for 2004– Use new data for minor backwards revisions for 1996-
2002• Data sources include cross-country surveys of firms,
commercial risk-rating agencies, think-tanks, government agencies, international organizations, etc.
• 352 proxies for various dimensions of governance • Organize these measures into six clusters
corresponding to definition of governance, for five periods: 1996, 1998, 2000, 2002, 2004

8
Sources of Governance Data• Cross-Country Surveys of Firms: Global Competitiveness Survey,
World Business Environment Survey, World Competitiveness Yearbook, BEEPS
• Cross-Country Surveys of Individuals: Gallup International Voice of the People, Latinobarometro, Afrobarometer, Vanderbilt University/USAID
• Expert Assessments from Commercial Risk Rating Agencies: DRI, PRS, EIU, World Markets Online, Merchant International Group, IJET Travel Consultancy, PERC
• Expert Assessments from NGOs, Think Tanks: Reporters Without Borders, Heritage Foundation, Freedom House, Amnesty International, Bertelsmann Foundation, Fundar, International Research and Exchanges Board, Brown University, Columbia University, Binghamton University
• Expert Assessments from Governments, Multilaterals: World Bank CPIA, EBRD, AFDB, ADB, UNECA, State Dept. Human Rights Report

9
Why Aggregate Indicators?
Basic Premise: individual data sources provide a noisy “signal” of broader concept of governance, e.g.:– trust in police RULE OF LAW– freedom of press VOICE & ACC’TBILITY– policy consistency GOV’T EFFECTIVENESS
Benefits of Aggregation -- through the U.C. Method• aggregate indicators are more informative and precise
about broad concepts of governance• broader country coverage than individual indicator• generate explicit margins of error for country scores

10
Building Aggregate Governance Indicators
• Use Unobserved Components Model (UCM) to construct composite governance indicators, and margins of error for each country
• Estimate of governance: weighted average of observed scores for each country, re-scaled to common units
• Weights are proportional to precision of underlying data sources
• Precision depends on how strongly individual sources are correlated with each other
• Margins of error reflect (a) number of sources in which a country appears, and (b) the precision of those sources
11
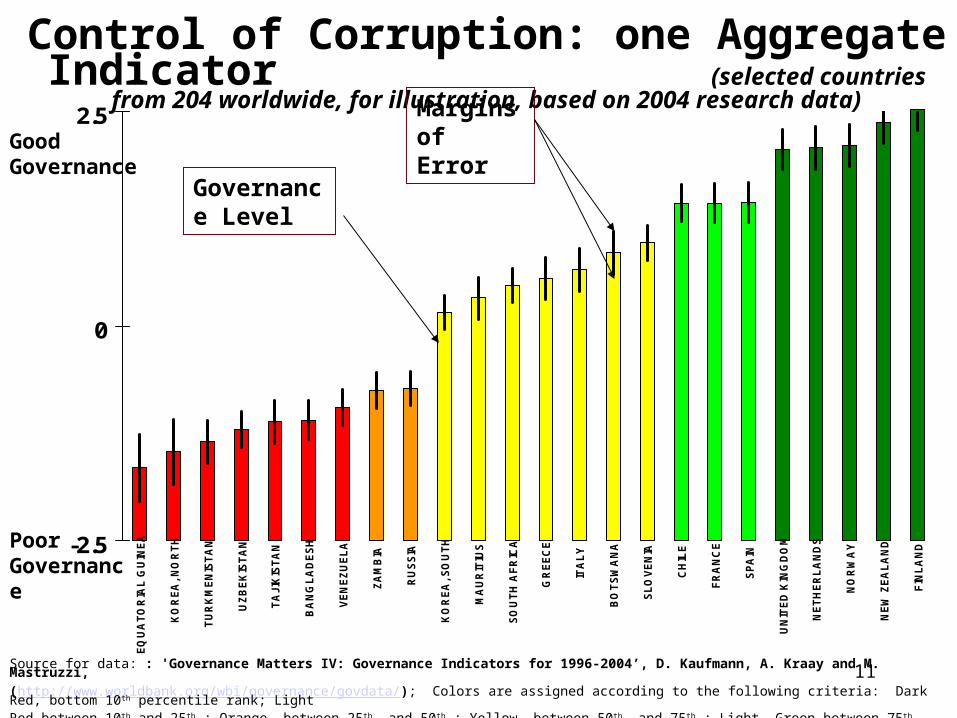
Control of Corruption: one Aggregate Indicator (selected countries from 204 worldwide, for illustration, based on 2004 research
data)
-2.5
0
2.5EQ
UA
TOR
IAL
GU
INEA
KO
REA
, NO
RTH
TUR
KM
ENIS
TAN
UZB
EKIS
TAN
TAJI
KIS
TAN
BA
NG
LAD
ESH
VEN
EZU
ELA
ZAM
BIA
RU
SSIA
KO
REA
, SO
UTH
MA
UR
ITIU
S
SOU
TH A
FRIC
A
GR
EEC
E
ITA
LY
BO
TSW
AN
A
SLO
VEN
IA
CH
ILE
FRA
NC
E
SPA
IN
UN
ITED
KIN
GD
OM
NET
HER
LAN
DS
NO
RW
AY
NEW
ZEA
LAN
D
FIN
LAN
DPoor Governance
Governance Level
Margins of ErrorGood
Governance
Source for data: : 'Governance Matters IV: Governance Indicators for 1996-2004’, D. Kaufmann, A. Kraay and M. Mastruzzi, (http://www.worldbank.org/wbi/governance/govdata/); Colors are assigned according to the following criteria: Dark Red, bottom 10th percentile rank; Light Red between 10th and 25th ; Orange, between 25th and 50th ; Yellow, between 50th and 75th ; Light Green between 75th and 90th ; Dark Green above 90th.

12
Governance Indicators for Croatia, 1996 & 2004
Source: 'Governance Matters IV: Governance Indicators for 1996-2004’, D. Kaufmann, A. Kraay and M. Mastruzzi (May 2005). Report and data at: http://www.worldbank.org/wbi/governance/govdata/. Thin line reflects confidence range interval ( margin of error), at 90% confidence. In any comparison, overlapping ranges imply that no inference about significance in observed difference is warranted.
13
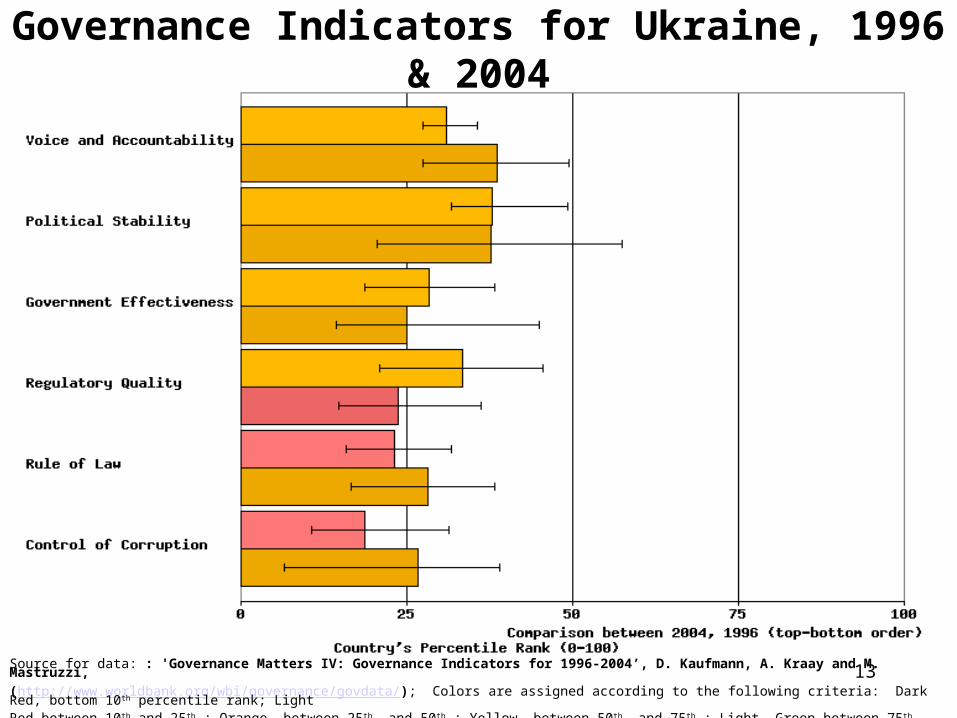
Governance Indicators for Ukraine, 1996 & 2004
Source for data: : 'Governance Matters IV: Governance Indicators for 1996-2004’, D. Kaufmann, A. Kraay and M. Mastruzzi, (http://www.worldbank.org/wbi/governance/govdata/); Colors are assigned according to the following criteria: Dark Red, bottom 10th percentile rank; Light Red between 10th and 25th ; Orange, between 25th and 50th ; Yellow, between 50th and 75th ; Light Green between 75th and 90th ; Dark Green above 90th.
14
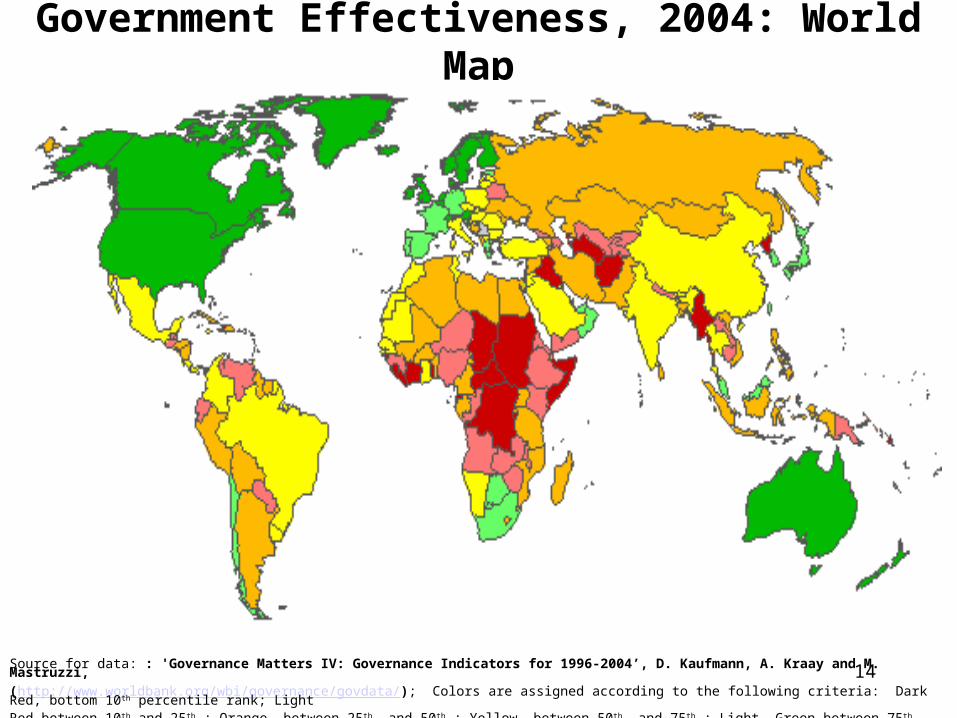
Government Effectiveness, 2004: World Map
Source for data: : 'Governance Matters IV: Governance Indicators for 1996-2004’, D. Kaufmann, A. Kraay and M. Mastruzzi, (http://www.worldbank.org/wbi/governance/govdata/); Colors are assigned according to the following criteria: Dark Red, bottom 10th percentile rank; Light Red between 10th and 25th ; Orange, between 25th and 50th ; Yellow, between 50th and 75th ; Light Green between 75th and 90th ; Dark Green above 90th.
15
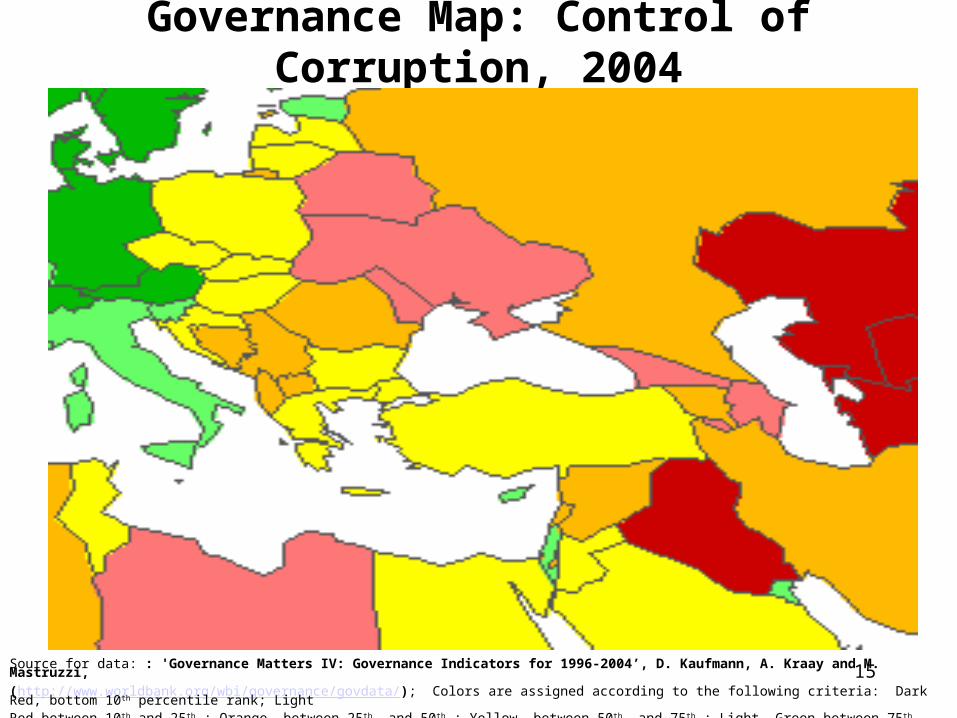
Governance Map: Control of Corruption, 2004
Source for data: : 'Governance Matters IV: Governance Indicators for 1996-2004’, D. Kaufmann, A. Kraay and M. Mastruzzi, (http://www.worldbank.org/wbi/governance/govdata/); Colors are assigned according to the following criteria: Dark Red, bottom 10th percentile rank; Light Red between 10th and 25th ; Orange, between 25th and 50th ; Yellow, between 50th and 75th ; Light Green between 75th and 90th ; Dark Green above 90th.
16
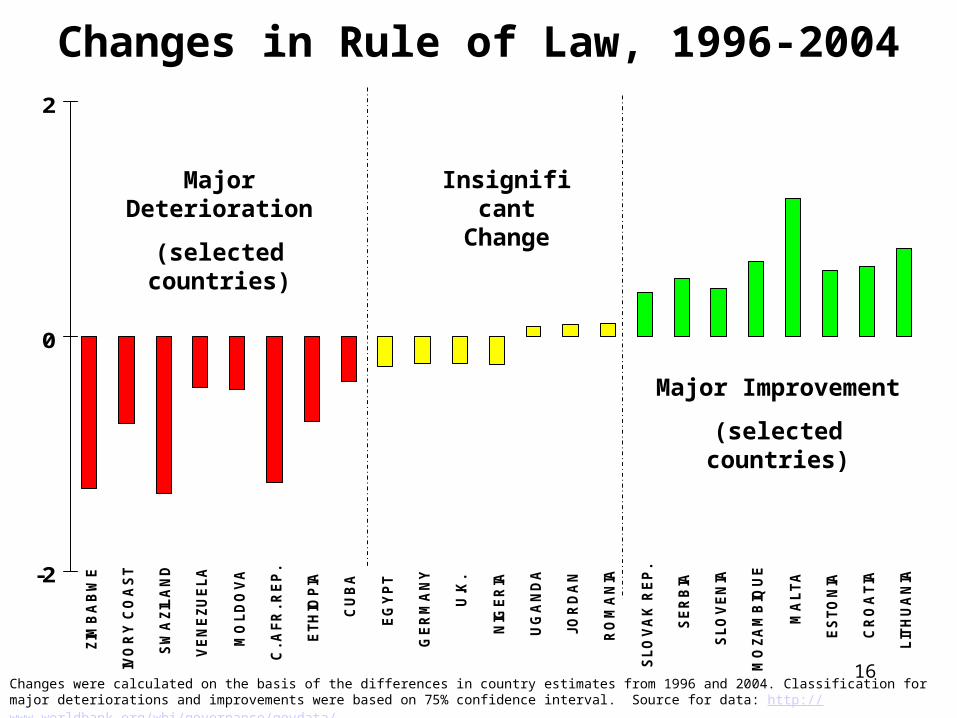
Changes in Rule of Law, 1996-2004
-2
0
2ZI
MB
AB
WE
IVO
RY
CO
AST
SWA
ZILA
ND
VEN
EZU
ELA
MO
LDO
VA
C. A
FR. R
EP.
ETH
IOPI
A
CU
BA
EGYP
T
GER
MA
NY
U.K
.
NIG
ERIA
UG
AN
DA
JOR
DA
N
RO
MA
NIA
SLO
VAK
REP
.
SER
BIA
SLO
VEN
IA
MO
ZAM
BIQ
UE
MA
LTA
ESTO
NIA
CR
OA
TIA
LITH
UA
NIA
Changes were calculated on the basis of the differences in country estimates from 1996 and 2004. Classification for major deteriorations and improvements were based on 75% confidence interval. Source for data: http://www.worldbank.org/wbi/governance/govdata/.
Major Deterioration
(selected countries)
Major Improvement
(selected countries)
Insignificant Change
18
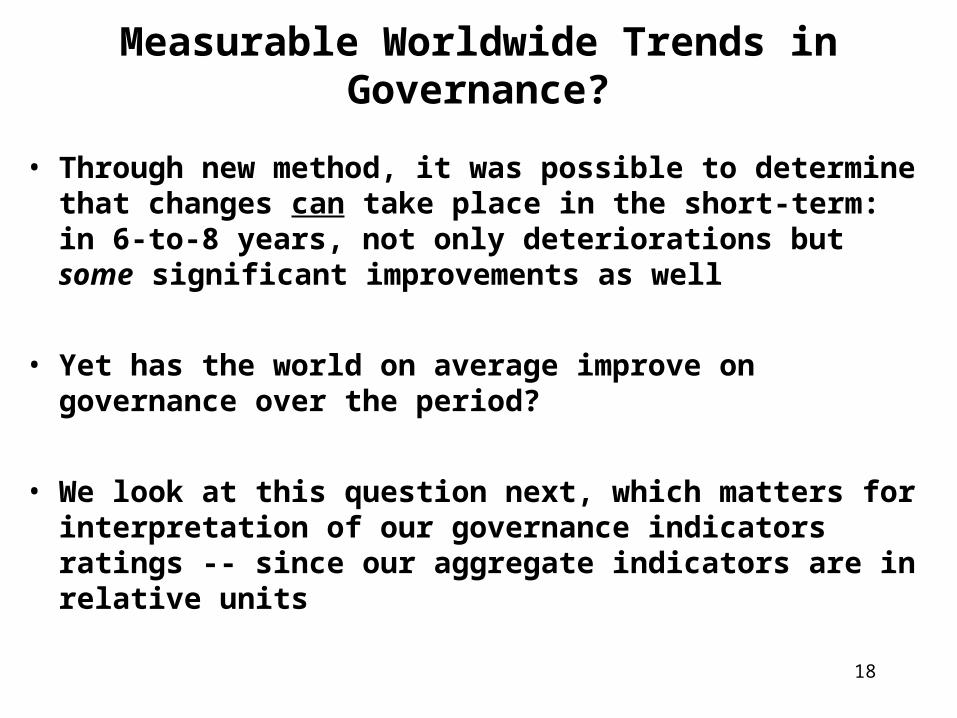
Measurable Worldwide Trends in Governance?
• Through new method, it was possible to determine that changes can take place in the short-term: in 6-to-8 years, not only deteriorations but some significant improvements as well
• Yet has the world on average improve on governance over the period?
• We look at this question next, which matters for interpretation of our governance indicators ratings -- since our aggregate indicators are in relative units
19
0
1.5
3
1984-1988 1989-1993 1994-1998 1999-2002
TRANSITION
EMERGING
OECD+NIC
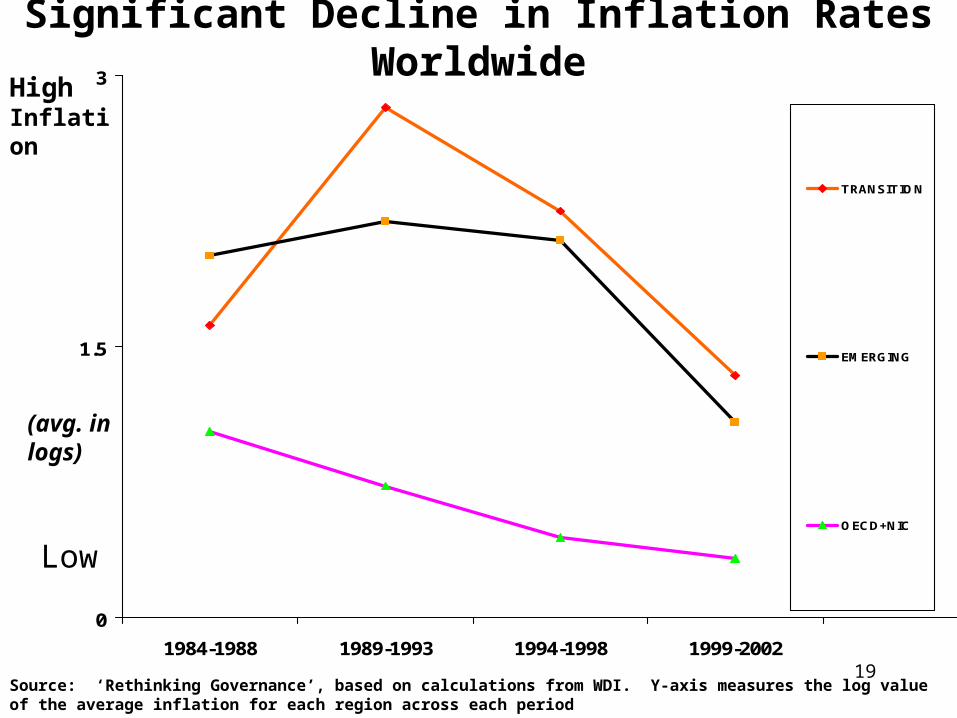
Source: ‘Rethinking Governance’, based on calculations from WDI. Y-axis measures the log value of the average inflation for each region across each period
Significant Decline in Inflation Rates WorldwideHighInflation
Low
(avg. inlogs)
20
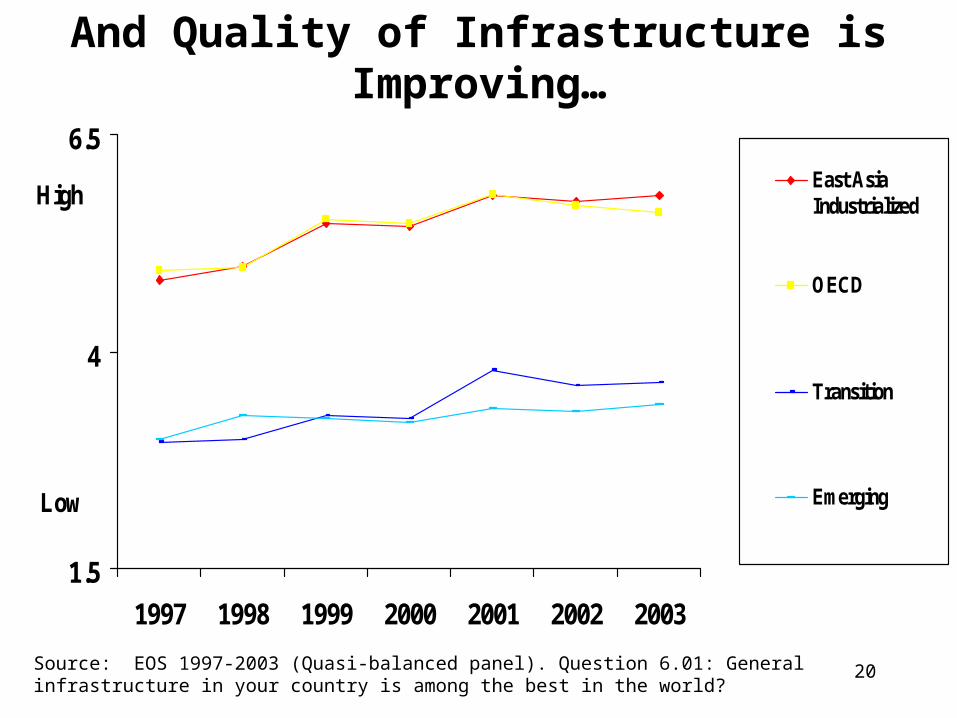
And Quality of Infrastructure is Improving…
1.5
4
6.5
1997 1998 1999 2000 2001 2002 2003
High
Low
East AsiaIndustrialized
OECD
Transition
Emerging
Source: EOS 1997-2003 (Quasi-balanced panel). Question 6.01: General infrastructure in your country is among the best in the world?
21
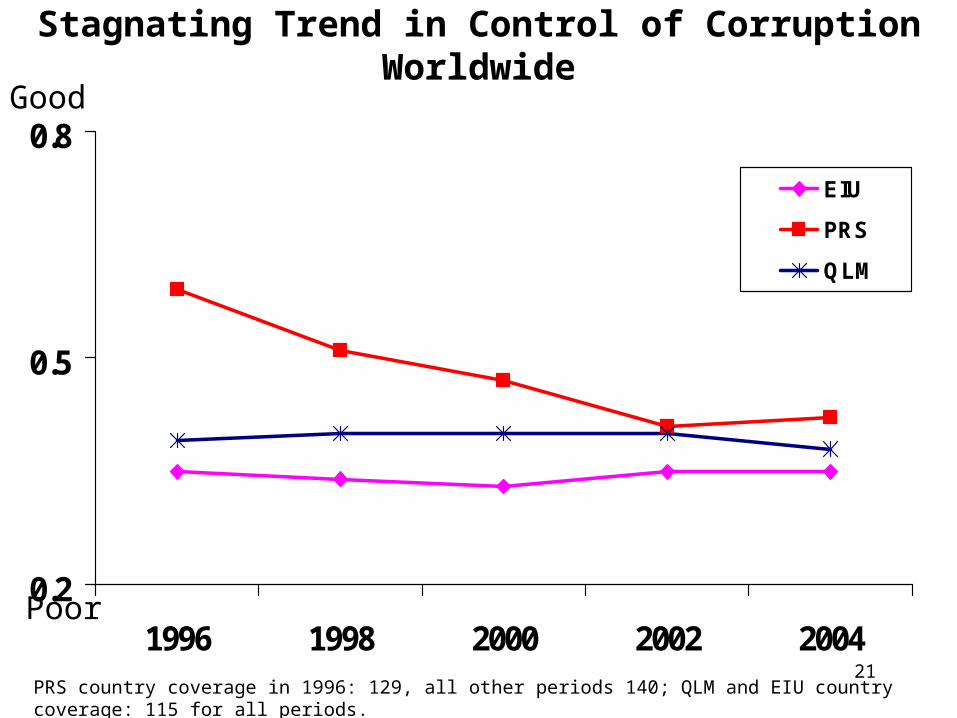
Stagnating Trend in Control of Corruption Worldwide
0.2
0.5
0.8
1996 1998 2000 2002 2004
EIU
PRS
QLM
Poor
Good
PRS country coverage in 1996: 129, all other periods 140; QLM and EIU country coverage: 115 for all periods.
22
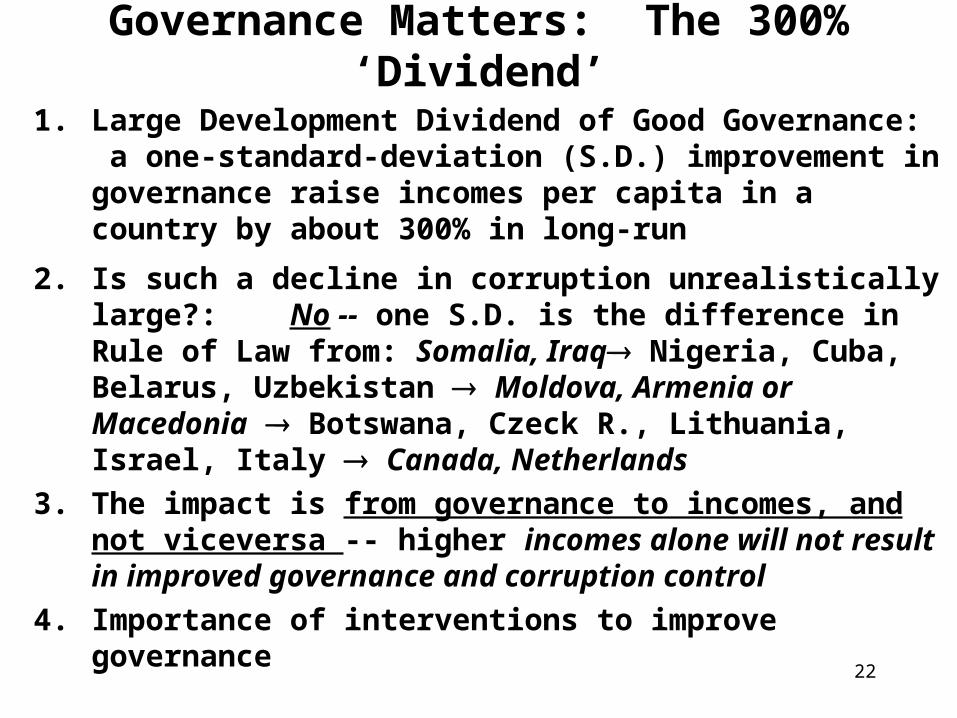
Governance Matters: The 300% ‘Dividend’1. Large Development Dividend of Good Governance:
a one-standard-deviation (S.D.) improvement in governance raise incomes per capita in a country by about 300% in long-run
2. Is such a decline in corruption unrealistically large?: No -- one S.D. is the difference in Rule of Law from: Somalia, Iraq Nigeria, Cuba, Belarus, Uzbekistan Moldova, Armenia or Macedonia Botswana, Czeck R., Lithuania, Israel, Italy Canada, Netherlands
3. The impact is from governance to incomes, and not viceversa -- higher incomes alone will not result in improved governance and corruption control
4. Importance of interventions to improve governance
23
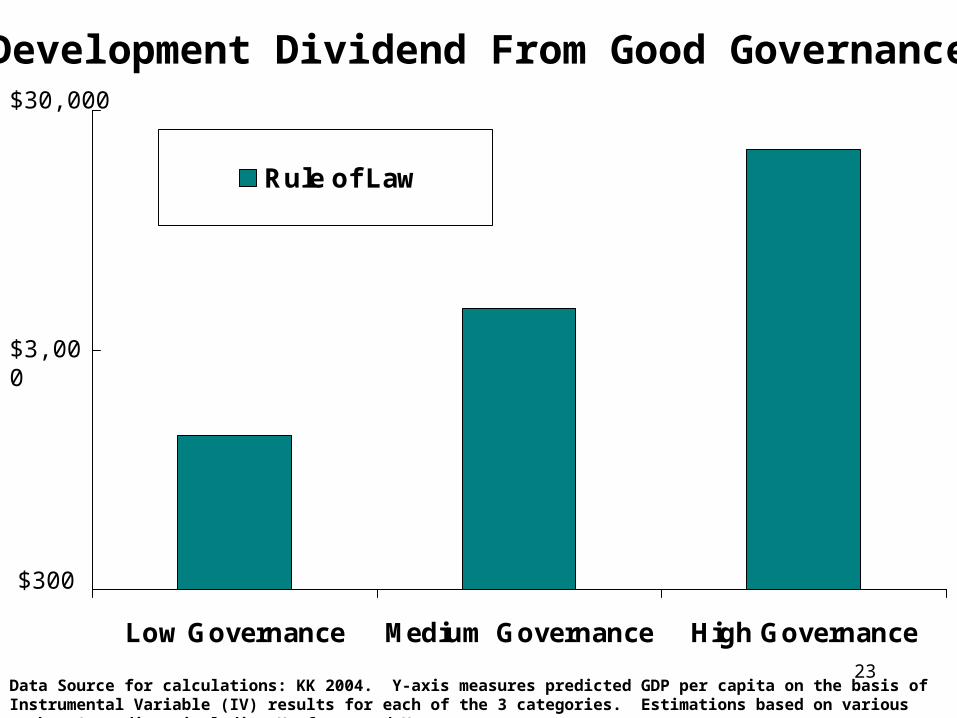
Development Dividend From Good Governance
Low Governance Medium Governance High Governance
Rule of Law
$300
$3,000
$30,000
Data Source for calculations: KK 2004. Y-axis measures predicted GDP per capita on the basis of Instrumental Variable (IV) results for each of the 3 categories. Estimations based on various authors’ studies, including Kaufmann and Kraay.

24
Some Key Constraints to Business –View of the Firm, 2004
0
10
20
30
40
50
60
70
80
Labour Bureaucracy EducatedWorkforce
Work Ethics PolicyInstability
Corruption Tax rates Inflation
Bulgaria Georgia Romania Ukraine
% firms reporting constraints among top 3:
Source: EOS 2004. Question: Select among the the following list of constraints the most problematic factors for doing business in your country… (only selected constraints (and countries) are shown, due to space limitations, illustrative)
25
0
5
10
15
20
25
30
Com
petit
iven
ess G
ain
in N
umbe
r of
Ran
king
s(C
hang
e in
Ran
k Po
sitio
ns)
Constraint
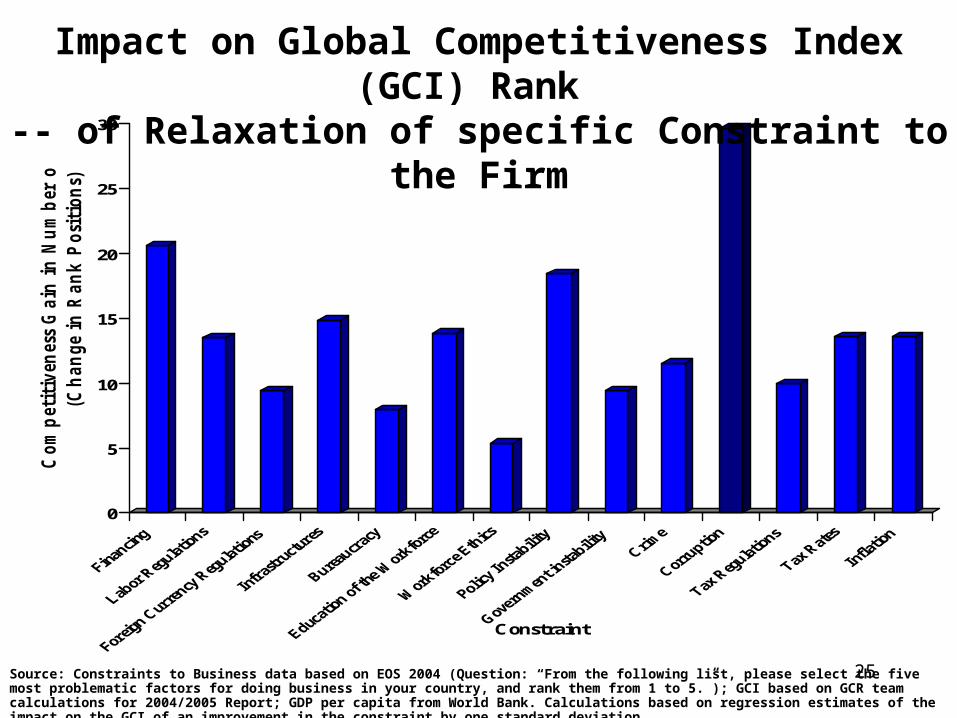
Source: Constraints to Business data based on EOS 2004 (Question: “From the following list, please select the five most problematic factors for doing business in your country, and rank them from 1 to 5.”); GCI based on GCR team calculations for 2004/2005 Report; GDP per capita from World Bank. Calculations based on regression estimates of the impact on the GCI of an improvement in the constraint by one standard deviation.
Impact on Global Competitiveness Index (GCI) Rank -- of Relaxation of specific Constraint to the Firm

26
Leakage of Public Funds, Responses by Firms, 2004
0
20
40
60
80
100
Div
ersio
n of
Pub
lic fu
nds
% firms report high leakage of public funds
Source: EOS firm survey, WEF2002-04. Question: In your country, diversion of public funds to companies, individuals or groups due to corruption is common / never occurs.

27
1
4
7
Inde
pend
ence
of J
udic
iary
High
Low
Independence of Judiciary, Responses by Firms, 2004
Source: EOS firm survey, WEF2002-05. Question: Is the judiciary in your country independent from political influences of members of government, citizens and firms?

28
1
4
7
Australia
Botswan
aChile
Estonia
Ghana
India
Lithuan
ia
Mex
icoRussi
a
Sweden
Ukraine
United K
ingdom
Venezu
ela
Gov
ernm
ent T
rans
pare
ncy
High
Low
Transparency of Government Policies (Views of Firms, 2004)
Source: EOS firm survey, WEF2002-04. Question: Are firms in your country usually informed clearly by the government on changes in policies and regulations affecting your industry?

29
‘Grand Corruption’: Bribery to ‘Purchase’ Laws, Policies, Regulations (Responses by Firms, 2004)
1
2
3
4
5
6
Freq
uenc
y of
bri
bery
High Bribe Frequency
Low
Source: EOS firm survey, WEF2002-04. Question: In your industry, how commonly firms make undocumented extra payments or bribes connected with influencing laws, policies, regulations or decrees to favor selected business interests?

30
Control of ‘Grand Corruption’ (Capture) vs. Government Transparency (EOS 2004)
ZWE ZMBVNM
VEN
URYUSA
GBRARE
UKRUGA
TUR
TUN
TTOTHA
TZA
TWN
CHE
SWE
LKA
ESPZAF
SVN
SVK
SGP
YUGRUS
ROM
PRT
POL
PHL
PER
PRY
PAN
PAK
NOR
NGA
NIC
NZL
NLD
NAM
MOZ
MAR
MEX MUS
MLT
MLI
MYS
MWI
MDG
MKD
LUX
LTU
LVAKORKEN
J OR
J PN
J AM
ITA
ISRIRL
IDN
IND
ISL
HUN
HKG
HND
GTM
GRCGHA
GEO
GMB
FRA
FIN
ETH
EST
SLV
EGY
ECUDOM
DNK
CZE CYP
HRV
CRICOL
CHN
CHL
TCD
CANBGR
BRA
BWA
BIHBOL
BEL
BGD
BHR
AUT
ARGAGO
DZA
1
4
7
2 5 7Government Transparency
Cont
rol o
f Sta
te C
aptu
re
Low
Low High
High
r = 0.81
Sources: EOS firm survey,WEF2004. Question: In your industry, how commonly firms make undocumented extra payments or bribes connected with influencing laws, policies, regulations or decrees to favor selected business interests? Question: Are firms in your country usually informed clearly by the government on changes in policies and regulations affecting your industry?
31
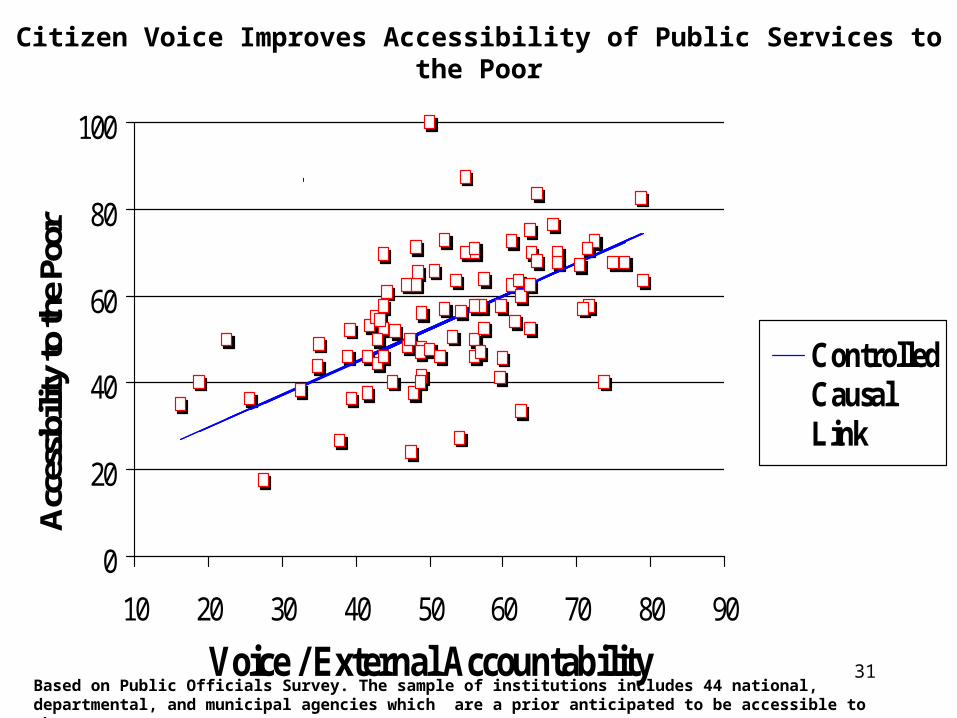
Citizen Voice Improves Accessibility of Public Services to the Poor
Based on Public Officials Survey. The sample of institutions includes 44 national, departmental, and municipal agencies which are a prior anticipated to be accessible to the poor
0
20
40
60
80
100
10 20 30 40 50 60 70 80 90
Voice / External Accountability
Acc
essib
ility
to th
e Po
or
ControlledCausalLink
r = 0.54
32
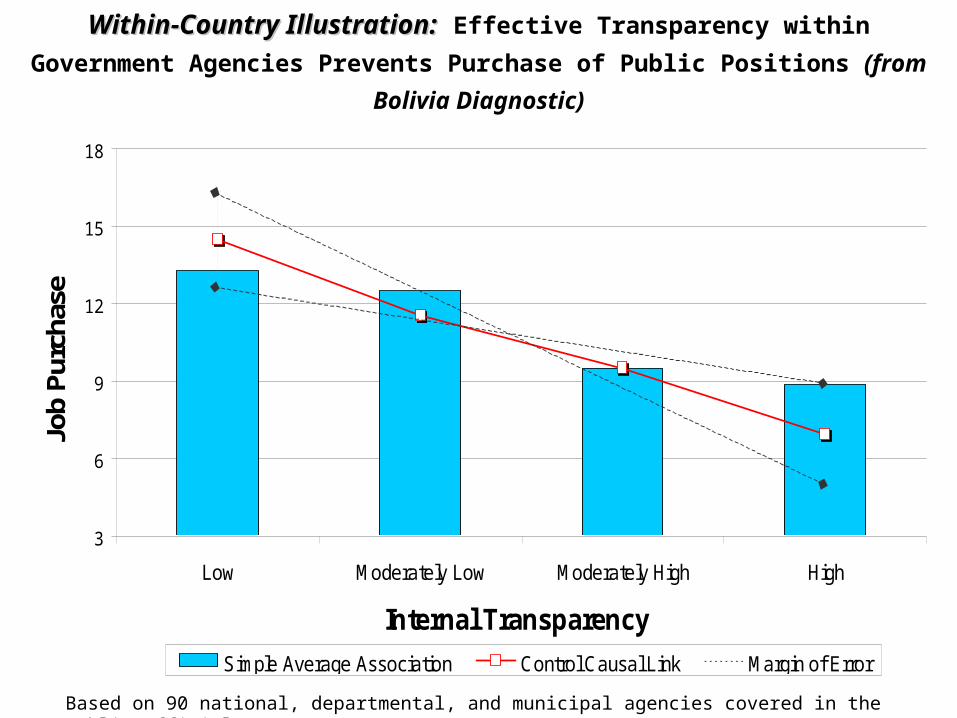
Within-Country Illustration:Within-Country Illustration: Effective Transparency within Government Agencies Prevents Purchase of Public Positions (from Bolivia Diagnostic)
Based on 90 national, departmental, and municipal agencies covered in the Public Officials Survey.
3
6
9
12
15
18
Low Moderately Low Moderately High High
Internal Transparency
Job
Purc
hase
Simple Average Association Control Causal Link Margin of Error

33
Main Findings and ImplicationsSome Key Findings:• Measuring Governance: Important & Feasible –with caution
• Governance matters: large “development dividend” strong causal impact of governance on incomes, not vv.
• But the world on average is ‘stagnant’– with high variance• From focus on the ‘Macro’ to Institutions/Governance as
the binding constraint
Implication: Need to refocus efforts to improve governance • Frank questioning of what has not worked: e.g. anti-
corruption agencies, more traditional T.A, ‘codes’ & laws• The danger of over-regulating (vs. incentives & transparency)• Focusing on what may work in moving forward… (cont.)
34
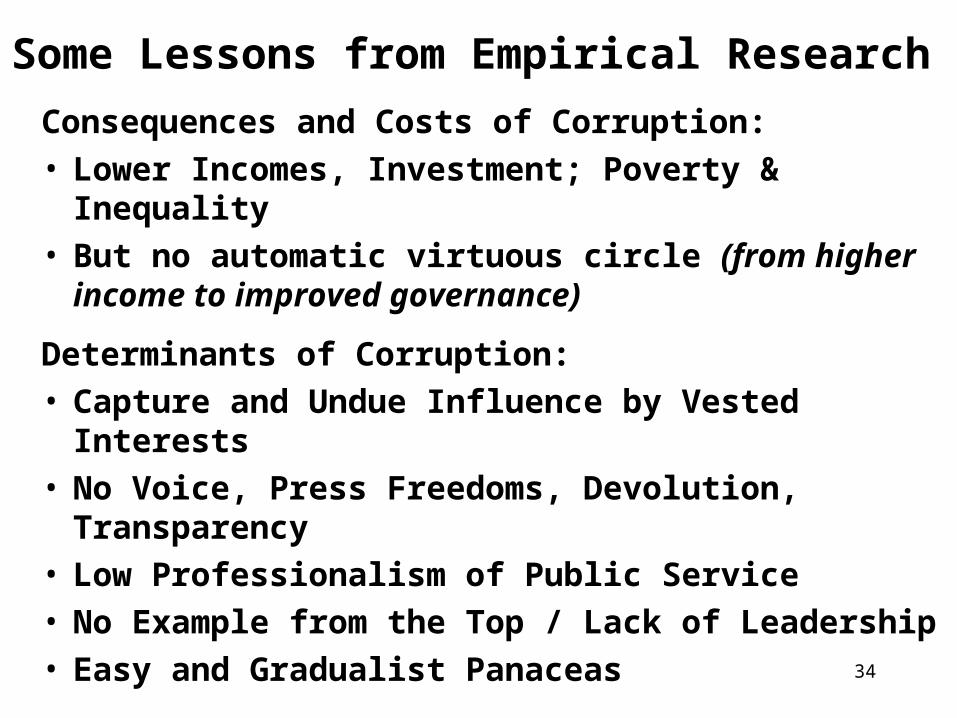
Some Lessons from Empirical ResearchConsequences and Costs of Corruption:• Lower Incomes, Investment; Poverty & Inequality• But no automatic virtuous circle (from higher
income to improved governance)
Determinants of Corruption:• Capture and Undue Influence by Vested Interests • No Voice, Press Freedoms, Devolution,
Transparency• Low Professionalism of Public Service• No Example from the Top / Lack of Leadership• Easy and Gradualist Panaceas

35
No Evidence to support some ‘popular’ notions on Anti-Corruption (A-C) – challenging the following:
1. Constant drafting of new A-C laws/regulations
2. Creating many new Commissions & Agencies
3. Blaming Globalization or Privatization
4. Cultural Relativism (or Regional Characteristics)
5. Historical Determinism/Legal Origins
…by contrast, what may be particularly important…
36
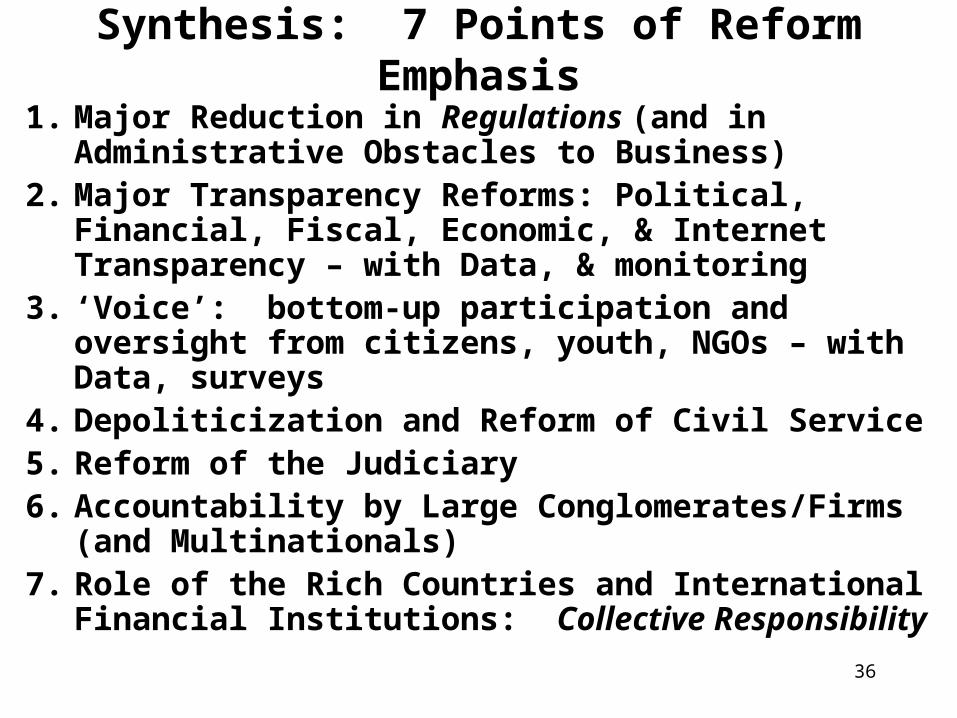
Synthesis: 7 Points of Reform Emphasis1. Major Reduction in Regulations (and in
Administrative Obstacles to Business)2. Major Transparency Reforms: Political,
Financial, Fiscal, Economic, & Internet Transparency – with Data, & monitoring
3. ‘Voice’: bottom-up participation and oversight from citizens, youth, NGOs – with Data, surveys
4. Depoliticization and Reform of Civil Service5. Reform of the Judiciary6. Accountability by Large Conglomerates/Firms
(and Multinationals)7. Role of the Rich Countries and International
Financial Institutions: Collective Responsibility
37
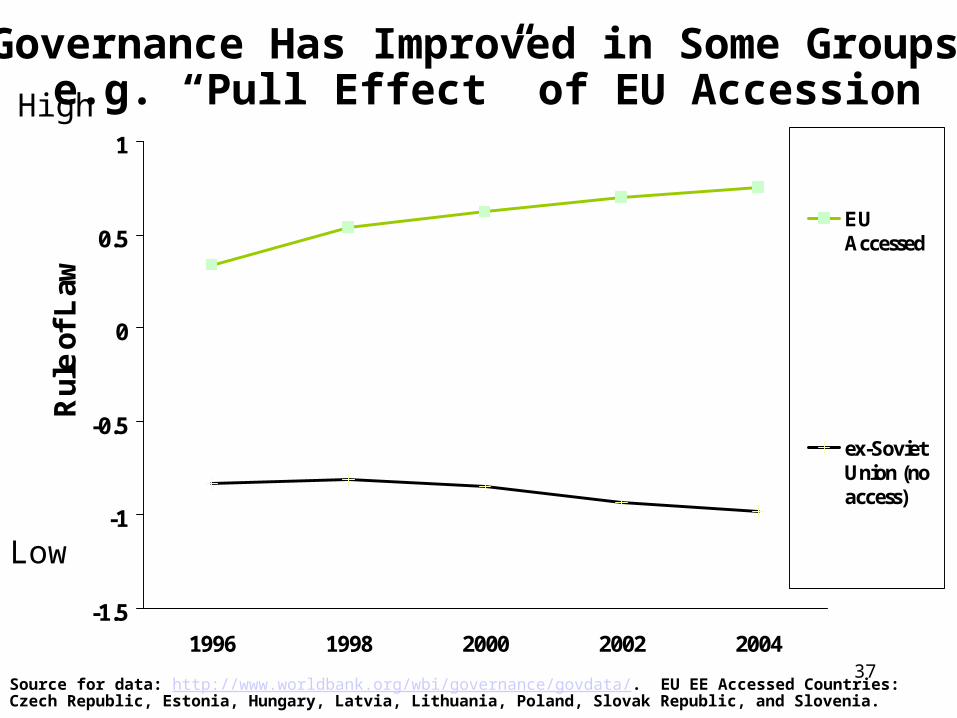
Governance Has Improved in Some Groups:e.g. “Pull Effect” of EU Accession
-1.5
-1
-0.5
0
0.5
1
1996 1998 2000 2002 2004
Rul
e of
Law
EUAccessed
ex-SovietUnion (noaccess)
Source for data: http://www.worldbank.org/wbi/governance/govdata/. EU EE Accessed Countries: Czech Republic, Estonia, Hungary, Latvia, Lithuania, Poland, Slovak Republic, and Slovenia.
High
Low

38
Data for Analysis and Informing Policy Advice,
Not for Precise Rankings
Any data on Governance, Institutions, and Investment Climate is subject to a margin of error. It is not intended for precise country
rankings, but to highlight relative strengths and weaknesses and draw analytical and policy lessons. The data presented here and in the Report do not necessarily reflect official views on rankings by the
World Bank or its Board of Directors. Errors are responsibility of the authors.
Further materials & access to interactive data: General: www.worldbank.org/wbi/governance
Data: www.worldbank.org/wbi/governance/govdata/Report: www.worldbank.org/wbi/governance/pubs/govmatters4.html

39
Basic Scorecard on 10 Transparency Reform Components:
How does the country rate?1. Public Disclosure of Assets and Incomes of Candidates, Public Officials, Politicians and
Legislators - & dependents2. Public Disclosure of Political Campaign contributions by individuals, and of campaign
expenditures3. Public Disclosure of Parliamentary Votes4. Effective Implementation of Conflict of Interest Laws, separating business, politics,
legislation, and government5. Publicly blacklisting firms bribing in public procurement6. Effective Implementation of Freedom of Information Law, with easy access to all to
government information7. Fiscal transparency in central and local budgets (web)8. E*procurement: transparency (web) and competition9. Adoption and implementation of ‘Lobby Law’10. Judiciary transparency and disclosure on funding, assets of judges, and on full
disclosure of judicial decisions
• What is Ukraine’s scorecard rating on these 10 points today-2005?
• What will Ukraine’s scorecard rating be within one year -- 2006 ?