1 objective and warmup: 11/8/10 objective: swbat evaluate the different methods of taking a...
TRANSCRIPT
1
Objective and Warmup: 11/8/10
• Objective: SWBAT Evaluate the different methods of taking a
population census.
• Warmup: Provide ways ecologists measure
populations.

2
Human Populations

3
History of Human Population
Early Hunter Gatherers• Nomadic, With a Strong Sense of the Earth• Practiced Intentional Birth Control
Rise of Agriculture• Necessary for Survival
• Animals became extinct via predation and altered habitat
• Humans began to cultivate own food

4
History of Human Population Cont…
Agriculture Gives Rise to Cities• Food Produced in Country, Consumed in City
• Food wastes are no longer returned to soil• Soil becomes less productive
• Waste of Populations Concentrated in Cities• Population Control in Medieval Societies
• Disease• Famine• Wars

5
History of Human Population Cont..
Industrialization• View of Children During Early Phases of Industrial
Growth• Valued as cheap source of income and cheap
labor• Exponential growth of populations
• By 1900s, Birth Rate in Industrialized World Dropped
• Rise in standards of living• Safe and inexpensive means of birth control
introduced• Increase in the cost of child rearing

6
Human Population Growth

7
0
2000
4000
6000
8000
10000
1750 1950 1995 2025 2100
developed countries
less developed countries

8

9
Current World Population
Global population on November 2, 2009 at 7:23 am U.S. 307,841,263
World 6,794,428,411 • The global population grows by:
Nearly 2.3 persons per seconds Nearly 8,343 persons per hour Over 200,234 persons per day Over 73 million persons per year

10
How Much is a Billion?
• 1,000 seconds = 16.7 minutes• 1 million-s = 16,677 min = 11.6 days• 1 billion-s = 11,574 days = 31.7 years
• 1,000 pennies = ~ 88 ounces = 5.5 pounds• 1 million pennies = 5,500 pounds (~1-Suburban)• 1 billion pennies = 2,750 tons (~2 Space
Shuttles)

11
Objectives and Warmup: 11/9/10
• Objectives: SWBAT Apply the rule of doubling time to
the provided scenarios.
• Warmup: If the current rate of human population
growth continues, the number of people on Earth will double in the next 50 years. Will this rapid growth actually occur?

12
Rate of Global Population Changeuse: International Data Base http://www.census.gov/ipc/www/idbnew.html,
• CBR (crude birth rate) = # births / 1000 population
1990: 24 now: 20.6
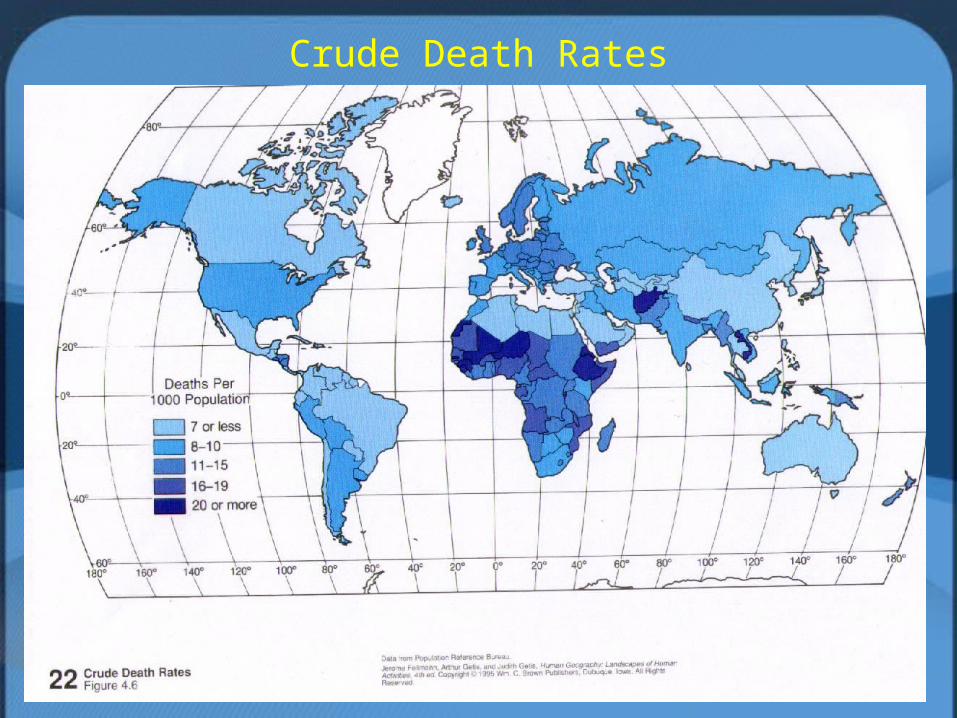
• CDR (crude death rate) = # deaths / 1000 population
1990: 9 now: 8.8
• Growth Rate = (b + i) – (d + e)
1990: 1.5% now: 1.19% growth rates have come down

13
Crude Birth Rates
14
Crude Death Rates

15
Doubling Time
• Doubling Time of a population: 70/annual percentage growth rate.
Doubling time for the Human Population 800 million in 1700 1.6 billion in 1900 3.2 billion in 1965 6.1 billion in 2000
• In 2000, each second 4-5 children born, 2 people died• J shaped curve

16

17
• Women could have 15 children in their lifetime. Yet across the world, they only have 2 ½ children on average. Why is that? Which factors influence the number of children born to each woman, and what effects do they have?
18
Objectives and Warmup 11/11/10
• Objective: SWBAT Analyze the factors that affect birth and
death rates between developing and developed countries.
• Warmup: If a population of 100,000 has 2,700 births
per year and 900 deaths per year, what is its growth rate in percent per year?
Calculate the doubling time for a population with a 1.3% growth rate.

19
LIMITS TO GROWTH
• Thomas Malthus-excess population growth is the cause of many social and environmental problems Disease, famine and population control is only
way to stabilize• Karl Marx- oppression and exploitation are the real
causes of poverty and environmental degradation Population growth is a symptom or result of
other problems, not the source Slow population growth through social
justice.
20
HUMAN DEMOGRAPHY
• Demography - vital statistics about people such as births, deaths, where they live, and population size.
• 2 demographic worlds First is poor, young, and rapidly growing.
- Less-developed countries contain 80% of world population, and will account for 90% of projected growth.
Second is wealthy, old, and mostly shrinking.- Western Europe, Japan.
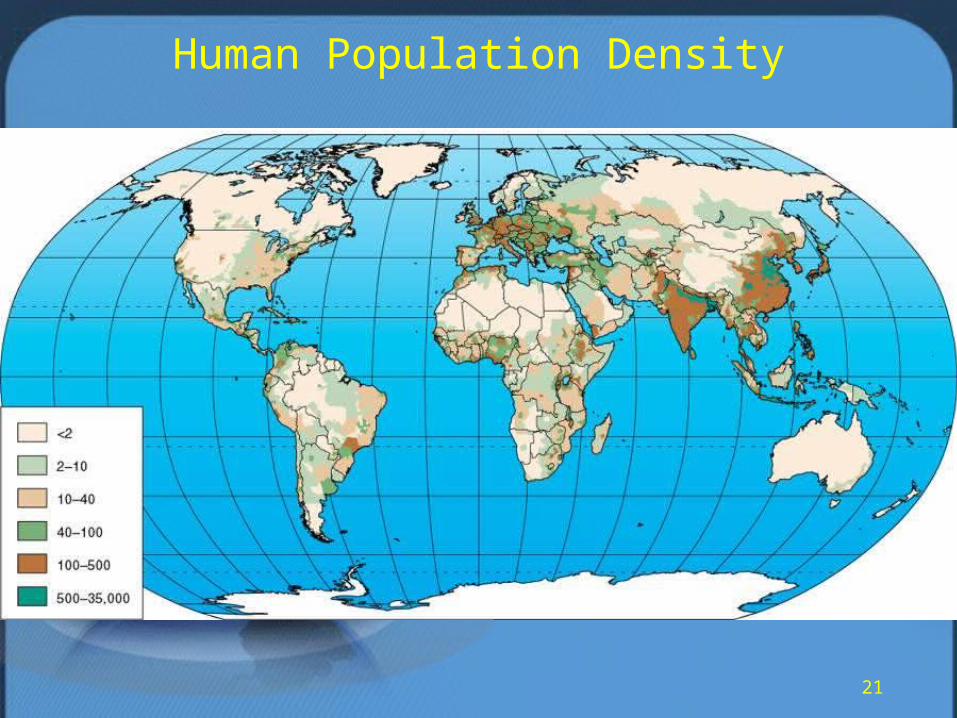
21
Human Population Density

22
Factors affecting birth rates and fertility rates
• Age of woman at time of marriage• Availability and affordability of birth control and
abortion• Children needed in the workforce• Costs of raising and educating children• Culture, religion, tradition• Government programs• Infant mortality

23
Factors affecting death rates
• Availability and affordability of health care, food and better nutrition
• Safer water supplies• Improvements in sanitation and pollution control• Improvements in medical and public health
24
Indicators of overall health of people in a country
• Life expectancy-average number of years a newborn infant can expect to live
• Infant mortality rate-number of babies out of every 1000 born who die before age 1

25
Objectives and Warmup: 11/12/10
• Objectives: Analyze factors that affect population size.
• Warmup: Why are life expectancies and infant
mortality rates in highly developed and developing countries so different?

26
Human Population Dynamics
3 sources of change in population size —• Migration• Fertility• Mortality

27
Migration-Influencing Population Size
Most countries restrict immigration Canada, Australia, U.S. - most immigration
• ~1% of developing nations pop. Emigrates• Migration from rural to urban areas

28
Family Planning
• Reduce births and abortions reduces children's social services needs reduces risk of childbearing deaths
• Effectiveness depends on program design and funding: good in some countries with good program poor in other countries
29
Rewards and Penalties to Reduce Births
• What might work: Encourage people to have fewer children Reinforce existing customs and trends toward
smaller families Don’t penalize for already existing larger
families Increase poor family’s economic status

30
Case Study-India
• Family planning efforts began in 1952; fertility rate declined from 5.3 to 3.4 but population grow is still exponential
• Disappointing results due to: poor planning bureaucratic inefficiency low status of women extreme poverty lack of administrative & financial support

31
Curbing Population Growth
• Provide economic incentives for having less children
• Empower and educate women Access to education and paying jobs outside
home Society doesn’t suppress women’s rights
• Government family planning services• Reduce poverty and economic
development

32
Case Study-China
• Family planning efforts began in 1970• Population control program is extensive, intrusive and
strict: postpone childbearing only one child/family -->benefits
- Free education and health care- Increased personal and family incomes- Preferential housing and retirement income
effective because China is dictatorship; limited resources would have mean disaster

33
Objectives and Warmup
• Objectives: Analyze age structure distributions to determine
the difference between developing and developed countries.
• Warmup: In 2050, there will be approximately 9 billion
people in the world, according to the most widely accepted estimate. What problems might this create for developing countries? What challenges will industrialized nations face?

34
Age Structure
• Bar graph that shows the age and gender composition of a region
• horizontal axis: gender male: left-hand female: right-hand absolute number of people or %
• vertical axis: age 5-year or 10-year age groups

35
Age Structure

36
Objectives and Warmup: 11/16/10
• Objectives: Analyze age structure distributions to
determine if the country is considered to be developed or developing.
Analyze age structure distributions to determine the future population of a specified country.
• Warmup: Describe at least three factors that
determine whether a nation is classified as a developed or developing country.

37
Developed vs. Developing…
standard of living• literacy rate• birth rate• death rate, esp. infant mortality rate• per capita GDP• degree of urbanization• life expectancy• health care system• educational system, esp. opportunities for women• amount of infrastructure• global vs local market economy• use of technology

38
Objectives and Warmup: 11/17/10
• Objectives: Analyze the demographic transition model
using classroom data
• Warmup: Compare the reproductive rights of women
in a highly developed nation (other than the USA) with their counterparts in one of the least developed nations.

39
4 Stages of the Demographic Transition
• Birth rates, death rates and growth rates change through time as societies change: modernize, urbanize gain access to technology

40
Stage 1: Pre-Industrial
• High birth rates, high (at time erratic) death rates, low growth rates
• Stage for much of human history, traditional societies
• Living conditions severe

41
Stage 2: Transitional
• High birth rates, declining death rates, rising growth rates• Improvements in sanitation (water) and medicine• Ex. Europe at the start of Industrial Revolution
developing countries since the 50s/60s much of Africa today, some countries of Asia
(Afghanistan, Nepal, etc.)
42
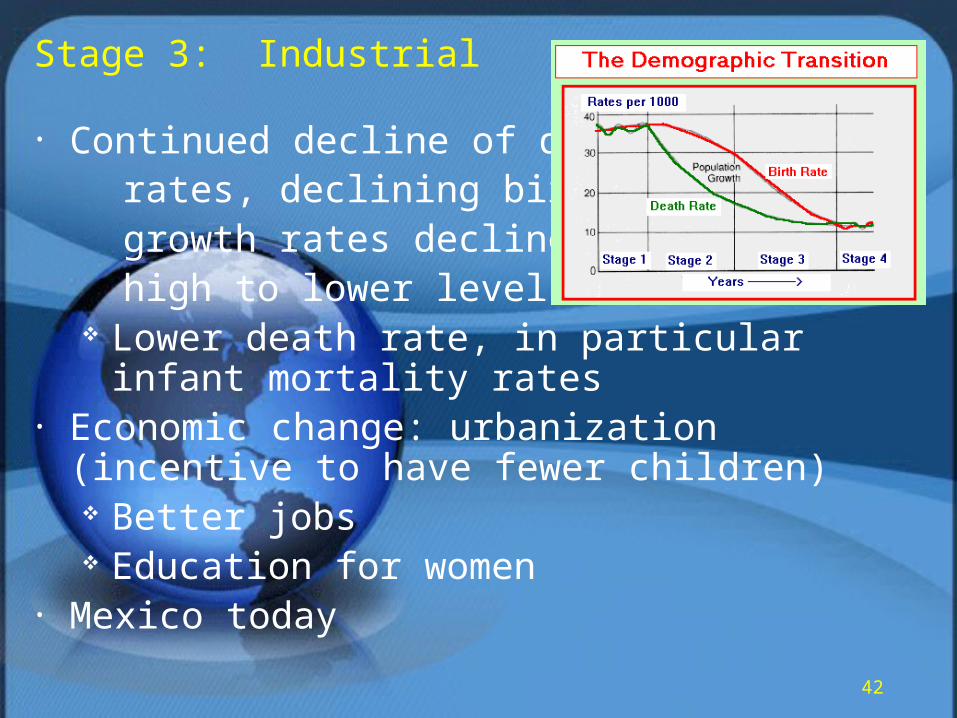
Stage 3: Industrial
• Continued decline of death rates, declining birth rates, growth rates decline from high to lower levels
Lower death rate, in particular infant mortality rates
• Economic change: urbanization (incentive to have fewer children) Better jobs Education for women
• Mexico today
43
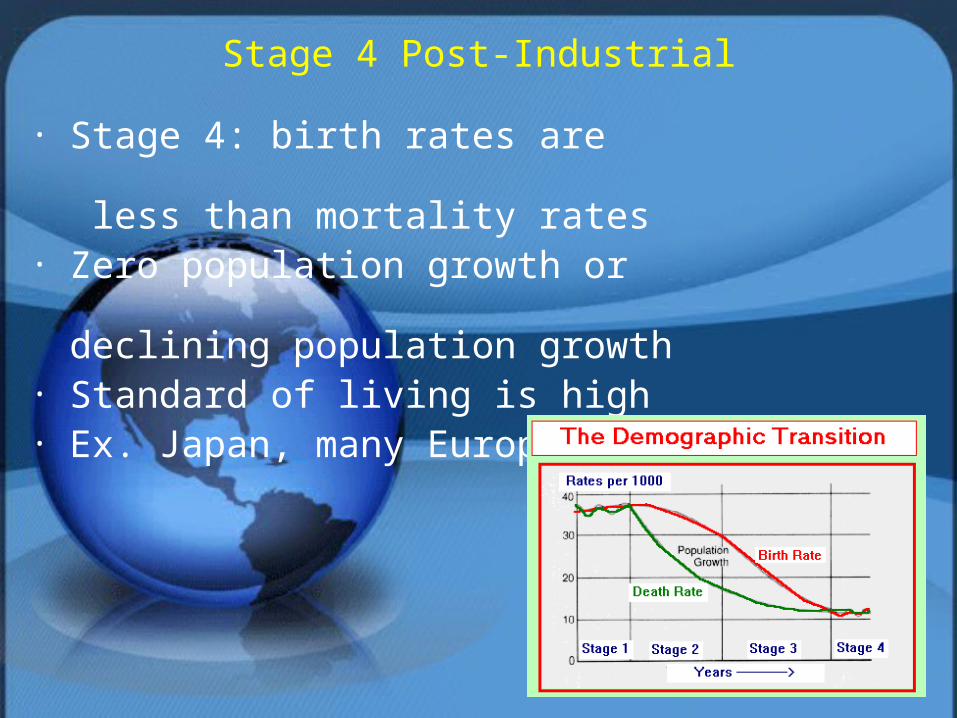
Stage 4 Post-Industrial
• Stage 4: birth rates are less than mortality rates
• Zero population growth or declining population growth
• Standard of living is high• Ex. Japan, many European countries