1 overview services, supports and needs for job development kathryn dupree, deputy commissioner...
TRANSCRIPT
1
OVERVIEW
Services, Supports and Needs
for Job Development
Kathryn duPree, Deputy Commissioner
January 12, 2006
Revised January 20, 2006
2
Our Mission
Presence and participation in Connecticut town life Opportunities to develop and exercise competence Opportunities to make choices in pursuit of a personal future Good relationships with family and friends Respect and dignity.
The mission of the Department of Mental Retardation is to join with others to create the conditions under which all people with mental retardation can experience:

3
Our Values
Personal choice Self-determination Importance of families Community inclusion Partnerships Teaching and skill development Protection of rights Promoting safety and health.
Our mission and values drive our services and supports. They place a strong emphasis on:

4
Salisbury
NorthCanaan
Canaan
Norfolk
Goshen
Cornwall
Sharon
Colebrook Hartland
WinchesterBarkhamsted
TorringtonNew
Hartford
HarwintonLitchfieldWarren
Kent
ThomastonMorrisWashington
NewMilford
BethlehemWatertown
Sherman
Bridgewater
RoxburyWoodbury
Middlebury
Waterbury
Wolcott
CheshireProspect
Naugatuck
BeaconFallsOxford
Southbury
Newtown
Brookfield
NewFairfield
Danbury
Bethel
ReddingRidgefield
Greenwich
StamfordDarien
NewCanaan
Wilton
NorwalkWestport
Weston
Easton
FairfieldBridgeport
Stratford
Trumbull
Monroe
Milford
Orange
DerbyAnsonia
Seymour
Shelton
Woodbridge
BethanyHamden
NorthHaven
NewHaven East
HavenWest
HavenBranford
NorthBranford
Wallingford Durham
Guilford
Meriden MiddletownMiddlefield
EastHampton
Haddam
Killingworth
MadisonClinton
Westbrook
DeepRiver Essex
Chester
EastHaddam
Lyme
OldLyme
GranbyEast
Granby
SuffieldEnfield
Windsor
Bloomfield
SimsburyCanton
SouthWindsor
EastWindsor
SomersStafford
Ellington
Tolland
Vernon
BoltonManchesterEast
Hartford
WestHartford
Avon
BurlingtonFarmington
Plymouth
BristolPlainville
NewBritain
BerlinSouthington
RockyHill
Newington Glastonbury
Marlborough
Hebron
Andover
UnionWoodstock
Thompson
WillingtonAshford
EastfordPomfret
Putnam
Killingly
BrooklynHamptonChaplin
MansfieldCoventry
Columbia
Lebanon
WindhamScotland
CanterburyPlainfield
Sterling
Voluntown
GriswoldLisbon
SpragueFranklin
Bozrah NorwichColchester
SalemMontville
Preston
Ledyard
NorthStonington
StoningtonGroton
NewLondon
Waterford
EastLymeOld
Saybrook
CromwellPortland
WindsorLocks
Hartford
Wethersfield
NORTH
SOUTH
WEST
DMR Regions
5
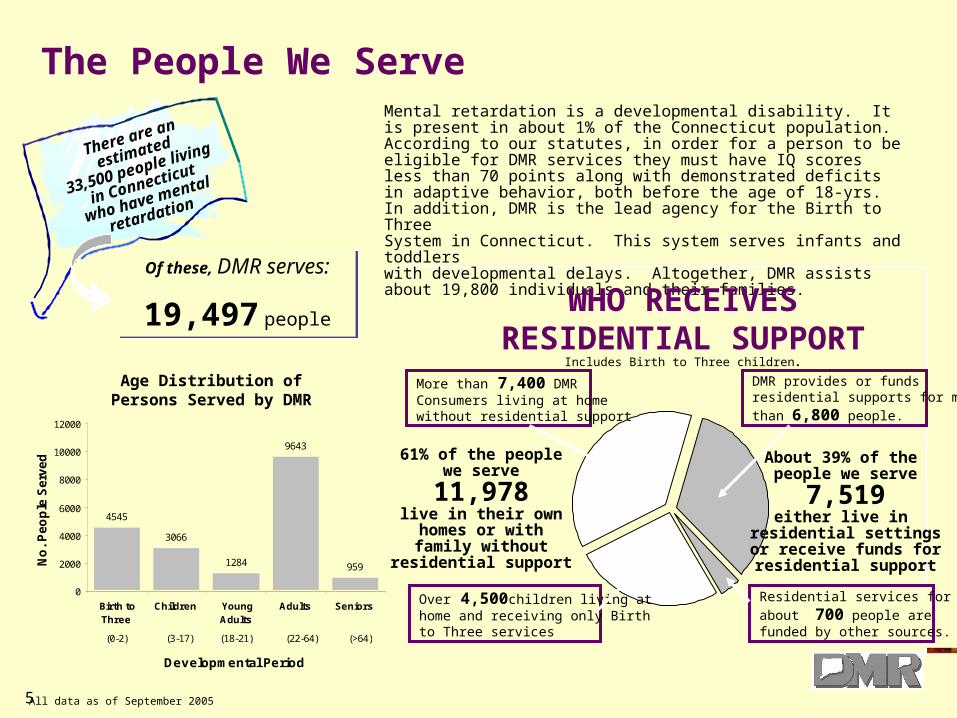
The People We Serve
Of these, DMR serves:
19,497 people
There are an
estimated
33,500 people living
in Connecticut
who have mental
retardation
Mental retardation is a developmental disability. It is present in about 1% of the Connecticut population. According to our statutes, in order for a person to be eligible for DMR services they must have IQ scores less than 70 points along with demonstrated deficits in adaptive behavior, both before the age of 18-yrs. In addition, DMR is the lead agency for the Birth to ThreeSystem in Connecticut. This system serves infants and toddlers with developmental delays. Altogether, DMR assists about 19,800 individuals and their families.
Residential services for
about 700 people arefunded by other sources.
About 39% of the people we serve
7,519either live in
residential settingsor receive funds forresidential support
DMR provides or fundsresidential supports for more
than 6,800 people.
61% of the peoplewe serve
11,978live in their ownhomes or withfamily without
residential support
More than 7,400 DMR Consumers living at homewithout residential support
Over 4,500children living at home and receiving only Birth to Three services
WHO RECEIVESRESIDENTIAL SUPPORT
Includes Birth to Three children.
All data as of September 2005
4545
3066
1284
9643
959
0
2000
4000
6000
8000
10000
12000
Birth toThree
Children YoungAdults
Adults Seniors
Developmental Period
No
. P
eo
ple
Se
rve
d
(0-2) (3-17) (18-21) (22-64) (>64)
Age Distribution ofPersons Served by DMR

6
14207
10998
1276511,690
18,673
16,468
10000
11000
12000
13000
14000
15000
16000
17000
18000
19000
20000
1992 1993 1994 1995 1996 1997 1998 1999 2000 2001
No
. Pe
op
le
No. Clients Total Served (Incl B3)
No. people served includingBirth to Three (and Early Connections).Note large jump in 1997 w hen DMRassumed responsibility as lead agency
No. people w ith mental retardation served by DMR. Does NOT include Birth to Three.
The no. of people with M R served by DM R has grown by over 3,200 , or about 30% since 1992. For the past 5 years, about 375 new people joined DM R each year.
10 Year Growth TrendNo. People Served by DMR
FY92 - FY01
Each year, DMR serves about 375 MORE PEOPLE than the year before.Eligibility
Beginning this fiscal year, DMR has instituted a SINGLE POINT OF ENTRY for all individuals seeking eligibility for services. This new approach is designed to simplify the application process and assure statewide consistency in reviewing and determining eligibility across the five regions.
A FEW FACTS ABOUTNEW REFERRALS
• Every month more than 90 people apply for services
• 65% of new referrals are for children (<18 yrs old)
• About 25% of new referrals are for adults older than 20 yrs of age
• The remaining 10% are young adults age 18-20 yrs.
3 primary factors used to determine eligibility based on CGS 1-1g:
1. Significant deficits in intellectual functioning
- IQ profile <70 on standardized IQ test
2. Deficits in adaptive behavior
- evaluate using standardized measure
- consistent profile across social, economic & self- help domains
3. Manifest during developmental period
- clear evidence of both intellectual and adaptive deficits before age 18
- medical records, school records, standardized testing
Plus individuals with Prader Willi Syndrome

7
404
2111
4041
0
500
1000
1500
2000
2500
3000
3500
4000
4500
1992 1993 1994 1995 1996 1997 1998 1999 2000 2001
No
. Peo
ple
10 Year Residential TrendNo. People Served with Public, Private, and Individual Support
PRIVATE SECTOR
PUBLIC (DMR)
INDIVIDUAL SUPPORT
Individual Support is the FASTEST GROWING approach for providing residential support. In just the past 5-yrs it has increased by >450%.
Residential services provided by the public sector have been shrinking over the past 10 years, primarily due to downsizing at campus programs.
Residential services provided byprivate sector agencies have grown at a steady rate over the past 10-yrs, and now serve 37% more people than they did in FY92.
$164,747,700
$100,000,000
$125,000,000
$150,000,000
$175,000,000
$200,000,000
$225,000,000
$250,000,000
$275,000,000
$300,000,000
$325,000,000
$350,000,000
$375,000,000
1992 1993 1994 1995 1996 1997 1998 1999 2000 2001
Fiscal Year
Do
llars
GROWTH IN CONTRACTED EXPENDITURESfor Services to People with Mental Retardation
DMR Budget: FY92 - FY01
40% of total
DMR expendituresin FY92
54% of total
DMR expendituresin FY01
Since FY92, expenditures for contracted services (private sector services) has increased by about $190 million, or 120%. Private sector expenditures now represent more than half of the entire DMR budget.
Who Provides Residential SupportThe past decade has witnessed a dramatic shift away from residential services provided by public programs operated directly by DMR and toward services and supports operated by the private sector community. In fact, in 2004, public programs serve only one quarter of all people who receive a residential support.
Over the past 12 years:• Public programs have shrunk by 25% • Private sector residential services
have increased by 65%• Self directed Individual Supports is
the fastest growing approach to residential service.
Providers of Residential Support
September 2005 MIR
Individual Supports9%
Private66%
Public25%

8
Kind of SupportIndiv.
Emp. And Day Supp. N/A Public Private Supp. Total % Total
Ind. Supp. Emp. 37 934 47 1,018 6.8%
Group Supp. Emp. 91 2,775 26 2,892 19.3%
Sheltered Emp. 143 756 10 909 6.1%
Day Supp. Opt. 503 2,886 42 3,431 22.9%
Comp. Employment 517 20 537 3.6%
Other 14 63 362 439 2.9%
Sub-Total 517 788 7,414 507 9,226 61.5%
% Total 5.6% 8.5% 80.4% 5.5% 100.0%
LEA 4,034 4,034 26.9%
Res School 42 42 0.3%
Birth to Three 15 16 31 0.2%
Other 58 58 0.4%
Sub-Total 15 4,150 4,165 27.8%
Day Program Needed 418 418 2.8%
No Prog - Other Reason* 873 873 5.8%
Blanks 315 315 2.1%
Grand Total 2,123 803 11,564 507 14,997 100.0%
DAY/WORK STATUS
Educational and Developmental Services
How They Receive Support
Other
Day Service and Work Status (9/30/05)
“No Prog-Other Reason” includes medical, retired, refused day program.
Issued: December 22, 2005
Who Provides Day / WorkSupport for Adults
Competitive 5.5%Public 8.5%Private 80.4%Individual Support 5.5%

9
Employment and Day Supports in Connecticut DMR
Group SupportedEmployment
Community NonWork
ShelteredEmployment
CompetitiveEmployment
Individual SupportedEmployment
37%
31%10%
11%6%

10
Service Needs – Day / Work Statewide(September 2005)
No Day Supports Emerg. Prior. 1 Total
Family or Own Home 5 198 203
Out of Home 2 80 82
Total no supports 7 278 285YTD 1 70 71
Transition
June 2005 Grads (Home) 0 115 115June 2005 Ageouts (DCF, LEA, ISA funded) 0 23 23
Total 0 138 138
DMR Day Programs 1 22 23
Private Day Programs 0 126 126
Total 1 148 149
WAITING LIST
DMR Funded/Operated Supports
School Graduates Ageouts
June 2006 218 60
June 2007 64 41
June 2008 27 43
FUTURE PLANNING
No Day Supports Priority 2 Priority 3 Total
Family or Own Home 11 4 15
Out of Home 3 2 5
Total no supports 14 6 20YTD 2 -1 1
DMR Day Programs 5 2 7
Private Day Programs 18 7 25
Total 23 9 32
DMR Funded/Operated Supports
PLANNING LIST
11
What we have learnedfrom our consumers about
vocational training and work….
12
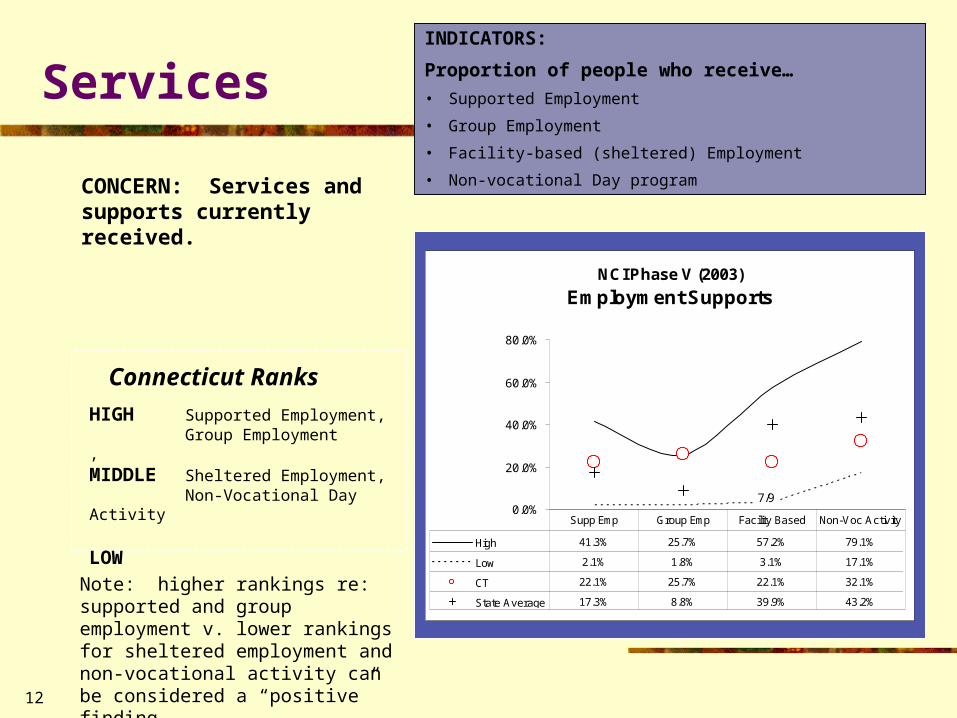
INDICATORS:
Proportion of people who receive…
• Supported Employment
• Group Employment
• Facility-based (sheltered) Employment
• Non-vocational Day program
Services
CONCERN: Services and supports currently received.
HIGH Supported Employment, Group Employment, MIDDLE Sheltered Employment, Non-Vocational Day Activity
LOW
Connecticut Ranks
NCI Phase V (2003)
Employment Supports
0.0%
20.0%
40.0%
60.0%
80.0%
High 41.3% 25.7% 57.2% 79.1%
Low 2.1% 1.8% 3.1% 17.1%
CT 22.1% 25.7% 22.1% 32.1%
State Average 17.3% 8.8% 39.9% 43.2%
Supp Emp Group Emp Facility Based Non-Voc Activity
7/92/9 1/9 6/9
Note: higher rankings re: supported and group employment v. lower rankings for sheltered employment and non-vocational activity can be considered a “positive” finding.

13
A relatively steady trend over time can be seen for people reporting less employment support, with the exception of non-vocational activity.
ServicesComparison across 3 years
NCI 3 Year Trend
Employment Supports
29%
36%
27%
33%35%30%
25% 26%22%
26%22%
32%
0.0%
10.0%
20.0%
30.0%
40.0%
50.0%
Supp Emp Group Emp Facility Based Non-VocActivity
1999 2000/01 20002/03
TREND:

14
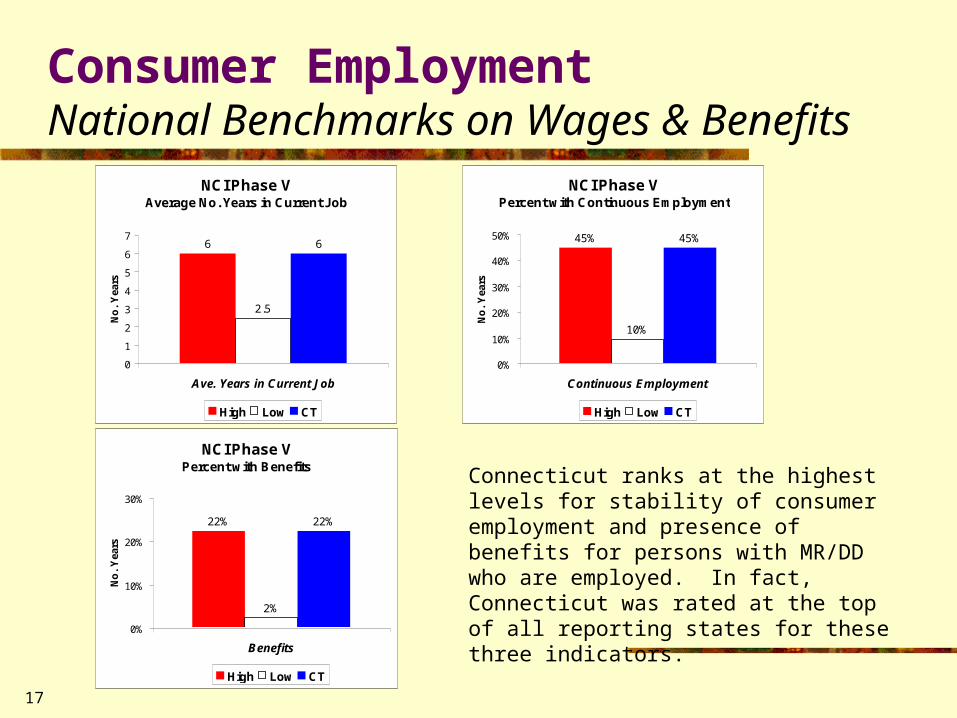
Consumer EmploymentNational Benchmarks on Wages & Benefits
NCI Phase V Average and Median Monthly Consumer Wage for
Work/Day Activity
$356
$257
$140
$63
$356
$257
$-
$50
$100
$150
$200
$250
$300
$350
$400
Mean Wage Median Wage
High Low CT
NCI Phase V Mean Monthly Consumer Wage by Type of Work
$-
$100
$200
$300
$400
$500
$600
$700
High $667.02 $508.04 $266.92 $166.91
Low $258.29 $59.55 $44.74 $97.63
CT $667.02 $375.68 $266.92 $166.91
Sample Average $417.37 $238.17 $167.89 $101.37
CompetitiveIndiv
SupportedGroup
SupportedFacility based
Work
1/5 2/5 1/5 1/5
Average and Median employment wages for consumers in Connecticut are the highest for the 5 states that participated in this aspect of the survey. They are also the highest in 3 out of the 4 categories of employment that were included in the survey.
5 Participating States:• CA (Orange Co.)• CT• IN• PA• SD

15
Consumer EmploymentNational Benchmarks on Wages & Benefits
In addition to the five states that completed the wage and benefit portion of the 2003 NCI Survey, additional benchmarks are available from four other states based on NCI State Data Systems information submitted in 2002. In reviewing these benchmarks it is important to note that the data reflects two very different methods of collecting information and may therefore not be directly comparable.
National Benchmarks for Average Consumer Monthly Wage
$100
$150
$200
$250
$300
$350
$400
$450
Dol
lars
per
Mon
th
Ave Monthly Wage $196 $383 $425 $225 $310 $356 $140 $163 $143
MA VT WA WY OC CT IN PA SD
Based on 2002 System Data Based on 2003 Consumer Survey
CT consumer wages are still relatively high when compared to these additional benchmarks.

16
Consumer EmploymentNational Benchmarks on Wages & Benefits
CT consumers who are competitively employed would appear to work the greatest number of hours. They have the second highest no. hours for group supported employment and when participating in community activities associated with a day program. However, the level of participation/work for CT consumers who are involved in individual supported employment and facility-based work or activity programs is lower than those of consumers in most of the other benchmark states.
NCI Phase V Mean Monthly Hours by Type of Work/Activity
10
20
30
40
50
60
70
80
90
No.
Hou
rs
High 80.1 75.5 81.1 83.0 84.6 83.9
Low 58.8 48.2 59.8 72.3 73.6 17.8
CT 80.1 48.2 78.3 72.3 74.7 78.1
Sample Average 66.1 56.9 70.2 79.3 78.1 43.9
CompetitiveIndiv
SupportedGroup
SupportedFacility Work
Facility Activity
Community Activity
1/5 5/5 2/5 5/5 4/5 2/5
Data reflects the average no. ofhours worked per month for the 5 survey states across 6 different categories of work/day program.
17
Consumer EmploymentNational Benchmarks on Wages & Benefits
Connecticut ranks at the highest levels for stability of consumer employment and presence of benefits for persons with MR/DD who are employed. In fact, Connecticut was rated at the top of all reporting states for these three indicators.
NCI Phase V Average No. Years in Current Job
2.5
66
0
1
2
3
4
5
6
7
Ave. Years in Current Job
No
. Y
ears
High Low CT
NCI Phase V Percent with Continuous Employment
10%
45%45%
0%
10%
20%
30%
40%
50%
Continuous Employment
No
. Y
ears
High Low CT
NCI Phase V Percent with Benefits
2%
22%22%
0%
10%
20%
30%
Benefits
No
. Y
ears
High Low CT
18
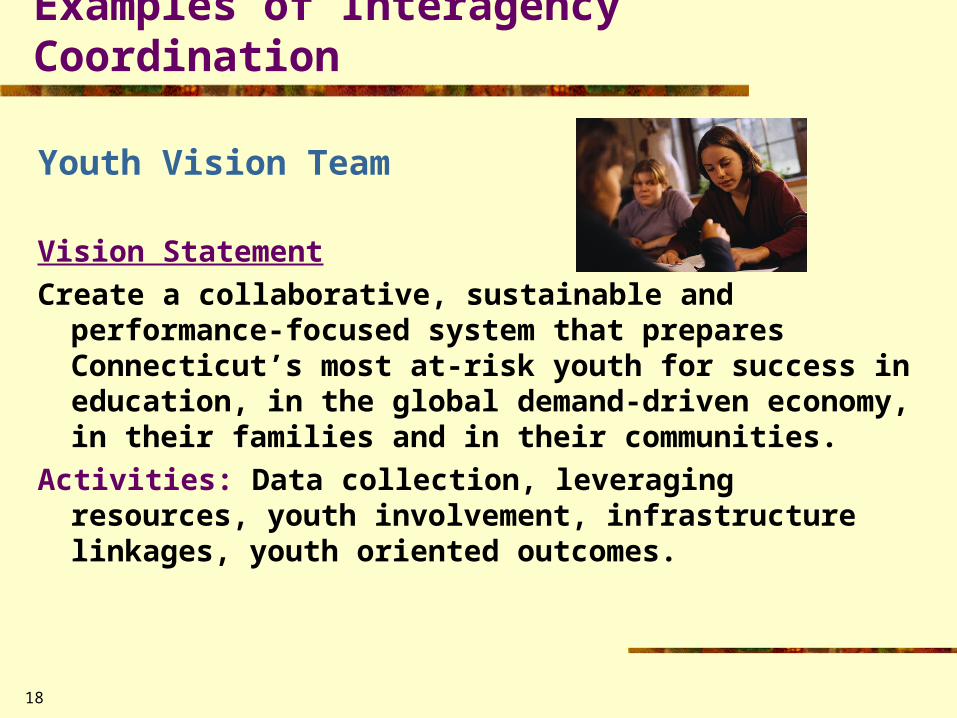
Examples of Interagency Coordination
Youth Vision Team
Vision Statement
Create a collaborative, sustainable and performance-focused system that prepares Connecticut’s most at-risk youth for success in education, in the global demand-driven economy, in their families and in their communities.
Activities: Data collection, leveraging resources, youth involvement, infrastructure linkages, youth oriented outcomes.
19
Youth
National Governor’s Association Policy Academy Improving outcomes for young adults with disabilities One of six state chosen Agency partners: BRS, DMR, DCF, DMHAS, DOL, DSS, DOC,
Judicial Dept., OPM, DOE, UCE, Young Adult Consumer Challenges: Lack of funding
- No designated agency for adults with developmental disabilities
- Limited resources
- Fragmentation
- No common data system.
Examples of Interagency Coordination

20
BEST Practice for Job Development
Start with a comprehensive needs assessment Listen to your consumers Use this information to create an individual plan Provide hands-on experience Market the strengths of your consumer with future employers Locate real work with:
Good payBenefitsOpportunity for change
Be educated about and use creativetechnology to help people with intellectualdisabilities become more independent.

21
Final Words of Advice….
People will learn the jobs they are in with the right supports.
Job developers need to tackle the difficult or social aspects of the world of work.
Coach on social interaction and personal hygiene skills.
AIM HIGH!