1 pencil sharpener report#6 economic analysis discrete event simulation december 05, 2001 hernan...
TRANSCRIPT
1
Pencil Sharpener Report#6Economic Analysis
Discrete Event SimulationDecember 05, 2001
Hernan JoglarJohn Sharkey
2.875Mechanical Assembly and its Role in Product Development
2
Report ContentsIntroduction
Part A: Economic Analysis1. Cost Estimates2. Cash flow analysis3. IRoR Analysis4. Final Thoughts on economical analysis
Part B: Discrete Time Simulation Workstation Layout1. Summary of Simulation Approach2. Assembly Flow#1 3. Assembly Flow#3 Appendices
1. Mold Cost Estimation2. Pencil Sharpener Exploded View3. Pencil Sharpener Structural Decomposition4. Pencil Sharpener Disassembly Photo5. Pencil Sharpener Indentured Part List6. Pencil Sharpener Parts & Material List 7. Part Handling and Insertion Times
3
Introduction• Purpose is to :
– Perform an economic analysis of the assembly layout, including development, manufacturing, transportation and assembly costs.
– Run a discrete event simulation of this assembly line and improve the design should any problem arise.
• Approach for economic analysis was to utilize cost estimates already done in previous reports and complete them with new reasonable estimates in the areas not covered before. Then input the data in the spreadsheet provided and extract results to analyze them.
– Costs are only estimates as no complete information of manufacturing process is available.
– In general costs were estimated assuming this product is inserted in an on-going process of incremental improvements of an architecture already established for previous generations of this product.
– Costs that might be shared by a family of products were estimated that way as this team is aware that this sharpener is actually one of many in its family
• CellSim software used for assembly process discrete time simulations
4
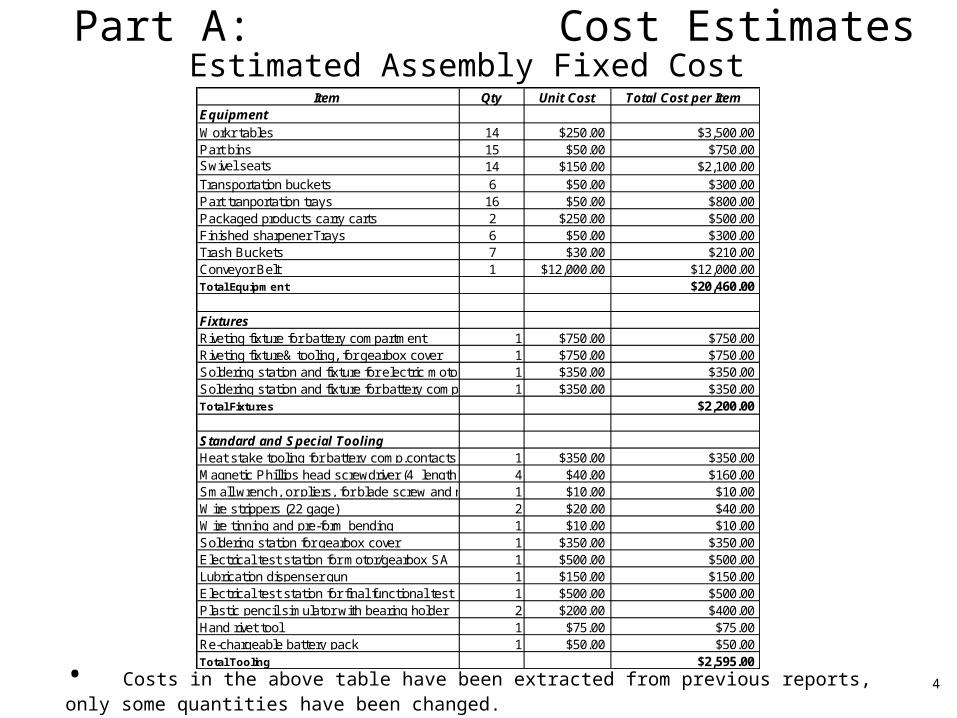
Part A: Cost EstimatesEstimated Assembly Fixed Cost
Item Qty Unit Cost Total Cost per Item EquipmentWorkr tables 14 $250.00 $3,500.00Part bins 15 $50.00 $750.00Swivel seats 14 $150.00 $2,100.00Transportation buckets 6 $50.00 $300.00Part tranportation trays 16 $50.00 $800.00Packaged products carry carts 2 $250.00 $500.00Finished sharpener Trays 6 $50.00 $300.00Trash Buckets 7 $30.00 $210.00Conveyor Belt 1 $12,000.00 $12,000.00Total Equipment $20,460.00
FixturesRiveting fixture for battery compartment 1 $750.00 $750.00Riveting fixture& tooling, for gearbox cover 1 $750.00 $750.00Soldering station and fixture for electric motor 1 $350.00 $350.00Soldering station and fixture for battery comp. 1 $350.00 $350.00Total Fixtures $2,200.00
Standard and Special ToolingHeat stake tooling for battery comp.contacts 1 $350.00 $350.00Magnetic Phillips head screwdriver (4” length) 4 $40.00 $160.00Small wrench, or pliers, for blade screw and nut 1 $10.00 $10.00Wire strippers (22 gage) 2 $20.00 $40.00Wire tinning and pre-form bending 1 $10.00 $10.00Soldering station for gearbox cover 1 $350.00 $350.00Electrical test station for motor/gearbox SA 1 $500.00 $500.00Lubrication dispenser gun 1 $150.00 $150.00Electrical test station for final functional test 1 $500.00 $500.00Plastic pencil simulator with bearing holder 2 $200.00 $400.00Hand rivet tool 1 $75.00 $75.00Re-chargeable battery pack 1 $50.00 $50.00Total Tooling $2,595.00
• Costs in the above table have been extracted from previous reports, only some quantities have been changed.
5
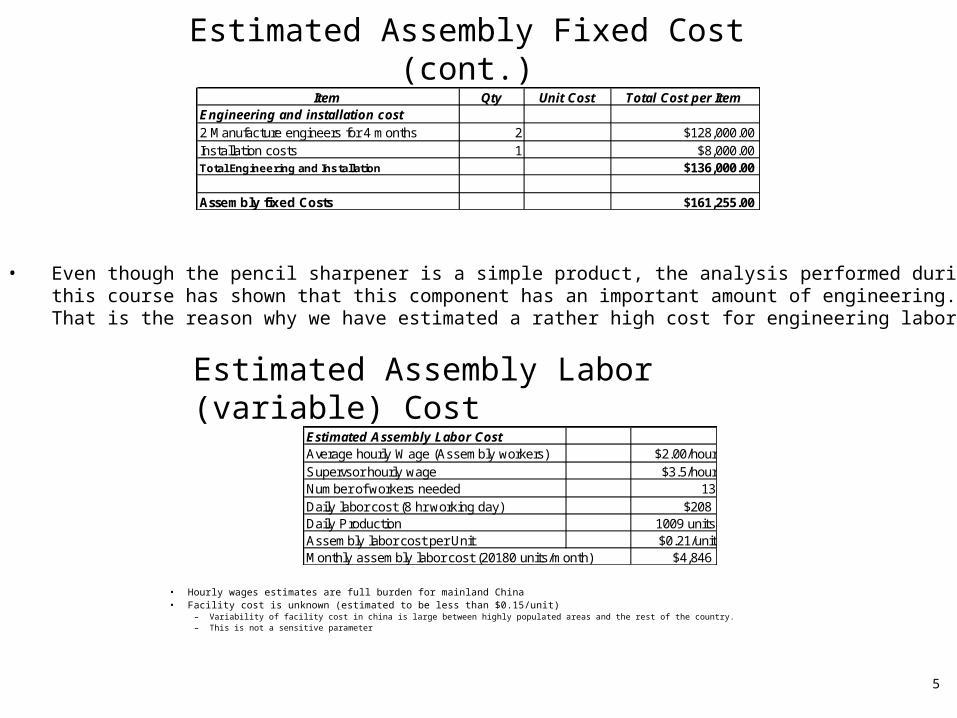
• Hourly wages estimates are full burden for mainland China• Facility cost is unknown (estimated to be less than $0.15/unit)
– Variability of facility cost in china is large between highly populated areas and the rest of the country.– This is not a sensitive parameter
Estimated Assembly Fixed Cost (cont.)
Estimated Assembly Labor (variable) CostEstimated Assembly Labor CostAverage hourly Wage (Assembly workers) $2.00/hourSupervsor hourly wage $3.5/hourNumber of workers needed 13Daily labor cost (8 hr working day) $208Daily Production 1009 unitsAssembly labor cost per Unit $0.21/unitMonthly assembly labor cost (20180 units/month) $4,846
• Even though the pencil sharpener is a simple product, the analysis performed during this course has shown that this component has an important amount of engineering. That is the reason why we have estimated a rather high cost for engineering labor.
Item Qty Unit Cost Total Cost per Item Engineering and installation cost2 Manufacture engineers for 4 months 2 $128,000.00Installation costs 1 $8,000.00Total Engineering and Installation $136,000.00
Assembly fixed Costs $161,255.00
6
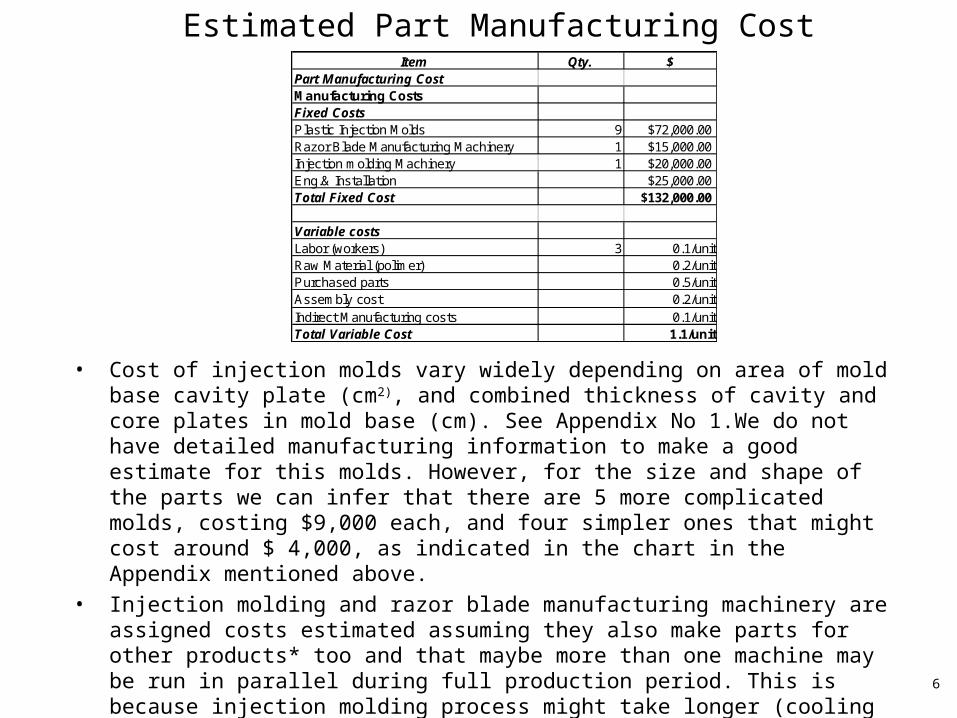
Estimated Part Manufacturing CostItem Qty. $
Part Manufacturing Cost Manufacturing CostsFixed CostsPlastic Injection Molds 9 $72,000.00Razor Blade Manufacturing Machinery 1 $15,000.00Injection molding Machinery 1 $20,000.00Eng.& Installation $25,000.00Total Fixed Cost $132,000.00
Variable costsLabor (workers) 3 0.1/unitRaw Material (polimer) 0.2/unitPurchased parts 0.5/unitAssembly cost 0.2/unitIndirect Manufacturing costs 0.1/unitTotal Variable Cost 1.1/unit
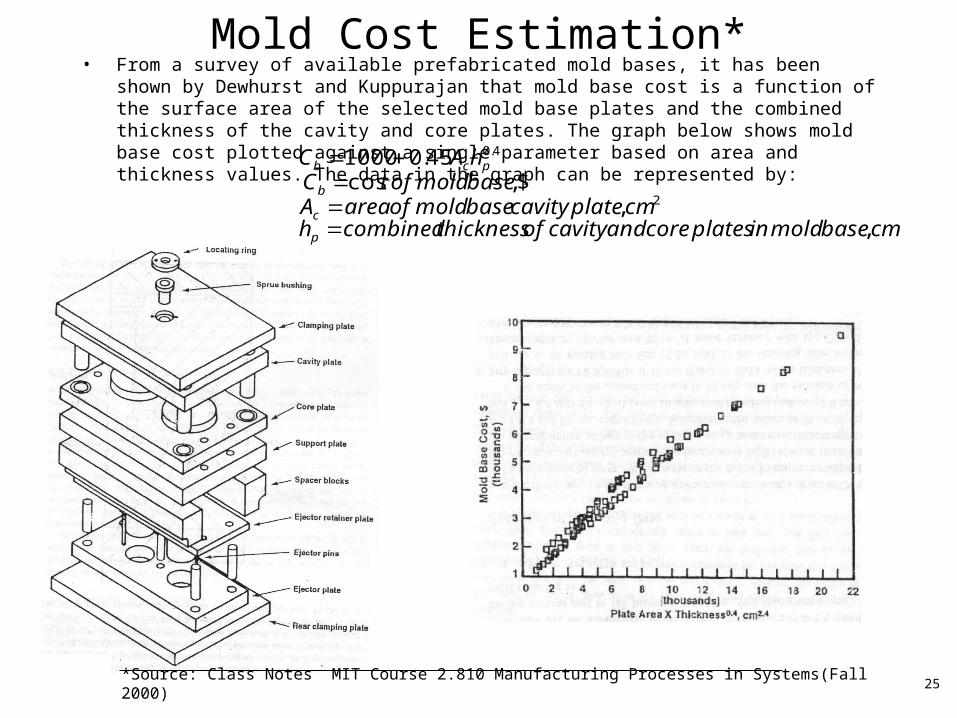
• Cost of injection molds vary widely depending on area of mold base cavity plate (cm2), and combined thickness of cavity and core plates in mold base (cm). See Appendix No 1.We do not have detailed manufacturing information to make a good estimate for this molds. However, for the size and shape of the parts we can infer that there are 5 more complicated molds, costing $9,000 each, and four simpler ones that might cost around $ 4,000, as indicated in the chart in the Appendix mentioned above.
• Injection molding and razor blade manufacturing machinery are assigned costs estimated assuming they also make parts for other products* too and that maybe more than one machine may be run in parallel during full production period. This is because injection molding process might take longer (cooling time) than assembly process, in which our production capacity calculations are based.
*Razor blades are provided by “Exacto” sister division, internal procurement.
7
Estimated Development Cost
Estimated Marketing Introduction Cost
Estimated Tooling and Ramp-Up Cost
Unit Price
Unit Production Cost
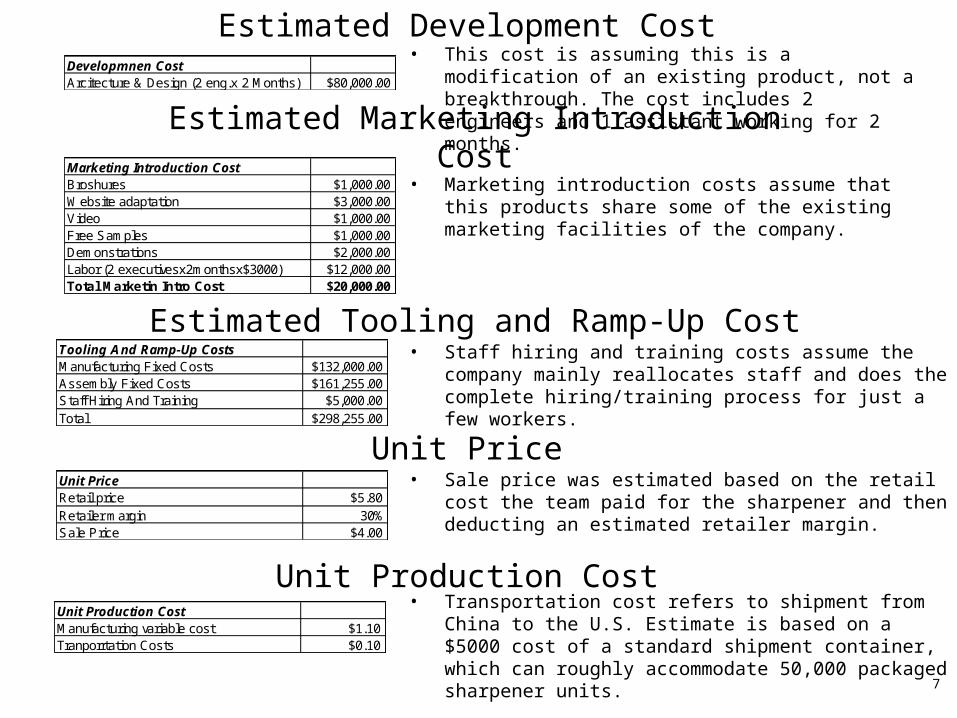
Developmnen CostArcitecture & Design (2 eng.x 2 Months) $80,000.00
Marketing Introduction CostBroshures $1,000.00Website adaptation $3,000.00Video $1,000.00Free Samples $1,000.00Demonstrations $2,000.00Labor (2 executivesx2monthsx$3000) $12,000.00Total Marketin Intro Cost $20,000.00
Tooling And Ramp-Up CostsManufacturing Fixed Costs $132,000.00Assembly Fixed Costs $161,255.00Staff Hiring And Training $5,000.00Total $298,255.00
Unit PriceRetail price $5.80Retailer margin 30%Sale Price $4.00
Unit Production CostManufacturing variable cost $1.10Tranporrtation Costs $0.10
• Marketing introduction costs assume that this products share some of the existing marketing facilities of the company.
• Staff hiring and training costs assume the company mainly reallocates staff and does the complete hiring/training process for just a few workers.
• Sale price was estimated based on the retail cost the team paid for the sharpener and then deducting an estimated retailer margin.
• Transportation cost refers to shipment from China to the U.S. Estimate is based on a $5000 cost of a standard shipment container, which can roughly accommodate 50,000 packaged sharpener units.
• This cost is assuming this is a modification of an existing product, not a breakthrough. The cost includes 2 engineers and 1 assistant working for 2 months.
8
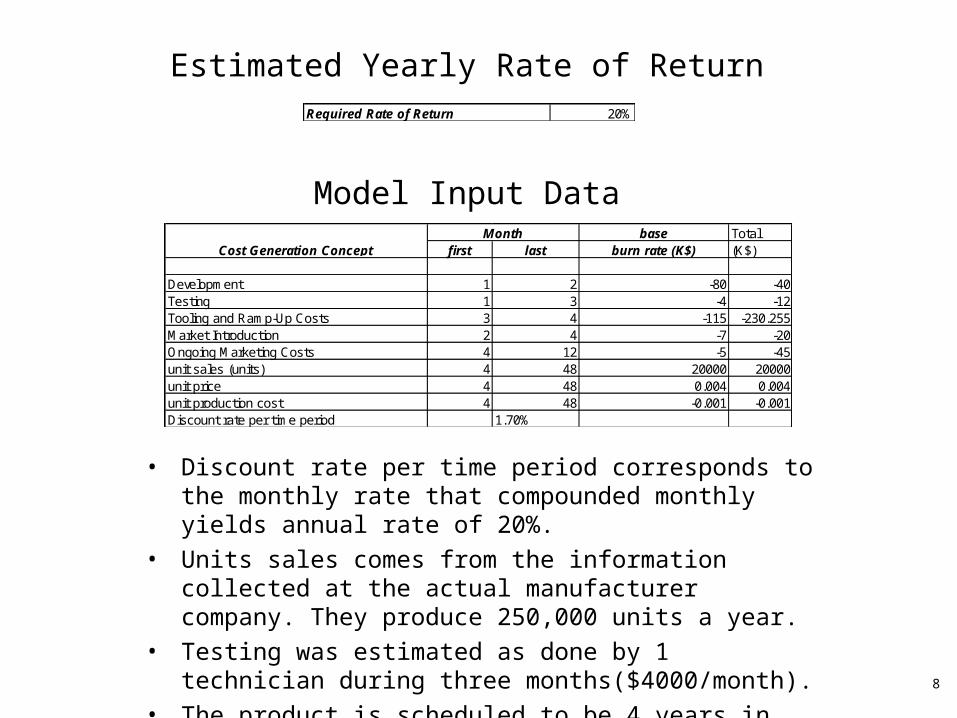
Estimated Yearly Rate of ReturnRequired Rate of Return 20%
Model Input Data
• Discount rate per time period corresponds to the monthly rate that compounded monthly yields annual rate of 20%.
• Units sales comes from the information collected at the actual manufacturer company. They produce 250,000 units a year.
• Testing was estimated as done by 1 technician during three months($4000/month).
• The product is scheduled to be 4 years in the market.
base Totalfirst last burn rate (K$) (K$)
Development 1 2 -80 -40Testing 1 3 -4 -12Tooling and Ramp-Up Costs 3 4 -115 -230.255Market Introduction 2 4 -7 -20Ongoing Marketing Costs 4 12 -5 -45unit sales (units) 4 48 20000 20000unit price 4 48 0.004 0.004unit production cost 4 48 -0.001 -0.001Discount rate per time period 1.70%
MonthCost Generation Concept
9
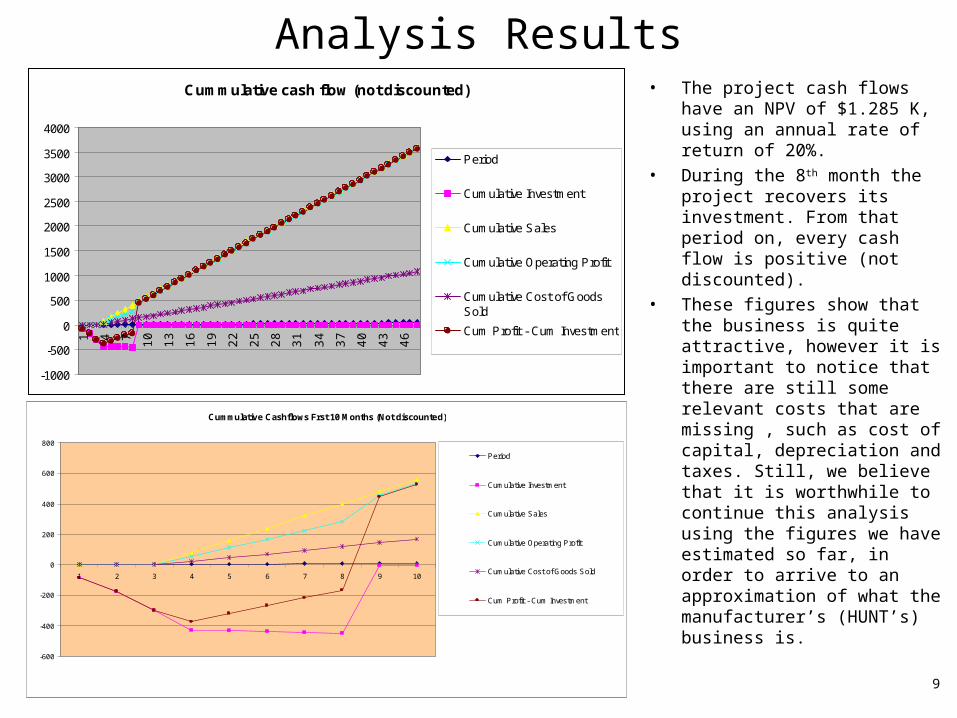
Analysis Results• The project cash flows have an
NPV of $1.285 K, using an annual rate of return of 20%.
• During the 8th month the project recovers its investment. From that period on, every cash flow is positive (not discounted).
• These figures show that the business is quite attractive, however it is important to notice that there are still some relevant costs that are missing , such as cost of capital, depreciation and taxes. Still, we believe that it is worthwhile to continue this analysis using the figures we have estimated so far, in order to arrive to an approximation of what the manufacturer’s (HUNT’s) business is.
Cummulative cash flow (not discounted)
-1000
-500
0
500
1000
1500
2000
2500
3000
3500
4000
1 4 7 10 13 16 19 22 25 28 31 34 37 40 43 46
Period
Cumulative Investment
Cumulative Sales
Cumulative Operating Profit
Cumulative Cost of GoodsSold
Cum Profit - Cum Investment
Cummulative Cashflows Frst 10 Months (Not discounted)
-600
-400
-200
0
200
400
600
800
1 2 3 4 5 6 7 8 9 10
Period
Cumulative Investment
Cumulative Sales
Cumulative Operating Profit
Cumulative Cost of Goods Sold
Cum Profit - Cum Investment
10
Analysis Results (cont.)
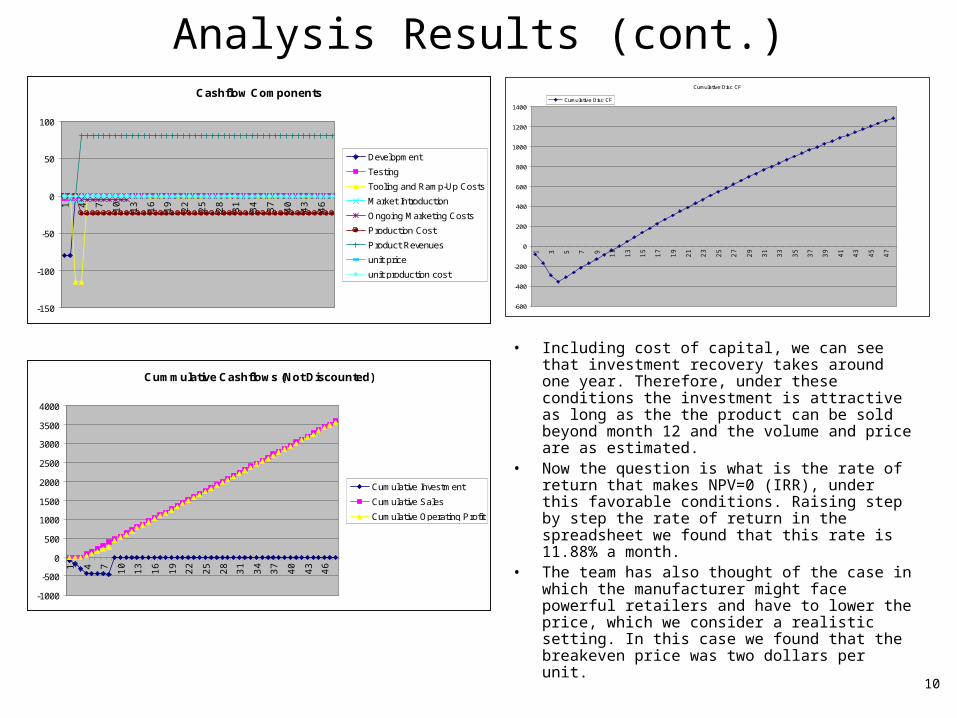
• Including cost of capital, we can see that investment recovery takes around one year. Therefore, under these conditions the investment is attractive as long as the the product can be sold beyond month 12 and the volume and price are as estimated.
• Now the question is what is the rate of return that makes NPV=0 (IRR), under this favorable conditions. Raising step by step the rate of return in the spreadsheet we found that this rate is 11.88% a month.
• The team has also thought of the case in which the manufacturer might face powerful retailers and have to lower the price, which we consider a realistic setting. In this case we found that the breakeven price was two dollars per unit.
Cashflow Components
-150
-100
-50
0
50
100
1 4 7 10 13 16 19 22 25 28 31 34 37 40 43 46
Development
Testing
Tooling and Ramp-Up Costs
Market Introduction
Ongoing Marketing Costs
Production Cost
Product Revenues
unit price
unit production cost
Cummulative Cashflows (Not Discounted)
-1000
-500
0
500
1000
1500
2000
2500
3000
3500
4000
1 4 7 10 13 16 19 22 25 28 31 34 37 40 43 46
Cumulative Investment
Cumulative Sales
Cumulative Operating Profit
Cumulative Disc CF
-600
-400
-200
0
200
400
600
800
1000
1200
1400
1 3 5 7 9 11 13
15
17
19
21
23
25
27
29
31
33
35
37
39
41
43
45
47
Cumulative Disc CF
11
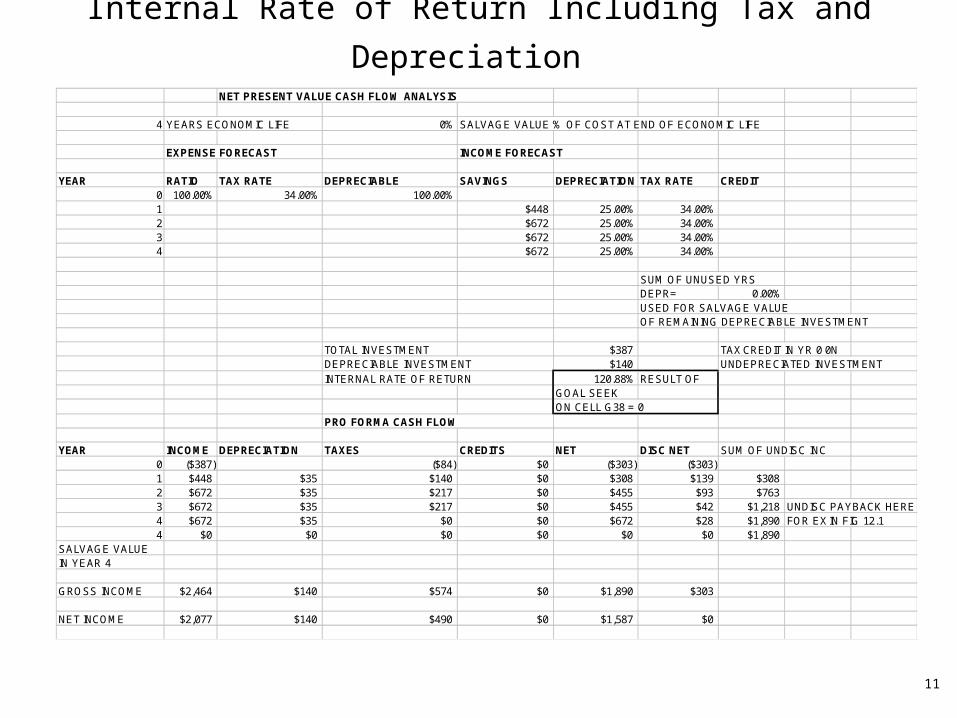
Internal Rate of Return Including Tax and Depreciation NET PRESENT VALUE CASH FLOW ANALYSIS
4 YEARS ECONOMIC LIFE 0% SALVAGE VALUE % OF COST AT END OF ECONOMIC LIFE
EXPENSE FORECAST INCOME FORECAST
YEAR RATIO TAX RATE DEPRECIABLE SAVINGS DEPRECIATION TAX RATE CREDIT0 100.00% 34.00% 100.00%1 $448 25.00% 34.00%2 $672 25.00% 34.00%3 $672 25.00% 34.00%4 $672 25.00% 34.00%
SUM OF UNUSED YRSDEPR= 0.00%USED FOR SALVAGE VALUEOF REMAINING DEPRECIABLE INVESTMENT
TOTAL INVESTMENT $387 TAX CREDIT IN YR 0 0N DEPRECIABLE INVESTMENT $140 UNDEPRECIATED INVESTMENTINTERNAL RATE OF RETURN 120.88% RESULT OF
GOAL SEEKON CELL G38 = 0
PRO FORMA CASH FLOW
YEAR INCOME DEPRECIATION TAXES CREDITS NET DISC NET SUM OF UNDISC INC0 ($387) ($84) $0 ($303) ($303)1 $448 $35 $140 $0 $308 $139 $3082 $672 $35 $217 $0 $455 $93 $7633 $672 $35 $217 $0 $455 $42 $1,218 UNDISC PAYBACK HERE4 $672 $35 $0 $0 $672 $28 $1,890 FOR EX IN FIG 12.14 $0 $0 $0 $0 $0 $0 $1,890
SALVAGE VALUEIN YEAR 4
GROSS INCOME $2,464 $140 $574 $0 $1,890 $303
NET INCOME $2,077 $140 $490 $0 $1,587 $0
12
Final Thoughts on Economic Analysis• When calculating the IRoR including taxes (34%) and depreciation of assets subject to it*,
we found that the results were not as good as without taking into account those two factors but the project still shows quite healthy figures.
• Including taxes and depreciation we obtain IRoR=120.88%, which is close to what we got without these factors (11.88% a month).
• Even though the above described landscape looks very attractive, there are previous investments that are not included for not being relevant cost in which the company has already incurred.
– Architecting and design– Market capture– Brand name– Manufacturing facilities… and others.
• There also exist some long term consequences to consider:– By not “doing” in-house, the company is transferring knowledge that it might not be able to
recover in the future as its absorptive capacity gets affected. We do not have much information in this regard, but HUNT might be outsourcing the whole process, which would be a mistake in the long run.
– Unfortunately, what we know is that this family of pencil sharpeners is completely manufactured in China, thus we suspect the company may be doing the same with more sophisticated products. Then, it runs the risk of becoming dependent for knowledge rather than for capacity.
• All in all, our opinion is that HUNT is doing a very good business with this product but has to be careful with the way it manages the supply chain.
• * We have depreciated all costs related to machinery, tooling, and a portion of its installation. We have not considered the engineering labor included in manufacturing and assembly fixed costs.
13
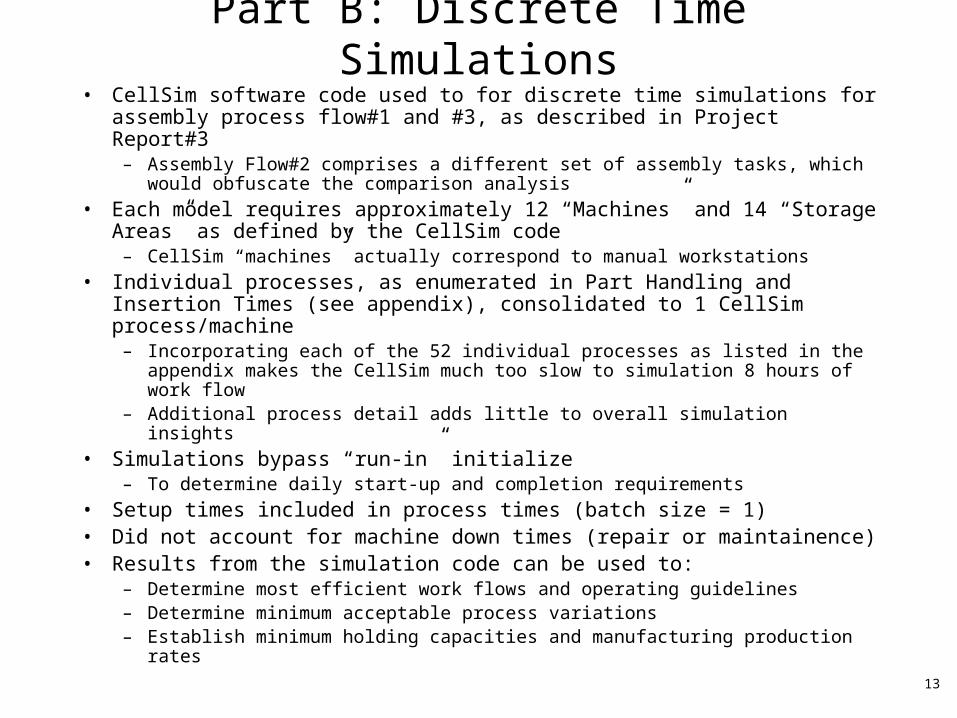
Part B: Discrete Time Simulations• CellSim software code used to for discrete time simulations for assembly
process flow#1 and #3, as described in Project Report#3– Assembly Flow#2 comprises a different set of assembly tasks, which would
obfuscate the comparison analysis
• Each model requires approximately 12 “Machines” and 14 “Storage Areas” as defined by the CellSim code
– CellSim “machines” actually correspond to manual workstations
• Individual processes, as enumerated in Part Handling and Insertion Times (see appendix), consolidated to 1 CellSim process/machine
– Incorporating each of the 52 individual processes as listed in the appendix makes the CellSim much too slow to simulation 8 hours of work flow
– Additional process detail adds little to overall simulation insights
• Simulations bypass “run-in” initialize– To determine daily start-up and completion requirements
• Setup times included in process times (batch size = 1)• Did not account for machine down times (repair or maintainence)• Results from the simulation code can be used to:
– Determine most efficient work flows and operating guidelines– Determine minimum acceptable process variations– Establish minimum holding capacities and manufacturing production rates
14
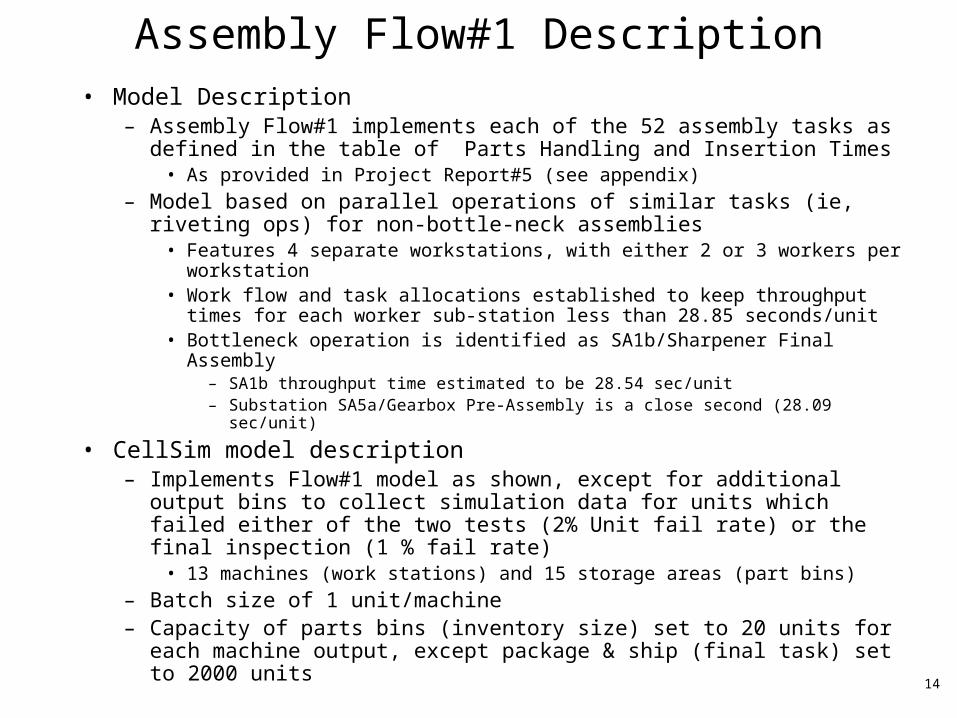
Assembly Flow#1 Description• Model Description
– Assembly Flow#1 implements each of the 52 assembly tasks as defined in the table of Parts Handling and Insertion Times
• As provided in Project Report#5 (see appendix)
– Model based on parallel operations of similar tasks (ie, riveting ops) for non-bottle-neck assemblies
• Features 4 separate workstations, with either 2 or 3 workers per workstation• Work flow and task allocations established to keep throughput times for each
worker sub-station less than 28.85 seconds/unit• Bottleneck operation is identified as SA1b/Sharpener Final Assembly
– SA1b throughput time estimated to be 28.54 sec/unit– Substation SA5a/Gearbox Pre-Assembly is a close second (28.09 sec/unit)
• CellSim model description– Implements Flow#1 model as shown, except for additional output bins to
collect simulation data for units which failed either of the two tests (2% Unit fail rate) or the final inspection (1 % fail rate)
• 13 machines (work stations) and 15 storage areas (part bins)
– Batch size of 1 unit/machine– Capacity of parts bins (inventory size) set to 20 units for each machine
output, except package & ship (final task) set to 2000 units
15
SA5
Motor/Gearbox Assy
SA5a Gearbox
Assy
SA5b Gearbox
Solder
SA5c Gearbox
Test
77.99 sec/unit
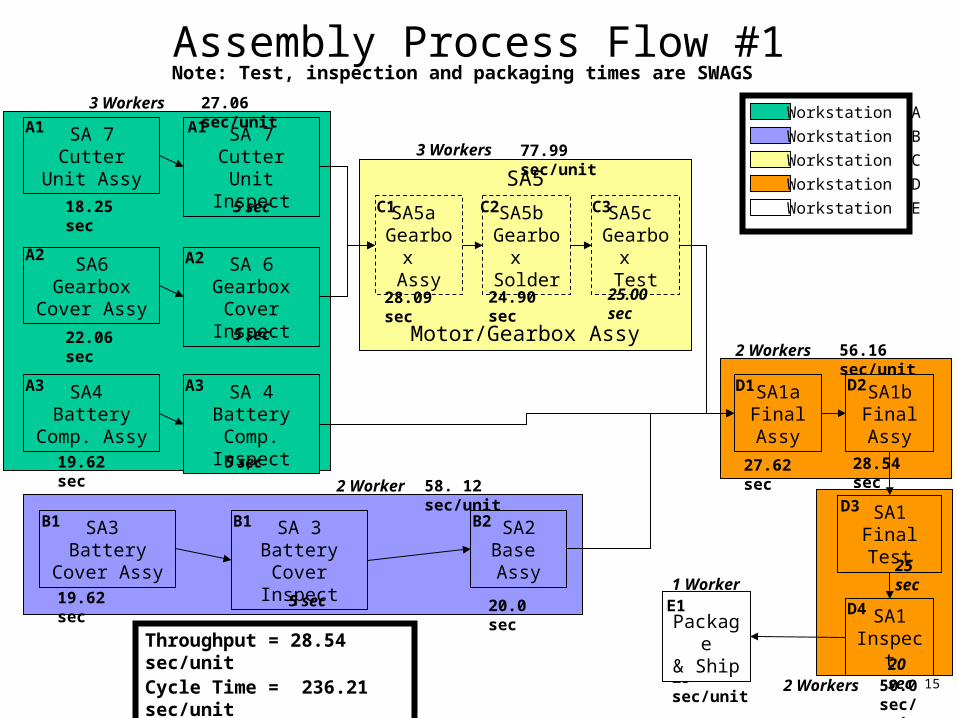
Assembly Process Flow #1
SA 7Cutter Unit
Assy
SA 7Cutter Unit
Inspect
SA6Gearbox Cover
Assy
SA 6Gearbox Cover
Inspect
SA4 Battery Comp.
Assy
SA 4Battery Comp.
Inspect
SA3 Battery Cover
Assy
SA 3Battery Cover
Inspect
SA2Base Assy
SA1aFinal Assy
SA1bFinal Assy
SA1Inspect
18.25 sec
22.06 sec
19.62 sec
19.62 sec
5 sec
5 sec
5 sec
5 sec 20.0 sec
27.62 sec
20 sec
Note: Test, inspection and packaging times are SWAGS
SA1Final Test
25 sec
Workstation A
Workstation B
Workstation C
Workstation D
Workstation E
27.06 sec/unit3 Workers
3 Workers
2 Workers 56.16 sec/unit
1 Worker
25 sec/unit
2 Worker 58. 12 sec/unit
Throughput = 28.54 sec/unitCycle Time = 236.21 sec/unit13 Workers
28.09 sec 24.90 sec 25.00 sec
28.54 sec
Package& Ship
2 Workers
A1 A1
A2A2
A3 A3
C1 C2 C3
B1 B1 B2
D1 D2
D3
D4E1
50.0sec/unit
16
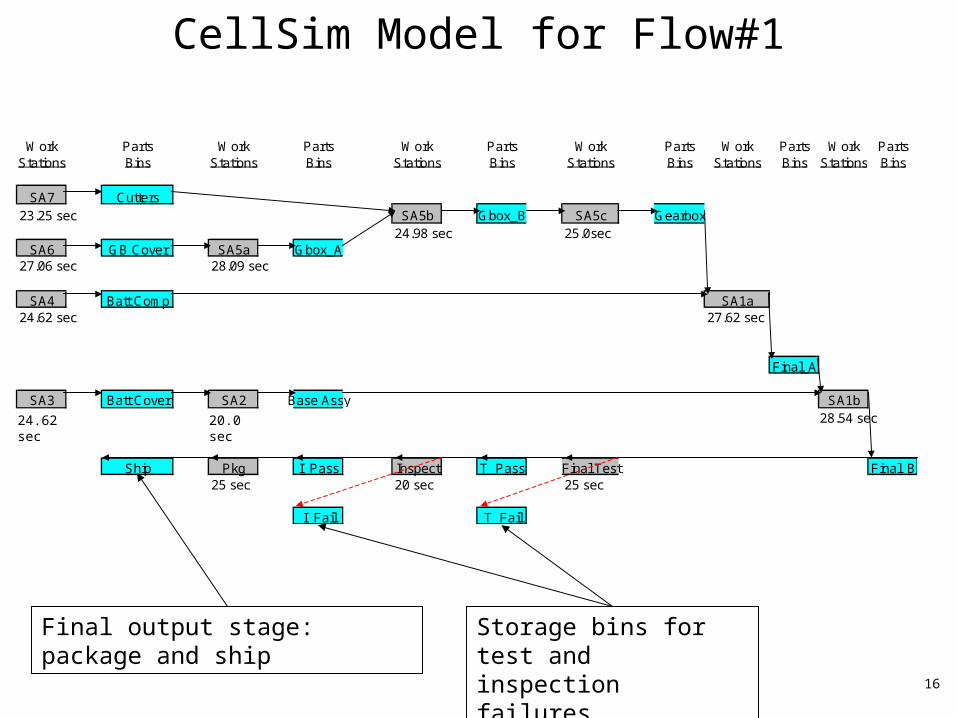
CellSim Model for Flow#1
Work Parts Work Parts Work Parts Work Parts Work Parts Work PartsStations Bins Stations Bins Stations Bins Stations Bins Stations Bins Stations Bins
SA7 Cutters23.25 sec SA5b Gbox_B SA5c Gearbox
24.98 sec 25.0secSA6 GB Cover SA5a Gbox_A
27.06 sec 28.09 sec
SA4 Batt Comp SA1a24.62 sec 27.62 sec
Final_A
SA3 Batt Cover SA2 Base Assy SA1b 28.54 sec
Ship Pkg I_Pass Inspect T_Pass Final Test Final_B25 sec 20 sec 25 sec
I_Fail T_Fail
24.62 sec 20.0 sec
Final output stage: package and ship Storage bins for test and inspection failures
17
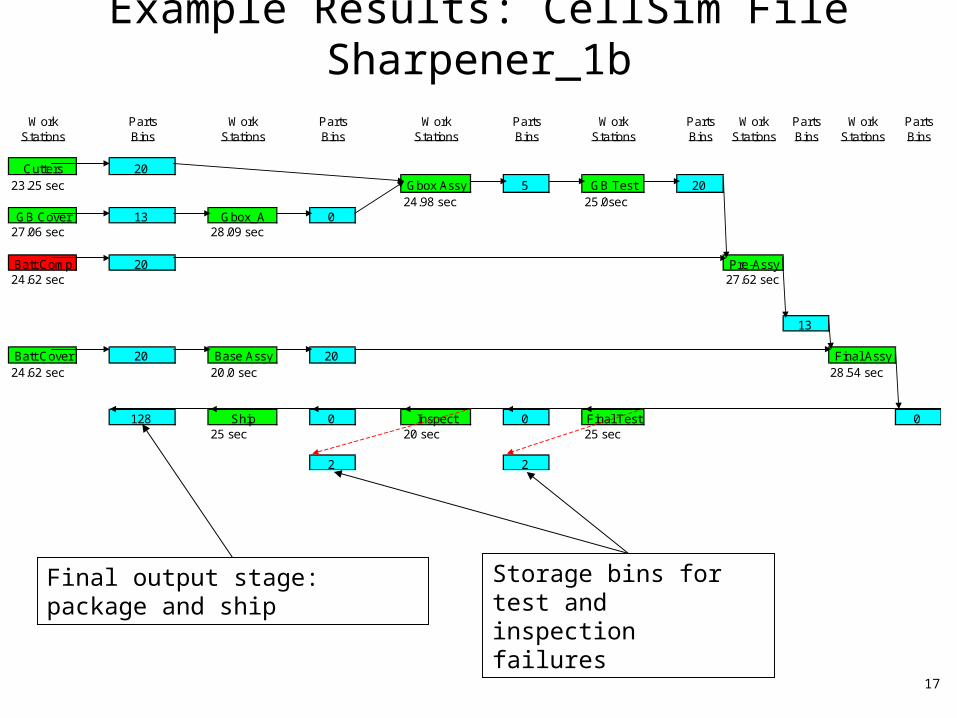
Work Parts Work Parts Work Parts Work Parts Work Parts Work PartsStations Bins Stations Bins Stations Bins Stations Bins Stations Bins Stations Bins
Cutters 2023.25 sec Gbox Assy 5 GB Test 20
24.98 sec 25.0secGB Cover 13 Gbox_A 0
27.06 sec 28.09 sec
Batt Comp 20 Pre-Assy24.62 sec 27.62 sec
13
Batt Cover 20 Base Assy 20 Final Assy24.62 sec 20.0 sec 28.54 sec
128 Ship 0 Inspect 0 Final Test 025 sec 20 sec 25 sec
2 2
Example Results: CellSim File Sharpener_1b
Final output stage: package and ship Storage bins for test and inspection failures
18
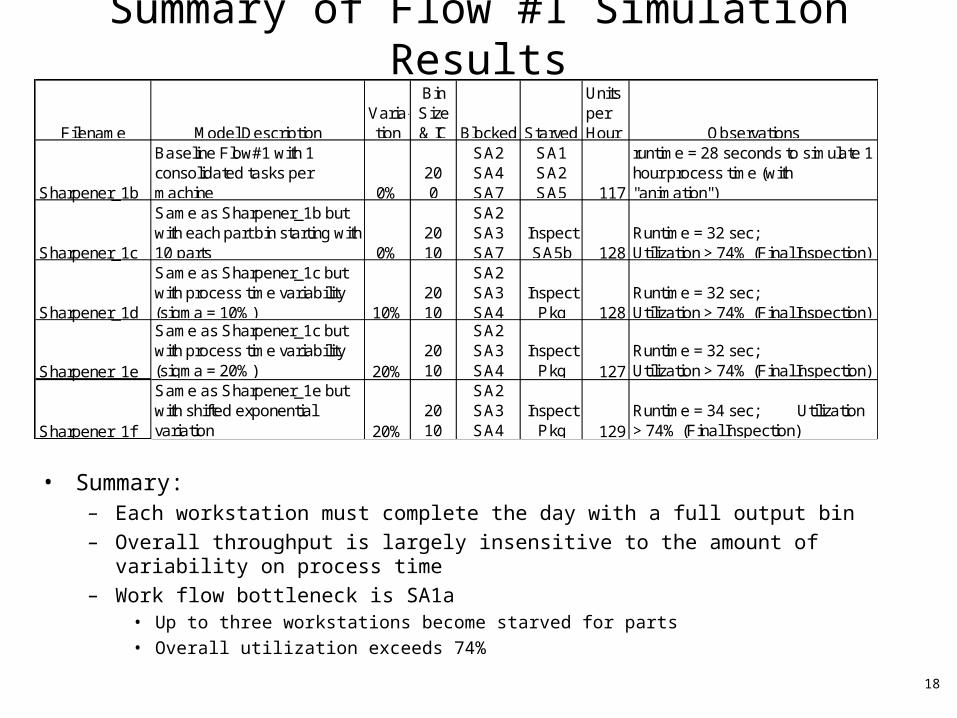
Summary of Flow #1 Simulation Results
• Summary:– Each workstation must complete the day with a full output bin
– Overall throughput is largely insensitive to the amount of variability on process time
– Work flow bottleneck is SA1a• Up to three workstations become starved for parts
• Overall utilization exceeds 74%
Filename Model DescriptionVaria-tion
Bin Size & IC Blocked Starved
Units per Hour Observations
Sharpener_1b
Baseline Flow#1 with 1 consolidated tasks per machine 0%
20 0
SA2 SA4 SA7
SA1 SA2 SA5 117
runtime = 28 seconds to simulate 1 hour process time (with "animation")
Sharpener_1c
Same as Sharpener_1b but with each part bin starting with 10 parts 0%
20 10
SA2 SA3 SA7
Inspect SA5b 128
Runtime = 32 sec; Utilization > 74% (Final Inspection)
Sharpener_1d
Same as Sharpener_1c but with process time variability (sigma = 10%) 10%
20 10
SA2 SA3 SA4
Inspect Pkg 128
Runtime = 32 sec; Utilization > 74% (Final Inspection)
Sharpener_1e
Same as Sharpener_1c but with process time variability (sigma = 20%) 20%
20 10
SA2 SA3 SA4
Inspect Pkg 127
Runtime = 32 sec; Utilization > 74% (Final Inspection)
Sharpener_1f
Same as Sharpener_1e but with shifted exponential variation 20%
20 10
SA2 SA3 SA4
Inspect Pkg 129
Runtime = 34 sec; Utilization > 74% (Final Inspection)
19
Assembly Flow#3 Description
• Model Description– Assembly flow is a modification of Flow#3 as described in Project
Report#5• Places 10 workstations in parallel to perform complete assembly
assembly operations (was 12 work stations in parallel)
• Utilizes a single workflow line to perform final test, inspection, packaging and shipping
• Increases overall workforce from 12 to 13 employees
– Model changes implemented as a result of insights gained during modeling and simulation with CellSim
• Reduces overall capital investment by eliminating duplicate test stands
• Simulation model follows the modified flow as described above
20
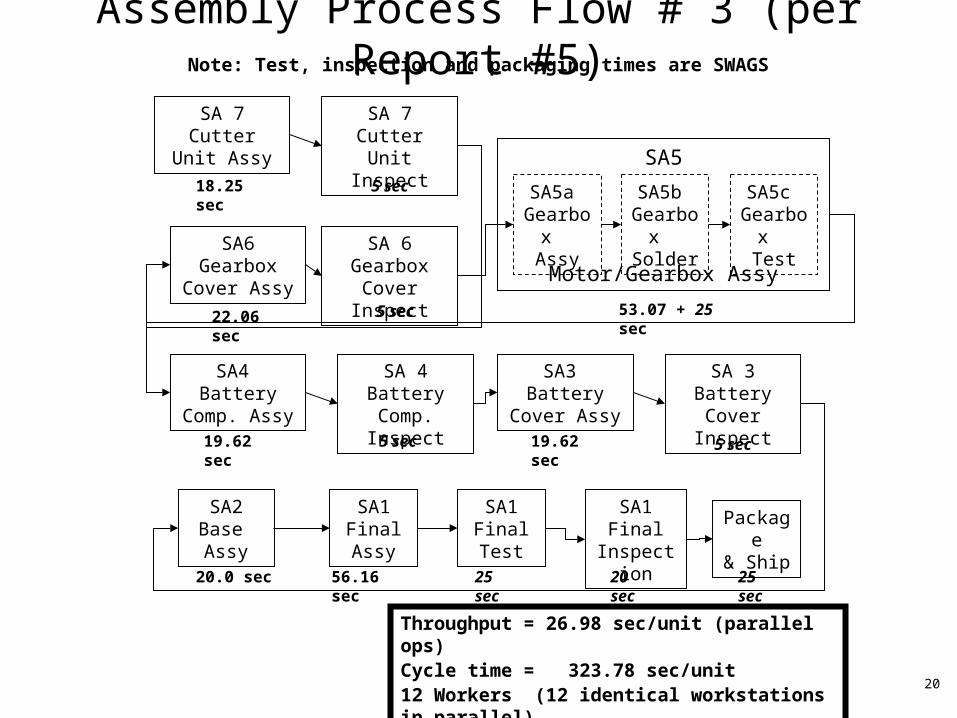
Assembly Process Flow # 3 (per Report #5)
SA 7Cutter Unit
Assy
SA 7Cutter Unit
Inspect
SA6Gearbox Cover
Assy
SA 6Gearbox Cover
Inspect
SA4 Battery Comp.
Assy
SA 4Battery Comp.
Inspect
SA3 Battery Cover
Assy
SA 3Battery Cover
Inspect
SA2Base Assy
SA1Final Assy
SA1Final Test
Package& Ship
18.25 sec
22.06 sec
19.62 sec 19.62 sec
5 sec
5 sec
5 sec 5 sec
20.0 sec 56.16 sec 25 sec 25 sec
Note: Test, inspection and packaging times are SWAGS
SA5a Gearbox
Assy
SA5b Gearbox
Solder
SA5c Gearbox
Test
SA5
Motor/Gearbox Assy
53.07 + 25 sec
SA1Final
Inspection20 sec
Throughput = 26.98 sec/unit (parallel ops)Cycle time = 323.78 sec/unit12 Workers (12 identical workstations in parallel)
21
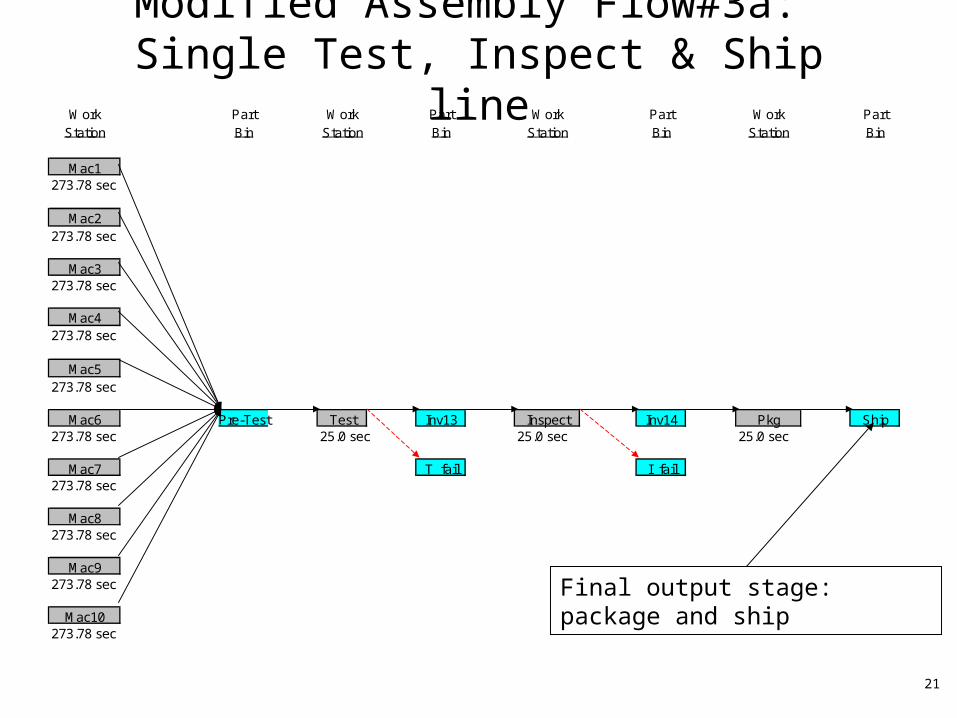
Modified Assembly Flow#3a: Single Test, Inspect & Ship line
Work Part Work Part Work Part Work PartStation Bin Station Bin Station Bin Station Bin
Mac1273.78 sec
Mac2273.78 sec
Mac3273.78 sec
Mac4273.78 sec
Mac5273.78 sec
Mac6 Pre-Test Test Inv13 Inspect Inv14 Pkg Ship273.78 sec 25.0 sec 25.0 sec 25.0 sec
Mac7 T_fail I_fail273.78 sec
Mac8273.78 sec
Mac9273.78 sec
Mac10273.78 sec
Final output stage: package and ship
22
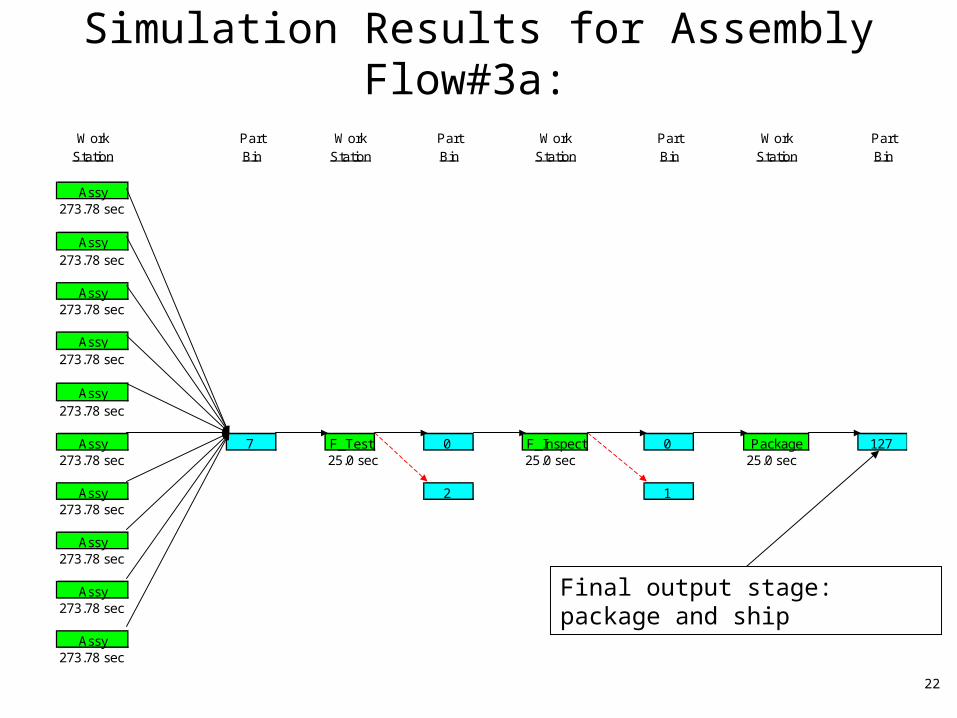
Simulation Results for Assembly Flow#3a:
Work Part Work Part Work Part Work PartStation Bin Station Bin Station Bin Station Bin
Assy273.78 sec
Assy273.78 sec
Assy273.78 sec
Assy273.78 sec
Assy273.78 sec
Assy 7 F_Test 0 F_Inspect 0 Package 127273.78 sec 25.0 sec 25.0 sec 25.0 sec
Assy 2 1273.78 sec
Assy273.78 sec
Assy273.78 sec
Assy273.78 sec
Final output stage: package and ship
23
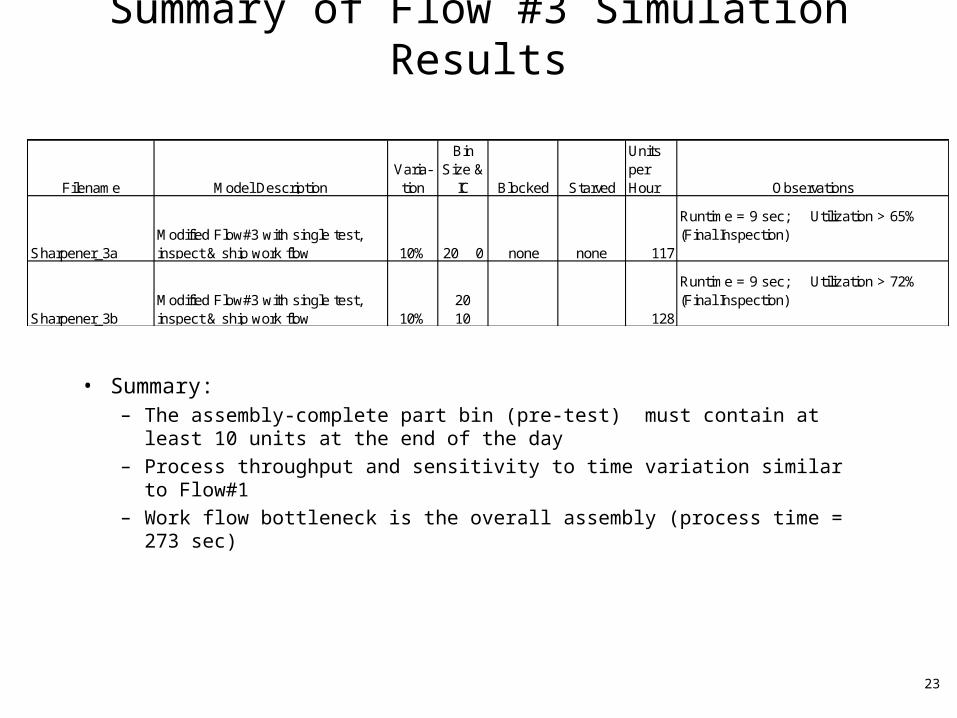
Summary of Flow #3 Simulation Results
• Summary:– The assembly-complete part bin (pre-test) must contain at least 10 units
at the end of the day
– Process throughput and sensitivity to time variation similar to Flow#1
– Work flow bottleneck is the overall assembly (process time = 273 sec)
Filename Model DescriptionVaria-tion
Bin Size &
IC Blocked Starved
Units per Hour Observations
Sharpener_3aModified Flow#3 with single test, inspect & ship work flow 10% 20 0 none none 117
Runtime = 9 sec; Utilization > 65% (Final Inspection)
Sharpener_3bModified Flow#3 with single test, inspect & ship work flow 10%
20 10 128
Runtime = 9 sec; Utilization > 72% (Final Inspection)
24
Appendices
1. Mold Cost Estimation
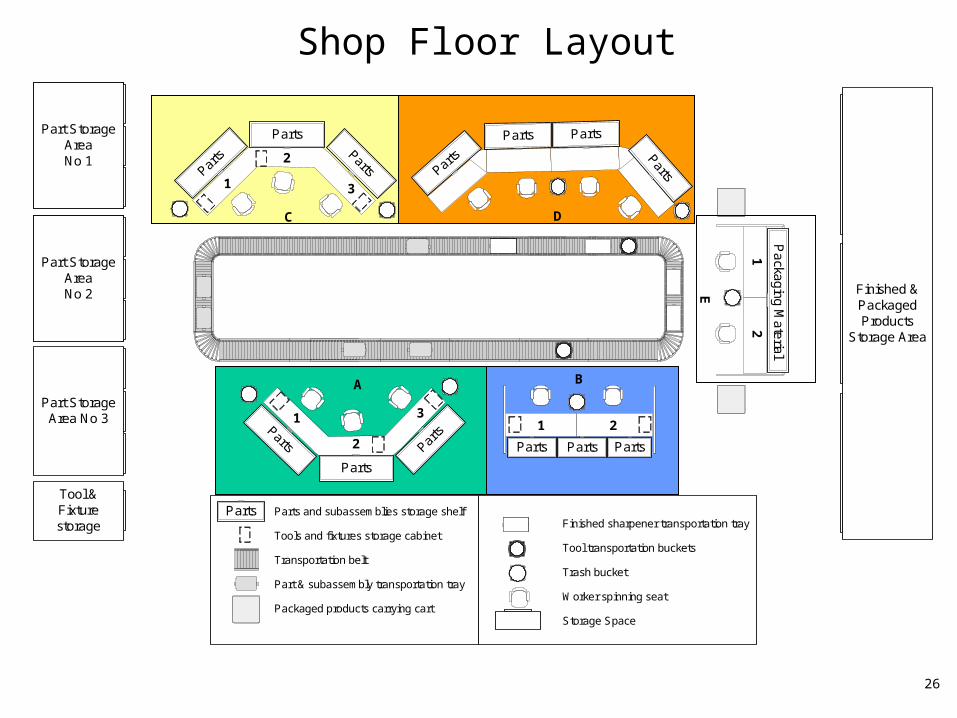
2. Shop Floor Layout
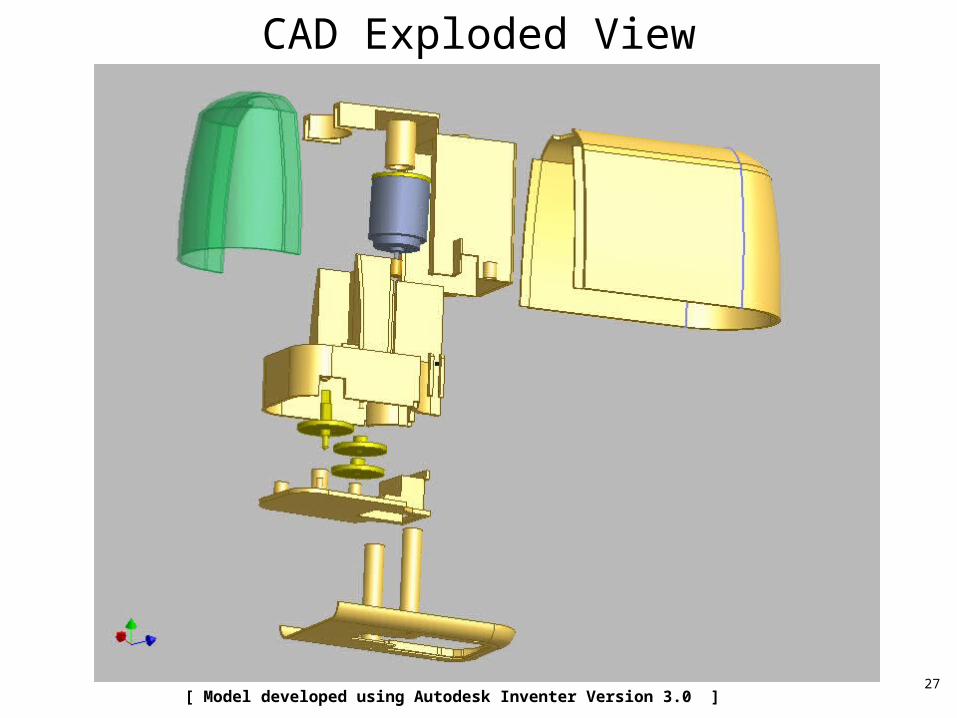
3. Cad Exploded View
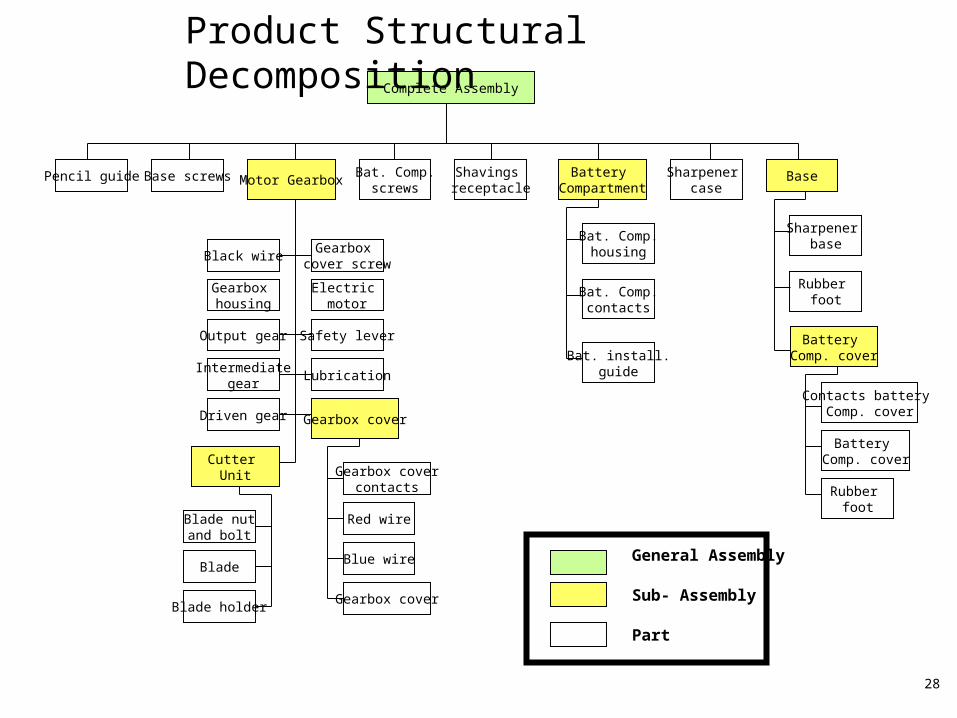
4. Product Structural Decomposition
5. Pencil Sharpener Disassembly Photo
6. Parts and Materials List
7. Pencil Sharpener Indentured Parts List
8. Adjusted Part Handling and Insertion Time
25
Mold Cost Estimation*• From a survey of available prefabricated mold bases, it has been shown by Dewhurst and
Kuppurajan that mold base cost is a function of the surface area of the selected mold base plates and the combined thickness of the cavity and core plates. The graph below shows mold base cost plotted against a single parameter based on area and thickness values. The data in the graph can be represented by:
cmbasemoldinplatescoreandcavityofthicknesscombinedhcmplatecavitybasemoldofareaA
basemoldoftChAC
p
c
b
pcb
,,
$,cos45.01000
2
4.0
*Source: Class Notes MIT Course 2.810 Manufacturing Processes in Systems(Fall 2000)
26
Parts and subassemblies storage shelf
Tools and fixtures storage cabinet
Transportation belt
Part & subassembly transportation tray
Packaged products carrying cart
Parts
Part StorageArea No 3
Tool &Fixturestorage Finished sharpener transportation tray
Tool transportation buckets
Trash bucket
Worker spinning seat
Storage Space
Part StorageAreaNo 1
Part StorageAreaNo 2
2
A
1 3
Parts
PartsParts
E
Pa
ckaging M
aterial
12
Finished &PackagedProducts
Storage Area
Parts
Parts Parts
Parts
D
2
C
1 3
PartsPartsPar
ts
B
Parts Parts
1 2
Parts
Shop Floor Layout
27
CAD Exploded View
[ Model developed using Autodesk Inventer Version 3.0 ]
28
Complete Assembly
Battery Compartment
BaseMotor GearboxBase screwsPencil guide Bat. Comp.screws
Shavings receptacle
Sharpener case
Bat. Comp.housing
Bat. Comp.contacts
Bat. install.guide
Sharpener base
Rubber foot
Battery Comp. cover
Contacts battery Comp. cover
Battery Comp. cover
Rubber foot
Black wire
Gearbox housing
Output gear
Intermediategear
Driven gear
Gearbox cover screw
Electric motor
Safety lever
Lubrication
Cutter Unit
Gearbox cover
Blade nutand bolt
Blade
Blade holderGearbox cover
Gearbox covercontacts
Red wire
Blue wire General Assembly
Sub- Assembly
Part
Product Structural Decomposition
29
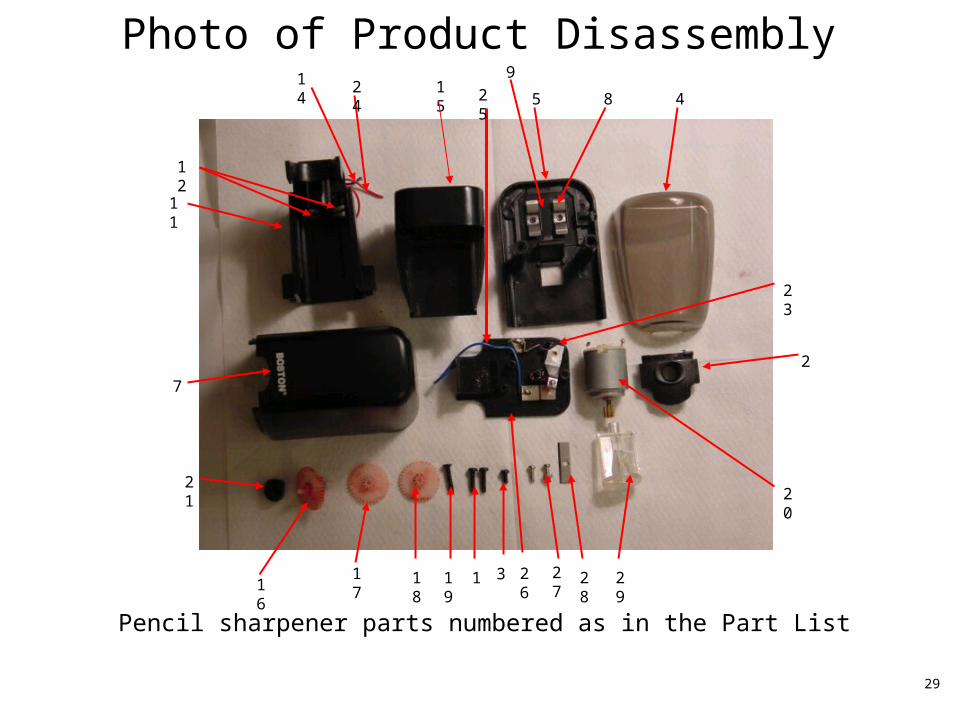
Photo of Product Disassembly8
11
2
4
7
20
26
5
21
16 1817 119 27 28 29
1524
23
11
3
14
12
25
9
Pencil sharpener parts numbered as in the Part List
30
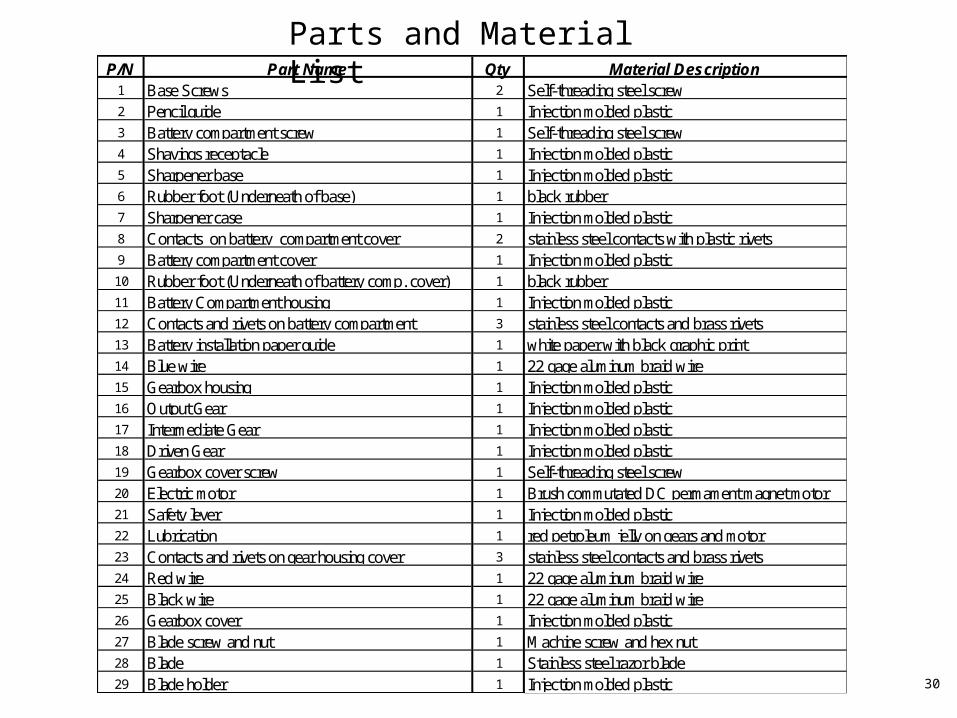
P/N Part Name Qty Material Description1 Base Screws 2 Self-threading steel screw2 Pencil guide 1 Injection molded plastic3 Battery compartment screw 1 Self-threading steel screw4 Shavings receptacle 1 Injection molded plastic5 Sharpener base 1 Injection molded plastic6 Rubber foot (Underneath of base) 1 black rubber7 Sharpener case 1 Injection molded plastic8 Contacts on battery compartment cover 2 stainless steel contacts with plastic rivets9 Battery compartment cover 1 Injection molded plastic10 Rubber foot (Underneath of battery comp. cover) 1 black rubber11 Battery Compartment housing 1 Injection molded plastic12 Contacts and rivets on battery compartment 3 stainless steel contacts and brass rivets13 Battery installation paper guide 1 white paper with black graphic print14 Blue wire 1 22 gage aluminum braid wire15 Gearbox housing 1 Injection molded plastic16 Output Gear 1 Injection molded plastic17 Intermediate Gear 1 Injection molded plastic18 Driven Gear 1 Injection molded plastic19 Gearbox cover screw 1 Self-threading steel screw20 Electric motor 1 Brush commutated DC permament magnet motor21 Safety lever 1 Injection molded plastic22 Lubrication 1 red petroleum jelly on gears and motor23 Contacts and rivets on gear housing cover 3 stainless steel contacts and brass rivets24 Red wire 1 22 gage aluminum braid wire25 Black wire 1 22 gage aluminum braid wire26 Gearbox cover 1 Injection molded plastic27 Blade screw and nut 1 Machine screw and hex nut 28 Blade 1 Stainless steel razor blade29 Blade holder 1 Injection molded plastic
Parts and Material List
31
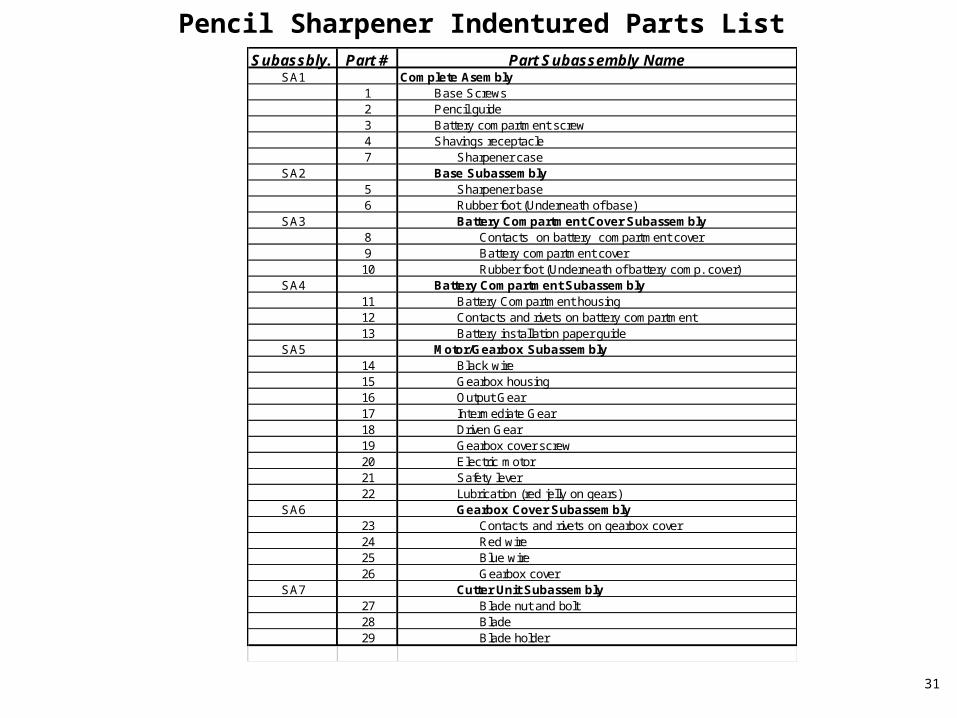
Subassbly. Part # Part Subassembly NameSA1 Complete Asembly
1 Base Screws2 Pencil guide3 Battery compartment screw4 Shavings receptacle7 Sharpener case
SA2 Base Subassembly5 Sharpener base 6 Rubber foot (Underneath of base)
SA3 Battery Compartment Cover Subassembly8 Contacts on battery compartment cover9 Battery compartment cover10 Rubber foot (Underneath of battery comp. cover)
SA4 Battery Compartment Subassembly11 Battery Compartment housing12 Contacts and rivets on battery compartment13 Battery installation paper guide
SA5 Motor/Gearbox Subassembly14 Black wire15 Gearbox housing16 Output Gear17 Intermediate Gear 18 Driven Gear19 Gearbox cover screw20 Electric motor21 Safety lever22 Lubrication (red jelly on gears)
SA6 Gearbox Cover Subassembly23 Contacts and rivets on gearbox cover24 Red wire25 Blue wire26 Gearbox cover
SA7 Cutter Unit Subassembly27 Blade nut and bolt28 Blade29 Blade holder
Pencil Sharpener Indentured Parts List
32
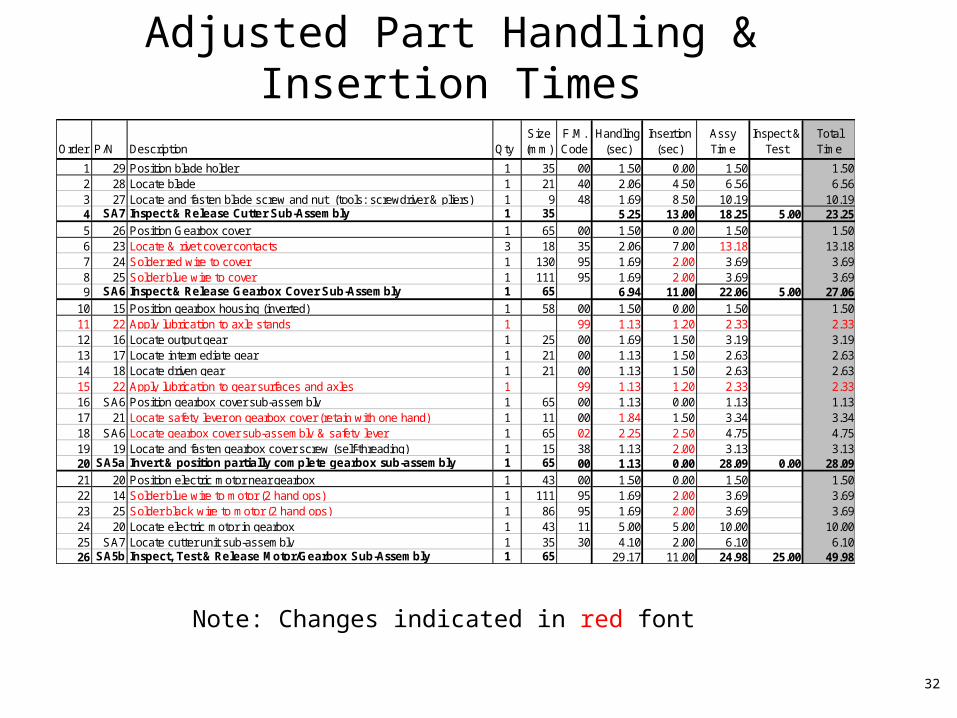
Order P/N Description QtySize (mm)
F.M. Code
Handling (sec)
Insertion (sec)
Assy Time
Inspect & Test
Total Time
1 29 Position blade holder 1 35 00 1.50 0.00 1.50 1.502 28 Locate blade 1 21 40 2.06 4.50 6.56 6.563 27 Locate and fasten blade screw and nut (tools: screwdriver & pliers) 1 9 48 1.69 8.50 10.19 10.194 SA7 Inspect & Release Cutter Sub-Assembly 1 35 5.25 13.00 18.25 5.00 23.255 26 Position Gearbox cover 1 65 00 1.50 0.00 1.50 1.506 23 Locate & rivet cover contacts 3 18 35 2.06 7.00 13.18 13.187 24 Solder red wire to cover 1 130 95 1.69 2.00 3.69 3.698 25 Solder blue wire to cover 1 111 95 1.69 2.00 3.69 3.699 SA6 Inspect & Release Gearbox Cover Sub-Assembly 1 65 6.94 11.00 22.06 5.00 27.06
10 15 Position gearbox housing (inverted) 1 58 00 1.50 0.00 1.50 1.5011 22 Apply lubrication to axle stands 1 99 1.13 1.20 2.33 2.3312 16 Locate output gear 1 25 00 1.69 1.50 3.19 3.1913 17 Locate intermediate gear 1 21 00 1.13 1.50 2.63 2.6314 18 Locate driven gear 1 21 00 1.13 1.50 2.63 2.6315 22 Apply lubrication to gear surfaces and axles 1 99 1.13 1.20 2.33 2.3316 SA6 Position gearbox cover sub-assembly 1 65 00 1.13 0.00 1.13 1.1317 21 Locate safety lever on gearbox cover (retain with one hand) 1 11 00 1.84 1.50 3.34 3.3418 SA6 Locate gearbox cover sub-assembly & safety lever 1 65 02 2.25 2.50 4.75 4.7519 19 Locate and fasten gearbox cover screw (self-threading) 1 15 38 1.13 2.00 3.13 3.1320 SA5a Invert & position partially complete gearbox sub-assembly 1 65 00 1.13 0.00 28.09 0.00 28.0921 20 Position electric motor near gearbox 1 43 00 1.50 0.00 1.50 1.5022 14 Solder blue wire to motor (2 hand ops) 1 111 95 1.69 2.00 3.69 3.6923 25 Solder black wire to motor (2 hand ops) 1 86 95 1.69 2.00 3.69 3.6924 20 Locate electric motor in gearbox 1 43 11 5.00 5.00 10.00 10.0025 SA7 Locate cutter unit sub-assembly 1 35 30 4.10 2.00 6.10 6.1026 SA5b Inspect, Test & Release Motor/Gearbox Sub-Assembly 1 65 29.17 11.00 24.98 25.00 49.98
Adjusted Part Handling & Insertion Times
Note: Changes indicated in red font
33
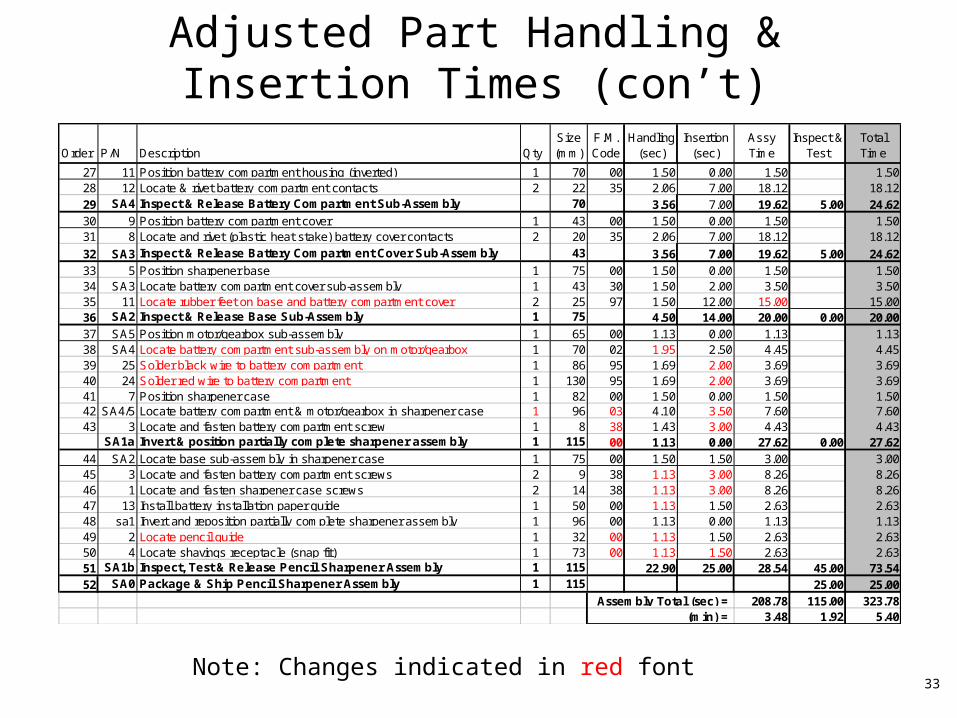
Order P/N Description QtySize (mm)
F.M. Code
Handling (sec)
Insertion (sec)
Assy Time
Inspect & Test
Total Time
27 11 Position battery compartment housing (inverted) 1 70 00 1.50 0.00 1.50 1.5028 12 Locate & rivet battery compartment contacts 2 22 35 2.06 7.00 18.12 18.1229 SA4 Inspect & Release Battery Compartment Sub-Assembly 70 3.56 7.00 19.62 5.00 24.6230 9 Position battery compartment cover 1 43 00 1.50 0.00 1.50 1.5031 8 Locate and rivet (plastic heat stake) battery cover contacts 2 20 35 2.06 7.00 18.12 18.12
32 SA3 Inspect & Release Battery Compartment Cover Sub-Assembly 43 3.56 7.00 19.62 5.00 24.6233 5 Position sharpener base 1 75 00 1.50 0.00 1.50 1.5034 SA3 Locate battery compartment cover sub-assembly 1 43 30 1.50 2.00 3.50 3.5035 11 Locate rubber feet on base and battery compartment cover 2 25 97 1.50 12.00 15.00 15.0036 SA2 Inspect & Release Base Sub-Assembly 1 75 4.50 14.00 20.00 0.00 20.0037 SA5 Position motor/gearbox sub-assembly 1 65 00 1.13 0.00 1.13 1.1338 SA4 Locate battery compartment sub-assembly on motor/gearbox 1 70 02 1.95 2.50 4.45 4.4539 25 Solder black wire to battery compartment 1 86 95 1.69 2.00 3.69 3.6940 24 Solder red wire to battery compartment 1 130 95 1.69 2.00 3.69 3.6941 7 Position sharpener case 1 82 00 1.50 0.00 1.50 1.5042 SA4/5 Locate battery compartment & motor/gearbox in sharpener case 1 96 03 4.10 3.50 7.60 7.6043 3 Locate and fasten battery compartment screw 1 8 38 1.43 3.00 4.43 4.43
SA1a Invert & position partially complete sharpener assembly 1 115 00 1.13 0.00 27.62 0.00 27.6244 SA2 Locate base sub-assembly in sharpener case 1 75 00 1.50 1.50 3.00 3.0045 3 Locate and fasten battery compartment screws 2 9 38 1.13 3.00 8.26 8.2646 1 Locate and fasten sharpener case screws 2 14 38 1.13 3.00 8.26 8.2647 13 Install battery installation paper guide 1 50 00 1.13 1.50 2.63 2.6348 sa1 Invert and reposition partially complete sharpener assembly 1 96 00 1.13 0.00 1.13 1.1349 2 Locate pencil guide 1 32 00 1.13 1.50 2.63 2.6350 4 Locate shavings receptacle (snap fit) 1 73 00 1.13 1.50 2.63 2.6351 SA1b Inspect, Test & Release Pencil Sharpener Assembly 1 115 22.90 25.00 28.54 45.00 73.5452 SA0 Package & Ship Pencil Sharpener Assembly 1 115 25.00 25.00
208.78 115.00 323.783.48 1.92 5.40
Assembly Total (sec) = (min) =
Adjusted Part Handling & Insertion Times (con’t)
Note: Changes indicated in red font