1 project cycle management an introduction. 2 - definitions - project cycle - log frame approach –...
TRANSCRIPT
1
PROJECT CYCLE MANAGEMENT
An introduction
2
- Definitions- Project Cycle- Log Frame Approach – analysis phase
- stakeholder analysis- problem analysis- analysis of objectives
- Log Frame Approach – planning phase- assumptions- indicators- sources of verification- activity scheduling
- Project Charts
Overview

3
PROJECT APPROACH
Project = a series of activities aimed at bringing about clearly specified objectives within a defined time-period and with a defined budget.
A project should have:•Clearly identified stakeholders (primary target group & final beneficiaries);•Clearly defined coordination, management and financing arrangements;•A monitoring and evaluation system;•An appropriate level of financial and economic benefits (indicating that the project‘s benefits will exceed its costs).
4
PROJECTS AND PROJECT MANAGEMENT
- Funding and contributions that are additional to ongoing activities- Funding = limited in time and resources
Contribute to process of change taking place in a context that is complex because:
it is changing continuously many actors are involved and may have an influence
Project management can therefore be defined as the facilitation of such processes of change in order to attain objectives in the most effective and efficient way

5
Management toolsLogical framework approach
A methodology for analysing, planning, managing and evaluating programmes and projects, using tools to enhance participation and transparency and to improve orientation towards objectives
Developed in early 70s by USAID and widely adopted
Project cycle management (PCM)
Defines different phases in the project life with a well-defined process of involvement of different stakeholders, management activities and decision making procedures
Uses the LFA (as well as other tools such as the Pert chart and Gantt diagram)
Developed in early 90s and adopted by most development agencies and the EC

6
Project cycle management
• Not revolutionary but likely to frame and articulate ongoing practices
• Not an exact science but a supporting tool to structure learning processes
• Many agencies talk about it, few are actually good at it
• Widely applicable – usefulness goes beyond development
• Value added depends on quality of its application
7
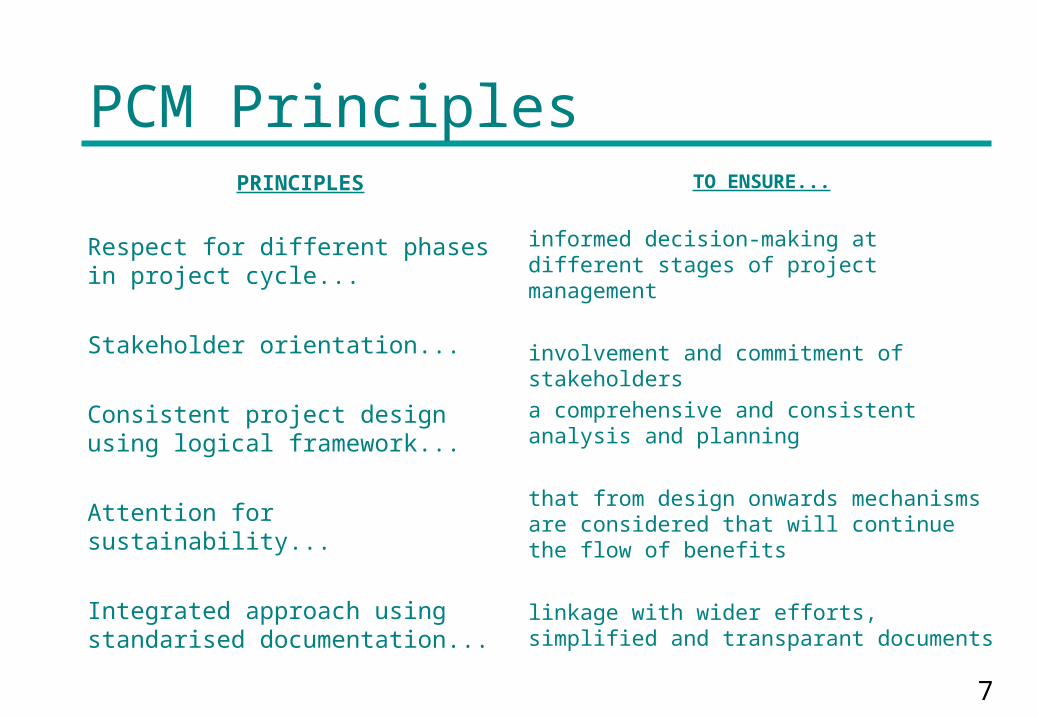
PCM PrinciplesPRINCIPLES
Respect for different phases in project cycle...
Stakeholder orientation...
Consistent project design using logical framework...
Attention for sustainability...
Integrated approach using standarised documentation...
TO ENSURE...
informed decision-making at different stages of project management
involvement and commitment of stakeholdersa comprehensive and consistent analysis and planning
that from design onwards mechanisms are considered that will continue the flow of benefits
linkage with wider efforts, simplified and transparant documents

8
PROJECT CYCLE
Identification
Formulation
Implementation
Monitoring
Evaluation
Programming

9
PROJECT CYCLE
l
Monitoring Monitoring by by stakeholderstakeholderss
End of End of project project evaluationevaluation
Ex-post Ex-post evaluationevaluation
a
Ex-ante evaluation
AppraisalFormulation
10
PCM/LFA APPROACH

11
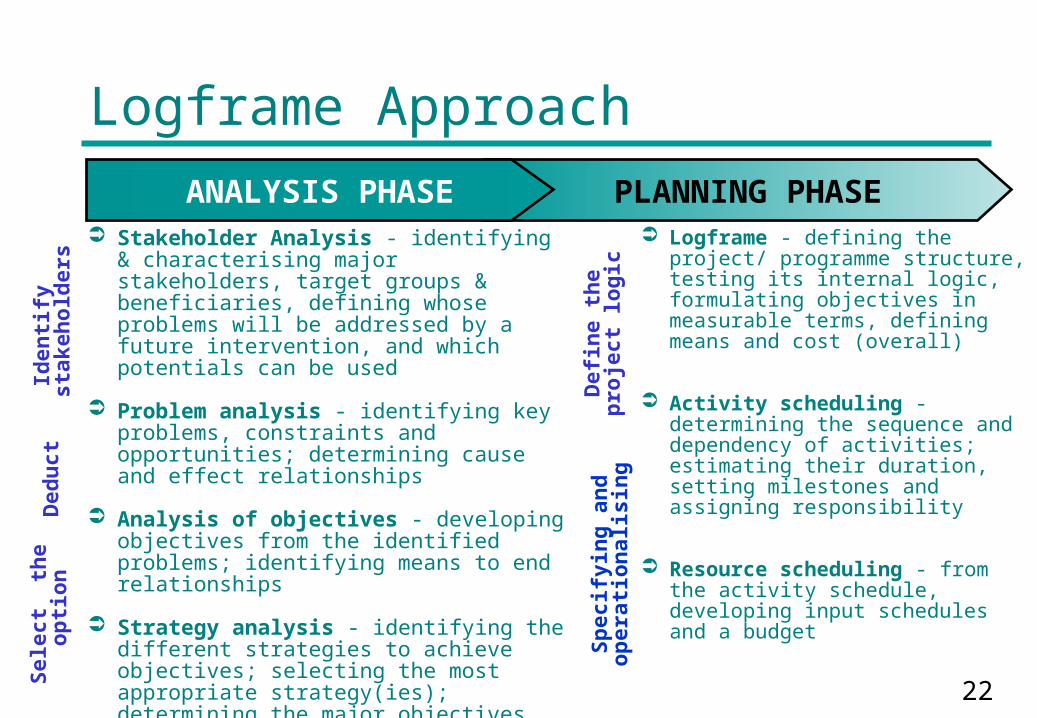
Logframe - defining the project/ programme structure, testing its internal logic, formulating objectives in measurable terms, defining means and cost (overall)
Activity scheduling - determining the sequence and dependency of activities; estimating their duration, setting milestones and assigning responsibility
Resource scheduling - from the activity schedule, developing input schedules and a budget
Logframe Approach
PLANNING PHASEANALYSIS PHASE Stakeholder Analysis - identifying &
characterising major stakeholders, target groups & beneficiaries, defining whose problems will be addressed by a future intervention, and which potentials can be used
Problem analysis - identifying key problems, constraints and opportunities; determining cause and effect relationships
Analysis of objectives - developing objectives from the identified problems; identifying means to end relationships
Strategy analysis - identifying the different strategies to achieve objectives; selecting the most appropriate strategy(ies); determining the major objectives (overall objectives and project purpose)
Sele
ct
th
e o
pti
on
Ded
uct
Defi
ne t
he
pro
ject
log
icS
pecif
yin
g a
nd
op
era
tion
alisin
g
Iden
tify
sta
keh
old
ers
12
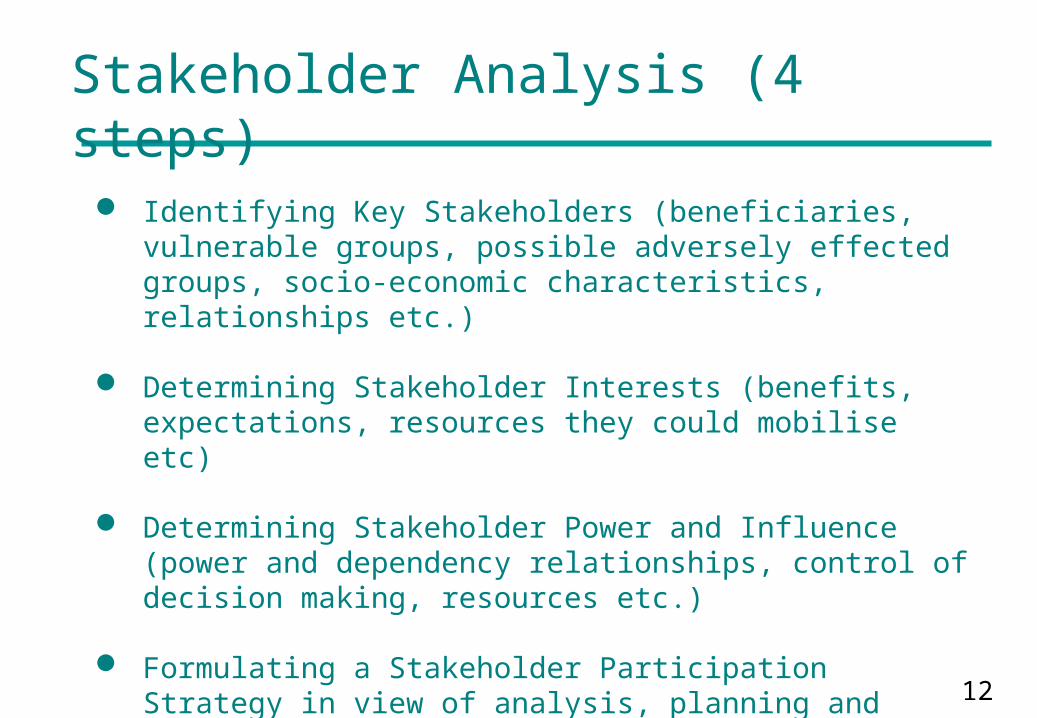
Stakeholder Analysis (4 steps)
Identifying Key Stakeholders (beneficiaries, vulnerable groups, possible adversely effected groups, socio-economic characteristics, relationships etc.)
Determining Stakeholder Interests (benefits, expectations, resources they could mobilise etc)
Determining Stakeholder Power and Influence (power and dependency relationships, control of decision making, resources etc.)
Formulating a Stakeholder Participation Strategy in view of analysis, planning and implementation
13
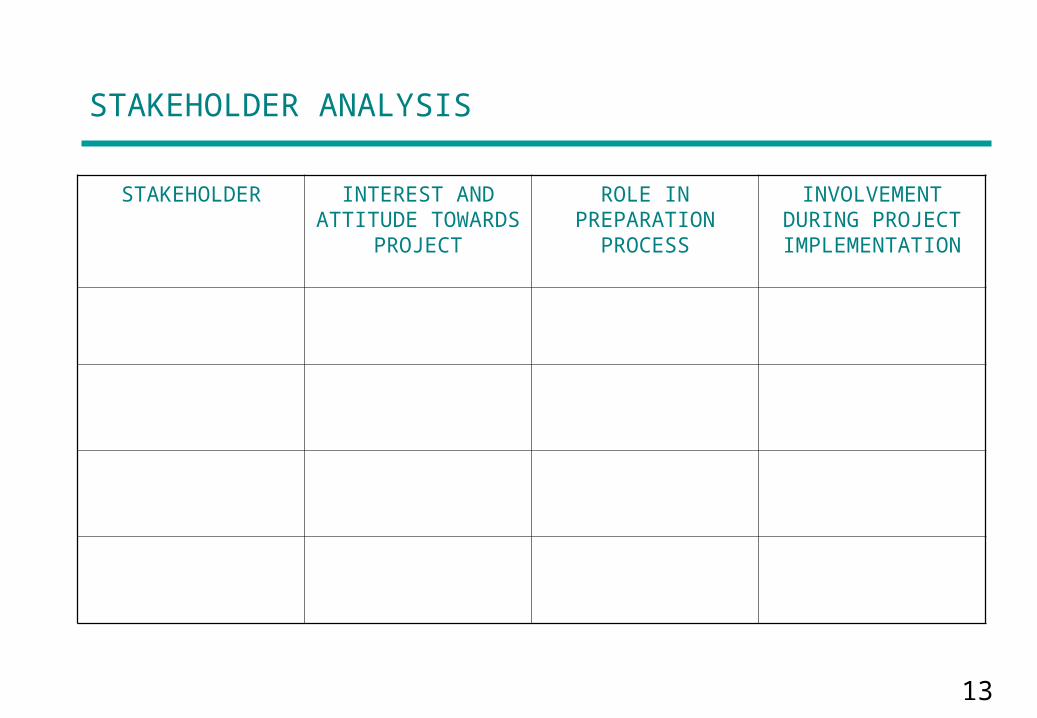
STAKEHOLDER ANALYSIS
STAKEHOLDER INTEREST AND ATTITUDE
TOWARDS PROJECT
ROLE IN PREPARATION
PROCESS
INVOLVEMENT DURING PROJECT IMPLEMENTATION
14
1. PROBLEM ANALYSIS
• Should involve key stakeholders (identified through analysis)
• Typically in a workshop setting with possible external facilitation
• Given the capacity building orientation, multilevel problem analysis (subject and capacity)
15
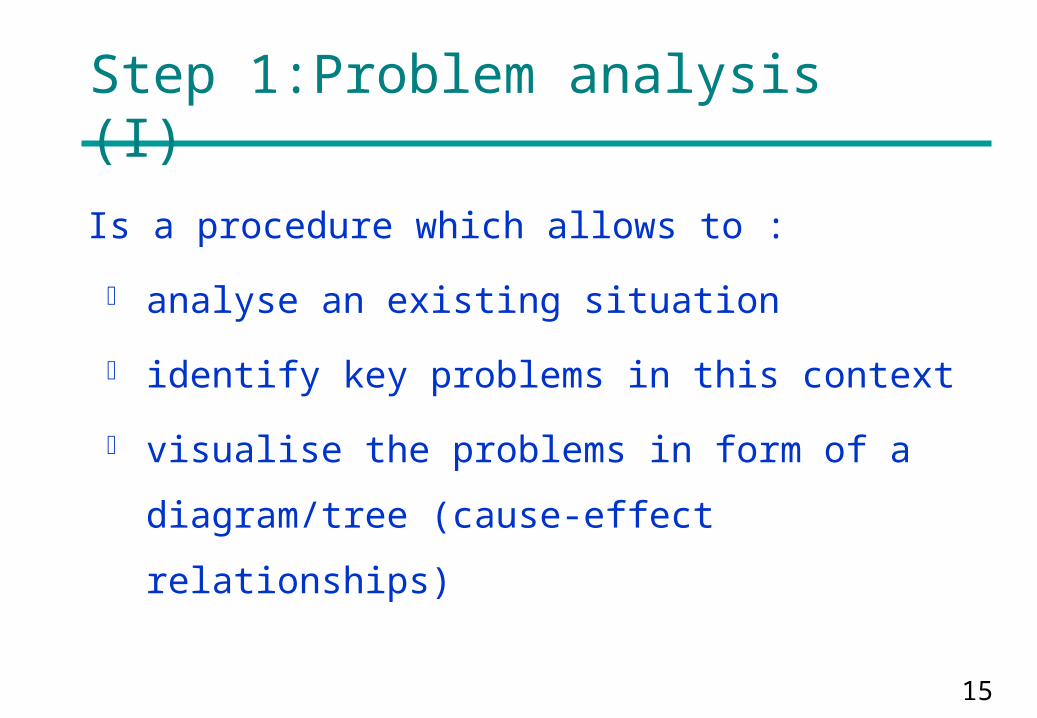
Step 1:Problem analysis (I)
Is a procedure which allows to :
analyse an existing situation
identify key problems in this context
visualise the problems in form of a
diagram/tree (cause-effect relationships)
16
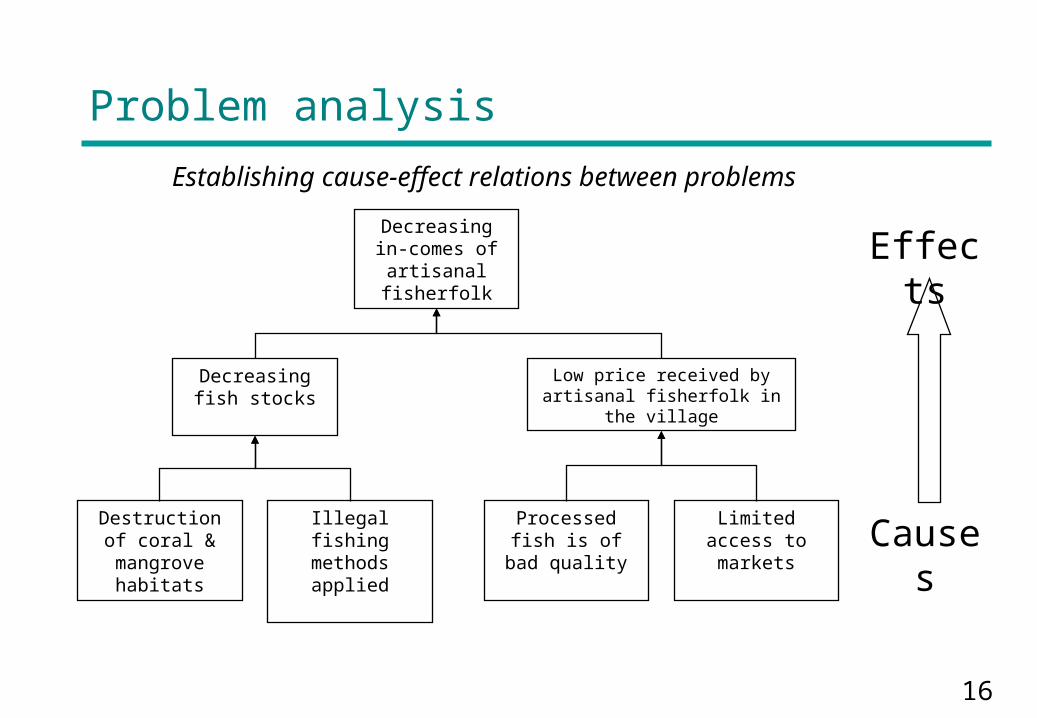
Problem analysis
Causes
Effects
Destruction of coral & mangrove habitats
Illegal fishing methods applied
Decreasing fish stocks
Low price received by artisanal fisherfolk in the village
Processed fish is of bad quality
Limited access to markets
Decreasing in-comes of artisanal fisherfolk
Establishing cause-effect relations between problems
17
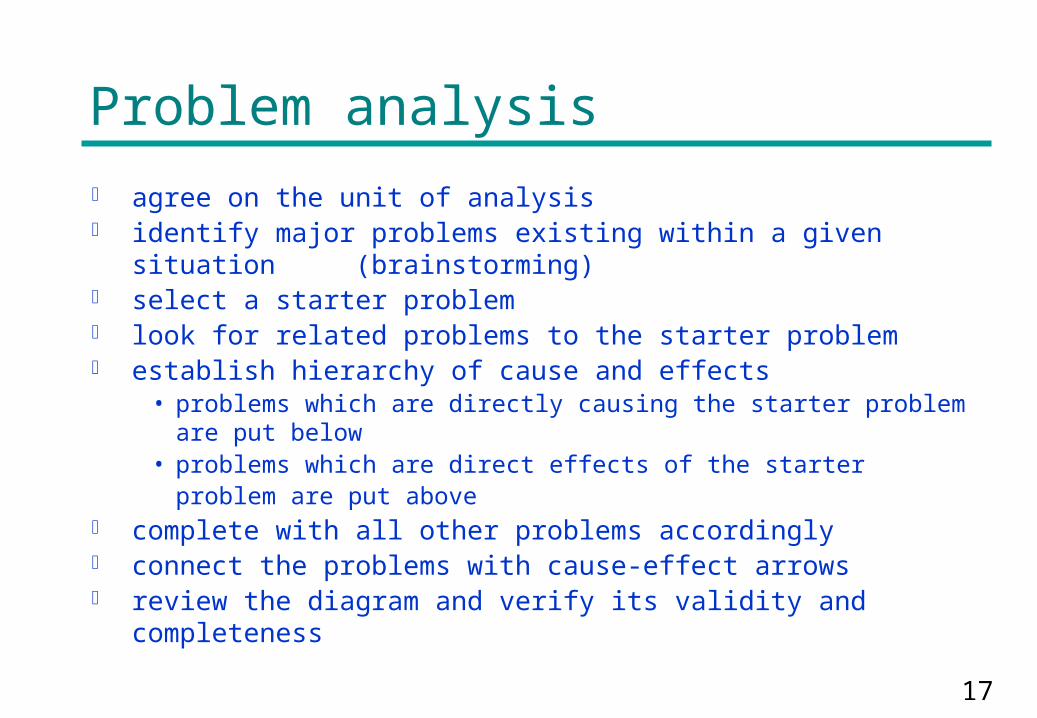
Problem analysis agree on the unit of analysis identify major problems existing within a given situation
(brainstorming) select a starter problem look for related problems to the starter problem establish hierarchy of cause and effects
• problems which are directly causing the starter problem are put below
• problems which are direct effects of the starter problem are put above
complete with all other problems accordingly connect the problems with cause-effect arrows review the diagram and verify its validity and completeness
18
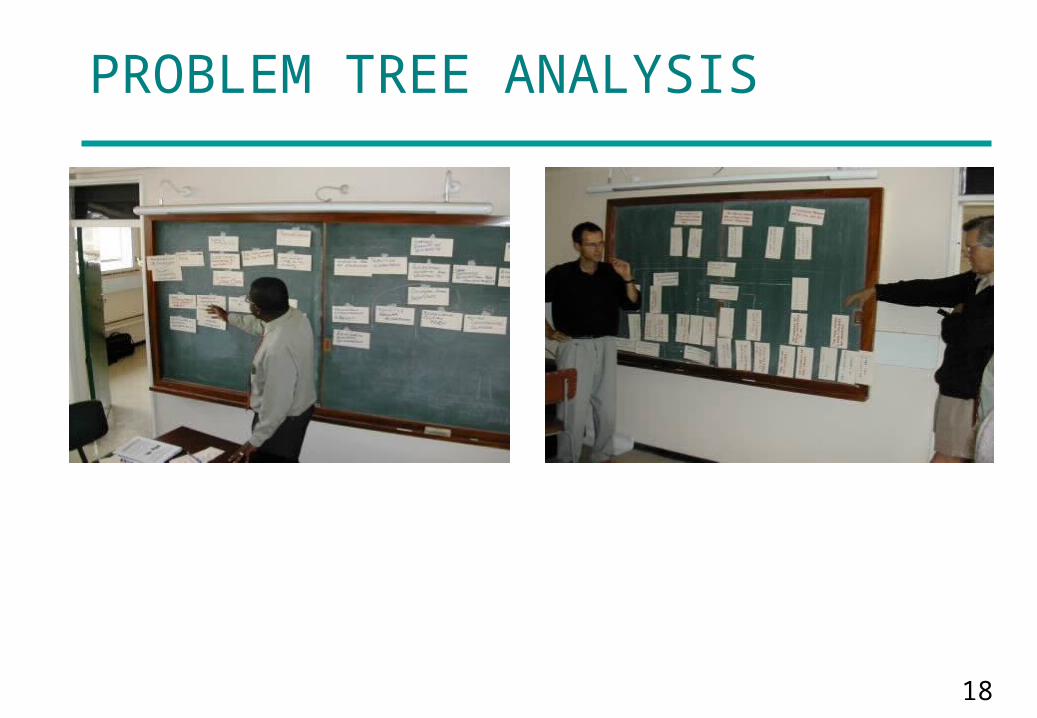
PROBLEM TREE ANALYSIS

19
2. Analysis of objectives
Means
Ends
Coral & man-grove habitats conserved
Incidence of illegal fishing reduced
Quality of fish processing improved
Access to markets improved
Rate of decline in fish stocks arrested
Price received by artisanal fisher-folk increased
Incomes of artisanal fisherfolk increased
Turning the negative aspects into future desired, but realistic situations

20
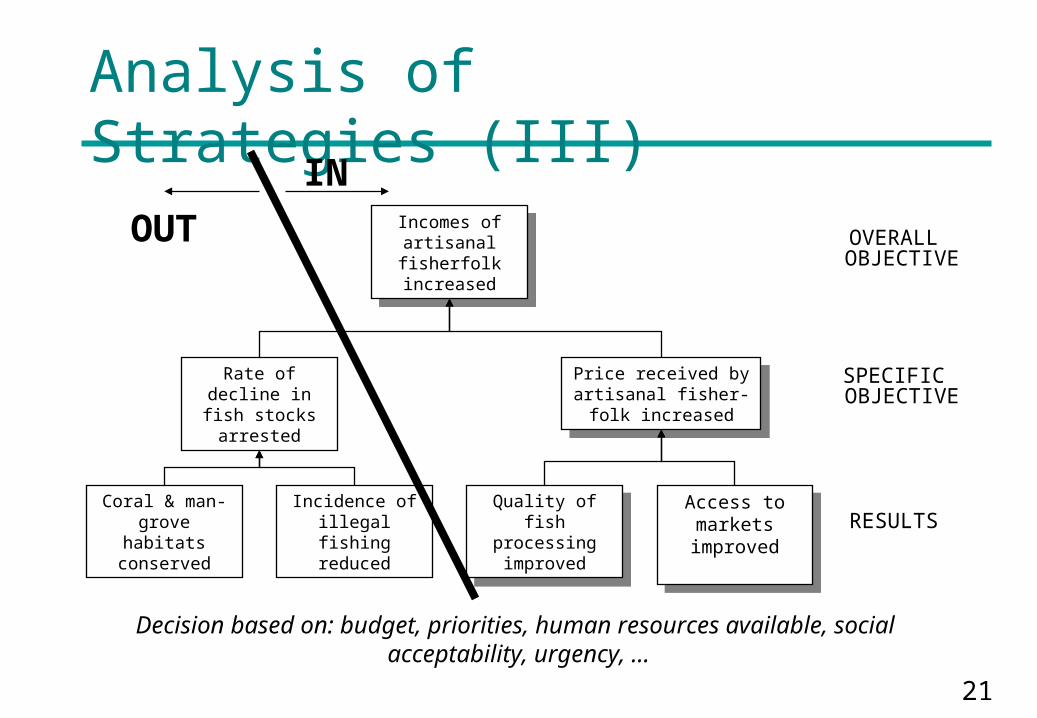
3: Analysis of Strategies
The purpose is:
• to identify possible alternative options or ways to
contribute to the overall objectives
• to agree on priority strategies based on an
assessment of the relevance, the feasibility and
the sustainability of each of them
• to concentrate the means of the project on what
is really important, effective and feasible
21
Analysis of Strategies (III)
RESULTS
OVERALLOBJECTIVE
SPECIFICOBJECTIVE
Coral & man-grove habitats conserved
Incidence of illegal fishing reduced
Quality of fish processing improved
Quality of fish processing improved
Access to markets improved
Access to markets improved
Rate of decline in fish stocks arrested
Price received by artisanal fisher-folk increased
Price received by artisanal fisher-folk increased
Incomes of artisanal fisherfolk increased
Incomes of artisanal fisherfolk increasedOUT
IN
Decision based on: budget, priorities, human resources available, social acceptability, urgency, ...
22
Logframe - defining the project/ programme structure, testing its internal logic, formulating objectives in measurable terms, defining means and cost (overall)
Activity scheduling - determining the sequence and dependency of activities; estimating their duration, setting milestones and assigning responsibility
Resource scheduling - from the activity schedule, developing input schedules and a budget
Logframe Approach
PLANNING PHASEANALYSIS PHASE Stakeholder Analysis - identifying &
characterising major stakeholders, target groups & beneficiaries, defining whose problems will be addressed by a future intervention, and which potentials can be used
Problem analysis - identifying key problems, constraints and opportunities; determining cause and effect relationships
Analysis of objectives - developing objectives from the identified problems; identifying means to end relationships
Strategy analysis - identifying the different strategies to achieve objectives; selecting the most appropriate strategy(ies); determining the major objectives (overall objectives and project purpose)
Sele
ct
th
e o
pti
on
Ded
uct
Defi
ne t
he
pro
ject
log
icS
pecif
yin
g a
nd
op
era
tion
alisin
g
Iden
tify
sta
keh
old
ers

23
The Logical Framework?
The Logical Framework Matrix provides a summary of: why a project is carried out what the project is expected to achieve how the project is going to achieve it which external factors are crucial for its success where to find the information required to assess the
success of the project which means are required what the project will cost
24
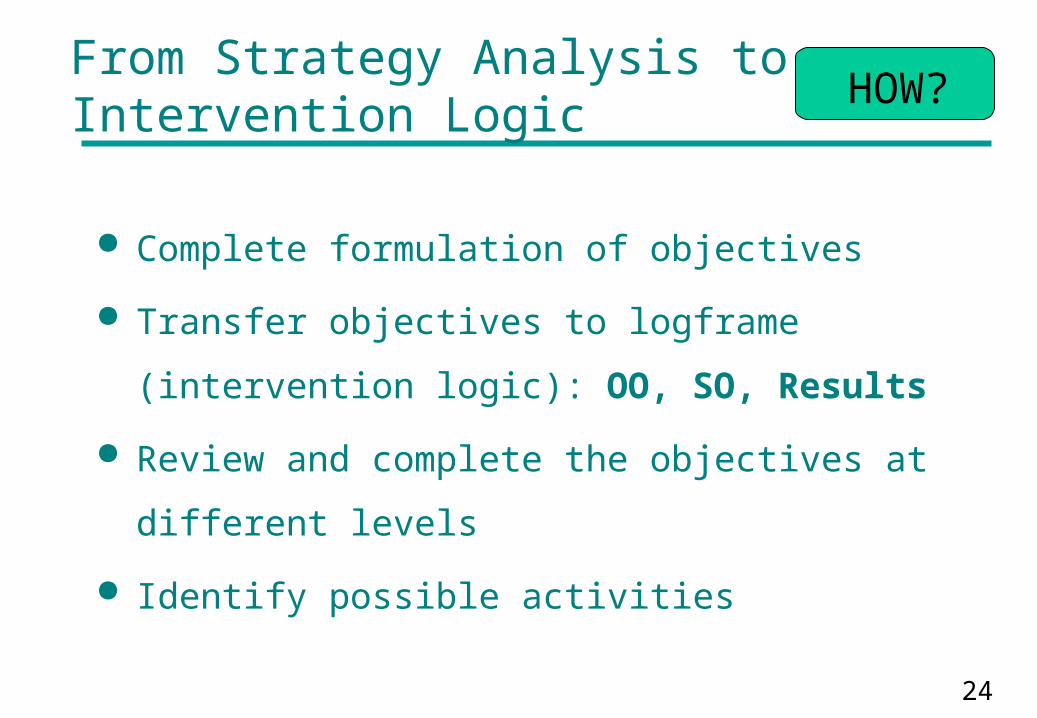
From Strategy Analysis to Intervention Logic
Complete formulation of objectives
Transfer objectives to logframe
(intervention logic): OO, SO, Results
Review and complete the objectives at
different levels
Identify possible activities
HOW?

25
Logical frameworkIntervention Objectively Sources of Assumptions Logic Verif. Indicators Verification
Overall Objective
Specific
Objective
Results
Activities Means Costs
Pre-conditions

26
Intervention Logic
Overall objective: the project’s contribution to policy or programme objectives (impact)
Specific objective: direct benefits to the target group(s). S.O. is consequence of results, not the sum of the results.
Results: the services or products to be realised by the project.
Activities: the tasks (workprogramme) that need to be carried out to deliver the planned results.(detailed activities are often better presented seperatly. e.g. Gantt chart format)

27
1.1. To train fish handlers1.2. To install appropriate Equipment etc.
Logical frameworkIntervention Objectively Sources of Assumptions Logic Verif. Indicators Verification
Incomes of artisanal fisherfolk increased
Price received by artisanal fisher-folk increased
Activities Means Costs
Pre-conditions
1.Quality of fish processing improved
2.Access to markets improved

28
Logframe Basics
‘... IF results are delivered, AND assumptions hold true, THEN the project purpose will be achieved ...’
Objectively Verifiable Indicators
Intervention Logic Sources of Verification
Assumptions
Overall Objectives
Specific
ObjectiveResults
Activities Means Cost
Pre-conditions
Logframe

29
Logframe Basics
‘... IF results are delivered, AND assumptions hold true, THEN the project purpose will be achieved ...’
Objectively Verifiable Indicators
Intervention Logic Sources of Verification
Assumptions
Leaders of fish co-ops Collaborate
Rate of decline in fish stocks arrested
Incomes of artisanal fisherfolk increased
Price received by artisanal fisher-folk increased
1.Quality of fish processing improved
1.1. To train fish handlers1.2. To install appropriate Equipment etc.
Means Cost
Logframe
Prmission localGov. ObtainedProject facilities provided
30
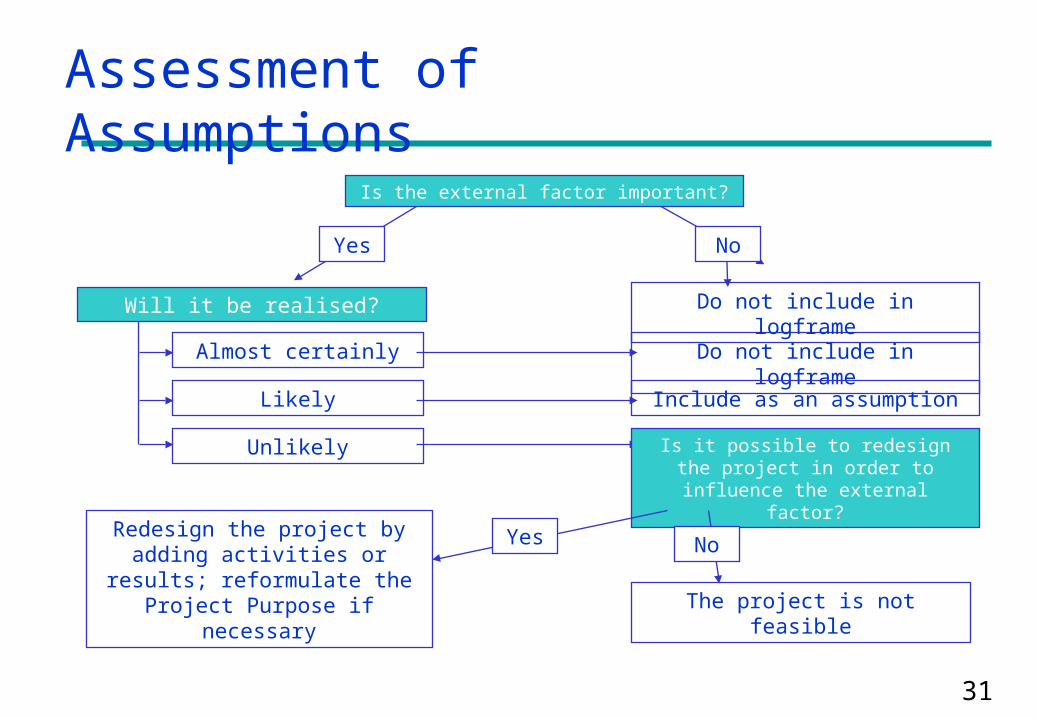
Assumptions HOW?
• Assess the importance of the external
factors by using the assessment algorithm
• Check the intervention logic and
assumptions on completeness
31
Will it be realised?
Almost certainly
Likely
Unlikely
Do not include in logframe
Include as an assumption
Is it possible to redesign the project in order to influence the
external factor?
Yes No
Do not include in logframe
Is the external factor important?
Redesign the project by adding activities or results;
reformulate the Project Purpose if necessary The project is not feasible
NoYes
Assessment of Assumptions
32
Project assumptions:
•Project assumptions may be outside of the project control (policy, collaboration external actors etc.)
•Other assumptions may have university policy implications (staffing policies, incentives, space for resources generation etc.) – Should be taken up prior or during implementation

33
Indicators
To:• Clarify the characteristics of the OO, SO and R• Manage the project more objectively• Provide a basis for performance measurement,
monitoring and evaluation
OVI’s describe the project’s objectives in operationally measurable terms (quantitiy, quality, time)
Note:Often, it is necessary to establish several indicators for one objective. Together, these will provide reliable information on the achievement of objectives.
WHY?

34
Indicators: An Example
Objective: Pollution load of wastewater discharged into the Blue river is reduced
Select the indicator: Concentration of heavy metal compounds (Pb, Cd, Hg)
Define the targets:• Define the quantity: Concentration of heay metal compounds
(Pb, Cd, Hg) is reduced by 75% compared to year x levels …(particular attention should be paid to the availability of baseline information)
• Define the quality: . to meet the limits for irrigation water ..
• Define the target group: ... , used by the farmers of Blue village, ...
• Define the place : . in the Blue river section of the District ..
• Determine the time: ... 2 years after the project has started
35
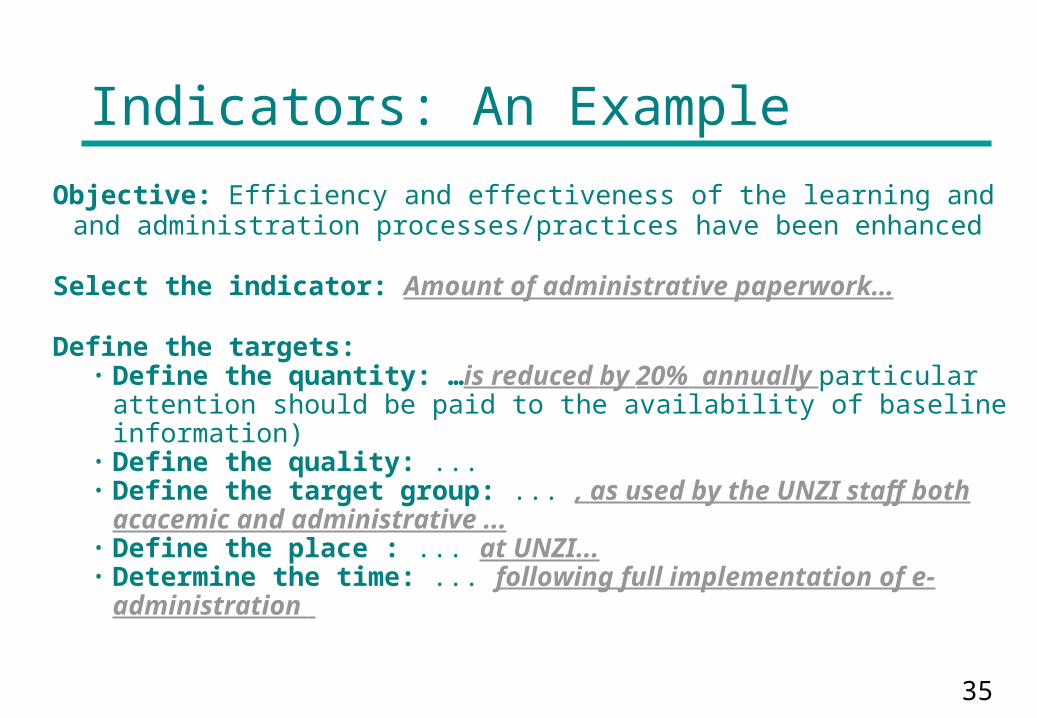
Indicators: An Example
Objective: Efficiency and effectiveness of the learning and and administration processes/practices have been enhanced
Select the indicator: Amount of administrative paperwork…
Define the targets:• Define the quantity: …is reduced by 20% annually
particular attention should be paid to the availability of baseline information)
• Define the quality: ... • Define the target group: ... , as used by the UNZI staff both
acacemic and administrative ...• Define the place : ... at UNZI...• Determine the time: ... following full implementation of e-
administration
36
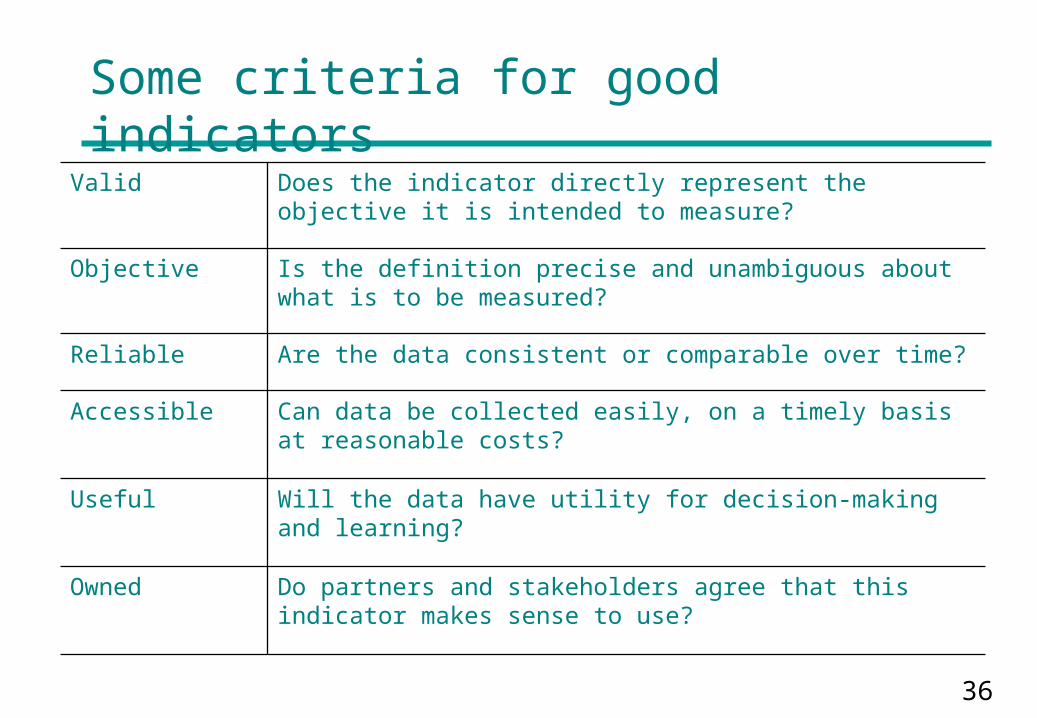
Some criteria for good indicators
Do partners and stakeholders agree that this indicator makes sense to use?
Owned
Will the data have utility for decision-making and learning?
Useful
Can data be collected easily, on a timely basis at reasonable costs?
Accessible
Are the data consistent or comparable over time?Reliable
Is the definition precise and unambiguous about what is to be measured?
Objective
Does the indicator directly represent the objective it is intended to measure?
Valid
37
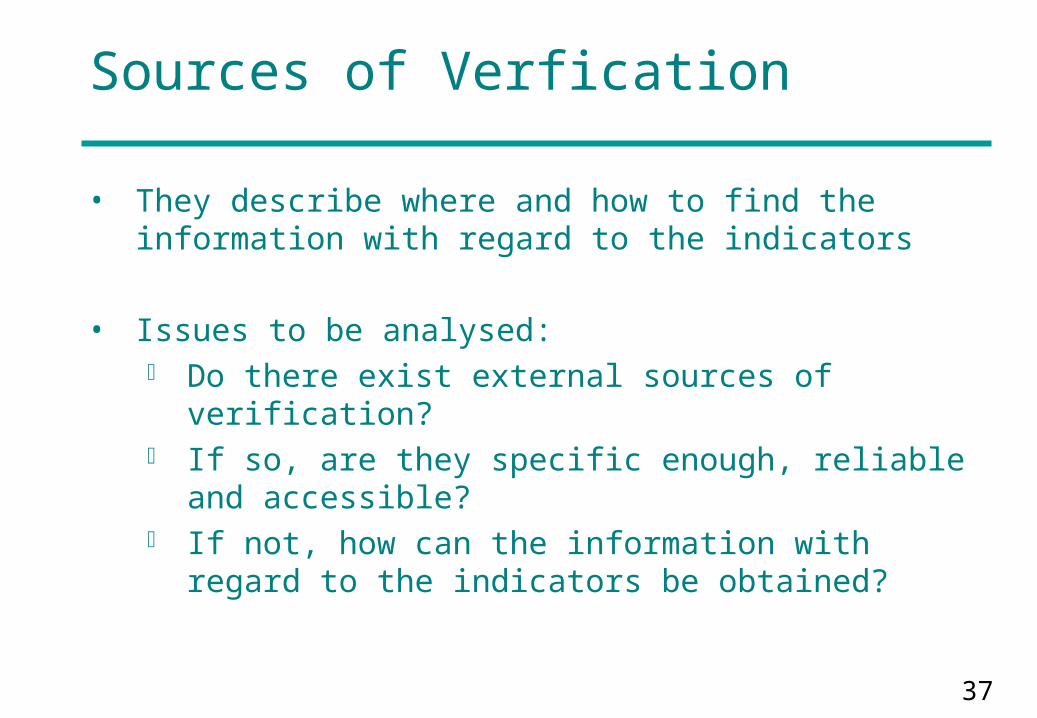
Sources of Verfication
• They describe where and how to find the information with regard to the indicators
• Issues to be analysed: Do there exist external sources of verification? If so, are they specific enough, reliable and
accessible? If not, how can the information with regard to
the indicators be obtained?
38
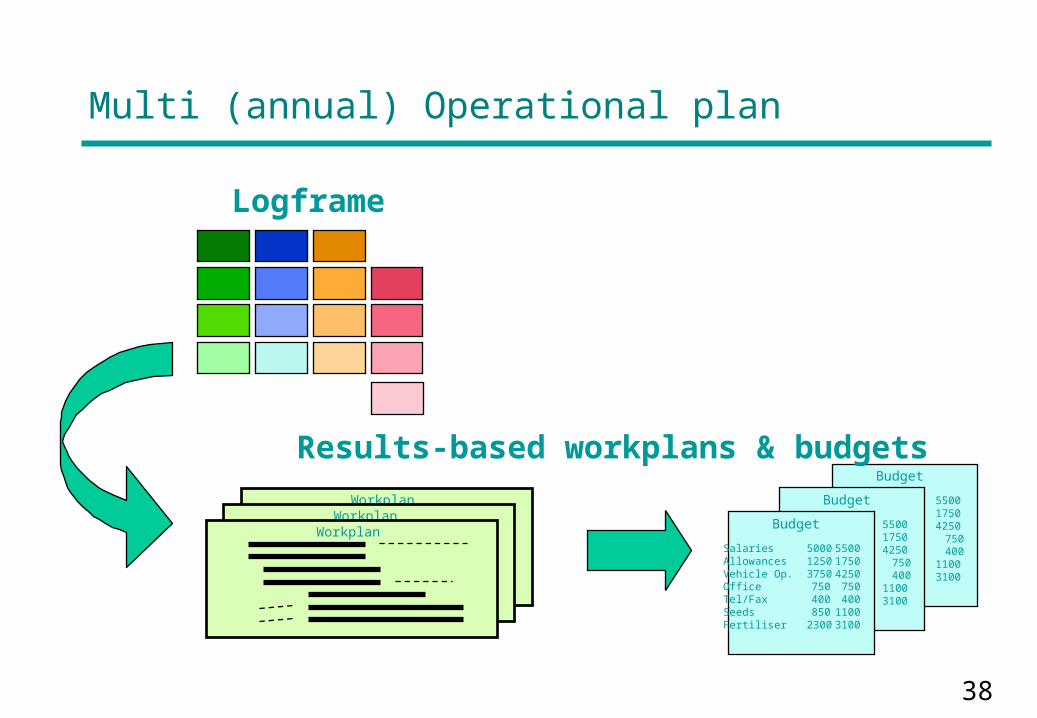
Multi (annual) Operational plan
550017504250 750 40011003100
Budget
550017504250 750 40011003100
Budget
SalariesAllowancesVehicle Op.Office Tel/FaxSeedsFertiliser
5000 55001250 17503750 4250
750 750400 400850 1100
2300 3100
Budget
WorkplanWorkplan
Workplan
Results-based workplans & budgets
Logframe

39
Activity Scheduling
An activity schedule: Maintains objective-oriented approach of logframe Breaks activities down into operational detail Clarifies sequence, duration and precedence of activities Identifies key milestones Assigns management responsibility
and implementing responsibilitiesand should include management tasks
USE project charts
WorkplanWorkplan
Workplan

40
Project charts
Gantt chart = common technique for representing the phases and activities of a project
In this example :- What are the different tasks;- What is the start and end date of the tasks.

41
Project charts
Gantt chart can also include:- Who is responsible?- What is the relation between ≠tasks?- Are the deadlines met?
42
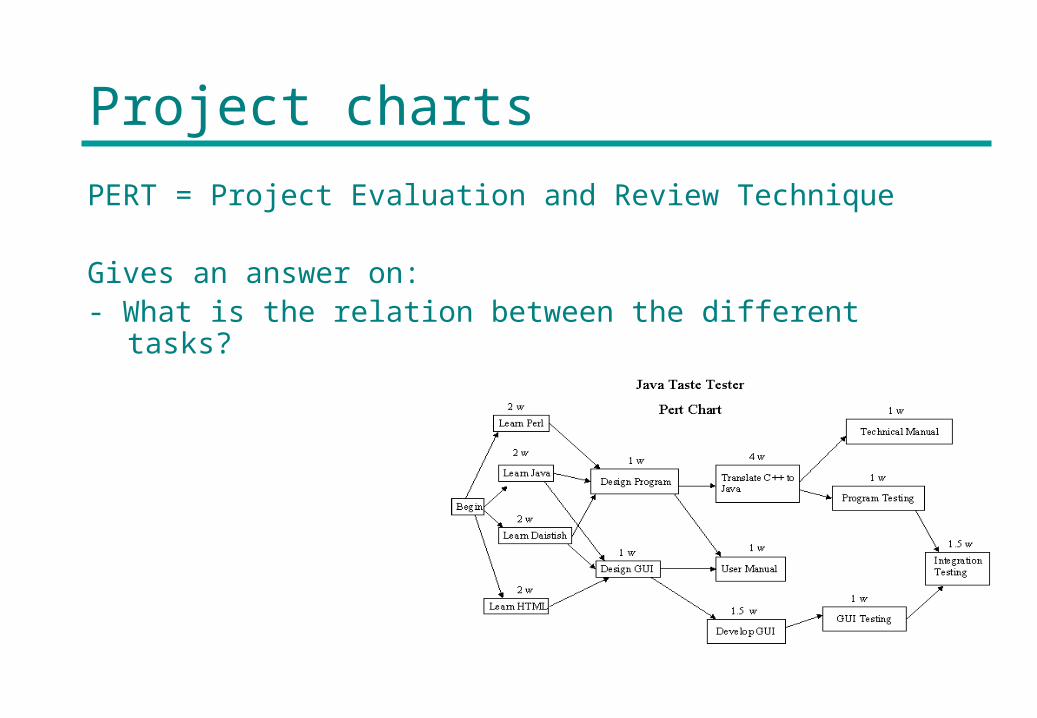
Project charts
PERT = Project Evaluation and Review Technique
Gives an answer on:- What is the relation between the different tasks?
43
Project charts
Gantt versus PERT
Gantt : tasks in relation to time
Pert : tasks in relation to other tasks
44
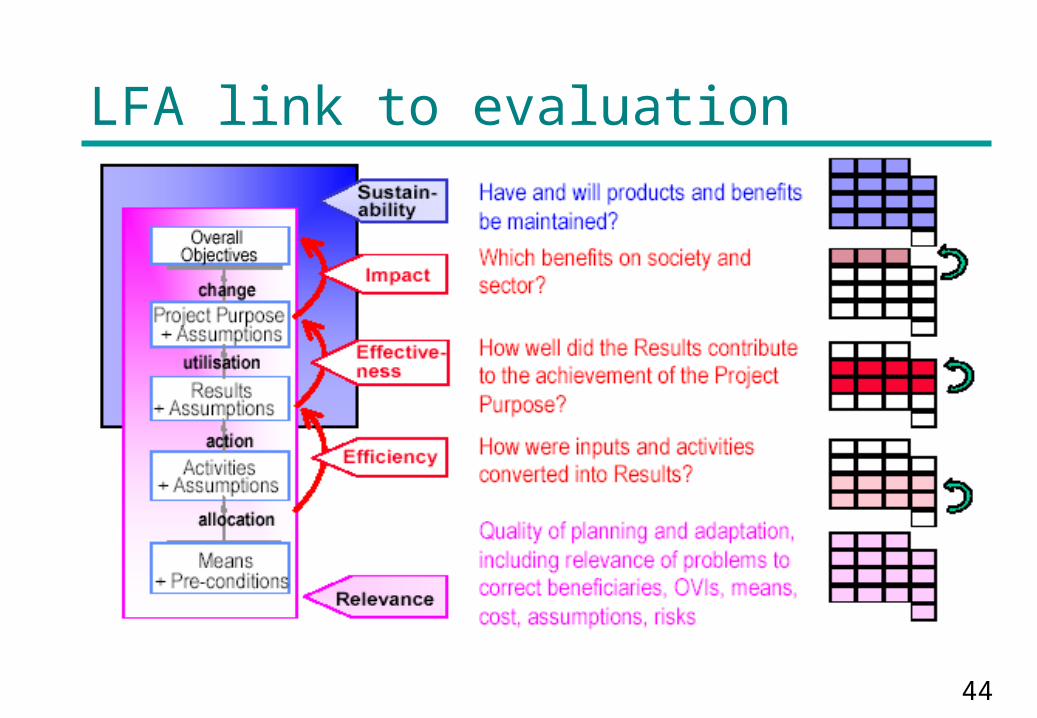
LFA link to evaluation