1 psi’s fluorescent lamp project defining end-of-life product infrastructure needs for small...
TRANSCRIPT

11
PSI’s Fluorescent Lamp Project PSI’s Fluorescent Lamp Project Defining End-of-Life Product Defining End-of-Life Product
Infrastructure Needs for Small Infrastructure Needs for Small Volume ConsumersVolume Consumers
National Dialogue Meeting, July 15th 2008, Seattle WANational Dialogue Meeting, July 15th 2008, Seattle WAPresented by David Nightingale, WA Dept. of EcologyPresented by David Nightingale, WA Dept. of Ecology

22
OverviewOverview
• Define the materials stream and rate
• Assess existing infrastructure, performance, effectiveness and cost
• ID gaps, Choose preferred methods
• Set measurable goals with timeframe
• Implement & Track progress
• Example: Leftover architectural paint

33
Define Material StreamDefine Material Stream
• Materials include: architectural paint leftover from household and small painting contractors
• Materials exclude: specialty paints, OEM paint, art paint, epoxies, industrial coatings

44
Define Material Generation RateDefine Material Generation Rate
• Original background research estimated leftover paint was approximately 5% of sales
• Doubts regarding accuracy of original estimate led to a more detailed study & best est. of 10% of sales become leftover
• 10% agreed baseline by stakeholders

55
Assess existing infrastructure, Assess existing infrastructure, performance, effectiveness and costperformance, effectiveness and cost
• Survey known US recycling capacity
• Interviewed existing collection programs to estimate range of performance and cost– Cost per unit managed ( $/gallon of leftover paint )
– Recovery rate – percent of annual generation rate collected. Paint Example…
• 2.5 gallons of paint sold per person/yr. • Generation rate, 10% of sold or 0.25 gal./capita• If 0.125 gal/capita collected = 50% Recovery rate
66
Identify Infrastructure Gaps, Identify Infrastructure Gaps, Choose preferred methodsChoose preferred methods
• Gap analysis for Paint Recycling/ Processing Capacity
• Analysis of known collection, processing and transportation methods for convenience and economy of scale

77
Gap analysis - Paint Recycling Gap analysis - Paint Recycling Capacity, est. 500 mile reachCapacity, est. 500 mile reach

88
Estimated New Processing Estimated New Processing Facilities NeededFacilities Needed
REGION
Level of Collection Assumed
Low(0.06 gals per
person)
Medium(0.11 gals
per person)
High(0.17 gals
per person)
Extra High(0.23 gals
per person)
Northwest 0 0 0-1 0-1
West 0 0 0 0
Midwest 0 0 0 1-3
South 1-2 1-4 1-6 2-7
Southeast 1-3 1-6 2-8 2-11
East 1-3 1-4 1-6 2-8
Northeast 0 0 0-1 1-2
TOTAL 3 - 8 3 - 14 4 - 22 8 - 32

99
Collection Point FindingsCollection Point Findings
• Permanent collection sites are more cost effective than collection events, except in very rural areas
• Current number of HHW collection points are insufficient, not expected to expand to satisfy expected needs, and not evenly distributed

1010
Collection Methods – Collection Methods – Convenience and EfficiencyConvenience and Efficiency
• Take advantage of Existing collection points
• Model additional infrastructure needs by 1. Minimum Service Levels and
2. Throughput Capacity

1111
Existing HHW Collection PointsExisting HHW Collection Points
1212
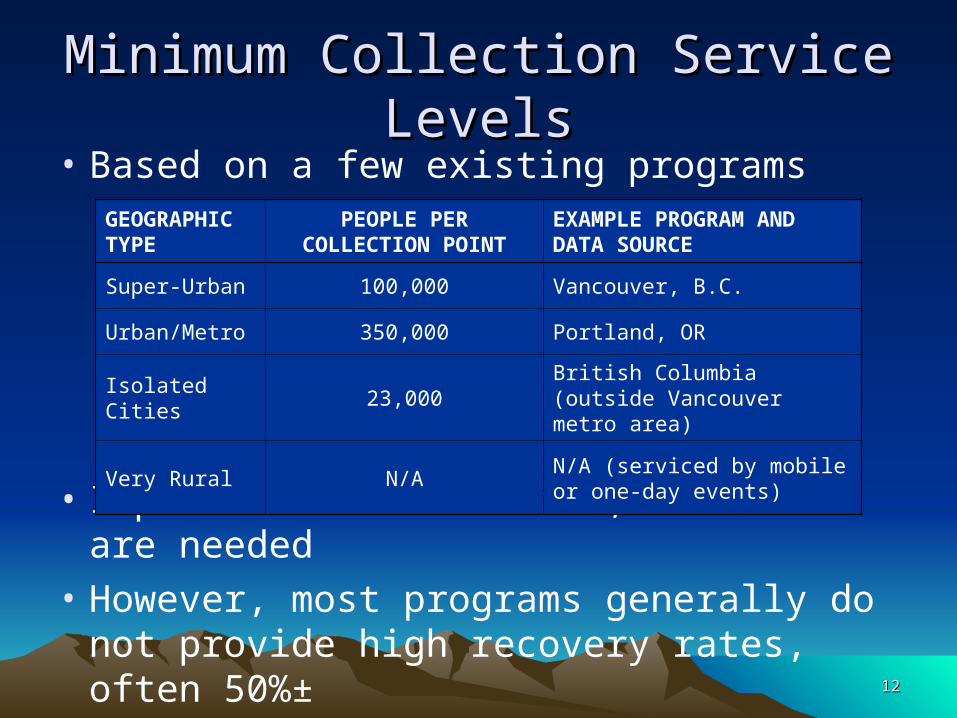
Minimum Collection Service LevelsMinimum Collection Service Levels
• Based on a few existing programs
• Implies that at least 2,090 sites are needed
• However, most programs generally do not provide high recovery rates, often 50%±
GEOGRAPHIC TYPE
PEOPLE PER COLLECTION POINT
EXAMPLE PROGRAM AND DATA SOURCE
Super-Urban 100,000 Vancouver, B.C.
Urban/Metro 350,000 Portland, OR
Isolated Cities 23,000British Columbia (outside Vancouver metro area)
Very Rural N/AN/A (serviced by mobile or one-day events)

1313
Collection Point Throughput Collection Point Throughput Capacity AnalysisCapacity Analysis
• Estimate cans of paint/week and /yr for geographic types (super-urban, metro…)
• Estimate pickups per year per collection site for transportation cost
• Calculate number of sites needed per geographic area for various recovery rates: 25, 50, 75 and 100%.

1414
Estimated US Collection Points Estimated US Collection Points Needed from Throughput Modeling Needed from Throughput Modeling
Recovery Rate
Low, 25% Med., 50%
High, 75%
Extra-High, 100%
Collection Points Needed
1,924 to 3,247
3,028 to 5,451
4,351 to 8,198
5,676 to 10,944

1515
Example: WA Infrastructure AnalysisExample: WA Infrastructure Analysis

1616
Set Measurable Goals & Set Measurable Goals & TimeframeTimeframe
• Goals differ based on existing level of recovery
• If currently at low recovery rates set short term goal at medium level
• If currently at medium recovery rate set short term goal at high
• This is in process for leftover paint

1717
Implement & Track ProgressImplement & Track Progress
• Monitor progress toward measurable Goals and adjust program as needed
• Set intermediate times to measure progress, perhaps annual checking for 5-year goal
• Compile results and present to stakeholders for review and potential program adjustments

1818
Paint Infrastructure Study CostsPaint Infrastructure Study Costs
• $156,000 plus donated time– Waste Stream Generation Rate Study
• $20,000 consulting firm report• 100 hours donated staffing by stakeholder project lead• Funding: US EPA HQ
– Infrastructure Report• $116,000 consulting firm report• $20,000 PSI research and project support• Many hours of donated time by stakeholders• Funding: 2 Associations, 3 States, 3 Local Govt.