1 report carrier bag charge ‘one year on’ · executive summary ... 4.5 where does the money go?...
TRANSCRIPT

1
Report
October 2015 Carrier Bag Charge ‘One Year On’

2 |Carrier Bag Charge ‘One Year On’
Executive Summary Scotland introduced a minimum 5p charge for single use carrier bags on 20th October 2014. The charge aims to influence consumer behaviour and reduce the number of single use carrier bags given out in shops. Before the charge was introduced, around 800 million single use bags were used in the major Scottish grocery retailers alone each year, with the number increasing in recent years. The Scottish Government encourages individual retailers to direct proceeds from the charge to good causes of their choice.
This report aims to outline the impacts of the charge in the first year since its introduction. However, at the time of writing a full year of data was not available and some sectors, and retailers, do not always have comparable pre-charge data to inform an assessment. It may also be the case that the first few months of the charge were not typical, as retailers and consumers became accustomed to remembering to take their own bags.
As a result, this report represents a systematic review of the available evidence for the charge’s performance to date (supplemented where appropriate by experience from elsewhere), though the conclusions may be subject to change once final data for a full “post-charge” year is available.
The most robust analysis for the impact of the charge is for the large grocery retailers, seven of whom submitted data on bag use in preceding years, and who collectively represent around 85% of the grocery market and a proportional share of carrier bag use. This is the sector group for whom pre-charge data is comprehensive. We therefore spoke to leading grocery retailers to gain their assessment of the reductions seen in single use carrier bags in the year to date, and any increases seen in the use of “bags for life”. These assessments were based on a mixture of previously published estimates, submissions to Scotland’s Carrier Bag Commitment Reporting Portal, and qualitative judgements by interviewees where hard data was lacking. We then applied these estimated reductions to each respondent company’s respective share of the grocery market to estimate the likely full year reductions. One major retailer was not available for interview, and in this case we assumed their performance would be comparable to their closest competitors.
The result of this assessment was two estimates for the likely impact of the charge on the major seven grocery retailers: one for those retailers we directly interviewed, and one for the group as whole. Both estimates suggest reductions in the region of 80% - an estimate supported by information from grocery retailers outwith the seven.
We also spoke to a smaller selection of non-grocery retailers. Baseline data on bag use in this sector is not available, so any reductions in bag numbers would be over and above the reduction numbers quoted in this report which are for the seven major grocery retailers only. Qualitatively, a wider range of reductions was quoted for non-grocery retailers, but larger stores seemed to report comparable results to the grocery sector. Overall we expect the impact of charging to be broadly consistent across sectors.
A reduction in the region of 80% implies at least 650 million fewer bags being used – a figure that only considers the major seven grocery retailers. Even with increases in the use of alternatives (bags for life and bin liners) taken into account, it is calculated that the charge has resulted in net material savings in the region of 4,350 tonnes and net carbon savings of at least 2,690 tCO2eq. We expect broadly comparable percentage reductions in bag use in other sectors, and any savings there would be additional.
Though not an explicit objective of charging, where consumers still choose to take a single use carrier bag the Scottish Government encourages retailers to pass the proceeds of the charge to good causes. For the large grocery retailers alone, this is expected to raise £6.7 million for good causes in 2015.
The exact proportion of single use carrier bags distributed in Scotland that end up either in the terrestrial litter stream, or as litter in our oceans, is not known with any confidence, but the reduction

Carrier Bag Charge ‘One Year On’ | 3
seen in use will almost certainly be followed by reductions in the number of single use carrier bags that escape into our shared environment as litter.
These estimates are not wholly comparable with estimates for Wales and Northern Ireland due to variable sector and data coverage, and the fact that reduction figures now quoted for those nations can account for a full twelve months of post charge data.
The visibility of the charge may prompt people to reflect on wider behaviours around waste prevention. This has not been investigated to date. Surveys carried out by Zero Waste Scotland, detailed later in the report, reveal that support for the charge is high among the public, with 35% saying they are very supportive, 24% saying they are quite supportive and 19% saying they don’t mind. The results of this study give confidence that very large reductions in single use carrier bags use have occurred, and that this generates net environmental benefits.

4 |Carrier Bag Charge ‘One Year On’
Contents Executive Summary 2
1 Background 5
1.1 One year on study 5
1.2 Data available 5
2 What would have happened without the charge? 6
3 What change has there been in single use carrier bag usage since the charge? 7
4 What difference has the charge made? 9
4.1 Single use carrier bags 9
4.2 Replacement bags 9
4.3 What are the net material and carbon savings from the charge? 13
4.4 What are the other impacts of the charge? 13
4.5 Where does the money go? 13
5 How do the public see the charge? 14
5.1 Public expectations before the charge was introduced 14
5.2 Public reactions to the charge 15
6 Conclusion 16
Appendix A: Methodology 18
Appendix B: Additional data 20
Appendix C: Data limitations 21
Inspiring change for Scotland’s resource economy Find out more at zerowastescotland.org.uk
Prepared by Rory McElearney and Jamie Warmington of Ricardo Energy & Environment for Zero Waste Scotland
Acknowledgements: We would like to thank the grocery and non-grocery retailer signatories of the Carrier Bag Commitment for providing bag data online through the Carrier Bag Commitment portal and for providing additional data during structured interviews.

Carrier Bag Charge ‘One Year On’ | 5
1 Background
1.1 One year on study On 20th October 2014, the Scottish Government introduced the Single Use Carrier Bags Charge (Scotland) Regulations, requiring all retailers (food and non-food) to charge a minimum of 5p for each new single use carrier bag issued to customers both in-store and for distance selling methods. The aim of the legislation is to reduce single use carrier bags, encourage bag re-use and reduce the impact of litter.
The term ‘single use carrier bag’ is defined in the Regulations and refers to all carrier bags that are supplied with the intention that they are used once to carry goods away from the point of sale, regardless of whether they are made of plastic, paper or any other material. The Regulations also specify a number of exemptions where there is no requirement to charge for carrier bags.
This report examines the impact of the charge one year on since introduction in October 2014 by:
• Gathering evidence on the impact of the charge on the number of single use carrier bags issued to customers for the largest grocery retailers and some non-grocery retailers; and
• Accounting for the substitution and displacement effects of reusable bags and certain types of bin liners.
1.2 Data available As a full year has not yet elapsed, this report estimates the first year impact based on a best available evidence approach. Data were collected from a variety of sources as displayed in Figure 1 using a hierarchical approach with an emphasis on using Scottish data where it was available.
Figure 1. Data sources used in the report, with Scottish data at the top of the hierarchy, followed by other sources used, in order of preference.
Reported data (Scotland)• ZWS Carrier Bag Commitment portal data on bags issued to customers• Bag procurement data from semi-structured interviews• 3Rs Tracker (ZWS)
Estimated and synthesised data (Scotland)• Carrier bag and resuable bag percentage change estimates from semi-structured interviews
• UK grocery sector retail sales volume data (ONS)
Existing comparable studies (Wales/NI)• UK Voluntary Carrier Bag Agreement - 2013 Data (WRAP)• Effect of charging for carrier bags on bin-bag sales in Wales (WRAP)

6 |Carrier Bag Charge ‘One Year On’
Data for the estimates on the grocery sector were gathered using:
• Semi-structured interviews with 6 of the 7 larger grocery retailers (the seventh was unavailable) to provide qualitative1 estimates of carrier bag use (based on bags issued to stores pre- and post- charge) and an estinate of the charge raised for good causes. These seven matched the companies that had voluntarily provided data on bag use into UK reporting systems prior to the Scottish charge, as this provides the most robust baseline;
• Analysis of the market share of the grocery retailers to provide a weighted basis for estimating carrier bag reduction, including modelling the likely reduction for the missing retailer;
• Analysis of bag sales for substitute products, such as bin liners, over a comparable timeline; • Analysis of Welsh data for reusable bag sales (comparable to the Scottish data).
These data were used to calculate the reduction figures for carbon and material following the introduction of the carrier bag charge.
In adddition, qualitative estimates for some additional grocery retailers and selected non-grocery retailers was gathered, using the same semi-structured interviews as described above. The non-grocery respondents included two clothes retailers, a pharmacist and two home improvement retailers. This does not give comprehensive coverage of other sectors, but was used to judge whether reductions seen in the grocery sector were likely to be matched elsewhere.
A more in-depth discussion of the methods used, and some of the challenges in analysing the data, can be found as appendices.
2 What would have happened without the charge? This section of the report focuses on the grocery sector only, since data on carrier bags issued by selected grocery retailers has been gathered and analysed by WRAP (Waste & Resources Action Programme) from 2006, providing the most robust available data set.
The impact of the charge is best compared against a “business as usual” scenario. This section sets out what single use carrier bag use would have been in Scotland in 2014 had the charge not been in place. The business as usual approach suggests a slightly higher baseline for comparison than a straight match to 2013 data would do due to growth in the retail market between the two years.
The WRAP data has been split by UK nation in reporting since 2010. Table 1 is taken from WRAP’s 2014 report on carrier bags and shows the number of thin-gauge (single use) bags issued by the 7 largest grocery retailers in the UK: Asda, Co-operative Group, Marks & Spencer, Morrisons, Sainsbury’s, Tesco and Waitrose. These 7 retailers were signatories of WRAP’s Voluntary Carrier-bag Agreement2 and account for over 80% of the UK’s grocery sector3, so tracking trends in their carrier bag usage can give a good picture of the market and the country as a whole.
Table 1. Number of thin-gauge (single use) bags issued by grocery retailers (WRAP 2014)
The Single Use Carrier Bags Charge (Scotland) Regulations came into effect on 20th October 2014, part way through a calendar year. The most recent full year of data available for carrier bag usage in
1 These assessments were qualitative in that respondents estimated the stated reduction in interview – in some cases based on detailed internal data. Respondents typically only had the first 6 to 9 months of post-charge data available to them. 2 WRAP’s Voluntary Carrier-bag Agreement was a separate scheme to ZWS’s Carrier Bag Commitment 3 Market share of grocery stores in the United Kingdom for the 12 weeks ending July 19, 2015 Kantar World Panel
Number of thin-gauge carrier bags per calendar year - (bags by billions)
2010 2011 2012 2013
UK 7.57 7.98 8.08 8.34
Scotland 0.75 0.75 0.76 0.80

Carrier Bag Charge ‘One Year On’ | 7
Scotland prior to charging was therefore WRAP’s 2013 data, therefore this year was taken as a notional pre-charge baseline. However, behaviour was modelled into 2014 to provide a “business as usual” (or “counterfactual”) scenario as the primary basis for comparison.
In the absence of a charge, we assume single use carrier bag usage in this group of retailers would have grown in line with grocery retail sales. This study uses Relative Strength Index (RSI) figures published by the Office for National Statistics (ONS) for sales volume in grocery stores4. It is assumed that there is a direct link between the volume of goods sold and the carrying capacity of bags required to get them home from the shops or delivered to shoppers’ houses. This approach not only lets us project overall bag use in a year, but also model how bag use may change within a year – for example, with much higher use associated with peak shopping periods for the grocery sector like Christmas.
Applying monthly RSI retail sales volume figures to WRAP’s carrier bag data provided a baseline “business as usual” scenario projection for single use carrier bag usage in the 7 largest grocery retailers in 2014 and 2015 if the charge had not been introduced.
This business as usual scenario is the comparison for discussion of change throughout the rest of this document. It implies around 819 million single use carrier bags would have been used in Scotland in the 12 months following 20th October if the charge had not been introduced. These would have accounted for around 7,213 tonnes of material use and 35,505 tonnes of CO2eq.
3 What change has there been in single use carrier bag usage since the charge? This section of the report focuses on the reduction of single use carrier bags estimated by grocery retailers who participated in the interviews and includes our modelled projection for the 7 major grocery retailers. It also includes a qualitative analysis of the bag reduction for the non-grocery sector, based on the estimates provided during interviews.
On the basis of the evidence gathered through interviews, using the 6 or 9 months of data they had available, it is estimated that the 7 major grocery retailers are on course to achieve a reduction in single use carrier bag usage in the region of 80%. Responses ranged from 50%, reported by a retailer who already charged for single use carrier bags before the charge was introduced to a 100% reduction reported by a retailer which no-longer provides single use carrier bags. The full results can been seen in Appendix A: Methodology.
Highly detailed data was shared by at least one grocery retailer and is shown in Figure 2. This graph shows stores ordering bags through the supermarket’s internal supply chain, not bags given out in stores per se, but it is reasonable to assume that the volume of bags ordered by stores would match the volume of bags required by the stores customers within a relatively short timeframe. Although the scale has been removed to protect retailer anonymity, there is a clear pattern of bag reduction following the introduction of the carrier bag charge. We would expect similar graphs for the other six major grocery retailers.
Figure 3 shows the 80% reduction assumption for single use carrier bags applied to the baseline scenario defined in Section 2 for the 7 major grocery retailers. We also carried out interviews with some major grocery retailers who are not included in the baseline data (as they were not party to previous pre-charge reporting). These retailers confirmed the findings, and suggest there is little difference across the rest of the grocery sector.
4 The Non-seasonally Adjusted (NSA) dataset was used to reflect the fact that carrier bag usage is tied to shopper activity rather than the Seasonally Adjusted (SA) dataset which seeks to account for sector performance adjusted for seasonal variation.

8 |Carrier Bag Charge ‘One Year On’
Figure 2. Weekly number of cases of single use carrier bags ordered by stores. No value for volumes is displayed to protect respondent anonymity.
Figure 3. Baseline and 80% reduction scenario for the 7 major grocery retailers
0
10
20
30
40
50
60
70
80
90
Milli
ons
of b
ags
per m
onth
Baseline 80% Reduction

Carrier Bag Charge ‘One Year On’ | 9
For the non-grocery sector, estimates of bag reduction at the 5 retailers interviewed ranged from 0% reduction seen at a high-value item retailer to 90% seen at a store which operates more like a grocery retailer i.e. high-volume, low-value items. Several reasons for this difference can be advanced – the charge will be a very small expense relative to the cost of prestige items and the branding on the bag may be something customers wish to display. However, in volume terms, retailers of this type will be relatively niche, and for larger or less specialist retailers the estimated reductions were not dissimilar to those seen in the grocery sector, though the retailers interviewed make up a much smaller proportion of the market and these results should be treated as indicative only. It is possible that reductions outside of the grocery sector may not be as high as those within.
Typically data on pre-charge bag use is poorer in the non-grocery sector, as there may have been no internal requirement to monitor or record use prior to the charge.
4 What difference has the charge made? This section of the report focuses on the grocery sector only, as this is the basis for the “business as usual” baseline and is the sector with the best data. The analysis covers only the seven grocery retailers that have published aggregate pre-charge data to ensure a like-for-like comparison.
4.1 Single use carrier bags In the one year from 20th October 2014 to 20th October 2015 it is estimated that the 7 major grocery retailers in Scotland would have used over 800 million single use carrier bags if the charge had not been in place. As a result of the charge, it is estimated that roughly 650 million fewer single use carrier bag have been used at the 7 major grocery retailers.
However, previous experience of bag charging schemes suggests that consumers may replace single use carrier bags with other bags in some situations. Most notably this includes bags for life in store, or substitute bags used in domestic situations, such as small bin liners.
The impact on these substitute bags is analysed in the following sections in order to calculate the overall carbon and material impact arising from the introduction of the carrier bag charge.
Based on previous charging experience these have been identified as the most likely factors to offset the initial benefits of a reduction in the use of single use bags.
4.2 Replacement bags Bags for life are a likely alternative to single use carrier bags used for shopping, so the number of these bags purchased would be expected to increase. For the charge to have an overall positive impact in carbon and material terms, use of bags for life (accounting for their different weights and material composition) needs to be compared with that of the single use carrier bags they replace. It was possible to only consider bags for life at the seven “baseline” grocery retailers in analysis.
Smaller sized bin liners, typically pedal- or swing-bin bags, may be a substitute for single use carrier bags in the home as liners or for storage purposes. As with bags for life, changes in bin liner sales may need to be offset against the benefits from changes in single use carrier bag use to understand the net effect of the charge.
For this reason data was gathered on bags for life and pedal- and swing-bin bags in order to ascertain the impacts of the charge on their use and compare against changes in in single use carrier bags. These two routes may not be the only areas where there are knock-on effects from charging (positive or negative) but are likely to be the most directly significant.
This question of substitution does not make a difference to some potential benefits of carrier bag charging (such as any litter reduction, which is the primary purpose of the charge).

10 |Carrier Bag Charge ‘One Year On’
4.2.1 Bags for life
Customers have the option of purchasing ‘bags for life’ for more than 5p, with the intention that they will reuse these bags and not have to use single use carrier bags when they next shop. There is also often the promise of a replacement at end of life too. Bags for life can be broadly divided into three categories: 6p (lighter plastic), 36p (heavier plastic) and cloth bags often made of cotton or hemp. Research carried out by Exodus Research for Welsh Government and Zero Waste Scotland5 suggests that the majority of bags for life purchased are the 6p variety (85%), with 36p (6%) and cloth bags (9%) making up a smaller market share., Bags for life made up approximately 3.3% of the new bag share before the charge.
In Wales, bags for life sales in the first full year of charging (2012) increased 46%6 on the previous year. During the interviews, the large grocery retailers were asked for their estimation of the increase in bags for life usage, and all responded that there had been an increase. However, as this is not something that had been monitored, their level of certainty was very low. For the purposes of this study, it has been assumed that bags for life sales have increased by 50%, from 27 million to just over 40 million bags per year following the introduction of the charge. By using the above assumptions on the mix of new 6p, 36p and cloth bags and using Life Cycle Analysis carbon impact data for these different classes of bag published by the Environmental Agency7 it is possible to calculate the estimated material use and carbon impacts associated with the substitution of single use carrier bags for bags-for-life. These are presented at the end of the section.
4.2.2 Smaller bin liners
In addition to their primary purpose, previous research5 suggests single use carrier bags can also be used as bin liners and for storage. In response to single use carrier bags now incurring a charge, it was anticipated that there would be an uplift in the sales of bags which fulfil these secondary purposes. This was the case in Wales.
To address this question for Scotland, data was obtained by Nielsen on behalf of Zero Waste Scotland on the sale of pedal- and swing-bin bags in Scotland. Figure 4 is a plot of this data, which can be found in Appendix B: Additional data. Increased sales of pedal- and swing-bin bags increased following the introduction of the charge can be clearly seen.
5 Consumer behavioural study on the use and re-use of carrier bags 2012, Exodus Research, Zero Waste Scotland, Welsh Government (2013) 6 Effect of charging for carrier bags on bin-bag sales in Wales, WRAP (2013) 7 Life cycle assessment of supermarket carrier bags: a review of the bags available in 2006 (Environment Agency)

Carrier Bag Charge ‘One Year On’ | 11
Figure 4. Number of pedal- and swing-bin bags sold per 4-week period in Scotland (continuous) Source: Nielsen Scantrack 2015
Due to an overall growth in retail sales, it would be anticipated that pedal- and swing-bin bags sales would also increase over this period. Figure 5 shows the 2013/14 and 2014/15 years overlaid with the year divided into 13 4-week periods.
15,000,000
17,000,000
19,000,000
21,000,000
23,000,000
25,000,000
27,000,000
29,000,000
Num
ber o
f bag
s/ 4
wee
k pe
riod
Pre-charge Post-charge

12 |Carrier Bag Charge ‘One Year On’
Figure 5. Number of pedal- and swing-bin bags sold per 4-week period in Scotland (year-on-year comparison) Source: Nielsen Scantrack 2015, adjusted to account for retail sales growth
Even with the 2014/15 smaller bin liner sales data adjusted downwards to account for an increase in retail sales growth, post-charge pedal- and swing-bin bag sales are higher. Extrapolating performance based on data from previous years for periods where data was not yet available, annual pedal- and swing-bin bag sales were anticipated to increase 51% from just under 80 million to 120 million.
Assuming that bin liner sales make up a uniform percentage of all sales across every sector, the grocery market accounts for 51.3p in every £1 of UK retail sales8, and the 7 large grocery retailers make up 85% of grocery market share3, sales of bin liners at the 7 large grocery retailers can be assumed to make up 43% of all bin liner sales in the UK.
Thus, assuming the percentage increase in pedal- and swing-bin bag sales impacts all sectors uniformly, the number of pedal- and swing-bin bags sold at the 7 major grocery retailers was estimated to be roughly 34.7 million pre-charge, rising to 52.3 million post-charge.
8 IGD UK Grocery: Market and channel forecasts 2015-2020
15,000,000
17,000,000
19,000,000
21,000,000
23,000,000
25,000,000
27,000,000
29,000,000
P1 P2 P3 P4 P5 P6 P7 P8 P9 P10 P11 P12 P13
Num
ber o
f bag
s/ 4
wee
k pe
riod
Pre-charge Post-charge
2014/15
2013/14
October 2014

Carrier Bag Charge ‘One Year On’ | 13
4.3 What are the net material and carbon savings from the charge? Taking into account the above analysis we estimate the following overall changes as a result of the charge:
Table 2. Net material and carbon impacts of the charge based on an 80% reduction scenario
Number of Bags Material Impact
(tonnes)
Carbon Impact
(tCO2eq)
Single use carrier bags
Baseline 818,513,667 6,132 15,725
Change in year 1 -655,724,940 -4,912 -12,597
Bags for life Baseline 27,058,303 798 17,954
Change in year 1 13,529,152 399 8,977
Smaller bin liners
Baseline 34,721,883 284 1,826
Change in year 1 17,649,466 165 928
Net change in first year of charge, assuming an 80% reduction n/a9 -4,349 -2,692
4.4 What are the other impacts of the charge? The impact of the charge on littering cannot be proven with available data, though it seems highly likely that a large reduction in the amount of bags in circulation will contribute to a significant reduction in the number that are subsequently littered. This view is supported by reported experience in other nations which have introduced charging, and matches anecdotal feedback from litter managers and practitioners. 36% of the Scottish public identified this as a benefit of the charge (see section 5).
However the litter impact might credibly be proportionately smaller than the overall reduction in single use carrier bag use if certain activities (such as selling take away or fast food) are more likely to see bags subsequently littered, and less likely to see a reduction in single use carrier bag use, or if plastic bags appearing in the litter stream are disproportionately likely to come from items outwith the scope of the charge (e.g. smaller sandwich bags). Detailed data on bag use by sector, and the origin and amount of littered items, is not available to support a detailed analysis of this question.
There is the possibility that charging may encourage the public to consider other waste prevention behaviours, but this has not been an explicit focus of research in Scotland. The public reaction is discussed in section 5.
4.5 Where does the money go? The Scottish Government encourages retailers to pass proceeds of the charge to good causes; where customers have chosen to use single use carrier bags the charge is estimated to have resulted in £6.7 million raised for good causes. This figure is for the seven largest grocery retailers alone based on the
9 The overall number of bags in circulation would not be meaningful as it does not account for the varying environmental impacts of the different bag types.

14 |Carrier Bag Charge ‘One Year On’
80% reduction scenario and does not include additional charges raised by other grocery stores and non-grocery retailers.
The charge primarily aims to reduce bag use, however there appears to be no conflict between this aim and raising money for good causes in almost all cases. The only exception to this encountered during the study was in one organisation which reported an increase in intra-store rivalry to raise the most money for good causes since the 5p charge was introduced. This would clearly run against the primary aims of the charge and the practice has subsequently stopped.
5 How do the public see the charge?
5.1 Public expectations before the charge was introduced Zero Waste Scotland track public attitudes and behaviours around recycling, reuse and repair via an annual national survey. Questions were included on the carrier bag charge in the spring 2014 and 2015 surveys with the intention of monitoring the public’s awareness of the charge, their level of support and their perception of the benefits, both before and after the charge was introduced. Figure 6 to Figure 8 are taken from the 2014 results and are a snapshot of the public’s perception of the charge before it was implemented (based on a sample size of 1,107 respondents).
No question was directly asked about actual carrier bag use because previous research experience strongly suggests that people may overstate positive behaviours around carrier bag use in questionnaires. Evidence for this, as well as stated behaviour in Scotland in 2012/13, can be seen in an earlier Zero Waste Scotland study conducted with the Welsh Government which also compares the two nations (Wales post-charge, and Scotland pre-charge)5.
Figure 6. Are you aware of plans to introduce a 5p charge on single use carrier bags in Scotland in autumn this year?
Figure 7. How supportive are you of this change (charging for bags)?
YES - 73% NO - 23% DK5%
31% 26% 21% 11% 10% 1%
Very supportive Quite supportive I don't mind
Quite unsupportive Very unsupportive DK

Carrier Bag Charge ‘One Year On’ | 15
Figure 8. What do you think the benefits of the charge will be?
5.2 Public reactions to the charge Slightly different questions were asked in February 2015 to determine views on the charge after its introduction (comparable sample size). Figure 10 and Figure 11 mirror the questions asked in Figure 7 and Figure 8 on support for the charge and its perceived benefits. Figure 9 is a new question which drives at the key metric of whether bag re-use is taking place, and thus fewer new single use carrier bags being used.
Figure 9. Do you feel the 5p charge on single use carrier bags has encouraged you to re-use your bags?
Figure 10. How supportive are you of this change (charging for bags)?
2%
15%
26%
36%
40%
48%
67%
Something else
I don’t think there will be any benefits
Money raised will support charities
There will be less litter
It will help people to throw away less plastic
It will be better for the environment
It will encourage people to use fewer plastic bags
YES - 50% NO -11%
DK3%
Already re-used before the charge -
36%
35% 24% 19% 9% 11% 1%
Very supportive Quite supportive I don't mind
Quite unsupportive Very unsupportive DK

16 |Carrier Bag Charge ‘One Year On’
Figure 11. What do you think the benefits of the charge have been?
All data on public perception therefore shows widespread support for the charge. 50% of respondents felt that the 5p charge on single use carrier bags has encouraged them to re-use bags, with 36% already re-using them before the charge.
Comparing the February 2014 (Figure 7) and February 2015 (Figure 10) results for the question on support for the charge, there does not appear to be a large difference in support between the two years, however there is evidence to suggest that popularity of carrier bag charges among consumers tends to increase once they have been implemented and their expected benefits (e.g. reduced litter) are observed in practice. Studies carried out by Welsh Government on the effectiveness and response to the charge revealed consumer support for the charge at 74% in 2014, up from 61% reported prior to 2011 (the introduction of the charge)10.
It has been suggested that charging for single use carrier bags may encourage people to reconsider their attitudes to waste prevention and material efficiency more widely. Ascertaining this is outwith the scope of the current project, and identifying longer term shifts of this nature, let alone linking them to single causes in a complex environment, will always be challenging.
No major concerns about the charge were raised during the interviews. One retailer even remarked that they were surprised by the high level of buy-in from staff and customers, with the selection of local good causes being mentioned as a particular driving factor. The main retailer concerns encountered in the current research project related to differing carrier bag reporting regimes in the different UK nations and the potential for them to become burdensome, and secondly that focus on this issue might detract from other environmental concerns.
6 Conclusion A full year of post-charge data is not available at the time of writing, and some sectors (and retailers) do not have comparable pre- and post-charge data on single use carrier bags. The current study did however gain a qualitative assessment on progress from a large majority of major grocery retailers and a selection of non-grocery stores. We therefore present expected impacts for the first year of the charge with a reasonable level of confidence, though highlight that these figures may be subject to review once fuller data is available in 2016.
For the major grocery retailers we estimate that the reduction in single use carrier bags will be in the region of 80%. We would urge some caution around this estimate as it relies on qualitative assessments by retailers, and we suspect these will tend to be optimistic rather than pessimistic in those cases where hard data was not available to interviewees. Nonetheless this implies a reduction of around 650 million bags. We expect retailers in other sectors to see broadly comparable
10 Post Implementation Review of the Single Use Carrier Bag Charge in Wales: Emerging Findings Report, Welsh Government (2015)
2%
14%
36%
36%
39%
56%
59%
Something else (write in)
I don’t think there are any benefits
There is less litter
The money charged for single use carrier bagssupports charities
It helps people to throw away less plastic
It’s better for the environment
It encourages people to use fewer plastic bags

Carrier Bag Charge ‘One Year On’ | 17
percentage reductions overall, though with perhaps a higher level of variation from store to store. Any benefits from this would be additional to those quoted here.
Whilst these numbers can only be indicative without a fuller set of data, these estimates broadly match charging experience elsewhere. Northern Ireland and Wales saw reductions of 71.3%11 and 81%6 respectively - though the sector coverage of our estimate, and those for other nations is not an exact match. The Scottish charging regime is closest to that in Wales. Previous statements from Scottish retailers, and preliminary data from October to December 2014 collected by WRAP, also support an expected reduction in the region of 80%. The WRAP data implied a change for the first quarter that was somewhat lower in percentage terms, but we believe this was due to a number of confounding factors, including the inclusion of several pre-charge weeks in the quarterly data, possible approximations in obtaining quarterly data, and potential transition effects in the first weeks of the charge (when consumers are still learning the new system).
The estimated reduction of 650 million bags for the major grocery retailers can be set against small increases in the use of alternative products such as bags for life and small bin liners. Our analysis suggests that the charge still has net environmental benefits when these elements are considered, with overall savings (based only on single use carrier bags distributed by the seven major grocery retailers and likely substitution) in the region of 4,350 fewer tonnes of material consumed and 2,690 fewer tonnes of CO2eq emissions generated as a result. Savings for other grocery retailers, and other sectors, would be additional to this. We see no reason to assume that patterns of behaviour in those sectors would be significantly different based on the evidence available to us. This analysis, confirming net environmental benefits, matches the conclusions of previous analysis conducted in Wales which also focused on the seven major grocery retailers6. Whilst the charge primarily aims to reduce bag consumption, where consumers choose to use a single use carrier bag, the proceeds go to a good cause selected by the individual retailers. For the seven major grocery retailers alone, this is expected to generate around £6.7 million for good causes in the first year of the charge. No major concerns were raised about the charge itself during the course of the interviews. One retailer even remarked that they were surprised by the high level of buy-in from staff and customers, with the selection of local good causes being mentioned as a particular driving factor. The public have been largely supportive of charging, and the charge may actually be marginally more popular since being introduced than it was in advance of its introduction.
11 Carrier bag levy annual statistics, Department of Environment Northern Ireland (2014)
18 |Carrier Bag Charge ‘One Year On’
Appendix A: Methodology 7 grocery retailers and 5 non-grocery retailers were approached to provide evidence for the report. They were asked initially if they were able to provide data on the number of bags issued to customers before and after October 2014 for both single use carrier bags and bags for life. Retailers were unable to provide detailed estimates on the number of bags for life sold for in most cases but were able to provide percentage reduction estimates for single use carrier bags by comparing the number of single use carrier bags procured by stores both before and after the charge.
As discussed in Appendix C: Data Limitations, this reduction estimate was not based on a full year’s data. There may also be some approximations in retailer estimations of change, as pre-charge data is not always held in a calendarised form allowing robust comparison for periods of less than a year. Post-charge data is more comprehensive as retailers must record bag charges as a legal requirement. However they are not obliged to report this for research purposes, and even those taking part in Scotland’s voluntary reporting commitment are not asked need only report annually. We would therefore like to thank all those retailers who cooperated with our research.
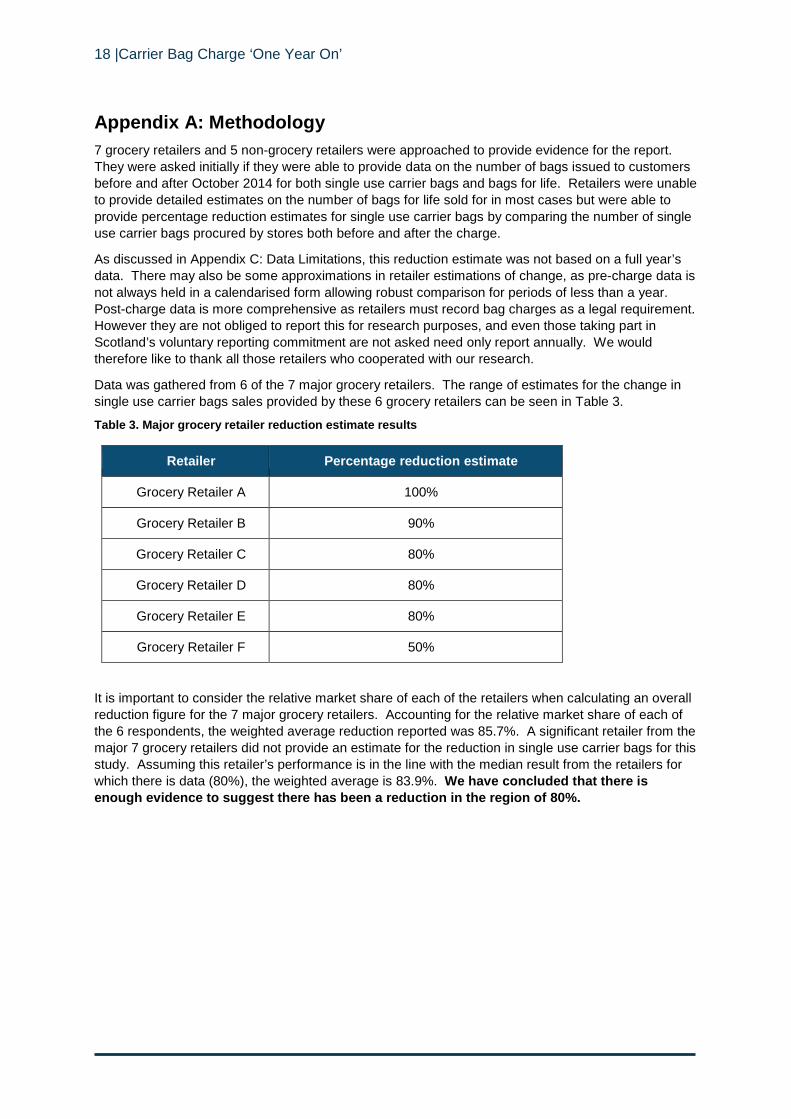
Data was gathered from 6 of the 7 major grocery retailers. The range of estimates for the change in single use carrier bags sales provided by these 6 grocery retailers can be seen in Table 3.
Table 3. Major grocery retailer reduction estimate results
Retailer Percentage reduction estimate
Grocery Retailer A 100%
Grocery Retailer B 90%
Grocery Retailer C 80%
Grocery Retailer D 80%
Grocery Retailer E 80%
Grocery Retailer F 50%
It is important to consider the relative market share of each of the retailers when calculating an overall reduction figure for the 7 major grocery retailers. Accounting for the relative market share of each of the 6 respondents, the weighted average reduction reported was 85.7%. A significant retailer from the major 7 grocery retailers did not provide an estimate for the reduction in single use carrier bags for this study. Assuming this retailer’s performance is in the line with the median result from the retailers for which there is data (80%), the weighted average is 83.9%. We have concluded that there is enough evidence to suggest there has been a reduction in the region of 80%.

Carrier Bag Charge ‘One Year On’ | 19
Table 4. Other retailer reduction estimate results
Retailer Percentage reduction estimate
Grocery Retailer G 55%
Non-grocery Retailer A 90%
Non-grocery Retailer B 80%
Non-grocery Retailer C 50%
Non-grocery Retailer D 40%
Non-grocery Retailer E 0%
Data was also collected from 1 additional grocery retailer and 5 non-grocery retailers. The results can be seen in Table 4. We have decided that there is not enough data available to draw any firm conclusions on retailers outside the grocery sector.

20 |Carrier Bag Charge ‘One Year On’
Appendix B: Additional data Table 5. Other non-recyclable bag sales Source: Nielsen Scantrack 2015
4 WE 28.09.13
4 WE 26.10.13
4 WE 23.11.13
4 WE 21.12.13
4 WE 18.01.14
4 WE 15.02.14
4 WE 15.03.14
4 WE 12.04.14
4 WE 10.05.14
4 WE 07.06.14
4 WE 05.07.14
4 WE 02.08.14
4 WE 30.08.14
TOTAL BIN
LINERS 6,625,440 6,150,697 6,153,473 6,036,423 6,032,605 5,797,646 5,801,947 5,796,059 5,905,972 5,865,166 5,966,552 6,071,607 6,400,802
PEDAL BIN
3,130,938 2,938,674 2,894,904 2,796,600 2,772,024 2,731,883 2,688,296 2,748,495 2,792,032 2,832,418 2,911,692 3,063,017 3,102,310
SWING BIN
3,494,502 3,212,023 3,258,569 3,239,823 3,260,581 3,065,763 3,113,651 3,047,564 3,113,940 3,032,748 3,054,860 3,008,590 3,298,493
4 WE
27.09.14 4 WE
25.10.14 4 WE
22.11.14 4 WE
20.12.14 4 WE
17.01.15 4 WE
14.02.15 4 WE
14.03.15 4 WE
11.04.15 4 WE
09.05.15 4 WE
06.06.15 4 WE
04.07.15 4 WE
01.08.15 4 WE
29.08.15 TOTAL
BIN LINERS
6,521,176 7,481,005 9,597,953 8,578,802 9,676,499 9,615,779 9,052,390 9,068,883 9,130,125 8,814,326 8,798,204 9,073,085 9,307,585
PEDAL BIN
3,296,532 3,903,369 5,726,828 4,246,491 5,179,154 5,567,209 5,273,391 5,002,199 5,145,265 4,856,562 4,903,154 5,158,442 5,335,090
SWING BIN
3,224,644 3,577,637 3,871,125 4,332,311 4,497,345 4,048,570 3,778,999 4,066,684 3,984,860 3,957,764 3,895,050 3,914,643 3,972,495

Carrier Bag Charge ‘One Year On’ | 21
Appendix C: Data limitations This report represents a high-level estimate of the first year impacts of the Single Use Carrier Bags Charge (Scotland) Regulations. The data available at the time of writing, and several other factors, presented limitations on the confidence that can be placed in the result.
When data was being gathered, a full year had not passed since the implementation of the charge
The charge came into effect on October 20th 2014. Data gathering for the report was carried out in August and September 2015 with data no more recent than July 2015 being available to the retailers during the interviews. Thus the full year result is modelled from between 6 and 9 months of data (depending on retailer). Seasonality is a significant factor in food and other retail markets (specifically pre-Christmas shopping) and while some retailers could provide comparison to seasonality in 2013, there will be some uncertainty due to assumptions made about how typical the first six months might be. In addition, the first six months of charging may not be typical in any case (as discussed below).
This restriction applied to single use carrier bag, bags for life, and other reusable bags.
Data for the first few months of charging may not be typical
It is very possible there was a “transition period” as customers became used to charging – this might be manifested either by higher than expected payment of the charge (as taking an alternative bag is not yet habitual) or higher than typical use of bags for life (as people stock up). Any transition effects may be exacerbated as this period coincides to some extent with pre-Christmas shopping – an exceptional period in the retail trade and in shopper behaviour. This adds to the uncertainty of modelling the first year of data from the first six months of data.
Retailers are only required to measure and not report single use carrier bags
The methods by which retailers report and calendarise their single use carrier bag data vary – all are compliant with the legislation post-charge, but pre-charge variation may be greater. Retailers are not obliged to record non-single use carrier bag use consistently, though this data is important to the overall analysis in this report. Prior to the charge most retailers only recorded bags ordered in by Store Managers, rather than the exact number and time these were distributed to customers.
Due to the potential commercial sensitivity and time costs of processing this historical data only one retailer was able to provide a continuous data set (Figure 2) with the others providing estimates.
The charge came into effect part way through a year and part way through a month
Carrier bag data submitted to the Carrier Bag Commitment portal and ONS retails sales volume are recorded monthly. As the charge came into effect on October 20th, in order to calculate single use carrier bag results for the month of October 2014, assumptions were made on carrier bag usage intensity based on the number of days remaining in the month. This issue also applied to organisations recording data quarterly as October falls within the final quarter of the calendar year. It seems unlikely change at the moment of introduction was wholly uniform, but this assumption has been used in modelling.
Data was gathered primarily from large grocery retailers
It was only possible to come to a conclusion on the impact of the charge for the 7 major grocery retailers. As these grocery retailers make up the majority of single use carrier bag usage in in the sector3, and it is this sector in particular which is impacted by the Regulations, measuring the impact on this sector is seen as a valid measure of the effectiveness of the charge. However, the reductions in the single use carrier bag in the grocery sector may not be seen uniformly across all sectors.
The results of the interviews carried out with non-grocery retailers as part of this study revealed wider variation between respondents than reported for the grocery sector. In addition, surveys of consumers

22 |Carrier Bag Charge ‘One Year On’
in Wales5 revealed that when asked about the last time they went for a big food shop at a supermarket, 17% used a plastic single use carrier bag compared with 50% who used a thick plastic bag for life and 49% a canvas, jute or cloth bag. Bag re-use is less prevalent for smaller food and non-food shops with 38% using bags that they had brought with them on their most recent non-food shop. The proportion of single use carrier bags used by customers in favour of reusable alternatives is even higher at quick service restaurants with 65% using plastic and 13% paper single use carrier bags. These differences in behaviour are expected to be similar in Scotland and it is important to bear this in mind when inferring the performance for the country as a whole based on evidence gathered primarily from one sector.

Carrier Bag Charge ‘One Year On’ | 23