uk voluntary carrier bag monitoring - 2013 data bag results 2013...voluntary carrier-bag agreement...
TRANSCRIPT

UK Voluntary Carrier Bag Monitoring - 2013 Data
WRAP
July 2014

Contents
Background
Scope of monitoring
Headline results for 2013 carrier-bag use
Nation data

Background – voluntary carrier-bag agreement
Agreement between the Scottish Government, Defra, the Welsh Assembly Government, and the Northern Ireland Department of the Environment with the British Retail Consortium (BRC) and its supermarket members.
Target to reduce thin-gauge carrier bags by 50% by Spring 2009 on a 2006 baseline. This target was narrowly missed with a 48% reduction measured for the UK.
An agreement was made to continue monitoring carrier-bag use during 2010, 2011, 2012 and 2013 – although no formal target was agreed to measure against.
The 7 retailers currently participating are: Asda, Co-operative Group, Marks & Spencer, Morrison’s, Sainsbury’s, Tesco and Waitrose.

Voluntary carrier-bag agreement – Monitoring
WRAP’s role is to monitor the sector’s carrier-bag use through data collection and analysis.
Individual retailers were contacted directly to obtain their data.
Individual retailer data was supplied voluntarily to WRAP on the basis that it is held confidentially and not disclosed to third parties.
Monitoring results are presented for the sector, not for individual retailers.

Basis of Reporting
Results are presented for 12 month periods: 2006, 2007, 2008, 2009/10a, 2010, 2011, 2012 and 2013
Metric presented:
number of bags (total and per capita);
weight of bags (tonnes); and
virgin polymer use (tonnes)
Bags are split into thin-gauge bagsb and reusable bags (split into polyethylene bags for life and other reusable bags)
Data for the four nations of the UK are presented using information reported by the majority of the retailers
Data on grocery retail volume sales (packs sold) has been purchased to provide context of changing bag use
(a) Reporting period: June 2009 – May 2010; the reporting period June 2008 – May 2009 has been omitted due to lack of data for all retailers.
(b) Thin-gauge bags are defined as all paper bags and polyethylene bags of a gauge (thickness) of less than 25 microns.

Results: Carrier-bag use in the UK, 2006-2013

Total number of bags used in the UK
In 2013, 8.76 billion bags were used by the participating supermarket retailers
This compares to 12.42 billion bags in 2006 and 8.49 billion bags in 2012
These figures represent an increase of 3.2% between 2012 and 2013, and an increase of 16% since the end of the voluntary agreement
– but a reduction of 29% on the 2006 baseline
‘Total carrier bags’ includes:
8.34 billion thin-gauge (also referred to as ‘single-use’) bags, and
0.42 bags for Life (‘reusable’ bags) such as cotton, jute and polypropylene bags and thicker gauge polyethylene bags
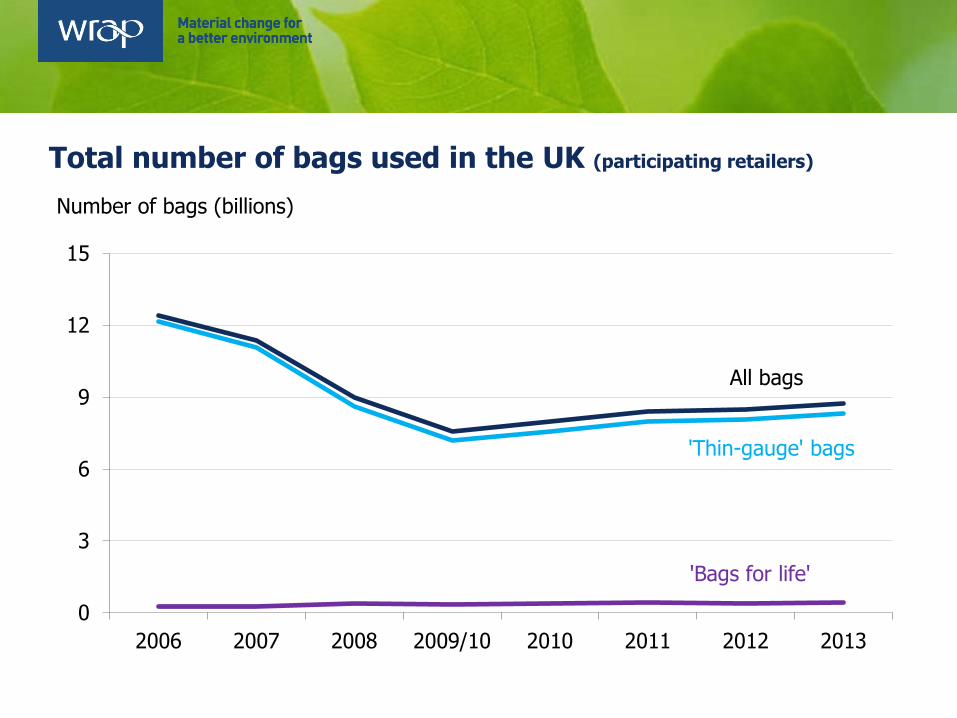
Total number of bags used in the UK (participating retailers)
0
3
6
9
12
15
2006 2007 2008 2009/10 2010 2011 2012 2013
Number of bags (billions)
All bags
'Thin-gauge' bags
'Bags for life'

PE = polyethylene
Number of ‘bags for life’ used in the UK – by material (participating retailers)
0.00
0.10
0.20
0.30
0.40
2006 2007 2008 2009/10 2010 2011 2012 2013
Number of bags (billions)
PE 'bags for life'
Non PE 'bags for life'

Weight of bags used in the UK
In 2013, total carrier bags used by the participating supermarket retailers weighed 67,300 tonnes.
This compares to 109,800 tonnes in 2006 and 70,400 tonnes in 2012.
These figures represent a decrease of 4.4% between 2012 and 2013, and a reduction of 39% since the baseline year of 2006
– but an increase of 3% since the end of the voluntary agreement
‘Total carrier bags’ includes:
Thin-gauge (sometimes referred to as ‘single-use’ bags), and
Bags for Life (‘reusable’ bags) such as cotton, jute and polypropylene bags and thicker gauge polyethylene bags

Total weight of bags used in the UK (participating retailers)
0
20
40
60
80
100
120
2006 2007 2008 2009/10 2010 2011 2012 2013
Weight of bags used (thousand tonnes)
All bags
'Thin-gauge' bags
'Bags for life'

PE = polyethylene
Total weight of ‘bags for life’ used in the UK – by material
(participating retailers)
0
2
4
6
8
10
2006 2007 2008 2009/10 2010 2011 2012 2013
Weight of bags used (thousand tonnes)
PE 'bags for life'
Non PE 'bags for life'

There has been a 48% reduction in the amount of virgin polymer used in all carrier bags between the baseline and 2013
Between 2012 and 2013 there was a 4.8% increase in virgin polymer used in all carrier bags.
Weight of virgin polymer used (participating retailers)
0
20
40
60
80
100
120
2006 2007 2008 2009/10 2010 2011 2012 2013
Weight of virgin polymer used (thousand tonnes)
All bags
'Thin-gauge' bags
'Bags for life'

Results: Carrier-bag use in the nations of the UK, 2010-2013

Number of thin-gauge carrier bags by nation
Most retailers are now providing information on thin gauge bag use for the nations of the UK so comparisons are possible between 2010 and 2013
However, comparisons prior to 2010 are difficult because the data are not consistent; as such, they are not presented
These estimates are based on reported data for 6 out of the 7 retailers – the split of the 7th retailer is modelled using sales data. This modelling has a negligible impact on the results.

i Rounding may cause apparent discrepancies between the figures for the nations and the total UK row. ii The number of bags used in each nation has changed from those previously reported. In 2013 some ‘bags for life’ were accidentally included in the thin-gauge bags total. Correcting this error has affected the split between the nation to a small degree but not the UK total.
Number of thin-gauge carrier bags by nation (participating
retailers)
The data illustrate a marked reduction in thin-gauge bag use in Wales in 2012 and in Northern Ireland in 2013 which may be attributed to the introduction of a charge for carrier bags (Oct’11 in Wales, Apr’13 in NI). In England and Scotland usage continues to rise.
Bags (billions) i % change
2010 2011 2012 2013 2012 – ‘13 2010 – ‘13
England 6.29 6.76 7.06 7.40 +5% +18%
Scotland 0.75 0.75 0.76 ii 0.80 +6% +7%
Wales 0.35 0.27 0.06 ii 0.07 +18% –79%
Northern Ireland 0.17 0.19 0.19 0.06 -71% -67%
UK 7.57 7.98 8.08 8.34 +3.2% +10.1%

Change in thin-gauge carrier bag use by nation (participating retailers)
% change 2010 to 2013
-100%
-80%
-60%
-40%
-20%
0%
20%
40%
England Scotland Wales Northern Ireland UK

Bags per person per month
2006 2007 2008 2009/10 2010 2011 2012 2013
UK 16.7 15.0 11.6 9.6 10.0 10.5 10.6 10.8
England
n/a
10.0 10.6 11.0 11.5
Scotland 11.9 11.8 11.9 12.6
Wales 9.6 7.4 1.7 2.0
Northern Ireland 8.0 8.6 8.8 2.6
Thin-gauge bags usage per capita per month (participating retailers)
Population data source: ONS, ONS 2012-based national population projections

0.0
2.0
4.0
6.0
8.0
10.0
12.0
14.0
UK England Scotland Wales Northern Ireland
Thin-gauge bags used per person per month 2010-2013
Thin-Gauge Bags Used Per Person per Month, 2010-2013 (participating retailers)

Bags for life in Wales
Five of the seven retailers provided ‘bags for life’ data for Wales in all 4 years 2010 to 2013, allowing trends in usage to be assessed
For these 5 retailers, as stated last year
there was a substantial increase in the number and weight of BfL purchased in Wales between 2010 and 2012. The increase is around 120-130% (i.e. more than doubling).
The number and weight increased further in 2013 but by a lesser amount:
number: +15% compared to 2012
weight: +6% compared to 2012
• The net effect of the changes in both bag types, in terms of weight, is shown in the next slide

Trend in weight of bags used in Wales (data from 5 retailers)
0
1
1
2
2
3
2010 2011 2012 2013
000 tonnes
Non-PE B4L
PE bags for life
Thin-gauge PE

Bags for life in Northern Ireland
Three retailers provided data allowing trends in ‘bags for life’ usage to be assessed in Northern Ireland
Based on data from just 3 retailers, what had been a declining trend in BfL sales changed to a more than 7-fold increase between 2012 and 2013 although the weight increase is lower (5-fold)
In terms of weight, the increase in ‘bags for life’ purchased in NI was approximately 30% of the reduction in weight of thin-gauge bags between 2010 and 2013 (i.e. a substantial minority of the reduction in material use associated with fewer thin-gauge bags was negated by more bags for life)
This mirrors the effect seen last year in Wales

Change in Sales Volume
2010-2013 2012-2013
England -1.1% -0.3%
Scotland -2.9% -2.2%
Wales (and West) -3.2% -2.0%
Northern Ireland n/a -0.3%
UK -1.6% -0.6%
Between 2010 and 2013 grocery volume sales for the participating retailers decreased by approximately 1.6%. Between 2012 and 2013 volume sales decreased by 0.6%.
The changes seen are different between the 4 nations: Data source: Kantar Worldpanel data – sales volume measured in number of packs / items.
A major revision of Kantar data means that the current dataset only goes back to 2009 (GB) and 2011 (NI)
Context Data – Sales Growth

Front-of-store recycling of carrier bags (participating retailers)
Retailers were asked to supply information about front-of-store recycling of carrier bags
Around 40% of stores have such recycling available. Generally the stores without this facility are smaller, convenience stores
Of the four nations of the UK, the proportion of stores with a facility is lowest in England
Most recycling points also accept other plastic film; many retailers use the on-pack recycling label (OPRL) scheme to guide their customers
Most do not record the amount of material they collect separately, as the bags (and film) are combined with packaging from the rest of the store before being sent for recycling

Summary - UK
Total bag use increased between 2012 and 2013 (by just over 3%) continuing the trend since the end of the voluntary agreement, but was still lower than in 2006 (by 29%)
Thin-gauge bags constitute 95% of all bags used and so the trend in total bag use mirrors the use of thin-gauge bags
The number of BfL issued is also increasing but from a much smaller base
The amount of virgin polymer used in carrier bags is increasing slowly but is still 48% less than in 2006
Thin-gauge bag use per capita has been increasing since 2009, to 10.8 bags per month in 2013, but still lower than the 16.7 bags in 2006
Retailers’ sales volume decreased by 1.6% between 2010 and 2013
Around 40% of grocery stores have a facility to recycle plastic-film and polyethylene carrier bags – convenience stores tend not to

Summary - Nations
Trends in thin-gauge carrier-bag use differed between nations between 2010 and 2013:
England and Scotland increased
Wales and Northern Ireland decreased
Thin-gauge bag use per person per month also differs
A steady year on year increase in England
Previously stable, an increase in Scotland
The marked decline in Wales in 2012 has not continued in 2013
Northern Ireland has shown a similar marked decrease
These figures give an indication of the impact of the introduction of the carrier bag charge in Wales and Northern Ireland