1 research design dr salah aburuz. 2 homework1: research title (due 1/4) research title introduction...
TRANSCRIPT

1
Research Design Research Design Research Design Research Design
Dr Salah AbuRuzDr Salah AbuRuz

2
HomeWork1:Research Title (Due 1/4)
• Research Title• Introduction including:
– Statement of problem.– Aims and objective– Research questions and Providing a
few hypotheses that come from the research problem.

3

4

5
hierarchy of major study designs
systematic review of RCTs
RCT
cohortcase control
Cross sectional study
Case report
interventional
observational
validity
6

7
The reason that we use less reliable designs for some questions:
• One reason for using a nonexperimental design is that a vast number of human characteristics are inherently not subject to experimental manipulation (e.g., blood type, personality, health beliefs, medical diagnosis); the effects of these characteristics on other phenomena cannot be studied experimentally.
• Ethics - RCTs cannot usually be applied to questions about potential harm, because it is unethical to expose people actively to potential harms
• Cost – More reliable designs are more expensive

8
• Practicality – Constraints might involve insufficient time, lack of administrative approval, excessive inconvenience to patients or staff, or lack of adequate funds.
• Not all questions require RCTs or systematic reviews. For example, questions about prevalence can be quite satisfactorily answered by cross-sectional studies, rather than by an RCT.
• Finally, nonexperimental research is usually needed before an experimental study can be planned. Experimental interventions are developed on the basis of nonexperimental research documenting the scope of a problem and describing critical relationships between relevant variables.

9
Nonexperimental Nonexperimental researchresearch
Nonexperimental Nonexperimental researchresearch

10
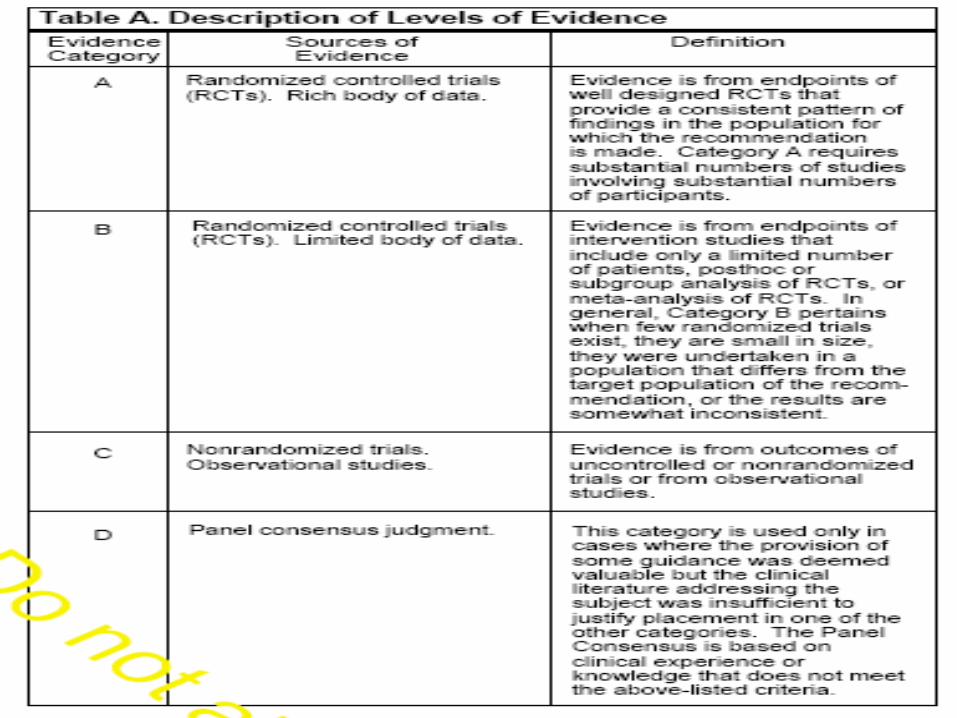
Nonexperimental research
(observational)• Correlational (ex post facto) research
– Prospective designs– Retrospective designs– Cross-sectional correlation
• Descriptive research (survey/prevalence)– Purely descriptive
11
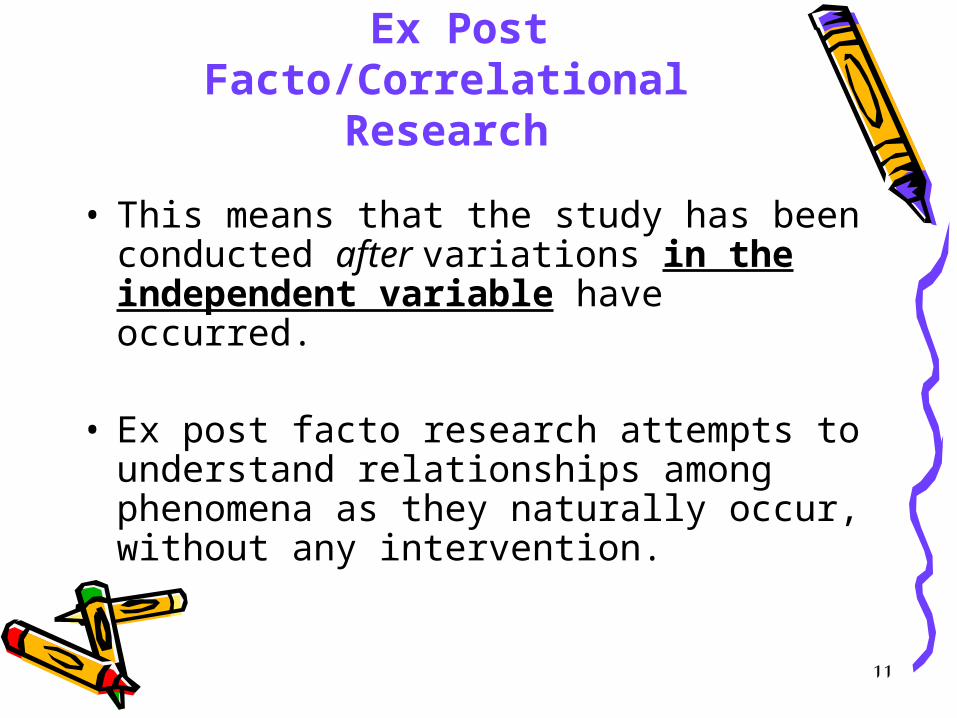
Ex Post Facto/Correlational Research
• This means that the study has been conducted after variations in the independent variable have occurred.
• Ex post facto research attempts to
understand relationships among phenomena as they naturally occur, without any intervention.

12
• correlation is an interrelationship or association between two variables, that is, a tendency for variation in one variable to be related to variation in another.
• For example, in human adults, height and weight are correlated because there is a tendency for taller people to weigh more than shorter people.
• Age and wealth• Age and height

14
• Correlation does not prove causation
• The mere existence of a relationship— even a strong one—between variables is not enough to warrant the conclusion that one variable caused the other.
• Although correlational studies are inherently weaker than experimental studies in elucidating cause-and-effect relationships, different designs offer different degrees of supportive evidence.

15
Cohort Study
Exposed
NotExposed
a
c
b
d
a+b
c+d
OutcomeNot
Outcome
a bc d
a+c b+d a+b+c+d

16
• Cohort studies
• Cohort Study is a study in which patients who presently have a certain condition and/or receive a particular treatment are followed over time and compared with another group who are not affected by the condition under investigation.
• Studies are generally concerned with what causes a disease. Problems include the time a study can take and the influence of other lifestyle variables.
• For instance, since a randomized controlled study to test the effect of smoking on health would be unethical, a reasonable alternative would be a study that identifies two groups, a group of people who smoke and a group of people who do not, and follows them forward through time to see what health problems they develop.

17

18

19
Characteristics
1. Begin by identifying individuals for study and control groups before the investigator is aware of whether they have or will develop the disease.
2. A cohort is a group of individuals who share a common experience.
3. Compare disease frequency over time between one cohort that possesses the characteristics under study (e.g., drug exposure) to a second cohort that does not possess these particular characteristics (e.g., no drug exposure).

Characteristics• Since they identify exposure and then proceed
to outcome (disease) they are less subject to bias than other observational studies.
• They are especially useful when it is not possible for ethical reasons to use a RCT design (e.g. randomising to cigarette/no cigarette use).
• Because cohort studies may run over many years and may need large numbers of participants, they are often very expensive.
20

21
Cohort studies
• Ethically safe
• Cheaper than RCT??
• No randomization• Subject to
confounders effect
• Long duration• Cost??• Rare disease
difficult to study
Advantages: Disadvantages:

22
NOTE
• Outcomes are RR, NNT• Discuss more examples from the
literature and experience

Self study
• Retrospective cohort study
23

24

25

26
Case-Control Study
Exposed
NotExposed
a
c
b
d
a+b
c+d
OutcomeNot
Outcome
a b
c d
a+c b+d a+b+c+d
27

28
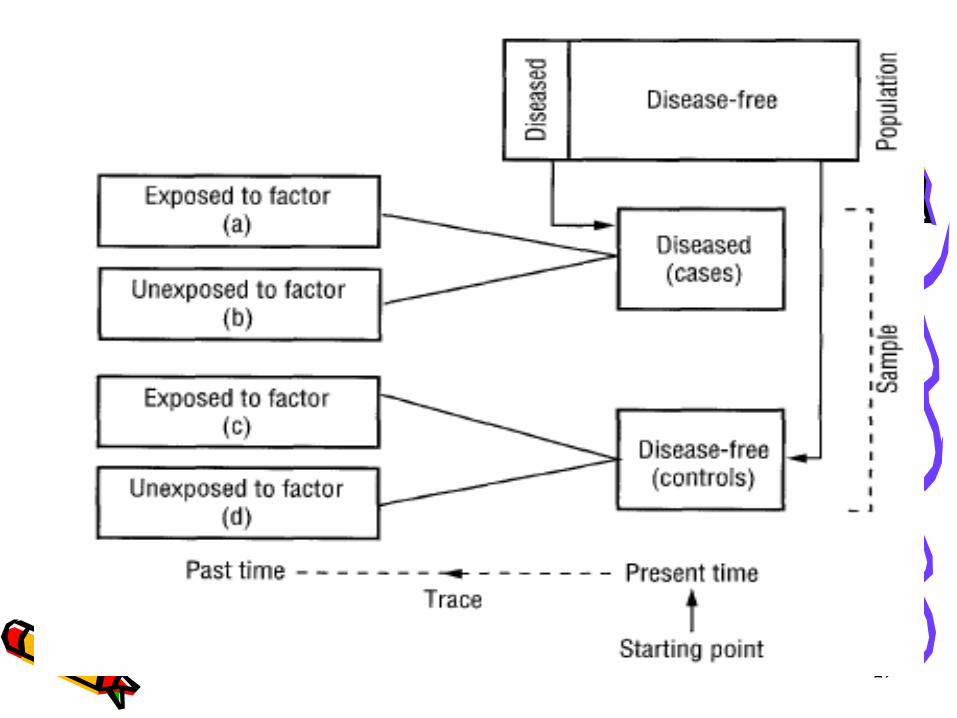
• Case control studies Case control studies are concerned with what causes a disease.
• a group of patients who have experienced an outcome of interest (e.g., breast cancer) are retrospectively matched to a similar group of patients who lack the outcome of interest (e.g., women without breast cancer). (matched usually by age and gender)
• The investigators then look for a difference in past exposures between the two groups (e.g., exogenous estrogen use) to determine the cause

29
Characteristics1. Begin after individuals already have developed or
failed to develop the disease being investigated.2. Go back in time to determine the characteristics of
individuals before the onset of disease.3. Cases: Individuals who have developed the disease
already.4. Controls: Individuals who have not developed the
disease.
5. Retrospective studies are often cross-sectional, with data on both the dependent and independent variables collected once, simultaneously.

30
• the researchers must find controls without the disease or condition who are as similar as possible to the cases with regard to key extraneous variables (e.g., age, gender) and also obtain historical information about the presumed cause.
• If controls are well chosen, the only difference between them and the cases is exposure to the presumed cause.
• Researchers sometimes use matching to control for extraneous variables.
• To the degree that researchers can demonstrate comparability between cases and controls with regard to extraneous traits, inferences regarding the presumed cause of the disease are enhanced.

31
• Matching ensures confounding is taken into consideration. , but rather than following the subjects into the future, data on past exposure to possible causal agents are collected (eg, by searching through medical records or interviewing subjects).
• This type of trial may be the only feasible way to study rare disorders or those with a long lag time between exposure and outcome. However, the results can be subject to bias, such as when patients are asked to recall long-ago events, such as their prior use of certain drugs.

32
Case-control studies
• Quick and cheap
• Excellent for rare diseases
• Potential recall bias
• Confounding of exposure variable
• Matching controls to cases is a “challenge”
Advantages: Disadvantages:

Notes• More examples• Outcomes: odds ratio
33

34

35

36
Cross sectional Correlation Studies
• Unlike other types of correlational research—such as the smoking and lung cancer investigations— the aim of descriptive correlational research is to describe the relationship among variables rather than to infer cause-and-effect relationships.
• Descriptive correlation studies are usually
cross-sectional (lung function and asthma control, age and weight)

37
Cross-sectional Study
Exposed
NotExposed
a
c
b
d
a+b
c+d
OutcomeNot
Outcome
a b
c d
a+c b+d a+b+c+d

38
Example of a descriptive correlationalstudy:Morin, Brogan, and Flavin (2002) described
therelationship between body image perceptions of postpartum African-American women on the one hand, and their weight (based on the body mass index) on the other. Irrespective of body masscategory, women usually considered themselves larger than they were.

39
Descriptive Research
• The purpose of descriptive studies is to observe, describe, and document aspects of a situation as it naturally occurs
• sometimes to serve as a starting point for hypothesis generation or theory development.

40
• Cross sectional surveys A cross sectional survey is a measure of the frequency of a disease or risk factor in a defined population at a given time.
• For example, the records of all patients in a number of general practices could be reviewed to determine the number of patients with heart failure (and therefore the prevalence of heart failure in that population)
• Cross-sectional studies are useful for defining the prevalence of a disease or lifestyle patterns (e.g. Survey of Lifestyles, Attitudes and Nutrition - SLAN) but they cannot provide information on possible cause(s) of a disease.

41
• Some descriptive studies are undertaken to describe the frequency of occurrence of a behavior or condition rather than to study relationships.
• For example, an investigator may wish to describe the health care and nutritional practices of pregnant teenagers.

42
Cross-sectional Studies1. prevalence studies2. case control studies3. Static pre-experminemntal
studies4. Descriptive Correlation Studies5. Cross sectional surveys

43
Observational studies
• Cheap and simple• Ethically safe
• No causality (only association)
• Unequal confounder distributions
• Recall bias
Advantages: Disadvantages:
44
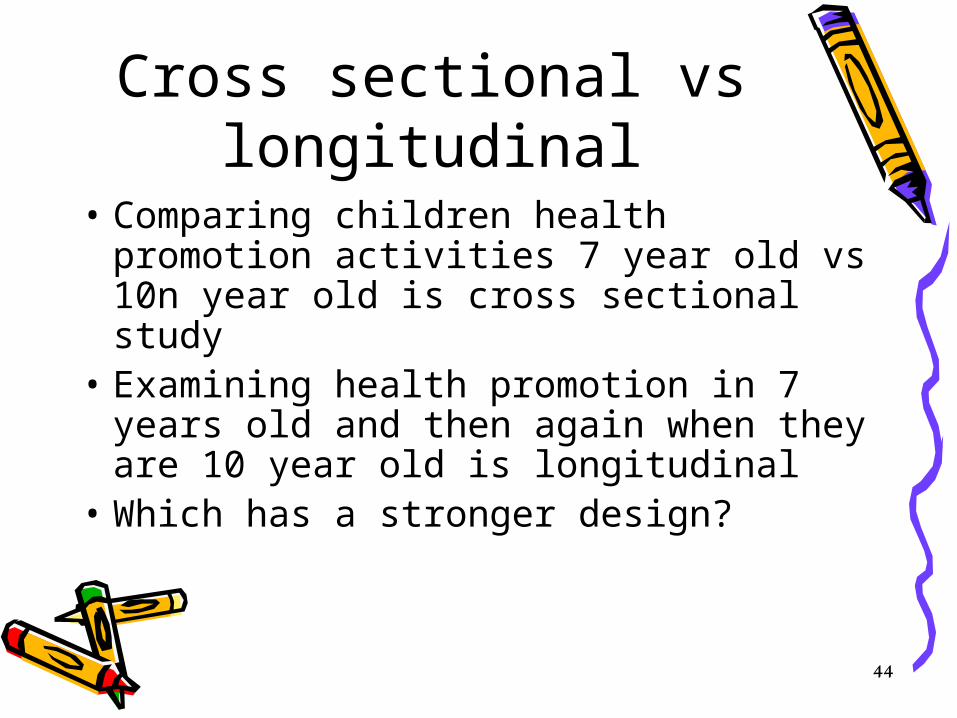
Cross sectional vs longitudinal
• Comparing children health promotion activities 7 year old vs 10n year old is cross sectional study
• Examining health promotion in 7 years old and then again when they are 10 year old is longitudinal
• Which has a stronger design?
45
• Repeated cross-sectional studies may be carried out at different time points to assess trends over time. However, as these studies involve different groups of individuals at each time point, it can be difficult to assess whether apparent changes over time simply reflect differences in the groups of individuals studied.

46
Case reports and case series
• A case report is simply a presentation of one or more cases. While case reports are valuable for reporting rare clinical events and raising awareness of the possible harm or benefit associated with an agent, they are not an evidence-based tool for making clinical decisions.
• Because there is no control group, case reports and series are not valid statistically.

See full cohort study
47

See full case control study
48

Seen full cross sectional correlational
study
49

50
Experimental Experimental studiesstudies
Experimental Experimental studiesstudies

51
Characteristics of True Experiments
1. Manipulation—researcher does something to some subjects (introduces an intervention or treatment)
2. Control—researcher introduces controls, including a control group

52
Characteristics of True Experiments (cont’d)
3. Randomization (also called random assignment)—researcher assigns subjects to groups at random– Typical assignment is to an
experimental group or a control group– May be done by computer or through a
table of random numbers

54
Randomized controlled Trial

55
• The steps in the classic controlled experiment are: – 1) randomly assign subjects to treatment or
control groups; – 2) administer the pre-test to all subjects in
both groups; – 3) ensure that both groups experience the
same conditions except that in addition the experimental group experiences the treatment;
– 4) administer the post-test to all subjects in both groups;
– 5) assess the amount of change on the value of the dependent variable from the pre-test to the post-test for each group separately.

56
• The difference in the control group's score from the pre-test to the post-test indicates the change in the value of the dependent variable that could be expected to occur without exposure to the treatment (independent) variable X.
• Control group - control group = control group difference pre-test score post-test score on the dependent variable

57
• The difference in the experimental group's score from the pre-test to the post-test indicates the change in the value of the dependent variable that could be expected to occur with exposure to the treatment (independent) variable X.
• Experimental group - experimental group = experimental group difference pre-test score - post-test score on the dependent variable

58
• The difference between the change in the experimental group and the change in the control group is the amount of change in the value of the dependent variable that can be attributed solely to the influence of the independent (treatment) variable X.
• Control group difference - experimental group difference = difference attributable to X

59
Randomized Trial
Exposed
NotExposed
a
c
b
d
a+b
c+d
OutcomeNot
Outcome
a bc d
a+c b+d a+b+c+d

60
Randomized Controlled Clinical
Trials
• Unbiased distribution of confounders
• causality
• Expensive: time & money
• Volunteer bias• Ethical issues• Hawthorne effect
Advantages: Disadvantages:

62
Experimental (interventional
design) Designs
• After-only (posttest-only) design• Before-after (pretest-posttest)
design• Crossover (repeated measures)
design• Factorial design• Randomized Block Design

64
• Example of a posttest-only experimental• design:• Milne (2000) used a posttest-only design to study• the effect of an educational intervention relating to• urinary incontinence on the subsequent help-seeking• behavior of older adults. One group received
individualized• instruction and written information, and• the other received written information alone. Two• months later, Milne determined how many subjects• in each group sought professional help for urinary• incontinence.

65
Example of a Factorial Design—Infant Stimulation

66
Randomized Block Design
• A design that looks similar to a factorial design in structure is the randomized block design.*
• There are two factors (independent variables), but one factor is not experimentally manipulated.
• Suppose that we were interested in comparing the effects of tactile versus auditory stimulation for male versus female infants.

67
• We could structure this as a 2*2 experiment, with type of stimulation as one factor and gender as the other.
• The variable gender, which we cannot manipulate, is known as a blocking variable
• The inclusion of a blocking variable in a study design enhances the researcher’s control over sample composition (i.e., to ensure that sufficient numbers of subjects with specific characteristics are included) and over extraneous variables.
• That is, if we consider gender a confounding variable because we believe that male and female infants will respond differently to the two therapies, then a randomized block design is needed

69
Crossover Design• In a crossover experimental design, subjects
are randomly assigned to different orderings of treatments.
• For example, if a crossover design were used to compare the effects of auditory and tactile stimulation on infant development, some infants would be randomly assigned to receive auditory stimulation first, and others would be assigned to receive tactile stimulation first. In such a study, the three conditions for an experiment have been met: there is manipulation, randomization, and a control group, with subjects serving as their own controls. condition.

70

71
• Although crossover designs are extremely powerful, they are inappropriate for certain research questions because of the problem of carry-over effects. When subjects are exposed to two different treatments or conditions, they may be influenced in the second condition by their experience in the first

72
The Control Condition or Counterfactual
• No intervention• An alternative intervention• A placebo or pseudo-intervention• Standard methods of care• Different doses or intensities of
treatment

73
Quasi-Experiments• Lack either randomization or control
group, but introduce other controls• Types of quasi-experimental
designs:– Nonequivalent control group pretest-
posttest design (no random assignment)
74
Preexperimental Designs
• Lack control group and/or randomization• Lack controls of quasi-experiments• Examples of preexperimental designs:
– Nonequivalent control group, after-only design (serious flaw?!)
– One group before-after design (time series)– -static group comparison design (cross-
sectional study)

75
Static group comparison
X O1
----------- O2
• cross-sectional & correlational analysis• Problems
– Selection into the two groups– No pre-“treatment” measurement

76
Evaluation of quasi-experimental and pre-experimental designs
• May be easier, more practical than true experiments
• Sometimes it is not possible to conduct true experiments
BUT• More difficult to infer causality• Usually several alternative rival
explanations for results

78
Homework1. Identify from the literature (title,
reference, summary)- Case control trial- Cohort trial- RCT- Preexperimental trial- Quazi-experimental trial

81
Enhancing Rigor inQuantitative
Research
Enhancing Rigor inQuantitative
Research

82
• Confounding is an exposure that the researcher did not measure that independently affects the outcomes of the study and which is associated with the exposure.
• Confounding can mislead people into thinking that a so-called exposure causes outcomes when really it was caused by the forgotten “confounding” exposure.
• Causes other than the one studied which may be linked to the studies outcomes

83

84
• For example, a study of the relation between lung cancer and coffee drinking might show a spurious association between the two. This is because coffee drinkers are more likely to smoke – the real risk factor for lung cancer. In this study, the left-out variable of smoking “confounds” the relationship between coffee and lung cancer

85
Controlling Extraneous Variables• Controlling external factors
– Achieving constancy of conditions– Control over environment,
setting, time• Controlling intrinsic factors
– Control over subject characteristics

86
Controlling external factors
• In quantitative studies, researchers often take steps to minimize situational contaminants to make the conditions under which data are collected as similar as possible for all subjects.
• The control that researchers impose by attempting to maintain constancy of conditions probably represents one of the earliest forms of scientific control.
87
• The environment has been found to exert a powerful influence on people’s emotions and behavior, and so, in designing quantitative studies, researchers need to pay attention to environmental context.

88
• Control over the environment is most easily achieved in laboratory experiments in which subjects are brought into environments arranged by the experimenter.
• in conducting a nonexperimental study in which data are gathered through an interview, researchers ideally should conduct all interviews in basically the same kind of environment.

89
• Depending on the study topic, the dependent variable may be influenced by the time of day or time of year in which the data are collected. In such cases, it would be desirable to strive for constancy of times across subjects.
• If an investigator were studying fatigue or perceptions of physical wellbeing, it would matter a great deal whether the data were gathered in the morning, afternoon, or evening, or in the summer as opposed to the winter.

90
• Constancy of communication: In most studies, researchers inform participants about the study purpose, the use that will be made of the data, under whose auspices the study is being conducted, and so forth. This information should be prepared ahead of time, and the same message should be delivered to all subjects.

91
• Achieving constancy of conditions isnot always easy, especially in clinical studies,but various steps can be taken. For example, inaddition to having standard protocols, it is importantto thoroughly train the people who will be collectingthe data and, in the case of an experiment orquasi-experiment, the personnel responsible forimplementing the intervention. The extent to whichthe protocols are followed should be monitored.

92
• Example of controlling external factors:• Wipke-Tevis, Stotts, Williams, Froelicher,• and Hunt (2001) conducted a quasi-
experimental• study in which great care was taken to ensure
constancy of conditions.• The study purpose was to compare tissue
oxygenation in four body positions among people with venous ulcers.
• As an example of how the researchers controlled environmental factors, all measurements were made in the early morning; subjects had been instructed to fast so that a fasting blood sample could be drawn; subjects were then provided the same breakfast. After breakfast all subjects rested in bed supine for 30 minutes before testing began.

93
Methods of Controlling Intrinsic Factors (subject
characteristics)
• Randomization• Subjects as own controls (crossover design)• Homogeneity (restricting sample)• Matching• Blocking • Statistical control (e.g., analysis of
covariance)

94

98
Characteristics of Good Research Design in Quantitative Studies
• Statistical conclusion validity —the ability to detect true relationships statistically
• Internal validity –the extent to which it can be inferred that the independent variable is truly causing or influencing the dependent variable

99
Characteristics of Good Research Design in
Quantitative Studies (cont’d)• External validity–the
generalizability of the findings to other samples or settings
• Construct validity–the adequacy of measuring key constructs

100
Threats to Statistical Conclusion Validity
• Low statistical power• Unreliable implementation of a
treatment - The strength of an intervention (and hence
statistical power) can be undermined if the intervention is not as powerful in reality as it is “on paper.”
- Inadequate participation in treatment conditions - Lack of standardization (constancy of conditions)

101
• Example of problems with standardization:Winterburn and Fraser (2000) tested theEffect of postnatal hospital stay onBreastfeeding rates in a teaching hospital innorthern England. Women in their thirdtrimester were randomly assigned to ashort postnatal stay (6 to 48 hours) ora longer stay (more than 48 hours). The study Design
was compromised by the fact that some women in the long-stay group were reluctant to stay in the hospital, resulting in relatively small group Differences in hospital stay.

103
• Power is the ability of the study to detect an effect if in ‘truth’ there is an effect. or the odds that you will observe a treatment effect when it occurs
• It is the probability the data gathered in an experiment will be sufficient to reject the null hypothesis

104
Threats to External Validity
• Inadequate sampling • Novelty effect• Expectancy effect (Hawthorne effect)• Placebo effect• Artificiality of research environment

105
• is to do with how relevant the study is to the question asked. If we hope to answer the question ‘does cell phone use cause brain tumors in the long term?’ then a study that only followed people up for a short time would have poor external validity. The same study may, however, be externally valid if we asked a question about short term effects.
• External validity may be hotly debated. For instance, are studies about reducing risk in people who have had a previous cardiovascular event externally valid (ie relevant) in people who have no history of cardiovascular disease?

106
Threats to Internal Validity
• The control mechanisms reviewed earlier inare all strategies for improving internalvalidity.• If researchers are not careful in managingextraneous variables and in other ways controllingthe design of the study, there may be reason tochallenge the conclusion that the subjects’ perfor-mance on the dependent measure was caused bythe independent variable.

107
Threats to Internal Validity
• True experiments possess a high degree of internal validity because the use of manipulation, randomization, and a control group usually enables the researcher to rule out most alternative explanations for the results.
• Researchers who use quasi-experimental, preexperimental, or correlational designs must always contend with competing explanations for obtained results.

108
Bias is any factor arising from the design and conduct of a study that skews the data in one particular direction, either away from or towards the “true” population value that is being estimated with the study.
• Bias becomes a major problem when you don’t know which way it is skewing the data.

109
Threats to Internal Validity
• History threat- The threat of history refers to the
occurrence of external events that take place concurrently with the independent variable that can affect the dependent variables

110
• Selection threat- Selection encompasses biases resulting
from preexisting differences between groups. When individuals are not assigned randomly to groups, there is always a possibility that the groups are nonequivalent. They may differ in ways that are subtle and difficult to detect. If the groups are nonequivalent, differences on outcomes may result from initial differences rather than from the effect of the independent variable.

111
• Maturation threat• In a research context, maturation refers to
processes occurring within subjects during the course of the study as a result of the passage of time rather than as a result of a treatment or independent variable. Examples of such processes include physical growth, emotional maturity, fatigue.
• Remember that maturation here does not refer to aging or development exclusively but rather to any change that occurs as a function of time. Thus, wound healing, postoperative recovery, and many other bodily changes that can occur with little or no nursing or medical intervention must be considered as an explanation for outcomes that rivals an explanation based on the effects of the independent variable.

112
• Instrumentation.
- Another threat related tomeasurements is the threat of instrumentation. Thisbias reflects changes in measuring instruments ormethods of measurement between two points of datacollection. - For example, if we used one measure ofstress at baseline and a revised measure at follow-up,any differences might reflect changes in the measuringtool rather than the effect of an independent variable.- Instrumentation effects can occur even if thesame measure is used. For example, if the measuringtool yields more accurate measures on the secondadministration (e.g., if the people collecting the dataare more experienced) or less accurate measures thesecond time (e.g., if subjects become bored or fatigued),then these differences could bias the results.

113
•Mortality threat– biases are usually of concern if the
rate exceeds 20%.

114
Examples of other kinds of bias are listed below:
• Recall bias
• Observer bias - for example, we know that the patient had active treatment so we subconsciously encourage her to rate her quality of life as higher than it really is
115
• Internal validity of measurement (construct validity) is to do with how good our assessment tools are for measuring the things we want to measure in the study.
• For instance, asking people ‘how are you on
a scale of 1 to 10?’ may not be a reliable way of assessing quality of life. Similarly, measuring glycosylated hemoglobin has more internal validity for assessing long term glucose control than a monthly urine dipstick test.
• Asking people ‘how much do you smoke?’ may not be as internally valid as asking people to keep their empty cigarette packets for measuring tobacco exposure.

116

117
• how many primary studies are reliable enough to incorporate into clinical decisions, guidelines, and policies.
• name reasons why studies may be too methodologically unreliable for application to research.
Factors affecting research validity

118
• Bias (internal validity)
• Poor internal measurement validity• Confounding (control of extraneous variables)
• External validity (relevance)
• Low power (conclusion)
BICEP

119
• “MODERATE ALCOHOL SAFE BECAUSE IT DOES NOT INCREASE BLOOD PRESSURE”
Example

120
• Bias• Selection bias – perhaps only young
people were included in the study, so not representative of entire population.
• Perhaps people were interviewed about previous alcohol intake (we can only interview the living, so if alcohol caused death, we would never know, since those who are deceased are excluded from the study).
• Observer bias – the researcher may subconsciously encourage participants to mis-represent alcohol intake in order to support his or her preconceived notions.

121
• Internal validity of measurement• The study may have assessed alcohol
intake by (for instance) a face to face interview, a postal questionnaire, observation or even checking through their trash for bottles. (they all have their advantages and disadvantages).
• Similarly, we would have to examine the reliability of blood pressure measurement, A one-off reading has poor internal validity for estimating mean blood pressure accurately.

122
• External validity
• An alteration in blood pressure is not the only effect that alcohol may have. Even if we believe the study results, it may not be externally valid to say that moderate alcohol is safe simply because it does not increase blood pressure. It may nevertheless be associated with heart attacks or other morbidity, and mortality.
• The study population may be a particular group, from whom results may not be extrapolated to the general population, as the statement seems to suggest.

123
• Power• for instance a small number of people in
the trial, or people only monitored for a short period, or blood pressure measurements were rounded off to the nearest 10mmHg. In these circumstances, the study cannot rule out an important effect.

Homework 2• Continue from homework 1• Design your own experiment• Write down what measures u will
do to inhancee the validity of research
124