1 sims 247: information visualization and presentation marti hearst course introduction aug 29, 2005
Post on 19-Dec-2015
219 views
TRANSCRIPT
1
SIMS 247: Information Visualization and PresentationMarti Hearst
Course IntroductionAug 29, 2005
2
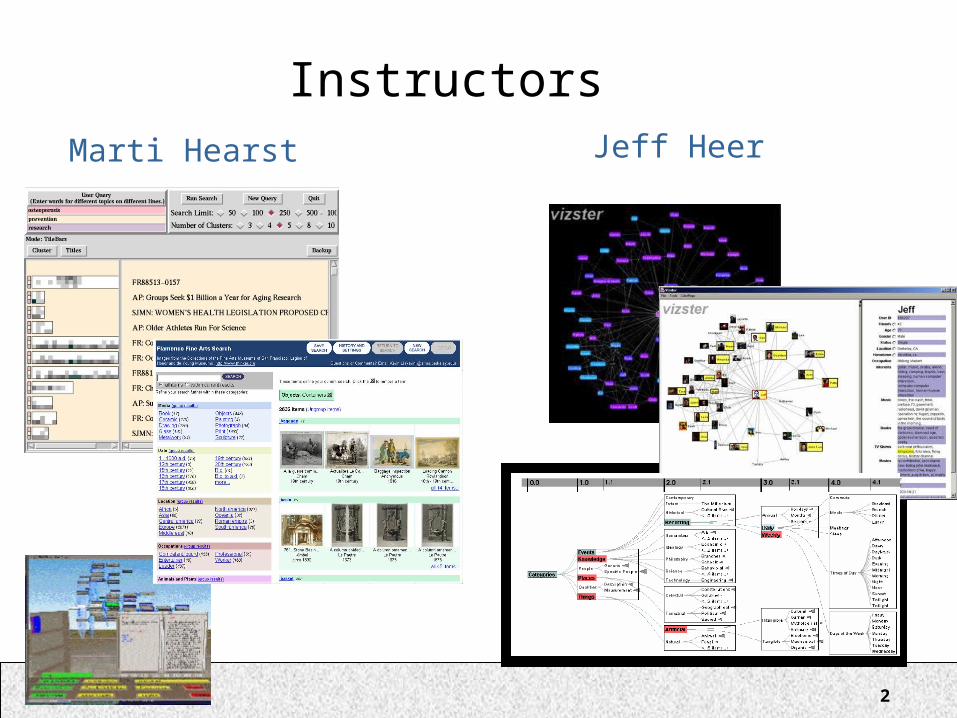
InstructorsMarti Hearst Jeff Heer
3
Outline
• Definitions • The Power of Information Visualization• How Infoviz is Used• How to Design Infoviz’s
– Case Study: The Journey of the TreeMap
• Course Outline• Administrivia
4
What is Information Visualization?
Visualize: to form a mental image or vision of …
Visualize: to imagine or remember as if actually seeing.
American Heritage dictionary, Concise Oxford dictionary
5
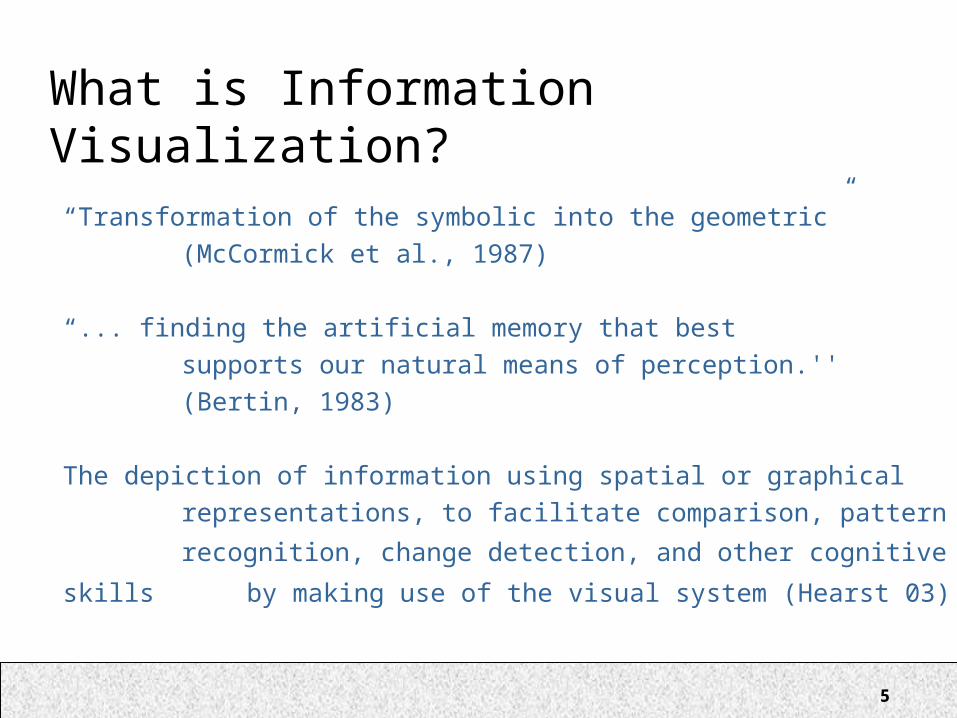
What is Information Visualization?
“Transformation of the symbolic into the geometric” (McCormick et al., 1987)
“... finding the artificial memory that best supports our natural means of perception.'' (Bertin, 1983)
The depiction of information using spatial or graphical representations, to facilitate comparison, pattern
recognition, change detection, and other cognitive skills by
making use of the visual system (Hearst 03).
6
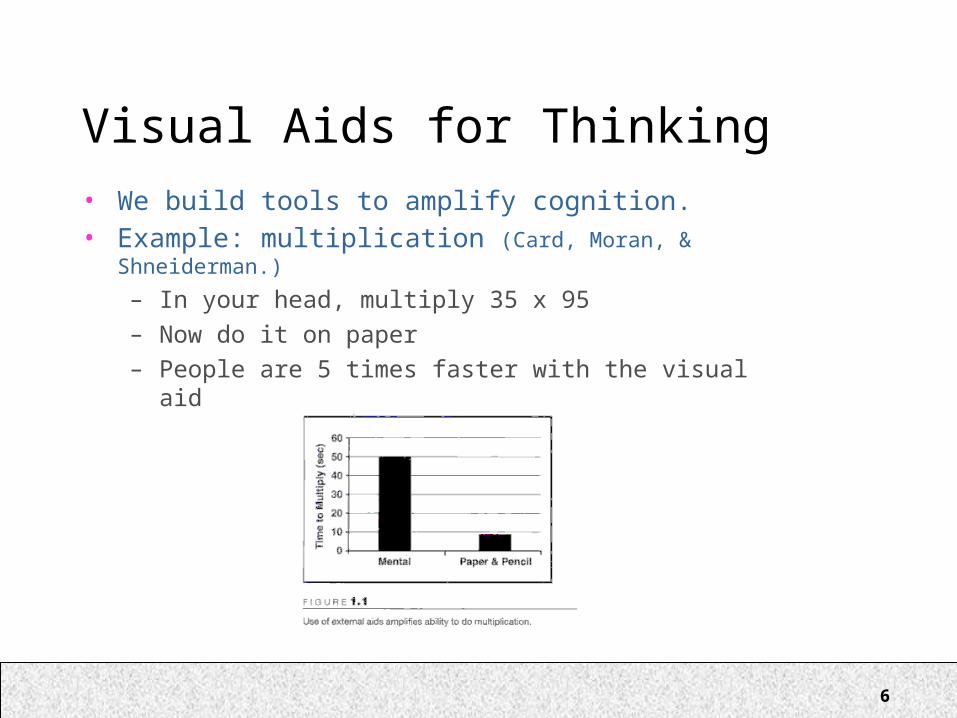
Visual Aids for Thinking• We build tools to amplify cognition.• Example: multiplication (Card, Moran, & Shneiderman.)
– In your head, multiply 35 x 95– Now do it on paper– People are 5 times faster with the visual aid
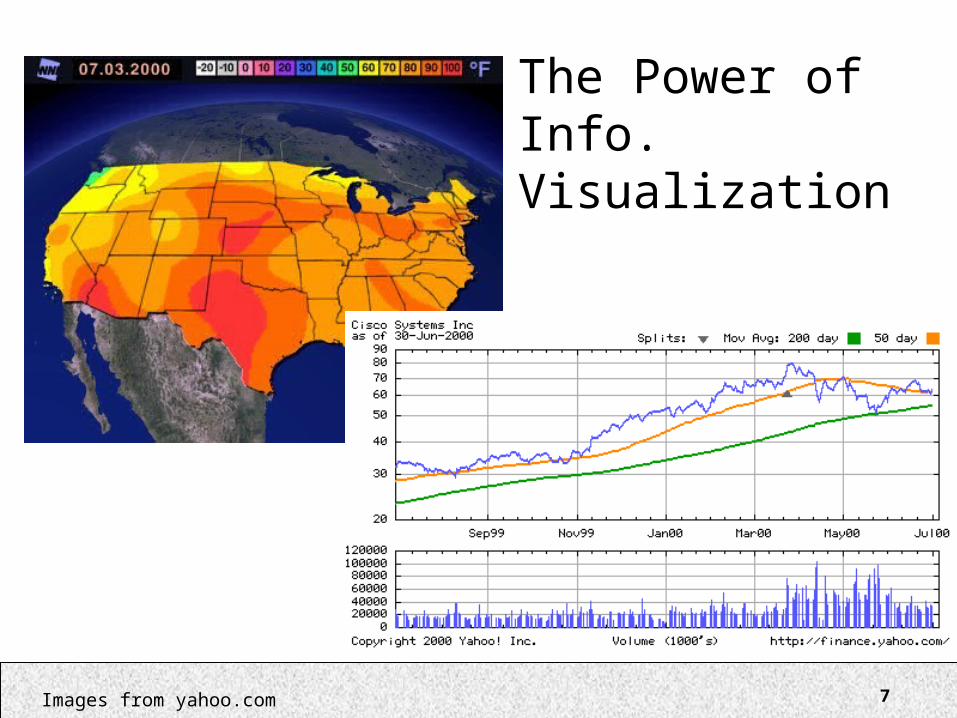
7Images from yahoo.com
The Power ofInfo. Visualization
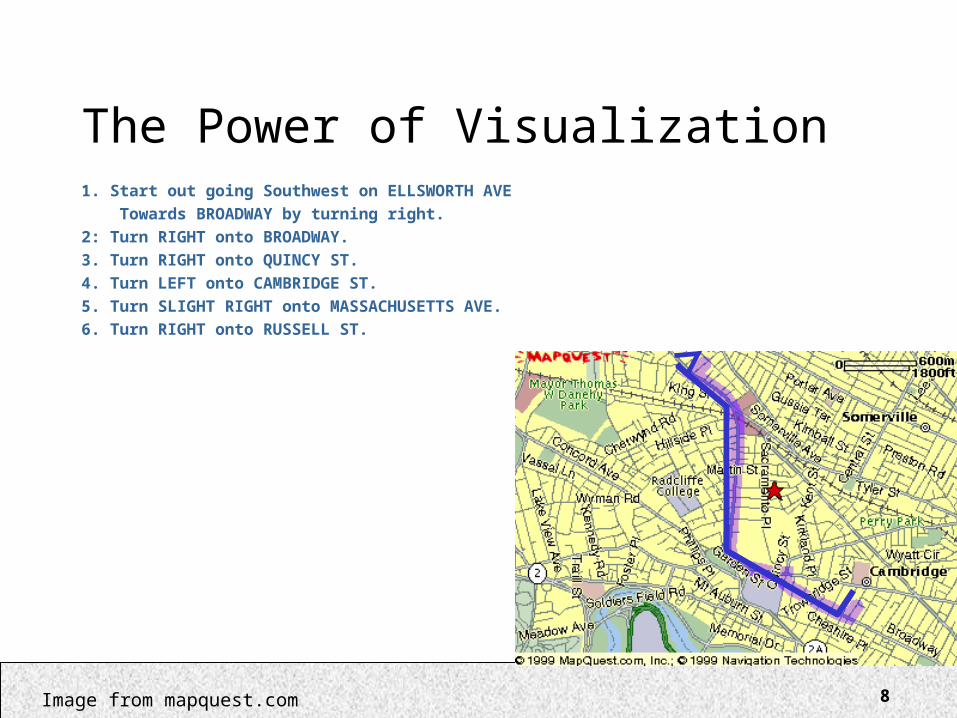
8Image from mapquest.com
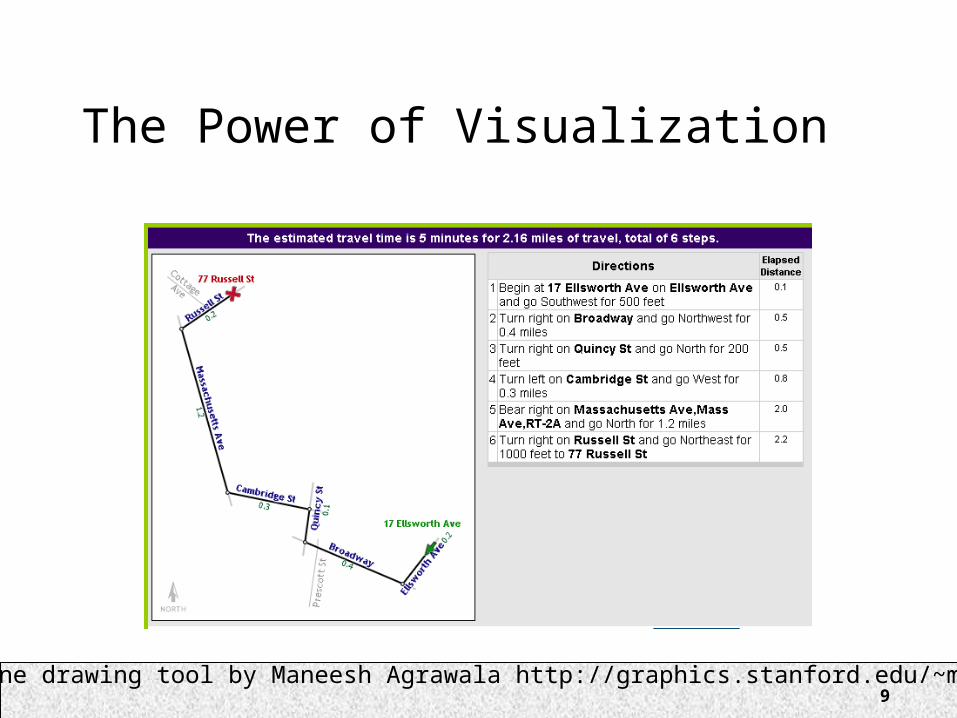
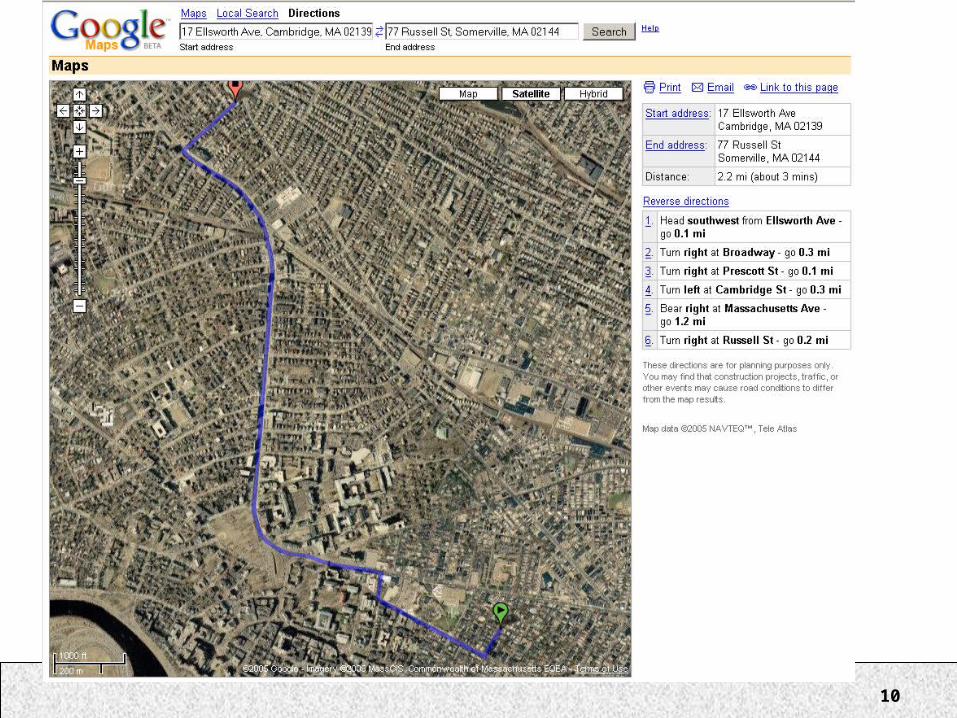
The Power of Visualization1. Start out going Southwest on ELLSWORTH AVE Towards BROADWAY by turning right. 2: Turn RIGHT onto BROADWAY. 3. Turn RIGHT onto QUINCY ST. 4. Turn LEFT onto CAMBRIDGE ST. 5. Turn SLIGHT RIGHT onto MASSACHUSETTS AVE. 6. Turn RIGHT onto RUSSELL ST.
9
The Power of Visualization
Line drawing tool by Maneesh Agrawala http://graphics.stanford.edu/~maneesh/
10
11
Visualization for Problem Solving
Mystery: what is causing a cholera epidemic in London in 1854?
12
Visualization for Problem Solving
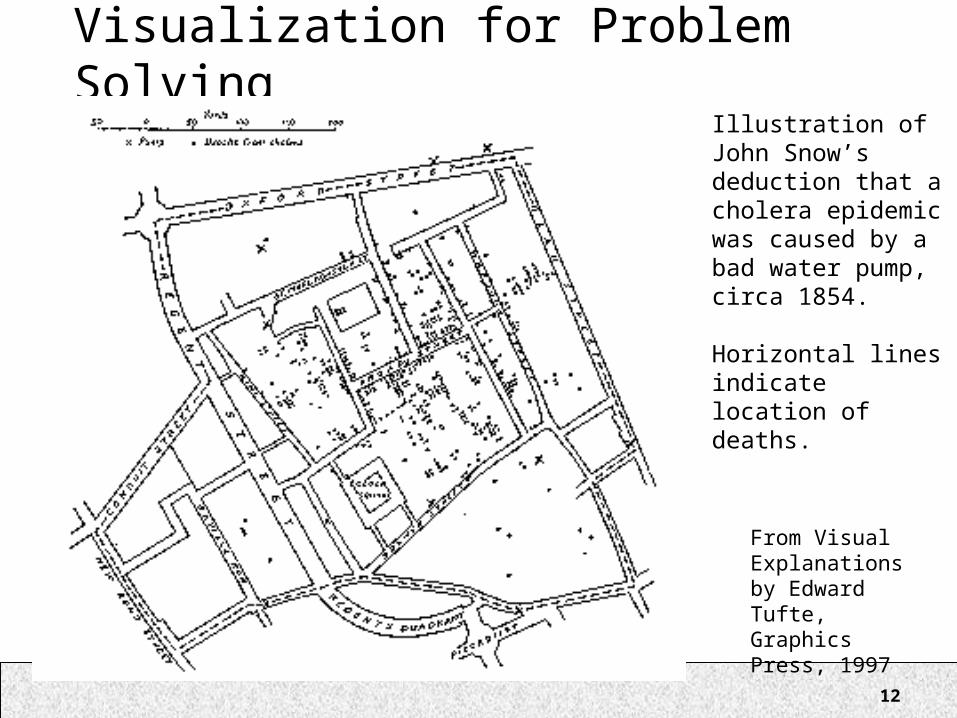
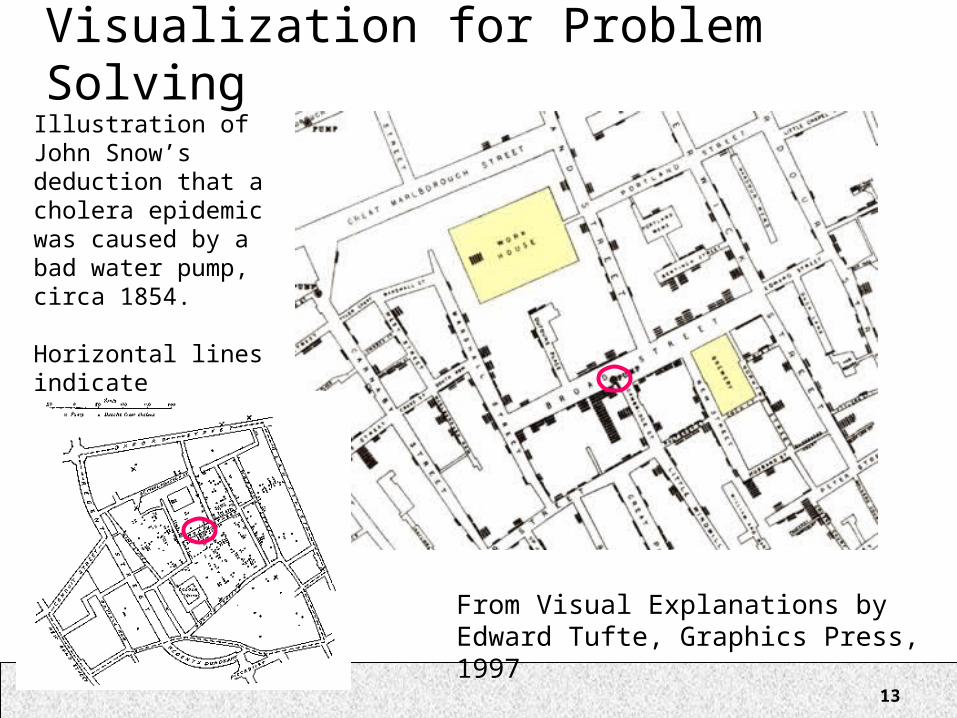
From Visual Explanations by Edward Tufte, Graphics Press, 1997
Illustration of John Snow’sdeduction that a cholera epidemicwas caused by a bad water pump, circa 1854.
Horizontal lines indicate location of deaths.
13
Visualization for Problem Solving
From Visual Explanations by Edward Tufte, Graphics Press, 1997
Illustration of John Snow’sdeduction that a cholera epidemicwas caused by a bad water pump, circa 1854.
Horizontal lines indicate location of deaths.
14
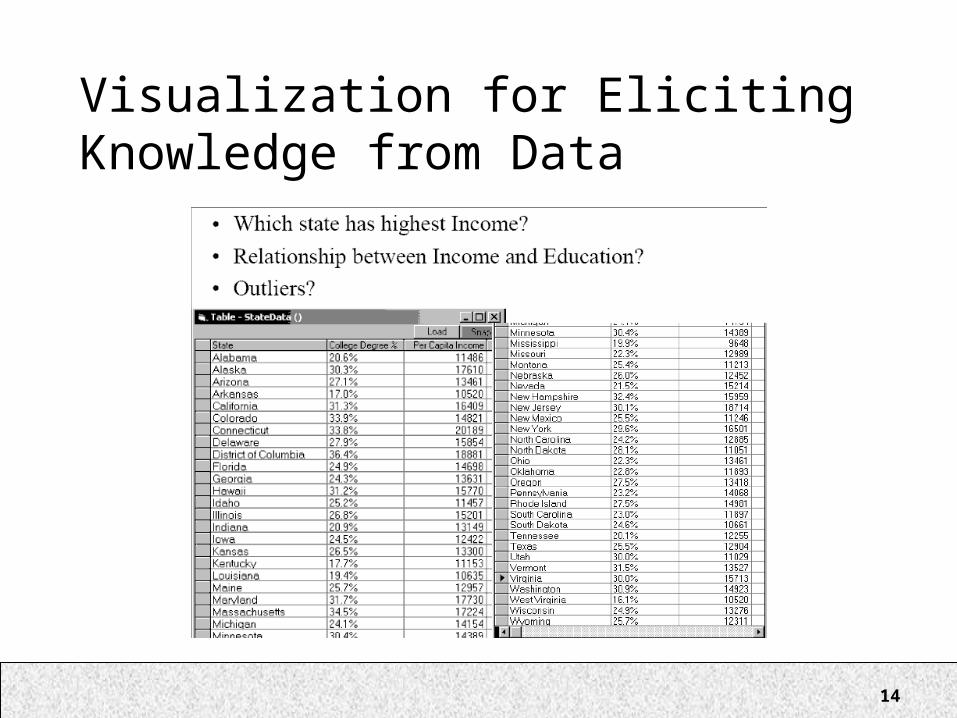
Visualization for ElicitingKnowledge from Data
15
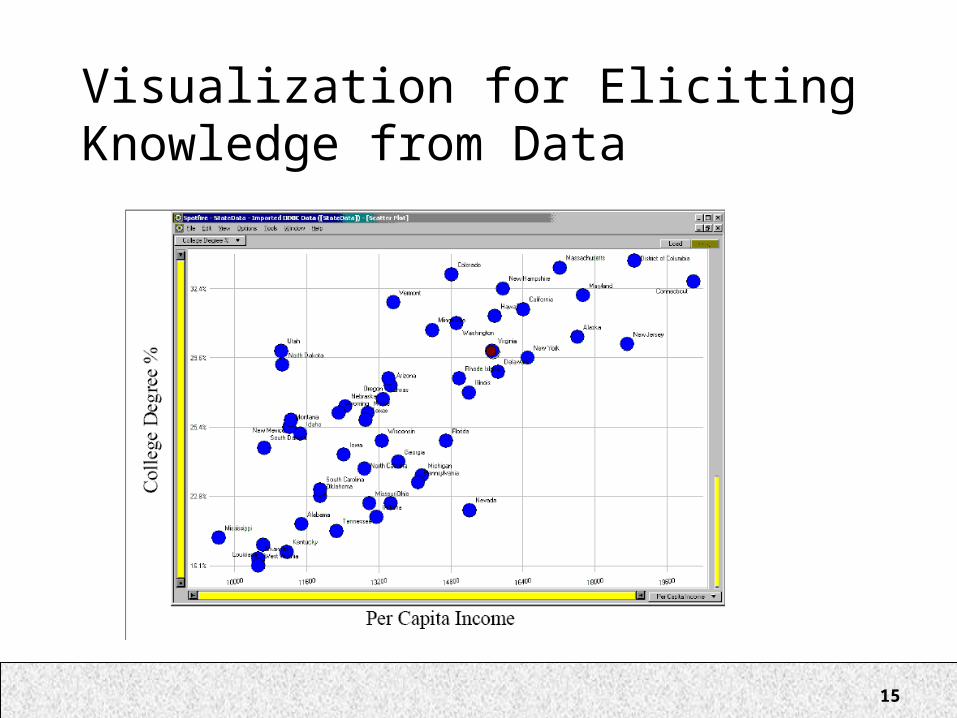
Visualization for ElicitingKnowledge from Data
16
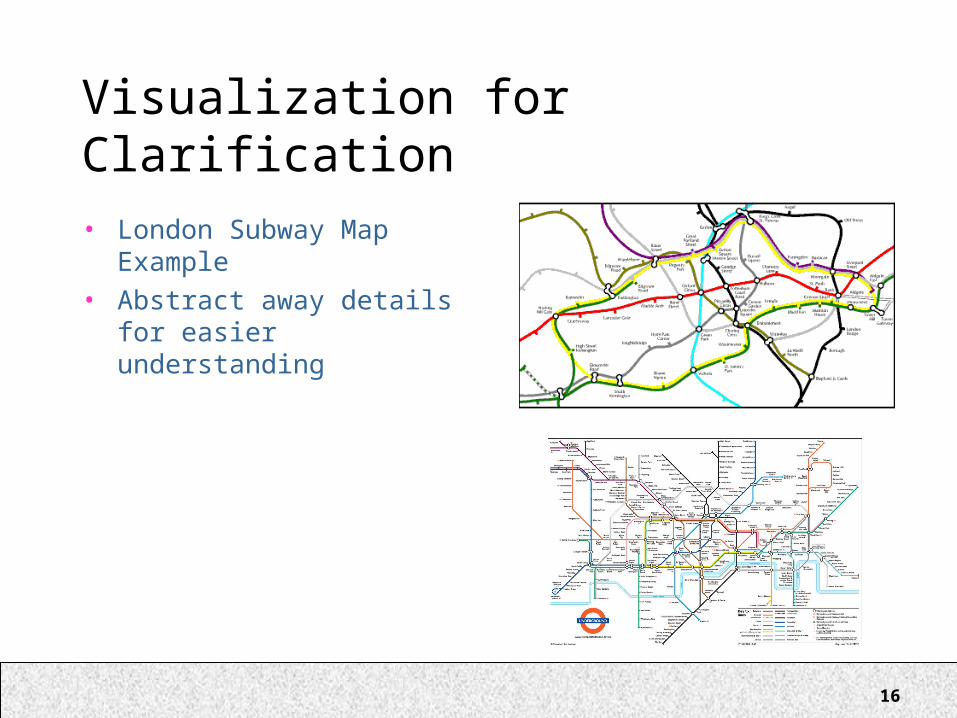
Visualization for Clarification
• London Subway Map Example
• Abstract away details for easier understanding
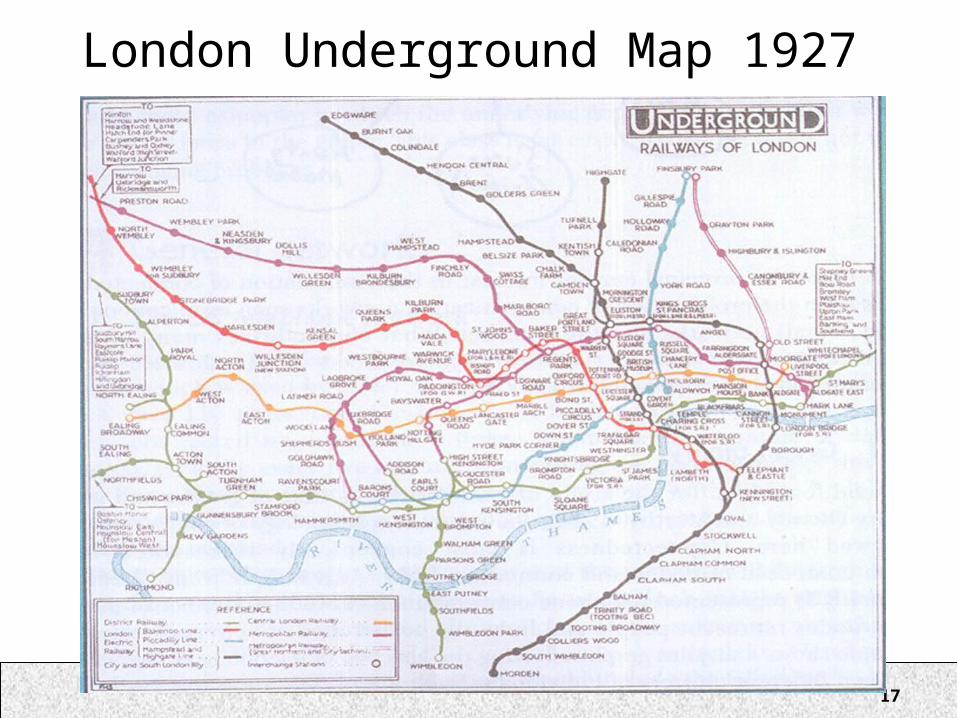
17
London Underground Map 1927
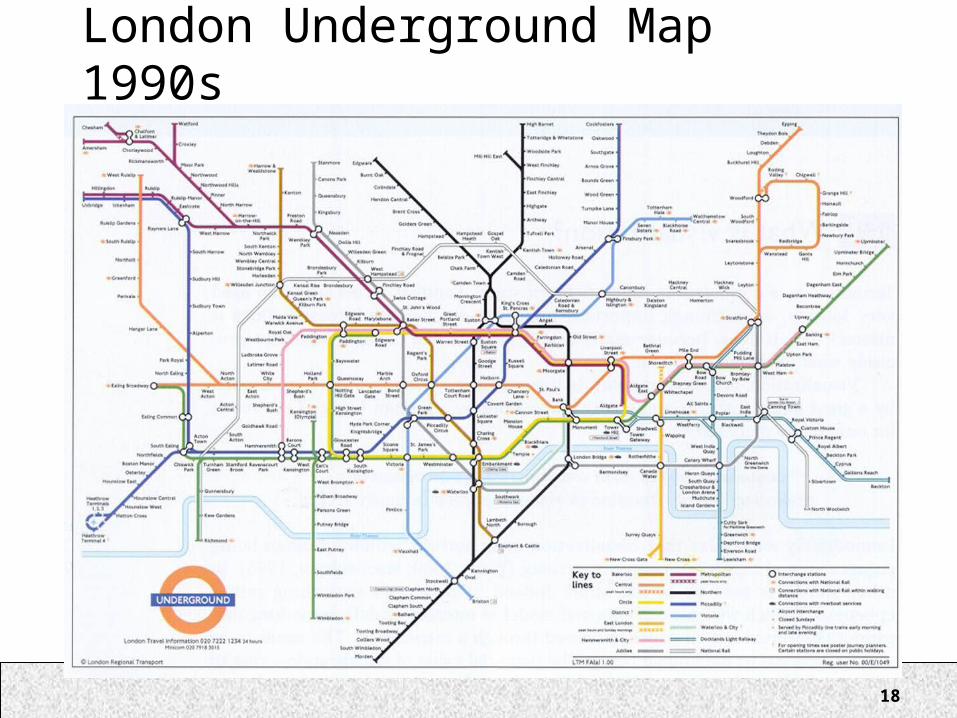
18
London Underground Map 1990s
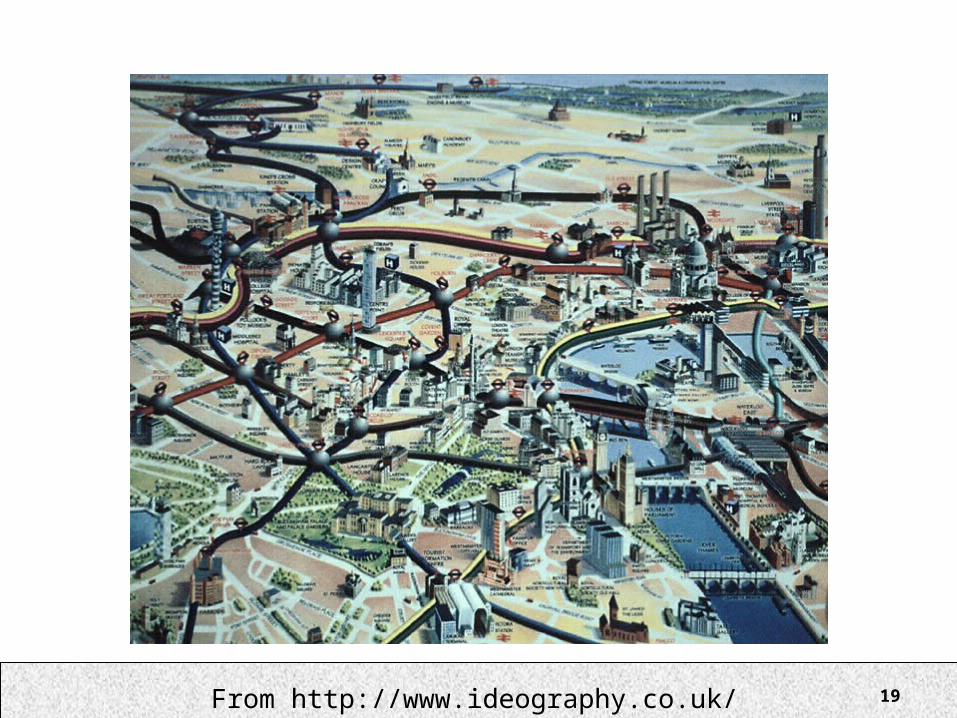
19From http://www.ideography.co.uk/
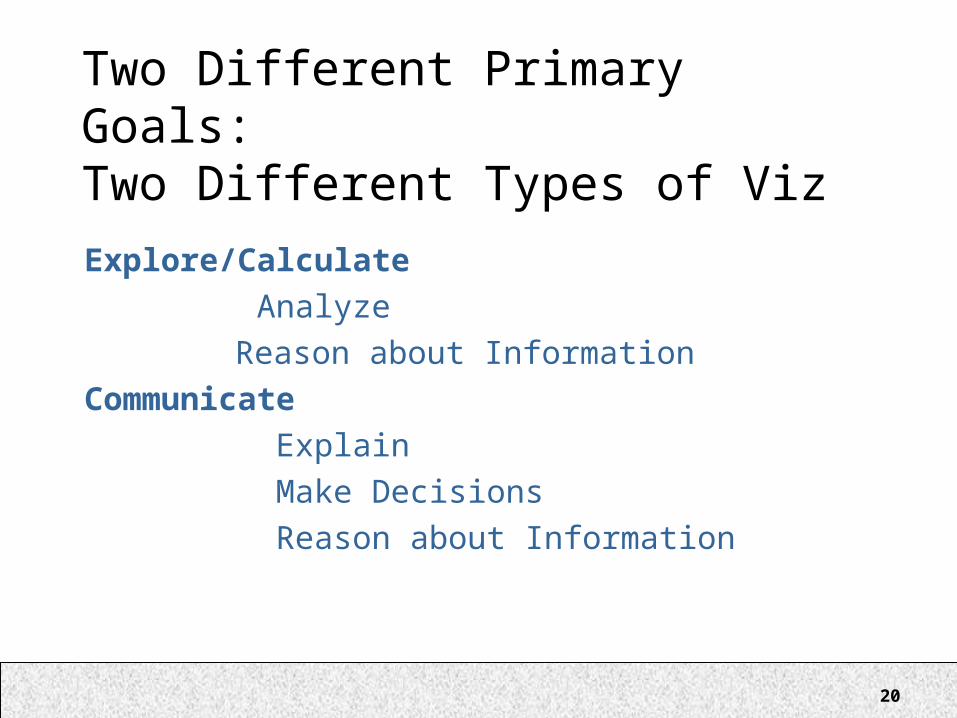
20
Two Different Primary Goals:Two Different Types of Viz
Explore/Calculate Analyze
Reason about Information Communicate Explain Make Decisions Reason about Information
21
Goals of Information Visualization
In more detail, visualization should:– Make large datasets coherent
(Present huge amounts of information compactly)
– Present information from various viewpoints – Present information at several levels of detail
(from overviews to fine structure)
– Support visual comparisons – Tell stories about the data
22
Human Perceptual FacilitiesUse the eye for pattern recognition; people are good at scanning recognizing remembering images
Graphical elements facilitate comparisons via length shape orientation texture
Animation shows changes across time Color helps make distinctions Aesthetics make the process appealing
23
The Need for Critical Analysis
• We see many creative ideas, but they often fail in practice
• The hard part: how to apply it judiciously– Inventors usually do not accurately predict how their invention will be used
• This course will emphasize – Getting past the coolness factor– Examining usability studies

24
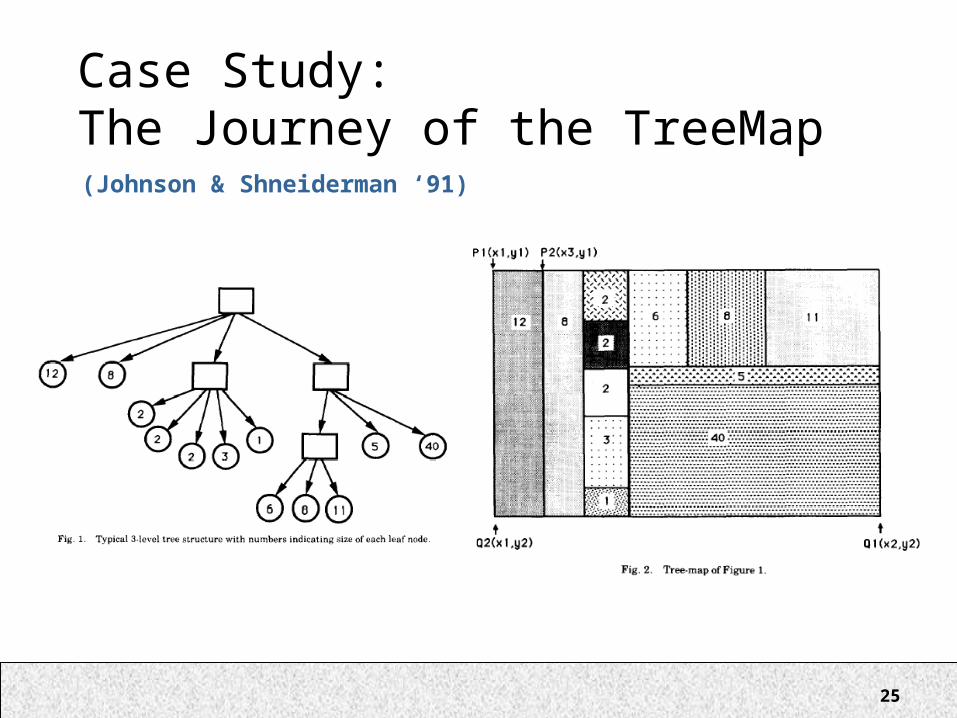
Case Study:The Journey of the TreeMap
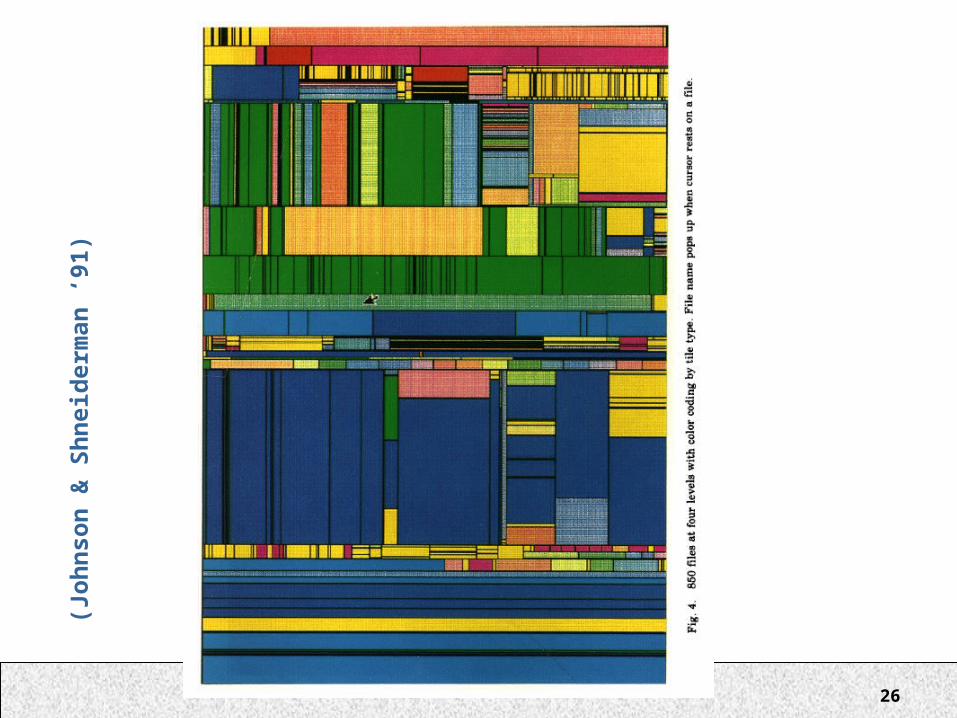
• The TreeMap (Johnson & Shneiderman ‘91)
• Idea: – Show a hierarchy as a 2D layout– Fill up the space with rectangles representing objects– Nested rectangles indicated levels of hierarchy– Size on screen indicates relative size of underlying
objects.
25
Case Study:The Journey of the TreeMap(Johnson & Shneiderman ‘91)
26
(Joh
nson
& S
hn
eid
erm
an
‘91)
27
Case Study:The Journey of the TreeMap
• The TreeMap (Johnson & Shneiderman ‘91)
• Idea: – Show a hierarchy as a 2D layout– Fill up the space with rectangles representing objects– Nested rectangles indicated levels of hierarchy– Size on screen indicates relative size of underlying
objects.
28
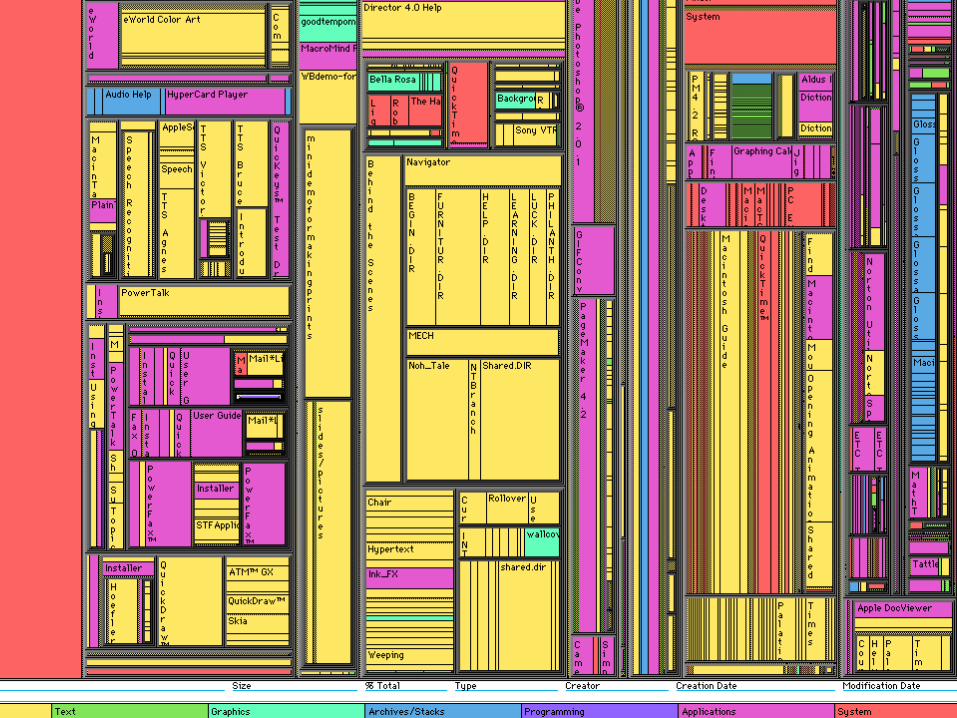
Early Treemap Applied to File System
29
Treemap Problems
• Too disorderly– What does adjacency mean?– Aspect ratios uncontrolled leads to lots of skinny boxes
that clutter
• Hard to understand– Must mentally convert nesting to hierarchy descent
• Color not used appropriately– In fact, is meaningless here
• Wrong application– Don’t need all this to just see the largest files in the OS
30
Successful Application of Treemaps
• Think more about the use– Break into meaningful groups
• Make appearance more usable– Fix these into a useful aspect ratio– Do not use nesting recursively
• Use visual properties properly– Use color to distinguish meaningfully
• Use only two colors: – Can then distinguish one thing from another
• When exact numbers aren’t very important
• Provide excellent interactivity – Access to the real data– Makes it into a useful tool

31
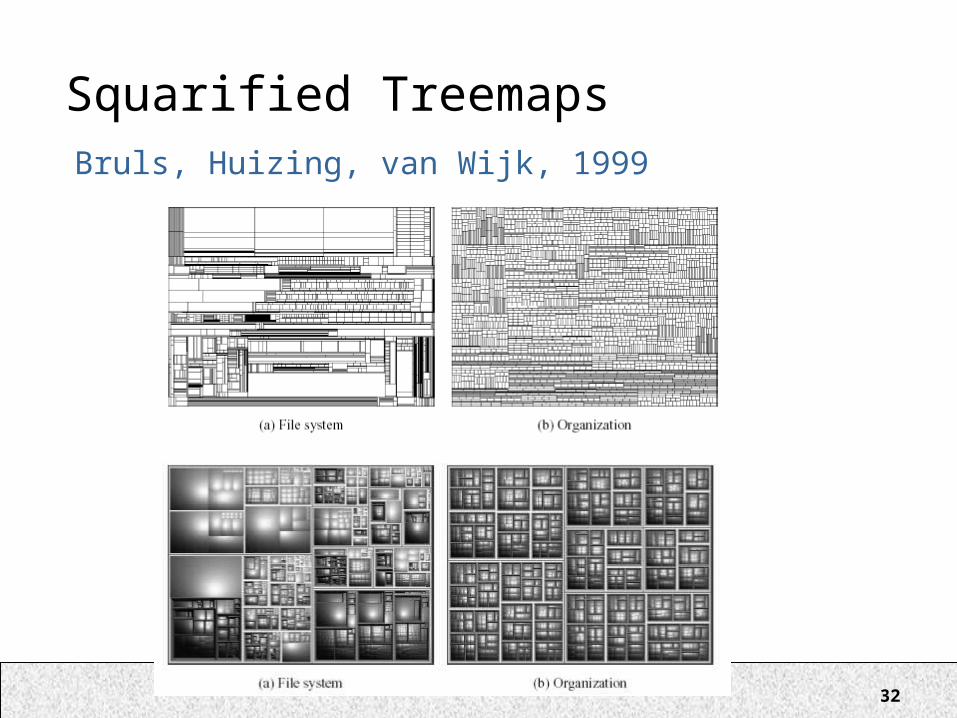
Squarified TreemapsBruls, Huizing, van Wijk, 1999
32
Squarified TreemapsBruls, Huizing, van Wijk, 1999
33
Improved, Usable TreeMaps
• Analysis:– http://www.smartmoney.com/maps
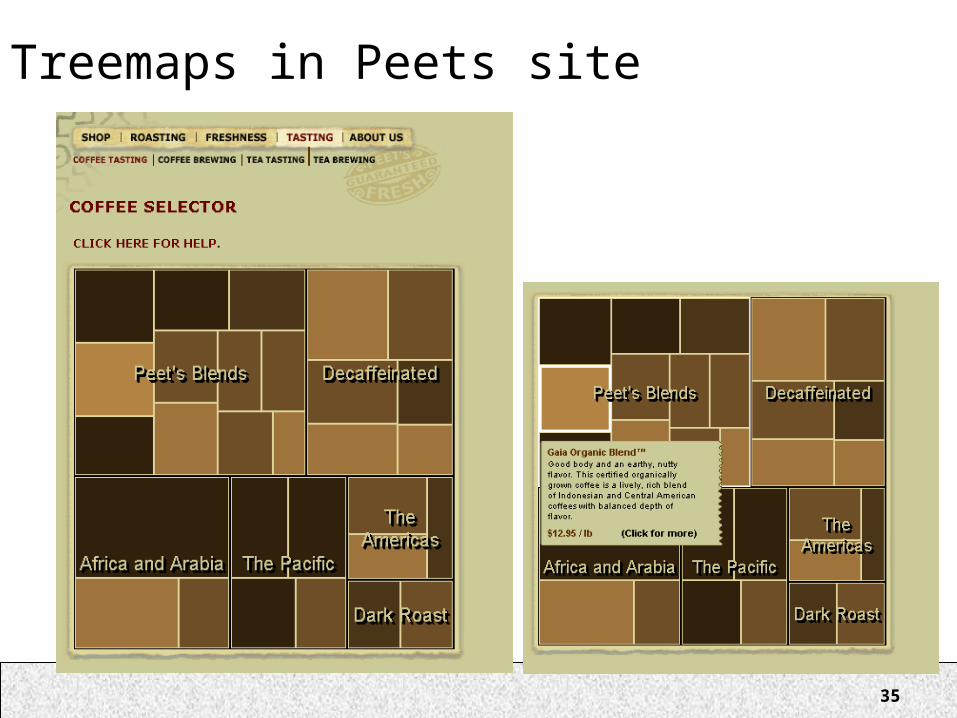
• Communication:– http://www.peets.com/selector_coffee/coffee_selector.asp
34
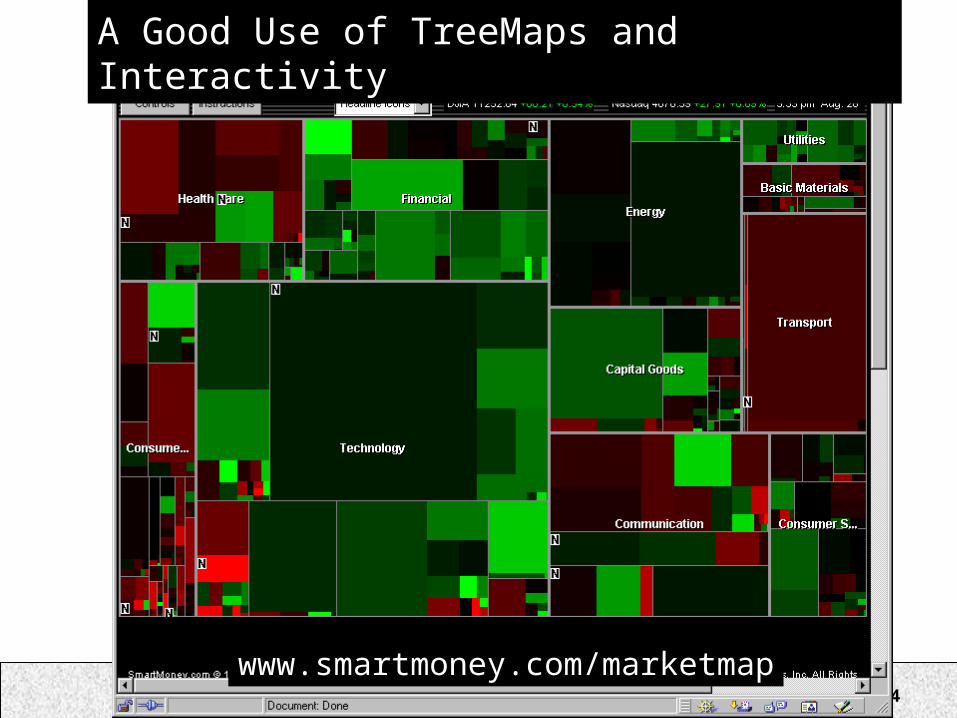
A Good Use of TreeMaps and Interactivity
www.smartmoney.com/marketmap
35
Treemaps in Peets site
36
Analysis vs. Communication
• MarketMap’s use of TreeMaps allows for sophisticated analysis
• Peets’ use of TreeMaps is more for presentation and communication
• This is a key contrast
37
Open Issues
• Does visualization help?– The jury is still out– Still supplemental at best for text collections
• A correlation with spatial ability• Learning effects: with practice ability on visual display
begins to equal that of text
• Does visualization sell?– Jury is still out on this one too!
• This is a hot area! More ideas will appear!
38
Course Outline
• Foundations• Visual Psychology • Data Graphics• Interactive Information Visualization• Visualizing Specific Data Types• Project Design Reviews• Visual Explorations• Evaluating and Automating Visualizations
39Slide adapted from Chris North's
What we will learn
• Design interactive visualizations• Critique existing designs• Empirically evaluate existing designs• An HCI-based focus
40
What we are not covering
• Scientific visualization • Statistics • Cartography (maps) • Education • Games • Computer graphics in general • Computational geometry
41
Mark Your Calendars
• Thursday Oct 12, 4-5:30pm– Martin Wattenberg; my guest as SIMS distinguished
speaker– Fantastic visualizations
• MarketMap• BabyNames• Many others that we’ll read about
– He may also give a lecture in our class
42
More Administrivia
• Join the email list: – Mail majordomo@sims– “subscribe infovis” in the BODY of the message
• Textbook:– Show Me the Numbers
43
Over the next few weeks …
• Bring an example of a use of visualization that clarifies, explains, or reveals useful information that was not otherwise evident. Write a paragraph saying how it uses visualization to do so.– Try not to do something really standard
• Financial line graphs• Musical notation• Straight-forward illustration
– Try to find a good example• Wired magazine has many bad examples
– Potential sources:• Web sites, popular science magazines, newspapers