1 taking development a bit further. 2 last week we started out with … development being defined as...
TRANSCRIPT

1
Taking Taking development a development a
bit furtherbit further

2
Last week we started out with …Last week we started out with …
Development being defined as the ‘process by which countries become richer’So 40 or so years ago, the statisticians started to measure the GDPThey thought that would tell all they needed to know!
3
Last week we started out with …Last week we started out with …
Then they got around to the idea that standard of living and quality of life came into it.What is the difference between those 2? What kind of things would you list under each one?Then we came to the idea that development is the improvements in standard of living and quality of life but that most of the indicators we could use to measure these depend directly or indirectly from a country becoming richer

4
But this is not completely trueBut this is not completely true
Quality of life is the general well-being of a person. It includes
the standard of life but also access to education and health care, availability of the utilities
i.e. electricity, water, rubbish collection,
but also political and religious freedom, social opportunities, environmental quality
Which of these do not depend on money?

5
However, what I However, what I left out last left out last
week …week …Was something that people have Was something that people have
only really begun to think only really begun to think seriously about in the last few seriously about in the last few
years.years.
What might that be? What might that be?
How will it affect development?How will it affect development?

6
So now we need a new So now we need a new definitiondefinition
"Sustainable development "Sustainable development is development that meets is development that meets the needs of the present the needs of the present
without compromising the without compromising the ability of future generations ability of future generations to meet their own needs."to meet their own needs."Anyone like to try and say
that more simply?

7
That quote came fromthe World Commission on Environment and Development’s (the Brundtland Commission) 1987Quite a long time ago, but no-one really took it seriously until quite recentlyIn mentions ‘needs of the present’‘What do you think these might be?
Whiteboard
8
What I was hoping might happen What I was hoping might happen ....
.. was that some of the needs might conflict with one anotherFor example clean air might conflict with wanting a car to driveWhich would you choose, and how would you make your decision? If within ourselves, we have conflicting needs, how much is that multiplied when we look at a whole community, city, country, world?For instance, what do you do when one country’s need for electricity results in acid rain that damages another country's lakes and rivers?

9
Look at the diagram of needs:Look at the diagram of needs:Social, economic and Social, economic and
environmentalenvironmentalCarrying capacity. The population that an area will support
without damaging the environment
Can anyone pick out a need in one
column that conflicts with a need in another
column?

10
Did you know?Did you know?
Life expectancy worldwide has risen on average by 4 months each year since 1970. Infant mortality rates fell from 80 per 1000 live births in 1980, to 54 per 1000 in 1998. Women tend to outlive men by 5 to 8 years in the countries with the highest life expectancies, but by only 0 to 3 years in countries where life expectancy is low.
Why do you think that is?

11
Life expectancy Life expectancy and sustainable and sustainable
developmentdevelopment

12
Life expectancy at birth is the average number of years a newborn infant would be expected to live if health and living conditions at the time of its birth remained the same throughout its life. It reflects the health of a country's people and the quality of care they receive when they are sick. Life expectancy is higher in high-income countries than in all but a few low- and middle-income countries.

13
What colour on the map represents countries with higher life expectancies? Where do these countries tend to be located? What colour represents countries with lowest life expectancies? Where do these countries tend to be located? What assumptions might you make about living conditions in the region with the lowest life expectancies

14
Now you will need to use the map Now you will need to use the map and the chartsand the charts
The countries are grouped together in the chart in alphabetical order – so Asia (south and east) and the Pacific comes before Europe and Central Asia, and is followed by Middle East and North Africa etc – which will come next? After that?

15
Using your world map to help, look at the Map and list five countries in which life expectancy at birth is less than 55 years, five in which it is between 55 and 64 years, five in which it is 65 to 69 years, and five in which it is 70 years or more.

16
Now turn to the EXCEL table I sent Now turn to the EXCEL table I sent youyou
1. Look at the Basic Data Tables, and find the economic group of each country on your list: low-income, middle-income, and high-income. 2. Use this information to make a general statement describing the relationship between life expectancy at birth and income level. 3. What assumptions can you make about living conditions in the countries in each category of life expectancy at birth? 4. Armenia (Life expectancy 74 with GDP per capita of $460) Sri Lanka (life expectancy 73 with GDP per capita of $810) – how do these not fit the pattern? Why?

17
This is a graph showing the changes in life expectancy at birth in 1965 and 1998Just looking at the graph for each, what was it in 1965, in 1998 and what is the difference?Who has made the most progress?

18
Between 1980 and 1998, the world's average life expectancy at birth rose from 61 to 67 years, with the most dramatic increases occurring in the low- and middle-income countries. This was because:
Increased access to nutritious food, primary health care--including safe water, sanitation, antibiotics and other medicines, and Immunizations-education
explain much of the difference.
It is important to note, however, that although the world's average life expectancy at birth was 67 years, individual countries can vary largely. For example, in Rwanda, life expectancy at birth in 1998 was 41 years, while in Japan it was 81 years.

19
But not all countries have experienced a rise in life expectancy at birth over the past two decades. Since 1980, seventeen countries-mostly in Sub-Saharan Africa and the former Soviet Union-have actually experienced a decline. In these nations, problems such as economic depression in the former Soviet Union and AIDS in Sub-Saharan Africa, have overcome the progress previously made in people's living conditions. In the Sub-Saharan country of Botswana, for example, where one out of every three adults is infected with HIV, the virus that causes AIDS, life expectancy at birth decreased by fifteen years between 1987 and 1998 after it had been rising steadily for more than thirty years.
20
Surviving Surviving ChildhoodChildhood
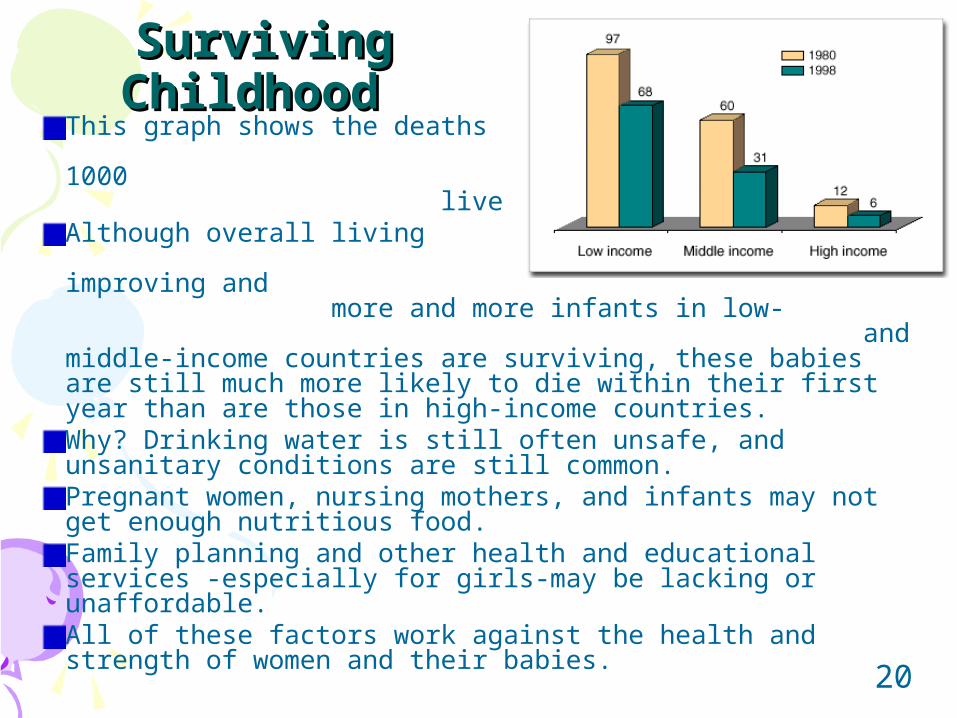
This graph shows the deaths before the age of 1 per 1000 live birthsAlthough overall living conditions are improving and more and more infants in low- and middle-income countries are surviving, these babies are still much more likely to die within their first year than are those in high-income countries. Why? Drinking water is still often unsafe, and unsanitary conditions are still common. Pregnant women, nursing mothers, and infants may not get enough nutritious food. Family planning and other health and educational services -especially for girls-may be lacking or unaffordable. All of these factors work against the health and strength of women and their babies.

21
Child mortalityChild mortalityChild mortality rates - the number of children who die between ages 1 and 5 per 1,000 children-are much higher for girls in some countries than for boys, even though when they are treated equally, more girls surviveFlu, pneumonia, and common diarrhoea cause many deaths; so do cholera and malaria. Children, especially those suffering from malnutrition, are most at risk. Many children are not immunized against deadly infectious diseases such as diphtheria, measles, polio, tetanus, typhoid, tuberculosis, and whooping cough. In some cultures where parents prefer sons over daughters, boys receive a larger share of the limited family resources. They get more food and better health care, including immunizations.

22
If more newborn babies livedIf more newborn babies lived
What might be the effect on each of the following? Give reasons for your responses. The number of productive adults in 15 or 20 years The attitudes of parents about having children School enrolment in five or six years The need for jobs in 15 or 20 years Attitudes toward family planning A family's educational costs A family's need for food A country's need for food

23
Living to Old AgeLiving to Old Age Children who live past their fifth birthday have a much greater chance of living to adulthood and old age because their bodies are stronger and better able to fight off the diseases.The longer a person lives, the greater his or her chances of reaching older ages. For example, someone who is 90 is much more likely to reach 100 than someone who is 50.Life-threatening events and personal habits reduce the chances of living a long, productive life. Some countries succeeded in improving the infant and under-5 mortality rates between 1980 and 1998 but still saw the life expectancy dropping, often due to HIV/AIDS and tuberculosis.

24
Life Expectancy, the Economy, Life Expectancy, the Economy, and the Environmentand the Environment
A primary goal for sustainable development is for people to live longer, more productive, more satisfying lives. This is impossible if they do not have the resources to ensure the health and well being of themselves and their families. Poverty has a major impact on life expectancy. When governments and families cannot afford enough quality health care, education, and nutritious food, people cannot reach their full potential, either in productivity or length and quality of life. In addition, extreme poverty increases the likelihood of war and political instability, which threatens lives--and the quality of life-- as well.

25
Life Expectancy, the Economy, Life Expectancy, the Economy, and the Environmentand the Environment
There are also close links between the environment and life expectancy since we depend on natural resources such as safe water, clean air, fertile soil, and fuel to sustain life. Lack of safe water is a major cause of illness and death in low- and middle-income countries, especially among children and the elderly. Polluted air from a variety of sources such as wood fires, industrial production, and car exhaust causes lung disease and associated illnesses. Areas with overworked or eroded soil may not be able to produce enough nutritious food to support growing populations. And lack of clean fuel for cooking, boiling water, or producing heat can seriously affect people's ability to thrive.

26
Strategies for Change: Affecting Life Strategies for Change: Affecting Life ExpectancyExpectancy
Experience has shown that campaigns teaching about the prevention of illness is one of the most effective and least expensive way to improve health. Uganda's AIDS Commission By the late 1990s, about 1/10 of Uganda’s 20.4 million people had died of AIDS, and 1.7 million children had lost their mothers or both parents to AIDS. In 1986 the government of Uganda created an AIDS Commission which ran an educational campaign to prevent and treat sexually transmitted diseases, distribute condoms and develop local centres for HIV counselling and testing. The Commission encouraged churches, unions, and businesses to carry out educational programs. By 1998, the adult rate of infection had fallen to 9.5 percent (less than half), a much lower rate than the other countries in Africa most affected by the AIDS epidemic.

27
Strategies for Change: Affecting Strategies for Change: Affecting Life ExpectancyLife Expectancy
At the same time, education is critical because these campaigns have the greatest impact when literacy and education are widespread. Also educated people are more likely to gain access to other key factors that help increase life expectancy such as safe water, sanitation, immunizations, medical care, and nutritious food. The education of women helps them to provide better care for their children and to pass on knowledge that will improve their children's lives. Educated women also tend to have smaller, healthier families.

28
Strategies for Change: Affecting Life Strategies for Change: Affecting Life ExpectancyExpectancy
Immunization against infectious diseases has done a lot to improve life expectancyCampaigns in the past 50 years successfully eliminated smallpox, and polio has disappeared in many areas. However, when countries relax immunization efforts or fail to immunize all children, infectious diseases remain a threat.As emerging diseases such as HIV/AIDS and tobacco-related illnesses take stronger holds in low- and middle-income countries, governments and communities are having to make difficult decisions about how to use their scarce resources. The price of medical research and care for the victims of these diseases is staggering even for wealthy countries. For many, the best option is to put their efforts into education and prevention.

29
HomeworkHomework
There is a case study about an infant feeding station in India, which demonstrates how local, not very expensive local projects can make things much better for everyone.There are a few questions at the end of it.