1 the global financial crisis and trans-siberian railway transportation hisako tsuji economic...
TRANSCRIPT

1
The Global Financial Crisis The Global Financial Crisis and Trans-Siberian Railway and Trans-Siberian Railway TransportationTransportation
Hisako TsujiHisako TsujiEconomic Research Institute for Northeast Asia (ERINA)Economic Research Institute for Northeast Asia (ERINA)
November, 2009November, 2009
禁無断転載禁無断転載© 2009 ERINA

22
ContentsContents Overview of the TSR TransportationOverview of the TSR Transportation
Route, performance and historyRoute, performance and history Business TrendsBusiness Trends in Past 10 yearsin Past 10 years
Reflecting booming Russian economyReflecting booming Russian economy Impact of the Global Financial Crisis: 2008~Impact of the Global Financial Crisis: 2008~
Decline of trade volumeDecline of trade volume A sharp decline of the Deep Sea rateA sharp decline of the Deep Sea rate
The “Watershed” ShiftsThe “Watershed” Shifts Analytical frameworkAnalytical framework Can TSR compete against the Deep Sea?Can TSR compete against the Deep Sea?
Issues and Opportunities of the TSR TransportationIssues and Opportunities of the TSR Transportation Issues: costs, customs clearanceIssues: costs, customs clearance Opportunities: finished carsOpportunities: finished cars

3

44
International Container Transport on the Trans-International Container Transport on the Trans-Siberian RailwaySiberian Railway International Multimodal Transport SystemInternational Multimodal Transport System
Marine transport + Russian ports + Russian railways + Marine transport + Russian ports + Russian railways + railways in various countriesrailways in various countries
Numerous players: forwarders are in charge of control and Numerous players: forwarders are in charge of control and combine various chargescombine various charges
Shorter distanceShorter distance compared to the Deep Sea route compared to the Deep Sea route Japan/ROK–Moscow: ½ of Deep Sea routeJapan/ROK–Moscow: ½ of Deep Sea route
Faster servicesFaster services using using block trains block trains Faster than the Deep Sea route for transport from Faster than the Deep Sea route for transport from
Japan/ROK to Finland, Eastern Europe and destinations in Japan/ROK to Finland, Eastern Europe and destinations in Russia/CISRussia/CIS
Japan/ROK–Moscow: 20–25 days by the TSR, 40–45 days Japan/ROK–Moscow: 20–25 days by the TSR, 40–45 days by the Deep Seaby the Deep Sea
Economic competitivenessEconomic competitiveness versus Deep Sea route versus Deep Sea route The ‘Watershed’ floatsThe ‘Watershed’ floats The Deep Sea rate fluctuates drasticallyThe Deep Sea rate fluctuates drastically Frequent rise of RZD rateFrequent rise of RZD rate

5
Maritime Transport to Russian PortsMaritime Transport to Russian PortsVostochny & Vladivostok PortsVostochny & Vladivostok PortsBusan is the de facto hub port of East Asia, and a fairly large volume of Busan is the de facto hub port of East Asia, and a fairly large volume of Japanese and Chinese containers are transshipped at BusanJapanese and Chinese containers are transshipped at Busan
Shippint Company
Ports of Call Ships/Week
Ships/Month
Maersk Line Busan 1 4
APL Busan 1 4
CMA-CGM Busan 1 4
FESCO & Hyundai (KSDL)
Busan, Ulsan 1 4
FESCO China Direct (FCDL)
Hong Kong, Shanghai, Ningbo, Qingdao, Tianjin, Yantian etc.
1 4
Sinokor Busan, Ulsan, Ningbo, Shanghai
1 4
CKL, PCL, KMTC Busan 1 4
FESCO & Mitsui O.S.K.
Kobe, Nagoya, Yokohama, Toyama, Moji, Niigata
1/2 2
66
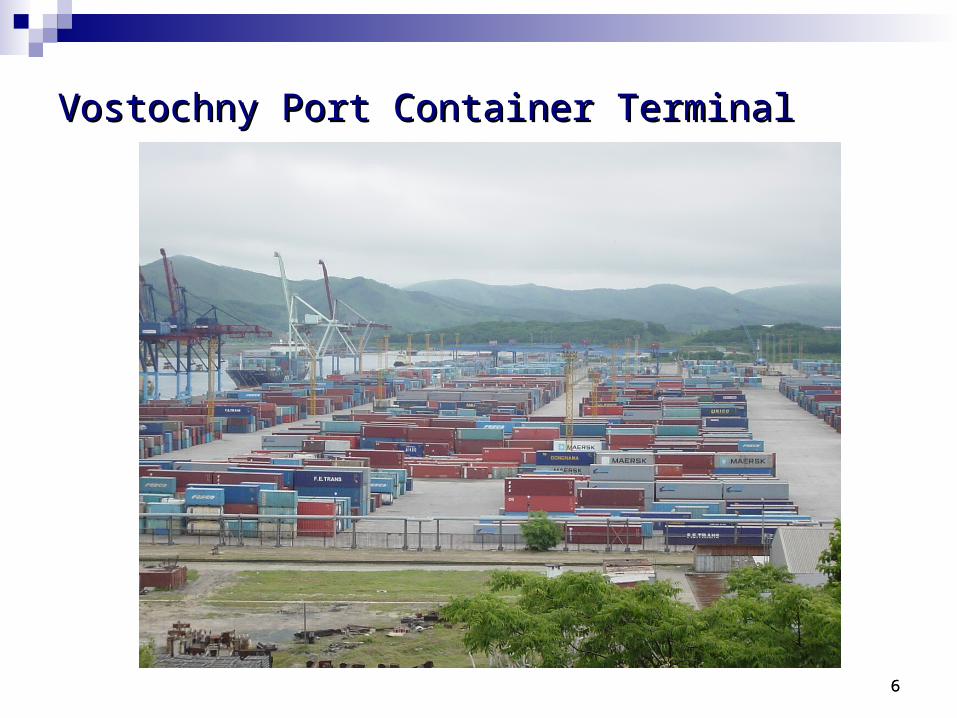
Vostochny Port Container TerminalVostochny Port Container Terminal
7
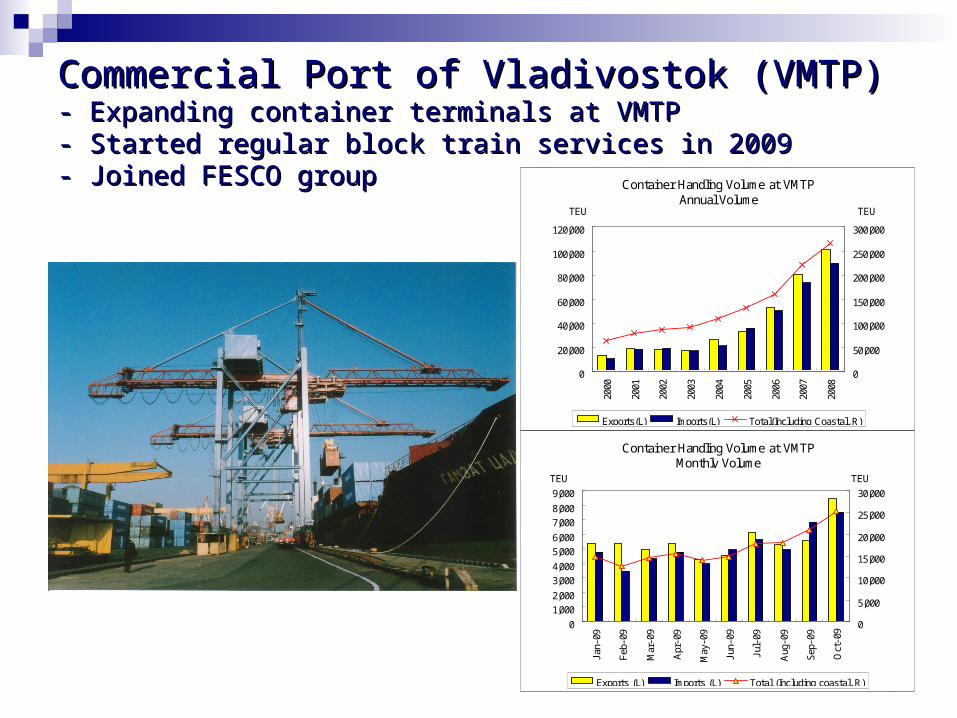
Commercial Port of Vladivostok (VMTP)Commercial Port of Vladivostok (VMTP)- Expanding container terminals at VMTP- Expanding container terminals at VMTP- Started regular block train services in 2009- Started regular block train services in 2009- Joined FESCO group- Joined FESCO group Container Handling Volume at VMTP
Annual Volume
0
20,000
40,000
60,000
80,000
100,000
120,000
2000
2001
2002
2003
2004
2005
2006
2007
2008
TEU
0
50,000
100,000
150,000
200,000
250,000
300,000
TEU
Exports(L) Imports(L) Total(Including Coastal, R)
Container Handling Volume at VMTPMonthly Volume
0
1,0002,000
3,0004,000
5,0006,000
7,0008,000
9,000
Jan
-09
Feb
-09
Mar
-09
Apr
-09
May
-09
Jun
-09
Jul
-09
Aug
-09
Sep
-09
Oct
-09
TEU
0
5,000
10,000
15,000
20,000
25,000
30,000
TEU
Exports (L) Imports (L) Total (Including coastal, R)

88
Rail TransportRail Transport
Block TrainsBlock Trains Composition: 100–150TEUComposition: 100–150TEU
80ft wagons (40ft containers x 2) x 38 = 152TEU80ft wagons (40ft containers x 2) x 38 = 152TEU Length: Max. 1,000mLength: Max. 1,000m Transit times: 11 days to Moscow from Vostochny/VladivostokTransit times: 11 days to Moscow from Vostochny/Vladivostok Major operators: Major operators:
TransContainer, Russkaya Troyka, F.E. Trans, DVTGTransContainer, Russkaya Troyka, F.E. Trans, DVTG Major routes from Vostochny/Vladivostok Major routes from Vostochny/Vladivostok
Moscow, Taganrog (Hyundai), Izhevsk (Kia), Uzbekistan (GM Moscow, Taganrog (Hyundai), Izhevsk (Kia), Uzbekistan (GM Daewoo), Yelabuga (Isuzu)Daewoo), Yelabuga (Isuzu)
Other routes:Other routes: China-Moscow, Germany-Moscow, Baltic ports-Kazakhstan, Czech-China-Moscow, Germany-Moscow, Baltic ports-Kazakhstan, Czech-
Kaluga etc.Kaluga etc.
Ordinary Trains for small-lot cargoesOrdinary Trains for small-lot cargoes Tracing information can be obtained on a daily basisTracing information can be obtained on a daily basis
99
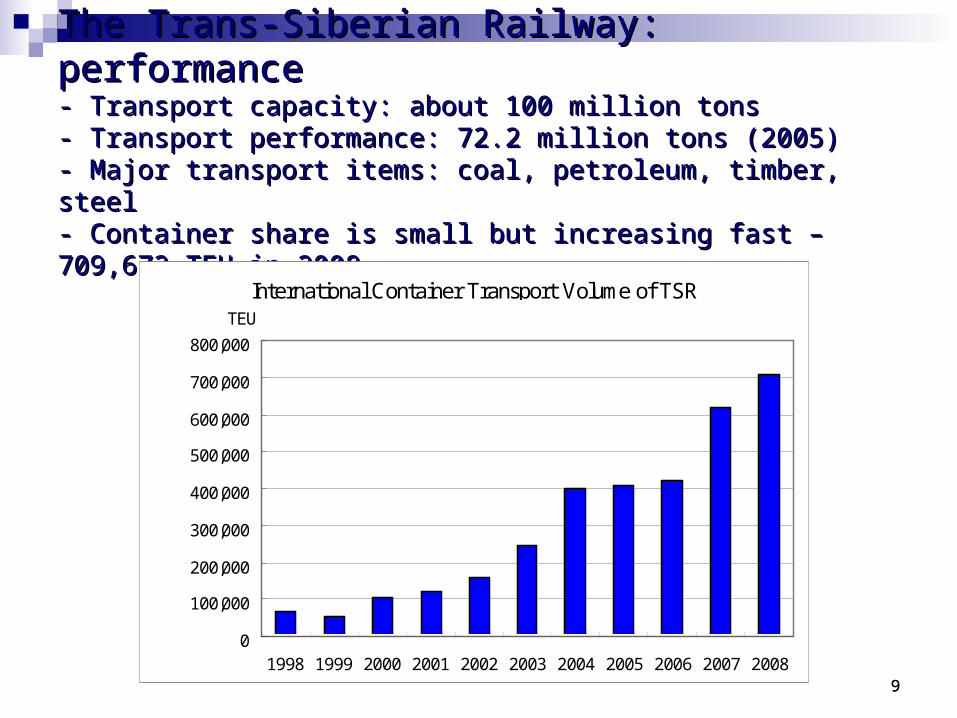
The Trans-Siberian Railway: performanceThe Trans-Siberian Railway: performance- Transport capacity: about 100 million tons- Transport capacity: about 100 million tons- Transport performance: 72.2 million tons (2005)- Transport performance: 72.2 million tons (2005)- Major transport items: coal, petroleum, timber, steel- Major transport items: coal, petroleum, timber, steel- Container share is small but increasing fast – 709,672 TEU in 2008- Container share is small but increasing fast – 709,672 TEU in 2008
International Container Transport Volume of TSR
0
100,000
200,000
300,000
400,000
500,000
600,000
700,000
800,000
1998 1999 2000 2001 2002 2003 2004 2005 2006 2007 2008
TEU
1010
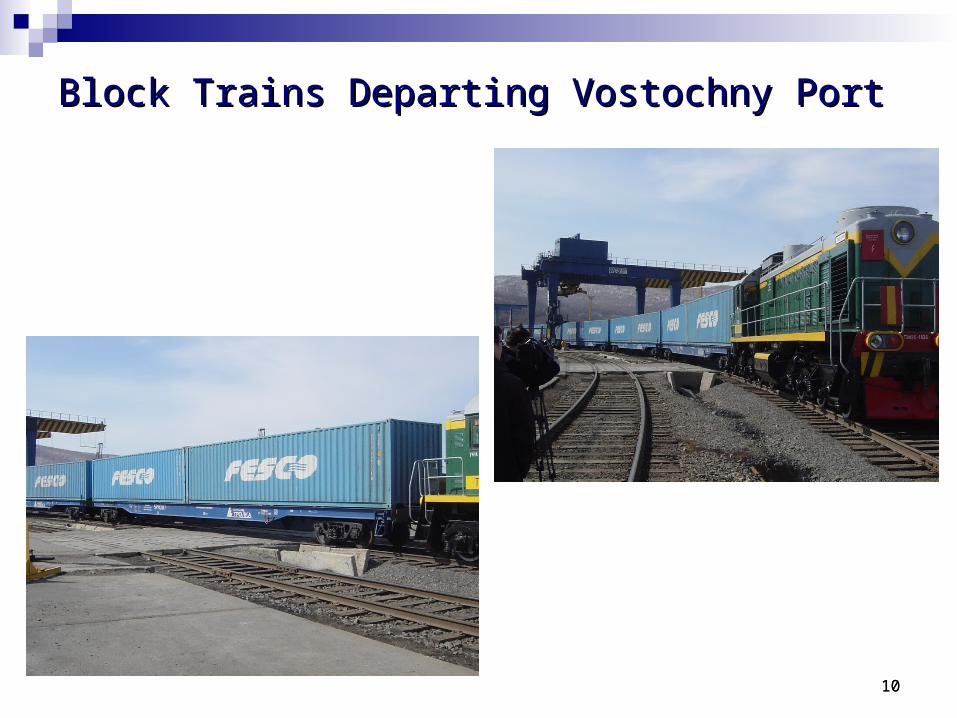
Block Trains Departing Vostochny PortBlock Trains Departing Vostochny Port

1111
The Four Periods in the History of TSR The Four Periods in the History of TSR International Container Transport: (1) & (2)International Container Transport: (1) & (2)
(1) (1) Land Bridge era: 1970s–1980sLand Bridge era: 1970s–1980s Transit cargo from Japan to Europe and the Middle East, Transit cargo from Japan to Europe and the Middle East,
established in 1971established in 1971 Soviet Union set low transit charges in order to secure foreign Soviet Union set low transit charges in order to secure foreign
currency; about 30% lower than the Deep Seacurrency; about 30% lower than the Deep Sea Benefited from the unstable political situation in the Middle EastBenefited from the unstable political situation in the Middle East 1983: Container volume reached 110,683 TEU (filled only) 1983: Container volume reached 110,683 TEU (filled only)
(2) (2) Period of chaos: 1990sPeriod of chaos: 1990s Service deteriorated after the collapse of the Soviet UnionService deteriorated after the collapse of the Soviet Union The route lost its economic competitiveness versus the Deep The route lost its economic competitiveness versus the Deep
Sea routeSea route The Deep Sea rate decreased due to technological progress and The Deep Sea rate decreased due to technological progress and
market competitionmarket competition

1212
Transit Cargo Originating in or Destined for Japan: Transit Cargo Originating in or Destined for Japan:
1971–2006 (filled containers only, data from TSIOAJ)1971–2006 (filled containers only, data from TSIOAJ)
0
20,000
40,000
60,000
80,000
100,000
120,000
1971 72 73 74 75 76 77 78 79 80 81 82 83 84 85 86 87 88 89 90 91 92 93 94 95 96 97 98 99
2000
2001
2002
2003
2004
2005
2006
WestboundEastboundTotal

1313
The Four Periods in the History of TSR The Four Periods in the History of TSR International Container Transport: (3) & (4)International Container Transport: (3) & (4)
(3) (3) Recovery period: From 2000 - 2005Recovery period: From 2000 - 2005 Booming Russian economy and active demand for importsBooming Russian economy and active demand for imports Growth due to increase in export cargo shipped directly or via Growth due to increase in export cargo shipped directly or via
Finland transit from the ROK and China to RussiaFinland transit from the ROK and China to Russia Electrical appliances, consumer goods, automobilesElectrical appliances, consumer goods, automobiles
Improvement in rail servicesImprovement in rail services Congestion on competing routesCongestion on competing routes
(4) (4) From transit to Russian import/export: 2006 - 2008From transit to Russian import/export: 2006 - 2008 Sharp decline in Finland transit cargo due to the abolition of Sharp decline in Finland transit cargo due to the abolition of
preferential charges for transit cargo preferential charges for transit cargo switching to the Deep Sea route for transport to Finland, or being switching to the Deep Sea route for transport to Finland, or being
exported directly to Russiaexported directly to Russia Local production in Russia by automobile manufacturers from Local production in Russia by automobile manufacturers from
the ROK & Japan is accelerating → the TSR route is used for the ROK & Japan is accelerating → the TSR route is used for shipments of production partsshipments of production parts

14
Container Throughput at Vostochny PortContainer Throughput at Vostochny Port- Including coastal and empty containers- Including coastal and empty containers- 400,724 TEU in 2008- 400,724 TEU in 2008
0
50,000
100,000
150,000
200,000
250,000
300,000
350,000
400,000
450,00019
93
1994
1995
1996
1997
1998
1999
2000
2001
2002
2003
2004
2005
2006
2007
2008
TEU
-30
-20
-10
0
10
20
30
40
50
60%
TEU% Grouth

1515
Volume of International Containers Handled at Vostochny Volume of International Containers Handled at Vostochny
PortPort - - About 30 About 30 % % of total were empty containersof total were empty containers
0
50,000
100,000
150,000
200,000
250,000
300,00019
93
1994
1995
1996
1997
1998
1999
2000
2001
2002
2003
2004
2005
2006
2007
2008
TEU
0
5
10
15
20
25
30
35
40%
FilledEmpty%-Empty

1616
TSR Cargo Volume by Direction TSR Cargo Volume by Direction - Vostochny Port, filled - Vostochny Port, filled containers onlycontainers onlyWB:EB = 85:15 (2008)WB:EB = 85:15 (2008)
0
50,000
100,000
150,000
200,000
250,00019
93
1994
1995
1996
1997
1998
1999
2000
2001
2002
2003
2004
2005
2006
2007
2008
TEU
0
10
20
30
40
50
60
70
80
90
100%
WBEB%-WB

1717
TSR Container Volume Handled at Vostochny Port by TSR Container Volume Handled at Vostochny Port by Country Country ROK: China: Japan = 66: 31: 3ROK: China: Japan = 66: 31: 3 (2008)(2008)Filled containers only. Not including int’l transshipment at Busan.Filled containers only. Not including int’l transshipment at Busan.
0
20,000
40,000
60,000
80,000
100,000
120,000
140,000
160,000
180,000
1999 2000 2001 2002 2003 2004 2005 2006 2007 2008
TEU
ROKChinaJ apan

1818
Rapidly Growing Russian Import and Diminishing Transit Rapidly Growing Russian Import and Diminishing Transit
CargoCargo (Vostochny Port, Filled containers only)(Vostochny Port, Filled containers only)
0
50,000
100,000
150,000
200,000
250,000
1993
1994
1995
1996
1997
1998
1999
2000
2001
2002
2003
2004
2005
2006
2007
2008
TEU
TransitImportExportCentral Asia

1919
Reasons for theReasons for the Revival of the TSR Route: From Revival of the TSR Route: From 2000 - 20082000 - 2008
Booming Russian economy, generating active demand Booming Russian economy, generating active demand for importsfor imports
ROK cargo played a key roleROK cargo played a key role Household electrical appliances and automobile parts destined Household electrical appliances and automobile parts destined
for Russiafor Russia Export of production components resulting from direct Export of production components resulting from direct
investment in Russia and the CIS – ‘Project Cargo’investment in Russia and the CIS – ‘Project Cargo’ Hyundai, Kia, Daewoo, LG, Samsung etc.Hyundai, Kia, Daewoo, LG, Samsung etc.
Surge in Chinese cargoSurge in Chinese cargo Exports of Chinese-made consumer goods to RussiaExports of Chinese-made consumer goods to Russia
Congestion and high cost on competing routesCongestion and high cost on competing routes Crowded St. Petersburg Port and Finnish routeCrowded St. Petersburg Port and Finnish route
The improvement of block train servicesThe improvement of block train services

2020
Booming Russian EconomyBooming Russian Economy- Growing Russian trade with Japan & the ROK- Growing Russian trade with Japan & the ROK
Major Economic Indicators of Russia
- 50
- 40
- 30
- 20
- 10
0
10
20
30
1990
1991
1992
1993
1994
1995
1996
1997
1998
1999
2000
2001
2002
2003
2004
2005
2006
2007
2008
%
% GDP Growth
% Investment Growth
International Trade of Russia
050,000
100,000150,000200,000250,000300,000350,000400,000450,000500,000
1994
1995
1996
1997
1998
1999
2000
2001
2002
2003
2004
2005
2006
2007
2008
$ Million
ExportsImports
ROK- Russia Trade
-2,000
0
2,000
4,000
6,000
8,000
10,000
12,000
1998 1999 2000 2001 2002 2003 2004 2005 2006 2007 2008
$ Million
ROK'sExportsROK's ImportsBalance
J apan- Russia Trade
0
2,000
4,000
6,000
8,000
10,000
12,000
14,000
16,000
18,000
1998 1999 2000 2001 2002 2003 2004 2005 2006 2007 2008
$ Million
J apan's ExportsJ apan's Imports
21
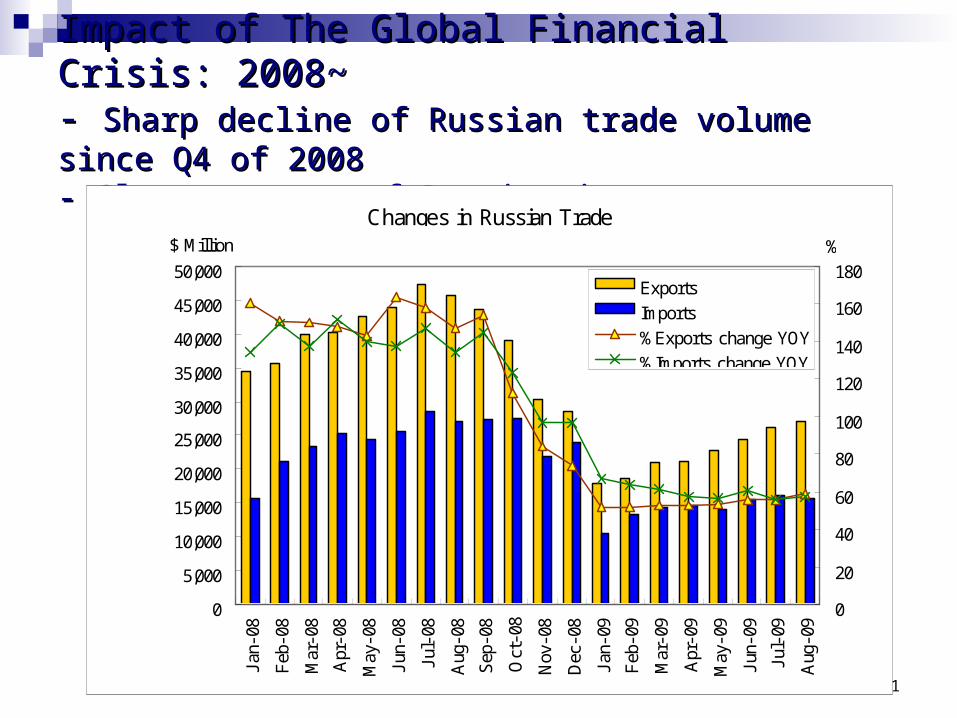
Impact of The Global Financial Crisis: 2008~Impact of The Global Financial Crisis: 2008~- - Sharp decline of Russian trade volume since Q4 of 2008Sharp decline of Russian trade volume since Q4 of 2008- Slow recovery of Russian imports- Slow recovery of Russian imports
Changes in Russian Trade
0
5,000
10,000
15,000
20,000
25,000
30,000
35,000
40,000
45,000
50,000Jan
-08
Feb
-08
Mar
-08
Apr
-08
May
-08
Jun
-08
Jul
-08
Aug
-08
Sep
-08
Oct
-08
Nov
-08
Dec
-08
Jan
-09
Feb
-09
Mar
-09
Apr
-09
May
-09
Jun
-09
Jul
-09
Aug
-09
$ Million
0
20
40
60
80
100
120
140
160
180%
ExportsImports% Exports change YOY% Imports change YOY
22
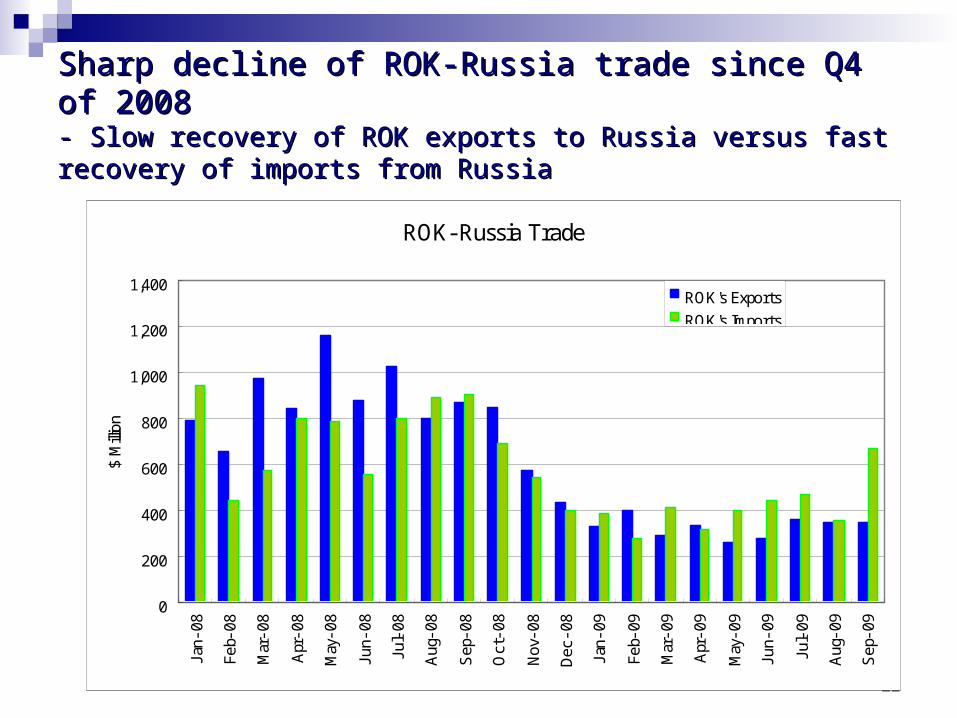
Sharp decline of ROK-Russia trade since Q4 of 2008Sharp decline of ROK-Russia trade since Q4 of 2008- Slow recovery of ROK exports to Russia versus fast recovery of - Slow recovery of ROK exports to Russia versus fast recovery of imports from Russiaimports from Russia
ROK-Russia Trade
0
200
400
600
800
1,000
1,200
1,400
Jan-
08
Feb-
08
Mar
-08
Apr
-08
May
-08
Jun-
08
Jul-
08
Aug
-08
Sep
-08
Oct
-08
Nov
-08
Dec
-08
Jan-
09
Feb-
09
Mar
-09
Apr
-09
May
-09
Jun-
09
Jul-
09
Aug
-09
Sep
-09
$ M
illion
ROK's ExportsROK's Imports
23
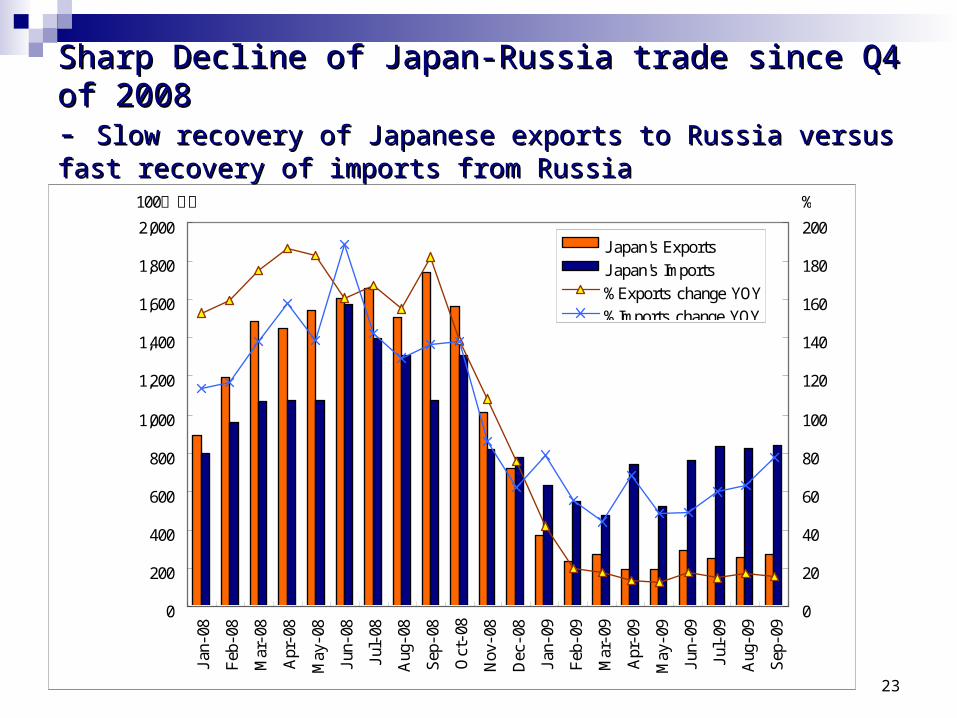
Sharp Decline of Japan-Russia trade since Q4 of 2008Sharp Decline of Japan-Russia trade since Q4 of 2008- - Slow recovery of Japanese exports to Russia versus fast recovery of Slow recovery of Japanese exports to Russia versus fast recovery of imports from Russiaimports from Russia
0
200
400
600
800
1,000
1,200
1,400
1,600
1,800
2,000
Jan
-08
Feb
-08
Mar
-08
Apr
-08
May
-08
Jun
-08
Jul
-08
Aug
-08
Sep
-08
Oct
-08
Nov
-08
Dec
-08
Jan
-09
Feb
-09
Mar
-09
Apr
-09
May
-09
Jun
-09
Jul
-09
Aug
-09
Sep
-09
100万ドル
0
20
40
60
80
100
120
140
160
180
200
%
J apan's ExportsJ apan's Imports% Exports change YOY% Imports change YOY

24
Impact of The World Financial Crisis: 2008~Impact of The World Financial Crisis: 2008~- Contraction of Japan-Russia Trade: 1H of 2009 vs. 2008- Contraction of Japan-Russia Trade: 1H of 2009 vs. 2008
J apan's Exports to Russia
0
1,000,000
2,000,000
3,000,000
4,000,000
5,000,000
6,000,000
7,000,000
8,000,000
9,000,000
2008(1- 6) 2009(1- 6)
$1,
000
Others
Rubber
Metals
Machinery
ElectricalequipmentTransportequipment
J apan's Imports from Russia
0
1,000,000
2,000,000
3,000,000
4,000,000
5,000,000
6,000,000
7,000,000
2008(1-6) 2009(1-6)
$1,0
00
OthersTimberFoodsMetalsCoalOil & gas
Exports to RussiaExports to Russia Total: -81.1%Total: -81.1% Cars: -88.7%Cars: -88.7% Machinery: -61.0%Machinery: -61.0%
Imports from RussiaImports from Russia Total: -43.6%Total: -43.6% Oil & gas: -41.7%Oil & gas: -41.7% Coal: -6.7%Coal: -6.7% Metals: -73.2%Metals: -73.2%

25
TSR route lost economic competitiveness under TSR route lost economic competitiveness under the World Financial Crisisthe World Financial Crisis- Sharp decline of the Deep Sea rate from summer 2008- Sharp decline of the Deep Sea rate from summer 2008- Frequent rises in rail charges up to 2008- Frequent rises in rail charges up to 2008
J apan-Moscow
0
2,000
4,000
6,000
8,000
10,000
12,000
2007- Oct. 2008- Oct.
$/40
'
TSR Deep Sea
J apan-St. Petersburg
0
2,000
4,000
6,000
8,000
10,000
12,000
2007- 0ct. 2008- Oct.
$/40
'
TSR Deep Sea

26
Sharp Decline of the TSR Container VolumeSharp Decline of the TSR Container Volume- Russian imports and ROK cargo declined severely in 2009- Russian imports and ROK cargo declined severely in 2009- ROK ‘project cargo’ has shifted to Deep Sea route- ROK ‘project cargo’ has shifted to Deep Sea route
Container Throughput at Vostochny Port
-
5,000
10,000
15,000
20,000
25,000
30,000
35,000
40,000
45,000
Jan-
08Fe
b-08
Mar
-08
Apr-
08M
ay-0
8Ju
n-08
Jul-
08Au
g-08
Sep-
08O
ct-0
8No
v-08
Dec-
08Ja
n-09
Feb-
09M
ar-0
9
TEU
0
20
40
60
80
100
120
140% Y0Y
TEU% YoY
Jan.-Aug. (2009 vs.2008) %
TSR Containers ▲37
International containers ▲63
Russian Imports ▲71
Russian Exports ▲51
Russia - China ▲45
Russia - ROK ▲76
Russia - Japan ▲37

27
Recent Trends in TSR vs. Deep Sea ChargesRecent Trends in TSR vs. Deep Sea Charges- Deep Sea charges declined until summer of 2009, followed by a - Deep Sea charges declined until summer of 2009, followed by a recovery in the Fall of 2009recovery in the Fall of 2009- TSR charges decreased slightly- TSR charges decreased slightly- The gap is narrowing as the economy recovers- The gap is narrowing as the economy recovers
Shanghai - Moscow
0
1,000
2,000
3,000
4,000
5,000
6,000
7,000
Feb-
09
Mar
-09
Apr
-09
May
-09
Jun-
09
Jul-
09
Aug
-09
Sep
-09
Oct
-09
$/ 40'
TSRDeep Sea

28
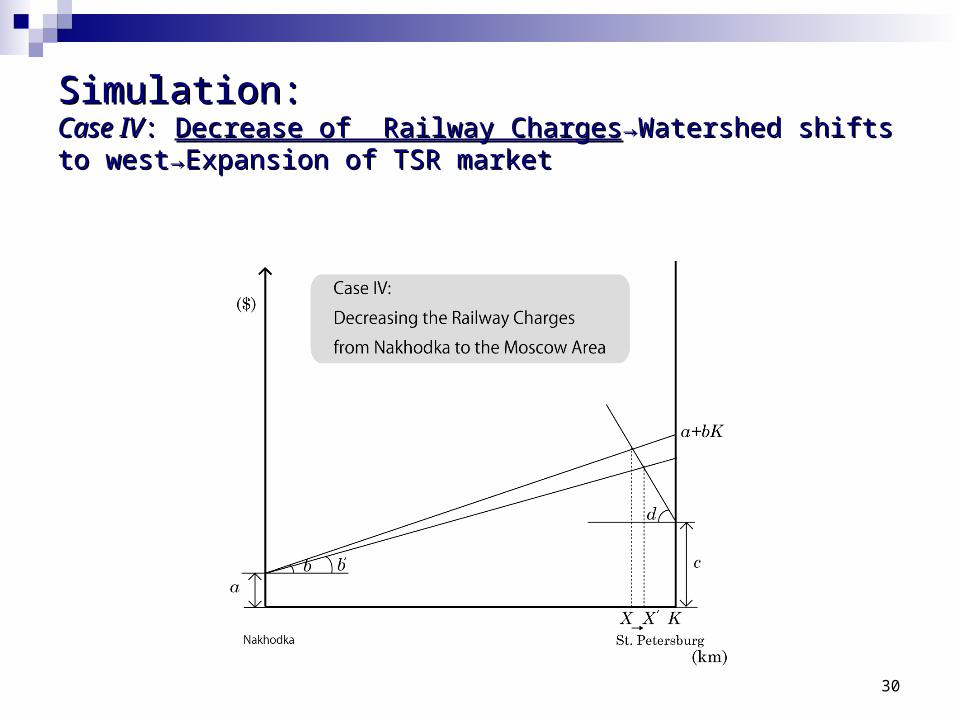
‘‘Watershed’Watershed’ : : “Where entering from the east (by TSR) and from “Where entering from the east (by TSR) and from the west (by Deep Sea) compete on an equal footing” in transporting the west (by Deep Sea) compete on an equal footing” in transporting from Japan to Russia – ‘X’ in the diagramfrom Japan to Russia – ‘X’ in the diagram
a a =Maritime freight =Maritime freight charges from Japan to charges from Japan to NakhodkaNakhodka
b b =Railway fees/km=Railway fees/km
c c =Maritime freight charges =Maritime freight charges from Japan to St. from Japan to St. PetersburgPetersburg
d d =The truck haulage fees =The truck haulage fees from St. Petersburg to from St. Petersburg to destinationdestination
K K =The distance from =The distance from Nakhodka to St. Nakhodka to St. PetersburgPetersburg
29
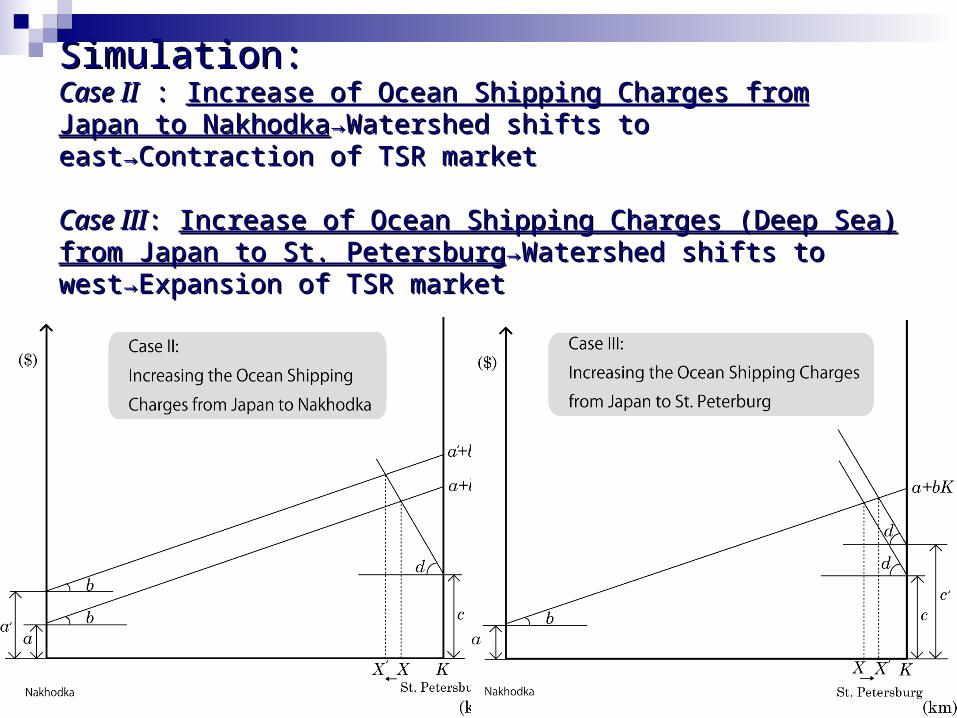
Simulation:Simulation: Case IICase II : : Increase of Ocean Shipping Charges from Japan to NakhodkaIncrease of Ocean Shipping Charges from Japan to Nakhodka→→Watershed shifts to eastWatershed shifts to east→→Contraction of TSR marketContraction of TSR market
Case IIICase III: : Increase of Ocean Shipping Charges (Deep Sea) from Japan Increase of Ocean Shipping Charges (Deep Sea) from Japan to St. Petersburgto St. Petersburg→→Watershed shifts to westWatershed shifts to west→→Expansion of TSR Expansion of TSR marketmarket
30
Simulation:Simulation:Case IVCase IV: : Decrease of Railway ChargesDecrease of Railway Charges→→Watershed shifts to Watershed shifts to westwest→→Expansion of TSR marketExpansion of TSR market

31
Summary of the ‘Watershed’ analysisSummary of the ‘Watershed’ analysis
Deep Sea rate is determined in the global marketDeep Sea rate is determined in the global market UncontrollableUncontrollable High under aHigh under a booming economy, low under recessionbooming economy, low under recession Fluctuate sharply – bigger shifts than rail chargesFluctuate sharply – bigger shifts than rail charges
Moscow is the main destination of the East Asian cargoMoscow is the main destination of the East Asian cargo TSR transportation is competitive only when the TSR TSR transportation is competitive only when the TSR
rate is equal or lower than the Deep Sea raterate is equal or lower than the Deep Sea rate When ‘Watershed’ is located in the west of Moscow regionWhen ‘Watershed’ is located in the west of Moscow region East Asian cargo owners are sensitive to costEast Asian cargo owners are sensitive to cost
Required tariff setting for maintaining competitivenessRequired tariff setting for maintaining competitiveness Flexible tariff policyFlexible tariff policy Cooperation of Cooperation of railrail, , seasea and and portport segments of TSR transportation segments of TSR transportation Quick action to meet a quick change of the Deep Sea rateQuick action to meet a quick change of the Deep Sea rate
3232
Issues and Recommendations Concerning the Issues and Recommendations Concerning the TSR RouteTSR Route Price competitiveness – The “Watershed” floatsPrice competitiveness – The “Watershed” floats
A flexible tariff policy is required to compete against the Deep Sea rate A flexible tariff policy is required to compete against the Deep Sea rate under various economic conditionsunder various economic conditions
A close cooperation is necessary among A close cooperation is necessary among railrail, , seasea and and portport segments segments
Seamless service Seamless service Time consuming Time consuming customs clearancescustoms clearances at Far Eastern ports at Far Eastern ports Desired to introduce an electronic documentation systemDesired to introduce an electronic documentation system Frequent feeder services are desirable between Japanese and Russian Frequent feeder services are desirable between Japanese and Russian
ports – only 2 services per month!ports – only 2 services per month!
InfrastructureInfrastructure Port facilitiesPort facilities Wagon and container supplyWagon and container supply
33
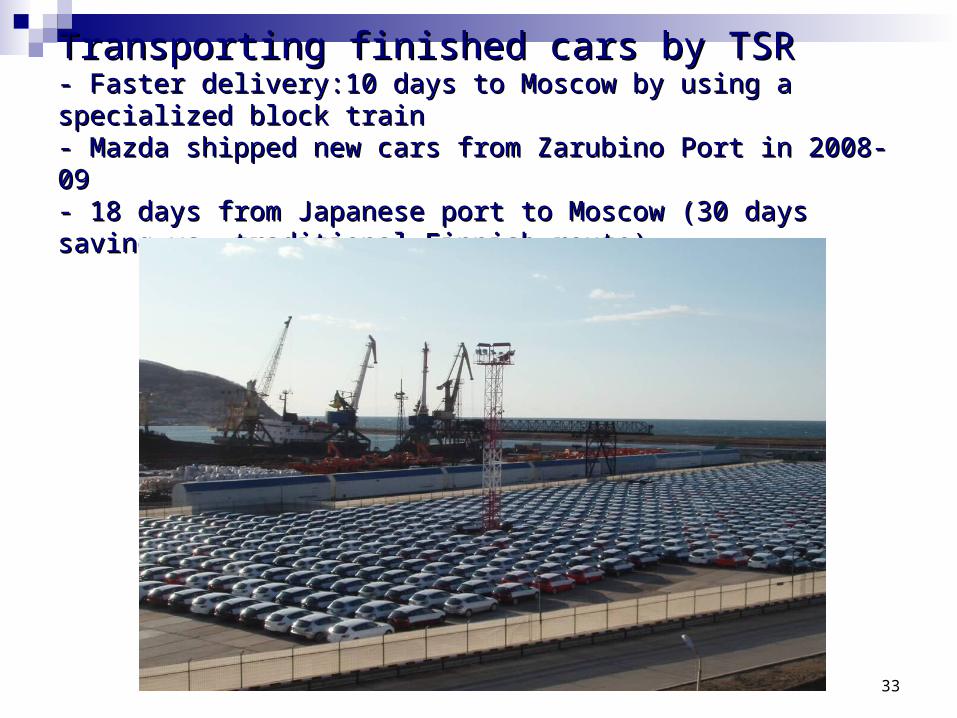
Transporting finished cars by TSRTransporting finished cars by TSR- Faster delivery:10 days to Moscow by using a specialized block train- Faster delivery:10 days to Moscow by using a specialized block train- Mazda shipped new cars from Zarubino Port in 2008-09- Mazda shipped new cars from Zarubino Port in 2008-09- 18 days from Japanese port to Moscow (30 days saving vs. traditional - 18 days from Japanese port to Moscow (30 days saving vs. traditional Finnish route)Finnish route)