1 transcript modeling brent lab. 2 overview of entertainment gene prediction jeltje van baren ...
TRANSCRIPT

1
Transcript modeling
Brent lab

2
Overview Of Entertainment
Gene prediction Jeltje van Baren
Improving gene prediction with tiling arrays Aaron Tenney
Validating predicted genes Laura Langton

3
How gene finders work in 3 easy steps
A computational gene finder annotates a sequence by:
1. Identifying valid gene predictions2. Assigning a probability to each gene
prediction3. Selecting the gene prediction with the
highest probability

4
TGTCCATGACCGGAGTCTACAGTTAAACGGAGTATGATGTCATTACTAGTACCATCAGGATCGTCAATACCTACAGATTACCTAATACC
Defining valid gene predictions
Start codon Stop codon
Canonical splice sites
No in-frame stops
5
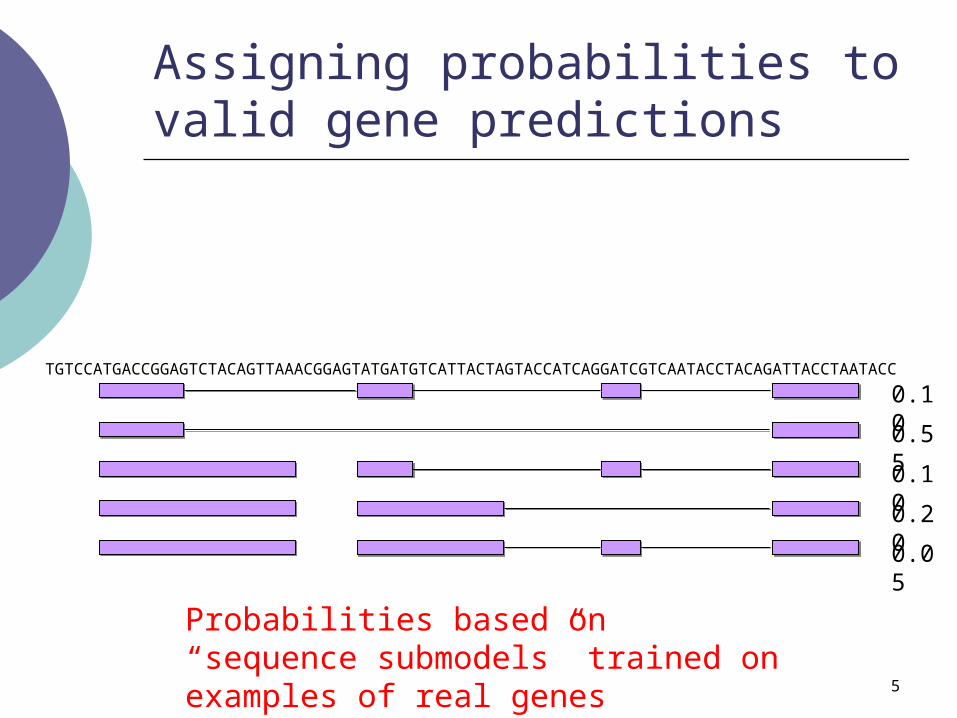
Assigning probabilities to valid gene predictions
0.05
0.20
0.10
0.55
0.10
Probabilities based on “sequence submodels” trained on examples of real genes
TGTCCATGACCGGAGTCTACAGTTAAACGGAGTATGATGTCATTACTAGTACCATCAGGATCGTCAATACCTACAGATTACCTAATACC

6
Picking optimal gene prediction
0.05
0.20
0.10
0.55
0.10
Viterbi a
lgorithmTGTCCATGACCGGAGTCTACAGTTAAACGGAGTATGATGTCATTACTAGTACCATCAGGATCGTCAATACCTACAGATTACCTAATACC

7
Alignment.....ATGACTGGGGT-TACAGTTAA.....GTACGATGT-ATTGCT............................GATAACCTAA....
||||| || || ||||||||| ||| ||||| ||| || ||| ||||||
TGTCCATGACCGGAGTCTACAGTTAAACGGAGTATGATGTCATTACTAGTACCATCAGGATCGTCAATACCTACAGATTACCTAATACC
Adding external information
0.10
0.60
0.15
0.10
0.05

8
Types of external informationDNA s
eque
nce
Alig
ned
trans
crip
ts
Evolutionary conservation
Tiling array data
Gene predictions
•Conservation: D. erecta and D. pseudoobscura
•Transcripts: ESTs and mRNA
•Tiling arrays: Affymetrix and Aaron

9
PASA
Assembly 1Assembly 2
Brian J. Haas et al. Improving the Arabidopsis genome annotation using maximal transcript alignment assemblies. NAR 2003 31: 5654–5666.

10
Adding the cDNA information
0.10
0.05
0.15
0.10
0.60
||||| |||||| |||| |||||
TGTCCATGACCGGAGTCTACAGTTAAACGGAGTATGATGTCATTACTAGTACCATCAGGATCGTCAATACCTACAGATTACCTAATACC

11
Creating an annotation
We can use PASA to “update” gene predictions
Assembly 1Assembly 2
Alternative splice
Gene prediction

12
Difficult: dscam

13
Difficult: dscam

14
Quirks
In-frame stop codons (selenocysteines?) Uncommon splice sites
Non GT/AG GC/AG or AT/AC Genome rearrangements Dicistronic genes (androcam) Trans-splicing (mod(mdg4)) More?

15
Storing the data DNA s
eque
nceEvolutionary conservation
Tiling array
data
Gene predictions
GenomeDB
(Brian Koebbe)
PASA
clusters
Manual annotation
Genome annotation
Alig
ned
trans
crip
ts

16
Tiling arrays
Aaron Tenney

17
Goal
Combine computational gene finding and tiling array analysis Improve prediction accuracy on protein
coding genes Predict different forms of genes in
different hybridization conditions

18
Tiling arrays complement other information sources
Tiling arrays vs. DNA sequence No explicit use of sequence, not as biased by
genes in training set Easier to find atypical novel genes (odd splice
sites or codon usage) Tiling arrays vs. Evolutionary conservation
Much conserved sequence is not transcribed Tiling array will help sift out conserved but non-
transcribed sequence Tiling arrays vs. aligned ESTs
Similar to information from aligned ESTs Less biased to high copy number transcripts and
3’ ends More complete view of transcriptome

19
Tiling arrays complement other information sources

20
Challenges
Most literature on analysis of oligonucleotide arrays is about expression arrays Sets of 10-20 probes designed to query specific
genes Analysis of tiling arrays is different
Determining which probes are hybridizing instead of estimating expression levels
Looser probe design criteria, noiser data

21
Low level analysis questions
Individual probe intensities Normalization Probe sequence specific corrections Cross hybridization

22
Data integration questions
Adding tiling arrays to information we already use
Resolution vs. noise reduction tradeoff Sequence representation / feature
functions Modeling entities of interest in the
genome Protein and non protein coding genes Non-genes, “Dark matter”
Correlations to DNA / conservation / EST signals

23
Validation experiments
Laura Langton
24
Prediction Validation
Which predictions to validate? Filter predictions for exon overlap with existing
experimental evidence. Evidence = mRNAs and PASA clustered ESTs
Classify predictions into 3 major categories: Known Partially verified Novel
Feature of interest = splice sites

25
Known Gene

26
Known Gene
27
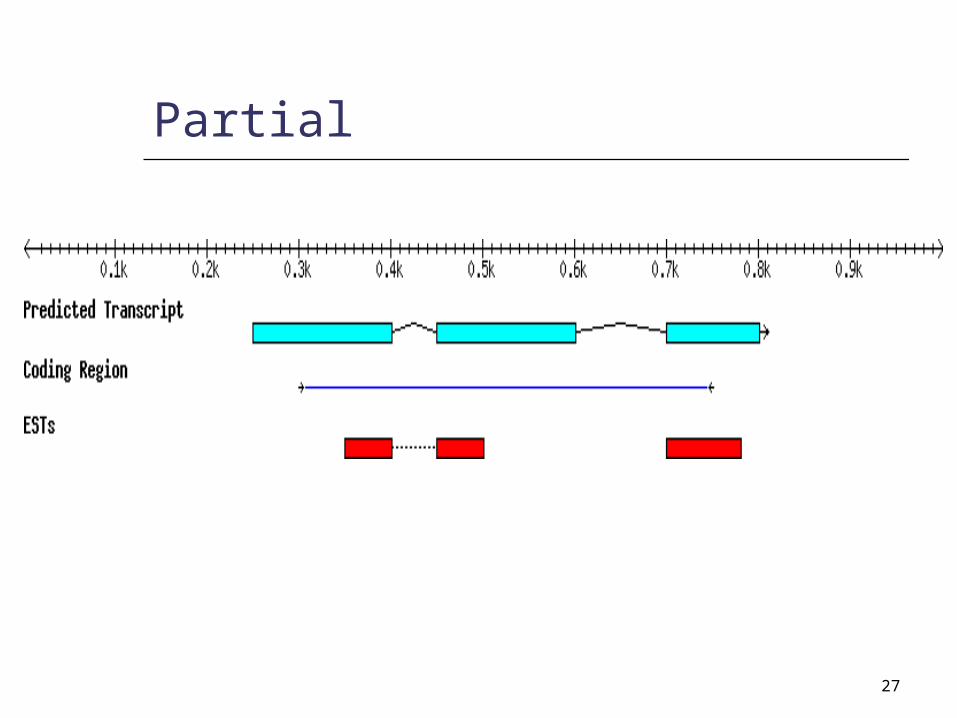
Partial

28
Novel

29
Novel

30
Categories not currently tested
Alternative splices Single exon genes UTRs Structural disagreements

31
Structural disagreements

32
Alternate Splice

33
Design primers to span one or more unverified introns.
Reverse transcribe RNA from whole fly or cell lines.
PCR 650 bp amplicons. Directly sequence. Align resulting ESTs to genome
Experimental Validation - RT PCR

34
Sequence Data

35
RT - PCR
Our EST data[RTDB]
DNA seq
uenc
eAlig
ned
ES
TsEvolutionary conservation
Tiling array data
Gene predictions

36
RT Database
Types of data in RTDB (examples) Traces, reads, quality values Primers, amplicons Predictions, genome version Experiment information
Accessible to collaborators Schema available on request
Charles Comstock

37
Preliminary results
Novel 176 predictions tested, 51% hit rate
Partial 442 predictions tested, 74% hit rate