1 what are we learning from business training and entrepreneurship
TRANSCRIPT

1
What are we learning from business training and entrepreneurship evaluations
around the developing world?*
David McKenzie, World Bank
Christopher Woodruff, University of Warwick
Abstract
Business training programs are a popular policy option to try to improve the performance of enterprises
around the world. The last few years have seen rapid growth in the number of evaluations of these
programs in developing countries. We undertake a critical review of these studies with the goal of
synthesizing the emerging lessons and understanding the limitations of the existing research and the
areas in which more work is needed. We find that there is substantial heterogeneity in the length,
content, and types of firms participating in the training programs evaluated. Many evaluations suffer
from low statistical power, measure impacts only within a year of training, and experience problems
with survey attrition and measurement of firm profits and revenues. Over these short time horizons,
there are relatively modest impacts of training on survivorship of existing firms, but stronger evidence
that training programs help prospective owners launch new businesses more quickly. Most studies find
that existing firm owners implement some of the practices taught in training, but the magnitudes of
these improvements in practices are often relatively modest. Few studies find significant impacts on
profits or sales, although a couple of the studies with more statistical power have done so. Some studies
have also found benefits to microfinance organizations of offering training. To date there is little
evidence to help guide policymakers as to whether any impacts found come from trained firms
competing away sales from other businesses versus through productivity improvements, and little
evidence to guide the development of the provision of training at market prices. We conclude by
summarizing some directions and key questions for future studies.
Keywords: Business training; Consulting; Randomized experiments; Firm Productivity.
JEL codes: O12, J16, L26, M53.
* We thank the authors of the different studies reviewed in this paper for providing us with additional details and
clarifications on their studies, and Louise Fox and Markus Goldstein for comments on earlier drafts. We thank the World Bank and UN Foundation for funding which supported this work.

2
Introduction
Walk into a typical micro or small business in a developing country and spend a few minutes talking with
the owner and it is often clear that owners are not implementing many of the business practices
standard in most small businesses in developed countries. Formal records are not kept, and household
and business finances are mixed together. Marketing efforts are sporadic and rudimentary. Some
inventory sits on shelves for years at a time, while more popular items frequently are out of stock. Few
owners have financial targets or goals that they regularly monitor and act to achieve. The picture is not
much better in medium and some large firms, with few firms using quality control systems, rewarding
workers with performance-based pay, or using many other practices typical in well managed firms in
developed countries.
Small wonder, then, that business training is one of the most common forms of active support provided
to small firms around the world. There are a number of programs offered by governments,
microfinance organisations and NGOs in many countries around the world. Perhaps the mostly widely
implemented traiing program is the International Labor Organization (ILO)’s Start and Improve Your
Business (SIYB) program. Started in 1977, the program claims over 4.5 million trainees with
implementation in over 100 countries.1 Other widely used programs include the GTZ/CEFE program, the
UNCTAD/EMPRETEC program, business plan competitions and training run by Technoserve, content for
microfinance clients developed by Freedom from Hunger, and the IFC’s Business Edge and SME Toolkit
programs.
However, until recently there has been very little rigorous evidence on the impacts of these programs.
An overview of impact evaluations in finance and private sector development written in 2009 found very
little work on business training (McKenzie, 2010). The last three years have seen a rapid increase in
attention to the idea that “managerial capital” or poor management is a constraint to production in
developing countries (Bruhn et al, 2010; Bloom and Van Reenen, 2010), and the emergence of a number
of impact evaluations of business training programs. This paper provides a critical overview of what we
are learning from these evaluations and attempts to draw out the emerging lessons for both policy and
the next generation of research.
We used a variety of methods to identify recent studies which examine the impacts of business training
in developing countries. These include an Econlit search for published studies, Google Scholar searches
of papers which cite these published studies or other working papers, our contacts with scholars
working in this field, input from recent training program inventory exercises, and knowledge of papers
presented in recent seminars or conferences. We restrict attention to papers which have a clear impact
evaluation design dealing with selection on both observable and unobservable characteristics of
business owners, and which focuses on enterprise management rather than solely on technical or
vocational training. This yields 16 randomized experiments and one regression discontinuity study
(Klinger and Schündeln, 2011) of business training, as well as three experiments which focus on
individualized consulting services which we discuss separately.
1 http://www.ilo.org/empent/areas/start-and-improve-your-business/lang--en/index.htm [accessed September 6,
2012].

3
We start by assessing the comparability of these different programs in terms of course content and who
takes part in the training. We find there is considerable heterogeneity across studies in both the
participants studied and in the length and content of the training provided, although a number of core
topics are covered in most training sessions. We next discuss a number of challenges researchers have
faced in measuring impact. Critically, most of the existing studies have very low power for detecting
impacts on business profits or revenues. This lack of power results from the use of a single follow-up
survey to measure impacts on relatively small samples of very heterogeneous firms. Power is further
compromised because take-up rates are often far below 100 percent. In addition, many existing studies
only look at impacts within a year of training, which may be too short a period to detect changes. Many
studies also experience problems with attrition, selective survival and start-up, and non-responses on
sensitive outcomes like profits and revenues. A final concern is that training may change measurement
of outcomes, even if it doesn’t change the outcomes themselves, and so we discuss how several studies
have attempted to show their results are robust to reporting issues.
With these issues in mind, we then assess what we have learned about the impacts of different
programs on business survivorship and start-up, business practices, and profitability and enterprise
growth. Among the minority of studies which have looked at impacts on survivorship of existing
businesses, there is some weak evidence for a positive effect for male-owned businesses. However, for
female-owned businesses training is found to have either zero or a slightly negative effect on
survivorship. Stronger results have been found with respect to the impacts of training programs on new
business start-ups. All the training programs studied which have content specifically intended to help
people to start a new business have found training helps firms start-up, although there is some evidence
that training may merely speed up the entry of firms who were going to enter anyway, and potentially
change the selection of who enters.
Almost all training programs find that treated firms start implementing some of the business practices
taught by the training. However, the magnitude of the impacts is rather small in many cases, with a
typical change being 0.1 or 0.2 standard deviations, or 5 to 10 percentage points. The combination of
relatively small changes in business practices and low statistical power means that few studies have
found any impacts of training on sales or profitability, although the studies with most power have found
some positive short-term effects. Studies which work with microfinance clients have also looked at
outcomes relevant to the microfinance institution. There is some evidence that training changes rates of
client retention and the characteristics of loan applicants. Finally, the three studies which examine the
impact of individualized consulting provided to larger firms find evidence that consulting services can
improve the performance of firms, including those with multiple plants and over 200 workers.
Before concluding we discuss several important issues that existing work provides very little evidence
about, but which are crucial for developing policy recommendations. These include whether gains from
training are long-lasting and whether they come from competing away sales from untrained firms or
through other channels. We also discuss the need to address the heterogeneity of both training content
and participants, and to uncover the market failures that might prevent firms from investing in training
themselves if it is really beneficial. We conclude with recommendations for future work in this area.

4
2. What does a typical business training program involve?
Attempts to measure “the” impact of “business training” face multiple challenges, which complicate
comparisons across studies. The first challenge is that business training varies in what is offered and how
it is offered across different locations and organizations. These differences in content are likely to be
important and to induce much more heterogeneity into the treatment of business training than there is
in several other firm interventions such as access to capital through credit or grants. A second challenge
(common to most evaluations) is that the impact of training is likely to differ depending on who receives
the training, so that even if we compare the same training content in different locations, differences in
the characteristics of the individuals receiving the training may result in different measured impacts. In
practice, studies vary both in how they select individuals to participate, and in what content they offer
to those who are selected, It is therefore important to examine carefully who participates and what is
offered before making comparisons among studies.
Who takes part in business training experiments?
Table 1 summarizes key characteristics of the participants in recent business training evaluation studies.
The most common modality for training amongst these studies is for class-room based training to be
offered by microfinance organizations or banks to their clients. This is particularly common for training
offered to female microenterprise owners, given that the majority of microfinance clients are women. In
some cases training is offered to all clients as part of their regular group meetings (e.g. Karlan and
Valdivia, 2011, Berge et al, 2011) while in other cases the bank or microfinance organization offers
training as an optional additional service for clients (e.g. Bruhn and Zia, 2012). A second strategy has
been to offer training to firms in a particular industry or industrial cluster (e.g. Mano et al, 2011; Sonobe
et al, 2011). A third strategy is to have individuals apply to take part in the training as part of a
competition, as is done by Technoserve (Klinger and Schündeln, 2011), be screened on interest in
participating (Valdivia, 2012), or to have students apply to take part in an entrepreneurship course
(Premand et al, 2012). All of these approaches result in a selected sample of firms, who may differ from
the general population. A final approach, to date used only by de Mel et al. (2012) and Calderon et al.
(2012), is to draw a representative sample of the microenterprise population of interest and then offer
the training to a random subsample of this population.
As a result of these approaches to selecting participants, most evaluations focus on existing businesses.
Exceptions include studies where many of the microfinance clients are borrowing or saving for
household purposes but do not necessarily have an enterprise (e.g. Field et al, 2010), and studies which
are based on competitions or training of new businesses (Klinger and Schündeln, 2011; Premand et al,
2012; de Mel et al, 2012). It is noticeable that almost all the evaluations to date have focused on urban
clients, which likely reflects the greater density of businesses and training providers in urban areas.
Exceptions are Giné and Mansuri (2011) who work in rural Pakistan, half of the sample of Karlan and
Valdivia (2012), which comes from rural Peru, and Calderon et al. (2012) who work in rural Mexico.

5
The average age of a participant in a typical study is 35 to 45 years old, with only two studies focused on
young entrepreneurs (Bruhn and Zia, 2012; Premand et al, 2012). Some studies focus entirely on female
business owners, others on entirely male owners, while relatively few have sufficient numbers of both
genders to compare impacts separately. Finally, there is substantial heterogeneity in the education
levels of the participantswith averages as low as 2.5 years of schooling for females and 5.7 years for
males in the rural Pakistan study of Giné and Mansuri (2011) and as high as university level in the course
of Premand et al. (2012).
Table 2 shows the degree of heterogeneity in firm size at baseline among studies that include existing
firms. At the low end are the subsistence firms run by women in Giné and Mansuri (2011) and de Mel et
al. (2012), where 95 percent of the firms have no paid employees, and average monthly revenues are
only US$80-100 at market exchange rates, and profits are approximately one dollar per day. Most of the
rest of the studies also focus on microenterprises, albeit ones with slightly larger revenues and
potentially one or two employees. The main exceptions are the firms chosen from industrial clusters
(Mano et al, 2011 and Sonobe et al, 2012), where the firms are SMEs with 5 to 50 workers, and monthly
revenues which are $5000 or more (and in some cases over $100,000).
Training delivery and costs
All of the training courses reviewed here are classroom-based and delivered to groups of individuals,
although several of the programs provide additional one-on-one follow-up training, which we will
discuss later (as well as discussing three individualized consulting experiments separately). Table 3
provides key characteristics of the training delivery in the different studies. A first point to note is that
many of the studies are testing content that has been modified or developed specifically for the study of
interest, rather than content that has been taught for years. This may matter if it takes time to adapt
particular content to local context or for instructors to become familiar with the material. The
instructors in most studies are experienced training professionals, although in a few studies
microfinance officers themselves have been trained to deliver content. Berge et al. (2012) compare the
same training content taught by microfinance staff and by professional trainers, and find that in the
courses taught by microfinance staff, attendance rates fall more and both subjective evaluations of
course quality and understanding of the concept of profits in tests are lower. As a consequence of
differences in the newness of the content and in who provides it, the quality of training is likely to vary
across studies.
The length of the training course also varies substantially across studies. The shortest courses are two
days or two half-days (Bruhn and Zia, 2012; Field et al, 2010), while other courses are for one week or
more full-time (e.g. de Mel et al, 2012; Sonobe et al, 2011). In most cases the training is concentrated
over a relatively short period of time, but in some of the cases where training takes place in
microfinance group meetings, it can be spread over many months, with as little as half an hour per
month over many months (e.g. Karlan and Valdivia, 2011). Longer full-time courses allow more content
to be taught, but are more costly, and also require business owners to be away for their businesses for
more time.

6
In all these experiments training has been offered for free, and in addition, some studies have also
provided small supplements for travel or food, or offered the prospect of grants as an additional
incentive.2 For example, Bruhn and Zia (2012) paid clients approximately $35 for participating in their
two day course to compensate for the opportunity cost of time, while de Mel et al. (2012) paid a travel
allowance of slightly less than $4 per day, but also offered the incentive that half of those completing
training would receive a grant of approximately $130. The training costs per person trained range from
as little as $21 in Drexler et al. (2011)- where training was conducted by local instructors once per week
over five or six weeks in local schools - to more than $400 per firm reported in Sonobe et al. (2011),
where instructor costs and venue rental costs per person for 15 days were relatively high. One argument
for subsidizing costs is that because many business owners have little perception of how badly managed
their firms are, and to them training is a new and unproven concept with uncertain payoffs, even those
who are not liquidity constrained may be reluctant to pay, while training providers may find it costly and
difficult to credibly signal quality. Indeed, two studies find some evidence to support the idea that
individuals who are least interested have potentially the most to gain from training (Bjorvatn and
Tungodden, 2010; Karlan and Valdivia, 2011). We will return to discussing market failures and subsidies
later in the paper, after discussing training impacts.
Despite training being offered for free, take-up of training is far from universal. The average take-up rate
across the different studies for individuals offered training is approximately 65 percent. Low take-up
reduces the power of an experiment, with 2.4 times the sample size needed to detect a given treatment
effect when take-up is 65% than when it is 100%. One would expect take-up rates to be highest when
training takes place in the context of regular group meetings organized by microfinance organizations,
but even in the “mandatory” treatment of Karlan and Valdivia (2011), attendance rates are only 88
percent. Screening on initial interest in training is no guarantee of high take-up rates. Bruhn and Zia
(2012) and Valdivia (2012) both focus on samples who had initially expressed interest in attending a
training course, but still only manage attendance rates of 39 percent and 51 percent, respectively. In
most short courses there has been very little drop-out conditional on attending the first session of the
course, but longer courses have experienced more drop-out along the way. For example, Valdivia (2012)
reports that only 42 percent of those that started the training completed at least 20 (out of 40) sessions,
and only 28 percent at least 30 sessions.
The challenge of take-up is further illustrated through the experiences of two planned randomized
experiments in which insufficient take-up prevented the experiment from occurring. Sonobe et al.
(2010) planned a business training experiment among enterprises operating in a manufacturing cluster
in Kenya, but had only 40 of 120 invited enterprises show up to the opening ceremony (33% take-up),
preventing them from randomization based on over-subscription. McKenzie and Weber (2009) discuss a
planned experiment among female SME clients of a bank in Uganda. Take-up was only 45%, so the bank
invited some of the control group firms to the training to make up the planned training numbers,
resulting in insufficient power for the experiment.
2 This is similar to most job-training programs, which do not charge participants.
7
Training content
Table 4 attempts to summarize the key topics taught in the different courses. All of the studies focus on
general business skills that should be broadly applicable to most businesses, rather than technical
knowledge or sector-specific content. However, there is significant variation in the depth and breadth of
topics. The most common set of topics centers around keeping business records and encouraging small
business owners to separate household and business finances. There is significant overlap here with
financial literacy courses, although the programs studied by Drexler et al. (2012) and Field et al (2010)
appear to be the only courses that also focus on encouraging savings and discussing debt management,
which are other common financial literacy topics. Many courses, especially those targeted at potential
rather than existing business owners, focus on generating a product idea and the steps needed to take
the product to market. A core set of topics for attempting to grow existing businesses includes
marketing, pricing and costing, inventory management, customer service, and financial planning. Since
few of the microenterprises have employees, employee management is not a significant part of most
courses. Courses focused on larger firms have included content on quality management, lean
production, and/or Kaizen and 5S techniques3 for continuous production improvement. Finally, in
addition to attempting to improve business practices, some courses attempt to change entrepreneurial
attitudes or aspirations. The amount of course time devoted to these aspects has been relatively light in
the courses studied by economists, but Glaub and Frese (2011) review a number of non-experimental
studies in developing countries in which training programs have focused much more heavily on
strengthening of psychological factors. Glaub et al. (2012) provides an example, with a three day course
focused on personal initiative training, which is a psychological intervention aimed at making business
owners more likely to self-start new ideas on products and processes, be more proactive in preparing
for future opportunities and problems, and be persistent in overcoming barriers.
These different types of content might be expected to impact business performance in different ways.
Simple accounting practices and financial literacy training may give business owners a better
understanding of the profitability of their business, but have little immediate effect on sales or profit
levels. However, in the longer term, the use of such practices may enable them to reinvest more in their
firms because of higher savings, or to make adjustments to product lines if they gain a better
understanding of which products are more profitable. In contrast, some of the other practices may show
impacts more quickly – better marketing and customer service may directly increase sales, while costing
and quality control practices may lead to reduced costs and increased profits. Development of a new
product idea could have rapid and long-lasting benefits even if no other additional practices are
introduced. Changes in entrepreneurial attitudes may have impacts on how hard the owner works, and
in the way they think about a host of business decisions. However, because all of the available training
experiments contain a mixture of different content, existing studies are unable to determine which
components of training in particular matter most.
3 Kaizen and 5S are Japanese systems for improving production efficiency, based on a philosophy of continuous
improvement, and by improving workflow in a production process through standardized and efficient storage, set-up, and production.

8
3. Challenges in Measuring Impact
Impact evaluations which measure the effects of business training programs on business performance
rely primarily on survey data to measure outcomes. In order to obtain credible and useful estimates,
studies must have sufficient power, measure impacts over an appropriate time horizon, deal with survey
attrition and selective survival and start-up of firms, and address the possibility that training changes
how firms report business outcomes even if it doesn’t change those outcomes. We discuss each of these
challenges and assess how well existing studies have met them in order to provide context for the
results discussed in the next section.
Power
The power of a statistical test is the probability that it will reject a null hypothesis given that the null
hypothesis is false. A starting point for most business training evaluations is to test the null hypothesis
that the intervention had no effect, so the power of the experiment is a measure of the ability to detect
an effect of training if such an effect does exist. The key determinants of the power of a study are the
size of the sample, how much heterogeneity there is in the sample (the more diverse the set of firms the
harder it is to measure a change for them), whether the intervention takes place at an individual or
group level (power is lower for a given sample size when treatments are allocated at the group level),
and the size of the treatment effect. Low take-up rates dilute the treatment effect, reducing power.
Table 5 compares different studies in terms of these components of power. Most studies conduct
individual level randomization, with the exception of several studies working with microfinance groups,
where different repayment groups are allocated to treatment or control, and Calderon et al. (2012) who
first randomize at the village level, and then at the individual level within the treatment villages. A
typical study involves approximately 200 to 400 individuals or groups in each of the treatment and
control, although sample sizes have been smaller for the studies based on specific industrial clusters
(Mano et al, 2012; Sonobe et al, 2011). A useful summary statistic of the cross-sectional heterogeneity in
baseline firms is the coefficient of variation (C.V.) of profits or revenues, which is the ratio of the
standard deviation and the mean. The two studies with lowest C.V.s are both studies which restrict the
heterogeneity in firms eligible for the study – de Mel et al. (2009) required firms to have baseline profits
below 5000 Rs per month (US$43), while Berge et al. (2011) restricted training to firms with loan sizes in
a reasonably narrowly defined range. In contrast, most studies of microfinance clients or firms in an
industrial cluster contain a much wider mix of firms, resulting in coefficients of variation which can
exceed 2 or more. The more different the firms are, the harder it is to detect changes in their average
outcomes arising from treatment.
To give a sense of the power of these different studies, we calculate the power to detect a 25% and a
50% increase in profits and revenues, given the C.V., sample size, and training take-up rate of each
study.4 We assume analysis is by an ANCOVA specification (outcome regressed on treatment and the
4 Power calculations were done using the sampsi command in Stata, and a test size of 0.05. See McKenzie (2012)
for more discussion of the validity of the underlying assumptions needed for these calculations in firm experiments.

9
lagged outcome variable) using a single baseline and single follow-up survey. The power will also
depends on the correlation between baseline profits (revenues) and follow-up profits (revenues).
McKenzie (2011, 2012) examines several firm surveys and finds autocorrelations in the 0.3 to 0.5 range,
reflecting the fact that firms experience a large amount of idiosyncratic variation in their profits and
revenues from one period to the next (Fafchamps et al, 2012). This autocorrelation is likely to be
stronger for larger firms (see Bloom et al, 2012), and weakest for the smallest microenterprises. We
assume an autocorrelation of 0.5, and ignore any survey attrition, which would further weaken power.
However, we also ignore any reduction in heterogeneity that comes from stratified randomization or
other methods to improve power (Bruhn and McKenzie, 2009).5 Nevertheless, these calculations provide
a useful approximation of the approximate power of different studies. Group-randomized studies add a
further complication for power comparisons, since their power is reduced relative to individual level
randomization by a factor which depends on the intra-group correlation. Our solution is to provide a
range of power, where the higher number would occur if the intra-group correlation is zero (equivalent
to individual randomization) and the lower number would occur if the intra-group correlation is one
(equivalent to having only one observation per group). Given the heterogeneity in firms, it is likely the
intra-group correlation is relatively low, making actual power closer to the higher number.
Many funding agencies consider 80% to 90% power an appropriate target (Duflo et al, 2008) and power
of 80% or more is the standard in medical trials (Schultz and Grimes, 2005). Table 5 reveals that many, if
not most, business training experiments fall well below these levels in terms of power to detect a 25
percent or 50 percent increase in profits or revenues. For a microenterprise earning $25 per month
(about $1 per day), a 25 percent increase in profits would be $75 per year, or around 75 percent of the
direct costs of a typical microenterprise training program. So a reasonable assessment of impact should
have the power to measure returns at least of this level. But in fact none of the studies achieve 80%
power to detect a 25 percent increase in revenues, and only de Mel et al. (2012) and possibly Berge et
al. (2011) exceed 80% power for a 25% increase in profits.6 The industrial cluster studies (Mano et al,
2012; Sonobe et al., 2011) and Bruhn and Zia (2012) are particularly low-powered. However, Valdivia
(2012) demonstrates the importance of heterogeneity and take-up. Although the study has the largest
sample size of any individual experiment, high heterogeneity among firms and a low 51 percent take-up
rate (requiring four times the sample size to achieve a given power compared with 100 percent take-up)
yield very low power.
In practice some of these studies attempt to further increase power by reducing the standard deviation
of revenues or profits through truncating (capping the outcome at a specified level) or trimming
(dropping observations with outcomes above a certain level) the top 1 or 5 percent of observations. This
5 Power can be further increased by taking multiple rounds of follow-up surveys and pooling them together to look
at an average impact over the pooled survey rounds (McKenzie, 2012). However, de Mel et al. (2012) and Calderon et al. (2012) are the only business training studies to do this, so we ignore this element in our power calculations. 6 Note that Berge et al. (2012) take existing loan groups who meet on a given day in a given branch and randomly
assign training to one out of two days in each of the two branches. True randomization thus only involves choosing one of four possible allocations, and thus has zero power according to permutation analysis. The authors claim that since loan groups are offered time on the basis of availability, this is as good as random, and so proceed with analysis as if randomization was at the group-level. Our table does the same, but this caveat should be noted.

10
increases power, but if the training has large effects for a few firms and small effects for most,
truncating or trimming may eliminate the very effect the study is trying to detect. Karlan et al. (2012)
argue that the prospect of a “tail” event may induce firms to experiment with new methods and
techniques, such as those taught in training or by consultants. Truncation should be preferred to
trimming for this reason.
We should note also that power is generally much higher for detecting binary outcomes, such as
whether or not a new business is started, whether or not a firm applies for a loan, or whether or not it
implements a particular business practice. Studies with low power to inform us about the impact of
training on ultimate business outcomes may therefore still be informative about other training impacts.
Timing of Effects
The short and long-run impacts of many policies can differ substantially, so a key challenge for impact
evaluation is figuring out when to measure outcomes (Woolcock, 2009). For business training, one might
expect firms to make some changes relatively quickly after training. But the full impact of training may
take some time. Impacts on business survival may also take time to materialize. However, firms could
start some practices and then drop them, so that surveys which measure what is taking place in the
business only several years after training may miss the period of experimentation. Ideally, then studies
should trace the trajectories of impacts, measuring both short and longer-term effects.
Table 6 provides details on the number of follow-up surveys, their timing, and their attrition rate for the
different studies. The majority of studies we review take a single follow-up survey, providing a snapshot
of information on the training impact, but no details on the trajectory of impacts. Eight of the thirteen
studies are very short-run, looking at impacts at one year or less after training. De Mel et al. (2012) find
that the impacts differ in the short and medium term in their study. For example, examining impacts
within the first year would show that business training for women out of the labor force led to large
increases in business entry, whereas surveys 16 and 25 months after training show the control group
had caught up in terms of business ownership rates.
Survey Attrition and Selective Survival or Start-up
Survey attrition is another problem complicating inference, especially if the reasons for attrition are
business failure, refusal because of disappointment with the training effects, or because successful
business owners have moved out of the area. Survey attrition rates can be related to the timing of the
follow-up surveys – a longer interval elapsing since baseline makes it more likely people have moved or
that contact details have changed, but may also help reduce the chance that the control group attrits
because they were disappointed not to be selected for training. Attrition rates range from as low as 5.3
percent in Field et al. (2010) and 6 to 8 percent in de Mel et al. (2012), up to 24 percent in Karlan and
Valdivia (2011), 26% in Calderon et al. (2012), and 28 percent in Klinger and Schündeln (2011). It is
perhaps no coincidence that the highest attrition rates come from three studies conducted in Latin
America; our personal experience has been that in many Latin American countries firms are less willing
to answer surveys than in Africa or South Asia, and transitions between wage work and self employment
are frequent in the region (Fajnzylber et al, 2006).

11
Attempts to examine impacts of training on business outcomes face additional difficulties when training
influences the rate of business survivorship or the likelihood of business start-up. For example, Giné and
Mansuri (2011) find that training led to a 6.1 percent reduction in business failures for male owners
(significant at the 10% level only). If training leads to survival of relatively unsuccessful firms who would
otherwise have closed, then a straight comparison of profits or sales by treatment status will understate
the impact of training. Giné and Mansuri attempt to address the differential survival issue by bounding,
an approach which has also been used in several other studies. Note that even if training has no impact
on the rate of business survivorship or start-up, it may still affect the characteristics of who survives,
again requiring authors to use non-experimental methods to attempt to deal with this selectivity. For
example, de Mel et al. (2012) find that training (and grants) led to changes in the characteristics of who
opens a business, even though the rates of ownership were no different in the treatment and control
groups. They therefore use a generalized propensity score to reweight their regression estimates to
correct for the selectivity they find on observables like ability and wealth.
Measurement changed by Training
A final challenge for measuring the impact of business training on business outcomes is measuring those
outcomes. Start-up and survivorship are objective measures that can at least be somewhat verified,
whereas measuring business practices, profitability, and revenues for most firms is more difficult.
Business practices (e.g. keeping accounts, separating business and household expenses, advertised in
the past month) are normally relatively easy concepts for firms to understand, and questions that firm
owners are usually willing to answer. However, Drexler et al. (2012) note the possibility that treated
individuals may report doing certain behaviors (e.g. separating personal and business accounts) because
the training told them this was important, rather than because they actually do this.
Measuring profits and revenues poses further problems. Owners of the smallest businesses typically do
not keep written records of these items, and owners of larger firms who do keep records may be
reluctant to share them (because of concerns about theft, or because of taxation issues). De Mel et al.
(2009a) study several approaches to obtaining profits from microenterprises and conclude that, in their
context at least, a simple direct question is more accurate and much less noisy than calculating profits
from revenues and expenses. However, collecting profits has proved difficult for many studies, with
several studies not collecting profit data at all (Valdivia, 2012; Giné and Mansuri 2011; Klinger and
Schündeln, 2011), collecting it but not using it due to too much noise (Drexler et al, 2012), or collecting
only profit margins on the main product, rather than overall profits (Karlan and Valdivia, 2011).7 Most
studies have collected revenue data (Bruhn and Zia, 2011 is an exception), but some have struggled with
much lower response rates for revenues than for non-financial business questions (e.g. Drexler et al,
2012 have a 46 percent attrition rate on revenues compared to 13 percent for their questionnaire as a
whole). Similarly, Bruhn and Zia (2011) note that about one-third of clients in their study did not provide
profit data.
7 In addition profits are not examined in two studies which look at business start-up as outcomes – Field et al.
(2010) and Premaud et al. (2012).

12
Even when studies are able to obtain data on profits and sales, a concern is that business training
changes the reporting of this data, irrespective of whether or not it actually changes profits and sales.
This may occur because the practices taught in the training course lead to more accurate accounting or
because training recipients are less likely to under-report profit and sales levels because, for example,
they trust the enumerators more after being gifted the training.8 On the first possibility, De Mel et al
(2009a) report on an experiment in which a random sample of microenterprises was encouraged to
keep simple ledgers over a period of several months. They find that enterprises keeping records
reported very similar profits to those not encouraged to keep records, but they reported higher levels of
both expenses and revenues. Few studies to date have discussed or attempted to address this issue.
Exceptions are Drexler et al. (2011), who look at reporting errors (e.g. reporting profits higher than
sales, or bad week sales higher than average sales) to see whether treatment reduces these reporting
errors, and at the difference between self-reported profits and profits calculated as the difference
between revenue and expenses; Berge et al. (2011), who compare self-reported profits to revenue
minus expenses for treatment versus control groups; and de Mel et al. (2012) who do the same, and
who also control for detailed measures of accounting practices as a further robustness check. De Mel et
al. (2012) find little evidence that training has changed reporting, whereas Drexler et al. (2012) find that
their rule-of-thumb training reduces the number of errors in reporting, and Berge et al. (2011) find that
training increases the gap between self-reported profits and revenue minus expenses.
4. Impacts of Business Training Interventions
The previous section highlights the issues with statistical power, timing of follow-ups, attrition, and
measurement that present challenges for interpreting the impacts found in the different studies. With
these caveats in mind, we examine the extent to which business training has been found to impact
business start-up and survivorship; business practices; business outcomes; and outcomes for
microfinance lenders. Since studies of other microenterprise interventions (e.g. De Mel et al, 2009b)
have often found differences by gender, we separate results by gender to the extent possible.
Impacts on Start-up and Survivorship
Table 7 summarizes the impacts of different studies on business survivorship and new business start-
ups. The coefficients are marginal effects on the probability of either outcome occurring, so that a
coefficient of 0.06 can be interpreted as a 6 percentage point increase. Consider first the impact on
business survival. Survivorship is difficult to examine when attrition rates are high, since closing down is
often a cause of attrition and bounds which allow for attrition can be very wide. The only study with a
survival effect significant at the 5% level is Mano et al. (2012), who find a 9 percentage point increase in
the likelihood of survival 12 months after their training. They do not provide bounds for this effect that
control for survey attrition, but note that none of the training participants had closed down. Giné and
Mansuri find a 6 percent increase in the likelihood of survival 18 to 22 months after training for the male
owners in their sample – an effect significant at the 10% level – but no change for female owners, while
8 A related concern is that people who take training may overreport profits or revenues after training to
exaggerate how well their firms have benefited from training. The same robustness checks as described in the text will also help rule out this sort of behavior; as well as detailed probing and observation from the surveyors.

13
Valdivia (2012) actually finds that training leads to a marginally significant reduction in the likelihood of
survival for female firm owners. He attributes this to the training teaching owners to close down losing
firms.9 The remaining studies which do report survivorship find insignificant impacts, but with
confidence intervals wide enough to include at least a 5 percentage point increase or decrease. The
sample-weighted average impact is -0.03 for female-owned enterprises and +0.04 for male-owned
enterprises, although given the differences in timing of follow-up across firms, it is unclear how useful
an aggregated impact is.
Studies which focus on existing firm owners sometimes look at start-up of a second business, but none
have found significant impacts. The studies which focus on training specifically tailored at starting new
businesses have found some impacts. Klinger and Schündeln (2011) find very large point estimates for
entry one year after taking part in the second phase of Technoserve’s business plan competition in
which training occurs, although the confidence intervals are very wide, and this impact also includes the
joint impact of grants given to the winners. Premaud et al. (2012) have a sample of 1500 youth and find
taking part in an entrepreneurship track instead of academic track in the final year of university leads to
a 6 percent increase in self-employment rates for males and 3 percent for females one year later.10 Four
months after training, Field et al. (2010) examine whether women report any business income over the
preceding week, which reflects a combination of an effect on business start-up and an effect on survival.
They find that upper caste Hindu women who took the training were 19 percentage points more likely
to report income, whereas the training had no effect on lower caste Hindu women or on Muslim
women. They attribute the lack of impact on these other groups to social restrictions, arguing that
training helped women whose businesses had been held down by social restrictions, but that women
who faced more extreme restrictions could not respond to training.
Training therefore appears to have some success in generating short-run impacts on business start-up.
However, this does not necessarily increase employment, since it may come from people switching from
wage work. Indeed Premaud et al. (2012) and de Mel et al. (2012) both find that short-run increases in
self-employment from training are coupled with reductions in the likelihood of wage work, so that net
employment effects are insignificant. Moreover, it is unclear whether this training merely speeds up the
rate of entry, or permanently increases it. De Mel et al. (2012) find that training alone increases the rate
of business ownership among a group of women out of the labor force by 9 percentage points within 4
months of the training, and giving them a grant increases this effect to 20 percentage points. However,
by 16 and 25 months after training, the control group had caught up. Given the short time horizon of the
other studies which have found start-up impacts, it is unclear whether they too would show these
effects dissipating over longer time horizons.
Relatively few studies have looked at how training affects the selectivity of who starts up a business or
of which businesses survive. The available evidence suggests training may enable less analytically able
9 Note that Valdivia’s measure looks at whether the owner has stopped any business in the last two years. This
doesn’t measure net survival, since if a firm owner closed one business and opened another, it would still be counted as not having survived here. 10
This effect also includes the impact of seed money given to the top placed business plans, but the authors argue via various checks that the impact is not being driven by these grants.

14
and poorer individuals to start businesses, and may prop up the survivorship of less profitable
businesses. De Mel et al. (2012) find that training leads to an increase in start-up among women with
low Raven test scores (a measure of analytical ability), and actually reduces the rate of ownership
among women with the highest test scores. Giné and Mansuri (2011) find that businesses that fail tend
to be ones with lower land holdings and lower digitspan recalls (a measure of short-term recall), but do
not examine whether training differentially affects who survives. Since many studies only examine
impacts over a short time frame, rates of business failure are often low. Selectivity is more important in
contexts where impacts are measured over longer time frames, or where business failure rates are high.
For example, Bruhn and Zia (2012) find 36 percent of businesses shut down during their study period in
Bosnia, with this high rate likely due in part to the downturn caused by the global economic crisis, while
Calderon et al. (2012) find that 50 percent of the non-attriting businesses had closed by the time of their
second follow-up survey 28 months after training.
Impacts on Business Practices
A first link in the causal chain from business training through to business profitability and growth is that
business training has to improve the knowledge of business owners and result in these owners
implementing at least some of the practices and behaviors that training has taught them. One can think
of other potential mechanisms through which training may affect business outcomes (e.g. through
changing attitudes or work hours), but failure to find any change in practices should cast doubt on the
ability of the training to improve firm outcomes.
Table 8 summarizes the impacts found by different studies on business practices. Almost all studies find
a positive effect of business training on business practices, although the effect is often not significant
once the sample is split by gender. Studies differ in the specific practices they measure, how
comprehensively they measure them, and how (if at all) they aggregate them. Several studies measure
only one to three basic practices, such as Calderon et al. (2012) who examine whether the firm uses
formal accounting, and Mano et al. (2011) who record whether or not the firm keeps records, whether it
analyzes them, and whether it visits customers. Others record a broader range of practices, including
different types of record keeping, different marketing activities, and other specific practices taught in
the training.
One common approach to aggregating different practices is to follow Kling et al. (2007) and normalize
each practice as a z-score (subtracting the mean and dividing by the standard deviation), and then
averaging these z-scores. A coefficient of 0.03 as in Karlan and Valdivia (2011) is then interpretable as an
impact of 3 percent of a standard deviation. This is useful for considering the magnitude of the increase
in relative terms, but does not provide much guidance as to the absolute size of the effect. Alternatively
one can look at the percentage point increase in the likelihood a particular practice is implemented, or
the change in the number of practices implemented out of some total, both of which provide more
guidance on the absolute magnitude of the increase.
Many studies find baseline levels of business practices which are relatively low. For example Giné and
Mansuri (2011) report only 18 percent of firms at baseline record money taken from the business and

15
only 18 percent record sales. Even among larger metalwork firms, Mano et al. (2012) report only 27% of
their sample keeps business records, and only 20 percent visit customers at baseline. Although most
studies find significant increases in the use of business practices taught during the training, the
magnitude of these effects, while sometimes large in relative terms, are often small in absolute terms.
For example, Drexler et al. (2012) find that the use of rule-of-thumb training leads to an increase in
individuals reporting that they separate personal and business expenses, keep accounting records, and
calculate revenues formally, with each of these measures increasing 6 to 12 percentage points relative
to the control group. In Giné and Mansuri (2011), treatment impacts include a 6.6 percentage point
increase in recording sales and 7.6 percentage point increase in recording money taken for household
needs. In de Mel et al. (2012), existing enterprises implement 2 more practices out of 29. Mano et al.
(2012) are something of an exception in this regard. They find a 30 percentage point increase in the
percentage of firms keeping records in the treatment versus the control group. But in general, given that
the magnitude of the changes in business practices is relatively small, we might expect it to be hard to
detect impacts of these changes on business outcomes. It also raises the question as to whether the
material is not being taught well enough for firm owners to be able to implement it, or whether they
feel the material is not relevant and hence not worth implementing.
Impacts on Business Profits and Sales
Ultimately from the viewpoint of an individual firm owner, training must result in an increase in profits
to justify the investment. However, as noted previously, many studies have struggled with measuring
profits, and so not all studies consider this as an outcome. Table 9 summarizes those which do,
converting, where necessary, point estimates of profit or sales levels to percentage increases relative to
the control group mean in order to enhance comparability across studies. Several studies examine
gender heterogeneity by reporting a point estimate for males, and then an interaction effect for
females, but no test of the overall impact on females. So the table sometimes shows confidence
intervals for males and not females. Often studies have more than one specification for profits and/or
revenues, with variation in whether or not they include different controls, and whether or not they
truncate or trim the data, or take a log transformation. We report impacts on the measure which
corresponds most closely to profits or sales in the last month. The data shown on the table do not
account for differential attrition, though some studies report bounds which adjust for attrition.
The table shows that few studies have detected significant impacts of business training on business
profits or sales, although the confidence intervals are very wide in many cases. The wide confidence
intervals reflect the issue of power discussed earlier. The studies that have most power according to the
calculations in Table 5 are the ones most likely to show significant effects. Berge et al. (2011) find
training increases profits by 24 percent and sales by 29 percent for males in the short-run (5-7 months
post-training), but the point estimate of the impact on profits has dropped to 5 percent and is
statistically insignificant in their longer-term follow-up (30 months post-training), with sales continuing
to have a larger and marginally significant impact.11 Their point estimates are much closer to zero and
11
The sales impact is insignificant when either covariates are dropped, or clustering is used to attempt to deal with the fact that randomization did not actually occur at the loan group level.

16
statistically significant for women in both the short and medium-term. De Mel et al. (2012) is the other
study with high power. They find no impact of training alone on profits of existing firms over either the
short or medium run, but do find significant impacts of the combination of training and a grant on short-
run profits, with these gains dissipating over time. In a separate sample of women who were out of the
labor force at baseline, training is found to significantly increase profits and sales of start-up businesses
by approximately 40 percent, although the confidence intervals are wide around this level.
Calderon et al. (2012) finds a 24 percent increase in weekly profits and 20 percent increase in weekly
revenues, both significant at the 10 percent level. However, given that attrition is 26 percent by the
second round survey, and that 50 percent of the non-attritors have closed down, there is reason to be
cautious in interpreting this estimate of the impact on surviving non-attriting firms. Valdivia (2012), the
only other study to find significant impacts on revenues, finds a 20 percent increase for the treatment
group that got both training and intensive one-on-one technical assistance, but no significant increase
from the training alone. Finally, Glaub et al. (2012) find a positive effect of their personal initiative
training on sales one year later, although they do not survey the non-compliers (individuals selected for
training who do not attend), which is problematic if there is selective participation. (The authors note
illness and unforeseen business problems were reasons for non-attendance.)
Several studies have emphasized the possibility that business training may have its strongest impact on
sales during a bad month. The working paper version of Karlan and Valdivia (2011) stressed this avenue,
noting that training might help clients identify strategies to reduce downward fluctuations in sales by
thinking about diversifying the products they offer as well as being more proactive about alternative
activities during slow months. Their difference-in-difference estimate finds a 30 percent increase in sales
during a bad month. However, the published version of the paper de-emphasizes this impact, noting
that when their preferred ANCOVA specification is used instead of difference-in-differences, the impact
falls to an insignificant 5 to 7 percent increase. The possibility that training may be particularly valuable
during bad times is also emphasized by Drexler et al. (2012), who find that their rule of thumb training
leads to an increase in sales during bad weeks which is significant at the 10 percent level. However,
Drexler et al. also ask firm owners to report sales in a bad month and find a very small and insignificant
impact of training on this measure. Giné and Mansuri (2012), de Mel et al. (2012), and Valdivia (2012)
also find no significant impacts of training alone on sales during bad months. Viewing these studies
together therefore leads us to conclude that the evidence that training has particularly strong effects
during bad periods is weak.
Since the costs of training often increase less than proportionally with the size of the firms taking
training, subsistence microenterprises would likely need to see much higher percentage increases in
profits from training to make training worthwhile than would larger firms. Nevertheless, a firm earning
$1 per day would need to see only a 13.7 percent increase in profits for the cost of $100 of training to be
recouped over two years. We see that the confidence intervals for the studies which do look at profits
are almost all wide enough to include this level of return. For larger firms, the percentage increase in

17
profits required to repay training costs is likely lower.12 For example, a firm with $500 in monthly profits
would only need a 2 percent increase in monthly profits to recoup $250 worth of training costs over two
years. The basic is that training costs may be justified by increases in profits which are far too small for
existing studies to detect.
Impacts on Employment
A further justification that policymakers sometimes make in subsidizing business training is that business
growth may have broader benefits for others in the community through increasing employment
opportunities. When it comes to programs working with microenterprises, the most direct employment
impacts are likely to be for the owner him or herself – through increasing their chances of employment
by increasing the likelihood of starting a new business and through reducing the chance of business
failure. However, even in these cases, increases in self-employment are likely to be offset by reductions
in wage employment (de Mel et al, 2012, Premaud et al, 2012).
Many of the studies working with microenterprises do not report impacts on employment of other
workers, but those that do robustly show very small and statistically insignificant effects. Karlan and
Valdivia (2011) find an increase of 0.02 workers, Valdivia (2012) a decrease of 0.06 workers from straight
training and a similar decrease from training plus technical assistance, and Drexler et al. (2012) find an
increase of 0.05 workers from standard training and decrease of 0.02 workers from the rule of thumb
training. None of these impacts are statistically significant, but their point estimates suggest that no
more than one in twenty microenterprises taking business training will hire an additional worker. Add to
this the fact that the worker may leave another job (including exiting self-employment) to take this job,
and the net employment creation impact of these training programs on people other than the worker
trained is extremely minimal.
The one study to show a stronger employment effect is Glaub et al. (2012), which hints at the possibility
of employment impacts when training larger firms. They find that employment in their treatment group
grows from 7.9 employees at baseline to 10.7 at follow-up, whilst employment in the control group falls
from 6.6 employees at baseline to 5.0 at follow-up, with this difference significant at the 5 percent level.
Their sample is small, and they drop non-compliers to their treatment, so this is likely at overstatement
of the effect, and more studies with larger firms are needed.
Impacts on Microfinance institution outcomes
Since many of the studies have worked with microfinance clients, they have also looked at outcomes
using administrative data from the microfinance organization. These data have the advantage of
potentially being available with less attrition and over longer time periods, and are useful for assessing
whether offering training is cost-effective for the microfinance organization. But they are less useful for
telling us about how such training impacts firms. Karlan and Zinman (2011) find training resulted in a 4
12
If we account for opportunity costs and risk aversion, the desired returns would be higher. But a 25 percent increase in profits would provide a very reasonable return to microenterprise training, even after accounting for these costs.

18
percentage point increase in client retention rates, and 2 to 3 percentage point increase in the likelihood
of perfect repayment (although this is only marginally significant). However, they also note that some of
the clients who do leave cite the added length of the weekly meetings due to the training sessions as a
factor in dropping out of the program. They note that these benefits appear to make the training
profitable from the lender side, and, after their study, FINCA-Peru implemented the mandatory version
of their training in all village banks.
Giné and Mansuri (2011) find training leads to a 16 percent increase in loan size for males, a reduction in
loan size for females, and no change in repayment rates. They also find a change in the selection of who
borrows, with individuals with higher predicted probabilities of default being less likely to borrow after
training. Field et al. (2010) find upper caste Hindu women who take training are 13 percentage points
more likely to borrow. In contrast, Drexler et al. (2012) and Bruhn and Zia (2012) find no significant
impacts of training on the likelihood of taking loans or loan size, although Bruhn and Zia find an increase
in loan duration and more refinancing of loans, which they attribute to trained individuals making
longer-term investments and being more aware of available interest rates.
5. Boosting the intensity and working with larger firms
As noted in Sections 2 and 4, many of the training sessions are relatively short in duration, and the
increase in business practices has been relatively small in a number of studies. One response to this is
that what is needed is more in-depth and individualized follow-ups on the training, while another has
been to also focus on larger firms where management practices may potentially be of greater
importance. We discuss the results of studies which have pursued these two approaches.
Individualized follow-ups
Three of the business training impact evaluations have also had a treatment group which followed up on
the classroom training with individualized follow-ups. Drexler et al. (2012) had trainers visit 8 times over
five months to answer any queries, verify and encourage the use of accounting books, and correct any
mistakes in completing books. They find no significant effects of this additional follow-up. Giné and
Mansuri (2012) have “hand-holding sessions” in half of the community organizations, where firms get
four months of being visited 1-2 times per month, to discuss topics learned, answer questions, and
suggest solutions to potential problems. They also find this hand-holding had no effect on any of their
aggregate outcomes for either men or women.
In both these cases, the follow-ups were mostly intended to reinforce the general business skills taught
in training rather than to provide firm-specific individualized advice. Valdivia (2012) also examines more
intensive follow-up, but in his case, trainers provided more specific technical assistance tailored to the
needs of the women’s businesses. The follow-ups combined individual sessions and visits with group
sessions among small groups of similar businesses during a three month period. This component
included 22 three hour group sessions and 5 to 6 hours of individual sessions or visits. Valdivia finds
some evidence to suggest this technical assistance helped firms – women assigned to receive the
assistance experienced a 20 percent increase in revenue relative to the control group (significant at the

19
1 percent level) and showed more improvement in business practices than women who were assigned
just to the basic training. This additional attention cost twice as much as the basic training alone.
Individual consulting
A related literature looks at the impact of providing consulting services on a one-on-one basis to firms in
order to improve business and management practices. The closest to the business training experiments
is the work of Karlan et al. (2012), who study a mix of 160 male and female tailors in Ghana with 5 or
fewer workers. They used local consultants from Ernst and Young in Ghana, who met with the tailors in
visits of 30 minutes to 1 hour several times a month over one year, with the average firm receiving 10
hours of consultant time over a year, at zero cost to the firm. In addition some firms receive grants of
around US$133. They find some of the consultants recommendations were adapted for some months,
but had been abandoned one year after training stopped. There is no significant impact of either
treatment on profits or revenues, with some specifications showing negative effects in the short-run,
although power is very low and confidence intervals wide.
Bruhn et al. (2012) evaluate a state government program in Puebla, Mexico, which paired small
businesses with a consultant from one of several local consulting firms. Consultants spent approximately
four hours per week over a year assisting the firm in overcoming constraints to growth. 432 firms
applied to the program, and 150 were chosen to receive heavily subsidized consulting services (the cost
was about 10% of the commercial rate). The mean number of employees was 14, and 72 percent were
male-owned. The training impact was assessed with a single follow-up survey one to three months after
the consulting. The authors find large point estimates for the impacts on sales and profits, which are
sometimes significant depending on the measure used and the extent of trimming. However, the study
faces many of the same challenges as the business training studies reviewed above. First, the firms in
the sample are very heterogeneous, with the baseline coefficient of variation of sales of 3.7 –and 2.4
even after trimming the top 1 percent. Second, despite all firms signing a statement of interest, only 80
out of the 150 firms (53 percent) assigned to treatment decided to take it up. Third, attrition rates are
reasonably high and there is additional item non-response on profits and sales even among those who
are interviewed, so that only 288 firms (66.7 percent) provided data on profits in the follow-up survey.
The combination of high heterogeneity and reduced take-up lowers power. Combined with the high
attrition rates this means any bounding exercise would give non-informative bounds for impacts on
profits and sales. These are likely to be challenges facing any similar government program offering
subsidized consulting or business services to firms, such as the matching grant programs used in many
World Bank private sector loans.
The final individualized consulting study is Bloom et al. (2012), who focus on a much smaller sample of
17 large textile firms in India, with the typical firm having 270 employees, 2 plants, and sales of US$7.5
million per year. They provide 11 of these firms with five months of free intensive consulting provided
by Accenture Consulting, with the consultants averaging 781 hours per treated plant, spending their
time attempting to get the firms to implement 38 key management practices related to quality control,
factory operations, inventory, human resource management, and sales and order management. They
deal with the problem of small sample size by focusing on very homogeneous firms and collecting lots of

20
data from them, including weekly data on quality, output, and inventories. They find that adopting these
management practices raised productivity by 17% in the first year through improved quality and
efficiency and reduced inventory, and some evidence that within three years this led to the opening of
more production plants. The results thus show that in large firms, at least, changing management
practices can lead to substantial improvements in firm performance. However, they can only indirectly
estimate the changes in profits from this effort.
6. What we don’t know
There are now a range of studies which look a variety of business training programs, and examine
impacts on business practices, business outcomes, and potentially outcomes for microfinance
institutions. However, there are still a number of open questions that existing studies have barely
touched upon, but that are important for thinking about the case for policy action to support business
training.
Who does training help most?
Our discussion above has touched on heterogeneity in outcomes by gender of the owner and, to some
extent across studies, by firm size. Several studies have examined heterogeneity in other dimensions
such as owner’s education and baseline business skill levels, business sector, and interest in training.
However, the low power of most studies to find average effects for the full sample also means there is
relatively little power for examining the heterogeneity of effects.
As a result, who benefits most from training (or which types of training are most suitable for which types
of firms) is still an open question. On one hand, poor subsistence firms whose owners are only running
the business because they cannot find a wage job may have very low business skills. This suggests that it
should be relatively easy to make improvements, but perhaps the owners will be less interested or able
to implement the practices taught, or perhaps these practices only start having an effect as businesses
reach a larger scale. There is much talk of targeting gazelles- firms that grow rapidly – but even if
characteristics to identify such firms in advance can be found, it is unclear whether these firms need the
help, or would grow fast anyway. Theoretically one would like to target firms where skills are the
binding constraint on growth, but there is little evidence to date to say who such firms are, especially
among the smallest firms.
How does training help firms – and do any gains just come at the expense of other firms?
Most studies have not explored the channels through which training has impacts on business outcomes,
in part because of their lack of power in detecting an impact on profits in the first place. Does training
enable firm owners to use the same inputs more efficiently (thereby reducing costs and wastage), or is
the main impact through increasing marketing and sales efforts thereby increasing revenues at the same
cost ratios? The policy implications will differ depending on the channels. In particular, one possibility is
that gains to the treated firms come as a result of them taking customers from other firms. For example,
Mano et al. (2012) note that their training encouraged participants to be proactive in getting new
customers. Participants began issuing invoices and receipts with their mobile phone numbers printed on

21
them, which they believed had helped boost sales. Berge et al. (2011) suggest their training had impacts
on male clients through an expansion effect, since profit margins did not change whereas sales did.
Such spillovers have possible implications for both internal and external validity. If the increased sales
come mainly as a result of taking business from the control group firms, then this a violation of the
stable unit treatment value assumption (SUTVA), and the experimental estimate will no longer give the
average impact of training for the sample population. If the increased sales come mainly from other
firms not in the sample, the results of the experiment could be misleading with respect to the gain to
society from scaling up the training program. It should be noted that spillovers might also be positive, if
control or non-sample firms copy some of the techniques or new products introduced by firms which
have gone through training. Indeed this possibility is often given as one of the main justifications for
public subsidies of matching grant programs which subsidize the purchase of business development
services by small and medium enterprises. These issues are part of the broader question of how
competition responds to newly trained firms – we do not know whether this deters some new firms
from entering the industry, causes others to exit, or causes the incumbents who remain in business to
make other changes to the way they run their businesses.
To investigate this issue, a much larger sample is needed. Experimental variation in the intensity of the
treatment within different geographical areas could then be used to test for and measure these
spillovers. A first attempt in this direction is found in Calderon et al. (2012), which randomly assigned 17
villages into 7 treatment villages and 10 control villages, with half the individuals in the treated villages
then assigned to training. Their preliminary analysis surprisingly finds little evidence for spillovers,
despite working in remote villages with 1500 or fewer households and where people mostly make or sell
goods for local consumption. However, it is unclear how much power there is to examine these
spillovers given the relatively small number of villages included in the study.
Do larger impacts emerge over time?
As noted above, most of the studies take a single snapshot of the impact of the training at a relatively
short interval after training has ended. Two studies which have traced trajectories of impacts suggest
that effects can indeed vary a lot over time. In de Mel et al. (2012) the impacts on business start-up fade
with time, as control firms catch up. Bloom et al. (2012) find that introducing management practices in
larger firms shows immediate effects on quality, then slowly leads to changes in inventory levels, output
and productivity, and it is only after several years of using these practices that impacts start to show in
terms of employment generation (through new plants being opened). Given the large interest of many
governments in employment creation, studies which look only within a year or so of treatment ending
may miss effects that take some time to be realized – or conversely, we may find that effects which look
very promising in the short-term dissipate over time.
If it is so helpful, why don’t firms purchase it?
It is noticeable that all the business training studies reviewed here offer the training for free, as do two
out of the three consulting experiments with the other offering a 90 percent subsidy. In part this is done
for research purposes – in order to ensure sufficiently high take-up and to provide evidence on how

22
training influences a range of firms. Even then we have seen limits to demand, with some studies
struggling to get people to undertake training even when it is offered without cost.
As a result, we know very little about what types of firms would choose to purchase training at market
prices, and the effects of training on this subgroup of firms. We cannot even be sure that there are
market failures preventing firms who would benefit substantially from training from purchasing the
training at market prices. Several potential constraints or market failures are discussed in the literature
(e.g. Karlan and Valdivia, 2011; Bloom et al, 2012, Karlan et al, 2012). The first is that of an information
failure, whereby the value of business training services is not understood by entrepreneurs, and may be
particularly understated by those with the most to gain, who do not realize how poorly run their firms
are. A second is credit constraints: Firms may find it harder to borrow to finance training, an intangible
asset, than to finance assets which can be seized by a bank in the event of non-repayment. A third is
insurance market failures, with firm owners reluctant to take training even if they think it has a high
expected payoff, because they are unable to insure against the possibility that it doesn’t work. A fourth
possibility is supply-side constraints. Perhaps consulting or training services simply do not exist in the
market, so that even if a firm wanted to purchase these services it would find it hard to. A final
possibility is positive spillovers, whereby the public gains to training greatly exceed the private gains,
causing firms to underinvest. Each of these appears plausible in at least some settings, but to date there
is no evidence as to which constraints or market failures appear to occur most frequently. The optimal
policy response will differ depending on which constraint binds, so making progress on the issue of why
more firms don’t purchase training or consulting is likely to have useful implications for policy efforts.
Practices or Personality?
Much of the tradition in business training courses has been focused on teaching particular practices that
firm owners can implement in their firms. However, another school of thought is that the attitudes and
personalities that business owners bring to the business are equally, if not more, important. Premand et
al. (2012) report that one of the main objectives of trainers in their study was to change students’
personalities to “turn them into entrepreneurs”. They find that their intervention did lead to measurable
and significant changes in several domains of personality. For example, assignment to the
entrepreneurship track led to a significant decrease in agreeableness, ranging from 0.23 to 0.42
standard deviations compared to the level of agreeableness in the control group. They cite literature
suggesting that agreeableness is negatively associated with occupations such as business professionals
or managers and, as a result, note that the behavioral skills for entry into self-employment could differ
from behavioral skills needed to hold a salaried job. In addition, they find some impact of training on
extraversion, which they view as consistent with the emphasis in training on making students less shy
and more outspoken to turn them into entrepreneurs.
There is also a range of different training courses studied by psychologists which focus more on the
personality of being an entrepreneur than on the specific skills (Glaub and Frese, 2011). Glaub et al.
(2012) finds some evidence to support a positive impact of such training in Uganda. While several
studies have incorporated some aspect of aspirations or entrepreneurial attitudes into their content, to
date there is no research which tests the relative contribution of both types of training.

23
Conclusions and Suggestions for Future Work
The last few years have seen rapid growth in the number of randomized trials evaluating business
training programs, providing a growing body of evidence in an area with large policy interest. However,
to date a number of challenges have hampered how much we can learn from these studies, with
methodological concerns and heterogeneity in both training content, and in the characteristics of who is
trained, making comparisons across studies difficult. Many of the key questions needed to justify large-
scale policy interventions in this area remain unanswered. Researchers have learned more in the interim
about how to do firm experiments better, suggesting these difficulties are not insurmountable.
In order to learn more from the next generation of studies, we believe the following elements are
needed.
1. Much larger samples or more homogeneous firms: rather than more studies with 100 to 500
individuals in each treatment or control group, we ideally need studies to move to samples of
several thousand or more. This would increase the power of studies, and allow more
consideration of what types of people training works for best. An alternative to large cross-
sectional samples is to reduce the heterogeneity of the sample by focusing on firms within one
industry and size category, and collecting much more frequent time series data on these firms
(McKenzie, 2011, 2012).
2. Better measurement of outcomes: measuring firm profits and revenues has proved a real
challenge for many studies, and even less evidence is available on how exactly training changes
the firm’s production process. Further efforts to improve the measurement of financial
information (and to ensure that there is not just a measurement effect of training) are needed,
while focus on a specific industry or sector may allow more detailed production level monitoring
of physical outputs and inputs.
3. Designing experiments to measure spillovers: this could include more use of GPS measurement
to measure local spillovers (Gibson and McKenzie, 2007), and randomizing the intensity of
training at the local market level to see whether the effects differ when all firms competing in a
local area are trained versus when only some of them are trained, building on the work of
Calderon et al. (2012).
4. Measuring trajectories of outcomes over longer periods of time: the impacts of training may
differ in the short and medium terms, so measuring outcomes at multiple points in time will
enable better study of whether impacts take time to materialize, or whether others which
emerge quickly persist.
5. Testing which elements of content matter: with larger samples, one can build on the work of
Drexler et al. (2012) and test different forms of training, in order to determine which elements
of business skills have most impact, and whether training needs to focus on entrepreneurial
personality as well as processes. However, researchers need to avoid the temptation to do this
at the cost of ending up with insufficient power in each treatment arm.
6. Understanding market failures and building market-based solutions: almost every study has
given training away for free and still experienced difficulties getting take-up. There are many
open interesting questions concerning how one helps develop a market for these business

24
services and the types of policies that can overcome market failures that prevent firms from
using these markets.
References
Berge, Lars Ivar Oppedal , Kjetil Bjorvatn, Kartika Sari Juniwaty, and Bertil Tungodden (2012) “Business
training in Tanzania: From research driven experiment to local implementation”, Journal of African
Economics, forthcoming.
Berge, Lars Ivar Oppedal , Kjetil Bjorvatn, Bertil Tungodden (2011) “Human and financial capital for
microenterprise development: Evidence from a field and lab experiment”, NHH Discussion Paper Sam 1,
2011.
Bloom, Nicholas, Benn Eifert, Aprajit Mahajan, David McKenzie, and John Roberts (2012) “Does
management matter? Evidence from India”, Quarterly Journal of Economics, forthcoming.
Bloom, Nicholas and John van Reenen (2010) “Why do management practices differ across firms and
countries?”, Journal of Economic Perspectives 24(1): 203-24.
Bjorvatn, Kjetil and Bertil Tungodden (2010) “Teaching business in Tanzania: Evaluating participating
and performance”, Journal of the European Economic Association 8(2-3): 561-70.
Bruhn, Miriam, Dean Karlan and Antoinette Schoar (2012) “The Impact of Consulting Services on Small
and Medium Enterprises: Evidence from a Randomized Trial in Mexico”, Yale Economics Department
Working Paper no. 100.
Bruhn, Miriam, Dean Karlan and Antoinette Schoar (2010) “What capital is missing in developing
countries?”, American Economic Review Papers and Proceedings 100(2): 629–633.
Bruhn, Miriam and David McKenzie (2009) “In Pursuit of Balance: Randomization in Practice in
Development Field Experiments “, American Economic Journal: Applied Economics, 1(4): 200-232
Bruhn, Miriam and Bilal Zia (2012) “Stimulating Managerial Capital in Emerging Markets:
The Impact of Business and Financial Literacy for Young Entrepreneurs”, Mimeo. World Bank
Calderon, Gabriela, Jesse Cunha and Giacomo de Giorgi (2012) “Business literacy and development:
Evidence from a Randomized Trial in Rural Mexico”, Mimeo. Stanford University.
De Mel, Suresh, David McKenzie and Christopher Woodruff (2012) “Business Training and Female
Enterprise Start-up, Growth, and Dynamics: Experimental evidence from Sri Lanka”, Mimeo. World
Bank.

25
De Mel, Suresh, David McKenzie and Christopher Woodruff (2009a) “Measuring microenterprise profits:
Must we ask how the sausage is made?:, Journal of Development Economics, 88(1): 19-31.
De Mel, Suresh, David McKenzie and Christopher Woodruff (2009b) “Are Women more Credit
Constrained? Experimental Evidence on Gender and Microenterprise Returns.” American Economic
Journal: Applied Economics 1(3): 1-32.
Drexler, Alejandro, Greg Fischer, and Antoinette Schoar (2012) "Keeping it Simple: Financial Literacy and
Rules of Thumb", Mimeo. LSE
Duflo, Esther, Rachel Glennerster, and Michael Kremer. (2008). “Using randomization in development
economics research: A toolkit.” In Handbook of Development Economics, Vol. 4, ed. T. Paul Schultz and
John Strauss, 3895–3962. Amsterdam, NH: North Holland.
Fafchamps, Marcel, David McKenzie, Simon Quinn and Christopher Woodruff (2012) “Using PDA
consistency checks to increase the precision of profits and sales measurement in panels“, Journal of
Development Economics, 98(1): 51-57.
Fajnzylber, Pablo, William Maloney, and Gabriel Montes Rojas (2006) “Microenterprise Dynamics in
Developing Countries: How Similar are they to those in the Industrialized World? Evidence from
Mexico,” World Bank Economic Review 20(3): 389-419.
Field, Erica, Seema Jayachandran and Rohini Pande (2010) “Do traditional institutions constrain female
entrepreneurship? A field experiment on business training in India”, American Economic Review Papers
and Proceedings 100(2): 125-29.
Gibson, John and David McKenzie (2007) “Using global positioning systems in household surveys for
better economics and better policy”, World Bank Research Observer 22(2): 217-41
Giné, Xavier and Ghazala Mansuri (2011) “Money or Ideas? A field experiment on constraints to
entrepreneurship in rural Pakistan”, Mimeo. World Bank.
Glaub, Matthias and Michael Frese (2011) “A critical review of the effects of entrepreneurship training in
developing countries”, Enterprise development and microfinance 22(4): 335-53.
Glaub, Matthias, Michael Frese, Sebastian Fischer, and Maria Hoppe (2012) “A Psychological Personal
Initiative Training Enhances Business Success of African Business Owners”, Mimeo. National University
of Singapore Business School.
Karlan, Dean, Ryan Knight and Christopher Udry (2012) “Hoping to Win, Expected to Lose: Theory and
Lessons on Microenterprise Development”, Mimeo. Yale.
Karlan, Dean and Martin Valdivia (2011) “Teaching entrepreneurship: Impact of business training on
microfinance clients and institutions”, Review of Economics and Statistics 93(2): 510-27.

26
Kling, Jeffrey, Jeffrey Liebman, and Lawrence Katz (2007) ‘‘Experimental Analysis of Neighborhood
Effects,’’ Econometrica 75: 83–119.
Klinger, Bailey and Matthias Schündeln (2011) “Can entrepreneurial activity be taught? Quasi-
experimental evidence from Central America”, World Development 39(9): 1592-1610.
Mano, Yukichi, AlHassan Iddrisu, Yutaka Yoshino and Tetsushi Sonobe (2012) “How Can Micro and Small
Enterprises in Sub-Saharan Africa Become More Productive? The Impacts of Experimental Basic
Managerial Training”, World Development, 40(3): 458-68.
McKenzie, David (2012) “Beyond baseline and follow-up: the case for more T in experiments”, Journal of
Development Economics, forthcoming.
McKenzie, David (2011) “How can we learn whether firm policies are working in Africa? Challenges (and
solutions?) for experiments and structural models”, Journal of African Economics, 20(4): 600-25.
McKenzie, David (2010) “Impact Assessments in Finance and Private Sector Development: What have we
learned and what should we learn?”, World Bank Research Observer, 25(2): 209-33.
McKenzie, David and Michaela Weber (2009) “The results of a pilot financial literacy and business
planning training program for women in Uganda”, Finance & PSD Impact note no. 8
http://siteresources.worldbank.org/INTFR/Resources/Note8.pdf
Premand, Patrick, Stefanie Brodmann, Rita Almeida, Rebekka Grun and Mahdi Barouni (2012)
“Entrepreneurship training and self-employment among university graduates: Evidence from a
randomized trial in Tunisia”, Mimeo. World Bank
Schulz, Kenneth and David Grimes (2005) “Sample size calculations in randomised trials: mandatory and
mystical”, Lancet 365: 1348-53.
Sonobe, Tetsushi , Yukichi Mano, John Akoten, and Keijiro Otsuka (2010) “Assessing the Impacts of
Management Skill Training in Ghana and Kenya”, paper presented at the CSAE conference, 2010.
Sonobe, Tetsushi , Aya Suzuki, and Keijiro Otsuka (2011) “Kaizen for Managerial Skills Improvement in
Small and Medium Enterprises: An Impact Evaluation Study”, The World Bank
http://siteresources.worldbank.org/DEC/Resources/FinalVolumeIV.pdf
Valdivia, Martin (2012) “Training or technical assistance for female entrepreneurship? Evidence from a
field experiment in Peru”, Mimeo. GRADE.
Woolcock, Michael (2009) “Toward a plurality of methods in project evaluation: a contextualised
approach to understanding impact trajectories and efficacy”, Journal of Development
Effectiveness,1(1),1-14.

27
Table 1: Who are the participants in business training evaluations?
Existing All microfinance/ Rural Business Selected on interest Mean
Study Country Businesses? bank clients? or Urban Sector in training? Age % Female
Berge et al. (2012) Tanzania Existing Yes Urban Many No 38 65
Bruhn and Zia (2012) Bosnia-Herzegovina 67% existing Yes Urban Many Yes 28 35
Calderon et al. (2012) Mexico Existing No Rural Many No 46 100
De Mel et al. (2012) Sri Lanka 50% existing No Urban Many No 34-36 100
Drexler et al. (2012) Dominican Republic Existing (a) Yes Urban Many No 40 90
Field et al. (2010) India 24% existing Yes Urban Many No 32.4 100
Giné and Mansuri (2011) Pakistan 61% existing Yes Rural Many No 37.6 49
Glaub et al. (2012) Uganda Existing No Urban Many Yes 39 49
Karlan and Valdivia (2011) Peru Existing Yes Both Many No n.r. 96
Klinger and Schündeln (2011) El Salvador, Guatemala, Nicaragua 39% existing No n.r. Many Yes 36 28
Mano et al. (2012) Ghana Existing No Urban Metalwork No 45 0
Premand et al. (2012) Tunisia No No Urban Many Yes 23 67
Sonobe et al. (2011) Tanzania Existing No Urban Garments No 45 85
Ethiopia Existing No Urban Metalwork No 44 4
Vietnam Existing No Urban Rolled Steel No 40 55
Vietnam Existing No Urban Knitwear No 41 66
Valdivia (2012) Peru Existing No Urban Many Yes 43 100
Notes:
n.r. denotes not reported
(a) 78% of sample is existing businesses, and study does not look at business outcomes for those who were not existing at baseline.
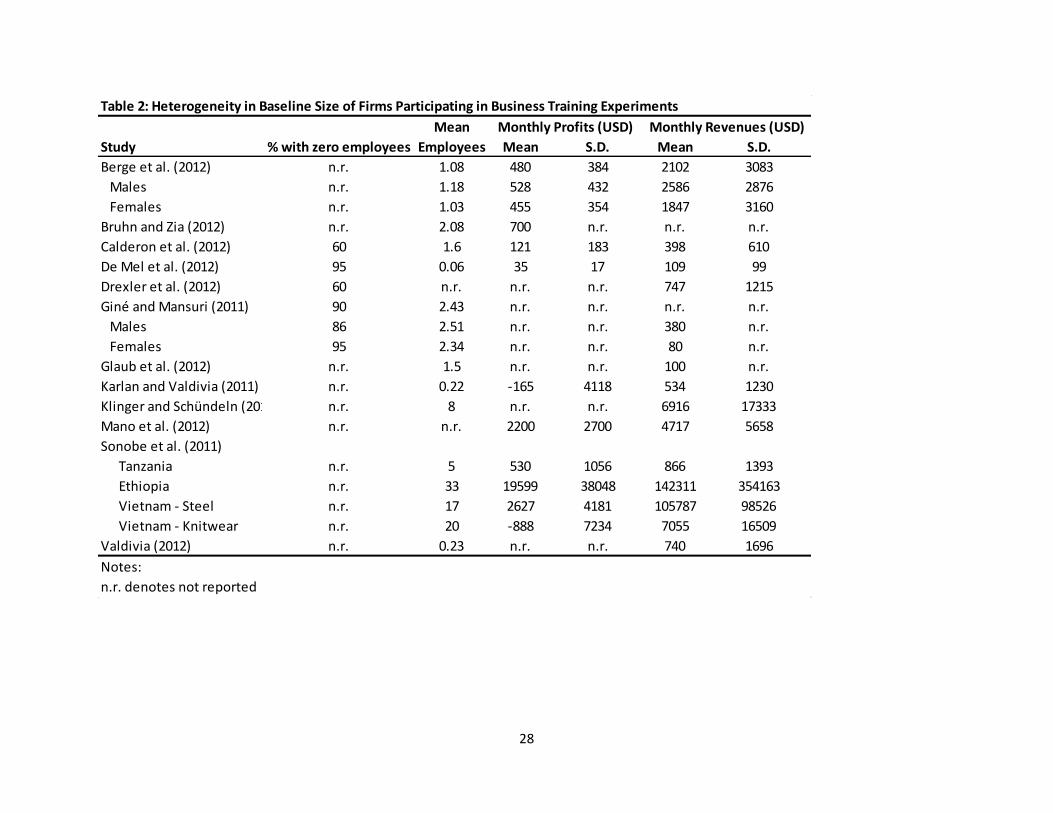
28
Table 2: Heterogeneity in Baseline Size of Firms Participating in Business Training Experiments
Mean
Study % with zero employees Employees Mean S.D. Mean S.D.
Berge et al. (2012) n.r. 1.08 480 384 2102 3083
Males n.r. 1.18 528 432 2586 2876
Females n.r. 1.03 455 354 1847 3160
Bruhn and Zia (2012) n.r. 2.08 700 n.r. n.r. n.r.
Calderon et al. (2012) 60 1.6 121 183 398 610
De Mel et al. (2012) 95 0.06 35 17 109 99
Drexler et al. (2012) 60 n.r. n.r. n.r. 747 1215
Giné and Mansuri (2011) 90 2.43 n.r. n.r. n.r. n.r.
Males 86 2.51 n.r. n.r. 380 n.r.
Females 95 2.34 n.r. n.r. 80 n.r.
Glaub et al. (2012) n.r. 1.5 n.r. n.r. 100 n.r.
Karlan and Valdivia (2011) n.r. 0.22 -165 4118 534 1230
Klinger and Schündeln (2011) n.r. 8 n.r. n.r. 6916 17333
Mano et al. (2012) n.r. n.r. 2200 2700 4717 5658
Sonobe et al. (2011)
Tanzania n.r. 5 530 1056 866 1393
Ethiopia n.r. 33 19599 38048 142311 354163
Vietnam - Steel n.r. 17 2627 4181 105787 98526
Vietnam - Knitwear n.r. 20 -888 7234 7055 16509
Valdivia (2012) n.r. 0.23 n.r. n.r. 740 1696
Notes:
n.r. denotes not reported
Monthly Profits (USD) Monthly Revenues (USD)

29
Table 3: Key Characteristics of Training Delivery
Training content Course Length Participant Actual Attendance
Study Training Provider new or established? (hours) Cost (USD) Cost (USD) Rate
Berge et al. (2012) Training professionals New 15.75 0 $70 83%
Bruhn and Zia (2012) Training organization New 6 0 $245 39%
Calderon et al. (2012) Professors & Students New 48 0 n.r. 65%
De Mel et al. (2012) Training organization Established (ILO) 49-63 0 $126-140 70-71%
Drexler et al. (2012)
"Standard" Local instructors New 18 0 or $6 $21 50%
"Rule-of-thumb" Local instructors New 15 0 or $6 $21 48%
Field et al. (2010) Microfinance credit officers New (a) 2 days 0 $3 71%
Giné and Mansuri (2011) Microfinance credit officers New (b) 46 0 n.r. 50%
Glaub et al. (2012) Professor New 3 days 0 $60 84%
Karlan and Valdivia (2011) Microfinance credit officers Established (FFH) 8.5-22 (c) 0 n.r. 76-88%
Klinger and Schündeln (2011) Training professionals Established (Empretec) 7 days 0 n.r. n.r.
Mano et al. (2012) Local instructors New (d) 37.5 0 $740 87%
Premand et al. (2012) Govt. office staff New 20 days + 0 n.r. 59-67%
Sonobe et al. (2011)
Tanzania Training professionals New (d) 20 days 0 >$400 92%
Ethiopia Training professionals New (d) 15 days 0 75%
Vietnam - Steel Training professionals New (d) 15 days 0 39%
Vietnam - Knitwear Training professionals New (d) 15 days 0 59%
Valdivia (2012) Training professionals New 108 (e) 0 $337 (f) 51%
Notes:
(a) Shortened version of existing program + new content on aspirations added.
(b) Adapted from ILO's Know About Business modules
(c) Training sessions were each 30 minutes to 1 hours, and up to 22 sessions occurred, but only half had done 17 sessions over 24 months.
(d) Based in part on ILO content + Japanese Kaizen content.
(e) Although only 42% of those attending completed at least 20/36 sessions, and only 28% attended 30 sessions or more.
(f) The basic training cost $337, while the technical assistance plus basic training cost $674.
FFH denotes Freedom from Hunger; ILO denotes the International Labor Organization.
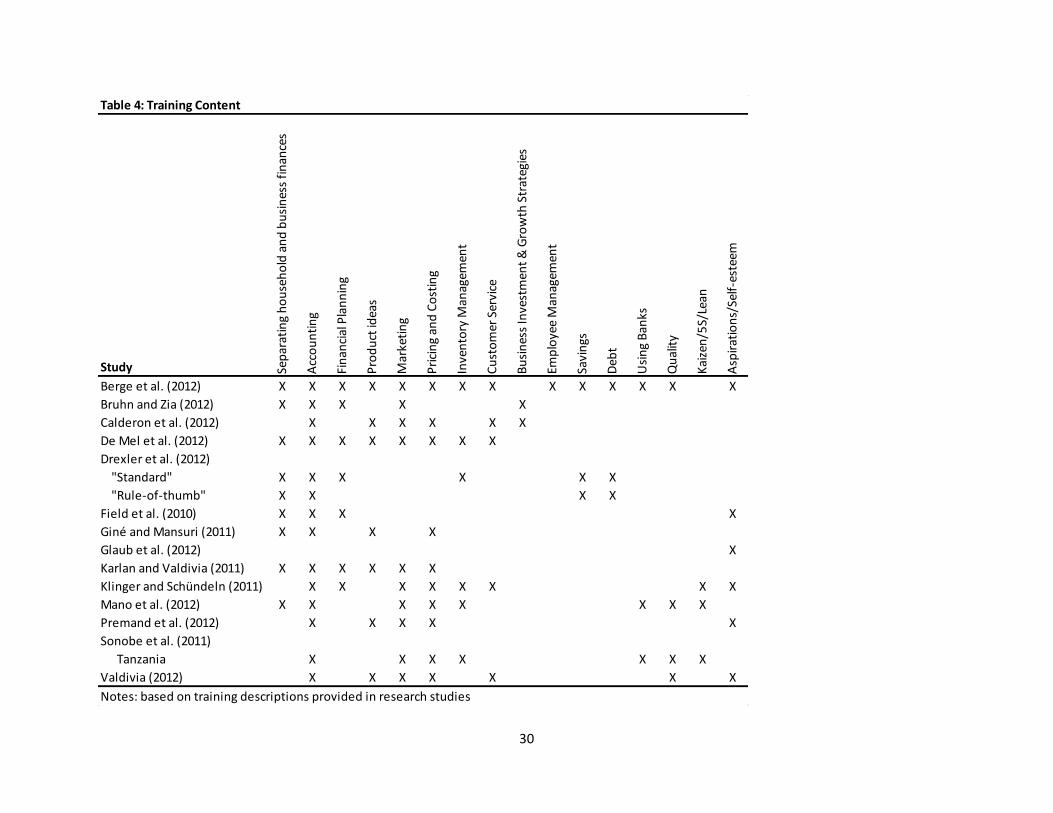
30
Table 4: Training Content
Study Sep
arat
ing
ho
use
ho
ld a
nd
bu
sin
ess
fin
ance
s
Acc
ou
nti
ng
Fin
anci
al P
lan
nin
g
Pro
du
ct id
eas
Mar
keti
ng
Pri
cin
g an
d C
ost
ing
Inve
nto
ry M
anag
emen
t
Cu
sto
mer
Ser
vice
Bu
sin
ess
Inve
stm
ent
& G
row
th S
trat
egie
s
Emp
loye
e M
anag
emen
t
Savi
ngs
Deb
t
Usi
ng
Ban
ks
Qu
alit
y
Kai
zen
/5S/
Lean
Asp
irat
ion
s/Se
lf-e
stee
m
Berge et al. (2012) X X X X X X X X X X X X X X
Bruhn and Zia (2012) X X X X X
Calderon et al. (2012) X X X X X X
De Mel et al. (2012) X X X X X X X X
Drexler et al. (2012)
"Standard" X X X X X X
"Rule-of-thumb" X X X X
Field et al. (2010) X X X X
Giné and Mansuri (2011) X X X X
Glaub et al. (2012) X
Karlan and Valdivia (2011) X X X X X X
Klinger and Schündeln (2011) X X X X X X X X
Mano et al. (2012) X X X X X X X X
Premand et al. (2012) X X X X X
Sonobe et al. (2011)
Tanzania X X X X X X X
Valdivia (2012) X X X X X X X
Notes: based on training descriptions provided in research studies

31
Table 5: Power of Studies to Detect Increases in Profits or Sales
Group or Individual Sample Sizes in Treatment (T) C.V. C.V. Attendance 25% in 50% in 25% in 50% in
Study Randomization? and Control (C) Groups Profits Revenues Rate Profits Profits Revenues Revenues
Berge et al. (2012) Group 119 (T), 116 (C) groups (a) 0.80 1.47 83% 0.631-0.842 0.996-1.000 0.239-0.365 0.705-0.897
Bruhn and Zia (2012) Individual 297 (T), 148 (C) 2.69 n.a. 39% 0.070 0.132 n.a. n.a.
Calderon et al. (2012) Two-stage 164 (T), 711 (C) (c) 1.51 1.53 65% 0.263 (b) 0.754 (b) 0.257 (b) 0.743 (b)
De Mel et al. (2012) Individual 200 (T1), 200 (T2), 228 (C) 0.49 0.91 70% 0.990 1.000 0.632 0.994
Drexler et al. (2012) Individual 402 (T1), 404 (T2), 387 (C) n.a. 1.63 49% n.a. n.a. 0.231 0.686
Giné and Mansuri (2011) Group 373 (T), 374 (C) groups n.a. n.a. 50% n.a. n.a. n.a. n.a.
Glaub et al. (2012) Individual 56 (T), 53 (C) n.a. n.a. 84% n.a. n.a. n.a. n.a.
Karlan and Valdivia (2011) Group 138 (T), 101 (C) groups -24.96 2.30 80% 0.057 (b) 0.078 (b) 0.120-0.757 0.335-1.000
Klinger and Schündeln (2011) Individual RD 377 (T), 278 (C) n.a. 2.51 n.a. n.a. n.a. 0.259 (d) 0.746 (d)
Mano et al. (2012) Individual 47 (T), 66 (C) (b) 1.23 1.20 87% 0.188 0.571 0.195 0.592
Sonobe et al. (2011)
Tanzania Individual 53 (T), 59 (C) 1.99 1.61 92% 0.109 0.292 0.141 0.414
Ethiopia Individual 56 (T), 47 (C) 1.94 2.49 75% 0.087 0.204 0.072 0.142
Vietnam - Steel Individual 110 (T), 70 (C) 1.59 0.93 39% 0.075 0.153 0.124 0.353
Vietnam - Knitwear Individual 91 (T), 70 (C) -8.15 2.34 59% 0.052 0.058 0.074 0.150
Valdivia (2012) Individual 709 (T1), 709 (T2), 565 (C) n.a. 2.29 51% n.a. n.a. 0.207 0.626
Notes:
n.a. denotes not available, either because the study did not report this outcome, or because it didn't report the coefficient of variation (C.V.).
Personal correspondence with authors used to obtain C.V.s from studies which only report sample means and not standard deviations.
Where range is shown, first number is power if intra-cluster correlation is one, second is power if intra-cluster correlation is zero.
(a) Numbers in control and training only groups - the study also includes groups with grants. Power calculations based on random assignment to groups, which is the
working assumption of the paper, although in practice true random assignment only occurred at the branch-day of the week level, in which case power is zero.
(b) Power calculation assuming randomization was at the individual level. Actual power will be lower once group-level randomization is accounted for.
(c) Assignment first at the village level to 7 treated villages and 10 control villages, then assignment within village to treatment and control.
(d) Study does not examine revenue as an outcome, since some data is collected retrospectively.
Power calculations ignore survey attrition, which would further lower power. They also assume entire sample are existing enterprises.
Attendance rate for Klinger and Schündeln (2011) assumed to be 90% for purpose of power calculations.
Power calculations assume one baseline and one post-treatment survey, with an autocorrelation in the outcome variable of 0.5, and ANCOVA estimation.
Power to Detect Increase of:

32
Table 6: Follow-up Survey Timing of Different Studies
Study Number of Follow-up Surveys Months since Intervention Attrition rate
Berge et al. (2012) 2 5 to 7, 29-31 13 to 18 (c)
Bruhn and Zia (2012) 1 5 to 6 11
Calderon et al. (2012) 2 8, 28 15-26 (b)
De Mel et al. (2012) 4 4, 8, 16, 25 6 to 8
Drexler et al. (2012) 1 12 13 to 46 (a)
Field et al. (2010) 1 4 5.3
Giné and Mansuri (2011) 1 19-22 16
Glaub et al. (2012) 2 5, 12 11
Karlan and Valdivia (2011) 1 12 to 24 24
Klinger and Schündeln (2011) 1 12 28
Mano et al. (2012) 1 12 17
Premand et al. (2012) 1 9 to 12 7.2
Valdivia (2012) 1 10 18
Notes:
(a) Attrition rate is 46% for business outcomes like sales, 13% for business practices.
(b) Rates are for first and second follow-ups respectively. Additionally note that 21 (50) percent of non-attritors
had closed down by the first (second) follow-up surveys, so profit and revenue outcomes are on smaller sample.
(c) Note the study only surveys 644 out of the 1164 clients, based on accessibility by phone.

33
Table 7: Impacts of Business Training on Business Start-up and Survival
Study Gender Point estimate 95% CI Point estimate 95% CI
Bruhn and Zia (2012) Mixed 0.013 (-0.09, +0.10) 0 n.r.
Female -0.125 n.r., not sig. 0 n.r.
Male 0.072 (-0.07, 0.21) 0 n.r.
Calderon et al. (2012) Female -0.034 (-0.13, +0.06) n.r. n.r.
De Mel et al. (2012)
Current Enterprises Female -0.026 (-0.102, +0.051) n.r. n.r.
Potential Enterprises Female n.r. n.r. +0.09 (4 months) (0, 0.18)
-0.02 (25 months) (-0.11, 0.07)
Giné and Mansuri (2011) Mixed 0.034 (-0.021, 0.089) -0.006 (-0.02, +0.01)
Male 0.061 (-0.012, 0.133) -0.011 (-0.04, +0.01)
Female 0.001 n.r., not sig. 0.002 n.r., not sig.
Glaub et al. (2012) Mixed 0.05 n.r. n.r. n.r.
Karlan and Valdivia (2011) Female n.r. n.r. -0.019 (-0.05, +0.01)
Klinger and Schündeln (2011)
selected in first phase Mixed n.r. n.r. 0.044 (-0.12, 0.21)
selected in first phase Female n.r. n.r. -0.019 (-0.31, +0.27)
getting trained in second phase Mixed n.r. n.r. 0.465 (0.10, 0.82)
Female n.r. n.r. 0.572 (0.04, 1.10)
Mano et al. (2012) Male 0.095 (0.022, 0.167) n.r. n.r.
Premand et al. (2012) Mixed n.r. n.r. 0.04 (0.02, 0.06)
Male n.r. n.r. 0.06 (0.04, 0.08)
Female n.r. n.r. 0.03 (0.01, 0.05)
Valdivia (2012)
General training Female -0.045 (-0.094, +0.004) 0.014 (-0.03, +0.06)
Training + technical assistance Female 0.021 (-0.014, +0.056) -0.006 (-0.05, +0.04)
Notes:
95% CI denotes 95 percent confidence interval. Impacts significant at the 10% level or more reported in bold.
n.r. denotes not reported. Not sig. denotes point estimate is not significantly different from zero.
Berge et al. (2012) and Drexler et al. (2012) do not report impacts on either survivorship or start-up
Note Valdivia (2012) survival is based on whether they stopped any business in the past two years, while start-up
is based on whether they started a new business in the last year.
Impact on Survival Impact on Start-up

34
Table 8: Impact of Business Training on Business Practices
Number
Study Gender Units of Practices Point estimate 95% CI
Berge et al. (2012) Male p.p. 4 (a) 0.03-0.08 n.a.
Female p.p. 4 (a) -0.02-0.00 n.a.
Bruhn and Zia (2012) Mixed s.d. 3 0.272 (0.03, +0.51)
Male s.d. 3 0.290 (0.01, 0.57)
Female s.d. 3 0.214 n.r.
Calderon et al. (2012) Female p.p. 1 0.062 (-0.02, +0.14)
De Mel et al. (2012)
Current Enterprises Female num 29 2.03 (1.27, 3.30)
Potential Enterprises Female num 29 0.87 (-0.23, +1.97)
Drexler et al. (2012)
"Rule-of-thumb" Mostly Female s.d. 12 0.14 (0.06, 0.22)
"Standard" Mostly Female s.d. 12 0.07 (-0.03, 0.17)
Giné and Mansuri (2011) Mixed s.d. 3 0.131 (0.01, 0.25)
Male s.d. 3 0.114 (-0.05, 0.28)
Female s.d. 3 0.140 n.r.
Karlan and Valdivia (2011) Mostly Female s.d. 14 0.03 (0.00, 0.06)
Mano et al. (2012) Male p.p. 3 0.24-0.42 n.a.
Valdivia (2012)
General training Female s.d. 11 0.01 (-0.02, +0.04)
Training + technical assistance Female s.d. 11 0.05 (0.02, 0.08)
Notes:
95% CI denotes 95 percent confidence interval. Impacts significant at the 10% level or more reported in bold.
Units for measuring practices are either standard deviations of a normalized aggregate (s.d.), percentage
points (p.p.), or number of distinct practices improved (num).
Number of practices is the total number of practices measured.
When no aggregate measure is reported, the range of point estimates for individual practices is given.
n.r. denotes not reported. n.a. denotes not applicable since range of estimates given.
(a) we include here their index of three marketing practices, plus their result on record-keeping. No aggregate
measure is provided.

35
Table 9: Impacts on Business Profits and Sales
Study Gender % increase 95% CI % increase 95% CI
Berge et al. (2012)
Male 5.4% (-20%, +38%) 31.0% (-4%, +79%)
Female -3.0% (-23%, +22%) 4.4% (-23%, +22%)
Bruhn and Zia (2012) Mixed -15% (-62%, + 32%) n.r. n.r.
Calderon et al. (2012) Female 24.4% (-1%, 56%) 20.0% (-2%, +47%)
De Mel et al. (2012)
Current Enterprises Female -5.4% (-44%, +33%) -14.1% (-68%, +40%)
Potential Enterprises Female 43% (+6%, +80%) 40.9% (-6%, +87%)
Drexler et al. (2012)
"Standard" Mostly Female n.r. n.r. -6.7% (-24.5%, +11.2%)
"Rule-of-thumb" Mostly Female n.r. n.r. 6.5% (-11.4%, +24.4%)
Giné and Mansuri (2011) Mixed -11.4% (-33%, +17%) -2.3% (-15%, +13%)
Male -4.3% (-34%, +38%) 4.8% (-14%, +27%)
Female n.r. (a) n.r. n.r. (a) n.r.
Glaub et al. (2012) Mixed n.r. n.r. 57.4% (c) n.r.
Karlan and Valdivia (2011) Mostly Female 17% (b) (-25%, +59%) 1.9% (-9.8%, +15.1%)
Mano et al. (2012) Male 54% (-47%, +82%) 22.7% (-31%, +76%)
Valdivia (2012)
General training Female n.r. n.r. 9% (-8%, +29%)
Training + technical assistance Female n.r. n.r. 20.4% (+6%, 37%)
Notes:
95% CI denotes 95 percent confidence interval. Impacts significant at the 10% level or more reported in bold.
n.r. denotes not reported.
(a) They look at an aggregate sales and profitability measure and find no significant impact for either gender.
(b) Impact on profit from main product.
(c) Calculated as difference-in-difference calculation. Study reports difference in log sales is significant at the 1% level.
Profit increases are scaled as a percentage of the control group mean to enable comparability.
When multiple rounds are used, longest-term impacts available are reported.
Profits Revenues