1 yfc investor presentation en 20200911 final
TRANSCRIPT

0
YFC-Bon Eagle6220 TT
Investor PresentationSeptember 2020

1
Table of ContentsIntroduction
Message from Andrew
Company Overview• Executive Summary• Core Strategy• Milestones
About YFC• YFC at a Glance• YFC Product Portfolio• Monoprice• Prime• Bestlink
Our Strategy to Increase Shareholder Returns
1H20 Review
Financial Summary
1
2
3
4
5
6
7

2
“四海內皆兄弟“-論語
“Within the Reach of the Great Oceans, All Men are Brothers”-The Analects of Confucius
“⼈盡其才,地盡其利,物盡其⽤,貨暢其流” -孫中山
Employ each person’s talents to their greatest potentialUse the full resources of the land to benefit all
Put material resources to their highest and best useCause material goods to circulate smoothly and widely
-Sun Yat-Sen
3
In the early 2000s, industry peersadded ever more ‘me too’ capacity –YFC realized it would result inoversupply and severe pricecompetition.
A Message from Chairman Andrew Yeh
“If your heart is big enough to take on the concerns and welfare of yourcolleagues and customers and to treat them as your own, then they will becomefamily to you; and loyalty, partnership and shared prosperity will follow.”
Instead, YFC sought differentiationthrough proprietary brands, beginningwith our investment in Prime Wireand Cable in 2006.
The 2016 acquisition of Monoprice,and its branded 3C Ecommerceplatform was another step forward inthe process of building our globalbrand and marketing presence.
In the modern business world, onlythe companies that adapt and evolvewill prosper. Those that don’t willperish.
1 3
2 4

4
3 Company Overview

5
Executive Summary
§ Our company culture is rooted in the Taiwan manufacturing tradition. We
compete through strict cost management and superior manufacturing
engineering, while driving growth with an entrepreneurial spirt and a
strong work ethic.
§ Yet, we are distinctly untraditional in our ability to acquire and retain top
talent in overseas branded channel companies.
§ Our ambition is to become a globally branded, omni channel presence.
That is, we will be as comfortable marketing through Ecommerce platforms
as we are selling to traditional, brick-and-mortar retail players. We will sell
products that are differentiated and achieve brand recognition, while
providing our clients with end-to-end supply chain support.
§ Our goal is to sustain a minimum 15% ROE. 2017-2019 ROE averaged 13%.
Culture
Resources
Channels
Goal
Driving growth through Branded Product and Channel Innovation

6
YFC-BonEagle Core Strategy & Values
YFC-BonEagle Core Strategy & Values
Establish a Global Branded Presence
Transparency & Shareholder Alignment
Retain Key Staff with a ‘Benevolent’ Culture
§ YFC has been building its global, branded omni channel presence since 2004, when it chose differentiation through vertical investment in the branded channel over ‘me too’ expansion in production facilities.
§ Our major acquisitions have been made for less than 1x Sales.
§ We use organic core competencies and acquired assets to drive growth.
§ A policy of transparency and accountability is maintained across the organization.
§ All major subsidiaries are 100% owned.
§ Founders + BOD + Supervisor holdings are 38%.
§ Chairman Andrew Yeh believes in cultivating loyalty amongst employees through fair treatment and equitable compensation.
§ All 5 founding shareholders are still with YFC, as are top senior managers who were with Monoprice, Prime & Bestlink at the time of acquisition.
§ We have a deep bench of senior and middle managers to ensure succession within the management team.

7
2017- Established YFC-BonEagle International, Inc. in Manila
- Established Monoprice Gmbh in Germany
YFC-BonEagle Milestones
2006- Acquired Prime Wire & Cable,
Inc. in USA
1983- Established YFC-BonEagle
Taiwan HQ
2004- Established Premium
Line in Germany- Established Bestlink
Netware, Inc. in USA
1990- Established YFC-BonEagle
Dongguan Plant in Guangzhou, China
2003- Listed on TPEx
- Established Wuxi Plant in Jiangsu,
China
2016- Acquired Monoprice,
Inc. in USA- Acquired PL-SKI Inc.
in Austria
2019
REVENUE: US $374Mn1,524 Employees
Globally

8
4 About YFC

9
YFC-BonEagle at a Glance
Manufacturing & Wholesale
E-Commerce & B2B Direct* B2B Retail Channels
YFC-BonEagle has 3 factories with a total of over 1.5mn
square feet of manufacturing space.
Business Unit:YFC-BonEagle
Monoprice sells over 6,500 consumer electronics items
via its E-commerce platform.
Business Units:MonopriceBestlink
Prime is a leading US supplier of extension cords, surge protectors and power strips. Its top client is
Lowe’s.
Business Units:Prime
Monoprice
YFC Group has a total of 475,000 square feet of scalable, E-commerce-capable warehouse and distribution space in the US.
*B2B offline sales to SMB, Installers and Enterprise.

10
YFC-BonEagle at a Glance in Numbers
* Note: This figure accounts for YFC-BonEagle MFG external sales only.
Sales Breakdown by Channel
Sales Breakdown by Geography
Business Unit YFC-BonEagle Monoprice Prime Bestlink
Business TypeMFG &
WholesaleE-Commerce &
B2B Direct B2B Retail E-Commerce
Focus Geography Global Global US US
Established 1983 2002 1986 2004
2019 Revenues (US$m) 79.7* 150.1 128.3 15.8
% of total YFC 2019 Revenues 21% 40% 34% 4%
Acquired by YFC-BonEagle 2016 2006
Acquisition Cost (US$M) 40 24
Revenues @ Acquisition (US$m) 142.4 40.0
Acquisition Multiple (PSR) 0.3 0.6
YFC has a track record of successful channel acquisitions in the US and a proven ability to retain top talent
86% 82%
8%9%
6% 8%
0
3,000
6,000
9,000
12,000
2018 2019
USA & Canada Greater China Other
NT$m
NT$m
7% 16%
47% 45% 44%66%64%
40% 40%35%
27%20%
13% 15%21%
0
3,000
6,000
9,000
12,000
2015 2016 2017 2018 2019
E-Commerce B2B Retail Manufacturing

11
YFC-BonEagle Product Portfolio
Prime Wire and CablePrime is a branded B2B vendor
selling to brick-and-mortar retailers.
MonopriceYFC Bon-EagleOur core product focus is Own-Brand
Proprietary Products for Tech Enthusiasts. Our Retail prices are 30-
70% lower than competitors.
YFC-Bon-Eagle manufactures Power Cords and 3C Cables & Accessories,
selling internally and externally.
Growth Products
Heating Cable EV Cable Solutions
Future Growth
Power Cords3C Cables & Accessories Cables Adapters Audio & Video
Accelerator(1) Pro Audio
Power Cords Surge Protectors
Timers Lighting

12
51%49%
Sales Breakdown for Key YFC-BonEagle Business Units
Cables
Adapters
Audio & Video
Accelerator
Pro Audio
3rd Party Branded
48%
15%
10%
16%
7%4%
3C Cables & Accessories
Power Cords
% of 2019 Revenue
Prime Wire and CableMonopriceYFC-BonEagle
% of 2019 Revenue % of 2019 Revenue
Power Cords
Surge Protectors
TimersOthes
71%
16%
6%7%

13
Manufacturing
Channel
E-commerce
Wuxi, China
YFC-BonEagle
Chenzhou, China
YFC-BonEagle
YFC-BonEagle
Dongguan, China
Taiwan
YFC-BonEagle HQ
Vienna,AustriaRaubling,Germany
Manila, Philippines
YFC-BonEagleInternational
Brea, USARancho Cucamonga, USA
Hebron, USA
Cerritos, USA
Los Angeles, USAMooresville, USA
YFC-BonEagle Global Footprint
3PL Distribution CtrRotterdam/Venlo,
Amsterdam
Monoprice GmbhBerlin, Germany

14
Monoprice Profile
Monoprice has a strong industry following with significant recent press coverage
§ Monoprice sells high quality, branded product direct to consumers− Similar quality to high-end brands, but sold at retail prices 30% -
70% lower than competitors− Healthy gross margins, due to ‘branded direct’ sales model
§ Products are manufactured at comparable factories to prominent global brands− Monoprice utilizes import data and its sourcing relationships to find
manufacturers for strategically targeted products and/or key product components for its products.
§ Monoprice has an established and growing multi-channel platform− 1) Monoprice.com 2) B2B sales channel 3) Marketplaces
§ The Monoprice customer set is growing in scale and diversity − 1) B2B: F-500 enterprises small and medium-sized businesses and
small office home office (SOHO)− 2) B2C: Prosumers, tech enthusiasts and an increasing number of
mainstream consumers

15
§ 2019 sales were US$128 million, down 4.5%. This followed a 2.5% YoY decline in 2018.
§ Sales peaked in 2017 at US$137.8m, as new products such as lighting and timers, helped drive a 9% CAGR in sales between 2013-2017.
§ However, starting in 2018, sales began a mild decline, due to the US-China Trade War and store closings at Lowe’s – which accounts for roughly 50% of Prime’s sales.
§ Between 2018-2019, Lowe’s closed 26 stores in the US and 13 in Mexico, in addition to 59 Rona’s stores in the Canada and all 99 Orchard Supply Hardware Stores in the US. Current store count is 1,977.
§ The 25% tariff on China-produced extension cords in 2019 disrupted Prime’s entire business in terms of supply chain, production location, capital investment, legal issues and US customs compliance, as well as vendor and client relationships.
§ Our biggest accomplishment in 2019 was maintaining our customer base and remaining profitable. In 2019, business from Lowe’s stabilized, after suffering a drop in 2018.
US-China Trade War & Lowe’s store closings negatively impacted sales in 2018-2019
Prime Wire & Cable 2019 Overview

16
Steps taken to Address the Tariffs in 2019§ Insituted immediate price increases to all
customers – allowed higher profits on all existing stock at that time.
§ Successfully added Menard’s as a high-volume client and greatly increased sales to Kroger.
§ Brought in more inventory than normal ahead of tariff implementation to avoid the additional 25% increase.
§ Identified & certified tariff-free factories in Ecuador, The Philippines, Taiwan and Vietnam. Signed supply relationships with select plants.
§ To avoid legal liability, visited all factories manufacturing extension cords and surge protectors outside of China to verify they were complying with US customs laws. Disqualified violators as the penalty for using them is 4x the value of shipments and potential imprisonment.
Prime Wire & Cable 2019 Overview
Our Key Clients

17
Our Strategy to Increase Shareholder Returns5

18
YFC-BonEagle Strategic Vision 2025
Deliver profitable, high single digit annual revenue growth
Strive to Achieve ROE of 15% or Greater
Increase Non-US sales to 15-20%
of total
Maintain a 50-60% cash dividend payout over
the next 3 years
Maximize FCF via strict management of NWC and
the Cash Conversion Cycle
Vision 2025

19
Our Path to Higher Shareholder Returns
Move out of commoditized areas of the Cable Industry & Raise Plant Efficiency
Drive Sustainable Growth with our Omni Channel, Multi-Brand presence
Strategic Initiatives Strategic purpose
Continue downwards vertical integration & reduce exposure to material costs
Expand Monoprice & Prime B2B Client Base while Maximizing Sales to existing B2B Clients
International Expansion with a Focus on the EU
B2B business is higher margin than B2C and has higher customer retention rates
Drive top line growth & purchasing economies of scale
Expand Monoprice B2C Target Segment to Prosumer + Tech Confident
This is a natural extension of the Monoprice business model

20
Marketplace
§ Strong growth channel § Provides customer diversification
and access to Int’l markets§ Lower gross margin
(listing fees & MDF)
B2B
§ Large, repeatable & predictable revenue
§ High customer retention§ Opportunity to expand customer
base and product breadth amongst large enterprises
B2C§ Prosumer and Tech Confident DIY§ Monoprice.com & Marketplaces§ Large TAM
Tech enthusiasts, F500 Enterprises, Small Businesses and Government & Education
Omni Channel through Monoprice
B2C
27%
Marketplace
47%
B2B
Marketplace
B2C
B2B
26%
Note: Percentages in the Pie Charts are % of 2019 total Monoprice net revenue.

21
Expanding B2B through MonopriceEstablishing New Customers While Growing Current Strategic Accounts via Reinforced Field & Inside Sales Organizations
Cables & Accessories
(80% Brand Flexible)
$5B
US B2B Ecommerce
Sales$780B
Target
$4B
US B2B CE/IT
Ecommerce Sales
SOURCE: CRN, CDW, CTA, Cabling Installation & Maintenance, PC World
Near Term Addressable Market
END-USERSF-500/Enterprise Government Education
IT Installers AV InstallersINSTALLERS
Disti/VARINDIRECT
Current Client List
Strategic Vertical Client Targets
• Fortune 500/Large Enterprise• Education: K-12 Large Districts/Higher Education (colleges/universities)• Fed/State/Local Government & Healthcare• IT & AV Installers• Indirect: Distributors/VARs• International B2B: EU, Canada, Latin America, Pacific Rim, APAC• Traditional (in-store) Retail
Managed B2B Sales Reorganization
• More effective/productive field & inside sales model.• Field sales manager with 4 "in-region" strategic field
sales reps based in key geographic markets. • Dedicated Inside sales manager driving enhanced
inside sales organization, platform & program.
Large Strategic Account Acquisition
• Field sales focused on securing large (tier 1) new strategic accounts across all targeted verticals.
• Duplicating success Monoprice has had with other large accounts: Google, ID Tech and Wren & Associates.
Outsourced Inside Sales Expansion
• Hunter-based model: volume prospecting for securing new tier 2, tier 3 accounts.
• Account mining mechanism for potential inside and field managed accounts.
Traditional Retail Expansion
• Secure/expand/grow 3-5 large strategic in-store retailers.
• Targets: Costco, MicroCenter, Home Depot, Walmart, Fry's.

22
Marketing initiatives are focused on Sales Support
Expanding B2B through Prime Wire & Cable
Stronger YouTube presence for PMs & consumers
Photo booth to support online customers
Self-produced POS displays to drive clients’ sales

23
International Expansion
YFC Europe
South East Asia
Monoprice International Expansion
§ KSI (Austria): Licensed Agent of Nexans networking products, will also distribute YFC-BonEagle Product in the EU.
§ Premium (Germany): Branded Vendor of High-Quality Structured Cable Systems. YFC plans to take the brand global.
§ YFC-BonEagle International (Philippines): Established to tap the Industrial and Construction markets with Prime and Premium product.
§ Monoprice value proposition of simplicity, fairness, and confidence in technology choices resonates with International buyers around the world
§ Monoprice has customers in over 85 countries, but only 5% of sales come from outside of the U.S
§ The EU presents a large B2C opportunity to start, with a B2B follow-up. EU Sales grew 115% YoY in 1H20 to US$1.7 million.
§ We are expanding our Asia presence and opportunity through the launch of Amazon Japan (which will feature Monoprice product) and the establishment of a HK 3PL to more rapidly deliver products to customers in the APAC region.
Dark Blue = Monoprice Home MarketLight Blue = International Markets where Monoprice has delivered product
24
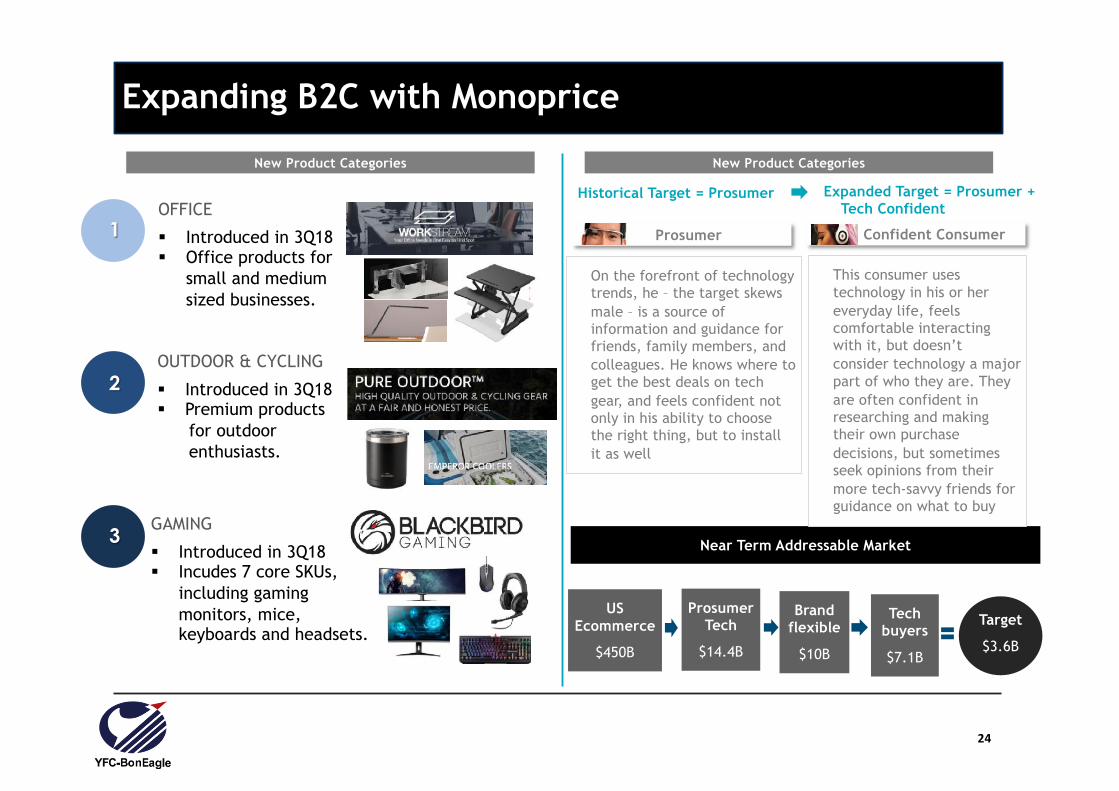
Expanding B2C with Monoprice
New Product Categories New Product Categories
1
2
3
OFFICE
§ Introduced in 3Q18§ Office products for
small and medium sized businesses.
OUTDOOR & CYCLING
§ Introduced in 3Q18§ Premium products
for outdoor enthusiasts.
GAMING
§ Introduced in 3Q18§ Incudes 7 core SKUs,
including gaming monitors, mice, keyboards and headsets.
Near Term Addressable Market
Tech buyers
$7.1B
Prosumer Tech
$14.4B
Target
$3.6B
Brand flexible
$10B
US Ecommerce
$450B
On the forefront of technology trends, he – the target skews male – is a source of information and guidance for friends, family members, and colleagues. He knows where to get the best deals on tech gear, and feels confident not only in his ability to choose the right thing, but to install it as well
This consumer uses technology in his or her everyday life, feels comfortable interacting with it, but doesn’t consider technology a major part of who they are. They are often confident in researching and making their own purchase decisions, but sometimes seek opinions from their more tech-savvy friends for guidance on what to buy
Prosumer Tech Confident Consumer
Historical Target = Prosumer Expanded Target = Prosumer + Tech Confident

25
6 1H20 Review
26
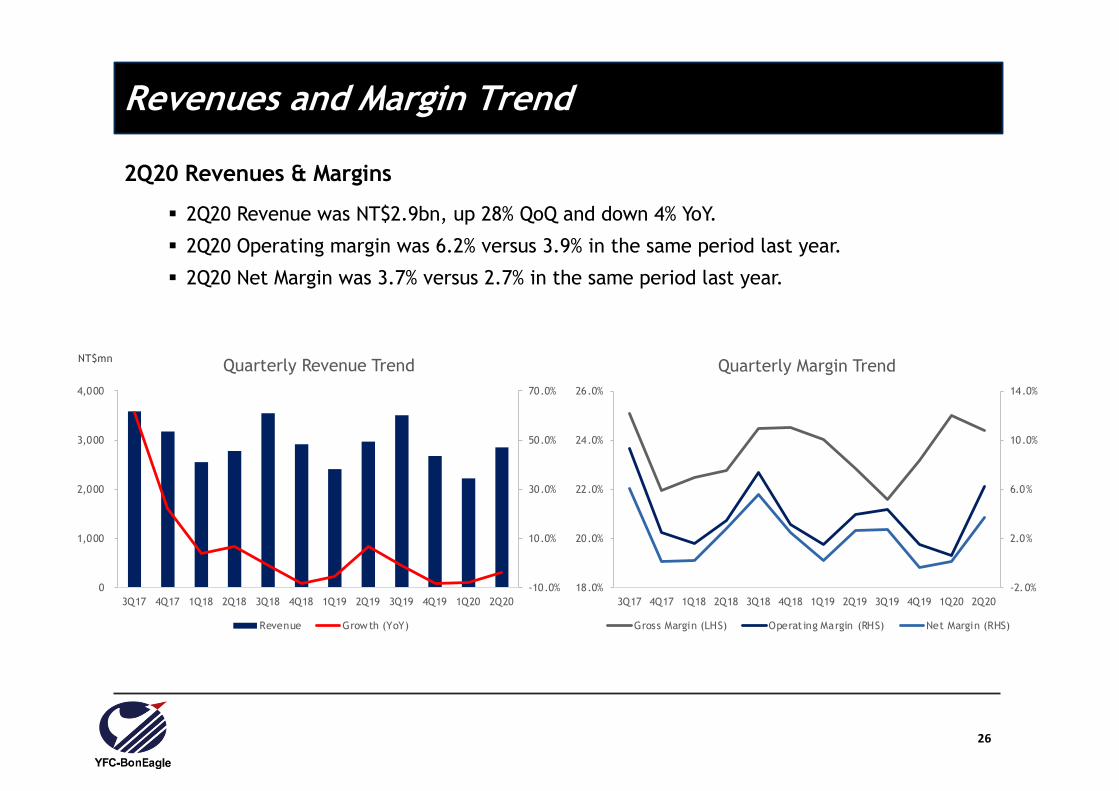
Revenues and Margin Trend
2Q20 Revenues & Margins
§ 2Q20 Revenue was NT$2.9bn, up 28% QoQ and down 4% YoY.
§ 2Q20 Operating margin was 6.2% versus 3.9% in the same period last year.
§ 2Q20 Net Margin was 3.7% versus 2.7% in the same period last year.
-10.0%
10.0%
30.0%
50.0%
70.0%
0
1,000
2,000
3,000
4,000
3Q17 4Q17 1Q18 2Q18 3Q18 4Q18 1Q19 2Q19 3Q19 4Q19 1Q20 2Q20
Quarterly Revenue Trend
Revenue Growth (YoY)
-2.0%
2.0%
6.0%
10.0%
14.0%
18.0%
20.0%
22.0%
24.0%
26.0%
3Q17 4Q17 1Q18 2Q18 3Q18 4Q18 1Q19 2Q19 3Q19 4Q19 1Q20 2Q20
Quarterly Margin Trend
Gross Margin (LHS) Operating Margin (RHS) Net Margin (RHS)
NT$mn

27
Earnings and Growth Trend
2Q20 Performance
§ Our business is seasonal, with peak profits coming in the 2nd and 3rd quarter of each year.
§ 2Q20 net income increased 35% YoY to NT$106m.
§ 1H20 net income and EPS increased 28% YoY to NT$108m and NT$0.87, respectively.
-25
75
175
275
375
3Q17 4Q17 1Q18 2Q18 3Q18 4Q18 1Q19 2Q19 3Q19 4Q19 1Q20 2Q20
Operating Profit & Net Income
Operating Profit Net Income to Parent
-0.20
0.40
1.00
1.60
2.20
3Q17 4Q17 1Q18 2Q18 3Q18 4Q18 1Q19 2Q19 3Q19 4Q19 1Q20 2Q20
EPS
EPS
NT$mn NT$

28
Consolidated Income Statement - Quarterly
Unit: NTD million 2Q20 1Q20 2Q19 QoQ YoYNet Revenue 2,854 2,223 2,972 28% -4%Gross Profit 696 556 680 25% 2%
Gross Margin 24.4% 25.0% 22.9%Operating Expenses 518 541 562 -4% -8%
SG&A percent of Sales 18.2% 24.4% 18.9%Operating Income 178 14 117 1144% 52%
Operating Margin 6.2% 0.6% 3.9%Net Non-Operating Income (Loss) -28 -7 -10 Pre-Tax Income 150 8 107 1872% 39%Income Tax Expense 43 6 28 Minority Interest 0 -1 0 Net Income to Parent 106 2 79 5206% 35%
Net Margin 3.7% 0.1% 2.7%EPS (NT$) 0.85 0.02 0.63 5206% 35%
ROE – not annualized 4.4% 0.1% 3.1%Depreciation 58 60 64 CAPEX 23 9 128

29
1H20 Overview
§ 1H20 sales were NT$5.1bn, down 6% YoY. This relative resilience in sales was despite the fact that over 80% of YFC’s sales are in the US, which has been hard hit by COVID-19.
§ YFC’s Taiwan and China factories produced at near full operating rates in 2Q20 as producers in other regions of the world faced COVID-19 related shutdowns. This resulted in improved pricing power for YFC and Prime.
§ Additionally, Monoprice’s own-brand website sales showed robust growth, which is positive for margins.
§ As a result, 1H20 gross margin was 24.7% vs 23.4% in 1H19. We also reduced operating expenses by 4% YoY, leading to an expansion in 1H20 operating margin to 3.8% from 2.9% in 1H19.
§ 1H20 EPS was NT$0.87, up 28% YoY.
§ We will pay an NT$0.85 cash dividend on 2019 earnings, representing a 61% payout. The ex-dividend date was August 19th.

30
Monoprice 1H20 Performance
§ Monoprice net sales in 1H20 rose 3% YoY in US$ terms but fell 1% in NT$ terms.
§ Monoprice was deemed an ‘Essential Business’ in the US, and was therefore allowed to continue normal warehouse, office and shipping operations. A surge in online business helped the top line, while the office closings of B2B customers resulted in a big drop in sales for this segment, which had been growing rapidly.
§ B2B Direct sales were down 18% YoY in 1H20. This factor and a COVID-19 induced shortage of cable & adaptor products, resulted in a 14% YoY drop in Monoprice’s Cable and Adapter sales.
§ Monoprice.com website sales – the core of its business – were up 11% YoY in 1H20. 2Q20 performance was especially strong – up 29% YoY and 19% QoQ.
§ Star products and segments were Audio & Video +24% YoY, Home & Office +73% YoY, Screen Mounts +21% YoY and Displays +33% YoY. These 4 product areas accounted for 23% of total Monoprice sales in 1H20, and collectively grew 26% over last year.
§ EU sales increased by 115% to US$1.7m, allowing introduction of more SKUs.
§ Price increases, sourcing outside of China, staff expense reduction and product mix improvements continued to help offset increased costs from the US tariffs.
§ Operating profit reached NT$70m, up 37% YoY.

31
YFC BonEagle and Prime 1H20 Performance
§ Combined Prime Wire & Cable and YFC BonEagle Factory Direct 1H20 sales were NT$2.7bn, down 9% YoY.
§ Prime’s top clients, such as Lowe’s and Menards, were deemed ‘Essential Businesses’ in the US, and were therefore allowed to remain open, though with reduced hours and lower foot traffic.
§ The inability of non-Greater China wire and cable manufacturers to operate normally due to local COVID-19 restrictions resulted in a substantial shift in orders to Prime and YFC-BonEagle from 2Q20 onwards, helping to make up somewhat for YFC’s COVID-19 related lost China factory production volume in 1Q20.
§ YFC’s ability to produce when others could not has provided pricing power to YFC direct factory sales and to Prime.
§ Enhanced pricing power led to an improved gross margin vs 1H19. This and an 8% reduction in operating expenses resulted in a 7% increase in operating profit for combined Prime + YFC BonEagle factory direct business segments in 1H20.
32
YFC Group 2H20 Outlook
§ Prospects for 2H20 appear to be good for Monoprice, Prime & YFC Factory Direct sales. YFC Group August sales were NT$1.22bn, up 13% MoM and 3% YoY, and the highest single month sales figure YTD.
§ 3Q is traditional peak season for Prime & YFC Factory Direct sales, and this year order visibility from top clients has extended into mid-4Q20. YFC’s Wuxi, China plant has temporarily increased output by 30%, by adding shifts and more staff. The plant can continue at this level as needed.
§ Pricing power remains strong for now.
§ Cumulative Jul-Aug Monoprice.com own-brand website sales increased 31% YoY, which is an acceleration in growth vs 2Q20’s 25% YoY growth. July own-brand website sales were up 29% YoY and August up 34% YoY.
§ Monoprice’s B2B monthly sales have been trending up since April, with July-Aug average monthly sales 51% higher than the April single month low.

33
Opportunities & Challenges – Monoprice
Opportunities
§ With new visitor traffic to Monoprice.com up 33% YoY in July-August and 34% YTD, we expect that the new business is likely to stick. EU Monoprice’s 1H20 success also bodes well for growth in international sales.
§ Gradual recovery in B2B Direct sales, which was 27% of total sales in 2019, seems likely to continue as economies reopen.
§ Non-Amazon marketplace sales led by Target and Walmart are showing robust growth. Monoprice direct sales to Amazon retail are increasing.
§ Monoprice will open a Philippines office in October, allowing us to expand our back office and ultimately lower OPEX per unit revenue.
Challenges
§ All transportation modes inbound and outbound in the US are seeing a slow-down and rising rates due to the current increase in volumes.
§ Product shortages for cables and adapters seem likely to continue in 2H20.
§ Expenses related to collection and administration of state taxes and legal fees, as well as challenges associated with local, state, and federal privacy and compliance laws. These are unique to and common within growing e-commerce businesses.
34
Opportunities & Challenges – Prime & YFC Factory Direct
Opportunities
§ YFC’s ability to produce from China and Taiwan in 2020 has helped win new clients.
§ Price remains firm due to peak season and high demand in the market.
§ YFC has rented a factory building in the Philippines and plans to install production equipment there beginning in 1H21. This is a potential source of additional capacity for 2H21.
Challenges
§ Several major and mid-level clients are increasingly seeking to go factory direct, which reduces opportunities to sell products sourced from 3rd party vendors.
§ Uncertainties in US tariff policy are complicating decision-making regarding capital expenditures and plant location.
§ Major clients are increasingly requiring and/or asking for production from non-China based plants. As production in countries severely affected by COVID-19 resumes, these requests could become more pressing.
35
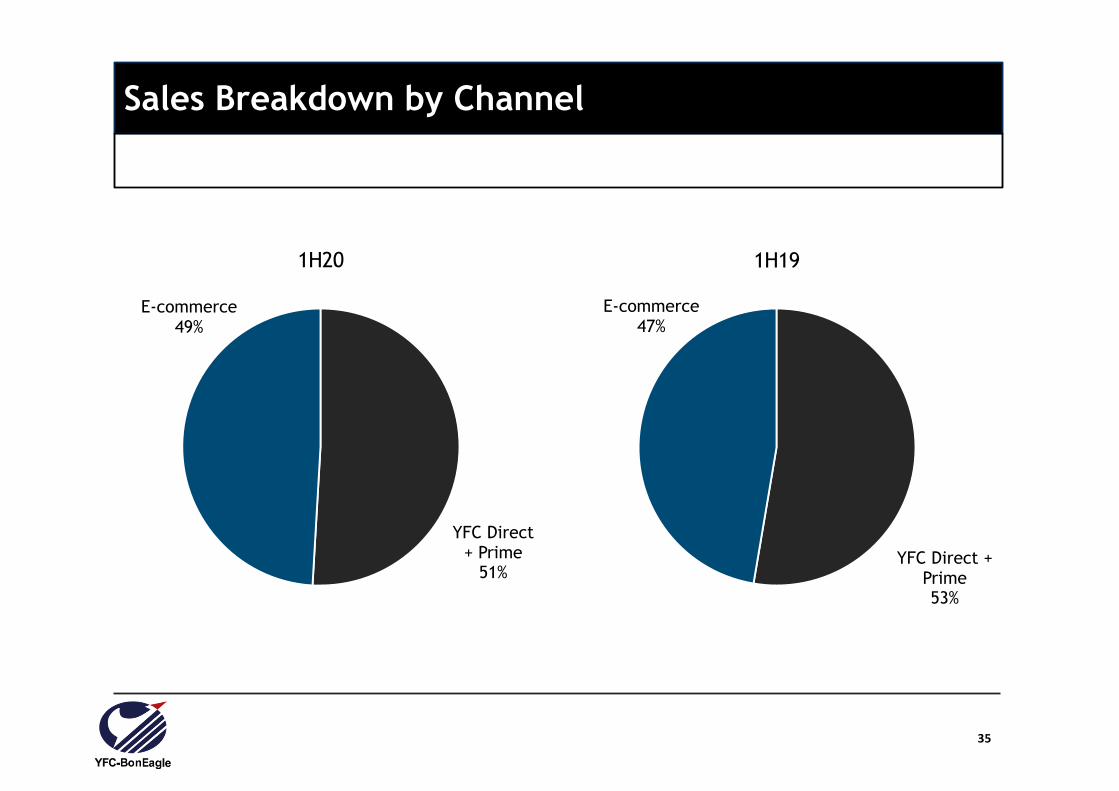
Sales Breakdown by Channel
YFC Direct + Prime
51%
E-commerce49%
1H20
YFC Direct + Prime53%
E-commerce47%
1H19

36
Sales Breakdown by Product
3C Cables and Accessories
33%
Power Cords37%
Consumer Electronics
30%
1H19
3C Cables and Accessories
31%
Power Cords36%
Consumer Electronics
33%
1H20

37
Consolidated Income Statement 1HQ20 vs 1HQ19
Unit: NTD million 1H20 1H19 YoYNet Revenue 5,077 5,387 -6%Gross Profit 1,252 1,260 -1%
Gross Margin 24.7% 23.4%Operating Expenses 1,059 1,106 -4%
SG&A percent of Sales 20.9% 20.5%Operating Income 192 154 25%
Operating Margin 3.8% 2.9%Net Non-Operating Income (Loss) -35 -40 Pre-Tax Income 157 115 37%Income Tax Expense 50 29 Minority Interest -1 1 Net Income to Parent 108 85 28%
Net Margin 2.1% 1.6%EPS (NT$) 0.87 0.68 28%
ROE - not annualized 4.6% 3.4%Depreciation 118 129 CAPEX 32 167

38
Consolidated Balance Sheet - Quarterly
Unit: NT$ million 2020/6/30 2020/3/31 2019/6/30Major Item $ % $ % $ %Cash and Cash Equivalents 1,702 19% 2,076 24% 1,138 13%Notes and Accounts Receivable, Net 2,109 24% 1,596 18% 2,125 25%Inventories 2,217 25% 2,218 25% 2,375 28%Other Current Assets 361 4% 277 3% 321 4%Fixed Assets 1,236 14% 1,272 15% 1,354 16%Other Long-term Assets 1,255 14% 1,280 15% 1,165 14%Total Assets 8,880 100% 8,719 100% 8,478 100%
Current Liabilities 4,909 55% 4,516 52% 4,545 54%Long-term Debt 1,171 13% 1,304 15% 1,056 12%Other Non-Current Liabilities 445 5% 473 5% 440 5%Total Liabilities 6,525 73% 6,293 72% 6,041 71%Common Stock 1,246 1,246 1,246Total Equity 2,355 27% 2,426 28% 2,437 29%Book Value per Share (NT$) 18.9 19.4 19.5Key Indices
Current Ratio ( Current Assets / Current Liabilities) 130% 137% 131%Net Cash (Debt) to Equity -114% -107% -116%

39
7 Financial Summary

40
Key Financial Performance MetricsKey Financial Performance Metrics
6,732 7,380 11,818 11,792 11,573
71
402
410 353
172
0
120
240
360
480
0
3,000
6,000
9,000
12,000
2015 2016 2017 2018 2019
Revenue (LHS) Net Income (RHS)
19.0%
24.4% 24.5% 23.7% 22.8%
4.5%6.9%
5.4%4.2%
3.0%
0%
8%
16%
24%
32%
2015 2016 2017 2018 2019
GPM OPM
0.60 3.14 3.30 2.84 1.38
3.0%
16.5% 16.8%
14.2%
7.0%
0%
5%
10%
15%
20%
0.0
1.0
2.0
3.0
4.0
2015 2016 2017 2018 2019
EPS (LHS) ROE (RHS)
1.2 2.3 2.3 2.0 0.9
209%
71% 70% 71% 61%
0%
75%
150%
225%
300%
0.5
1.0
1.5
2.0
2.5
2015 2016 2017 2018 2019
Dividend per share (LHS) Payout %
NT$m NT$m
NT$ NT$

41
NT$ million 2015 2016 2017 2018 2019Y-Y (%)
2015 2016 2017 2018 2019
Sales Revenue 6,732 7,380 11,818 11,792 11,573 2% 10% 60% 0% -2%
Gross Profit 1,279 1,798 2,894 2,791 2,638 13% 41% 61% -4% -5%
Operating Profit 302 509 642 495 349 39% 69% 26% -23% -29%
Pretax Income 140 492 560 425 237 -15% 253% 14% -24% -44%
Net Income to Parent 71 402 410 353 172 -56% 465% 2% -14% -51%
EPS (NT$) 0.60 3.14 3.30 2.84 1.38 -57% 423% 5% -14% -51%
Gross Margin 19.0% 24.4% 24.5% 23.7% 22.8%
Operating Margin 4.5% 6.9% 5.4% 4.2% 3.0%
Net Margin 1.1% 5.4% 3.5% 3.0% 1.5%
ROE 3.0% 16.5% 16.8% 14.2% 7.0%
Income Statement HighlightsIncome Statement Highlights

42
NT$ million 2015 2016 2017 2018 2019% of Total Assets
2015 2016 2017 2018 2019
TOTAL ASSETS 5,271 7,285 7,967 8,049 8,651 100% 100% 100% 100% 100%
Cash 675 928 989 1,178 1,433 13% 13% 12% 15% 17%
NR & AR 2,117 2,361 2,408 2,276 1,994 40% 32% 30% 28% 23%
Inventory 888 1,777 2,203 2,308 2,283 17% 24% 28% 29% 26%
Fixed Assets 1,219 1,257 1,189 1,252 1,284 23% 17% 15% 16% 15%
TOTAL LIABILITIES 2,882 4,806 5,548 5,488 6,266 55% 66% 70% 68% 72%
LT Debt 702 910 1,055 1,924 1,052 13% 12% 13% 24% 12%
NP&AP 371 895 773 734 669 7% 12% 10% 9% 8%
TOTAL EQUITY 2,390 2,479 2,419 2,562 2,385 45% 34% 30% 32% 28%
A/R turnover days 113 110 74 73 67
Inventory turnover days 64 99 90 98 101
A/P turnover days 29 41 34 31 29
Cash conversion cycle 148 168 130 146 139
Income Statement HighlightsBalance Sheet Highlights
43
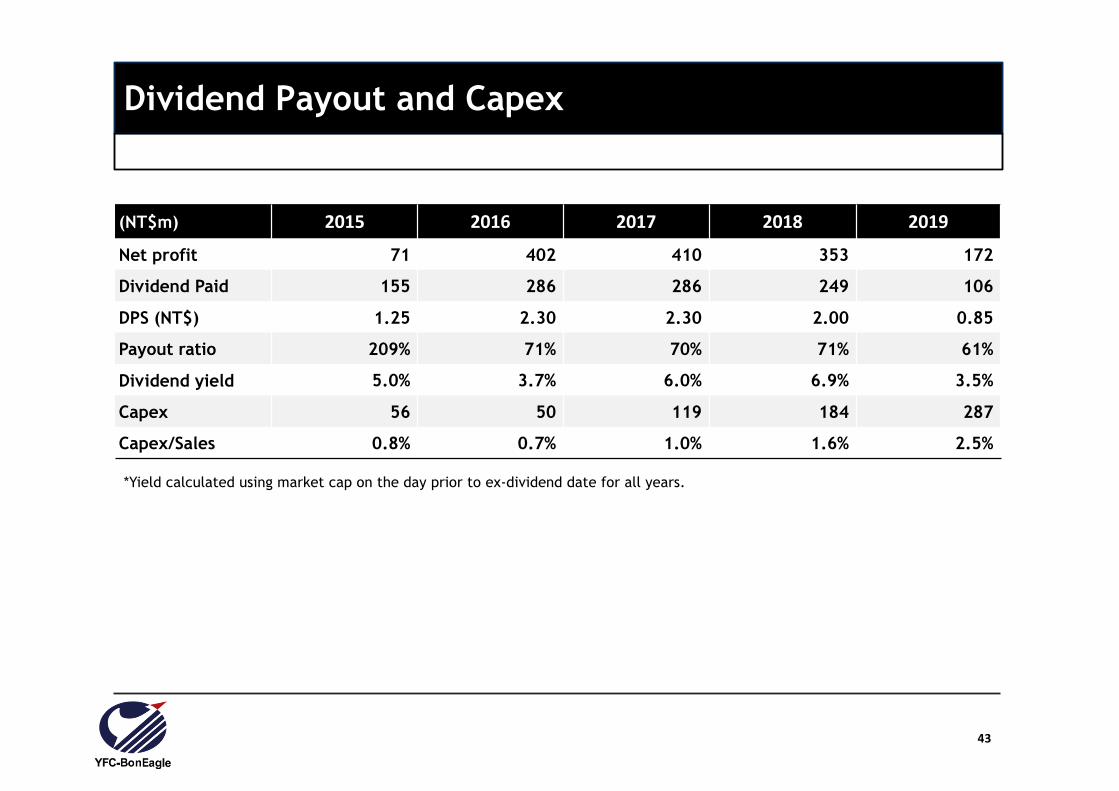
(NT$m) 2015 2016 2017 2018 2019
Net profit 71 402 410 353 172
Dividend Paid 155 286 286 249 106
DPS (NT$) 1.25 2.30 2.30 2.00 0.85
Payout ratio 209% 71% 70% 71% 61%
Dividend yield 5.0% 3.7% 6.0% 6.9% 3.5%
Capex 56 50 119 184 287
Capex/Sales 0.8% 0.7% 1.0% 1.6% 2.5%
Dividend Payout and CapexDividend Payout and Capex
*Yield calculated using market cap on the day prior to ex-dividend date for all years.

44
Issue Date 2020/2/18
Maturity Date 2023/2/18
Maturity Term 3 years
Coupon Rate 0.00%
Issue Amount NT$ 400,000,000
Issue Price NT$ 101.0
Latest Conversion Price NT$ 25.6
Conversion Premium 114.29%
Latest Trading Price 99.5 (2020/08/25)
Dividend Payout and Capex (CB Terms and Trading Information (9th Series)
Note: No Redemption Option

45
Disclaimer•The information contained in this confidential document ("Presentation") has been prepared by YFC-BonEagle Electric Co. Ltd. (the "Company"). It has not been fully verified and is subject to material updating, revision and further amendment. While the information contained herein has been prepared in good faith, neither the Company nor any of its shareholders, directors, officers, agents, employees or advisers gives, has given or has authority to give, any representations or warranties (express or implied) as to, or in relation to, the accuracy, reliability or completeness of the information in this Presentation, or any revision or supplement thereof, or of any other written or oral information made or to be made available to any interested party or its advisers (all such information being referred to as "Information") and liability therefore is expressly disclaimed. Accordingly, neither the Company nor any of its shareholders, directors, officers, agents, employees or advisers takes any responsibility for, or will accept any liability whether direct or indirect, express or implied, contractual, tortious, statutory or otherwise, in respect of, the accuracy or completeness or injury of the Information or for any of the opinions contained herein or for any errors, omissions or misstatements or for any loss, howsoever arising, from the use of this Presentation or the information.
•Neither the issue of this Presentation nor any part of its contents is to be taken as any form of commitment on the part of the Company to proceed with any transaction and the right is reserved by the Company to terminate any discussions or negotiations with any prospective investors. In no circumstances will the Company be responsible for any costs, losses or expenses incurred in connection with any appraisal or investigation of the Company. In furnishing this Presentation, the Company does not undertake or agree to any obligation to provide the recipient with access to any additional information or to update this Presentation or to correct any inaccuracies in, or omissions from, this Presentation which may become apparent.
•This Presentation should not be considered as the giving of investment advice by the Company or any of its shareholders, directors, officers, agents, employees or advisers. Each party to whom this Presentation is made available must make its own independent assessment of the Company after making such investigations and taking such advice as may be deemed necessary. In particular, any estimates or projections or opinions contained herein necessarily involve significant elements of subjective judgment, analysis and assumptions and each recipient should satisfy itself in relation to such matters.
•This Presentation includes certain statements that may be deemed “forward-looking statements”. All statements in this discussion, other than statements of historical facts, that address future activities and events or developments that the Company expects, are forward-looking statements. Although the Company believes the expectations expressed in such forward-looking statements are based on reasonable assumptions, such statements are not guarantees of future performance and actual results or developments may differ materially from those in the forward-looking statements. Factors that could cause actual results to differ materially from those in forward-looking statements include market prices, continued availability of capital and financing, general economic, market or business conditions and other unforeseen events. Prospective Investors are cautioned that any such statements are not guarantees of future performance and that actual results or developments may differ materially from those projected in forward-looking statements.

46
Thank you!
Company Website: www.cables.com.tw