10 minutes on… - pwc australia · tsr remains the most common hurdle, with eps increasing in...
TRANSCRIPT

10 minutes on…2016 Executive remuneration trends: Fair pay for a fair day’s work?
www.pwc.com.au
May 2017

PwC
Summary
• Despite sluggish performance in the overall economy, ASX 100 companies continued to provide healthy pay outcomes for executives in 2016.
• Australian economic growth was relatively low in 2016, with GDP increasing 2.4%*. ASX 100 companies delivered similarly low returns: average EBIT growth was 0.6%**; and overall ASX 100 growth was -5.1%*** for the year to 30 June 2016 (the most common year end for ASX 100 companies).
• Low returns did not translate to low bonus outcomes however. CEOs averaged 101% of their bonus targets, while other executives averaged 95% of their bonus targets.
• Many CEOs experienced little variability in their year-on-year bonus outcomes, with over 40% seeing a variation of less than 10%. This lack of variability raises questions regarding the performance measures chosen, their calibration, and how discretion is applied.
• 2-3% fixed pay increases were typical for CEOs, Executives, and Non Executive Directors. While relatively conservative, these increases were still often higher than average worker increases of 1.9%.
• In the 2016 AGM season, there was a sharp increase in the number of strikes against remuneration reports. Shareholders expressed concerns with lack of stretch in targets, the transparency of disclosures, and the overall fairness of pay.
2016 Executive remuneration trends: Fair pay for a fair day’s work?2
* Seasonally adjusted GDP to December 2016 (source: Australian Bureau of Statistics)
** Same companies’ year-on-year EBIT movements as at 31 December 2015 and 2016
*** Excludes dividend payments. Source: Capital IQ
Note: All data in this report is based on the ASX 100 unless otherwise stated.
Highlights• Median fixed pay movements for same incumbents were:
- 2.4% for CEOs (3.5% for those that received an increase)
- 1.9% for other executives (6.2% for those that received an increase)
- 1.3% for NEDs (4.5% for those that received an increase)
• Remuneration packages showed a marginal movement toward more variable pay in FY16
• Median short term incentive payments were on target, with many companies paying out very similar amounts to last year
• Whilst relative TSR remains the dominant LTI measure, the use of EPS increased materially:
- As a measure used alongside relative TSR (28% to 36%)
- As a sole hurdle (2% to 4%)
• Internal hurdles vested more frequently than external hurdles:
- 68% of internal hurdles vested in part or full
- 54% of external hurdles vested in part or full
• 51% of the ASX 100 companies require CEOs, and executives in some instances, to hold a minimum value of shares.
• Across all ASX 100 companies, median shareholdings increased to 229% of fixed pay for CEOs and 81% for other executives

PwC
Executive KMP increases were generally modest in FY16
Over the past 12 months, executive pay levels have been increasingly criticised by shareholders, the public and media. While alignment between pay and performance continues to be scrutinised, the issue of “fairness” is now commonly raised e.g. How much pay is reasonable? Should executives get pay increases where they have overseen significant headcount reductions? As reported by the media, how fair is it that CEOs only take five days to earn an average worker’s salary*?
Fixed pay increases were generally restrained
FY16 saw executive pay increases that met or slightly exceeded those given to general employees. The median fixed pay increase was 2.4% for CEOs and 1.9% for other executives. This compared to average weekly ordinary times earnings growth of 1.9%**.
There were signs of a more deliberate application of fixed pay budgets. Instead of giving marginal increases for all, more companies have provided material reviews for select executives while keeping the pay of other executives flat.
Figure 1: Executive KMP pay changes (ASX 100, same incumbent)
Restraint was demonstrated overall with approximately ⅓ of CEOs and executives receiving no pay rise at all, and newly appointed CEOs in the ASX100 receiving on average 33% less fixed remuneration than their predecessors.
Several “outlier” companies provided large increases
While most pay increases were low, just over a quarter of companies provided fixed pay increases of 10% or higher to their CEOs or other executive KMP. It is interesting to note that of these companies, four received strikes against their remuneration reports (although we acknowledge this is not necessarily the only contributing factor) with an average of 35% of votes cast against the reports.
Figure 2: Executive pay increases by percentage band
2016 Executive remuneration trends: Fair pay for a fair day’s work?3
Median movementMedian increase (increase >0%) % with no pay rise
CEOOther exec
KMP CEOOther exec
KMP CEOOther exec
KMP
FY16 2.4% 1.9% 3.5% 6.2% 30% 34%
FY15 2.0% 4.0% 3.7% 6.2% 24% 12%
*http://www.smh.com.au/business/workplace-relations/chief-executives-have-already-been-paid-average-annual-earnings-20170105-gtm8i5.html
** Source: Australian Bureau of Statistics (http://www.abs.gov.au/)
0%
10%
20%
30%
40%
50%
60%
< 2.5% 2.5 to 4.99% 5 to 7.49% 7.5 to 9.99% >10%
Per
cen
tag
e o
f E
xec
uti
ves
Fixed Remuneration Increase
CEO Other Exec KMP
PwC
Short-term incentives were around target and showed little variation from FY15 results
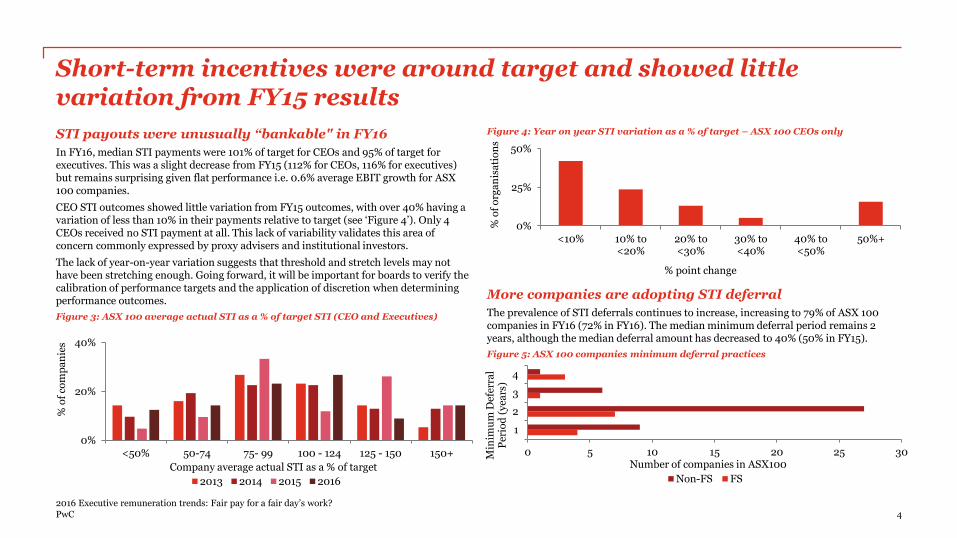
STI payouts were unusually “bankable" in FY16
In FY16, median STI payments were 101% of target for CEOs and 95% of target for executives. This was a slight decrease from FY15 (112% for CEOs, 116% for executives) but remains surprising given flat performance i.e. 0.6% average EBIT growth for ASX100 companies.
CEO STI outcomes showed little variation from FY15 outcomes, with over 40% having a variation of less than 10% in their payments relative to target (see ‘Figure 4’). Only 4 CEOs received no STI payment at all. This lack of variability validates this area of concern commonly expressed by proxy advisers and institutional investors.
The lack of year-on-year variation suggests that threshold and stretch levels may not have been stretching enough. Going forward, it will be important for boards to verify the calibration of performance targets and the application of discretion when determining performance outcomes.
Figure 3: ASX 100 average actual STI as a % of target STI (CEO and Executives)
Figure 4: Year on year STI variation as a % of target – ASX 100 CEOs only
More companies are adopting STI deferral
The prevalence of STI deferrals continues to increase, increasing to 79% of ASX 100 companies in FY16 (72% in FY16). The median minimum deferral period remains 2 years, although the median deferral amount has decreased to 40% (50% in FY15).
Figure 5: ASX 100 companies minimum deferral practices
2016 Executive remuneration trends: Fair pay for a fair day’s work?4
0%
20%
40%
<50% 50-74 75- 99 100 - 124 125 - 150 150+
% o
f co
mp
an
ies
Company average actual STI as a % of target
2013 2014 2015 2016
0%
25%
50%
<10% 10% to<20%
20% to<30%
30% to<40%
40% to<50%
50%+
% o
f o
rga
nis
ati
on
s
% point change
0 5 10 15 20 25 30
1
2
3
4
Number of companies in ASX100
Min
imu
m D
efer
ral
Per
iod
(y
ears
)
Non-FS FS

PwC
Fixed pay increases reflect company performance
CEO pay increases tended to reflect EBIT performance
As shown in the graph below, fixed pay increases (including 0% increases) appeared to reflect business performance. This relationship was a binary one: where EBIT was negative, fixed pay increase were just 0.6% for CEOs; where EBIT was positive, increases were around 3% even where growth was very high.
Figure 6: Company EBIT performance year-on-year relative to median CEO fixed pay increase
Total target remuneration levels increased slightly more so than fixed pay
Total target remuneration (i.e. the aggregate of fixed and variable pay) increased by 4.8% for both the CEO and other executive KMP. The distribution of pay between “fixed”, “STI” and “LTI” for executives in FY16 was similar to FY15, with a slight increase in the mix of variable pay. The weighting given to STI was the main driver of change.
Figure 7: Executive KMP pay mix variations year-on-year (ASX 100, same incumbent)
2016 Executive remuneration trends: Fair pay for a fair day’s work?5
0.0%
0.5%
1.0%
1.5%
2.0%
2.5%
3.0%
3.5%
<0% 0-20% 20-40%
Med
ian
CE
O p
ay
ch
an
ge
EBIT percentage change year-on-year
45% 44%53% 50%
22% 26%21% 23%
33% 30% 26% 27%
0%
20%
40%
60%
80%
100%
FY15 FY16 FY15 FY16
CEO Other Executives
Fixed STI LTI
Note: LTI values reflect ‘fair value’ amounts, providing a more comparable valuation to target STIs and fixed pay.
PwC
14%
36%
6%
33%
4% 7%
Long-term incentive structures retained a high level of consistency
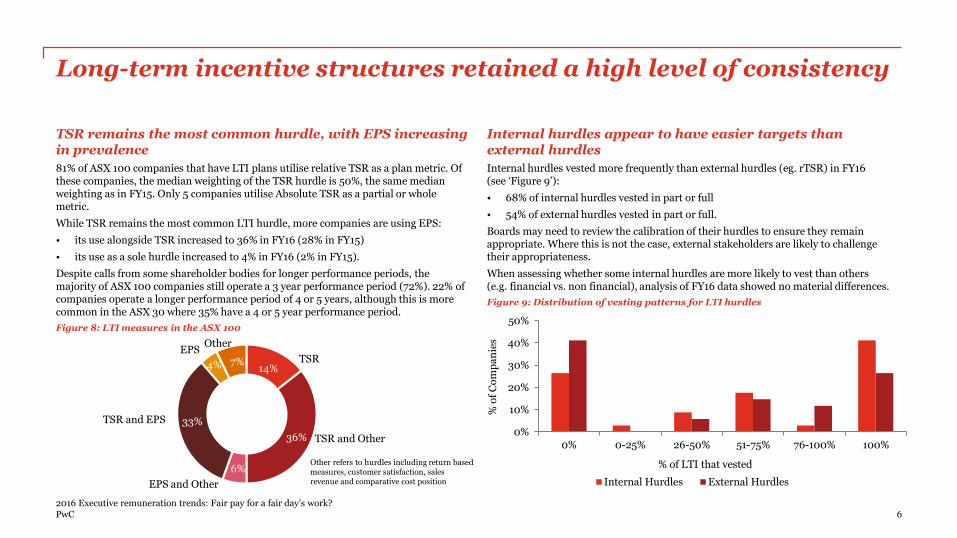
TSR remains the most common hurdle, with EPS increasing in prevalence
81% of ASX 100 companies that have LTI plans utilise relative TSR as a plan metric. Of these companies, the median weighting of the TSR hurdle is 50%, the same median weighting as in FY15. Only 5 companies utilise Absolute TSR as a partial or whole metric.
While TSR remains the most common LTI hurdle, more companies are using EPS:
• its use alongside TSR increased to 36% in FY16 (28% in FY15)
• its use as a sole hurdle increased to 4% in FY16 (2% in FY15).
Despite calls from some shareholder bodies for longer performance periods, the majority of ASX 100 companies still operate a 3 year performance period (72%). 22% of companies operate a longer performance period of 4 or 5 years, although this is more common in the ASX 30 where 35% have a 4 or 5 year performance period.
Figure 8: LTI measures in the ASX 100
Internal hurdles appear to have easier targets than external hurdles
Internal hurdles vested more frequently than external hurdles (eg. rTSR) in FY16 (see ‘Figure 9’):
• 68% of internal hurdles vested in part or full
• 54% of external hurdles vested in part or full.
Boards may need to review the calibration of their hurdles to ensure they remain appropriate. Where this is not the case, external stakeholders are likely to challenge their appropriateness.
When assessing whether some internal hurdles are more likely to vest than others(e.g. financial vs. non financial), analysis of FY16 data showed no material differences.
Figure 9: Distribution of vesting patterns for LTI hurdles
2016 Executive remuneration trends: Fair pay for a fair day’s work?6
0%
10%
20%
30%
40%
50%
0% 0-25% 26-50% 51-75% 76-100% 100%
% o
f C
om
pa
nie
s
% of LTI that vested
Internal Hurdles External Hurdles
TSR and Other
EPS and Other
TSR and EPS
Other refers to hurdles including return based measures, customer satisfaction, sales revenue and comparative cost position
TSREPS
Other

PwC
0%
100%
200%
300%
400%
All Companies Guidelines No Guidelines
Sh
are
s h
eld
as
a p
erce
nta
ge
of
fix
ed r
emu
ner
ati
on
CEO EXEC Median Guideline
Executive shareholdings have increased dramatically
Mandatory shareholding requirements continue to grow
As anticipated in FY15, the prevalence of minimum shareholding guidelines has continued to grow, with 51% of the ASX 100 requiring at least their CEOs to hold a minimum value of shares (45% in FY15, 36% in FY14).
The median shareholding guidelines for CEOs and other executives are consistent, with the median guideline requiring an amount equal to 100% of their fixed pay in shares, acquired over a five year period. Minimum shareholding guidelines are more common for CEOs.
Where shareholding guidelines are set for both the CEO and other executives, we tend to see a differential where the CEO is expected to hold twice the amount of shares as a percentage of fixed remuneration. This variance applies in practice too, as CEOs tend to hold far more shares as a percentage of their fixed remuneration relative to other executives (see ‘Figure 10’).
Where mandatory shareholding guidelines exists, the level of shares held by CEOs is actually lower than where no guideline applies. This is a change from FY15 and may be attributable to factors beyond the guideline policies e.g. CEO turnover (7 new CEOs), 5 new entrants to the ASX 100 in FY16, share price movements, and generally high vesting of equity awards.
For other executives, the median shareholdings remains fairly consistent regardless of whether the company has set a shareholding guideline or not.
Allocating LTI using “face value” is now the clear standard
There has been an increase in the proportion of ASX 100 companies switching from fair value to face value LTI allocation, and further companies have indicated they will switch in 2017. 64% of companies that disclose their LTI allocation methodology in the ASX100 now utilise a face value allocation methodology for LTI (59% in FY15).
Figure 10: Comparison of current CEO and executive shareholdings (vested shares only)
2016 Executive remuneration trends: Fair pay for a fair day’s work?7

PwC
NED increases were higher than usual, exceeding pay increases given to executives
For NED roles receiving an increase in FY16, the uplift was 4.5%
Given NED fees are not always reviewed annually, it is useful to look at both overall fee changes, and the size of increases where these occurred. In FY16, both saw relatively high increases as outlined below.
52% of companies provided increases in base NED fees and of those companies, the median increase was 4.5%.
The median change for committee fees in the ASX 100 was 0%, however of companies that did provide increases to committee fees the median increases of the three most common committees were:
• 12.1% for the Remuneration Committee
• 10.4% for the Audit Committee
• 14.3% for the combined Audit and Risk Committee
The median NED fee pool increase across the ASX100 was 0%, however of the 14 companies that did increase fee pools, the median amount was an increase of 16.4%
Figure 11: NED pay changes (ASX 100, same position)
8
Median increase(increase >0%)
Median increase(all roles)
Chair Other NEDs Chair Other NEDs
FY16 4.5% 4.5% 0.9% 1.3%
FY15 3.5% 2.6% 0.0% 0.0%
2016 Executive remuneration trends: Fair pay for a fair day’s work?
PwC
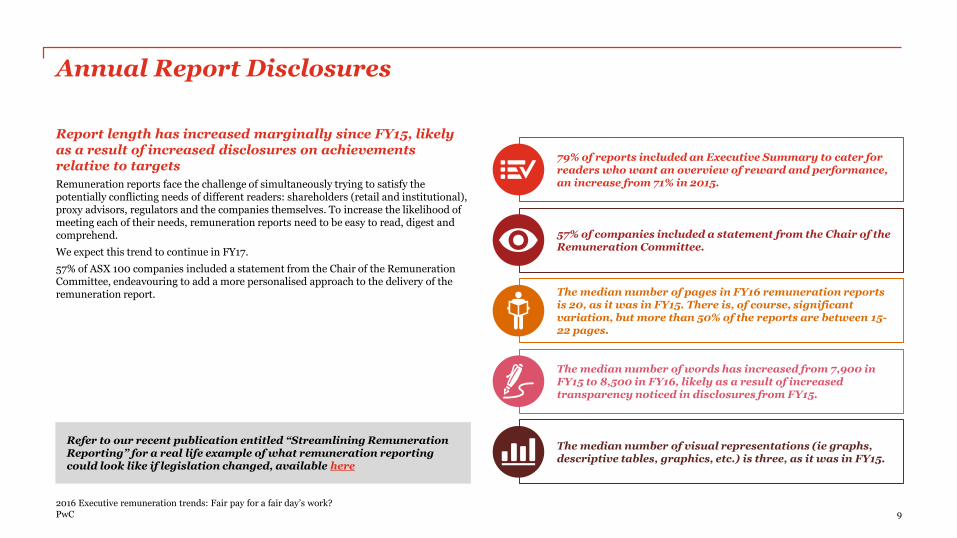
The median number of pages in FY16 remuneration reports is 20, as it was in FY15. There is, of course, significant variation, but more than 50% of the reports are between 15-22 pages.
The median number of words has increased from 7,900 in FY15 to 8,500 in FY16, likely as a result of increased transparency noticed in disclosures from FY15.
79% of reports included an Executive Summary to cater for readers who want an overview of reward and performance, an increase from 71% in 2015.
57% of companies included a statement from the Chair of the Remuneration Committee.
The median number of visual representations (ie graphs, descriptive tables, graphics, etc.) is three, as it was in FY15.
Annual Report Disclosures
Report length has increased marginally since FY15, likely as a result of increased disclosures on achievements relative to targets
Remuneration reports face the challenge of simultaneously trying to satisfy the potentially conflicting needs of different readers: shareholders (retail and institutional), proxy advisors, regulators and the companies themselves. To increase the likelihood of meeting each of their needs, remuneration reports need to be easy to read, digest and comprehend.
We expect this trend to continue in FY17.
57% of ASX 100 companies included a statement from the Chair of the Remuneration Committee, endeavouring to add a more personalised approach to the delivery of the remuneration report.
9
Refer to our recent publication entitled “Streamlining Remuneration Reporting” for a real life example of what remuneration reporting could look like if legislation changed, available here
2016 Executive remuneration trends: Fair pay for a fair day’s work?

PwC
Outlook for 2017
By virtue of the increased number of strikes in 2016 and heightened media attention, the topic of executive pay is not only in the minds of shareholders and proxy advisors but the general public too. 2017 is shaping up to be a year for Boards and Remuneration Committees to consider increased transparency and additional engagement with shareholders regarding the rationale behind how remuneration frameworks enable their corporate strategy, and how remuneration outcomes align to company performance.
Building trust and transparency
STI transparency continues to improve in response to shareholders and proxy advisors demanding to fully understand the details behind executive pay outcomes, particularly in the wake of an increase in related strikes during the 2o16 AGM season.
Fixed pay relative to average employees is likely to remain a concern for shareholders and the broader public. Executive pay levels appear to have slowed in the last few years, and given increased scrutiny on the topic amongst shareholders and proxy advisors, we expect this trend to continue in FY17.
Calibrating pay for performance
Given the lack of variability in FY16 incentive pay outcomes, companies are likely to review how their variable payments are calibrated relative to performance outcomes. There should be some genuine variability in pay outcomes for different levels of performance and we expect to see instances of zero incentive payments for companies that have experienced particularly poor shareholder – or even inappropriate employee or customer – outcomes.
10
Simplifying remuneration models
Companies will continue to explore simplifying their remuneration frameworks, making them clearer and more transparent to shareholders, and more focused and engaging for participants.
Pockets of the UK market are championing simplification. Whilst there continues to be mixed investor reactions to innovative remuneration structures, the UK Business Energy and Industrial Strategy (BEIS) Committee’s recent report on Corporate Governance calls for change:
• Ending traditional hurdled LTIs
• Simplifying executive pay more broadly.
Re-engaging stakeholders on the value of non-financial measures
Despite broad criticism leveled at non-financial measures within short and long-term incentive plans, some of these KPIs have a place in underpinning the overall strategic direction of companies. Boards and Remuneration Committees must provide better disclosure and explanations regarding linkages to company strategy in order to mitigate potential backlash.
2016 Executive remuneration trends: Fair pay for a fair day’s work?
PwC
SydneyEmma GroganPartnerPh: (02) 8266 2420Email: [email protected]
Debra EckersleyPartnerPh: (02) 8266 9034Email: [email protected]
Daniel GeardDirectorPh: (02) 8266 0725Email: [email protected]
Cassandra FungDirectorPh: (02) 8266 2183Email: [email protected]
Katie WilliamsSenior ManagerPh: (02) 8266 0273Email: [email protected]
MelbourneAndrew CurcioPartnerPh: (03) 8603 1685Email: [email protected]
James OrrSenior ManagerPh:(03) 8603 0018Email: [email protected]
Michael BierwirthSenior ManagerPh:(03) 8603 4835Email: [email protected]
PwC’s People & Organisation BusinessPwC’s People & Organisation Business helps our clients to realise and discover the potential of their people
• Performance and reward
• Employment tax and legal advice
• Human resource consulting
• Change
• International assignment solutions and immigration
• Talent and Leadership
• Diversity
• Design thinking
How can PwC help?
To have a deeper discussion about these issues, please contact:

www.pwc.com.au
This publication has been prepared for general guidance on matters of interest only, and does not constitute professional advice. You should not act upon the information contained in this publication without obtaining specific professional advice.No representation or warranty (express or implied) is given as to the accuracy or completeness of the information contained in this publication, and, to the extent permitted by law, PricewaterhouseCoopers, its members, employees and agents do not accept or assume any liability, responsibility or duty of care for any consequences of you or anyone else acting, or refraining to act, in reliance on the information contained in this publication or for any decision based on it.
© 2017 PricewaterhouseCoopers. All rights reserved. PwC refers to the Australian member firm, and may sometimes refer to the PwC network.Each member firm is a separate legal entity. Please see www.pwc.com/structure for further details.
PwC Australia helps organisations and individuals create the value they're looking for. We're a member firm of network of firms in 157 countries with more than 223,000 people who are committed to delivering quality in assurance, advisory, tax & legal, and private clients services.
127048577