10.000 städte im klimawandelkriewald/gisday/kriewald_gis_day_pik.pdf · gfdl, nobert blau...
TRANSCRIPT

10.000 Städte im Klimawandel...
Was wissen wir dank GIS?
Steffen Kriewald
19. November 2014
2RD2 - Climate Change and Development
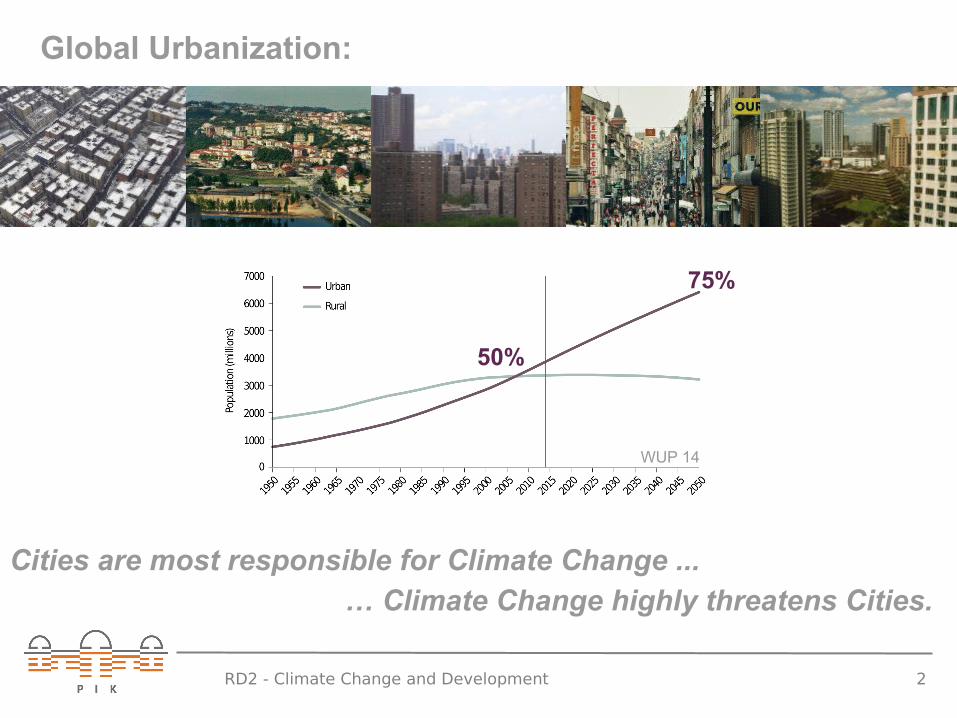
Global Urbanization:
WUP 14
50%
75%
Cities are most responsible for Climate Change ...… Climate Change highly threatens Cities.

3RD2 - Climate Change and Development
Space for Mitigation:
over 70 % of global GHG emissions (IEA 2008):
Energy Consumption Transportation Heating (building insulation) Air pollution
Space for Adaptation:
• wind storm• drought, heatwave, increased mortality, decreased water availability• sea level rise and storm surge flooding, river flooding, intense rainfall flooding• building and infrastructure subsidence and landslides• diseases
4RD2 - Climate Change and Development
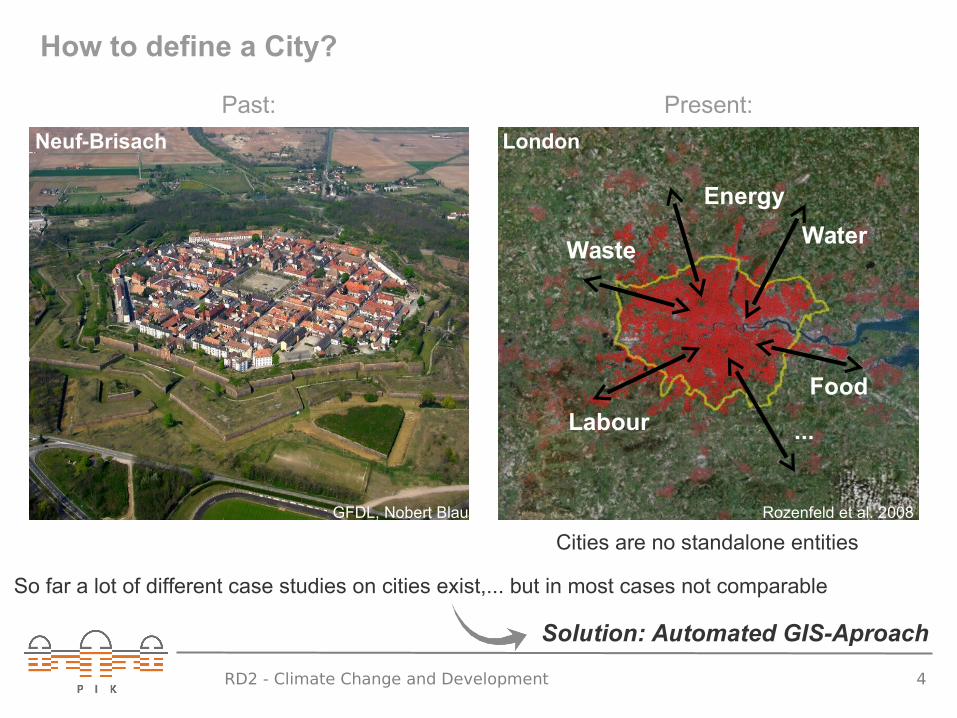
How to define a City?
Cities are no standalone entities
Energy
Food
Water
Labour
Waste
...
So far a lot of different case studies on cities exist,... but in most cases not comparable
GFDL, Nobert Blau Rozenfeld et al. 2008
Neuf-Brisach London
Past: Present:
Solution: Automated GIS-Aproach
5RD2 - Climate Change and Development
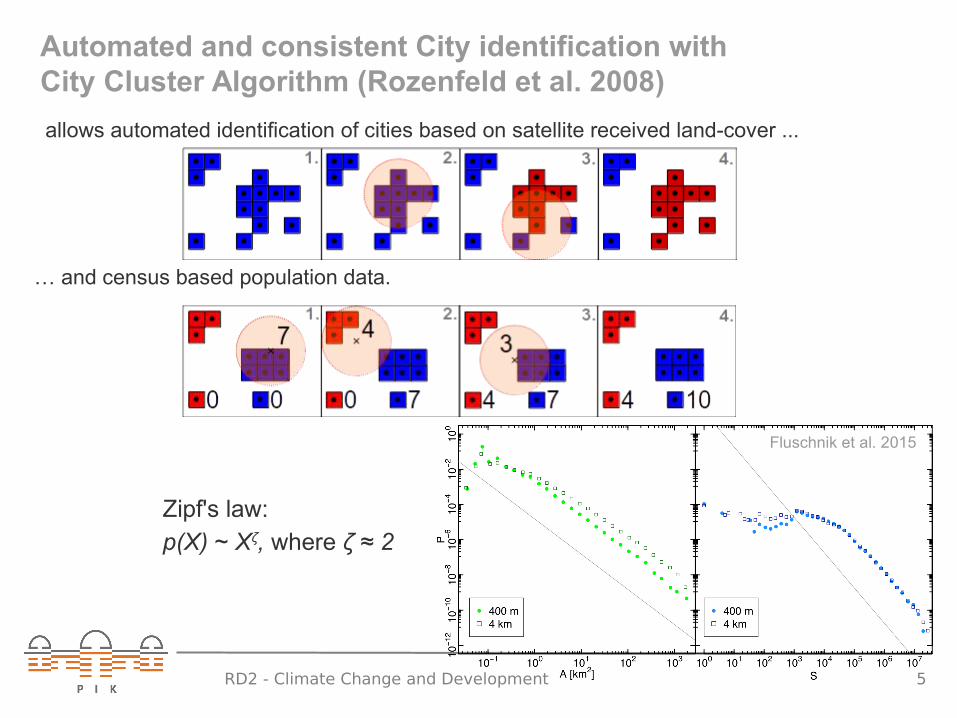
Automated and consistent City identification withCity Cluster Algorithm (Rozenfeld et al. 2008)
allows automated identification of cities based on satellite received land-cover ...
… and census based population data.
Zipf's law:p(X) ~ Xζ, where ζ ≈ 2
Fluschnik et al. 2015

6RD2 - Climate Change and Development
Development of a city data base:
e.g.: Combination of GlobCover2009 + GRUMP settlement points provides:• area, population and population density for over 32.000 locations• over 2838 cities with more then 100.000 inhabitants
Possibility of further investigation: • Structure of cities and peri-urban areas• Classification of cities• proportion of urban green• … or
example: Potential of peri-urban agriculture
+ =
Definition of peri-urban as a buffer with size:
AiPU=A i
U⋅ρi / ρref

7RD2 - Climate Change and Development
Potential of peri-urban agriculture
• 67 % of all urban areas• 28 % (60 %) of global (urban) population• Around 5 % of global agricultural area• Peri-urban areas composition:
- 47 % Farmland- 41 % Natural area- 12 % non-arable area

Future change in kcal production:(based on A2 ECHAM4 for 2080)
• Indo-Gangetic Plain -40 % • 80 % of cities will face a decreasing productivity
RD2 - Climate Change and Development
Potential of peri-urban agriculture
9RD2 - Climate Change and Development
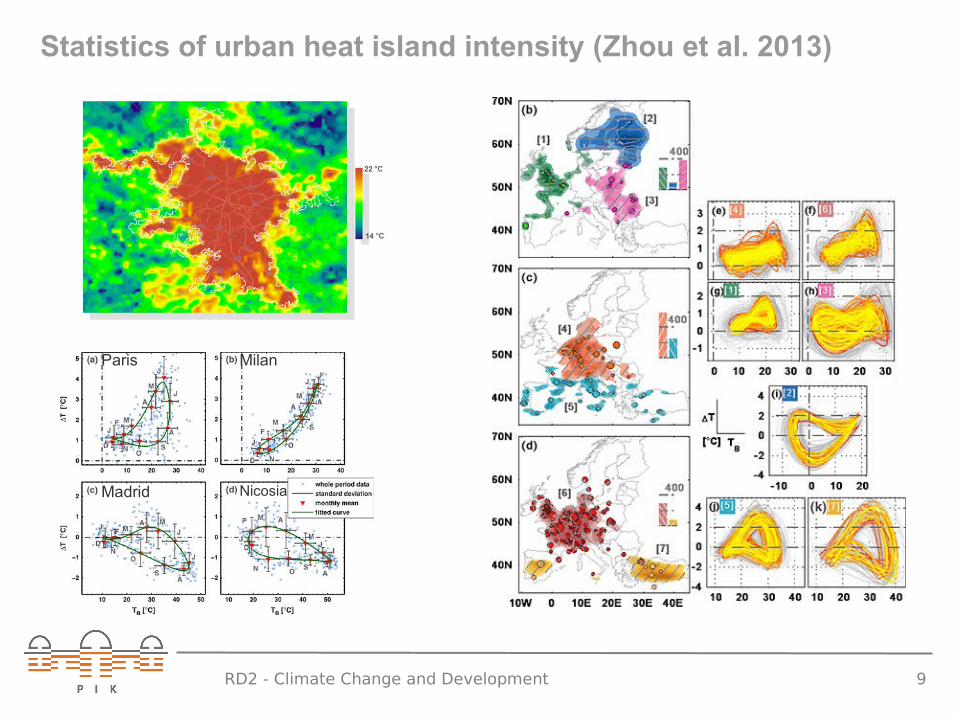
Statistics of urban heat island intensity (Zhou et al. 2013)
Paris Milan
Madrid Nicosia

10RD2 - Climate Change and Development
Berlin Seoul London
Quality of data – Different dataset; Different city! M
OD
IS 5
00m
Glo
bCov
er 3
00m
Total urban area:GlobCover = 313.000 km²MODIS = 657.000 km²

11Special thanks goes to the whole CCD group!
Outlook:
Comparison with other datasets – Open Street Map
City classification – fingerprint
Impact analysis:- Damage functions for flood events- Impact on human health / mortality due to heat events
Sustainable transition pathways
Prahl et al. 2014
Zhou et al. 2013
Thank youfor your attention.
More information & contact: [email protected]
http://www.pik-potsdam.de/~rybski/cities/http://www.cigrasp.org (cities module)
Center for International Earth Science Information Network (CIESIN), Columbia University; International Food Policy Research Institute (IFPRI), The World Bank; and Centronternacional de Agricultura Tropical (CIAT). 2011. Global Rural-Urban Mapping Project, Version GRUMPv1: Settlement Points. Palisades, NY: Socioeconomic Data and Applications Center (SEDAC), Columbia University.Available at: http://sedac.ciesin.columbia.edu/data/dataset/grump-v1-settlement-points. Last accessed Nov 2014.
ESA (European Space Agency) 2010 The Ionia GlobCover project. Globcover land cover v2.1. Website.Available online at http://ionia1.esrin.esa.int. Last accessed Nov 2014.
Fluschnik, T., Kriewald, S., Ros, A. G. C., Zhou, B., Reusser, D. E., Kropp, J. P., & Rybski, D. (2014). The size distribution, scaling properties and spatial organization of urban clusters: a global and regional perspective. arXiv preprint arXiv:1404.0353.
Rozenfeld, H. D., Rybski, D., Andrade, J. S., Batty, M., Stanley, H. E., & Makse, H. A. (2008). Laws of population growth. Proceedings of the National Academy of Sciences, 105(48), 18702-18707.
United Nations, Department of Economic and Social Affairs, Population Division (2014). World Urbanization Prospects: The 2014 Revision, Highlights (ST/ESA/SER.A/352).
Zhou, B., Rybski, D., & Kropp, J. P. (2013). On the statistics of urban heat island intensity. Geophysical Research Letters, 40(20), 5486-5491.
References: