105361 002 sendd web · 2016-09-28 · through the $5.6 billion special dividend we paid in...
TRANSCRIPT

ANNUAL REPORT AND FORM 10-K
WEYERHAEUSER

The actions we took in 2010 enhanced our ability to return value to our shareholders through our long-term strategy to generate superior returns with sustainable land and forest solutions.
The most signifi cant action involved electing Real Estate Investment
Trust status. You’ve already benefi ted from this decision through the $5.6 billion special dividend we paid in September.
In the future, you’ll benefi t from our enhanced ability to operate and grow our core asset — the more than 6 million acres of valuable timberland we hold. We believe forests provide a source of sustainable products, green energy and carbon sequestration as well as a host of other solutions for challenges facing the world. No one is better positioned than us to meet these needs through our holdings, our intellectual property and our people.
Our taxable REIT subsidiary, composed of Wood Products, Cellulose Fibers and Real Estate, generates cash fl ow to service our debt and help fund your dividend and our growth opportunities. Cellulose Fibers, which had a record year in 2010, broadens our exposure to global markets, while Wood Products and Real Estate offer substantial upside potential from their unique position to benefi t from a return to long-term housing-start trends.
Our commitment is to provide you with a dividend that is sustainable and that we can grow over time. In December, we announced a policy of paying a dividend ratio of 75 percent of funds available for distribution over the cycle. Given the continued challenges of the housing market, our announced quarterly dividend of 15 cents per share is likely to represent nearly all of our 2011 funds available for distribution.
For 2011, we project only a modest increase in single-family housing starts from 2010 levels. This will continue to put pressure on our Timberlands, Wood Products and Real Estate businesses.
Nonetheless, I expect improved performance from continued operational changes, cost effi ciencies and improved relative competitiveness of our businesses. I expect positive cash fl ow from our Wood Products segment, while I expect our Real Estate segment to continue to deliver strong performance relative to its peers. Although our Timberlands business will continue to defer a portion of our harvest, we foresee a slight increase in logging activity, taking advantage of improved demand in Asian markets. Finally, Cellulose Fibers should maintain its strong operating performance.
2011 will be another challenging year, but I’m confi dent we’ll continue on the path to stronger results.
Dan FultonPresident and Chief Executive Offi cer
DEAR SHAREHOLDER,

UNITED STATESSECURITIES AND EXCHANGE COMMISSION
WASHINGTON, D.C. 20549
FORM 10-K[X] ANNUAL REPORT PURSUANT TO SECTION 13 OR 15(D) OF THE SECURITIES EXCHANGE ACT OF 1934
FOR THE FISCAL YEAR ENDED DECEMBER 31, 2010
or
[ ] TRANSITION REPORT PURSUANT TO SECTION 13 OR 15(D) OF THE SECURITIES EXCHANGE ACT OF 1934FOR THE TRANSITION PERIOD FROM TO
COMMISSION FILE NUMBER 1-4825
WEYERHAEUSER COMPANYA WASHINGTON CORPORATION
91-0470860(IRS EMPLOYER IDENTIFICATION NO.)
FEDERAL WAY, WASHINGTON 98063-9777 TELEPHONE (253) 924-2345
SECURITIES REGISTERED PURSUANT TO SECTION 12(B) OF THE ACT:
TITLE OF EACH CLASS NAME OF EACH EXCHANGE ON WHICH REGISTERED:
Common Shares ($1.25 par value) Chicago Stock ExchangeNew York Stock Exchange
Indicate by check mark if the registrant is a well-known seasoned issuer, as defined in Rule 405 of the SecuritiesAct. [X] Yes [ ] No
Indicate by check mark if the registrant is not required to file reports pursuant to Section 13 or Section 15(d) of theAct. [ ] Yes [X] No
Indicate by check mark whether the registrant (1) has filed all reports required to be filed by Section 13 or 15(d) of the SecuritiesExchange Act of 1934 during the preceding 12 months (or for such shorter period that the registrant was required to file suchreports), and (2) has been subject to such filing requirements for the past 90 days. [X] Yes [ ] No
Indicate by check mark whether the registrant has submitted electronically and posted on its corporate Website, if any, everyInteractive Data File required to be submitted and posted pursuant to Rule 405 of Regulation S-T (§ 232.405 of this chapter)during the preceding 12 months (or for such shorter period that the registrant was required to submit and post suchfiles). [X] Yes [ ] No
Indicate by check mark if disclosure of delinquent filers pursuant to Item 405 of Regulation S-K (§ 229.405 of this chapter) is notcontained herein, and will not be contained, to the best of registrant’s knowledge, in definitive proxy or information statementsincorporated by reference in Part III of this Form 10-K or any amendment to this Form 10-K. [X]
Indicate by check mark whether the registrant is a large accelerated filer, an accelerated filer, a non-accelerated filer, or a smallerreporting company. See the definitions of “large accelerated filer,” “accelerated filer” and “smaller reporting company” in Rule12b-2 of the Exchange Act.
Large accelerated filer [X] Accelerated filer [ ] Non-accelerated filer [ ] Smaller reporting company [ ]
Indicate by check mark whether the registrant is a shell company (as defined in Rule 12b-2 of the Act). [ ] Yes [X] No
As of June 30, 2010, the aggregate market value of the registrant’s common stock held by non-affiliates of the registrant was$6,289,093,380 based on the closing sale price as reported on the New York Stock Exchange Composite Price Transactions.
As of February 4, 2011, 536,242,106 shares of the registrant’s common stock ($1.25 par value) were outstanding.
DOCUMENTS INCORPORATED BY REFERENCEPortions of the Notice of 2011 Annual Meeting of Shareholders and Proxy Statement for the company’s Annual Meeting ofShareholders to be held April 14, 2011, are incorporated by reference into Part II and III.
WEYERHAEUSER COMPANY > 2010 ANNUAL REPORT AND FORM 10-K
TABLE OF CONTENTSPART IITEM 1. OUR BUSINESS . . . . . . . . . . . . . . . . . . . . . . . . . . . . . . . . . . . . . . . . 1
WE CAN TELL YOU MORE . . . . . . . . . . . . . . . . . . . . . . . . . . . . . . . . . 1WHO WE ARE . . . . . . . . . . . . . . . . . . . . . . . . . . . . . . . . . . . . . . . . . . 1
• REAL ESTATE INVESTMENT TRUST (REIT) CONVERSION . . . . . . . 1
• OUR BUSINESS SEGMENTS . . . . . . . . . . . . . . . . . . . . . . . . . . . . . 2
• CURRENT MARKET CONDITIONS . . . . . . . . . . . . . . . . . . . . . . . . . 2
• COMPETITION IN OUR MARKETS . . . . . . . . . . . . . . . . . . . . . . . . . 2
• SALES OUTSIDE THE U.S. . . . . . . . . . . . . . . . . . . . . . . . . . . . . . . 2
• OUR EMPLOYEES . . . . . . . . . . . . . . . . . . . . . . . . . . . . . . . . . . . . . 2
• COMPARABILITY OF DATA . . . . . . . . . . . . . . . . . . . . . . . . . . . . . . 2WHAT WE DO . . . . . . . . . . . . . . . . . . . . . . . . . . . . . . . . . . . . . . . . . . 3
• TIMBERLANDS . . . . . . . . . . . . . . . . . . . . . . . . . . . . . . . . . . . . . . . 3
• WOOD PRODUCTS . . . . . . . . . . . . . . . . . . . . . . . . . . . . . . . . . . . . 8
• CELLULOSE FIBERS . . . . . . . . . . . . . . . . . . . . . . . . . . . . . . . . . . . 12
• REAL ESTATE . . . . . . . . . . . . . . . . . . . . . . . . . . . . . . . . . . . . . . . . 14
• CORPORATE AND OTHER . . . . . . . . . . . . . . . . . . . . . . . . . . . . . . . 16NATURAL RESOURCE AND ENVIRONMENTAL MATTERS . . . . . . . . . . 17
• ENDANGERED SPECIES PROTECTIONS . . . . . . . . . . . . . . . . . . . . 17
• REGULATIONS AFFECTING FORESTRY PRACTICES . . . . . . . . . . . . 17
• FOREST CERTIFICATION STANDARDS . . . . . . . . . . . . . . . . . . . . . 18
• WHAT THESE REGULATIONS AND CERTIFICATION PROGRAMSMEAN TO US . . . . . . . . . . . . . . . . . . . . . . . . . . . . . . . . . . . . . . 18
• CANADIAN ABORIGINAL RIGHTS . . . . . . . . . . . . . . . . . . . . . . . . . . 18
• POLLUTION-CONTROL REGULATIONS . . . . . . . . . . . . . . . . . . . . . . 18
• ENVIRONMENTAL CLEANUP . . . . . . . . . . . . . . . . . . . . . . . . . . . . . 19
• REGULATION OF AIR EMISSIONS IN THE U.S. . . . . . . . . . . . . . . . 19
• REGULATION OF AIR EMISSIONS IN CANADA . . . . . . . . . . . . . . . . 20
• POTENTIAL CHANGES IN POLLUTION REGULATION . . . . . . . . . . . 20FORWARD-LOOKING STATEMENTS . . . . . . . . . . . . . . . . . . . . . . . . . . 21
ITEM 1A. RISK FACTORS . . . . . . . . . . . . . . . . . . . . . . . . . . . . . . . . . . . . . . . . . 22RISKS RELATED TO OUR INDUSTRIES AND BUSINESS . . . . . . . . . . 22
• MACROECONOMIC CONDITIONS . . . . . . . . . . . . . . . . . . . . . . . . . 22
• COMMODITY PRODUCTS . . . . . . . . . . . . . . . . . . . . . . . . . . . . . . . 22
• INDUSTRY SUPPLY OF LOGS, WOOD PRODUCTS ANDPULP . . . . . . . . . . . . . . . . . . . . . . . . . . . . . . . . . . . . . . . . . . . . 22
• HOMEBUILDING MARKET AND ECONOMIC RISKS . . . . . . . . . . . . 23
• CAPITAL MARKETS . . . . . . . . . . . . . . . . . . . . . . . . . . . . . . . . . . . . 23
• CHANGES IN CREDIT RATINGS . . . . . . . . . . . . . . . . . . . . . . . . . . . 24
• SUBSTITUTION . . . . . . . . . . . . . . . . . . . . . . . . . . . . . . . . . . . . . . . 24
• CHANGES IN PRODUCT MIX OR PRICING . . . . . . . . . . . . . . . . . . . 24
• INTENSE COMPETITION . . . . . . . . . . . . . . . . . . . . . . . . . . . . . . . . 24
• MATERIAL DISRUPTION OF MANUFACTURING . . . . . . . . . . . . . . . 24
• CAPITAL REQUIREMENTS . . . . . . . . . . . . . . . . . . . . . . . . . . . . . . . 25
• LAWS AND REGULATIONS . . . . . . . . . . . . . . . . . . . . . . . . . . . . . . 25
• CURRENCY EXCHANGE RATES . . . . . . . . . . . . . . . . . . . . . . . . . . . 25
• AVAILABILITY OF RAW MATERIALS AND ENERGY . . . . . . . . . . . . . 25
• TRANSPORTATION . . . . . . . . . . . . . . . . . . . . . . . . . . . . . . . . . . . . 26
• REIT STATUS . . . . . . . . . . . . . . . . . . . . . . . . . . . . . . . . . . . . . . . . 26
• LEGAL PROCEEDINGS . . . . . . . . . . . . . . . . . . . . . . . . . . . . . . . . . 27
• EXPORT TAXES . . . . . . . . . . . . . . . . . . . . . . . . . . . . . . . . . . . . . . . 28
• NATURAL DISASTERS . . . . . . . . . . . . . . . . . . . . . . . . . . . . . . . . . . 28RISKS RELATED TO OWNERSHIP OF OUR COMMON STOCK . . . . . . 28
• STOCK-PRICE VOLATILITY . . . . . . . . . . . . . . . . . . . . . . . . . . . . . . . . .28ITEM 1B. UNRESOLVED STAFF COMMENTS . . . . . . . . . . . . . . . . . . . . . . . . . . 28ITEM 2. PROPERTIES . . . . . . . . . . . . . . . . . . . . . . . . . . . . . . . . . . . . . . . . . . 29ITEM 3. LEGAL PROCEEDINGS . . . . . . . . . . . . . . . . . . . . . . . . . . . . . . . . . . . 29
PART IIITEM 5. MARKET FOR REGISTRANT’S COMMON EQUITY, RELATED
STOCKHOLDER MATTERS AND ISSUER PURCHASES OF EQUITYSECURITIES . . . . . . . . . . . . . . . . . . . . . . . . . . . . . . . . . . . . . . . . . . . 30
ITEM 6. SELECTED FINANCIAL DATA . . . . . . . . . . . . . . . . . . . . . . . . . . . . . . 32ITEM 7. MANAGEMENT’S DISCUSSION AND ANALYSIS OF FINANCIAL
CONDITION AND RESULTS OF OPERATIONS . . . . . . . . . . . . . . . . . 33WHAT YOU WILL FIND IN THIS MD&A . . . . . . . . . . . . . . . . . . . . . . . . 33REAL ESTATE INVESTMENT TRUST (REIT) CONVERSION . . . . . . . . . 33
ECONOMIC AND MARKET CONDITIONS AFFECTING OUROPERATIONS . . . . . . . . . . . . . . . . . . . . . . . . . . . . . . . . . . . . . . . . . . 33FINANCIAL PERFORMANCE SUMMARY . . . . . . . . . . . . . . . . . . . . . . 35RESULTS OF OPERATIONS . . . . . . . . . . . . . . . . . . . . . . . . . . . . . . . 36
• CONSOLIDATED RESULTS . . . . . . . . . . . . . . . . . . . . . . . . . . . . . 36
• TIMBERLANDS . . . . . . . . . . . . . . . . . . . . . . . . . . . . . . . . . . . . . . 37
• WOOD PRODUCTS . . . . . . . . . . . . . . . . . . . . . . . . . . . . . . . . . . . 39
• CELLULOSE FIBERS . . . . . . . . . . . . . . . . . . . . . . . . . . . . . . . . . . 41
• REAL ESTATE . . . . . . . . . . . . . . . . . . . . . . . . . . . . . . . . . . . . . . . 42
• CORPORATE AND OTHER . . . . . . . . . . . . . . . . . . . . . . . . . . . . . . 44
• CONTAINERBOARD, PACKAGING AND RECYCLING . . . . . . . . . . 45
• INTEREST EXPENSE . . . . . . . . . . . . . . . . . . . . . . . . . . . . . . . . . . 45
• INCOME TAXES . . . . . . . . . . . . . . . . . . . . . . . . . . . . . . . . . . . . . 45LIQUIDITY AND CAPITAL RESOURCES . . . . . . . . . . . . . . . . . . . . . . 46
• CASH FROM OPERATIONS . . . . . . . . . . . . . . . . . . . . . . . . . . . . . 46
• INVESTING IN OUR BUSINESS . . . . . . . . . . . . . . . . . . . . . . . . . . 47
• FINANCING . . . . . . . . . . . . . . . . . . . . . . . . . . . . . . . . . . . . . . . . . 47OFF-BALANCE SHEET ARRANGEMENTS . . . . . . . . . . . . . . . . . . . . . 49ENVIRONMENTAL MATTERS, LEGAL PROCEEDINGS AND OTHERCONTINGENCIES . . . . . . . . . . . . . . . . . . . . . . . . . . . . . . . . . . . . . . . 49ACCOUNTING MATTERS . . . . . . . . . . . . . . . . . . . . . . . . . . . . . . . . . 49
• CRITICAL ACCOUNTING POLICIES . . . . . . . . . . . . . . . . . . . . . . . 49
• PROSPECTIVE ACCOUNTING PRONOUNCEMENTS . . . . . . . . . . . 52ITEM 7A. QUANTITATIVE AND QUALITATIVE DISCLOSURES ABOUT
MARKET RISK . . . . . . . . . . . . . . . . . . . . . . . . . . . . . . . . . . . . . . . . 53LONG-TERM DEBT OBLIGATIONS . . . . . . . . . . . . . . . . . . . . . . . . . . 53
ITEM 8. FINANCIAL STATEMENTS AND SUPPLEMENTARY DATA . . . . . . . 54REPORT OF INDEPENDENT REGISTERED PUBLIC ACCOUNTINGFIRM . . . . . . . . . . . . . . . . . . . . . . . . . . . . . . . . . . . . . . . . . . . . . . . . 54CONSOLIDATED STATEMENT OF OPERATIONS . . . . . . . . . . . . . . . . 55CONSOLIDATED BALANCE SHEET . . . . . . . . . . . . . . . . . . . . . . . . . . 56CONSOLIDATED STATEMENT OF CASH FLOWS . . . . . . . . . . . . . . . 58CONSOLIDATED STATEMENT OF CHANGES IN EQUITY ANDCOMPREHENSIVE INCOME . . . . . . . . . . . . . . . . . . . . . . . . . . . . . . . 59INDEX FOR NOTES TO CONSOLIDATED FINANCIALSTATEMENTS . . . . . . . . . . . . . . . . . . . . . . . . . . . . . . . . . . . . . . . . . 60NOTES TO CONSOLIDATED FINANCIAL STATEMENTS . . . . . . . . . . . 61
ITEM 9. CHANGES IN AND DISAGREEMENTS WITH ACCOUNTANTS ONACCOUNTING AND FINANCIAL DISCLOSURE . . . . . . . . . . . . . . . . 102
ITEM 9A. CONTROLS AND PROCEDURES . . . . . . . . . . . . . . . . . . . . . . . . . . . 102EVALUATION OF DISCLOSURE CONTROLS AND PROCEDURES . . . 102CHANGES IN INTERNAL CONTROL . . . . . . . . . . . . . . . . . . . . . . . . . 102MANAGEMENT’S REPORT ON INTERNAL CONTROL OVERFINANCIAL REPORTING . . . . . . . . . . . . . . . . . . . . . . . . . . . . . . . . . . 102REPORT OF INDEPENDENT REGISTERED PUBLIC ACCOUNTINGFIRM . . . . . . . . . . . . . . . . . . . . . . . . . . . . . . . . . . . . . . . . . . . . . . . . 103
ITEM 9B. OTHER INFORMATION — NOT APPLICABLE . . . . . . . . . . . . . . . . .
PART IIIITEM 10. DIRECTORS AND EXECUTIVE OFFICERS . . . . . . . . . . . . . . . . . . . 104ITEM 11. EXECUTIVE AND DIRECTOR COMPENSATION . . . . . . . . . . . . . . . 109ITEM 12. SECURITY OWNERSHIP OF CERTAIN BENEFICIAL OWNERS AND
MANAGEMENT AND RELATED STOCKHOLDER MATTERS . . . . . . 109ITEM 13. CERTAIN RELATIONSHIPS AND RELATED TRANSACTIONS . . . . . 109ITEM 14. PRINCIPAL ACCOUNTING FEES AND SERVICES . . . . . . . . . . . . . . 109
PART IVITEM 15. EXHIBITS AND FINANCIAL STATEMENT SCHEDULES . . . . . . . . . 110
EXHIBITS . . . . . . . . . . . . . . . . . . . . . . . . . . . . . . . . . . . . . . . . . . . . . 110SIGNATURES . . . . . . . . . . . . . . . . . . . . . . . . . . . . . . . . . . . . . . . . . 112REPORT OF INDEPENDENT REGISTERED PUBLIC ACCOUNTINGFIRM . . . . . . . . . . . . . . . . . . . . . . . . . . . . . . . . . . . . . . . . . . . . . . . . 113FINANCIAL STATEMENT SCHEDULE . . . . . . . . . . . . . . . . . . . . . . . . 114
CERTIFICATIONS . . . . . . . . . . . . . . . . . . . . . . . . . . . . . . . . . . . . . . 115
COMPANY OFFICERS . . . . . . . . . . . . . . . . . . . . . . . . . . . . . . . . . . 118

OUR BUSINESSWe are a forest products company that grows and harveststrees, builds homes and makes a range of forest productsessential to everyday lives. Our goal is to do this safely,profitably and responsibly. We are committed to operate as asustainable company in the 21st Century. We focus onincreasing energy and resource efficiency, reducing greenhousegas emissions, reducing water consumption, conserving naturalresources, and offering products that meet human needs withsuperior sustainability attributes. We operate with world classsafety results, understand and address the needs of thecommunities in which we operate, and present ourselvestransparently.
We have offices or operations in 10 countries and havecustomers worldwide. We manage 20.5 million acres of forests,of which we own 5.8 million acres, lease 0.7 million acres andhave renewable, long-term licenses on 14 million acres. In2010, we generated $6.6 billion in net sales.
This portion of our Annual Report and Form 10-K providesdetailed information about who we are, what we do and wherewe are headed. Unless otherwise specified, current informationreported in this Form 10-K is as of the fiscal year endedDecember 31, 2010.
We break out financial information such as revenues, earningsand assets by the business segments that form our company.We also discuss the development of our company and thegeographic areas where we do business.
We report our financial condition in two groups:
•Forest Products — our forest products-based operations,principally the growing and harvesting of timber, themanufacture, distribution and sale of forest products andcorporate governance activities; and
•Real Estate — our real estate development and constructionoperations.
Throughout this Form 10-K, unless specified otherwise,references to “we,” “our,” “us” and “the company” refer to theconsolidated company, including both Forest Products and RealEstate.
WE CAN TELL YOU MORE
AVAILABLE INFORMATION
We meet the information-reporting requirements of theSecurities Exchange Act of 1934 by filing periodic reports, proxystatements and other information with the Securities and
Exchange Commission (SEC). These reports and statements —information about our company’s business, financial resultsand other matters — are available at:
•the SEC Internet site — www.sec.gov;
•the SEC’s Public Conference Room, 100 F St. N.E.,Washington, D.C., 20549, (800) SEC-0330; and
•our Internet site — www.weyerhaeuser.com.
When we file the information electronically with the SEC, it alsois added to our Internet site.
WHO WE ARE
We started out as Weyerhaeuser Timber Company, incorporatedin the state of Washington in January 1900, when FrederickWeyerhaeuser and 15 partners bought 900,000 acres oftimberland.
REAL ESTATE INVESTMENT TRUST (REIT) CONVERSION
Our board of directors has determined that conversion to a REITbest supports our strategic direction. For tax purposes, thischange was effective January 1, 2010. To implement ourdecision to be taxed as a REIT, we distributed to ourshareholders our accumulated earnings and profits, determinedunder federal income tax provisions as a “Special Dividend” onSeptember 1, 2010.
As a REIT, we expect to derive most of our REIT income frominvestments in timberlands, including the sale of standingtimber through pay-as-cut sales contracts. REIT income can bedistributed to shareholders without first paying corporate leveltax, substantially eliminating the double taxation on income. Asignificant portion of our timberland segment earnings willreceive this favorable tax treatment. We will, however, besubject to corporate taxes on built-in-gains (the excess of fairmarket value over tax basis at January 1, 2010) on sales ofreal property (other than standing timber) held by the REITduring the first 10 years following the REIT conversion. We alsowill continue to be required to pay federal corporate incometaxes on earnings of our Taxable REIT Subsidiary (TRS), whichprincipally includes our manufacturing businesses, our realestate development business and our non-qualified timberlandsegment income.
More information about our REIT conversion is in Note 2: RealEstate Investment Trust (REIT) Conversion in the Notes toConsolidated Financial Statements, as well as in theManagement’s Discussion and Analysis of Financial Conditionand Results of Operations.
WEYERHAEUSER COMPANY > 2010 ANNUAL REPORT AND FORM 10-K 1

OUR BUSINESS SEGMENTSIn the Consolidated Results section of Management’sDiscussion and Analysis of Financial Condition and Results ofOperations, you will find our overall performance results for ourbusiness segments:
•Timberlands;
•Wood Products;
•Cellulose Fibers;
•Real Estate;
•Corporate and Other; and
•Containerboard, Packaging and Recycling (sold in 2008).
Detailed financial information about our business segmentsand our geographic locations is in Note 3: Business Segmentsand Note 22: Geographic Areas in the Notes to ConsolidatedFinancial Statements, as well as in this section and in theManagement’s Discussion and Analysis of Financial Conditionand Results of Operations.
CURRENT MARKET CONDITIONSThe U.S. economy has gradually begun its recovery from themost severe recession since the 1930’s. However, the U.S.housing market continues to lag other sectors in the recoveryand remains burdened by excess inventory and a diminishedpool of qualified home buyers. The health of the U.S. housingmarket strongly affects our Real Estate, Wood Products andTimberlands segments. Real Estate focuses on building singlefamily homes. Wood Products primarily sells into the newresidential building and repair and remodel markets. Demand forlogs from our Timberlands segment is affected by the productionof wood-based building products. Cellulose Fibers is primarilyaffected by global demand and the value of the U.S. dollar.
COMPETITION IN OUR MARKETSWe operate in highly competitive domestic and foreign markets,with numerous companies selling similar products. Many of ourproducts also face competition from substitutes for wood andwood-fiber products. In real estate development, ourcompetitors include numerous regional and national firms. Wecompete in our markets primarily through price, product qualityand service levels.
Our business segments’ competitive strategies are as follows:
•Timberlands — Extract maximum value for each acre we ownor manage.
•Wood Products — Deliver high-quality lumber, engineeredwood products and integrated solutions to the residentialconstruction and industrial markets.
•Cellulose Fibers — Concentrate on value-added pulpproducts.
•Real Estate — Deliver unique value propositions in targetmarkets.
SALES OUTSIDE THE U.S.
In 2010, $2.1 billion — 32 percent — of our total consolidatedsales and revenues were to customers outside the U.S. The tablebelow shows sales outside the U.S. for the last three years.
SALES OUTSIDE THE U.S. IN MILLIONS OF DOLLARS
2010 2009 2008
Exports from the U.S. $1,381 $1,154 $1,649
Canadian export and domestic sales 240 166 257
Other foreign sales 467 247 563
Total $2,088 $1,567 $2,469
Percent of total sales 32% 28% 22%
OUR EMPLOYEES
We have approximately 14,250 employees. This numberincludes:
•13,400 employed in North America and
•850 employed by our operations outside of North America.
Of these employees, approximately 3,500 are members ofunions covered by multi-year collective-bargaining agreements.
COMPARABILITY OF DATA
Over the last five years, we have made an acquisition tocomplement our key operations and have exited businessesthat did not fit our long-term strategic direction. As you reviewour results for the past five years, it may be helpful to keepin mind the following acquisition and divestitures and thesegments affected.
Summary of Recent Divestitures and Acquisition
YEAR TRANSACTION SEGMENTS AFFECTED
2010 Five short line railroads – sold Corporate and Other segment
2009 Trus Joist® Commercialdivision – sold
Wood Products segment
2008 Containerboard, Packaging andRecycling segment – sold
Containerboard, Packaging andRecycling segment
2008 Australian operations – sold Corporate and Other segment
2008 Uruguay operations – partitioncompleted
Timberlands and Corporate andOther segments
2007 Fine Paper and related assets –divested
Fine Paper, Timberlands andWood Products segments
2007 New Zealand operations – sold Corporate and Other segment
2007 Canadian wood productsdistribution centers – sold
Wood Products segment
2006 North American and Irishcomposite panel operations –sold
Wood Products and Corporateand Other segments
2006 Maracay Homes – acquired Real Estate segment
Additional information related to our discontinued operationscan be found in Note 4: Discontinued Operations in the Notes
2

to Consolidated Financial Statements. Information pertaining tosegment comparability can be found in Note 3: BusinessSegments in the Notes to Consolidated Financial Statements.
WHAT WE DO
This section provides information about how we:
•grow and harvest trees,
•manufacture and sell products made from them,
•build and sell homes and
•develop land.
For each of our business segments, we provide details aboutwhat we do, where we do it, how much we sell and where weare headed.
TIMBERLANDS
Our Timberlands business segment manages 6.5 million acresof private commercial forestland worldwide. We own 5.8 millionof those acres and lease the other 0.7 million acres. Inaddition, we have renewable, long-term licenses on 14.0 millionacres of forestland located in four Canadian provinces. Thetables presented in this section include data from thissegment’s business units as of the end of 2010.
WHAT WE DO
Forestry Management
Our Timberlands business segment:
•grows and harvests trees for use as lumber, other wood andbuilding products and pulp and paper;
•exports logs to other countries where they are made intoproducts;
•plants seedlings — and in parts of Canada we use naturalregeneration — to reforest the harvested areas using themost effective regeneration method for the site and species;
•monitors and cares for the new trees as they grow tomaturity; and
•seeks to sustain and maximize the timber supply from ourforestlands while keeping the health of our environment a keypriority.
Our goal is to maximize returns by selling logs and stumpage tointernal and external customers. We focus on solid wood anduse intensive silviculture to improve forest productivity andreturns while managing our forests on a sustainable basis tomeet customer and public expectations.
International operations in this segment consist principally offorest plantations, forest licenses and converting assets inSouth America. We serve as owners or managing partner inthese operations, which are either wholly-owned subsidiaries or
joint ventures. In China, we are the managing partner in a jointventure established in 2007. We own 51 percent of this jointventure and Fujian Yong’An Forestry Company owns theremaining 49 percent. As of December 31, 2010, the jointventure managed 44,000 acres of timberlands.
Sustainable Forestry Practices
We are committed to responsible environmental stewardshipwherever we operate, managing forests to produce financiallymature timber while protecting the ecosystem services theyprovide. Our working forests include places with uniqueenvironmental, cultural, historical or recreational value. Toprotect their unique qualities, we follow regulatoryrequirements, voluntary standards and implement theSustainable Forestry Initiative® (SFI) standard. Independentauditing of all of the forests we own or manage in the UnitedStates and Canada certifies that we meet the SFI standard. Ourforestlands in Uruguay are Forest Stewardship Council (FSC)certified or managed to the developing Uruguayan nationalforestry management standard designed to meet the Programfor the Endorsement of Forest Certification (PEFC).
Canadian Forestry Operations
In Canada, we have licenses to operate forestlands that provideraw material for our manufacturing units in various provinces.When we harvest trees, we pay the provinces at stumpage ratesset by the government and generally based on prevailing marketprices. We do not generate any profit in the Timberlands segmentfrom the harvest of timber from the licensed acres in Canada.
Other Values From Our Timberlands
In the United States, we actively manage mineral, oil and gasleases on our land and use geologic databases to identify andmarket opportunities for commercial mineral and geothermaldevelopment. We recognize leasing revenue over the terms ofagreements with customers. Revenue primarily comes from:
•royalty payments on oil and gas production;
•upfront bonus payments from oil and gas leasing andexploration activity;
•royalty payments on hard minerals (rock, sand and gravel);
•geothermal lease and option revenues; and
•the sale of mineral assets.
In managing mineral resources, we generate revenue related toour ownership of the minerals and, separately, related to ourownership of the surface. The ownership of mineral rights andsurface acres may be held by two separate parties. Materialsthat can be mined from the surface, and whose value comesfrom factors other than their chemical composition, typicallybelong to the surface owner. Examples of surface materialsinclude rock, sand, gravel, dirt and topsoil. The mineral ownerholds the title to commodities that derive value from their
WEYERHAEUSER COMPANY > 2010 ANNUAL REPORT AND FORM 10-K 3

unique chemical composition. Examples of mineral rightsinclude oil, gas, coal (even if mined at the surface) andprecious metals. If the two types of rights conflict, then mineralrights are generally superior to surface rights. A third type ofland right is geothermal, which can belong to either the surfaceor mineral owner. We routinely reserve mineral and geothermalrights when selling surface timberlands acreage.
Timberlands Products
PRODUCTS HOW THEY’RE USED
Logs Logs are made into lumber, other wood andbuilding products and pulp and paper products
Timberlands Timberland tracts are exchanged to improve ourtimberland portfolio or are sold to third parties byour land development subsidiary within thissegment
Timber Standing timber may be sold to third parties orconverted into chips and other raw materials tobe made into pulp and paper products
Minerals, oil and gas Sold into construction and energy markets
Other products Includes seed and seedlings, poles, as well asplywood and hardwood lumber produced by ourinternational operations, primarily in SouthAmerica
HOW WE MEASURE OUR PRODUCT
We report Timberlands data in cubic meters. Cubic metersmeasure the total volume of wood fiber in a tree or log that wecan sell. Cubic meter volume is determined from the large- andsmall-end diameters and length and provides a more consistentand comparative measure of timber and log volume amongoperating regions, species, size and seasons of the year thanother units of measure.
We also use two other units of measure when transactingbusiness including:
•thousand board feet (MBF) — used in the West to measurethe expected lumber recovery from a tree or log, but it doesnot include taper or recovery of nonlumber residual products;and
•green tons — used in the South to measure weight, butfactors used for conversion to product volume can vary byspecies, size, location and season.
Both measures are accurate in the regions where they areused, but they do not provide a meaningful basis forcomparisons between the regions.
The conversion rate for MBF to cubic meters varies based onseveral factors including diameter, length and taper of thetimber. The average conversion rate for MBF to cubic meters isapproximately 6.7 cubic meters per MBF.
The conversion rate from green tons to cubic meters also variesbased on the season harvested and the specific gravity of the
wood for the region where the timber is grown. An averageconversion rate for green tons to cubic meters is approximately0.825 cubic meters per green ton.
WHERE WE DO IT
Our timberlands assets are located primarily in North America.In the U.S. we own and manage sustainable forests in ninestates for use in wood products and pulp and papermanufacturing. We own or lease:
•4.1 million acres in the southern U.S. (Alabama, Arkansas,Louisiana, Mississippi, North Carolina, Oklahoma and Texas);and
•2.0 million acres in the Pacific Northwest (Oregon andWashington).
Our international operations are located primarily in Uruguayand China where, as of December 31, 2010, we own a totalof 317,000 acres and have long-term leases on another70,000 acres.
In addition, we have renewable, long-term licenses on14.0 million acres of forestland owned by the provincialgovernment of four Canadian provinces.
Our total timber inventory — including timber on owned andleased land in our U.S. and international operations — isapproximately 303 million cubic meters. The timber inventoryon licensed lands in Canada is approximately 371 million cubicmeters. The amount of timber inventory does not translate intoan amount of lumber or panel products because the quantity ofend products:
•varies according to the species, size and quality of thetimber; and
•will change through time as the mix of these variables adjust.
The species, size and grade of the trees affects the relativevalue of our timberlands.
DISCUSSION OF OPERATIONS BY GEOGRAPHY
Summary of 2010 Timber Inventory and Timberland Locations
United States
GEOGRAPHIC AREA
MILLIONSOF CUBICMETERS
THOUSANDS OF ACRES ATDECEMBER 31, 2010
TOTALINVENTORY
FEEOWNERSHIP
LONG-TERM
LEASESTOTALACRES
U.S.:
West 157 2,038 — 2,038
South 138 3,434 681 4,115
Total U.S. 295 5,472 681 6,153
4

Western United States
Our Western acres are well situated to serve the wood productmarkets in Oregon and Washington. Their location nearWeyerhaeuser mills and many third-party facilities allows formultiple sales opportunities. In addition, our location on theWest Coast provides access to higher-value export markets forDouglas fir and hemlock logs in Japan, Korea and China. Thesize and quality of our Western timberlands, coupled with theirproximity to several deep-water port facilities, positions us tomeet the needs of Pacific Rim log markets.
Our lands are composed primarily of Douglas fir, a specieshighly valued for its structural strength. Our coastal lands alsocontain western hemlock and have a higher proportion ofhemlock than our interior holdings. Our management systems,which provide us a competitive operating advantage, range fromresearch and forestry, to technical planning models,mechanized harvesting and marketing and logistics.
The average age of timber harvested in 2010 was 50 years.Most of our U.S. timberland is intensively managed for timberproduction, but some areas are conserved for environmental,historical, recreational or cultural reasons. Some of our oldertrees are protected in acreage set aside for conservation, andsome are not yet logged due to harvest rate regulations. Whileover the long term our average harvest age will decrease inaccordance with our sustainable forestry practices, we will onlyharvest approximately 1.5 percent of our Western acreage eachyear.
Southern United States
Our Southern acres predominantly contain southern yellow pineand encompass timberlands in seven states. This areaprovides a constant year round flow of logs to a variety ofinternal and third-party customers. We sell grade logs to millsthat manufacture a diverse range of products including lumber,plywood and veneer. We also sell chips and fiber logs tooriented strand board, pulp and paper mills. Our timberlandsare well located to take advantage of road, logging andtransportation systems for efficient delivery of logs to thesecustomers.
We intensively manage our timber plantations using forestryresearch and planning systems to optimize grade logproduction. We also actively manage our land to capturerevenues from our oil, gas and hard minerals resources. We dothis while providing quality habitat for a range of animals andbirds, which is in high demand for recreational purposes. Welease more than 95 percent of our acres to the public and statewildlife agencies for recreational purposes.
The average age of timber harvested in 2010 was 31 years forsouthern yellow pine. In accordance with our sustainableforestry practices, we harvest approximately 3.0 percent to3.5 percent of our acreage each year in the South.
International
GEOGRAPHIC AREA
MILLIONSOF CUBICMETERS
THOUSANDS OF ACRES ATDECEMBER 31, 2010
TOTALINVENTORY
FEEOWNERSHIP
LONG-TERM
LEASESTOTALACRES
Uruguay 7 317 26 343
China(1) 1 — 44 44
Total International 8 317 70 387
(1) Includes Weyerhaeuser percentage ownership of timberlands owned and managedthrough joint ventures
Our forestlands in Uruguay are approximately 51 percentloblolly pine and 49 percent eucalyptus. On average, the timberin Uruguay is in the first third of its rotation age. It is enteringinto that part of the growth rotation when we will see increasedvolume accretion. About 93 percent of the area to be plantedhas been afforested to date. The afforestation program isplanned to be completed within the next two years.
In Uruguay, the target rotation ages are 21 to 22 years for pineand 14 to 17 years for eucalyptus. We manage both species toa grade (appearance) regime.
We also operate a plywood mill in Uruguay with a productioncapacity of 140,000 cubic meters and a production volume of109,000 cubic meters reached in 2010. Construction to morethan double this capacity is under way and is expected to becompleted in April 2011.
In Brazil, Weyerhaeuser is a managing partner in a jointventure. We own 67 percent and Fibria Cellulose SA owns33 percent. A hardwood sawmill with 65,000 cubic meters ofcapacity produces high-value eucalyptus (Lyptus®) lumber andrelated appearance wood products. The mill’s production in2010 was 55,000 cubic meters.
Our investment in China is a joint venture with a publiccompany that is controlled by the state and local governments.Weyerhaeuser is the managing partner in a joint venture startedin 2007. Ownership is 51 percent Weyerhaeuser and49 percent Fujian Yong’An Forestry Company. The joint venturecurrently manages 44,000 acres of timberlands.
In China, the target rotation age is seven years, since we aremanaging the forests of loblolly pine and eucalyptus for fiber.
WEYERHAEUSER COMPANY > 2010 ANNUAL REPORT AND FORM 10-K 5

Canada — Licensed Timberlands
GEOGRAPHIC AREA
MILLIONSOF CUBICMETERS
THOUSANDS OF ACRES ATDECEMBER 31, 2010
TOTALINVENTORY
LICENSEDSTANDING
VOLUME
TOTALLICENSE
ARRANGEMENTS
Canada:
Alberta 246 5,356
British Columbia 12 1,034
Ontario 33 2,598
Saskatchewan 80 4,968
Total Canada 371 13,956
We lease and license forestland in Canada from the provincialgovernment to secure the volume for our manufacturing units inthe various provinces. When the volume is harvested, we paythe province at stumpage rates set by the government andgenerally based on prevailing market prices. The harvested logsare transferred to our manufacturing facilities at cost(stumpage plus harvest, haul and overhead costs less anymargin on selling logs to third parties). Any conversion profit isrecognized at the respective mill in either the Cellulose Fibersor Wood Products segment.
Five-Year Summary of Timberlands Production
PRODUCTION IN THOUSANDS
2010 2009 2008 2007 2006
Fee depletion –cubic meters:
West 5,569 6,359 10,626 10,403 10,666
South 8,197 8,996 12,363 12,645 13,246
International(1) 349 503 — — —
Total 14,115 15,858 22,989 23,048 23,912
(1) International forestlands started commercial thinning in 2009 leading to productionvolumes.
Our Timberlands annual fee depletion represents the harvest ofthe timber assets we own. Depletion is a method of expensingthe cost of establishing the fee timber asset base over theharvest or timber sales volume. The decline in fee depletionfrom 2008 through 2010 reflects the company’s decision todefer harvest and preserve the long-term value of the assets.
HOW MUCH WE SELL
Our net sales to unaffiliated customers over the last two yearswere:
•$874 million in 2010 — up 22 percent from 2009; and
•$714 million in 2009.
Our intersegment sales over the last two years were:
•$603 million in 2010 — up 12 percent from 2009; and
•$537 million in 2009.
Five-Year Summary of Net Sales for Timberlands
NET SALES IN MILLIONS OF DOLLARS
2010 2009 2008 2007 2006
To unaffiliatedcustomers:
Logs:
West $ 414 $ 329 $ 547 $ 565 $ 667
South 145 144 97 56 57
Canada 17 13 20 38 58
Total 576 486 664 659 782
Pay as cuttimber sales
33 31 32 25 32
Timberlandssales andexchanges(1)
109 66 73 128 96
Higher andbetter useland sales(1)
22 11 11 33 35
Minerals, oiland gas
60 62 61 40 48
Products frominternationaloperations(2)
65 44 40 12 6
Other products 9 14 18 25 24
Subtotal sales tounaffiliatedcustomers
874 714 899 922 1,023
Intersegmentsales:
United States 409 392 817 983 1,093
Other 194 145 217 363 593
Subtotalintersegmentsales
603 537 1,034 1,346 1,686
Total $1,477 $1,251 $1,933 $2,268 $2,709
(1) Higher and better use timberland and non-strategic timberlands are conducted throughForest Products subsidiaries.
(2) Includes logs, plywood and hardwood lumber harvested or produced by our internationaloperations, primarily in South America.
Five-Year Trend for Total Net Sales in Timberlands
603
874
537
714
2006 2007 2008 20102009
$1,600
$1,800
$1,200
$1,400
$1,000
$2,000
$800
$400
$200
$600
$ -
1,023
1,686
922
1,346 1,034
899
All Other ProductsSouthern LogsWestern LogsIntersegmentSales
NET SALES IN MILLIONS OF DOLLARS
6

Percentage of 2010 Sales to Unaffiliated Customers
WESTERN LOGS
SOUTHERN LOGS
TIMBERLAND EXCHANGESMINERALS, OIL AND GAS
PRODUCTS FROM INTERNATIONAL OPERATIONS(1)
OTHER PRODUCTS
(1) Includes logs, plywood and hardwood lumber harvested or produced by our international operations, primarily in South America.
17%17%
47%47%
7%7%
10%10%
7%7%
12%12%
Log Sales Volumes
Logs sold to unaffiliated customers in 2010 decreasedapproximately 106 thousand cubic meters — 1 percent — from2009.
•Sales volumes in the West were flat year to year. Ourwestern sales to unaffiliated customers are generally higher-grade logs sold into the export market and domestic-gradelogs sold to West Coast sawmills.
•Sales to unaffiliated customers in the South decreased179 thousand cubic meters — 5 percent — primarily due todeferring more fee harvest in 2010 compared to 2009. Oursouthern sales volumes to unaffiliated customers aregenerally lower-grade fiber logs sold to pulp or containerboardmills. We use most of our high-grade logs in our ownconversion facilities.
•Sales volumes from Canada increased 98 thousand cubicmeters — 24 percent — in 2010. This increase in volumewas primarily due to increased market demand for logsmainly in Alberta.
•Sales volumes from our international operations decreased22 thousand cubic meters — 7 percent — in 2010. Thisreduction in volume was due to consuming more volumeinternally in 2010.
We sell three grades of logs — domestic grade, domestic fiberand export. Factors that may affect log sales in each of thesecategories include:
•domestic grade log sales — lumber usage, primarily forhousing starts and repair and remodel activity, the needs ofour own mills and the availability of logs from both outsidemarkets and our own timberlands;
•domestic fiber log sales — demand for chips by pulp andcontainerboard mills; and
•export log sales — level of housing starts in Japan, wheremost of our North American export logs are sold.
Our sales volumes include logs purchased in the open marketand all our domestic and export logs are sold to unaffiliatedcustomers or transferred at market prices to our internal millsby the sales and marketing staff within our Timberlandsbusiness units.
Five-Year Summary of Log Sales Volumes to UnaffiliatedCustomers for Timberlands
SALES VOLUMES IN THOUSANDS
2010 2009 2008 2007 2006
Logs – cubicmeters:
West 4,476 4,479 6,967 6,212 6,602
South 3,357 3,536 2,347 1,581 1,698
Canada 507 409 529 925 1,425
International 283 305 329 — 55
Total 8,623 8,729 10,172 8,718 9,780
Log Prices
The majority of our log sales to unaffiliated customers involvessales to the export market and to other domestic sawmills inthe Pacific Northwest. Following is a five-year summary ofselected export log prices.
Five-Year Summary of Selected Export Log Prices(#2 Sawlog Bark On — $/MBF)
2009200820072006 2010
COASTAL - DOUGLAS FIR - LONGVIEW
COASTAL - HEMLOCK
833
767731
686 687
442 433389
314
408
SELECTED PRODUCT PRICES
Our log prices are affected by the supply of and demand forgrade and fiber logs and are influenced by the same factorsthat affect log sales. Export log prices are particularly affectedby the Japanese housing market.
Average 2010 log realizations in the West and South increasedfrom 2009 — primarily due to higher domestic log pricescaused by the relative recovery in lumber prices during the year
WEYERHAEUSER COMPANY > 2010 ANNUAL REPORT AND FORM 10-K 7

as compared to 2009. Western export realizations alsoincreased due to the demand of logs in the China market.Export prices driven by the China demand also influenced thehigher Western domestic prices.
Minerals and Energy Products
Mineral revenue decreased in 2010 as recognition of leasingrevenue was completed on some older leases and sales ofproducing oil and gas properties was limited. The decline waspartially offset by increased oil and gas royalties as productionfrom Haynesville Shale gas wells came on line. Overall royaltiesfrom construction aggregates increased slightly. Revenues fromwind power and geothermal agreements remained the samefrom year-to-year, but the company entered into five new windpower agreements.
WHERE WE’RE HEADED
Our competitive strategies include:
•managing forests on a sustainable basis to meet customerand public expectations;
•reducing the time it takes to realize returns by practicingintensive forest management and focusing on the mostadvantageous markets;
•efficiently delivering raw materials to internal supply chains;
•building long-term relationships with external customers whorely on a consistent supply of high-quality raw material;
•continuously reviewing our portfolio of land holdings to createthe greatest value for the company;
•investing in technology and advances in silviculture toimprove yields and timber quality;
•positioning ourselves as one of the largest, lowest-costgrowers of global softwood and hardwood timber;
•leveraging our mineral ownership position; and
•positioning ourselves to take advantage of new marketopportunities that may be created by energy and climatechange legislation and regulation.
In addition, we believe we will generate additional revenuesfrom new products and services, such as wetland mitigationbanking and conservation easements, and from participating inemerging carbon and energy markets.
WOOD PRODUCTS
We are a large manufacturer and distributor of wood products inNorth America and Asia.
WHAT WE DO
Our wood products segment:
•provides a family of high-quality softwood lumber, engineeredlumber, structural panels and other specialty products to theresidential structural frame market;
•delivers innovative homebuilding solutions to help ourcustomers quickly and efficiently meet their customers’needs;
•sells our products and services primarily through our ownsales organizations and distribution facilities andsupplements our product offerings with building materialsthat we purchase from other manufacturers;
•sells certain products into the repair and remodel marketthrough the wood preserving and home-improvementwarehouse channels;
•exports our softwood lumber, engineered building materialsand industrial hardwood products to Europe and Asia; and
•makes and sells hardwood lumber to manufacturers offurniture and cabinetry in more than 35 countries.
Wood Products
PRODUCTS HOW THEY’RE USED
Structural lumber Structural framing for new residential, repair andremodel, treated applications, industrial, andcommercial structures
Engineered lumber
•Solid section
•I-joists
Floor and roof joists, and headers and beams forresidential and commercial structures
Structural panels
•Oriented strand board(OSB)
•Softwood plywood
Structural sheathing, subflooring and stair treadfor residential and commercial structures
Hardwood lumber Furniture, pallets, ties, moldings, panels,cabinets, architectural millwork, components andretail boards
Other products Complementary building products such as cedar,decking, siding, insulation, rebar and engineeredlumber connectors
8

WHERE WE DO IT
We operate manufacturing facilities in the United States andCanada. We distribute through a combination of Weyerhaeuserand third-party locations. Information about the locations,capacities and actual production of our manufacturing facilitiesis included below.
Principal Manufacturing Locations
Locations of our principal manufacturing facilities as ofDecember 31, 2010, by major product group were:
•Structural lumber– U.S. — Alabama, Arkansas, Louisiana, Mississippi,
North Carolina, Oklahoma, Oregon and Washington– Canada — Alberta and British Columbia
•Engineered lumber– U.S. — Alabama, Georgia, Louisiana, Oregon and
West Virginia– Canada — British Columbia and Ontario
•Oriented strand board– U.S. — Louisiana, Michigan, North Carolina and
West Virginia– Canada — Alberta and Saskatchewan
•Softwood plywood and veneer– U.S. — Alabama, Arkansas, Louisiana and Oregon
•Hardwood lumber– U.S. — Michigan, Oregon, Washington and Wisconsin
Summary of 2010 Wood Products Capacities
CAPACITIES IN MILLIONS
PRODUCTIONCAPACITY
NUMBER OFFACILITIES
Structural lumber – board feet 4,530 19
Engineered solid section – cubic feet 37 8
Engineered I-joists – lineal feet 380 3
Oriented strand board – square feet (3/8”) 3,015 6
Softwood Plywood – square feet (3/8”) 460 2
Veneer – square feet (3/8”)(1) 1,145 5
Hardwood lumber – board feet 334 7
Capacities include four engineered solid section facilities, one engineered I-joist facility andtwo veneer mills that are indefinitely closed.(1) Veneer is primarily used internally to produce plywood and engineered lumber products.
In response to market conditions, we sold or closed a numberof facilities and curtailed production at several other mills. Thesales and closures include:
•Sales:– 2010 — one lumber mill; and– 2009 — TJ® Commercial business, Albany Trucking and
one veneer mill.
•Permanent closures:– 2010 — one lumber mill, one engineered lumber mill, one
oriented strand board mill; and– 2009 — four lumber mills, two engineered lumber mills
and six distribution centers.
•Indefinite closures:– 2010 — one engineered lumber mill; and– 2009 — one lumber mill, three engineered lumber mills
and two veneer mills.
In addition to these sales and closures, we discontinued ourcontractual relationship with two southern lumber mills in2010. We no longer produce lumber at Bogalusa, Louisianaand Silver Creek, Mississippi.
Five-Year Summary of Wood Products Production
PRODUCTION IN MILLIONS
2010 2009 2008 2007 2006
Structural lumber –board feet(1)
3,289 3,098 4,451 5,490 6,355
Engineered solidsection – cubic feet(2)
15 11 22 28 41
Engineered I-joists –lineal feet(2)
133 109 218 339 473
Oriented strand board –square feet (3/8”)
1,721 1,448 2,468 3,428 4,166
Softwood plywood –square feet (3/8”)(3)
212 150 333 423 900
Hardwood lumber –board feet
231 201 253 294 324
Composite panels –square feet (3/4”)(1)
— — — — 666
(1) Reflects the divestitures of our North American composite panel operations in July 2006and the Domtar Transaction in March 2007.
(2) Weyerhaeuser engineered I-joist facilities also may produce engineered solid section.(3) All Weyerhaeuser plywood facilities also produce veneer.
HOW MUCH WE SELL
Revenues of our Wood Products business segment come fromsales to wood products dealers, do-it-yourself retailers, buildersand industrial users. We provide products and services to theresidential construction market under the iLevel® brand. In2010, Wood Products net sales were $2.6 billion, an increaseof 16 percent, compared with $2.2 billion in 2009.
WEYERHAEUSER COMPANY > 2010 ANNUAL REPORT AND FORM 10-K 9
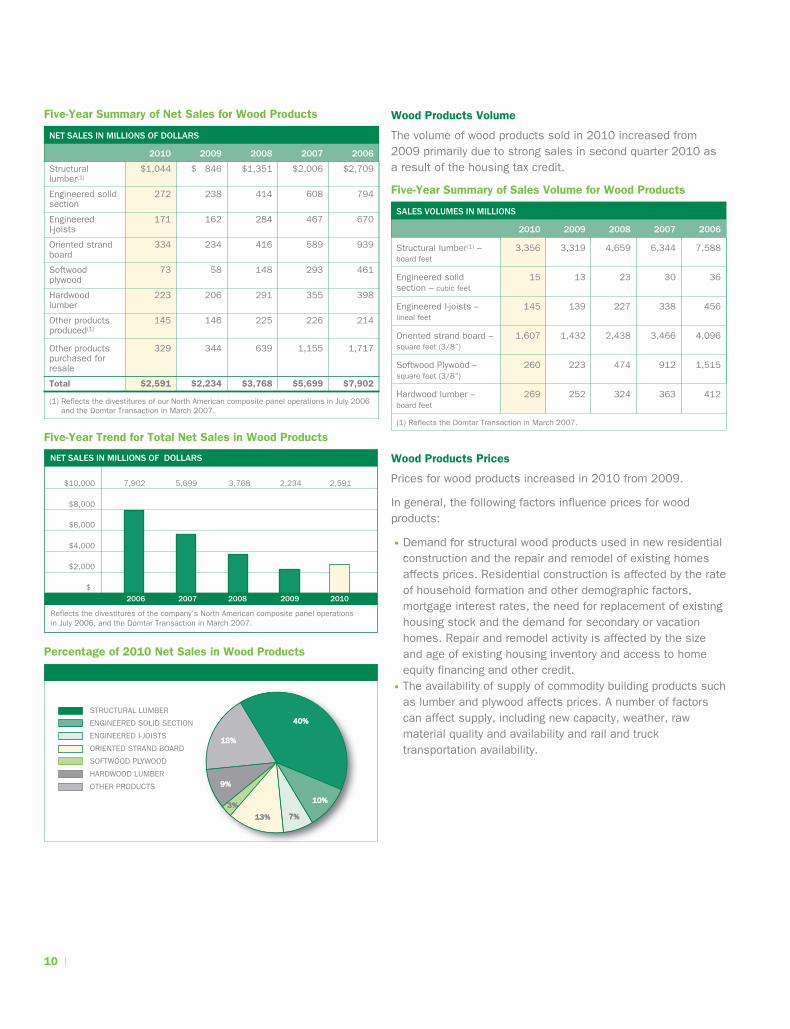
Five-Year Summary of Net Sales for Wood Products
NET SALES IN MILLIONS OF DOLLARS
2010 2009 2008 2007 2006
Structurallumber(1)
$1,044 $ 846 $1,351 $2,006 $2,709
Engineered solidsection
272 238 414 608 794
EngineeredI-joists
171 162 284 467 670
Oriented strandboard
334 234 416 589 939
Softwoodplywood
73 58 148 293 461
Hardwoodlumber
223 206 291 355 398
Other productsproduced(1)
145 146 225 226 214
Other productspurchased forresale
329 344 639 1,155 1,717
Total $2,591 $2,234 $3,768 $5,699 $7,902
(1) Reflects the divestitures of our North American composite panel operations in July 2006and the Domtar Transaction in March 2007.
Five-Year Trend for Total Net Sales in Wood Products
NET SALES IN MILLIONS OF DOLLARS
$10,000
$8,000
$6,000
$4,000
$2,000
$ -
2,234
2009
2,591
2010200820072006
Reflects the divestitures of the company’s North American composite panel operationsin July 2006, and the Domtar Transaction in March 2007.
7,902 5,699 3,768
Percentage of 2010 Net Sales in Wood Products
STRUCTURAL LUMBER
SOFTWOOD PLYWOOD
ORIENTED STRAND BOARD
HARDWOOD LUMBER
ENGINEERED I-JOISTS
ENGINEERED SOLID SECTION
OTHER PRODUCTS
40%40%
10%10%
7%7%13%13%
3%3%
9%9%
18%18%
Wood Products Volume
The volume of wood products sold in 2010 increased from2009 primarily due to strong sales in second quarter 2010 asa result of the housing tax credit.
Five-Year Summary of Sales Volume for Wood Products
SALES VOLUMES IN MILLIONS
2010 2009 2008 2007 2006
Structural lumber(1) –board feet
3,356 3,319 4,659 6,344 7,588
Engineered solidsection – cubic feet
15 13 23 30 36
Engineered I-joists –lineal feet
145 139 227 338 456
Oriented strand board –square feet (3/8”)
1,607 1,432 2,438 3,466 4,096
Softwood Plywood –square feet (3/8”)
260 223 474 912 1,515
Hardwood lumber –board feet
269 252 324 363 412
(1) Reflects the Domtar Transaction in March 2007.
Wood Products Prices
Prices for wood products increased in 2010 from 2009.
In general, the following factors influence prices for woodproducts:
•Demand for structural wood products used in new residentialconstruction and the repair and remodel of existing homesaffects prices. Residential construction is affected by the rateof household formation and other demographic factors,mortgage interest rates, the need for replacement of existinghousing stock and the demand for secondary or vacationhomes. Repair and remodel activity is affected by the sizeand age of existing housing inventory and access to homeequity financing and other credit.
•The availability of supply of commodity building products suchas lumber and plywood affects prices. A number of factorscan affect supply, including new capacity, weather, rawmaterial quality and availability and rail and trucktransportation availability.
10

Demand for home construction fell dramatically from 2006through 2009, with a corresponding drop in demand for theproducts that we produce and sell. This put significant andprolonged downward pressure on product prices. The followinggraphs reflect product price trends for the past five year period.
Five-Year Summary of Selected Published Lumber Prices —$/MBF
2006 2007 2008 2009 2010
SELECTED PUBLISHED PRODUCT PRICES
2x4 DOUGLAS FIR (GREEN)
2x4 SOUTHERN YELLOW PINE (KILN DRIED)
2x4 SPRUCE-PINE-FIR (KILN DRIED)
2x4 DOUGLAS FIR (KILN DRIED)
207
280
153
219
242
301
164
229
351
282284
231
329
279265
220
246
189
297
190
Five-Year Summary of Selected Published Oriented StrandBoard Prices — $/MSF
2010200920082007
OSB (7/16”-24/16”)NORTH CENTRAL PRICE
SELECTED PUBLISHED PRODUCT PRICES
2006
218
162 171 164
220
WHERE WE’RE HEADED
Our competitive strategies include:
•responding to difficult market conditions by actively managingour network of production facilities to balance supply withmarket demand;
•taking advantage of our size, scale, expertise and breadth ofproducts that make us unique in serving the residentialstructural-frame marketplace;
•developing and delivering innovative homebuilding solutions,such as residential structural frame construction, to meetcustomers’ needs;
•continuing to meet the needs of home-improvement repairand remodel customers;
•achieving operating excellence through the delivery chain;
•differentiating our products and services from othermanufacturers to create demand for them in themarketplace, which could generate higher prices;
•meeting international demands for hardwood products byaligning and improving our global supply; and
•conducting our activities in an environmentally sustainablemanner and developing and marketing the environmentalattributes of our products and solutions.
WEYERHAEUSER COMPANY > 2010 ANNUAL REPORT AND FORM 10-K 11

CELLULOSE FIBERS
Our cellulose fibers segment is one of the world’s largestproducers of absorbent fluff used in products such as diapers.We also manufacture liquid packaging board and other pulpproducts. We have a 50 percent interest in North Pacific PaperCorporation (NORPAC) — a joint venture with Nippon PaperIndustries that produces newsprint and high-brightnesspublication papers.
WHAT WE DO
Our cellulose fibers segment:
•provides cellulose fibers for absorbent products in marketsaround the world;
•works closely with our customers to develop unique orspecialized applications;
•manufactures liquid packaging board used primarily for theproduction of containers for liquid products; and
•generates energy, of which 84 percent is from black liquorproduced at the mills and biomass.
Cellulose Fibers Products
PRODUCTS HOW THEY’RE USED
Pulp
•Fluff pulp (Southernsoftwood kraft fiber)
•Papergrade pulp(Southern and Northernsoftwood kraft fiber)
•Specialty chemicalcellulose pulp
•Used in sanitary disposable products thatrequire bulk, softness and absorbency
•Used in products that include printing andwriting papers and tissue
•Used in textiles, absorbent products, specialtypackaging, specialty applications andproprietary high-bulking fibers
Liquid packaging board Converted into containers to hold liquid materialssuch as milk, juice and tea
Other products
•Slush pulp
•Wet lap pulp
Used in the manufacture of paper products
WHERE WE DO IT
Our cellulose fibers (pulp) products are distributed through aglobal direct sales network, and our liquid packaging productsare sold directly to carton and food product packagingconverters in North America and Asia. Locations of our principalmanufacturing facilities by major product group are:
•Pulp– U.S. — Georgia (2), Mississippi and North Carolina– Canada — Alberta
•Liquid packaging board– U.S. — Washington
Summary of 2010 Cellulose Fibers Capacities
CAPACITIES IN THOUSANDS
PRODUCTIONCAPACITY
NUMBER OFFACILITIES
Pulp – air-dry metric tons 1,835 5
Liquid packaging board – tons 300 1
Five-Year Summary of Cellulose Fibers Production
PRODUCTION IN THOUSANDS
2010 2009 2008 2007 2006
Pulp – air-dry metric tons(1) 1,774 1,629 1,760 1,851 2,588
Liquid packagingboard – tons
316 282 297 283 282
(1) Reflects the Domtar Transaction in March 2007.
HOW MUCH WE SELL
Revenues of our Cellulose Fibers segment come from sales tocustomers who use the products for further manufacturing ordistribution and for direct use. Our net sales increased to$1.9 billion in 2010, or 26 percent, compared with $1.5 billionin 2009.
Five-Year Summary of Net Sales for Cellulose Fibers
NET SALES IN MILLIONS OF DOLLARS
2010 2009 2008 2007 2006
Pulp(1) $1,489 $1,148 $1,357 $1,478 $1,657
Liquid packagingboard
337 290 290 247 229
Other products 85 73 118 107 70
Total $1,911 $1,511 $1,765 $1,832 $1,956
(1) Reflects the Domtar Transaction in March 2007.
Five-Year Trend for Total Net Sales in Cellulose Fibers
NET SALES IN MILLIONS OF DOLLARS
2009200820072006
$2,000
$1,500
$1,000
$500
$ -2010
1,9111,511
Reflects Domtar Transaction in March 2007.
1,8321,956 1,765
12

Percentage of 2010 Net Sales in Cellulose Fibers
PULP
LIQUID PACKAGING BOARD
OTHER PRODUCTS
78%78%
18%18%
4%4%
Pulp Volumes
Our sales volumes of cellulose fiber products were 1.7 milliontons in 2010, 2009 and 2008.
Factors that affect sales volumes for cellulose fiber productsinclude:
•growth of the world gross domestic product and
•demand for paper production and diapers.
Five-Year Summary of Sales Volume for Cellulose Fibers
SALES VOLUMES IN THOUSANDS
2010 2009 2008 2007 2006
Pulp – air-dry metric tons(1) 1,714 1,697 1,704 2,070 2,621
Liquid packagingboard – tons
311 288 302 286 275
(1) Reflects the Domtar Transaction in March 2007.
Pulp Prices
Our average pulp prices in 2010 increased compared with2009 due to the:
•relative strength of the U.S. dollar,
•level of demand and
•world economic environment.
Five-Year Summary of Selected Published Pulp Prices —$/TON
2006 2007 2008 2009 2010
NORTHERN BLEACHED KRAFT PULP-AIR DRY METRIC-U.S.
SELECTED PUBLISHED PRODUCT PRICES
721
823857
718
960
WHERE WE’RE HEADED
Our competitive strategies include:
•improving our cost-competitiveness through operationalexcellence and noncapital solutions;
•focusing capital investments on new and improved productcapabilities, cost-reduction, and green energy opportunities;
•collaborating with third parties to develop new value-addedproducts; and
•focusing research and development resources on new waysto expand and improve the range of applications for cellulosefibers and new product opportunities.
WEYERHAEUSER COMPANY > 2010 ANNUAL REPORT AND FORM 10-K 13

REAL ESTATE
Our Real Estate business segment includes our wholly-ownedsubsidiary Weyerhaeuser Real Estate Company (WRECO) andits subsidiaries.
WHAT WE DO
The Real Estate segment focuses on:
•constructing single-family housing and
•developing residential lots for our use and for sale.
Real Estate Products and Activities
PRODUCTS HOW THEY’RE USED
Single-family housing Residential living
Land Residential lots and land forconstruction and sale, master-planned communities with mixed-useproperty
WHERE WE DO IT
Our operations are concentrated in metropolitan areas inArizona, California, Maryland, Nevada, Texas, Virginia andWashington.
HOW MUCH WE SELL
We are one of the top 20 homebuilding companies in theUnited States as measured by annual single-family homeclosings.
Our revenues increased to $923 million in 2010, up 2 percent,compared with $904 million in 2009. This modest increaseoccurred despite slightly fewer home closings and challengingmarket conditions marked by low consumer confidence, highunemployment and continued downward pressure on pricingdue to foreclosures.
The following factors affect revenues in our Real Estatebusiness segment:
•The market prices of the homes that we build varies.
•The product and geographic mix of sales varies based on thefollowing:– the markets where we build, which vary by geography;– we build homes that range in price points to meet our
target customers’ needs, from first-time to semi-customhomes based on geography; and
– the mix of price points, which differ for traditional, single-family detached homes and attached products such astownhomes and condominiums.
•Land and lot sales are a component of our activities. Thesesales do not occur evenly from year to year and may rangefrom approximately 5 percent to 15 percent of total RealEstate revenues annually.
•From time to time, we sell apartment buildings and otherincome producing properties.
Five-Year Summary of Net Sales for Real Estate
REVENUE IN MILLIONS OF DOLLARS
2010 2009 2008 2007 2006
Single-family housing $842 $832 $1,294 $2,079 $2,951
Land 64 68 99 213 310
Other 17 4 15 67 74
Total $923 $904 $1,408 $2,359 $3,335
Five-Year Trend for Total Net Sales in Real Estate
NET SALES IN MILLIONS OF DOLLARS
2009200820072006
$4,000
$3,000
$2,000
$1,000
$ -
904
2010
9233,335 2,359 1,408
Percentage Breakdown of 2010 Net Sales in Real Estate
SINGLE-FAMILY HOMES
91%91%
9%9%
LAND DEVELOPMENTAND OTHER
14

Five-Year Summary of Single-Family Unit Statistics
SINGLE-FAMILY UNIT STATISTICS
2010 2009 2008 2007 2006
Homes sold 1,914 2,269 2,522 4,152 4,541
Homes closed 2,125 2,177 3,188 4,427 5,836
Homes sold butnot closed(backlog)
439 650 558 1,224 1,499
Cancellation rate 20% 23% 32% 26% 29%
Buyer traffic 68,430 65,781 112,817 181,896 231,993
Average price ofhomes closed
$396,000 $382,000 $406,000 $470,000 $506,000
Single-familygross margin –excludingimpairments (%)(1)
23.7% 17.5% 15.1% 21.5% 28.0%
(1) Single-family gross margin equals revenue less cost of sales and period costs (otherthan impairments, deposit write-offs and project abandonments).
WHERE WE’RE HEADED
Our competitive strategies include:
•offering customer-driven, distinct value propositions tospecific market niches in each of our targeted geographies;
•delivering quality homes to satisfied customers — a principlewe measure through “willingness to refer” rates fromindependent surveys of homebuyers;
•replicating best practices developed in each geographicarea; and
•optimizing value from our land portfolio.
WEYERHAEUSER COMPANY > 2010 ANNUAL REPORT AND FORM 10-K 15

CORPORATE AND OTHERWHAT WE DO
Our Corporate and Other segment includes certain gains orcharges that are not related to an individual operating segmentand transportation operations.
WHERE WE DO IT
Our transportation operations include our marine operations,which provide shipping between North America and Asia, and,until we sold them in December 2010, our railroad operations.
As part of our strategic restructuring of our internationalholdings, we:
•sold our Irish composite panels operation —November 2006;
•restructured our investment in our Uruguay joint ventures inpreparation for a partitioning of the assets with the jointventure owners — June 2007;
•sold our investment in our New Zealand joint venture,Nelson Forests — October 2007;
•completed the partitioning of assets related to our Uruguayjoint ventures — April 2008; and
•sold our investment in our Australian operations —July 2008.
HOW MUCH WE SELL
Sales and revenues for our Corporate and Other segment areprimarily related to our marine transportation and discontinuedinternational operations. In 2010, our net sales were$253 million compared with $165 million in 2009. Theincrease in revenues is primarily due to increased revenue inour transportation business during 2010.
Factors that affect revenues in our transportation operationsinclude:
•international trade levels between North America and itstrading partners in Asia,
•the profile of our competition within our shipping lanes and
•overall demand for forest products.
Five-Year Summary of Net Sales for Corporate and Other
NET SALES IN MILLIONS OF DOLLARS
2010 2009 2008 2007 2006
Transportation $253 $165 $259 $223 $198
International woodproducts(1)
— — 133 209 277
Other — — — — 2
Total $253 $165 $392 $432 $477
(1) Reflects the divestitures of our Irish composite panels operation in November 2006 andour Australian Operations in July 2008.
Five-Year Trend for Total Net Sales in Corporate and Other
165
$500
$600
$400
$300
$200
$100
$ -
Reflects the divestitures of our Irish composite panels operations in November 2006 andour Australian operations in July 2008.
NET SALES IN MILLIONS OF DOLLARS
2009
253
2010200820072006
477 432 392
Catchlight Energy
Catchlight Energy is Weyerhaeuser’s joint venture with Chevron,which is focused on the commercialization of liquidtransportation fuels produced from conversion of forest-basedmaterial. During 2010, Catchlight was engaged in research anddevelopment work in the areas of sustainability, feedstocksourcing and scalability, and conversion technologies.Catchlight Energy also spent time developing relationships withselected technology partners. Results of Catchlight Energy arereported in the Corporate and Other segment.
16

NATURAL RESOURCE AND ENVIRONMENTALMATTERS
Many social values are expressed in the laws and regulationsthat pertain to growing and harvesting timber. We participate involuntary certification of our timberlands to assure that wesustain their values including the protection of wildlife andwater quality. We are also subject to laws regulating forestrypractices. Changes in law and regulation can significantly affectlocal or regional timber harvest levels and market values oftimber-based raw materials.
ENDANGERED SPECIES PROTECTIONS
In the United States, a number of fish and wildlife species thatinhabit geographic areas near or within our timberlands havebeen listed as threatened or endangered under the federalEndangered Species Act (ESA) or similar state laws, including:
•the northern spotted owl, the marbled murrelet, a number ofsalmon species, bull trout and steelhead trout in the PacificNorthwest;
•several freshwater mussel and sturgeon species; and
•the red-cockaded woodpecker, gopher tortoise and Americanburying beetle in the South or Southeast.
Additional species or populations may be listed as threatenedor endangered as a result of pending or future citizen petitionsor petitions initiated by federal or state agencies.
Restrictions on our timber harvests result, or could result from:
•federal and state requirements to protect habitat forthreatened and endangered species;
•additional listings of fish and wildlife species as endangered,threatened or sensitive under the ESA or similar state laws;or
•regulatory actions taken in the future by federal or stateagencies to protect habitat for these species.
Such actions also could increase our operating costs and affecttimber supply and prices in general.
In Canada, the federal Species at Risk Act (SARA) requiresprotective measures for species identified as being at risk andfor critical habitat. Environment Canada announced a series ofwestern science studies in 2010 that, with other landscapeinformation, are designed to identify critical habitat. Theidentification and protection of habitat may, over time, result inadditional restrictions on timber harvests and other forestmanagement practices that could increase operating costs foroperators of forestlands in Canada. To date these Canadianmeasures have not had, and in 2011 will not have, a significanteffect on our harvesting operations. We anticipate that future
measures will not disproportionally affect Weyerhaeuser ascompared with comparable operations.
REGULATIONS AFFECTING FORESTRY PRACTICES
In the United States, regulations established by federal, stateand local governments or agencies to protect water quality andwetlands could affect future harvests and forest managementpractices on some of our timberlands. Forest practice acts insome states in the United States that increasingly affectpresent or future harvest and forest management activitiesinclude:
•limits on the size of clearcuts,
•requirements that some timber be left unharvested to protectwater quality and fish and wildlife habitat,
•regulations regarding construction and maintenance of forestroads,
•rules requiring reforestation following timber harvest,
•procedures for state agencies to review and approveproposed forest practice activities and
•various permit programs.
Each state in which we own timberlands has developed bestmanagement practices to reduce the effects of forest practiceson water quality and aquatic habitats. Additional and morestringent regulations may be adopted by various state and localgovernments to achieve water-quality standards under thefederal Clean Water Act, protect fish and wildlife habitats, orachieve other public policy objectives.
In Canada, our forest operations are carried out on publicforestlands under forest licenses. All forest operations aresubject to:
•forest practices and environmental regulations and
•license requirements established by contract between us andthe relevant province designed to:– protect environmental values and– encourage other stewardship values.
On May 18, 2010, 21 member companies of the ForestProducts Association of Canada (FPAC), includingWeyerhaeuser’s Canadian subsidiary, announced the signing ofa Canadian Boreal Forest Agreement (CBFA) with nineenvironmental organizations. The CBFA applies to approximately72 million hectares of public forests licensed to FPAC membersand, when fully implemented, is expected to lead to theconservation of significant areas of Canada’s boreal forest andprotection of woodland caribou. CBFA signators are meetingwith provincial governments, and aboriginal and localcommunities to seek their participation in advancing the goalsof the CBFA. Progress under the CBFA will be measured by anindependent auditor.
WEYERHAEUSER COMPANY > 2010 ANNUAL REPORT AND FORM 10-K 17

FOREST CERTIFICATION STANDARDS
We operate in North America under the Sustainable ForestryInitiative®. This is a certification standard designed tosupplement government regulatory programs with voluntarylandowner initiatives to further protect certain public resourcesand values. The Sustainable Forestry Initiative® is anindependent standard, overseen by a governing boardconsisting of:
•conservation organizations,
•academia,
•the forest industry and
•large and small forest landowners.
Compliance with the Sustainable Forestry Initiative® may resultin some increases in our operating costs and curtailment of ourtimber harvests in some areas.
WHAT THESE REGULATIONS AND CERTIFICATIONPROGRAMS MEAN TO US
The regulatory and nonregulatory forest management programsdescribed above have:
•increased our operating costs;
•resulted in changes in the value of timber and logs from ourtimberlands;
•contributed to increases in the prices paid for wood productsand wood chips during periods of high demand;
•sometimes made it more difficult for us to respond to rapidchanges in markets, extreme weather or other unexpectedcircumstances; and
•potentially encouraged further reductions in the usage of, orsubstitution of other products for, lumber and plywood.
We believe that these kinds of programs have not had, and in2011 will not have, a significant effect on the total harvest oftimber in the United States or Canada. However, these kindsof programs may have such an effect in the future. We expectwe will not be disproportionately affected by these programsas compared with typical owners of comparable timberlands.We also expect that these programs will not significantlydisrupt our planned operations over large areas or forextended periods.
CANADIAN ABORIGINAL RIGHTS
Many of the Canadian forestlands are subject to theconstitutionally protected treaty or common-law rights ofaboriginal peoples of Canada. Most of British Columbia (B.C.)is not covered by treaties, and as a result the claims of B.C.’saboriginal peoples relating to forest resources are largelyunresolved, although many aboriginal groups are engaged intreaty discussions with the governments of B.C. and Canada.
Final or interim resolution of claims brought by aboriginalgroups is expected to result in:
•additional restrictions on the sale or harvest of timber,
•potential increase in operating costs and
•likely effects timber supply and prices in Canada.
We believe that such claims will not have a significant effect onour total harvest of timber or production of forest products in2011, although they may have such an effect in the future. In2008, FPAC, of which we are a member, signed a Memorandumof Understanding with the Assembly of First Nations, underwhich the parties agree to work together to strengthenCanada’s forest sector through economic-developmentinitiatives and business investments, strong environmentalstewardship and the creation of skill-development opportunitiesparticularly targeted to aboriginal youth.
POLLUTION-CONTROL REGULATIONS
Our operations are subject to various laws and regulations,including:
•federal,
•state,
•provincial and
•local pollution controls.
These laws and regulations, as well as market demands,impose controls with regard to:
•air, water and land;
•solid and hazardous waste management;
•disposal and remediation; and
•the chemical content of some of our products.
Compliance with these laws, regulations and demands usuallyinvolves capital expenditures as well as additional operatingcosts. We cannot easily quantify the future amounts of capitalexpenditures we might have to make to comply with these laws,regulations and demands or the effects on our operating costsbecause in some instances compliance standards have notbeen developed or have not become final or definitive. Inaddition, it is difficult to isolate the environmental componentof most manufacturing capital projects.
Our capital projects typically are designed to:
•enhance safety,
•extend the life of a facility,
•increase capacity,
•increase efficiency,
•change raw material requirements,
•increase the economic value of assets or products and
•comply with regulatory standards.
18

We estimate that our capital expenditures made primarily forenvironmental compliance were approximately $3 million in2010 (approximately 1 percent of total capital expenditures).Based on our understanding of current regulatory requirementsin the U.S. and Canada, we expect that capital expenditures forenvironmental compliance will be approximately $4 million in2011 (approximately 2 percent of expected total capitalexpenditures).
ENVIRONMENTAL CLEANUP
We are involved in the environmental investigation orremediation of numerous sites. Of these sites, we may havethe sole obligation to remediate or may share that obligationwith one or more parties. In some instances, several partieshave joint and several obligations to remediate. Some sites areSuperfund sites where we have been named as a potentiallyresponsible party. Our liability with respect to these varioussites ranges from insignificant to substantial. The amount ofliability depends on the quantity, toxicity and nature ofmaterials at the site and depends on the number and economicviability of the other responsible parties.
We spent approximately $6 million in 2010 and expect tospend approximately $5 million in 2011 on environmentalremediation of these sites.
It is our policy to accrue for environmental-remediation costswhen we:
•determine it is probable that such an obligation exists and
•can reasonably estimate the amount of the obligation.
We currently believe it is reasonably possible that our costs toremediate all the identified sites may exceed our currentaccruals of $29 million. The excess amounts required may beinsignificant or could range, in the aggregate, up toapproximately $97 million over several years. This estimate ofthe upper end of the range of reasonably possible additionalcosts is much less certain than the estimates we currently areusing to determine how much to accrue. The estimate of theupper range also uses assumptions less favorable to us amongthe range of reasonably possible outcomes.
REGULATION OF AIR EMISSIONS IN THE U.S.
The United States Environmental Protection Agency (EPA) hadpromulgated regulations for air emissions from:
•pulp and paper manufacturing facilities,
•wood products facilities and
•industrial boilers.
These regulations cover:
•hazardous air pollutants that require use of maximumachievable control technology (MACT) and
•controls for pollutants that contribute to smog, haze andmore recently greenhouse gasses.
The U.S. Court of Appeals for the D.C. Circuit issued decisionsin 2007:
•vacating the MACT standards for air emissions fromindustrial boilers and process heaters and
•remanding the standards for plywood and composite woodproducts to the EPA.
The EPA must promulgate:
•supplemental MACT standards for plywood and compositeproducts and
•new MACT standards for boilers.
Pending final action by the EPA, we expect:
•some states may implement MACT requirements for boilerson a case-by-case basis and
•we might spend as much as $30 million to $100 million overthe next few years to comply with the MACT standards thatare finally determined by the EPA and the states.
We cannot currently quantify the amount of capital we will needin the future to comply with new regulations being developed bythe EPA or Canadian environmental agencies because finalrules have not been promulgated.
To comply with these regulations, we:
•closely monitor legislative, regulatory and scientificdevelopments pertaining to climate change;
•adopted in 2006, as part of the Company’s sustainabilityprogram, a goal of reducing greenhouse gas emissions by40 percent by 2020 compared with our emissions in 2000,assuming a comparable portfolio and regulations;
•determined to achieve this goal by increasing energyefficiency and using more greenhouse gas-neutral, biomassfuels instead of fossil fuels; and
•reduced greenhouse gas emissions by approximately10 percent considering changes in the asset portfolioaccording to 2008 data.
In 2007, the U.S. Supreme Court ruled that greenhouse gasesare pollutants that can be subject to regulation under the CleanAir Act. As a result, the EPA:
•promulgated regulations in 2009 for reporting greenhousegas emissions that are applicable to our manufacturingoperations;
•issued a final rule in 2010 to limit the growth in greenhousegas emissions from new projects meeting certain emissionthresholds starting in 2011 that applies to our manufacturingoperations on a project-by-project basis; and
WEYERHAEUSER COMPANY > 2010 ANNUAL REPORT AND FORM 10-K 19

•announced in 2011 that it intends to:– defer for three years greenhouse gas permitting
requirements for carbon dioxide emissions from biomassand
– seeks further independent scientific analysis and developsa rulemaking on how biomass emissions should betreated.
It is unclear what the effect of EPA’s greenhouse gasregulations will be on our operations until final rules regardingbiomass emissions are promulgated.
Additional factors that could affect greenhouse gas emissionsin the future include:
•policy proposals by state governments regarding regulation ofgreenhouse gas emissions,
•Congressional legislation regulating greenhouse gasemissions within the next several years or
•establishment of a multistate and federal greenhouse gasemissions reduction trading system with potentiallysignificant implications for all U.S. businesses.
It is not yet known when and to what extent these policyactivities may come into force or how they may relate to eachother in the future.
We believe these measures have not had, and in 2011 will nothave, a significant effect on our operations, although they mayhave such an effect in the future. We expect we will not bedisproportionately affected by these measures as comparedwith typical owners of comparable operations. We maintain anactive forestry research program to track and understand anypotential effect from actual climate change related parametersthat could affect the forests we own and manage and do notanticipate any disruptions to our planned operations.
REGULATION OF AIR EMISSIONS IN CANADA
We participate in negotiations between the FPAC and NaturalResources Canada to define industry obligations for complyingwith Canada’s national plan for reducing greenhouse gasemissions over the next several years. FPAC continues to workwith international, national and regional policy makers in theirefforts to develop technically sound and economically viablepolicies, practices and procedures for measuring, reporting andmanaging greenhouse gas emissions.
The Canadian federal government:
•proposed a regulatory framework for air emissions in 2007that adopted some aspects of the Kyoto Protocol;
•called for mandatory reductions in greenhouse gas emissionsfor heavy industrial emissions producers, among othermeasures, to be put in place by 2010;
•currently is redesigning the framework to conform toanticipated international cap and trade programs; and
•reduced the greenhouse gas emission reporting threshold forcarbon dioxide equivalents.
Canadian provincial governments:
•are working on emissions-reduction strategies;
•have adopted rules requiring reporting of greenhouse gasemissions by large emitters;
•have adopted rules requiring reductions by large emitters;
•are developing new provincial requirements for reductions inemissions; and
•are considering, along with the Canadian federal government,implementing new or revised emission standards forparticulate matter, volatile organic compounds, nitrogenoxides and sulfur oxides.
We believe these measures have not had, and in 2011 will nothave, a significant effect on our operations, although they mayhave such an effect in the future. We expect we will not bedisproportionately affected by these measures as comparedwith typical owners of comparable operations. We also expectthat these measures will not significantly disrupt our plannedoperations.
POTENTIAL CHANGES IN POLLUTION REGULATION
State governments continue to promulgate total maximum dailyload (TMDL) requirements for pollutants in water bodies that donot meet state or EPA water quality standards. State TMDLrequirements may set limits on pollutants that may bedischarged to a body of water or set additional requirements,such as best management practices for nonpoint sources,including timberland operations, to reduce the amounts ofpollutants. It is not possible to estimate the capitalexpenditures that may be required for us to meet pollutionallocations across the various proposed state TMDL programsuntil a specific TMDL is promulgated.
Various levels of government in Canada have started work toaddress water usage and quality issues. Regional watershedprotection is increasing and appears to be a part of futurewater strategies across Canada. As part of our membership inthe U.S. Business Roundtable S.E.E. Change (society,environment and economy) initiative, we established a goal inMay 2008 to reduce water use at our cellulose fibers mills20 percent by 2012, using a 2007 baseline. We achieved a12.5 percent water use reduction in 2009 compared to our2007 baseline.
20

FORWARD-LOOKING STATEMENTS
This report contains statements concerning our future resultsand performance that are forward-looking statements accordingto the Private Securities Litigation Reform Act of 1995. Thesestatements:
•use forward-looking terminology,
•are based on various assumptions we make and
•may not be accurate because of risks and uncertaintiessurrounding the assumptions we make.
Factors listed in this section — as well as other factors notincluded — may cause our actual results to differ from ourforward-looking statements. There is no guarantee that any ofthe events anticipated by our forward-looking statements willoccur. If any of the events occur, there is no guarantee whateffect it will have on our operations or financial condition.
We will not update our forward-looking statements after thedate of this report.
FORWARD-LOOKING TERMINOLOGY
Some forward-looking statements discuss our plans, strategiesand intentions. They use words such as expects, may, will,believes, should, approximately, anticipates, estimates andplans. In addition, these words may use the positive or negativeor a variation of those terms.
STATEMENTS
We make forward-looking statements of our expectationsregarding first quarter 2011, including:
•housing market conditions;
•earnings in our businesses;
•market challenges for our Timberlands, Wood Products andReal Estate segments;
•higher selling prices for our western logs and seasonallyhigher harvest volumes in Timberlands;
•improved operating rates, higher selling prices and costreductions in the Wood Products segment;
•favorable market conditions, continued strong pricing andincreased scheduled maintenance in the Cellulose Fiberssegment; and
•fewer home sale closings and lower margins and prices inour single-family homebuilding operations.
In addition, we base our forward-looking statements on theexpected effect of:
•the economy;
•foreign exchange rates, primarily the Canadian dollar and theEuro;
•adverse litigation outcomes and the adequacy of reserves;
•regulations;
•changes in accounting principles;
•contributions to pension plans;
•projected benefit payments;
•projected tax rates;
•loss of tax credits; and
•other related matters.
RISKS, UNCERTAINTIES AND ASSUMPTIONS
Major risks and uncertainties — and assumptions that wemake — that affect our business include, but are not limited to:
•general economic conditions, including employment rates,housing starts, the level of interest rates, availability offinancing for home mortgages, and strength of the U.S.dollar;
•market demand for our products, which is related to thestrength of the various U.S. business segments andeconomic conditions;
•performance of our manufacturing operations, includingmaintenance requirements;
•raw material prices;
•successful execution of our internal performance plans andcost-reduction initiatives;
•energy prices;
•level of competition from domestic and foreign producers;
•the effect of weather;
•transportation costs;
•risk of loss from fires, floods, windstorms, hurricanes, pestinfestations and other natural disasters;
•federal tax policies;
•the effect of forestry, land use, environmental and othergovernmental regulations;
•legal proceedings;
•the effect of retirement eligibility and changes in the marketprice of our common stock on charges for share-basedcompensation;
•changes in accounting principles;
•performance of pension fund investments and relatedderivatives; and
•other factors described under Risk Factors.
EXPORTING ISSUES
We are a large exporter, affected by changes in:
•economic activity in Europe and Asia — especially Japan andChina;
•currency exchange rates — particularly the relative value ofthe U.S. dollar to the Canadian dollar, Euro and Yen; and
•restrictions on international trade or tariffs imposed onimports.
WEYERHAEUSER COMPANY > 2010 ANNUAL REPORT AND FORM 10-K 21

RISK FACTORSWe are subject to certain risks and events that, if one or moreof them occur, could adversely affect our business, ourfinancial condition, our results of operations and the tradingprice of our common stock.
You should consider the following risk factors, in addition to theother information presented in this report and the mattersdescribed in “Forward-Looking Statements,” as well as theother reports and registration statements we file from time totime with the SEC, in evaluating us, our business and aninvestment in our securities.
The risks below are not the only risks we face. Additional risksnot currently known to us or that we currently deem immaterialalso may adversely affect our business.
RISKS RELATED TO OUR INDUSTRIES ANDBUSINESS
MACROECONOMIC CONDITIONS
The industries in which we operate are sensitive tomacroeconomic conditions and consequently highly cyclical.
The overall levels of demand for the products we manufactureand distribute and consequently our sales and profitabilityreflect fluctuations in levels of end-user demand, which dependin part on general macroeconomic conditions in North Americaand worldwide as well as on local economic conditions. Currenteconomic conditions in the United States and the globaleconomic downturn, combined with the decreased availability ofcredit and high foreclosure rates, has resulted in a continuedweakness in the homebuilding industry (including thecompany’s Real Estate business), increased inventories ofavailable new homes, significant declines in home prices, lossof home-equity values and loss of consumer confidence anddemand. Our Wood Products segment is highly dependent onthe strength of the homebuilding industry and the weakness inthat industry has resulted in depressed prices of and demandfor wood products and building materials. This has been furtherreflected in declining prices and demand for logs and reducedharvests in our Timberland segment. The length and magnitudeof industry cycles have varied over time and by product, butgenerally reflect changes in macroeconomic conditions.Consumer demand could continue to decline as a result of thecurrent economic conditions, further adversely affecting ourbusinesses.
COMMODITY PRODUCTS
Many of our products are commodities that are widelyavailable from other producers.
Because commodity products have few distinguishingproperties from producer to producer, competition for theseproducts is based primarily on price, which is determined bysupply relative to demand and competition from substituteproducts. Prices for our products are affected by many factorsoutside of our control, and we have no influence over the timingand extent of price changes, which often are volatile. Ourprofitability with respect to these products depends, in part, onmanaging our costs, particularly raw material and energy costs,which represent significant components of our operating costsand can fluctuate based upon factors beyond our control. Pricesof and demand for many of our products have declinedsignificantly in recent quarters, while many of our raw materialor energy costs have increased. This has adversely affectedboth our sales and profitability.
INDUSTRY SUPPLY OF LOGS, WOOD PRODUCTS ANDPULP
Excess supply of products may adversely affect prices andmargins.
Industry supply of logs, wood products and pulp is subject tochanging macroeconomic and industry conditions that maycause producers to idle or permanently close individualmachines or entire mills or to decrease harvest levels. To avoidsubstantial cash costs in connection with idling or closing amill, some producers choose to continue to operate at a loss,which could prolong weak prices due to oversupply. Oversupplyof products also may result from producers introducing newcapacity or increasing harvest levels in response to favorableshort-term pricing trends. Industry supplies of pulp also areinfluenced by overseas production capacity, which has grown inrecent years and is expected to continue to grow. While theweakness of the U.S. dollar in recent years has improved thecompany’s competitive position and mitigated the levels ofimports, the recent strengthening of the U.S. dollar anddecreases in demand for consumer products in emergingmarkets may result in increased imports of pulp from overseas,resulting in lower prices. Continuation of these factors couldmaterially and adversely affect sales volumes and margins ofour operations.
22

HOMEBUILDING MARKET AND ECONOMIC RISKSContinuing high foreclosure rates, low demand and low levelsof consumer confidence could continue to adversely affect oursales volume, pricing and margins and result in furtherimpairments.
Demand for homes is sensitive to changes in economicconditions such as the level of employment, consumerconfidence, consumer income, the availability of financing andinterest rate levels. During the period of 2007 through 2010,the mortgage industry experienced significant instability andincreasing default rates, particularly with regard to subprimeand other nonconforming loans. This caused many lenders totighten credit requirements and reduce the number of mortgageloans available for financing home purchases. Demand for newhomes also has been adversely affected by factors such ascontinued high unemployment, accelerating foreclosure ratesand distress sales of houses, significant declines in homevalues and a collapse of consumer confidence. Our cancellationrates have fallen, but homebuyers sometimes find it moreadvantageous to forfeit a deposit than to complete thepurchase of the home because of the fear of further pricedeclines.
The company has traditionally carried a larger supply of land fordevelopment than many of our competitors. Some of the landwas purchased during the last few years. Land prices havefallen in these markets and may continue to fall. As newhousing demand in our markets has fallen significantly, wehave elected to sell some of our land and lots at a loss ordeclined to exercise options, even though that required us toforfeit deposits and write off preacquisition costs. We also havechanged our competitive strategies in some markets andelected to discontinue or postpone development in othermarkets in response to the downturn. As a result, we continueto look for opportunities to reposition our portfolio through thesale of our assets.
Our homebuyers’ ability to qualify for and obtain affordablemortgages could be affected by changes in governmentsponsored entities and private mortgage insurance companiessupporting the mortgage market.
The federal government has historically had a significant role insupporting mortgage lending through its sponsorship of FannieMae and Freddie Mac. As a result of turbulence in the creditmarkets and mortgage finance industry in the last few years,the effect of the federal government’s conservatorship of thesegovernment sponsored entities on the short-term and long-termdemand for new housing remains unclear. The liquidity providedto the mortgage industry by Fannie Mae and Freddie Mac, bothof which purchase home mortgages and mortgage-backedsecurities originated by mortgage lenders, is critical to thehousing market. There have been significant concerns about
the future purpose of Fannie Mae and Freddie Mac and anumber of proposals to curtail their activities over time areunder review. Any limitations or restrictions on the availability offinancing by these entities could adversely affect interest rates,mortgage financing, and increase the effective cost of ourhomes, which could reduce demand for our homes andadversely affect our results of operations.
Changes in tax regulations could harm our future sales andearnings.
Significant costs of homeownership include mortgage interestexpense and real estate taxes, both of which are generallydeductible for an individual’s federal and, in some cases, stateincome taxes. Any changes to income tax laws by the federalgovernment or a state government to eliminate or substantiallyreduce these income tax deductions, as has been consideredfrom time to time, would increase the after-tax cost of owning ahome. Increases in real estate taxes by local governmentalauthorities also increase the cost of homeownership. Any suchincreases to the cost of homeownership could adversely affectthe demand for and sales prices of new homes.
CAPITAL MARKETS
Recent deterioration in economic conditions and the creditmarkets could adversely affect our access to capital.
Financial and credit markets have been experiencing a period ofturmoil that has included the failure or sale of various financialinstitutions and an unprecedented level of intervention from theUnited States government. While it is difficult to predict theultimate results of these events, they may impair thecompany’s ability to borrow money. Similarly, our customersmay be unable to borrow money to fund their operations.
Continued deteriorating or volatile market conditions could:
•adversely affect our ability to access credit markets on termsacceptable to us,
•limit our capital expenditures for repair or replacement ofexisting facilities or equipment,
•adversely affect our compliance with covenants underexisting credit agreements,
•result in adverse changes in the credit ratings of our debtsecurities,
•have an adverse effect on our customers and suppliers andtheir ability to purchase our products,
•adversely affect the banks providing financial security for thetransaction structures used to defer taxes related to severalmajor sales of timber,
•adversely affect the performance of our pension plansrequiring additional company contributions and
•reduce our ability to take advantage of growth and expansionopportunities.
WEYERHAEUSER COMPANY > 2010 ANNUAL REPORT AND FORM 10-K 23

CHANGES IN CREDIT RATINGS
Changes in credit ratings issued by nationally recognizedstatistical rating organizations could adversely affect our costof financing and have an adverse effect on the market price ofour securities.
Credit rating agencies rate our debt securities on factors thatinclude our operating results, actions that we take, their view ofthe general outlook for our industry and their view of thegeneral outlook for the economy. Actions taken by the ratingagencies can include maintaining, upgrading or downgrading thecurrent rating or placing the company on a watch list forpossible future downgrading. Downgrading the credit rating ofour debt securities or placing us on a watch list for possiblefuture downgrading could limit our access to the credit markets,increase our cost of financing, and have an adverse effect onthe market price of our securities.
SUBSTITUTION
Some of our products are vulnerable to declines in demanddue to competing technologies or materials.
Our products may compete with nonfiber-based alternatives orwith alternative products in certain market segments. Forexample, plastic, wood/plastic or composite materials may beused by builders as alternatives to the products produced byour Wood Products businesses such as lumber, veneer,plywood and oriented strand board. Changes in prices for oil,chemicals and wood-based fiber can change the competitiveposition of our products relative to available alternatives andcould increase substitution of those products for our products.As the use of these alternatives grows, demand for ourproducts may further decline.
CHANGES IN PRODUCT MIX OR PRICING
Our results of operations and financial condition could bematerially adversely affected by changes in product mix orpricing.
Our results may be affected by a change in our sales mix. Ouroutlook assumes a certain volume and product mix of sales. Ifactual results vary from this projected volume and product mixof sales, our operations and our results could be negativelyaffected. Our outlook also assumes we will be successful inimplementing previously announced price increases as well asfuture price increases. Delays in acceptance of price increasescould negatively affect our results. Moreover, price discounting,if required to maintain our competitive position, could result inlower than anticipated price realizations.
INTENSE COMPETITION
We face intense competition in our markets, and the failure tocompete effectively could have a material adverse effect onour business, financial condition and results of operations.
We compete with North American and, for many of our productlines, global producers, some of which may have greaterfinancial resources and lower production costs than we do. Theprincipal basis for competition is selling price. Our ability tomaintain satisfactory margins depends in large part on ourability to control our costs. Our industries are also particularlysensitive to other factors including innovation, design, qualityand service, with varying emphasis on these factors dependingon the product line. To the extent that one or more of ourcompetitors become more successful with respect to any keycompetitive factor, our ability to attract and retain customerscould be materially adversely affected. If we are unable tocompete effectively, such failure could have a material adverseeffect on our business, financial condition and results ofoperations.
MATERIAL DISRUPTION OF MANUFACTURING
A material disruption at one of our manufacturing facilitiescould prevent us from meeting customer demand, reduce oursales or negatively affect our results of operation and financialcondition.
Any of our manufacturing facilities, or any of our machineswithin an otherwise operational facility, could cease operationsunexpectedly due to a number of events, including:
•unscheduled maintenance outages;
•prolonged power failures;
•an equipment failure;
•a chemical spill or release;
•explosion of a boiler;
•the effect of a drought or reduced rainfall on its water supply;
•labor difficulties;
•disruptions in the transportation infrastructure, includingroads, bridges, railroad tracks and tunnels;
•fires, floods, windstorms, earthquakes, hurricanes or othercatastrophes;
•terrorism or threats of terrorism;
•governmental regulations; and
•other operational problems.
Any such downtime or facility damage could prevent us frommeeting customer demand for our products and/or require usto make unplanned capital expenditures. If one of thesemachines or facilities were to incur significant downtime, ourability to meet our production targets and satisfy customerrequirements could be impaired, resulting in lower sales andincome.
24

CAPITAL REQUIREMENTS
Our operations require substantial capital.
The company has substantial capital requirements forexpansion and repair or replacement of existing facilities orequipment. Although we maintain our production equipmentwith regular scheduled maintenance, key pieces of equipmentmay need to be repaired or replaced periodically. The costs ofrepairing or replacing such equipment and the associateddowntime of the affected production line could have a materialadverse effect on our financial condition, results of operationsand cash flows.
We believe our capital resources will be adequate to meet ourcurrent projected operating needs, capital expenditures andother cash requirements. If for any reason we are unable toprovide for our operating needs, capital expenditures and othercash requirements on economic terms, we could experience amaterial adverse effect on our business, financial condition,results of operations and cash flows.
LAWS AND REGULATIONS
We could incur substantial costs as a result of compliancewith, violations of or liabilities under applicable environmentallaws and other laws and regulations.
We are subject to a wide range of general and industry-specificlaws and regulations relating to the protection of theenvironment, including those governing:
•air emissions;
•wastewater discharges;
•harvesting;
•silvicultural activities;
•the storage, management and disposal of hazardoussubstances and wastes;
•the cleanup of contaminated sites;
•landfill operation and closure obligations;
•forestry operations and endangered species habitat; and
•health and safety matters.
In particular, the pulp and paper industry in the United States issubject to Cluster Rules and Boiler Maximum AchievableControl Technology Rules that further regulate effluent and airemissions. These laws and regulations will require us to obtainauthorizations from and comply with the authorizationrequirements of the appropriate governmental authorities,which have considerable discretion over the terms and timing ofpermits.
We have incurred, and we expect to continue to incur,significant capital, operating and other expenditures complyingwith applicable environmental laws and regulations and as aresult of remedial obligations. We also could incur substantialcosts, such as civil or criminal fines, sanctions and
enforcement actions (including orders limiting our operations orrequiring corrective measures, installation of pollution controlequipment or other remedial actions), cleanup and closurecosts, and third-party claims for property damage and personalinjury as a result of violations of, or liabilities under,environmental laws and regulations.
As the owner and operator of real estate, including in ourhomebuilding business, we may be liable under environmentallaws for cleanup, closure and other damages resulting from thepresence and release of hazardous substances on or from ourproperties or operations. The amount and timing ofenvironmental expenditures is difficult to predict, and in somecases, our liability may exceed forecasted amounts or the valueof the property itself. The discovery of additional contaminationor the imposition of additional cleanup obligations at our sitesor third-party sites may result in significant additional costs.Any material liability we incur could adversely affect ourfinancial condition or preclude us from making capitalexpenditures that otherwise would benefit our business.
We also anticipate public policy developments at the state,federal and international level regarding climate change andenergy access, security and competitiveness. We expect thesedevelopments to address emission of carbon dioxide,renewable energy and fuel standards, and the monetization ofcarbon. Compliance with regulations that implement new publicpolicy in these areas might require significant expenditures.Enactment of new environmental laws or regulations or changesin existing laws or regulations, or the interpretation of theselaws or regulations, might require significant expenditures. Wealso anticipate public policy developments at the state, federaland international level regarding taxes, health care and anumber of other areas that could require significantexpenditures.
CURRENCY EXCHANGE RATES
We will be affected by changes in currency exchange rates.
We have manufacturing operations in Canada, Uruguay andBrazil. We are also a large exporter and compete withproducers of products very similar to ours. Therefore, we areaffected by changes in the strength of the U.S. dollar relative tothe Canadian dollar, Euro and Yen.
AVAILABILITY OF RAW MATERIALS AND ENERGY
Our business and operations could be materially adverselyaffected by changes in the cost or availability of raw materialsand energy.
We rely heavily on certain raw materials (principally wood fiberand chemicals) and energy sources (principally natural gas,electricity, coal and fuel oil) in our manufacturing processes.Our ability to increase earnings has been, and will continue to
WEYERHAEUSER COMPANY > 2010 ANNUAL REPORT AND FORM 10-K 25

be, affected by changes in the costs and availability of such rawmaterials and energy sources. We may not be able to fullyoffset the effects of higher raw material or energy costs throughhedging arrangements, price increases, productivityimprovements or cost-reduction programs.
TRANSPORTATION
We depend on third parties for transportation services andincreases in costs and the availability of transportation couldmaterially adversely affect our business and operations.
Our business depends on the transportation of a large numberof products, both domestically and internationally. We relyprimarily on third parties for transportation of the products wemanufacture and/or distribute as well as delivery of our rawmaterials. In particular, a significant portion of the goods wemanufacture and raw materials we use are transported byrailroad or trucks, which are highly regulated.
If any of our third-party transportation providers were to fail todeliver the goods we manufacture or distribute in a timelymanner, we may be unable to sell those products at fullvalue — or at all. Similarly, if any of these providers were to failto deliver raw materials to us in a timely manner, we may beunable to manufacture our products in response to customerdemand. In addition, if any of these third parties were to ceaseoperations or cease doing business with us, we may be unableto replace them at reasonable cost.
Any failure of a third-party transportation provider to deliver rawmaterials or finished products in a timely manner could harmour reputation, negatively affect our customer relationships andhave a material adverse effect on our financial condition andresults of operation.
In addition, an increase in transportation rates or fuelsurcharges could materially adversely affect our sales andprofitability.
REIT STATUS
If we fail to qualify or remain qualified as a REIT, we would besubject to tax at corporate rates and would not be able todeduct dividends to shareholders when computing our taxableincome because our timber-related income will be subject totaxation.
In any taxable year we fail to qualify as a REIT, unless we areentitled to relief under the Internal Revenue Code:
•We would be subject to federal and state income tax on ourtaxable income at regular corporate rates.
•We would not be allowed to deduct dividends to shareholdersin computing our taxable income.
•We also would be disqualified from treatment as a REIT forthe four taxable years following the year during which we lostqualification.
If we fail to qualify as a REIT, we might need to borrow funds orliquidate some investments in order to pay the additional taxliability. Accordingly, funds available for investment or dividendsto our shareholders would be reduced.
Qualification as a REIT involves the application of highlytechnical and complex provisions of the Internal Revenue Codeto our operations and the determination of various factualmatters and circumstances not entirely within our control. Thereare only limited judicial or administrative interpretations ofthese provisions. Although we operate in a manner consistentwith the REIT qualification rules, we cannot assure you that weare or will remain so qualified.
In addition, federal and state tax laws are constantly underreview by persons involved in the legislative process, theInternal Revenue Service, the United States Department of theTreasury, and state taxing authorities. Changes to the tax lawcould adversely affect our shareholders. We cannot predict withcertainty whether, when, in what forms, or with what effectivedates, the tax laws applicable to us or our shareholders may bechanged.
Certain of our business activities are potentially subject toprohibited transactions tax or corporate-level income tax.
Under the Internal Revenue Code, REITs generally must engagein the ownership and management of income producing realestate. For the Company, this generally includes owning andmanaging a timberland portfolio for the production and sale ofstanding timber. Accordingly, the manufacture and sale by us ofwood products, the harvesting and sale of logs, and thedevelopment or sale of certain timberlands, the manufactureand sale of pulp products, the development of real estate, thebuilding and sale of single-family houses and the developmentand sale of land and lots for real estate development areconducted through one or more of our wholly-owned taxableREIT subsidiaries (“TRSs”) because such activities couldgenerate non-qualifying REIT income and could constitute“prohibited transactions.” Prohibited transactions are definedby the Internal Revenue Code generally to be sales or otherdispositions of property to customers in the ordinary course ofa trade or business. By conducting our business in this mannerwe believe that we satisfy the REIT requirements of the InternalRevenue Code and are not subject to the 100 percent tax thatcould be imposed if a REIT were to conduct a prohibitedtransaction. We may not always be successful, however, inlimiting such activities to our TRSs. Therefore, we could besubject to the 100 percent prohibited transactions tax if suchinstances were to occur. The net income of our TRSs is subjectto corporate-level income tax.
26

The extent of our use of our TRS may affect the price of ourcommon shares relative to the share price of other REITs.
We conduct a significant portion of our business activitiesthrough one or more TRSs. Our use of our TRSs enables us toengage in non-REIT qualifying business activities such as thesale of logs, production and sale of wood products and pulpproducts, real estate development and single-family homesales, and sale of HBU property. Our TRSs are subject tocorporate-level tax. Therefore, we pay income taxes on theincome generated by our TRSs. Under the Code, no more than25 percent of the value of the gross assets of a REIT may berepresented by securities of one or more TRS. This limitationmay affect our ability to increase the size of our TRSs’operations. Furthermore, our use of TRSs may cause themarket to value our common shares differently than the sharesof other REITs, which may not use TRSs as extensively as weuse them.
We may be limited in our ability to fund distributions using cashgenerated through our taxable REIT subsidiaries.
The ability of the REIT to receive dividends from our TRS islimited by the rules with which we must comply to maintain ourstatus as a REIT. In particular, at least 75 percent of grossincome for each taxable year as a REIT must be derived frompassive real estate sources including sales of our standingtimber and other types of qualifying real estate income and nomore than 25 percent of our gross income may consist ofdividends from our TRS and other non-real estate income.
This limitation on our ability to receive dividends from our TRSsmay affect our ability to fund cash distributions to ourshareholders using cash flows from our TRSs. We can,however, under current law, issue stock dividends for up to 90percent of our regular dividend distribution for calendar yearsthrough 2011. The net income of our TRSs is not required to bedistributed, and income that is not distributed will not besubject to the REIT income distribution requirement.
Our cash dividends are not guaranteed and may fluctuate.
Generally, REITs are required to distribute 90 percent of theirordinary taxable income and 95 percent of their net capitalgains income. Capital gains may be retained by the REIT, butwould be subject to income taxes. If capital gains are retainedrather than distributed, our shareholders would be notified andthey would be deemed to have received a taxable distribution,with a refundable credit for any federal income tax paid by theREIT. Accordingly, we believe that we are not required todistribute material amounts of cash since substantially all ofour taxable income is treated as capital gains income. OurBoard of Directors, in its sole discretion, determines theamount of quarterly dividends to be provided to ourshareholders based on consideration of a number of factors.
These factors include, but are not limited to, our results ofoperations, cash flow and capital requirements, economicconditions, tax considerations, borrowing capacity and otherfactors, including debt covenant restrictions that may imposelimitations on cash payments, future acquisitions anddivestitures, harvest levels, changes in the price and demandfor our products and general market demand for timberlandsincluding those timberland properties that have higher andbetter uses. Consequently, our dividend levels may fluctuate.
We may not be able to complete desired like-kind exchangetransactions for timberlands and real estate we sell.
When we sell timberlands and real estate, we generally seek tomatch these sales with the acquisition of suitable replacementtimberlands. This allows us “like-kind exchange” treatment forthese transactions under section 1031 and related regulationsof the Code. This matching of sales and purchases provides uswith significant tax benefits, most importantly the deferral ofany gain on the property sold until ultimate disposition of thereplacement property. While we attempt to complete like-kindexchanges wherever practical, we may not be able to do so inall instances due to various factors, including the lack ofavailability of suitable replacement property on acceptableterms and our inability to complete a qualifying like-kindexchange transaction within the time frames required by theCode. The inability to obtain like-kind exchange treatment wouldresult in the payment of taxes with respect to the property sold,and a corresponding reduction in earnings and cash availablefor distribution to shareholders as dividends.
LEGAL PROCEEDINGS
We are a party to a number of legal proceedings, and adversejudgments in certain legal proceedings could have a materialadverse effect on our financial condition.
The costs and other effects of pending litigation against us andrelated insurance recoveries cannot be determined withcertainty. Although the disclosure in Note 16: LegalProceedings, Commitments and Contingencies of Notes toConsolidated Financial Statements contains management’scurrent views of the effect such litigation will have on ourfinancial results, there can be no assurance that the outcomeof such proceedings will be as expected.
For example, there have been several lawsuits filed against usalleging that we violated U.S. antitrust laws. Those includedlawsuits alleging antitrust violations against us and othermanufacturers of oriented strand board and lawsuits allegingantitrust violations with respect to alder logs and lumber. All ofthese matters have been settled.
It is possible that there could be adverse judgments against us insome or all major litigation against us and that we could be
WEYERHAEUSER COMPANY > 2010 ANNUAL REPORT AND FORM 10-K 27

required to take a charge for all or a portion of any damage award.Any such charge could materially and adversely affect our resultsof operations for the quarter or year in which we record it.
EXPORT TAXES
We may be required to pay significant export taxes orcountervailing and anti-dumping duties for exported products.
We may experience reduced revenues and margins on some ofour businesses as a result of export taxes or countervailing andanti-dumping duty applications. For example, in 2001, a groupof companies filed petitions with the U.S. Department ofCommerce and the International Trade Commission claimingthat production of softwood lumber in Canada was beingsubsidized by Canada and that imports into the U.S. fromCanada were being sold in U.S. markets at less than their fairvalue. We have softwood lumber facilities in Canada that exportlumber into the U.S. We paid a total of $370 million in depositsfor countervailing duty and anti-dumping tariffs from 2002through 2006 related to those lumber exports. The U.S. andCanadian governments reached a settlement of the dispute in2006. As a result of the settlement, we received a refund of$344 million fourth quarter 2006. However, our Canadiansoftwood lumber facilities will have to pay an export tax whenthe price of lumber is at or below a threshold price. The exporttax could be as high as 22.5 percent if a province exceeds itstotal allotted export share. Similar types of actions have beeninitiated from time to time against us and other U.S. producersof products such as paper or lumber by countries such asChina and Korea. It is possible that countervailing duty andantidumping tariffs, or similar types of tariffs could be imposedon us in the future. We may experience reduced revenues andmargins in any business that is subject to such tariffs or to theterms of the settlements of such international disputes. Thesetariffs or settlement terms could have a material adverse effecton our business, financial results and financial condition,including facility closures or impairments of assets.
NATURAL DISASTERS
Our business and operations could be adversely affected byweather, fire, infestation or natural disasters.
Our timberlands assets may be damaged by adverse weather,severe wind and rainstorms, fires, pest infestation or othernatural disasters. Because our manufacturing processesprimarily use wood fiber, in many cases from our owntimberlands, in the event of material damage to ourtimberlands, our operations could be disrupted or ourproduction costs could be increased.
RISKS RELATED TO OWNERSHIP OF OURCOMMON STOCK
STOCK-PRICE VOLATILITY
The price of our common stock may be volatile.
The market price of our common stock may be influenced bymany factors, some of which are beyond our control, includingthose described above under “Risks Related to our Industriesand Business” and the following:
•actual or anticipated fluctuations in our operating results orour competitors’ operating results;
•announcements by us or our competitors of new products,capacity changes, significant contracts, acquisitions orstrategic investments;
•our growth rate and our competitors’ growth rates;
•the financial market and general economic conditions;
•changes in stock market analyst recommendations regardingus, our competitors or the forest products industry generally,or lack of analyst coverage of our common stock;
•sales of our common stock by our executive officers,directors and significant stockholders or sales of substantialamounts of common stock; and
•changes in accounting principles.
In addition, there has been significant volatility in the marketprice and trading volume of securities of companies operatingin the forest products industry that often has been unrelated tothe operating performance of particular companies.
Some companies that have had volatile market prices for theirsecurities have had securities litigation brought against them. Iflitigation of this type is brought against us, it could result insubstantial costs and would divert management’s attention andresources.
UNRESOLVED STAFF COMMENTSThere are no unresolved comments that were received from theSEC staff relating to our periodic or current reports under theSecurities Exchange Act of 1934.
28

PROPERTIESDetails about our facilities, production capacities and locationsare found in the Our Business — What We Do section of thisreport.
•For details about our Timberlands properties, go to OurBusiness/What We Do/Timberlands/Where We Do It.
•For details about our Wood Products properties, go to OurBusiness/What We Do/Wood Products/Where We Do It.
•For details about our Cellulose Fibers properties, go to OurBusiness/What We Do/Cellulose Fibers/Where We Do It.
•For details about our Real Estate properties, go to OurBusiness/What We Do/Real Estate/Where We Do It.
Production capacities listed represent annual productionvolume under normal operating conditions and producing anormal product mix for each individual facility. Productioncapacities do not include any capacity for facilities that weresold or permanently closed as of the end of 2010.
LEGAL PROCEEDINGSSee Note 16: Legal Proceedings, Commitments andContingencies in the Notes to Consolidated FinancialStatements for a summary of legal proceedings.
WEYERHAEUSER COMPANY > 2010 ANNUAL REPORT AND FORM 10-K 29

MARKET FOR REGISTRANT’S COMMON EQUITY, RELATEDSTOCKHOLDER MATTERS AND ISSUER PURCHASES OF EQUITYSECURITIESOur common stock trades on the following exchanges under thesymbol WY:
•New York Stock Exchange and
•Chicago Stock Exchange
As of December 31, 2010, there were approximately 10,050holders of record of our common shares. Dividend-per-sharedata and the range of closing market prices for our commonstock for each of the four quarters in 2010 and 2009 areincluded in Note 23: Selected Quarterly Financial Information(unaudited) in the Notes to Consolidated Financial Statements.
INFORMATION ABOUT SECURITIES AUTHORIZED FOR ISSUANCE UNDER OUR EQUITY COMPENSATION PLAN
NUMBER OFSECURITIES TO BE
ISSUED UPONEXERCISE OF
OUTSTANDINGOPTIONS,
WARRANTS ANDRIGHTS (A)
WEIGHTEDAVERAGE EXERCISE
PRICE OFOUTSTANDING
OPTIONS,WARRANTS AND
RIGHTS (B)
NUMBER OFSECURITIES
REMAINING AVAILABLEFOR FUTURE ISSUANCE
UNDER EQUITYCOMPENSATION PLANS
(EXCLUDINGSECURITIES REFLECTED
IN COLUMN (A)) (C)
Equity compensation plans approved by security holders(1) 37,331,097 $22.19 10,371,757
Equity compensation plans not approved by security holders N/A N/A N/A
Total 37,331,097 $22.19 10,371,757
(1) Includes 1,963,106 restricted stock units. Because there is no exercise price associated with restricted stock units, such stock units are not included in the weighted average pricecalculation.
INFORMATION ABOUT COMMON STOCKREPURCHASES
We did not repurchase any common shares in 2010. InDecember 2008, we announced a stock-repurchase programunder which we are authorized to repurchase up to
$250 million of outstanding shares. We repurchased a total of66,691 shares of common stock for approximately $2 millionunder the program during 2009. All common stock purchasesunder the program were made in open-market transactions.
30

COMPARISON OF FIVE-YEAR CUMULATIVE TOTAL SHAREHOLDER RETURN
Weyerhaeuser Company, S&P 500, S&P Global Timber & Forestry Index and Prior Performance Peer Group
WEYERHAEUSER
S&P 500
PRIOR PERFORMANCE PEERS
S&P GLOBAL TIMBER & FORESTRY INDEX
2008200720062005 20102009
$ -
$25
$50
$75
$100
$125
$150
PERFORMANCE GRAPH ASSUMPTIONS
•Assumes $100 invested on December 31, 2005 inWeyerhaeuser common stock, the S&P 500 Index, the S&PGlobal Timber & Forestry Index and Weyerhaeuser’s priorperformance peer group described below.
•Total return assumes dividends are reinvested quarterly.
•Measurement dates are the last trading day of the calendaryear shown.
Given our changes in our asset portfolio, decreased size andconversion to a Real Estate Investment Trust in 2010, webelieve our prior performance peers no longer best reflect ourindustry and line-of business. Therefore, we selected the S&P
Global Timber & Forestry Index as our peer index going forward.The S&P Global Timber & Forestry Index is comprised of 25 ofthe largest publicly traded companies engaged in theownership, management or the upstream supply chain offorests and timberlands.
Our prior performance peer group reflected in this analysisincludes: Air Products & Chemicals, Alcoa, Ball, Celanese,Domtar, Dow Chemical, Du Pont, Eastman Chemical,Huntsman, International Paper, Louisiana-Pacific,MeadWestvaco, Monsanto, Nucor, Owens-Illinois, PPGIndustries, Praxair, Rohm and Haas, Smurfit Stone Container,and United States Steel.
WEYERHAEUSER COMPANY > 2010 ANNUAL REPORT AND FORM 10-K 31

SELECTED FINANCIAL DATADOLLAR AMOUNTS IN MILLIONS, EXCEPT PER-SHARE FIGURES
PER SHARE
2010 2009 2008 2007 2006Basic earnings (loss) from continuing operations attributable toWeyerhaeuser common shareholders $ 4.00 (2.58) (8.72) (1.13) 3.48Basic earnings (loss) from discontinued operations attributable toWeyerhaeuser common shareholders(1) — — 3.15 4.73 (1.63)Basic net earnings (loss) attributable to Weyerhaeuser commonshareholders $ 4.00 (2.58) (5.57) 3.60 1.85Diluted earnings (loss) from continuing operations attributable toWeyerhaeuser common shareholders $ 3.99 (2.58) (8.72) (1.13) 3.47Diluted earnings (loss) from discontinued operations attributable toWeyerhaeuser common shareholders(1) — — 3.15 4.73 (1.63)Diluted net earnings (loss) attributable to Weyerhaeuser commonshareholders $ 3.99 (2.58) (5.57) 3.60 1.84Dividends paid $ 26.61 0.60 2.40 2.40 2.20Weyerhaeuser shareholders’ interest (end of year) $ 8.60 19.13 22.78 37.80 38.17
FINANCIAL POSITION
2010 2009 2008 2007 2006Total assets:
Forest Products $ 11,476 13,248 14,080 20,026 23,238Real Estate 1,953 2,002 2,615 3,736 3,570
Total $ 13,429 15,250 16,695 23,762 26,808Total Long-term debt:
Forest Products:Long-term debt $ 4,710 5,284 5,560 6,566 7,557
Capital lease obligations — — — 2 44Total $ 4,710 5,284 5,560 6,568 7,601Real Estate:
Long-term debt $ 350 402 456 775 606Weyerhaeuser shareholders’ interest $ 4,612 4,044 4,814 7,981 9,085Percent earned on average Weyerhaeuser shareholders’ interest 29.6% (12.3)% (18.4)% 9.3% 4.8%
OPERATING RESULTS
2010 2009 2008 2007 2006
Net sales and revenues $ 6,552 5,528 8,100 10,933 13,599
Earnings (loss) from continuing operations $ 1,283 (568) (1,909) (299) 839Discontinued operations, net of income taxes(1) — — 667 1,038 (399)
Net earnings (loss) 1,283 (568) (1,242) 739 440Less: Net loss (earnings) attributable to noncontrolling interest (2) 23 66 51 13
Net earnings (loss) attributable to Weyerhaeuser common shareholders $ 1,281 (545) (1,176) 790 453
CASH FLOWS
2010 2009 2008 2007 2006Net cash from operations $ 744 (162) (1,299) 635 1,624Cash from investing activities $ 143 263 5,459 816 (914)Cash from financing activities $ (1,289) (526) (1,980) (1,580) (1,571)
Net change in cash and cash equivalents $ (402) (425) 2,180 (129) (861)
STATISTICS (UNAUDITED)
2010 2009 2008 2007 2006Number of employees 14,250 14,888 19,843 37,857 46,737Number of shareholder accounts at year-end:
Common 10,050 10,577 11,088 10,489 11,471Exchangeable — — — 1,037 1,169
Number of shares outstanding at year-end (thousands):Common 535,976 211,359 211,289 209,546 236,020Exchangeable — — — 1,600 1,988
Weighted average shares outstanding – basic (thousands) 319,976 211,342 211,258 219,305 244,931
(1) A summary of our discontinued operations is presented in Note 4: Discontinued Operations in the Notes to Consolidated Financial Statements.To implement our decision to be taxed as a REIT, we distributed our accumulated earnings and profits, determined under federal income tax provisions, to our shareholders as a “SpecialDividend.” The Special Dividend of $5.6 billion was paid September 1, 2010, and included the regular quarterly dividend of approximately $11 million. More information about our REIT conversionis in Note 2: Real Estate Investment Trust (REIT) Conversion in the Notes to Consolidated Financial Statements, as well as in the Management’s Discussion and Analysis of Financial Conditionand Results of Operations.At the election of each shareholder, the Special Dividend was paid in cash or Weyerhaeuser common shares. The aggregate amount of cash distributed was $560 million and the number ofcommon shares issued was approximately 324 million. The stock portion of the Special Dividend is treated as the issuance of new shares for accounting purposes and affects our earnings (loss)per share only for periods after the distribution. Prior periods are not restated. The required treatment results in earnings (loss) per share that is less than would have been the case had thecommon shares not been issued. See Note 5: Net Earnings (Loss) Per Share in the Notes to Consolidated Financial Statements for pro forma results giving effect to the common stockdistribution for diluted earnings per common share as if the common stock distribution had occurred at the beginning of each period.
32

MANAGEMENT’S DISCUSSIONAND ANALYSIS OF FINANCIALCONDITION AND RESULTS OFOPERATIONS (MD&A)
WHAT YOU WILL FIND IN THIS MD&A
Our MD&A includes the following major sections:
•real estate investment trust (REIT) conversion;
•economic and market conditions affecting our operations;
•financial performance summary;
•results of our operations — consolidated and by segment;
•liquidity and capital resources — where we discuss ourcash flows;
•off-balance sheet arrangements;
•environmental matters, legal proceedings and othercontingencies; and
•accounting matters — where we discuss critical accountingpolicies and areas requiring judgments and estimates.
REAL ESTATE INVESTMENT TRUST (REIT)CONVERSION
Our board of directors has determined that conversion to a REITbest supports our strategic direction. For tax purposes, thischange was effective January 1, 2010.
We expect to derive most of our REIT income from investments intimberlands, including the sale of standing timber throughpay-as-cut sale contracts. REIT income can be distributed toshareholders without first paying corporate level tax, substantiallyeliminating the double taxation on income. A significant portion ofour timberland segment earnings will receive this favorable taxtreatment. We will, however, be subject to corporate taxes onbuilt-in-gains (the excess of fair market value over tax basis atJanuary 1, 2010) on sales of real property (other than standingtimber) held by the REIT during the first 10 years following theREIT conversion. We also will continue to be required to payfederal corporate income taxes on earnings of our TRS, whichprincipally includes our manufacturing businesses, our real estatedevelopment business and our non-qualified timberland segmentincome. Following are points related to our conversion:
•We received shareholder approval on April 15, 2010 to issuea significant number of shares to enable the payout ofearnings and profits to shareholders. On July 13, 2010, wefiled a prospectus supplement with the SEC covering theissuance of the additional shares of stock. See Notes toConsolidated Financial Statements — Note 2: Real EstateInvestment Trust (REIT) Conversion for more information.
•To implement our decision to be taxed as a REIT, wedistributed to our shareholders our accumulated earningsand profits, determined under federal income tax provisions,as a “Special Dividend.” The Special Dividend of $5.6 billionwas paid September 1, 2010, and included the regularquarterly dividend of approximately $11 million. At theelection of each shareholder, the Special Dividend was paidin cash or Weyerhaeuser common shares. The aggregateamount of cash distributed was $560 million and the numberof common shares issued was approximately 324 million.
•The stock portion of the Special Dividend is treated as theissuance of new shares for accounting purposes and affectsour earnings (loss) per share only for periods after thedistribution. Prior periods are not restated. The requiredtreatment results in earnings (loss) per share that is lessthan would have been the case had the common shares notbeen issued.
•We reversed certain deferred income tax liabilities, whichresulted in a benefit in the Consolidated Statement ofOperations during 2010 of approximately $1,064 million. Our2010 effective income tax rate also decreased due to lowertaxes on REIT qualifying timberlands income.
ECONOMIC AND MARKET CONDITIONSAFFECTING OUR OPERATIONS
The U.S. economy has gradually begun its recovery from themost severe recession since the 1930’s. However, the housingmarket continues to lag other sectors in the recovery andremains burdened by excess inventory and a diminished pool ofqualified homebuyers. The health of the U.S. housing marketstrongly affects our Real Estate, Wood Products andTimberlands segments. Real Estate focuses on building singlefamily homes. Wood Products primarily sells into the newresidential building and repair and remodel markets. Demand forlogs from our Timberlands segment is affected by the productionof wood-based building products. Cellulose Fibers is primarilyaffected by global demand and the value of the U.S. dollar.
HOUSING MARKET
We track certain indicators such as employment, consumerconfidence, housing starts, home sales, foreclosures, homeprices, mortgage interest rates and the number of homes forsale to assess housing market conditions.
Throughout 2010 the unemployment rate has remained wellabove 9 percent but as of December had fallen to 9.4 percent,the lowest level for the year. Weak employment growthcontributed to weak consumer confidence, limiting any growthin demand for housing and wood products. Total U.S. housingstarts for 2010 were 586 thousand units with single family
WEYERHAEUSER COMPANY > 2010 ANNUAL REPORT AND FORM 10-K 33

units accounting for 472 thousand of the total. This representsa modest 6 percent gain in total starts over 2009, but remainswell below the 1992 through 2007 annual levels of over1 million single family starts. The number of mortgages indefault remains very large and the number of foreclosures isexpected to remain high relative to historic trends. This willcontinue to contribute to the inventory of existing homes whichlimits demand for new homes. New home sales in the U.S.totaled 321 thousand units in 2010. This low level of newhome sales last occurred in 1963 and is a decrease of14 percent from 2009, the previous record low. At the peak in2005, new home sales were 1.28 million.
Demand for wood products continued to be affected by thedepressed level of new home construction in 2010. Overalldemand levels for lumber increased 4 percent from 2009 whiledemand for oriented strand board (OSB), which is more heavilydependent on residential construction, declined 3 percent from2009 levels. Demand for both lumber and OSB remain36 percent to 38 percent below peak levels. As a result,industry operating rates for lumber and OSB averaged between70 and 80 percent of capacity. Product prices were subject tosignificant fluctuations in 2010 as a result of low inventoriesand relatively weak demand. Most prices peaked in the secondquarter coinciding with the strongest quarter of construction,only to decrease to levels closer to their costs of production formuch of the year. Demand for logs increased as lumberproduction increased slightly. In the western region, weakdomestic demand for logs was offset somewhat by demandfrom Japan, China and Korea, resulting in increases for westernlog prices.
U.S. DOLLAR/GLOBAL DEMAND
The U.S. dollar has weakened relative to most developed worldcurrencies over 2010. Cellulose Fibers benefitted from thedecline in the value of the U.S. dollar, as our pulp mills becamemore competitive compared to European, Canadian and SouthAmerican producers.
The combination of the weaker dollar, steady global demandand decreased capacity resulted in a 41 percent increase in thekey indicator northern bleached softwood kraft (NBSK) pulpprice in 2010 over 2009. Pulp prices started the year above2009 levels and increased further as global supplies werestrained by production interruptions in Chile, due toearthquakes. The combination of re-started Chilean mills andthe production response to higher prices led to a gradualretreat in the key NBSK indicator price in fourth quarter.
The weaker dollar compared to the Yen resulted in U.S. logsbeing cheaper. Total housing starts in Japan increased2 percent from 2009 levels; however, wooden housing starts, akey factor influencing demand for export logs, increased almost8 percent on a year over year basis. The export log market wasaffected by increased demand from China. Chinese imports ofsoftwood logs from the U.S. are estimated at 2.4 million cubicmeters for 2010, an increase of 400 percent from 2009.
WHERE WE ARE HEADED
The U.S. economy has continued to grow through fourth quarter2010 and into 2011, but there has been no meaningful jobgrowth in the first quarter of 2011. Single-family starts areexpected to be higher in the first quarter, as a result of therecord low inventory of new homes for sale. Demand for woodproducts is expected to increase seasonally, however some ofthis is expected to result from the rebuilding of inventories bydealers and wholesalers. Sustainable demand growth isexpected to be modest in 2011. Log prices are expected to riseas a result of the increased seasonal domestic demand forwood products and increasing off-shore demand. The U.S.dollar is expected to remain weak by comparison to the Euroand the Canadian dollar, which will increase the competitiveposition of U.S. market pulp producers.
34

FINANCIAL PERFORMANCE SUMMARY
Net Sales and Revenues by Segment
2008 2009 2010
NET SALES AND REVENUES BY SEGMENT IN MILLIONS OF DOLLARS
$-
$2,000
$4,000
714 874899
2,2342,591
3,768
1,5111,9111,765
904 9231,408
165 253392
TIMBERLANDS WOOD PRODUCTS CELLULOSE FIBERS REAL ESTATE CORPORATE& OTHER
$3,000
$1,000
Contribution (Charge) to Pretax Earnings by Segment
2008 2009 2010
$(1,000)$(800)$(600)$(400)$(200)
$-$200$400$600$800
$1,400$1,200$1,000
$1,600$1,800
CELLULOSE FIBERS REAL ESTATETIMBERLANDS
CONTRIBUTION (CHARGE) TO EARNINGS BY SEGMENT IN MILLIONS OF DOLLARS
WOOD PRODUCTS
$(1,600)$(1,800)
$(1,400)$(1,200)
CORPORATE& OTHER
(107)
71
1,558
282384 338
(733)
(310)
(1,547)
444 412
147
(299)
91
(1,357)
WEYERHAEUSER COMPANY > 2010 ANNUAL REPORT AND FORM 10-K 35

RESULTS OF OPERATIONS
In December 2008, our board of directors amended our bylawsto adopt a December 31 fiscal year-end. Before 2008, our fiscalyear ended on the last Sunday of the calendar year. As a result,our fiscal year ended December 31, 2008 had 367 days.
In reviewing our results of operations, it is important tounderstand these terms:
•Price realizations refer to net selling prices — this includesselling price plus freight minus normal sales deductions.
•Net contribution to earnings can be positive or negative andrefers to earnings (loss) attributable to Weyerhaeusershareholders before interest expense not capitalized andincome taxes.
CONSOLIDATED RESULTS
HOW WE DID IN 2010
Summary of Financial Results
DOLLAR AMOUNTS IN MILLIONS, EXCEPT PER-SHARE FIGURES
AMOUNT OF CHANGE
2010 2009 2008 2010vs.
2009
2009vs.
2008
Net sales andrevenues
$6,552 $5,528 $ 8,100 $1,024 $(2,572)
Operating income(loss)
$ 468 $ (447) $(2,601) $ 915 $ 2,154
Earnings fromdiscontinuedoperations, netof tax
$ — $ — $ 667 $ — $ (667)
Net earnings(loss) attributableto Weyerhaeusercommonshareholders
$1,281 $ (545) $(1,176) $1,826 $ 631
Basic earnings(loss) per shareattributable toWeyerhaeusercommonshareholders
$ 4.00 $ (2.58) $ (5.57) $ 6.58 $ 2.99
Diluted earnings(loss) per shareattributable toWeyerhaeusercommonshareholders
$ 3.99 $ (2.58) $ (5.57) $ 6.57 $ 2.99
COMPARING 2010 WITH 2009
In 2010:
•Net sales and revenues increased $1 billion — 19 percent.
•Net earnings attributable to Weyerhaeuser commonshareholders increased $1.8 billion.
Net Sales and Revenues
Net sales and revenues increased primarily due to thefollowing:
•increased pulp sales realizations — refer to the CelluloseFibers segment discussion;
•increased price realizations and sales volumes for residentialbuilding products — refer to the Wood Products segmentdiscussion;
•increased revenues from our shipping operations — refer tothe Corporate and Other segment discussion; and
•increased price realizations for log sales in the West — referto the Timberlands segment discussion.
Net Earnings (Loss) Attributable to Weyerhaeuser CommonShareholders
Our net earnings attributable to Weyerhaeuser commonshareholders increased primarily due to the following:
•reversal of certain deferred income tax liabilities as a resultof our conversion to a REIT — refer to the income taxdiscussion;
•decreased restructuring, closure and asset impairmentcharges — refer to the Timberlands, Wood Products, RealEstate and Corporate and Other segment discussions;
•higher price realizations — refer to the Timberlands, WoodProducts and Cellulose Fibers segment discussions;
•recognition of cellulosic biofuel producer credits — refer tothe income tax discussion; and
•higher gross margins from single-family operations — refer tothe Real Estate segment discussion.
The increases in our earnings were partially offset by thefollowing:
•recognition of alternative fuel mixture credits in 2009 that didnot recur in 2010 — refer to the Cellulose Fibers segmentdiscussion;
•recognition of a gain on sale of 140,000 acres ofnon-strategic timberlands in 2009 — refer to the Timberlandssegment discussion; and
•increased raw materials, maintenance and other operatingcosts — refer to the Timberlands, Wood Products andCellulose Fibers segment discussions.
COMPARING 2009 WITH 2008
In 2009:
•Net sales and revenues decreased $2.6 billion —32 percent.
•Net loss attributable to Weyerhaeuser common shareholdersdecreased $631 million — 54 percent.
36

Net Sales and Revenues
Net sales and revenues decreased primarily due to the following:
•significantly lower demand and prices for residential buildingproducts along with the closure and curtailment of a number offacilities — refer to the Wood Products segment discussion;
•declines in the number of single-family homes closed andaverage selling prices — refer to the Real Estate segmentdiscussion;
•lower pulp sales realizations — refer to the Cellulose Fiberssegment discussion; and
•decreased western log sales due to weaker export and domesticmarkets — refer to the Timberlands segment discussion.
Net Earnings (Loss) Attributable to Weyerhaeuser CommonShareholders
Our net loss attributable to Weyerhaeuser common shareholdersdecreased primarily due to the following:
•decreased asset impairment charges — refer to the RealEstate, Wood Products, Cellulose Fibers and Corporate andOther segments;
•decreased income tax expense from taxes related to thegains from our discontinued operation transactions in2008 — refer to the income tax discussion;
•recognition of alternative fuel mixture credits in 2009 — referto the Cellulose Fibers segment;
•decreased selling and general and administrative costs as aresult of the implementation of company cost-savinginitiatives, a reduction in the number of employees and lowersales volumes across all of our segments;
•decreased raw materials costs, manufacturing, warehousingand delivery and other cost of sales — refer to the WoodProducts segment;
•recognition of a gain on sale of 140,000 acres ofnon-strategic timberlands in 2009 — refer to the Timberlandssegment discussion;
•increased earnings from foreign exchange gains — refer tothe Corporate and Other segment; and
•decreased freight, fiber and energy costs — refer to theCellulose Fibers segment.
These reductions to net loss during 2009 were partially offsetby the following:
•pretax gains recognized on dispositions and investmentrestructuring — refer to the Corporate segment;
•reduced harvest volumes and lower domestic and exportprices — refer to the Timberlands segment;
•lower sales price realizations — refer to the Wood Productssegment;
•loss of earnings due to the sale of our Containerboard,Packaging and Recycling business;
•lower pulp prices and lower pulp sales volumes — refer tothe Cellulose Fibers segment;
•increased restructuring and closure charges — refer to theCorporate and Other and Wood Products segments;
•decrease in pretax earnings from our shipping and internationaloperations — refer to the Corporate segment; and
•changes in our U.S. postretirement plans for salariedemployees in the U.S. — refer to the Corporate and Othersegment.
TIMBERLANDS
HOW WE DID IN 2010
We report sales volume and annual production data for ourTimberlands business segment in Our Business/What We Do/Timberlands.
Here is a comparison of net sales and revenues to unaffiliatedcustomers, intersegment sales, and net contribution toearnings for the last three years:
Net Sales and Revenues and Net Contribution to Earningsfor Timberlands
DOLLAR AMOUNTS IN MILLIONS
AMOUNT OF CHANGE
2010 2009 2008 2010vs.
2009
2009vs.
2008
Net sales and revenues tounaffiliated customers:
Logs:
West $ 414 $ 329 $ 547 $ 85 $(218)
South 145 144 97 1 47
Canada 17 13 20 4 (7)
Total 576 486 664 90 (178)
Pay as cut timber sales 33 31 32 2 (1)
Timberlandsexchanges(1)
109 66 73 43 (7)
Higher and better-useland sales(1)
22 11 11 11 —
Minerals, oil and gas 60 62 61 (2) 1
Products frominternationaloperations(2)
65 44 40 21 4
Other products 9 14 18 (5) (4)
Subtotal sales tounaffiliated customers
874 714 899 160 (185)
Intersegment sales:
United States 409 392 817 17 (425)
Other 194 145 217 49 (72)
Subtotal intersegment sales 603 537 1,034 66 (497)
Total $1,477 $1,251 $1,933 $226 $(682)
Net contribution to earnings $ 282 $ 338 $ 384 $ (56) $ (46)
(1) Disposition of higher and better use timberland and non-strategic timberlands areconducted through Forest Products subsidiaries.
(2) Includes logs, plywood and hardwood lumber harvested or produced by our internationaloperations, primarily in South America.
WEYERHAEUSER COMPANY > 2010 ANNUAL REPORT AND FORM 10-K 37

COMPARING 2010 WITH 2009
In 2010:
•Net sales and revenues to unaffiliated customers increased$160 million — 22 percent.
•Intersegment sales increased $66 million — 12 percent.
•Net contribution to earnings decreased $56 million —17 percent.
Net Sales and Revenues — Unaffiliated Customers
The $160 million increase in net sales and revenues tounaffiliated customers resulted primarily from the following:
•Western log sales increased $85 million due to increasedprice realizations of 26 percent.
•Land exchanges, dispositions of non-strategic timberlandsand sales of higher and better-use lands increased$54 million.
•Sales from our International operations increased $21 milliondue to improvement in prices across most products andincreased sales volumes.
Intersegment Sales
The $66 million increase in intersegment sales resultedprimarily from the following:
•$49 million increase due to increased Canadian log and chipsales volumes and
•$17 million increase due to increase in U.S. log prices.
Net contribution to earnings
The $56 million decrease in net contribution to earningsresulted primarily from the following:
•$163 million pre-tax gain on the third quarter 2009 sale of140,000 acres of non-strategic timberland in northwesternOregon;
•$24 million decrease due to decreased harvest levels of9 percent in the South and 12 percent in the West;
•$30 million decrease resulting from increased incentivecompensation and increased allocations of corporate coststo the business segments; and
•$17 million increase in operating costs, which includeshigher road maintenance, and increased fuel costs.
These items were partially offset by:
•$125 million increase primarily due to higher domestic andexport prices;
•$27 million increase due to land exchanges, dispositions ofnon-strategic timberlands and sales of higher and better-uselands; and
•$25 million decrease in charges for restructuring, closuresand asset impairments.
COMPARING 2009 WITH 2008
In 2009:
•Net log sales and revenues to unaffiliated customersdecreased $178 million — 27 percent.
•Sales of other products to unaffiliated customers decreased$7 million — 3 percent.
•Intersegment sales decreased $497 million — 48 percent.
•Net contribution to earnings decreased $46 million —12 percent.
Net Sales and Revenues — Unaffiliated Customers
The $185 million decrease in net sales and revenues tounaffiliated customers resulted from:
•$218 million decrease — 40 percent — in log sales in theWest as sales volumes decreased 36 percent and pricerealizations decreased 6 percent due to weaker domesticand export markets;
•$7 million decrease — 35 percent — in log sales in Canadaas sales volume in Canada decreased 23 percent and pricerealizations decreased 15 percent primarily due to weakerdemand; and
•$7 million decrease — 3 percent — in other sales andrevenues from unaffiliated customers primarily due to lowertimberlands exchange revenues.
These decreases were partially offset by $47 million —48 percent — increase in log sales in the South as salesvolumes increased 51 percent, primarily due to sales of fiberlogs to International Paper for use at locations that previouslywere owned by Weyerhaeuser and higher grade log sales todomestic customers.
Intersegment Sales
The $497 million decrease in intersegment sales primarilyresulted from:
•fewer Weyerhaeuser mills in operation as a result of closuresand curtailments of Wood Products operations in the UnitedStates; and
•sales to Containerboard, Packaging and Recycling operationsbecame third-party sales after we sold the business toInternational Paper in August 2008.
Net contribution to earnings
The $46 million decrease in net contribution to earningsprimarily resulted from:
•$146 million due to a 40 percent reduction in harvest in theWest and 27 percent reduction in harvest in the South;
•$113 million due to lower domestic and export prices in theWest and South; and
•$15 million due to asset impairments.
38

These decreases were partially offset by the following:
•$163 million pretax gain on a sale of 140,000 acres ofnon-strategic timberland in northwestern Oregon in thirdquarter 2009;
•$44 million reduction of operating costs, including lowersalvage logging costs, lower fuel costs and reduced spendingon silviculture; and
•$21 million reduction in selling, general and administrativecosts as a result of cost cutting measures.
OUR OUTLOOK
Excluding the disposition of non-strategic timberlands, weexpect higher earnings in first quarter compared with the fourth.The company expects higher selling prices for western logs andseasonally higher harvest volumes. A sale of approximately82,000 acres of non-strategic timberlands in southwestWashington that occurred subsequent to year end, willcontribute approximately $150 million in pre-tax earnings.
WOOD PRODUCTS
HOW WE DID IN 2010
We report sales volume and annual production data for ourWood Products business segment in Our Business/What WeDo/Wood Products.
Here is a comparison of net sales and revenues and netcontribution to earnings for the last three years:
Net Sales and Revenues and Net Contribution to Earnings forWood Products
DOLLAR AMOUNTS IN MILLIONS
AMOUNT OF CHANGE
2010 2009 2008 2010vs.
2009
2009vs.
2008
Net sales andrevenues:
Structurallumber
$1,044 $ 846 $ 1,351 $198 $ (505)
Engineeredsolidsection
272 238 414 34 (176)
EngineeredI-joists
171 162 284 9 (122)
Orientedstrandboard
334 234 416 100 (182)
Softwoodplywood
73 58 148 15 (90)
Hardwoodlumber
223 206 291 17 (85)
Otherproductsproduced
145 146 225 (1) (79)
Otherproductspurchasedfor resale
329 344 639 (15) (295)
Total $2,591 $2,234 $ 3,768 $357 $(1,534)
Net contributionto earnings
$ (310) $ (733) $(1,547) $423 $ 814
COMPARING 2010 WITH 2009
In 2010:
•Restructuring, closures and impairments decreased$63 million — 36 percent.
•Net sales and revenues increased $357 million —16 percent.
•Net contribution to earnings improved $423 million —58 percent.
WEYERHAEUSER COMPANY > 2010 ANNUAL REPORT AND FORM 10-K 39

Restructuring, Closures and Asset Impairments
During fourth quarter 2010, we recognized $92 million ofimpairment charges in the Wood Products segment primarilyrelated to the decision to permanently close three WoodProducts facilities that were previously indefinitely closed.These include an engineered wood products facility inDeerwood, Minnesota, a sawmill in Pine Hill, Alabama and anoriented strand board mill in Wawa, Ontario. Total restructuring,closures and asset impairment charges in 2010 for thesegment were $114 million. This compares with total WoodProducts restructuring, closures and asset impairment chargesof $177 million in 2009.
Net Sales and Revenues
The $357 million increase in net sales and revenues wasprimarily due to the following:
•Structural lumber average price realizations increased22 percent.
•OSB average price realizations increased 27 percent andshipment volumes increased 12 percent.
•Softwood plywood average price realizations increased8 percent and shipment volumes increased 17 percent.
•Hardwood lumber shipment volumes increased 8 percent.
Net Contribution to Earnings
The $423 million improvement in net contribution to earningswas primarily due to the following:
•$276 million increase due to sales price realizations,primarily OSB and structural lumber;
•$63 million decrease in charges for restructuring, closureand asset impairment;
•$59 million decrease in manufacturing and other costs ofsales as a result of increased operating efficiencies andcost reductions;
•$52 million increase in the net pretax gain on the sale ofassets and operations, including the sale of certain BritishColumbia forest licenses and associated rights;
•$35 million decrease in selling and administrative costs,primarily due to staff reductions in 2009; and
•$13 million decrease in litigation charges, primarily due tothe settlement of Alder litigation in 2009.
These improvements were partially offset by a $64 millionincrease in log costs.
COMPARING 2009 WITH 2008
In 2009:
•Net sales and revenues decreased $1.5 billion — 41 percent.
•Net contribution to earnings increased $814 million.
Net Sales and Revenues
Net sales and revenues decreased $1.5 billion primarily due tothe following:
•Structural lumber average price realizations remained flat andshipment volumes decreased 29 percent.
•Engineered solid section average price realizations decreased3 percent and shipment volumes decreased 41 percent.
•Engineered I-joists average price realizations decreased7 percent and shipment volumes decreased 39 percent.
•Oriented strand board (OSB) average price realizationsdecreased 4 percent and shipment volumes decreased41 percent.
•Softwood plywood average price realizations decreased17 percent and shipment volumes decreased 53 percent.
•Hardwood lumber average price realizations decreased9 percent and shipment volumes decreased 22 percent.
•Sales of other products purchased for resale decreased46 percent as a result of the sale of Canadian and selectedU.S. distribution centers and overall decline in demand forbuilding products.
Net Contribution to Earnings
Net contribution to earnings improved $814 million primarilydue to the following:
•$714 million decrease in charges for restructuring, closuresand asset impairments, primarily related to a decrease inimpairments of goodwill and other assets;
•$137 million decrease in raw materials, mainly due todecreased log costs;
•$107 million decrease in selling and administrative chargesresulting from staff reductions and continued focus onreducing costs;
•$57 million decrease in manufacturing and other cost ofsales due to mill optimizations and productionefficiencies; and
•$38 million decrease in warehousing and delivery costs as aresult of lower shipment volumes and closures of distributioncenter facilities.
These improvements were partially offset by the following:
•$206 million decrease due to lower sales pricerealizations and
•$25 million decrease in contributions from other productspurchased for resale as a result of reduced market demandand closed distribution facilities.
OUR OUTLOOK
Excluding the effect of fourth quarter special items,Weyerhaeuser anticipates a smaller loss from the segment infirst quarter due to improved operating rates, higher sellingprices, and continued cost reductions.
40

CELLULOSE FIBERS
HOW WE DID IN 2010
We report sales volume and annual production data for ourCellulose Fibers business segment in Our Business/What WeDo/Cellulose Fibers.
Here is a comparison of net sales and revenues and netcontribution to earnings for the last three years:
Net Sales and Revenues and Net Contribution to Earnings forCellulose Fibers
DOLLAR AMOUNTS IN MILLIONS
AMOUNT OF CHANGE
2010 2009 2008 2010vs.
2009
2009vs.
2008
Net sales andrevenues:
Pulp $1,489 $1,148 $1,357 $341 $(209)
Liquidpackagingboard
337 290 290 47 —
Otherproducts
85 73 118 12 (45)
Total $1,911 $1,511 $1,765 $400 $(254)
Net contributionto earnings
$ 412 $ 444 $ 147 $ (32) $ 297
COMPARING 2010 WITH 2009
In 2010:
•Net sales and revenues increased $400 million —26 percent.
•Net contribution to earnings decreased $32 million —7 percent.
Net Sales and Revenues
Net sales and revenues increased $400 million primarily due tothe following:
•Pulp price realizations increased $192 per ton —28 percent — primarily due to tight global softwood pulpinventories, due in part to lower industry production in thefirst half of 2010 as a result of the Chilean earthquake thatoccurred in February 2010.
•Sales volumes for pulp increased 17,000 tons — 1 percent.
•Liquid packaging board price realizations increased $80 perton — 8 percent — primarily due to a favorable mix shifttoward coated board.
•Sales volumes for liquid packaging board increasedapproximately 23,000 tons — 8 percent.
Net Contribution to Earnings
Net contribution to earnings decreased $32 million primarilydue to the following:
•$344 million decrease due to alternative fuel mixture credits,see “Liquidity and Capital Resources — Other LiquidityRelated Disclosures” for more information related to thealternative fuel mixture credits;
•$69 million increase in operating costs, freight and the effecton Canadian operating costs of the weakening U.S. dollarcompared to the Canadian dollar; and
•$11 million increase in general and administrative cost.
Partially offsetting these decreases in earnings were thefollowing increases:
•$330 million increase due to higher pulp price realizations,
•$24 million increase in other product realizations,
•$25 million increase due to higher liquid packaging boardprice realizations and
•$12 million in other non operating income.
COMPARING 2009 WITH 2008
In 2009:
•Net sales and revenues decreased $254 million —14 percent.
•Net contribution to earnings increased $297 million —202 percent.
WEYERHAEUSER COMPANY > 2010 ANNUAL REPORT AND FORM 10-K 41

Net Sales and Revenues
The effects of the global economic recession — weaker pulpdemand and a stronger U.S. dollar — resulted in decreasedsales realizations from fourth quarter 2008 through first half2009. Pulp prices improved in the second half as the U.S.dollar weakened and demand strengthened. The $254 milliondecrease in net sales and revenues for the full year 2009compared with 2008 was primarily due to the following:
•Pulp price realizations decreased $120 per ton —15 percent;
•Sales volume of pulp decreased approximately 7,000 tons;
•Sales volume of liquid packaging board decreasedapproximately 14,000 tons — 5 percent; and
•Sales price of liquid packaging increased $46 per ton —5 percent.
Net Contribution to Earnings
Net contribution to earnings increased $297 million primarilydue to the following:
•$344 million increase due to alternative fuel mixture credits,see “Liquidity and Capital Resources” for more informationrelated to alternative fuel mixture credits;
•$94 million goodwill impairment charge in fourth quarter2008, which did not recur in 2009;
•$80 million decrease in fiber, freight and energy costs,primarily related to lower prices for chips and fuel;
•$46 million decrease in other operating and maintenancecosts, primarily as a result of cost reduction initiatives andthe effect of the strengthening of the U.S. exchange rate onCanadian operating costs year over year;
•$13 million increase in liquid packaging board pricerealizations; and
•$12 million decrease in administrative costs as a result ofcost reduction activities.
These increases were partially offset by the followingdecreases:
•$203 million due to lower pulp prices and lower pulp salesvolumes, as global market demand decreased from the prioryear;
•$40 million as a result of lower production, primarily due tomaintenance downtime and market downtime in the first halfof the year;
•$26 million due to lower other product realizations; and
•$23 million in other non operating income and earnings fromour interest in our newsprint joint venture due to lowernewsprint market prices.
OUR OUTLOOK
We expect Cellulose Fibers earnings to decline in first quarterdue to an increase in the number scheduled annualmaintenance outages.
REAL ESTATE
HOW WE DID IN 2010
We report single-family unit statistics for our Real Estatebusiness segment in Our Business/What We Do/Real Estate.
Here is a comparison of net sales and revenues and netcontribution to earnings for the last three years:
Net Sales and Revenues and Net Contribution to Earnings forReal Estate
DOLLAR AMOUNTS IN MILLIONS
AMOUNT OF CHANGE
2010 2009 2008 2010vs.
2009
2009vs.
2008
Net sales andrevenues:
Single-familyhousing
$842 $ 832 $ 1,294 $ 10 $ (462)
Land 64 68 99 (4) (31)
Other 17 4 15 13 (11)
Total $923 $ 904 $ 1,408 $ 19 $ (504)
Net contributionto earnings
$ 91 $(299) $(1,357) $390 $1,058
COMPARING 2010 WITH 2009
In 2010:
•Net sales and revenues increased $19 million — 2 percent.
•Net contribution to earnings increased $390 million.
Net Sales and Revenues
The $19 million increase in net sales and revenues resultedprimarily from:
•$10 million increase in single-family housing revenuesprimarily due to a shift in product mix; and– The average price of homes closed improved to $396,000
in 2010 from $382,000 in 2009.– This was partially offset by a 2 percent decline in home
closings — 2010 included closings of 2,125 compared to2,177 in 2009.
•$9 million net increase in land and other revenues primarilyrelated to the sale of an apartment building in 2010.
Net Contribution to Earnings
The $390 million increase in net contribution to earningsresulted primarily from:
•$240 million decrease in impairments and other relatedcharges;
42

•$56 million increase — 37 percent — in contribution fromsingle-family closings. The net contribution reflects a$60 million benefit as a result of improved margins due tothe mix of homes closed, partially offset by a $4 milliondecrease as a result of fewer closings;
•$24 million decrease in restructuring and other relatedcharges;
•$24 million increase in contributions from sales ofpartnership interests — 2010 included gains of $33 millionon sales compared to $9 million in 2009;
•$23 million increase in contribution from land and lot sales;
•$19 million decrease in selling and general andadministrative expenses due to cost cutting measures,including reductions in headcount; and
•$4 million increase in contributions from partnership income— 2010 included income of $12 million compared to$8 million in 2009.
COMPARING 2009 WITH 2008
In 2009:
•Net sales and revenues decreased $504 million —36 percent.
•Net contribution to earnings increased $1.1 billion —78 percent.
Net Sales and Revenues
The $504 million decrease in net sales and revenues resultedfrom:
•Single-family revenues decreased $462 million —36 percent. This included:– $410 million due to a 32 percent decrease in single-family
home closings and– $52 million due to a 6 percent decrease in the average
sales price of homes closed.
•Land and lot sales decreased $31 million — 31 percent.
•Other revenue decreased $11 million.
Net Contribution to Earnings
The $1.1 billion increase in net contribution to earningsresulted from:
•$815 million decrease in impairments and write-offs ofpreacquisition and abandoned community costs;
•$233 million increase in contribution from land and lot sales;
•$73 million benefit from lower selling, general andadministrative costs, primarily due to lower sales volumes, areduction in the number of open communities, and generalcost cutting measures, including a reduction in headcount.
Offsetting the increase was:
•$56 million decrease in single-family gross margin, primarilythe result of fewer closings at lower prices; and
•$17 million increase in restructuring charges, primarilyrelated to vacated office space and headcount reductions.
OUR OUTLOOK
We expect a small loss from single-family homebuildingoperations in first quarter due to fewer home sale closings andlower margins.
WEYERHAEUSER COMPANY > 2010 ANNUAL REPORT AND FORM 10-K 43

CORPORATE AND OTHER
We report what our Corporate and Other segment includes inOur Business/What We Do/Corporate and Other.
Here is a comparison of net sales and revenues and netcontribution to earnings for the last three years:
Net Sales and Revenues and Net Contributions to Earnings forCorporate and Other
DOLLAR AMOUNTS IN MILLIONS
AMOUNT OF CHANGE
2010 2009 2008 2010vs.
2009
2009vs.
2008
Net sales andrevenues
$253 $ 165 $ 392 $ 88 $ (227)
Net contributionsto earnings
$ 71 $(107) $1,558 $178 $(1,665)
HOW WE DID IN 2010
The segment’s results are affected by changes in foreignexchange rates primarily related to our Canadian operations,changes in our stock price, pension and postretirement credits(costs), and strategic initiatives outside the operatingsegments. Results for the Corporate and Other segment alsoinclude the net gain on divestitures that affect multiplebusiness segments and the disposition of entire businesssegments.
We completed the sale of our five short line railroads inDecember 2010
COMPARING 2010 WITH 2009
In 2010:
•Net sales and revenues increased $88 million — 53 percent.
•Net contributions to earnings increased $178 million.
Net Sales and Revenues
The $88 million increase in net sales and revenues primarilyconsisted of increased revenues generated by our WestwoodShipping operations as a result of higher volumes and prices.
Net Contribution to Earnings
Net contribution to earnings increased $178 million, primarilyresulting from the following:
•$183 million decrease in charges for asset impairments andcorporate restructuring activities;
•$46 million increase for the gain on the sale of our five shortline railroads; and
•$32 million increase in earnings from transportationoperations, primarily from our Westwood Shipping operations.
These increases were partially offset by the following:
•$29 million decrease related to litigation and insurancereimbursements received in 2009;
•$28 million decrease in foreign exchange, primarily resultingfrom a smaller change in the Canadian dollar relative to theU.S. dollar in 2010 as compared to 2009; and
•$18 million decrease related to the 2009 sale of a Honolulubox plant site.
COMPARING 2009 WITH 2008
In 2009:
•Net sales and revenues decreased $227 million —58 percent.
•Net contribution to earnings decreased $1.7 billion.
Net Sales and Revenues
Net sales and revenues decreased, primarily due to the sale ofour Australian operations in July 2008 and decreased revenuein our transportation business during 2009.
Net Contribution to Earnings
The $1.7 billion decrease in net contribution to earningsresulted from:
•$1.2 billion pretax gain recognized in 2008 from the sale ofour Containerboard, Packaging and Recycling business;
•$250 million pretax non-cash gain recognized in 2008 fromrestructuring our joint ventures in Uruguay in 2008;
•$218 million pretax gain recognized in 2008 from the sale ofour Australian operations;
•$64 million reduction in net pension and postretirementcredits primarily related to the remeasurement of plan assetsand liabilities partially offset by changes in plan participation;
•$55 million decrease in earnings from Westwood Shippingoperations, as well as international operations that weredisposed of in 2008;
•$52 million pretax gain recognized in 2008 from changes inour U.S. postretirement plans for salaried employees in theU.S; and
•$51 million increase in charges for asset impairments andrestructuring activities, primarily related to 2009 pensionsettlements and curtailments.
These decreases were partially offset by the following:
•$82 million change in net foreign exchange gains and losses— $39 million gain in 2009 compared to $43 million loss in2008 — primarily resulting from changes in exchange ratesbetween the U.S. dollar and the Canadian dollar;
•$59 million decrease in general and administrative costs asa result of implementing company cost saving initiatives; and
•$51 million decrease in Weyerhaeuser’s expense related topreviously capitalized interest on excess qualifying assets ofWeyerhaeuser Real Estate Company, primarily due to lowerhome and land sales in 2009.
44

CONTAINERBOARD, PACKAGING AND RECYCLING
On August 4, 2008, our Containerboard, Packaging andRecycling business was sold to International Paper. As a result,the year ended December 31, 2008, includes 31 weeks ofoperations. Subsequent to third quarter 2008, we no longerhave results of operations for the Containerboard, Packagingand Recycling segment.
Here are net sales and revenues and net contribution toearnings for 2008:
Net Sales and Revenues and Net Contribution to Earnings forContainerboard, Packaging and Recycling
DOLLAR AMOUNTS IN MILLIONS
2008
Net sales and revenues:
Containerboard $ 301
Packaging 2,449
Recycling 275
Kraft bags and sacks 56
Other products 88
Total $3,169
Net contribution to earnings $ 204
INTEREST EXPENSE
Including interest expense reported in discontinued operations,our net interest expense incurred for the last three years was:
•$452 million in 2010,
•$462 million in 2009 and
•$414 million in 2008.
In connection with the repayments, included in our net interestexpense, we recognized the following pretax (gains) losses onearly extinguishment of debt:
•$50 million in 2010,
•$28 million in 2009 and
•$(32) million in 2008.
Reductions in our amount of outstanding debt was:
•$627 million in 2010,
•$327 million in 2009 and
•$1.4 billion in 2008.
INCOME TAXES
Our benefit for income taxes for our continuing operations overthe last three years was:
•$1,187 million in 2010,
•$274 million in 2009 and
•$900 million in 2008.
During 2010, we recorded the following tax benefits or charges:
•We reversed certain deferred income tax liabilities as a resultof our conversion to a REIT, which resulted in a benefit of$1,064 million. See Note 2: Real Estate Investment Trust(REIT) Conversion.
•We recorded a tax benefit of $149 million for cellulosicbiofuel producer credits; see “Fuel Credits” for moreinformation.
•We recorded a $32 million tax charge as a result of thePatient Protection and Affordable Care Act, as modified bythe Health Care and Education Reconciliation Act and achange in our postretirement medical plan.
During 2008, we recorded a tax benefit of $57 million as aresult of Timber provisions in the Food, Conservation andEnergy Act (TREE Act) of 2008 enacted May 22, 2008. Theprovision was effective for one year and reduced the capitalgains tax rate on qualified timber sales from 35 percent to15 percent.
In addition, income tax expense recorded in connection withdivestitures is included in discontinued operations and includesthe tax expense on dispositions of $887 million related to thegain on sale of our Containerboard, Packaging and Recyclingbusiness and $58 million related to the gain on sale of ourAustralian operations in 2008.
As a REIT, we will no longer be required to pay corporate leveltax on income of the REIT that is distributed to shareholders.We will, however, be subject to corporate taxes on built-in-gains(the excess of fair market value over tax basis at January 1,2010) on sales of real property (other than standing timber)held by the REIT during the first 10 years following the REITconversion. We will also continue to be required to pay federalcorporate income taxes on earnings of our TRS, whichprincipally includes our manufacturing businesses, our realestate development business and the portion of ourtimberlands segment income included in the TRS.
The table below summarizes the historical tax characteristics ofdistributions to shareholders for the years ended December 31:
AMOUNTS PER SHARE
2010 2009 2008
Qualified distributions $25.53 $0.60 $2.40
Capital gain distributions 0.61 — —
Return of capital — — —
Non-taxable distribution ofpre-March 1, 1913 earnings
0.47 — —
Total distributions $26.61 $0.60 $2.40
WEYERHAEUSER COMPANY > 2010 ANNUAL REPORT AND FORM 10-K 45
LIQUIDITY AND CAPITAL RESOURCES
We are committed to maintaining a sound, conservative capitalstructure that enables us to:
•protect the interests of our shareholders and lenders and
•have access at all times to major financial markets.
CASH FROM OPERATIONS
Cash from operations includes:
•cash received from customers;
•cash paid to employees, suppliers and others;
•cash paid for interest on our debt; and
•cash paid or received for taxes.
Consolidated net cash provided by (used in) our operationswas:
•$744 in 2010,
•$(162) million in 2009 and
•$(1.3) billion in 2008.
COMPARING 2010 WITH 2009
Net cash provided by operations increased $906 million in2010 as compared with 2009:
•Cash we received from customers increased approximately$864 million primarily due to increased price realizations andshipment volumes from our Wood Products, Cellulose Fibersand Timberlands segments.
•Consolidated cash received for income taxes increased$495 million as compared to 2009.
Partially offsetting these increases was an increase of cashpaid to employees, suppliers and others of approximately$234 million and pension contributions of $233 million in2010.
COMPARING 2009 WITH 2008
Net cash used in operations decreased $1.1 billion in 2009 ascompared with 2008 due to the following:
•Consolidated cash paid for income taxes decreased by$1.1 billion primarily due to taxes paid on the sale of ourContainerboard, Packaging and Recycling business in 2008.
•Cash we received from customers increased $559 million netof cash paid to employees, suppliers and others. Thisincrease was primarily due to:– Cash from operations declined as a result of significantly
lower demand for building materials due to the continueddeterioration of the U.S. housing market.
– 2008 cash from operations includes 31 weeks ofContainerboard, Packaging and Recycling andapproximately 30 weeks of Australian operations prior totheir sales.
•We received $213 million from alternative fuel mixturecredits in 2009.
Fuel Credits
During 2009, the U.S. Internal Revenue Code allowed a $0.50per gallon tax credit for the alternative fuel component ofalternative fuel mixtures produced and used as a fuel in ataxpayer’s trade or business. Our application for registration asa blender based on our use of black liquor as an alternativefuel was approved in May 2009. We began blending black liquor(a byproduct of our wood pulping process) and diesel fuelduring the first week of April 2009 and blended and usedapproximately 688 million gallons of the alternative fuel mixturethrough December 31, 2009, resulting in $344 million ofcredits. The alternative fuel mixture credit expired onDecember 31, 2009.
In an IRS memo dated June 28, 2010, the IRS concluded thatblack liquor sold or used in 2009 qualifies for the cellulosicbiofuel producer credit. With the recognition that black liquorpotentially qualifies for either the cellulosic biofuel producercredit or the alternative fuel mixture credit (but not both on thesame gallon of black liquor), the IRS has provided instructionsthat would allow a taxpayer to refund alternative fuel mixturecredits already received and claim the higher cellulosic biofuelproducer credit. We received our registration as a cellulosicbiofuel producer in third quarter 2010. In an IRS memo datedOctober 5, 2010, the IRS concluded that both the alternativefuel mixture credit and the cellulosic biofuel producer creditcould be claimed by a taxpayer in the same year. During 2009,we produced approximately 238 million gallons of black liquor,which did not qualify for the alternative fuel mixture credit. Thisequals $240 million of potential cellulosic biofuel producercredit at $1.01 per gallon, or $149 million net of tax, which werecognized in fourth quarter 2010. Since this credit offsets ourincome tax liability, we will carry the credit forward.
46

INVESTING IN OUR BUSINESS
Cash from investing activities includes:
•acquisitions of property, equipment, timberlands andreforestation; and
•proceeds from sale of assets and operations.
Three-Year Summary of Capital Spending by BusinessSegment
DOLLAR AMOUNTS IN MILLIONS
2010 2009 2008
Timberlands $ 72 $ 83 $109
Wood Products 33 57 101
Cellulose Fibers(1) 123 61 54
Containerboard, Packaging and Recycling — — 100
Corporate and Other 1 14 61
Real Estate 5 8 18
Total $234 $223 $443
(1) 2010 includes the exercise of an option to acquire liquid packaging board extrusionequipment for $21 million, including the assumption of liabilities of $4 million.
We anticipate that our net capital expenditures for 2011 —excluding acquisitions — will be approximately $250 million.However, that amount could change due to:
•future economic conditions,
•weather and
•timing of equipment purchases.
PROCEEDS FROM THE SALE OF NONSTRATEGIC ASSETS
Proceeds received from the sale of nonstrategic assets overthe last three years were:
•$213 million in 2010 including:– $66 million for the sale of Wood Products assets,– $52 million for the sale of five short line railroads,– $40 million for the sale of British Columbia forest licenses
and associated rights in our Wood Products segment,– $33 million for the sale of partnership interests in our Real
Estate segment and– $21 million for the sale of other non-strategic assets.
•$355 million in 2009 including:– $295 million from the sale of nonstrategic timberlands in
Oregon and– $20 million from the sale of our closed Honolulu box plant.
•$6.5 billion in 2008 including:– $6.1 billion from the sale of our Containerboard, Packaging
and Recycling business;– $342 million from the sale of our Australian operations;– $62 million from the sale of certain wood products
distribution facilities; and
– $54 million from the sale of property, equipment and otherassets.
Discontinued operations are discussed in Note 4: DiscontinuedOperations in the Notes to Consolidated Financial Statements.
In 2008, $2.1 billion of the proceeds from the sale of ourContainerboard, Packaging and Recycling business were usedto pay down outstanding debt in the second half of the year.
FINANCING
Cash from financing activities includes:
•issuances and payment of long-term debt,
•borrowings and payments under revolving lines of credit and
•payment of cash dividends.
LONG-TERM DEBT
Our consolidated long-term debt was:
•$5.1 billion as of December 31, 2010;
•$5.7 billion as of December 31, 2009; and
•$6.0 billion as of December 30, 2008.
Long-term debt proceeds were:
•$0 million in 2010,
•$491 million in 2009 and
•$0 million in 2008.
Long-term debt we retired according to its scheduled maturitywas:
•$43 million in 2010,
•$459 million in 2009 and
•$504 million in 2008.
Long-term debt we retired prior to its scheduled maturity was:
•$589 million in 2010,
•$367 million in 2009 and
•$500 million in 2008.
The (gains) and losses recognized on early extinguishment ofdebt were:
•$50 million in 2010 and
•$28 million in 2009 and
•$(32) million in 2008.
See Note 14: Long-Term Debt in the Notes to ConsolidatedFinancial Statements for more information.
REVOLVING CREDIT FACILITIES
As of December 31, 2010, Weyerhaeuser Company andWeyerhaeuser Real Estate Company (WRECO) have a $1 billionfive-year revolving credit facility that expires in December 2011
WEYERHAEUSER COMPANY > 2010 ANNUAL REPORT AND FORM 10-K 47

(credit facility). WRECO can borrow up to $200 million under thefacility. Neither of the entities is a guarantor of the other underthis credit facility. In March 2010, Weyerhaeuser Company’s$400 million revolving credit facility expired and was notrenewed.
As of December 31, 2010, Weyerhaeuser Company andWRECO:
•had no borrowings outstanding under our credit facility and
•were in compliance with the credit facility covenants.
We had no borrowings at any time under our available creditfacilities during 2010 or 2009. Our net pay-down under ouravailable credit facilities was $452 million during 2008.
Weyerhaeuser Company Covenants:
Key covenants related to Weyerhaeuser Company include therequirement to maintain:
•a minimum defined net worth of $3.0 billion and
•a defined debt-to-total-capital ratio of 65 percent or less.
Weyerhaeuser Company’s defined net worth is comprised of:
•total Weyerhaeuser shareholders’ interest,
•plus or minus accumulated comprehensive loss balancerelated to deferred pension and postretirement income orexpense,
•minus Weyerhaeuser Company’s investment in subsidiariesin our Real Estate segment or other unrestrictedsubsidiaries.
Total Weyerhaeuser Company capitalization is comprised of:
•total Weyerhaeuser Company (excluding WRECO) debt
•plus total defined net worth.
As of December 31, 2010, Weyerhaeuser Company had:
•a defined net worth of $5.0 billion and
•a defined debt-to-total-capital ratio of 48.8 percent.
Weyerhaeuser Real Estate Company Covenants
Key covenants related to WRECO revolving credit facilities andmedium-term notes include the requirement to maintain:
•a minimum defined net worth of $100 million,
•a defined debt-to-total-capital ratio of 80 percent or less and
•Weyerhaeuser Company or a subsidiary must own at least79 percent of WRECO.
WRECO’s defined net worth is:
•total WRECO shareholders’ interest,
•minus intangible assets,
•minus WRECO’s investment in joint ventures andpartnerships.
Total WRECO defined debt is:
•total WRECO debt — including any intercompany debt
•plus outstanding WRECO guarantees and letters of credit.
Total WRECO capitalization is defined as:
•total WRECO defined debt and
•total WRECO defined net worth.
As of December 31, 2010, WRECO had:
•a defined net worth of $840 million and
•a defined debt-to-total-capital ratio of 51.7 percent.
There are no other significant financial debt covenants relatedto our third party debt for either Weyerhaeuser Company orWRECO.
See Note 12: Short-term Borrowings and Lines of Credit in theNotes to Consolidated Financial Statements for moreinformation.
PAYING DIVIDENDS AND REPURCHASING STOCK
We paid dividends of:
•$608 million in 2010,
•$127 million in 2009 and
•$507 million in 2008.
The increase in dividends paid during 2010 is due to theSpecial Dividend paid on September 1, 2010, as part of ourconversion to a REIT.
Changes in the amount of dividends we paid during 2009 and2008 were primarily due to the decrease in our quarterlydividend from 60 cents to 25 cents in December 2008 and to5 cents in July 2009.
Our board considered several factors in regards to anappropriate dividend level following REIT conversion.Considerations included the macroeconomic climate, ourearnings potential, affordability, our target capital structure,funding for potential growth opportunities and comparability toother timber REIT dividend practices. During December 2010,we provided updated guidance on our dividend level for 2011 byannouncing that we expect to pay quarterly dividends of15 cents per share or 60 cents per share on an annualizedbasis. On February 10, 2011, our board declared a dividend of15 cents per share, payable on March 15, 2011.
In December of 2008, the board of directors authorized theadditional repurchase of up to $250 million of the company’soutstanding shares. During 2009, we repurchased 66,691shares of common stock at a cost of $2 million under thestock-repurchase program. We have not repurchased any morecommon shares since 2009.
48

OUR CONTRACTUAL OBLIGATIONS AND COMMERCIALCOMMITMENTS
More details about our contractual obligations and commercialcommitments are in Note 9: Pension and Other PostretirementBenefit Plans, Note 14: Long-Term Debt, Note 16: LegalProceedings, Commitments and Contingencies and Note 21:Income Taxes in the Notes to Consolidated FinancialStatements.
Significant Contractual Obligations as of December 31, 2010
DOLLAR AMOUNTS IN MILLIONS
PAYMENTS DUE BY PERIOD
TOTAL LESSTHAN 1
YEAR
1–3YEARS
3–5YEARS
MORETHAN 5YEARS
Long-term debtobligations:
ForestProducts
$ 4,716 $ — $ 869 $ — $3,847
Real Estate 350 33 257 15 45
Interest(1) 4,636 366 638 576 3,056
Operating leaseobligations
421 88 142 37 154
Purchaseobligations(2)
140 60 41 27 12
Employee-relatedobligations(3)
697 216 179 58 92
Liabilitiesrelated tounrecognized taxbenefits(4)
210 — — — —
Total $11,170 $763 $2,126 $713 $7,206
(1) Amounts presented for interest payments assume that all long-term debt obligationsoutstanding as of December 31, 2010 will remain outstanding until maturity, and interestrates on variable-rate debt in effect as of December 31, 2010 will remain in effect untilmaturity.
(2) Purchase obligations include agreements to purchase goods or services that areenforceable and legally binding on the company and that specify all significant terms,including: fixed or minimum quantities to be purchased; fixed, minimum or variable priceprovisions; and the approximate timing of the transaction. Purchase obligations excludearrangements that the company can cancel without penalty.
(3) The timing of certain of these payments will be triggered by retirements or other events.When the timing of payment is uncertain, the amounts are included in the total columnonly. Minimum pension funding is required by established funding standards andestimates are not made beyond 2012. Estimated payments of contractually obligatedpostretirement benefits are not made beyond 2010.
(4) We have recognized total liabilities related to unrecognized tax benefits of $210 millionas of December 31, 2010, including interest of $30 million. The timing of paymentsrelated to these obligations is uncertain; however, none of this amount is expected to bepaid within the next year.
OFF-BALANCE SHEET ARRANGEMENTS
Off-balance sheet arrangements have not had — and are notreasonably likely to have — a material effect on our current orfuture financial condition, results of operations or cash flows.Note 10: Variable Interest Entities, Note 11: Real Estate inProcess of Development and for Sale and Note 12: Short-termBorrowings and Lines of Credit in the Notes to ConsolidatedFinancial Statements contain our disclosures of:
•surety bonds,
•letters of credit and guarantees and
•information regarding variable interest entities.
ENVIRONMENTAL MATTERS, LEGALPROCEEDINGS AND OTHER CONTINGENCIES
See Note 16: Legal Proceedings, Commitments andContingencies in the Notes to Consolidated FinancialStatements.
ACCOUNTING MATTERS
CRITICAL ACCOUNTING POLICIES
Our critical accounting policies involve a higher degree ofjudgment and estimates. They also have a high degree ofcomplexity.
In accounting, we base our judgments and estimates on:
•historical experience and
•assumptions we believe are appropriate and reasonableunder current circumstances.
Actual results, however, may differ from the estimated amountswe have recorded.
Our most critical accounting policies relate to our:
•pension and postretirement benefit plans;
•potential impairments of long-lived assets;
•legal, environmental and product liability reserves; and
•depletion accounting.
Details about our other significant accounting policies — whatwe use and how we estimate — are in Note 1: Summary ofSignificant Accounting Policies in the Notes to ConsolidatedFinancial Statements.
WEYERHAEUSER COMPANY > 2010 ANNUAL REPORT AND FORM 10-K 49

PENSION AND POSTRETIREMENT BENEFIT PLANS
We sponsor several pension and postretirement benefit plansfor our employees. Key assumptions we use in accounting forthe plans include our:
•discount rate,
•expected long-term rate of return,
•anticipated trends in health care costs,
•assumed increases in salaries and
•mortality rates.
At the end of every year, we review our assumptions withexternal advisers and make adjustments as appropriate. Actualexperience that differs from our assumptions or any changes inour assumptions could have a significant effect on our financialposition, results of operations and cash flows.
Other factors that affect our accounting for the plans include:
•actual pension fund performance,
•level of lump sum distributions,
•plan changes,
•changes in plan participation or coverage and
•portfolio changes and restructuring.
This section provides more information about our:
•expected long-term rate of return,
•discount rate and
•cash contributions.
Expected Long-Term Rate of Returns
Plan assets are assets of the pension plan trusts that fund thebenefits provided under the pension plans. The expected long-term rate of return is our estimate of the long-term rate ofreturn that our plan assets will earn. After considering allavailable information at the end of 2010, we continue toassume an expected long-term rate of return of 9.5 percent.Factors we considered include:
•the 15.3 percent net compounded annual return achieved byour U.S. pension trust investment strategy over the past26 years and
•current and expected valuation levels in the global equity andcredit markets.
Our expected long-term rate of return is important indetermining the net income or expense we recognize for ourplans. Every 0.5 percent decrease in our expected long-termrate of return would increase expense or reduce a credit byapproximately:
•$19 million for our U.S. qualified pension plans and
•$3 million for our Canadian registered pension plans.
Likewise, every 0.5 percent increase in our expected long-termrate of return would decrease expense or increase a credit bythose same amounts.
The actual return on plan assets in any given year may varyfrom our expected long-term rate of return. Actual returns onplan assets affect the funded status of the plans. Differencesbetween actual returns on plan assets and the expected long-term rate of return are reflected as adjustments to cumulativeother comprehensive income (loss), a component of totalequity.
Discount Rate
Our discount rate as of December 31, 2010, is:
•5.4 percent for our U.S. pensions plans — compared with5.9 percent at December 31, 2009;
•5.0 percent for our U.S. postretirement plans — comparedwith 5.2 percent at December 31, 2009;
•5.3 percent for our Canadian pension plans — comparedwith 6.1 percent at December 31, 2009; and
•5.2 percent for our Canadian postretirement plans —compared with 6.0 percent at December 31, 2009.
We review our discount rates annually and revise them asneeded. The discount rates are selected at the measurementdate by matching current spot rates of high-quality corporatebonds with maturities similar to the timing of expected cashoutflows for benefits.
Pension and postretirement benefit expenses for 2011 will bebased on the 5.4 percent and 5.0 percent assumed discountrates for U.S. plans and the 5.3 percent and 5.2 percentassumed discount rates for the Canadian plans.
Our discount rate is important in determining the cost of ourplans. A 0.5 percent decrease in our discount rate wouldincrease expense or reduce a credit by approximately:
•$25 million for our U.S. qualified pension plans and
•$4 million for our Canadian registered pension plans.
Contributions Made and Benefits Paid
During 2010:
•We contributed approximately $150 million to our U.S.qualified pension plans.
•We contributed approximately $23 million to our U.S.nonqualified pension plans.
•We contributed approximately $6 million to our Canadianregistered and nonregistered pension plans in accordancewith minimum funding rules in accordance with the respectiveprovincial regulations. We also chose to make voluntarycontributions of approximately $54 million to our largestregistered plan during 2010.
50

•We made benefit payments of approximately $47 millionrelated to our U.S. and Canadian other postretirement plans.
During 2011:
Based on estimated year end assets and projections of planliabilities we expect to:
•have a required contribution for our U.S. qualified plan for2011 of approximately $20 million, which is payable bySeptember 15, 2012;
•be required to contribute approximately $80 million to ourCanadian registered and nonregistered pension plans;
•contribute $19 million to our U.S. nonqualified pensionplans; and
•make benefit payments of $44 million to our U.S. andCanadian other postretirement plans.
LONG-LIVED ASSETS
We review the carrying value of our long-lived assets wheneverevents or changes in circumstances indicate that the carryingvalue of the assets may not be recoverable through futureoperations. The carrying value is the amount assigned to long-lived assets in our books.
An impairment occurs when the carrying value of long-livedassets will not be recovered from future cash flows and is lessthan fair market value. Fair market value is the estimatedamount we would get if we were to sell the assets.
In determining fair market value and whether impairment hasoccurred, we are required to estimate:
•future cash flows,
•residual values and
•fair values of the assets.
Key assumptions we use in developing the estimates include:
•probability of alternative outcomes,
•product pricing,
•raw material costs,
•product sales and
•discount rate.
IMPAIRMENT OF LONG-LIVED ASSETS: REAL ESTATE
We review homebuilding long-lived assets for impairmentwhenever events or changes in circumstances indicate that thecarrying amount of the assets may not be recoverable. Werecorded long-lived homebuilding asset impairments andrelated charges attributable to Weyerhaeuser shareholders of$21 million in 2010, $261 million in 2009 and $1.1 billion in2008.
Real Estate Held for Development
Real estate held for development includes subdivisions andmaster planned communities (MPCs). MPCs typically includeseveral product segments such as residential, active adult,retail and commercial. We evaluate impairment at thesubdivision or MPC product segment level. Factors that areconsidered when evaluating a subdivision or MPC productsegment for impairment include:
•gross margins and selling costs on homes closed in recentmonths;
•projected gross margins and selling costs based on ouroperating budgets;
•competitor pricing and incentives in the same or nearbycommunities; and
•trends in average selling prices, discounts, incentives, salesvelocity and cancellations.
We update the undiscounted cash flow forecast for eachsubdivision and MPC product segment that may be impaired.The undiscounted cash flow forecasts are affected bycommunity-specific factors that include:
•estimates and timing of future revenues;
•estimates and timing of future land development, materials,labor and contractor costs;
•community location and desirability, including availability ofschools, retail, mass transit and other services;
•local economic and demographic trends regardingemployment, new jobs and taxes;
•competitor presence, product types, future competition,pricing, incentives and discounts; and
•land availability, number of lots we own or control,entitlement restrictions and alternative uses.
The carrying amount of each subdivision and MPC productsegment is written down to fair value when the forecasted cashflows are less than the carrying amount of a subdivision or MPCproduct segment. An impairment charge for a subdivision orMPC product segment is allocated to each lot in the communityin the same manner as land and development costs areallocated to each lot.
Real Estate Held for Sale
Real estate held for sale includes homes that have beencompleted and land that we intend to sell. We regularly sellland or lots that do not fit our value proposition or developmentplans.
The carrying amount of real estate held for sale is reduced tofair value less estimated costs to sell if the forecasted netproceeds are less than the carrying amount. The fair valueanalysis is affected by local market economic conditions,demographic factors and competitor actions, and is inherently
WEYERHAEUSER COMPANY > 2010 ANNUAL REPORT AND FORM 10-K 51

uncertain. Actual net proceeds can differ from the estimates.The carrying amount of real estate held for sale is evaluatedquarterly.
Market Approach
We use the market approach to determine fair value of realestate held for development and held for sale when informationfor comparable assets is available. This approach is commonlyused for our active projects where we are selling product. Wetypically use:
•sales prices for comparable assets,
•market studies,
•appraisals or
•legitimate offers.
Income Approach
We generally use the income approach to determine fair valueof real estate for our inactive projects. The income approachuses valuation techniques to convert future amounts (forexample, cash flows or earnings) to a single present amount(discounted). The fair value measurement is based on the valueindicated by current market expectations regarding those futureestimated cash inflows and outflows. We use present valuetechniques based on discounting the estimated cash flows at arate commensurate with the inherent risks associated with theassets and related estimated cash flow streams. Discountrates applied to the estimated future cash flows of ourhomebuilding assets in 2010 ranged from 15 percent to18 percent. The income approach relies on managementjudgment regarding the various inputs to the undiscounted cashflow forecasts.
CONTINGENT LIABILITIES
We are subject to lawsuits, investigations and other claimsrelated to environmental, product and other matters, and arerequired to assess the likelihood of any adverse judgments oroutcomes to these matters, as well as potential ranges ofprobable losses.
We record contingent liabilities when:
•it becomes probable that we will have to make payments and
•the amount of loss can be reasonably estimated.
Assessing probability of loss and estimating probable lossesrequires analysis of multiple factors, including:
•historical experience,
•judgments about the potential actions of third party claimantsand courts and
•recommendations of legal counsel.
In addition to contingent liabilities recorded for probable losses,we disclose contingent liabilities when there is a reasonablepossibility that an ultimate loss may occur.
While we do our best in developing our projections, recordedcontingent liabilities are based on the best informationavailable and actual losses in any future period are inherentlyuncertain. If estimated probable future losses or actual lossesexceed our recorded liability for such claims, we would recordadditional charges in other (income) expense, net. Theseexposures and proceedings can be significant and the ultimatenegative outcomes could be material to our operating results orcash flow in any given quarter or year. See Note 16: LegalProceedings, Commitments and Contingencies in the Notes toConsolidated Financial Statements for more information.
DEPLETION
We record depletion — the costs attributed to timber harvested— as trees are harvested.
To calculate our depletion rate, which is updated annually, we:
•take the total carrying cost of the timber and
•divide by the total timber volume estimated to be harvestedduring the harvest cycle.
Estimating the volume of timber available for harvest over theharvest cycle requires the consideration of the following factors:
•changes in weather patterns,
•effect of fertilizer and pesticide applications,
•changes in environmental regulations and restrictions,
•limits on harvesting certain timberlands,
•changes in harvest plans,
•scientific advancement in seedling and growing technologyand
•changes in harvest cycles.
In addition, the length of the harvest cycle varies by geographicregion and species of timber.
Depletion-rate calculations do not include estimates for:
•future silviculture — or sustainable forest management —costs associated with existing stands;
•future reforestation costs associated with a stand’s finalharvest; and
•future volume in connection with the replanting of a standsubsequent to its final harvest.
PROSPECTIVE ACCOUNTING PRONOUNCEMENTS
Currently there are no significant prospective accountingpronouncements that are expected to have an impact on us.
52

QUANTITATIVE AND QUALITATIVE DISCLOSURES ABOUT MARKET RISK
LONG-TERM DEBT OBLIGATIONS
The following summary of our long-term debt obligations includes:
•scheduled principal repayments for the next five years and after,
•weighted average interest rates for debt maturing in each of the next five years and after and
•estimated fair values of outstanding obligations.
We estimate the fair value of long-term debt based on quoted market prices we received for the same types and issues of ourdebt or on the discounted value of the future cash flows using market yields for the same type and comparable issues of debt.Changes in market rates of interest affect the fair value of our fixed-rate debt.
SUMMARY OF LONG-TERM DEBT OBLIGATIONS AS OF DECEMBER 31, 2010
DOLLAR AMOUNTS IN MILLIONS
2011 2012 2013 2014 2015 THEREAFTER TOTAL FAIR VALUE
Forest Products:
Fixed-rate debt $ — $ 529 $ 340 $ — $ — $3,847 $4,716 $5,029
Average interest rate — 6.75% 7.33% — — 7.44% 7.35% N/A
Real Estate:
Fixed-rate debt $ 33 $ 188 $ 69 $ 15 $ — $ 20 $ 325 $ 335
Average interest rate 7.43% 6.11% 6.14% 6.22% — 6.49% 6.27% N/A
Variable-rate debt $ — $ — $ — $ — $ — $ 25 $ 25 $ 25
Average interest rate — — — — — 0.27% 0.27% N/A
WEYERHAEUSER COMPANY > 2010 ANNUAL REPORT AND FORM 10-K 53

FINANCIAL STATEMENTS AND SUPPLEMENTARY DATA
REPORT OF INDEPENDENT REGISTERED PUBLIC ACCOUNTING FIRM
The Board of Directors and ShareholdersWeyerhaeuser Company:
We have audited the accompanying consolidated balance sheets of Weyerhaeuser Company and subsidiaries as of December 31,2010 and 2009, and the related consolidated statements of operations, cash flows, and changes in equity and comprehensiveincome for each of the years in the three-year period ended December 31, 2010. These consolidated financial statements are theresponsibility of the Company’s management. Our responsibility is to express an opinion on these consolidated financialstatements based on our audits.
We conducted our audits in accordance with the standards of the Public Company Accounting Oversight Board (United States).Those standards require that we plan and perform the audit to obtain reasonable assurance about whether the financialstatements are free of material misstatement. An audit includes examining, on a test basis, evidence supporting the amountsand disclosures in the financial statements. An audit also includes assessing the accounting principles used and significantestimates made by management, as well as evaluating the overall financial statement presentation. We believe that our auditsprovide a reasonable basis for our opinion.
In our opinion, the consolidated financial statements referred to above present fairly, in all material respects, the financialposition of Weyerhaeuser Company and subsidiaries as of December 31, 2010 and 2009, and the results of their operations andtheir cash flows for each of the years in the three-year period ended December 31, 2010, in conformity with U.S. generallyaccepted accounting principles.
We also have audited, in accordance with the standards of the Public Company Accounting Oversight Board (United States),Weyerhaeuser Company’s internal control over financial reporting as of December 31, 2010, based on criteria established inInternal Control — Integrated Framework issued by the Committee of Sponsoring Organizations of the Treadway Commission(COSO), and our report dated February 25, 2011 expressed an unqualified opinion on the effectiveness of the Company’s internalcontrol over financial reporting.
/s/ KPMG LLP
Seattle, WashingtonFebruary 25, 2011
54

CONSOLIDATED STATEMENT OF OPERATIONS
FOR THE THREE-YEAR PERIOD ENDED DECEMBER 31, 2010
DOLLAR AMOUNTS IN MILLIONS, EXCEPT PER-SHARE FIGURES
2010 2009 2008
Net sales and revenues $ 6,552 $ 5,528 $ 8,100
Costs of products sold 5,392 5,127 7,508
Gross Margin 1,160 401 592
Selling, general and administrative expenses 677 709 996
Research and development expenses 34 51 66
Alternative fuel mixture credits (Note 21) — (344) —
Charges for restructuring, closures and impairments (Note 19) 149 698 2,118
Other operating costs (income), net (Note 20) (168) (266) 13
Operating income (loss) 468 (447) (2,601)
Interest income and other 83 74 366
Impairment of investments and other related charges (Note 19) (3) (7) (160)
Interest expense, net of capitalized interest (452) (462) (414)
Earnings (loss) from continuing operations before income taxes 96 (842) (2,809)
Income tax benefit (Note 21) 1,187 274 900
Earnings (loss) from continuing operations 1,283 (568) (1,909)
Earnings from discontinued operations, net of income taxes (Note 4) — — 667
Net earnings (loss) 1,283 (568) (1,242)
Less: net (earnings) loss attributable to noncontrolling interests (2) 23 66
Net earnings (loss) attributable to Weyerhaeuser common shareholders $ 1,281 $ (545) $ (1,176)
Basic earnings (loss) per share attributable to Weyerhaeuser common shareholders (Note 5):
Continuing operations $ 4.00 $ (2.58) $ (8.72)
Discontinued operations — — 3.15
Net earnings (loss) per share $ 4.00 $ (2.58) $ (5.57)
Diluted earnings (loss) per share attributable to Weyerhaeuser common shareholders (Note 5):
Continuing operations $ 3.99 $ (2.58) $ (8.72)
Discontinued operations — — 3.15
Net earnings (loss) per share $ 3.99 $ (2.58) $ (5.57)
Dividends paid per share (Note 2) $ 26.61 $ 0.60 $ 2.40
Weighted average shares outstanding (in thousands) (Note 5)
Basic 319,976 211,342 211,258
Diluted 321,096 211,342 211,258
See accompanying Notes to Consolidated Financial Statements.
WEYERHAEUSER COMPANY > 2010 ANNUAL REPORT AND FORM 10-K 55

CONSOLIDATED BALANCE SHEET
ASSETS
DOLLAR AMOUNTS IN MILLIONS, EXCEPT PER-SHARE FIGURES
DECEMBER 31,2010
DECEMBER 31,2009
Forest Products
Current assets:
Cash and cash equivalents $ 1,466 $ 1,862
Short-term investments — 49
Receivables, less allowances of $8 and $12 432 370
Receivables for taxes 19 602
Receivable from pension trust (Note 9) — 146
Inventories (Note 6) 478 447
Prepaid expenses 81 82
Deferred tax assets (Note 21) 113 109
Total current assets 2,589 3,667
Property and equipment, less accumulated depreciation of $6,784 and $6,682 (Note 7) 3,217 3,611
Construction in progress 123 52
Timber and timberlands at cost, less depletion charged to disposals 4,035 4,010
Investments in and advances to equity affiliates (Note 8) 194 197
Goodwill 40 40
Deferred pension and other assets 363 756
Restricted assets held by special purpose entities (Note 10) 915 915
11,476 13,248
Real Estate
Cash and cash equivalents 1 7
Receivables, less discounts and allowances of $3 and $2 51 32
Real estate in process of development and for sale (Note 11) 517 598
Land being processed for development 974 917
Investments in and advances to equity affiliates (Note 8) 16 17
Deferred tax assets (Note 21) 266 299
Other assets 120 126
Consolidated assets not owned (Note 10) 8 6
1,953 2,002
Total assets $13,429 $15,250
See accompanying Notes to Consolidated Financial Statements.
56

CONSOLIDATED BALANCE SHEET
LIABILITIES AND EQUITY
DECEMBER 31,2010
DECEMBER 31,2009
Forest Products
Current liabilities:
Notes payable and commercial paper (Note 12) $ — $ 4
Current maturities of long-term debt (Notes 14 and 15) — 3
Accounts payable 340 317
Accrued liabilities (Note 13) 734 631
Total current liabilities 1,074 955
Long-term debt (Notes 14 and 15) 4,710 5,281
Deferred income taxes (Note 21) 366 1,538
Deferred pension, other postretirement benefits and other liabilities 1,323 2,000
Liabilities (nonrecourse to Weyerhaeuser) held by special-purpose entities (Note 10) 772 768
Commitments and contingencies (Note 16)
8,245 10,542
Real Estate
Long-term debt (Notes 14 and 15) 350 402
Other liabilities 212 252
Consolidated liabilities not owned (Note 10) 8 —
Commitments and contingencies (Note 16)
570 654
Total liabilities 8,815 11,196
Equity:
Weyerhaeuser shareholders’ interest (Notes 2, 17 and 18):
Common shares: $1.25 par value; authorized 1,360,000,000 and 400,000,000 shares; issued and outstanding:535,975,518 and 211,358,955 shares
670 264
Other capital 4,552 1,786
Retained earnings 181 2,658
Cumulative other comprehensive loss (791) (664)
Total Weyerhaeuser shareholders’ interest 4,612 4,044
Noncontrolling interests 2 10
Total equity 4,614 4,054
Total liabilities and equity $13,429 $15,250
See accompanying Notes to Consolidated Financial Statements.
WEYERHAEUSER COMPANY > 2010 ANNUAL REPORT AND FORM 10-K 57

CONSOLIDATED STATEMENT OF CASH FLOWS
FOR THE THREE-YEAR PERIOD ENDED DECEMBER 31, 2010
DOLLAR AMOUNTS IN MILLIONS
2010 2009 2008
Cash flows from operations:
Net earnings (loss) $ 1,283 $ (568) $(1,242)
Noncash charges (credits) to income:
Depreciation, depletion and amortization 503 538 689
Deferred income taxes, net (Note 21) (1,257) 66 (1,005)
Pension and other postretirement benefits (Note 9) (21) (19) (200)
Share-based compensation expense (Note 18) 24 26 47
Equity in (income) loss of equity affiliates — (3) (32)
Litigation charges — — (13)
Charges for impairment of assets (Notes 19) 117 458 2,164
Net gains on dispositions of assets and operations (Note 20) (149) (197) (1,422)
(Gain) loss on early extinguishment of debt (Note 14) 50 28 (32)
Gain on Uruguay restructuring (Note 8) — — (250)
Foreign exchange transaction (gains) losses (Note 20) (8) (41) 48
Decrease (increase) in working capital:
Receivables less allowances (67) 93 48
Receivable for taxes 583 (529) —
Inventories (30) 251 (10)
Real estate and land 5 125 232
Prepaid expenses 2 23 65
Accounts payable and accrued liabilities (116) (349) (258)
Deposits on land positions and other assets (10) 13 (2)
Pension contributions (233) (62) (28)
Other 68 (15) (98)
Net cash from operations 744 (162) (1,299)
Cash flows from investing activities:
Property and equipment (194) (187) (390)
Timberlands reforestation (36) (36) (53)
Acquisition of timberlands (56) (16) (165)
Redemption of short-term investments 49 92 553
Distributions from (investments in and advances to) equity affiliates (2) (4) (44)
Proceeds from sale of assets and operations 213 355 6,484
Purchase of short-term investments — — (701)
Repayments from (loan to) pension trust (Note 9) 146 54 (200)
Other 23 5 (25)
Cash from investing activities 143 263 5,459
Cash flows from financing activities:
Issuance of debt — 491 —
Notes, commercial paper borrowings and revolving credit facilities, net (4) — (373)
Cash dividends (Note 2) (608) (127) (507)
Change in book overdrafts 6 (30) (79)
Payments on debt (Note 14) (682) (854) (972)
Other (1) (6) (49)
Cash from financing activities (1,289) (526) (1,980)
Net change in cash and cash equivalents (402) (425) 2,180
Cash and cash equivalents at beginning of year 1,869 2,294 114
Cash and cash equivalents at end of year $ 1,467 $1,869 $ 2,294
Cash paid (received) during the year for:
Interest, net of amounts capitalized of $29 in 2010, $32 in 2009, and $104 in 2008 $ 413 $ 432 $ 457
Income taxes $ (453) $ 42 $ 1,174
See accompanying Notes to Consolidated Financial Statements.
58

CONSOLIDATED STATEMENT OF CHANGES IN EQUITY AND COMPREHENSIVE INCOMEFOR THE THREE-YEAR PERIOD ENDED DECEMBER 31, 2010
DOLLAR AMOUNTS IN MILLIONS
2010 2009 2008
Common shares:Balance at beginning of year $ 264 $ 264 $ 262Issued for exercise of stock options 1 — —Retraction or redemption of exchangeable shares — — 2Special Dividend (Note 17) 405 — —Balance at end of year $ 670 $ 264 $ 264
Exchangeable shares:Balance at beginning of year $ — $ — $ 109Retraction or redemption — — (109)Balance at end of year $ — $ — $ —
Other capital:Balance at beginning of year $ 1,786 $1,767 $ 1,609Exercise of stock options 2 — 4Retraction or redemption of exchangeable shares — — 107Special Dividend (Note 17) 2,745 — —Repurchase of common shares — (2) —Share-based compensation 21 23 51Other transactions, net (2) (2) (4)Balance at end of year $ 4,552 $1,786 $ 1,767
Retained earnings:Balance at beginning of year $ 2,658 $3,278 $ 5,014Net earnings (loss) attributable to Weyerhaeuser common shareholders 1,281 (545) (1,176)Dividends on common shares (Note 17) (3,758) (75) (560)Balance at end of year $ 181 $2,658 $ 3,278
Cumulative other comprehensive income (loss):Balance at beginning of year $ (664) $ (495) $ 987
Annual changes – net of tax:Foreign currency translation adjustments 30 91 (229)Changes in unamortized net pension and other postretirement benefit loss (Note 9) (166) (298) (1,438)Changes in unamortized prior service credit (Note 9) 9 37 182Cash flow hedge fair value adjustments — (1) 6Unrealized gains (losses) on available-for-sale securities — 2 (3)
Balance at end of year $ (791) $ (664) $ (495)Total Weyerhaeuser shareholders’ interest:
Balance at end of year $ 4,612 $4,044 $ 4,814Noncontrolling interest:
Balance at beginning of year $ 10 $ 33 $ 190Net earnings (loss) attributable to noncontrolling interest 2 (23) (66)Contributions — 2 17Distributions — (2) (67)New consolidations, de-consolidations and other transactions (10) — (41)Balance at end of year $ 2 $ 10 $ 33
Total equity:Balance at end of year $ 4,614 $4,054 $ 4,847
Comprehensive income (loss):Consolidated net earnings (loss) $ 1,283 $ (568) $(1,242)Other comprehensive income (loss):
Foreign currency translation adjustments 30 91 (229)Changes in unamortized net pension and other postretirement benefit loss, net of tax expense (benefit) of $66 in 2010,($154) in 2009, and ($851) in 2008
(166) (298) (1,438)
Changes in unamortized prior service credit, net of tax expense (benefit) of ($9) in 2010, $3 in 2009, and $106 in 2008 9 37 182Cash flow hedges:
Net derivative gains, net of tax expense of $9 in 2008 — — 14Reclassification of gains, net of tax expense of $1 in 2009, and $5 in 2008 — (1) (8)
Unrealized gains (losses) on available-for-sale securities — 2 (3)Total comprehensive income (loss) 1,156 (737) (2,724)Less: comprehensive (earnings) loss attributable to noncontrolling interest (2) 23 66
Total comprehensive income (loss) attributable to Weyerhaeuser shareholders $ 1,154 $ (714) $(2,658)
See accompanying Notes to Consolidated Financial Statements.
WEYERHAEUSER COMPANY > 2010 ANNUAL REPORT AND FORM 10-K 59

INDEX FOR NOTES TO CONSOLIDATED FINANCIAL STATEMENTS
NOTE 1: SUMMARY OF SIGNIFICANT ACCOUNTING POLICIES . . . . . . . 61
NOTE 2: REAL ESTATE INVESTMENT TRUST (REIT) CONVERSION . . . . 65
NOTE 3: BUSINESS SEGMENTS . . . . . . . . . . . . . . . . . . . . . . . . . . . . . . . . 66
NOTE 4: DISCONTINUED OPERATIONS . . . . . . . . . . . . . . . . . . . . . . . . . . 68
NOTE 5: NET EARNINGS (LOSS) PER SHARE . . . . . . . . . . . . . . . . . . . . . 69
NOTE 6: INVENTORIES . . . . . . . . . . . . . . . . . . . . . . . . . . . . . . . . . . . . . . . 70
NOTE 7: PROPERTY AND EQUIPMENT . . . . . . . . . . . . . . . . . . . . . . . . . . . 71
NOTE 8: EQUITY AFFILIATES . . . . . . . . . . . . . . . . . . . . . . . . . . . . . . . . . . 71
NOTE 9: PENSION AND OTHER POSTRETIREMENT BENEFIT PLANS . . . 72
NOTE 10: VARIABLE INTEREST ENTITIES . . . . . . . . . . . . . . . . . . . . . . . . . 84
NOTE 11: REAL ESTATE IN PROCESS OF DEVELOPMENT AND FORSALE . . . . . . . . . . . . . . . . . . . . . . . . . . . . . . . . . . . . . . . . . . . . . . 85
NOTE 12: SHORT-TERM BORROWINGS AND LINES OF CREDIT . . . . . . . . 85
NOTE 13: ACCRUED LIABILITIES . . . . . . . . . . . . . . . . . . . . . . . . . . . . . . . . 85
NOTE 14: LONG-TERM DEBT . . . . . . . . . . . . . . . . . . . . . . . . . . . . . . . . . . . 86
NOTE 15: FAIR VALUE OF FINANCIAL INSTRUMENTS . . . . . . . . . . . . . . . 86
NOTE 16: LEGAL PROCEEDINGS, COMMITMENTS ANDCONTINGENCIES . . . . . . . . . . . . . . . . . . . . . . . . . . . . . . . . . . . . 87
NOTE 17: SHAREHOLDERS’ INTEREST . . . . . . . . . . . . . . . . . . . . . . . . . . . 88
NOTE 18: SHARE-BASED COMPENSATION . . . . . . . . . . . . . . . . . . . . . . . . 90
NOTE 19: CHARGES FOR RESTRUCTURING, CLOSURES AND ASSETIMPAIRMENTS . . . . . . . . . . . . . . . . . . . . . . . . . . . . . . . . . . . . . . 94
NOTE 20: OTHER OPERATING COSTS (INCOME), NET . . . . . . . . . . . . . . . 96
NOTE 21: INCOME TAXES . . . . . . . . . . . . . . . . . . . . . . . . . . . . . . . . . . . . . 97
NOTE 22: GEOGRAPHIC AREAS . . . . . . . . . . . . . . . . . . . . . . . . . . . . . . . . . 100
NOTE 23: SELECTED QUARTERLY FINANCIAL INFORMATION(unaudited) . . . . . . . . . . . . . . . . . . . . . . . . . . . . . . . . . . . . . . . . . 101
60

NOTES TO CONSOLIDATED FINANCIALSTATEMENTS
FOR THE THREE-YEAR PERIOD ENDED DECEMBER 31, 2010
NOTE 1: SUMMARY OF SIGNIFICANT ACCOUNTINGPOLICIES
Our significant accounting policies describe:
•how we report our results,
•changes in how we report our results and
•how we account for various items.
HOW WE REPORT OUR RESULTS
We report our results using:
•consolidated financial statements,
•our business segments,
•foreign currency translation,
•estimates and
•a fiscal year that ended December 31.
We converted to a Real Estate Investment Trust (REIT) in 2010.See Note 2: Real Estate Investment Trust (REIT) Conversion formore information.
CONSOLIDATED FINANCIAL STATEMENTS
Our consolidated financial statements provide an overall view ofour results and financial condition. They include our accountsand the accounts of entities that we control, including:
•majority-owned domestic and foreign subsidiaries and
•variable interest entities in which we are the primarybeneficiary.
They do not include our intercompany transactions andaccounts, which are eliminated.
Noncontrolling Interests are presented as a separatecomponent of equity.
We account for investments in and advances to unconsolidatedequity affiliates using the equity method, with taxes provided onundistributed earnings. This means that we record earnings andaccrue taxes in the period that the earnings are recorded by ourunconsolidated equity affiliates.
We report our financial condition in two groups:
•Forest Products — our forest products-based operations,principally the growing and harvesting of timber, themanufacture, distribution and sale of forest products andcorporate governance activities; and
•Real Estate — our real estate development and constructionoperations.
Throughout these Notes to Consolidated Financial Statements,unless specified otherwise, references to “Weyerhaeuser,”“we” and “our” and refer to the consolidated company,including both Forest Products and Real Estate.
OUR BUSINESS SEGMENTS
We are principally engaged in:
•growing and harvesting timber;
•manufacturing, distributing and selling forest products; and
•developing real estate and constructing homes.
Our business segments are organized based primarily onproducts and services.
Our Business Segments and Products
SEGMENT PRODUCTS AND SERVICES
Timberlands Logs, timber, minerals, oil and gas andinternational wood products
Wood Products Softwood lumber, engineered lumber, structuralpanels, hardwood lumber and building materialsdistribution
Cellulose Fibers Pulp, liquid packaging board and an equityinterest in a newsprint joint venture
Real Estate Real estate development, construction and sales
Corporate and Other Certain gains or charges that are not related toan individual operating segment andtransportation operations
Containerboard,Packaging and Recycling(sold in 2008)
Containerboard, packaging and recycling
We also transfer raw materials, semifinished materials and endproducts among our business segments. Because of thisintracompany activity, accounting for our business segmentsinvolves:
•allocating joint conversion and common facility costsaccording to usage by our business segment product linesand
•pricing products transferred between our business segmentsat current market values.
FOREIGN CURRENCY TRANSLATION
Local currencies are the functional currencies for certain of ouroperations outside the U.S. We translate foreign currencies intoU.S. dollars in two ways:
•assets and liabilities — at the exchange rates in effect as ofour balance sheet date; and
•revenues and expenses — at average monthly exchangerates throughout the year.
WEYERHAEUSER COMPANY > 2010 ANNUAL REPORT AND FORM 10-K 61
ESTIMATES
We prepare our financial statements according to U.S. generallyaccepted accounting principles (U.S. GAAP). This requires us tomake estimates and assumptions during our reporting periodsand at the date of our financial statements. The estimates andassumptions affect our:
•reported amounts of assets, liabilities and equity;
•disclosure of contingent assets and liabilities; and
•reported amounts of revenues and expenses.
While we do our best in preparing these estimates, actualresults can and do differ from those estimates andassumptions.
OUR FISCAL YEAR
In December 2008, our board of directors amended our bylawsto adopt a December 31 fiscal year-end. Before 2008, ourfiscal year ended on the last Sunday of the calendar year. As aresult, our fiscal year ended December 31, 2008 had367 days.
CHANGES IN HOW WE REPORT OUR RESULTS
Changes in how we report our results come from:
•accounting changes made upon our adoption of newaccounting guidance and
•our reclassification of certain balances and results from prioryears to make them consistent with our current reporting.
In 2010, we combined the operating results and cash flows ofForest Products businesses and Real Estate in theConsolidated Statements of Operations and Cash Flows for allperiods presented. This was done to simplify our reporting andhad no effect on our consolidated results of operations or cashflows. We have not combined Forest Products and Real Estateon our Consolidated Balance Sheet. This is because our RealEstate business has an unclassified balance sheet as a resultof the nature of their operations.
ACCOUNTING CHANGES WE IMPLEMENTED IN 2010
Variable Interest Entities (VIE)
In June 2009, the Financial Accounting Standards Board (FASB)issued guidance that amends existing consolidation guidancefor VIEs by:
•changing the required approach for identifying the primarybeneficiary of a VIE by replacing the quantitative-based risksand rewards calculation with a qualitative approach thatfocuses on identifying who has the power to direct activitiesthat significantly affect an entity’s economic performance;
•requiring additional reconsideration events when determiningwhether an entity is a VIE to include loss of power from votingor similar rights to direct the activities that significantly affectthe entity’s economic performance;
•requiring ongoing assessment of whether an enterprise is theprimary beneficiary of a VIE; and
•requiring additional disclosures over involvement with a VIE.
Our adoption of this guidance in first quarter 2010 did not havea material effect on our results of operations, financial positionor cash flows.
RECLASSIFICATIONS
We have reclassified certain balances and results from prioryears to be consistent with our 2010 reporting. Ourreclassifications had no effect on net earnings (loss) orWeyerhaeuser shareholders’ interest.
HOW WE ACCOUNT FOR VARIOUS ITEMS
This section provides information about how we account forcertain key items related to:
•capital investments,
•financing our business and
•operations.
ITEMS RELATED TO CAPITAL INVESTMENTS
Key items related to accounting for capital investments pertainto property and equipment, timber and timberlands, impairmentof long-lived assets and goodwill.
Property and Equipment
We maintain property accounts on an individual asset basis.Here’s how we handle major items:
•Improvements to and replacements of major units of propertyare capitalized.
•Maintenance, repairs and minor replacements are expensed.
•Depreciation is calculated using a straight-line method atrates based on estimated service lives.
•Logging railroads and truck roads are generallyamortized — as timber is harvested — at rates based on thevolume of timber estimated to be removed.
•Cost and accumulated depreciation of property sold or retiredare removed from the accounts and the gain or loss isincluded in earnings.
Timber and Timberlands
We carry timber and timberlands at cost less depletion chargedto disposals. Depletion refers to the carrying value of timberthat is harvested, lost as a result of casualty, or sold.
62

Key activities affecting how we account for timber andtimberlands include:
•reforestation,
•depletion and
•forest management in Canada.
Reforestation. Generally, we capitalize initial site preparationand planting costs as reforestation. We transfer reforestationto a merchantable timber classification when the timber isconsidered harvestable. That generally occurs after:
•15 years in the South and
•30 years in the West.
Generally, we expense costs after the first planting as they areincurred or over the period of expected benefit. These costsinclude:
•fertilization,
•vegetation and insect control,
•pruning and precommercial thinning,
•property taxes and
•interest.
Accounting practices for these costs do not change whentimber becomes merchantable and harvesting starts.
Depletion. To determine depletion rates, we divide the netcarrying value of timber by the related volume of timberestimated to be available over the growth cycle. To determinethe growth cycle volume of timber, we consider:
•regulatory and environmental constraints,
•our management strategies,
•inventory data improvements,
•growth rate revisions and recalibrations and
•known dispositions and inoperable acres.
We include the cost of timber harvested in the carrying valuesof raw materials and product inventories. As these inventoriesare sold to third parties, we include them in the cost ofproducts sold.
Forest management in Canada. We hold forest managementlicenses in various Canadian provinces that are:
•granted by the provincial governments;
•granted for initial periods of 15 to 25 years; and
•renewable every five years provided we meet reforestation,operating and management guidelines.
Calculation of the fees we pay on the timber we harvest:
•varies from province to province,
•is tied to product market pricing and
•depends upon the allocation of land managementresponsibilities in the license.
Impairment of Long-Lived Assets
We review long-lived assets — including certain identifiableintangibles — for impairment whenever events or changes incircumstances indicate that the carrying amount of the assetsmay not be recoverable. Impaired assets held for use arewritten down to fair value. Impaired assets held for sale arewritten down to fair value less cost to sell. We determine fairvalue based on:
•appraisals,
•market pricing of comparable assets,
•discounted value of estimated cash flows from the asset and
•replacement values of comparable assets.
Goodwill
Goodwill is the purchase price minus the fair value of netassets acquired when we buy another entity. We assessgoodwill for impairment:
•using a fair-value-based approach and
•at least annually — at the beginning of the fourth quarter.
In 2010 the fair value of the reporting unit with goodwillsubstantially exceeded its carrying value.
Fair Value Measurements
We use a fair value hierarchy in accounting for certainnonfinancial assets and liabilities including:
•long-lived assets (asset groups) measured at fair value for animpairment assessment,
•reporting units measured at fair value in the first step of agoodwill impairment test,
•nonfinancial assets and nonfinancial liabilities measured atfair value in the second step of a goodwill impairmentassessment and
•asset retirement obligations initially measured at fair value.
The fair value hierarchy is based on inputs to valuationtechniques that are used to measure fair value that are eitherobservable or unobservable. Observable inputs reflectassumptions market participants would use in pricing an assetor liability based on market data obtained from independentsources while unobservable inputs reflect a reporting entity’spricing based upon its own market assumptions.
The fair value hierarchy consists of the following three levels:
•Level 1 — Inputs are quoted prices in active markets foridentical assets or liabilities.
•Level 2 — Inputs are:– quoted prices for similar assets or liabilities in an active
market;– quoted prices for identical or similar assets or liabilities in
markets that are not active; or
WEYERHAEUSER COMPANY > 2010 ANNUAL REPORT AND FORM 10-K 63

– inputs other than quoted prices that are observable andmarket-corroborated inputs, which are derived principallyfrom or corroborated by observable market data.
•Level 3 — Inputs are derived from valuation techniques inwhich one or more significant inputs or value drivers areunobservable.
ITEMS RELATED TO FINANCING OUR BUSINESS
Key items related to financing our business include financialinstruments, derivatives, cash and cash equivalents andaccounts payable.
Financial Instruments
We estimate the fair value of financial instruments whereappropriate. The assumptions we use — including the discountrate and estimates of cash flows — can significantly affect ourfair-value amounts. Our fair values are estimates and may notmatch the amounts we would realize upon sale or settlement ofour financial positions.
Cash and Cash Equivalents
Cash equivalents are investments with original maturities of 90days or less. We state cash equivalents at cost, whichapproximates market.
Accounts Payable
Our banking system replenishes our major bank accounts dailyas checks we have issued are presented for payment. As aresult, we have negative book cash balances due tooutstanding checks that have not yet been paid by the bank.These negative balances are included in accounts payable onour Consolidated Balance Sheet. Changes in these negativecash balances are reported as financing activities in ourConsolidated Statement of Cash Flows. Negative book cashbalances were:
•$45 million at December 31, 2010; and
•$55 million at December 31, 2009.
ITEMS RELATED TO OPERATIONS
Key items related to operations include revenue recognition,inventories, shipping and handling costs, income taxes, share-based compensation, pension and other postretirement plans,and environmental remediation.
Revenue Recognition
Forest Products operations generally recognize revenue uponshipment to customers. For certain export sales, revenue isrecognized when title transfers at the foreign port.
Real Estate operations recognize revenue when:
•closings have occurred,
•required down payments have been received,
•title and possession have been transferred to the buyer and
•all other criteria for sale and profit recognition have beensatisfied.
Inventories
We state inventories at the lower of cost or market. Costincludes labor, materials and production overhead. We useLIFO — the last-in, first-out method — for certain of ourdomestic raw material, in-process and finished goodsinventories. Our LIFO inventories were:
•$159 million at December 31, 2010; and
•$118 million at December 31, 2009.
We use FIFO — the first-in, first-out method — or movingaverage cost methods for the balance of our domestic rawmaterials and product inventories as well as for all material andsupply inventories and all foreign inventories. If we used FIFOfor all inventories, our stated product inventories would havebeen higher by:
•$121 million at December 31, 2010; and
•$127 million at December 31, 2009.
Shipping and Handling Costs
We classify shipping and handling costs in the costs ofproducts sold in our Consolidated Statement of Operations.
Income Taxes
We account for income taxes under the asset and liabilitymethod. Unrecognized tax benefits represent potential futurefunding obligations to taxing authorities if uncertain taxpositions the company has taken on previously filed tax returnsare not sustained. In accordance with the company’saccounting policy, accrued interest and penalties related tounrecognized tax benefits are recognized as a component ofincome tax expense.
We recognize deferred tax assets and liabilities to reflect:
•future tax consequences due to differences between thecarrying amounts for financial purposes and the tax bases ofcertain items and
•operating loss and tax credit carryforwards.
To measure deferred tax assets and liabilities, we:
•determine when the differences between the carryingamounts and tax bases of affected items are expected to berecovered or resolved and
•use enacted tax rates expected to apply to taxable income inthose years.
64

Share-Based Compensation
We measure the fair value of share-based awards on the datesthey are granted or modified. These measurements establishthe cost of the share-based awards for accounting purposes.We then recognize the cost of share-based awards in ourConsolidated Statement of Operations over each employee’srequired service period. Note 18: Share-Based Compensationprovides more information about our share-basedcompensation.
Pension and Other Postretirement Benefit Plans
We recognize the overfunded or underfunded status of ourdefined benefit pension and other postretirement plans on ourConsolidated Balance Sheet and recognize changes in thefunded status through comprehensive income (loss) in the yearin which the changes occur.
Actuarial valuations determine the amount of the pension andother postretirement benefit obligations and the net periodicbenefit cost we recognize. The net periodic benefit costincludes:
•cost of benefits provided in exchange for employees’ servicesrendered during the year;
•interest cost of the obligations;
•expected long-term return on fund assets;
•gains or losses on plan settlements and curtailments;
•amortization of prior service costs and plan amendmentsover the average remaining service period of the activeemployee group covered by the plans; and
•amortization of cumulative unrecognized net actuarial gainsand losses — generally in excess of 10 percent of thegreater of the accrued benefit obligation or market-relatedvalue of plan assets at the beginning of the year — over theaverage remaining service period of the active employeegroup covered by the plans.
Pension plans. We have pension plans covering most of ouremployees. Determination of benefits differs for salaried, hourlyand union employees:
•Salaried employee benefits are based on each employee’shighest monthly earnings for five consecutive years duringthe final 10 years before retirement.
•Hourly and union employee benefits generally are statedamounts for each year of service.
•Union employee benefits are set through collective-bargainingagreements.
We contribute to our U.S. and Canadian pension plansaccording to established funding standards. The fundingstandards for the plans are:
•U.S. pension plans — according to the Employee RetirementIncome Security Act of 1974; and
•Canadian pension plans — according to the applicableProvincial Pension Benefits Act and the Income Tax Act.
Postretirement benefits other than pensions. We providecertain postretirement health care and life insurance benefitsfor some retired employees. In some cases, we pay a portion ofthe cost of the benefit. Note 9: Pension and OtherPostretirement Benefit Plans provides additional informationabout changes made in our postretirement benefit plans during2010 and 2009.
Environmental Remediation
We accrue losses associated with environmental remediationobligations when such losses are probable and reasonablyestimable. Future expenditures for environmental remediationobligations are not discounted to their present value.Recoveries of environmental remediation costs from otherparties are recorded as assets when the recovery is deemedprobable and does not exceed the amount of losses previouslyrecorded.
NOTE 2: REAL ESTATE INVESTMENT TRUST (REIT)CONVERSION
We implemented certain technical changes necessary toconvert to a REIT that were effective January 1, 2009. Thisincluded changing our fiscal year end to a calendar year endand a number of revisions to our systems and businessprocesses. We also restructured the company so that ournon-REIT qualifying assets are held in a wholly-owned subsidiaryalso known as a taxable REIT subsidiary (TRS), while our parentcompany continues to hold the majority of our timber assets.
Our board of directors has determined that conversion to a REITbest supports our strategic direction. For tax purpose, thischange was effective January 1, 2010.
We expect to derive most of our REIT income from investmentsin timberlands, including the sale of standing timber throughpay-as-cut sales contracts. REIT income can be distributed toshareholders without first paying corporate level tax,substantially eliminating the double taxation on income. Asignificant portion of our timberland segment earnings willreceive this favorable tax treatment. We will, however, besubject to corporate taxes on built-in-gains (the excess of fairmarket value over tax basis at January 1, 2010) on sales ofreal property (other than standing timber) held by the REITduring the first 10 years following the REIT conversion. We alsowill continue to be required to pay federal corporate incometaxes on earnings of our TRS, which principally includes ourmanufacturing businesses, our real estate developmentbusiness and our non-qualified timberland segment income.
At the annual meeting of shareholders on April 15, 2010, ourshareholders approved amendments to our articles of
WEYERHAEUSER COMPANY > 2010 ANNUAL REPORT AND FORM 10-K 65

incorporation to increase the number of shares of commonstock we are authorized to issue from 400 million shares to1.36 billion shares and to impose ownership and transferrestrictions. These restrictions limit the number of shares anyperson or entity may own, including those attributed to it underthe attribution provisions of the Internal Revenue Code, otherthan an excepted holder, to no more than 9.9 percent of theoutstanding shares of any class or series of Weyerhaeuserequity shares. These amendments were filed and becameeffective when our board of directors declared the SpecialDividend. Shareholders also approved the issuance of up to960 million shares of common stock to pay out the SpecialDividend. On July 13, 2010, we filed a prospectus supplementwith the SEC covering the issuance of the additional shares ofstock.
To implement our decision to be taxed as a REIT, we distributedto our shareholders our accumulated earnings and profits,determined under federal income tax provisions, as a “SpecialDividend.” The Special Dividend of $5.6 billion was paidSeptember 1, 2010, and included the regular quarterly dividendof approximately $11 million. At the election of eachshareholder, the Special Dividend was paid in cash orWeyerhaeuser common shares. The aggregate amount of cashdistributed was $560 million and the number of commonshares issued was approximately 324 million.
The stock portion of the Special Dividend is treated as theissuance of new shares for accounting purposes and affects
our earnings (loss) per share only for periods after thedistribution. Prior periods are not restated. The requiredtreatment results in earnings (loss) per share that is less thanwould have been the case had the common shares not beenissued. See Note 5: Net Earnings (Loss) Per Share for proforma results giving effect to the common stock distribution fordiluted earnings per common share as if the common stockdistribution had occurred at the beginning of each period.
During 2010, following the payout of the Special Dividend, wereversed certain deferred income tax liabilities primarily relatingto temporary differences on timber assets, which resulted in abenefit in the Consolidated Statement of Operations of$1,064 million. Our 2010 effective income tax rate alsodecreased due to lower taxes on REIT qualifying timberlandsincome. See Note 21: Income Taxes for more information.
NOTE 3: BUSINESS SEGMENTS
Our business segments and how we account for thosesegments are discussed in Note 1: Summary of SignificantAccounting Policies. This note provides key financial data bybusiness segment.
DISCONTINUED OPERATIONS
We have disposed of various businesses and operations thatare included in the segment results below. See Note 4:Discontinued Operations for information regarding ourdiscontinued operations and the segments affected.
KEY FINANCIAL DATA BY BUSINESS SEGMENT
Sales, Revenues and Contribution (Charge) to Earnings
DOLLAR AMOUNTS IN MILLIONS
TIMBERLANDS WOODPRODUCTS
CELLULOSEFIBERS
REALESTATE
CORPORATEAND
OTHER
CONTAINERBOARDPACKAGING AND
RECYCLING
DISCONTINUEDOPERATIONS
ANDINTERSEGMENT
ELIMINATIONS
CONSOLIDATED
Sales to and revenues from unaffiliated customers
2010 $ 874 $ 2,591 $1,911 $ 923 $ 253 $ — $ — $6,552
2009 $ 714 $ 2,234 $1,511 $ 904 $ 165 $ — $ — $5,528
2008 $ 899 $ 3,768 $1,765 $ 1,408 $ 392 $3,169 $(3,301) $8,100
Intersegment sales
2010 $ 603 $ 74 $ — $ — $ 19 $ — $ (696) $ —
2009 $ 537 $ 64 $ — $ — $ 12 $ — $ (613) $ —
2008 $1,034 $ 166 $ 7 $ — $ 34 $ 2 $(1,243) $ —
Contribution (charge) to earnings (continuing and discontinued operations)
2010 $ 282 $ (310) $ 412 $ 91 $ 71 $ — $ — $ 546
2009 $ 338 $ (733) $ 444 $ (299) $ (107) $ — $ — $ (357)
2008 $ 384 $(1,547) $ 147 $(1,357) $1,558 $ 204 $ — $ (611)
66

During 2010 we changed the methodology for allocating corporate costs to the business segments. The amounts for previousyears were not reclassified. Had these years been presented using the same method, net contribution (charge) to earnings wouldhave increased or decreased as follows:
Change in Contribution (Charge) to Earnings Resulting from Change in Allocation of Corporate Costs
DOLLAR AMOUNTS IN MILLIONS
TIMBERLANDS WOODPRODUCTS
CELLULOSEFIBERS
REALESTATE
CORPORATEAND
OTHER
CONTAINERBOARDPACKAGING AND
RECYCLING
DISCONTINUEDOPERATIONS
ANDINTERSEGMENTELIMINATIONS
CONSOLIDATED
Change in contribution (charge) to earnings (continuing and discontinued operations)
2009 $(16) $(32) $(16) $(3) $ 67 $ — $ — $ —
2008 $(19) $(55) $(21) $(9) $132 $(28) $ — $ —
Management evaluates segment performance based on the contributions to earnings of the respective segments. An analysisand reconciliation of our business segment information to the consolidated financial statements follows:
Reconciliation of Contribution (Charge) to Earnings to Net Earnings
DOLLAR AMOUNTS IN MILLIONS
2010 2009 2008
Total contribution (charge) to earnings $ 546 $(357) $ (611)
Interest expense, net of capitalized interest (continuing and discontinued operations) (452) (462) (415)
Income (loss) before income taxes (continuing and discontinued operations) 94 (819) (1,026)
Income tax benefit (loss) (continuing and discontinued operations) 1,187 274 (150)
Net earnings (loss) attributable to Weyerhaeuser common shareholders $1,281 $(545) $(1,176)
WEYERHAEUSER COMPANY > 2010 ANNUAL REPORT AND FORM 10-K 67

Additional Financial Information
DOLLAR AMOUNTS IN MILLIONS
TIMBERLANDS WOODPRODUCTS
CELLULOSEFIBERS
REALESTATE
CORPORATEAND OTHER
CONTAINERBOARDPACKAGING AND
RECYCLING
DISCONTINUEDOPERATIONS
ANDINTERSEGMENT
ELIMINATIONS
CONSOLIDATED
Depreciation, depletion and amortization
2010 $ 118 $ 177 $ 145 $ 16 $ 47 $ — $ — $ 503
2009 $ 124 $ 198 $ 142 $ 17 $ 57 $ — $ — $ 538
2008 $ 157 $ 245 $ 148 $ 18 $ 61 $ 60 $ (63) $ 626
Net pension and postretirement credit (cost)
2010 $ (6) $ (22) $ (11) $ (3) $ 73 $ — $ — $ 31
2009 $ — $ (5) $ (6) $ 4 $ 141 $ — $ — $ 134
2008 $ (2) $ (13) $ (9) $ 3 $ 165 $ (10) $ — $ 134
Charges for restructuring, closures and impairments(1)
2010 $ 2 $ 114 $ — $ 21 $ 12 $ — $ — $ 149
2009 $ 27 $ 177 $ 3 $ 296 $ 195 $ — $ — $ 698
2008 $ — $ 891 $ 94 $ 989 $ 144 $ 13 $ (13) $ 2,118
Equity in income (loss) of equity affiliates and unconsolidated entities
2010 $ — $ — $ (6) $ 12 $ (6) $ — $ — $ —
2009 $ — $ — $ 2 $ 8 $ (7) $ — $ — $ 3
2008 $ (2) $ (5) $ 17 $ 21 $ 10 $ — $ (5) $ 36
Capital expenditures
2010 $ 72 $ 33 $ 123 $ 5 $ 1 $ — $ — $ 234
2009 $ 83 $ 57 $ 61 $ 8 $ 14 $ — $ — $ 223
2008 $ 109 $ 101 $ 54 $ 18 $ 61 $100 $ — $ 443
Investments in and advances to equity affiliates and unconsolidated entities
2010 $ — $ — $ 194 $ 16 $ — $ — $ — $ 210
2009 $ — $ — $ 197 $ 17 $ — $ — $ — $ 214
2008 $ — $ 1 $ 200 $ 30 $ 1 $ — $ — $ 232
Total assets
2010 $4,731 $1,453 $2,365 $1,953 $2,927 $ — $ — $13,429
2009 $4,712 $1,724 $2,255 $2,002 $4,557 $ — $ — $15,250
2008 $4,917 $2,104 $2,363 $2,615 $6,502 $ — $(1,806) $16,695
(1) See Note 19: Charges for restructuring, closures and asset impairments for more information
NOTE 4: DISCONTINUED OPERATIONSWe have made certain reclassifications in our consolidatedfinancial statements to reflect discontinued operations.
OPERATIONS INCLUDED IN DISCONTINUED OPERATIONS
Discontinued Operations
Operations Disposition Segmentwhere
activities wereincluded
Pretax gain onsale
Containerboard,Packaging and Recyclingbusiness
Sold 2008 —third quarter
Containerboard,Packaging andRecycling
$1.2 billiongain inCorporate andOther
Australian operations Sold 2008 —third quarter
Corporate andOther
$218 milliongain inCorporate andOther
DISCONTINUED OPERATIONS DIVESTED
Containerboard, Packaging and Recycling Business
On August 4, 2008, we sold our Containerboard, Packaging andRecycling business to International Paper Company. Operatingassets included in the transaction were:
•nine containerboard mills with total capacity of 6.3 milliontons,
•72 packaging locations with total capacity of 99.4 billionsquare feet,
•10 specialty packaging plants,
•four kraft bag and sack locations with a total capacity of199,000 tons and
•19 recycling facilities.
68

The Containerboard, Packaging and Recycling assets wereclassified as assets held for sale, and depreciation of theassets was suspended as of March 15, 2008, the date thepurchase and sale agreement was signed.
We received $6.1 billion in proceeds from the sale and we used$2.1 billion of these proceeds to pay down outstanding debtduring the second half of 2008. We recorded a $1.2 billionpretax gain in our Corporate and Other segment and recordedtax expense of $887 million, resulting in a net gain of$288 million. The effective tax rate on the transaction is higherthan our overall effective tax rate primarily due to the write-offof approximately $1.25 billion of goodwill in connection with thesale. Goodwill is not deductible for income tax purposes, andno tax benefit has been recorded on the write-off of goodwill.
Australian Operations
In July 2008, we sold the manufacturing operations and thedistribution business of our Weyerhaeuser Australia Group andour 50 percent interest in the Green Triangle Forest Productstimberlands business in two separate transactions. The assetswe sold were:
•Pine Solutions Australia — sales and distribution operations;
•Weyerhaeuser Australia — two sawmills and associatedoperations; and
•Green Triangle Forest Products — two sawmills, a pinemolding operation, an export chip business and timberlandsoperations including approximately 20,000 hectares(approximately 50,000 acres) of plantation pine forest.
The Australian assets were classified as assets held for saleand depreciation of the assets was suspended as of June 19,2008, the date the transactions were approved by our board ofdirectors.
We classified the $342 million aggregate cash proceeds fromthese transactions in the accompanying ConsolidatedStatement of Cash Flows as:
•$306 million in proceeds from sale of business andoperating facilities and
•$36 million in distributions from equity affiliates.
We recorded a $218 million pretax gain in the Corporate andOther segment and recorded tax expense of $58 million,resulting in a net gain of $160 million during 2008.
NET EARNINGS FROM DISCONTINUED OPERATIONS
Sales, Earnings and Gains from Discontinued Operations
DOLLAR AMOUNTS IN MILLIONS
2008
Net sales $3,301
Income from operations $ 320
Interest expense and other (1)
Equity in income of affiliates 5
Income tax expense (105)
Net earnings from operations 219
Net gain on sale (after-tax):
Containerboard, Packaging and Recycling business 288
Australian operations 160
Net earnings from discontinued operations $ 667
NOTE 5: NET EARNINGS (LOSS) PER SHARE
Our basic earnings (loss) per share attributable toWeyerhaeuser shareholders for the last three years were:
•$4.00 in 2010,
•$(2.58) in 2009 and
•$(5.57) in 2008.
Our diluted earnings (loss) per share attributable toWeyerhaeuser shareholders for the last three years were:
•$3.99 in 2010,
•$(2.58) in 2009 and
•$(5.57) in 2008.
This note discloses:
•how we calculate basic and diluted net earnings pershare and
•our shares with an antidilutive effect.
HOW WE CALCULATE BASIC AND DILUTED NET EARNINGSPER SHARE
“Basic earnings” per share is net earnings divided by theweighted average number of our outstanding common andexchangeable shares. As of year-end 2008, we no longer haveexchangeable shares outstanding. More information about thiscan be found in Note 17: Shareholders’ Interest.
“Diluted earnings” per share is net earnings divided by the sumof the:
•weighted average number of our outstanding common andexchangeable shares and
•the effect of our outstanding dilutive potentialcommon shares.
WEYERHAEUSER COMPANY > 2010 ANNUAL REPORT AND FORM 10-K 69

Dilutive potential common shares may include:
•outstanding stock options,
•restricted stock units or
•performance share units.
We use the treasury stock method to calculate the effect of ouroutstanding dilutive potential common shares.
On September 1, 2010 we paid a Special Dividend inassociation with our REIT conversion. See Note 2: Real EstateInvestment Trust (REIT) Conversion. Reflected below are proforma results giving effect to the common stock distribution fordiluted earnings per common share for each of the last threeyears, as if the common stock distribution of approximately324 million shares had occurred at the beginning of each year.
DOLLAR AMOUNTS IN MILLIONS, EXCEPT PER SHARE FIGURES
2010 2009 2008
Net earnings (loss) attributable toWeyerhaeuser commonshareholders
$ 1,281 $ (545) $ (1,176)
Diluted earnings (loss) per share:
As reported $ 3.99 $ (2.58) $ (5.57)
Pro forma $ 2.39 $ (1.02) $ (2.20)
Diluted weighted average sharesoutstanding (in thousands)
As reported 321,096 211,342 211,258
Pro forma 537,013 535,661 535,577
SHARES EXCLUDED FROM DILUTIVE EFFECT
The following shares were not included in the computation ofdiluted earnings (loss) per share because they were antidilutive.However, some or all of these shares may be dilutive potentialcommon shares in future periods.
Potential Shares Not Included in the Computation of DilutedEarnings per Share
2010 2009 2008
Options 26,385,128 11,720,674 10,312,819
Restricted stock units — 705,866 713,563
Performance share units — 218,594 496,343
The increase in options in 2010 is primarily due to our Long-Term Incentive Compensation Plan requiring outstanding stockoptions to be adjusted as a result of the Special Dividend. SeeNote 18: Share-Based Compensation for more information onthis adjustment.
SHARE REPURCHASE PROGRAM
In December 2008, we announced a share repurchase programunder which we are authorized to repurchase up to$250 million of outstanding common shares. We repurchased atotal of 66,691 shares of common stock for approximately$2 million under the program during 2009. All common stockpurchases under the program were made in open-markettransactions. We have not repurchased any more commonshares since 2009.
NOTE 6: INVENTORIES
Forest Products inventories include raw materials,work-in-process and finished goods.
Inventories as of the End of Our Last Two Years
DOLLAR AMOUNTS IN MILLIONS
DECEMBER 31,2010
DECEMBER 31,2009
Logs and chips $ 66 $ 61
Lumber, plywood, panels andengineered lumber
164 167
Pulp and paperboard 157 114
Other products 79 97
Materials and supplies 133 135
Subtotal 599 574
Less LIFO reserve (121) (127)
Total $ 478 $ 447
The LIFO inventory reserve applies to major inventory productsheld at our U.S. domestic locations. These inventory productsinclude grade and fiber logs, chips, lumber, plywood, orientedstrand board, hardwood lumber, pulp and paperboard. We alsohave the same inventory products outside the U.S. based uponthe FIFO method.
HOW WE ACCOUNT FOR OUR INVENTORIES
The Inventories section of Note 1: Summary of SignificantAccounting Policies provides details about how we account forour inventories.
70

NOTE 7: PROPERTY AND EQUIPMENT
Forest Products property and equipment includes land,buildings and improvements, machinery and equipment, roadsand other items.
Carrying Value of Forest Products Property and Equipment andEstimated Service Lives
DOLLAR AMOUNTS IN MILLIONS
RANGE OF LIVESDECEMBER 31,
2010DECEMBER 31,
2009
Property andequipment, atcost:
Land N/A $ 162 $ 182
Buildings andimprovements
10–40 1,572 1,680
Machinery andequipment
2–25 7,372 7,550
Roads 10–20 551 547
Other 3–10 344 334
Total cost 10,001 10,293
Allowance fordepreciation andamortization
(6,784) (6,682)
Property andequipment, net
$ 3,217 $ 3,611
SERVICE LIVES AND DEPRECIATION
Buildings and improvements for Forest Products property andequipment have estimated lives that are generally at either thehigh end or low end of the range from 10 years to 40 years,depending on the type and performance of construction.
The maximum service lives for Forest Products machinery andequipment varies among our operations:
•Timberlands — 15 years;
•Wood products manufacturing facilities — 20 years; and
•Primary pulp mills — 25 years.
Forest Products depreciation expense was:
•$399 million in 2010,
•$425 million in 2009 and
•$541 million in 2008.
NOTE 8: EQUITY AFFILIATES
We have investments in unconsolidated equity affiliates overwhich we have significant influence that we account for usingthe equity method with taxes provided on undistributedearnings. We record earnings and accrue taxes in the periodthat the earnings are recorded by the affiliates.
This note provides information about our:
•Forest Products equity affiliates and
•Real Estate equity affiliates.
FOREST PRODUCTS EQUITY AFFILIATES
Following is a list of Forest Products equity affiliates as ofDecember 31, 2010:
Details About Our Equity Affiliates
AFFILIATE WHAT IT DOESOUR
OWNERSHIP
North Pacific PaperCorporation (NORPAC)
Owns and operates a newsprintmanufacturing facility in Longview,Washington
50 percent
Catchlight Energy Researching and developingtechnology for converting cellulose-based biomass into economical,low-carbon biofuels
50 percent
Liaison Technologies Inc. Provides integration and datamanagement services across awide variety of industriesworldwide
16 percent
Uruguay
In April 2008, we completed the process of restructuring ourownership interests in Uruguay and partitioned the timberlandand other assets formerly owned through a joint venture. Aspart of the partitioning, we contributed $23 million, net of cashacquired, to obtain full ownership of a plywood mill formerlyowned through the joint venture. These assets and the resultsof their operations were consolidated in the accompanyingfinancial statements as of April 2008. An estimated noncashrestructuring gain of $101 million was recorded in ourCorporate and Other segment during second quarter 2008. Anadditional $149 million gain was recorded in fourth quarter2008 when the valuation of the partitioned assets wasfinalized. There was no tax provision on the gain due to aforestry exemption from income taxes in Uruguay, and the factthat the assets are considered indefinitely invested.
Australia
In July 2008, the manufacturing operations held within our RIIWeyerhaeuser World Timberfund L.P. joint venture were sold.We received a cash distribution of $36 million and recorded apretax gain of $6 million on this sale. Also in July, we sold ourinterest in the joint venture. We received net cash proceeds of$77 million and recorded a pretax gain on the sale of$78 million. These results are included in discontinuedoperations in the Consolidated Statement of Operations.
WEYERHAEUSER COMPANY > 2010 ANNUAL REPORT AND FORM 10-K 71

Unconsolidated Financial Information of Forest ProductsEquity Affiliates
Aggregated assets, liabilities and operating results of theentities that we accounted for as equity affiliates are providedbelow.
Assets and Liabilities of Forest Products Equity Affiliates
DOLLAR AMOUNTS IN MILLIONS
DECEMBER 31,2010
DECEMBER 31,2009
Current assets $105 $ 99
Noncurrent assets $494 $504
Current liabilities $ 52 $ 35
Noncurrent liabilities $161 $168
Operating Results of Forest Products Equity Affiliates
DOLLAR AMOUNTS IN MILLIONS
2010 2009 2008
Net sales and revenues $530 $474 $639
Operating income (loss) $ (20) $ (12) $ 68
Net income (loss) $ (15) $ (16) $ 35
Doing Business with Forest Products Affiliates
Doing business with our affiliates varies by the individualaffiliate. We:
•provide a varying mix of goods and services to some of ouraffiliates and
•buy finished products from some of our affiliates.
The goods and services we provide include:
•raw materials,
•management and marketing services,
•support services and
•shipping services.
In addition, we manage cash for NORPAC under a servicesagreement. Weyerhaeuser holds the cash and records apayable balance to NORPAC, which is included in accountspayable in the accompanying Consolidated Balance Sheet. Wehad the following payable balances to NORPAC:
•$57 million at December 31, 2010; and
•$61 million at December 31, 2009.
REAL ESTATE EQUITY AFFILIATES
Our Real Estate segment holds equity investments in five realestate partnerships and limited liability companies. Ourparticipation in these entities may be as a developer, a builder,or an investment partner. Our ownership percentage varies from5 percent to 50 percent depending on the investment.
Aggregated assets, liabilities and operating results of theentities that we account for as equity affiliates are providedbelow.
Assets and Liabilities of Real Estate Equity Affiliates
DOLLAR AMOUNTS IN MILLIONS
DECEMBER 31,2010
DECEMBER 31,2009
Current assets $ 20 $ 24
Noncurrent assets $718 $863
Current liabilities $ 78 $ 77
Noncurrent liabilities $384 $496
Results of Operations From Real Estate Equity Affiliates
DOLLAR AMOUNTS IN MILLIONS
2010 2009 2008
Net sales and revenues $ 51 $ 39 $ 334
Operating loss $(31) $(14) $(786)
Net loss $(32) $(22) $(798)
NOTE 9: PENSION AND OTHER POSTRETIREMENTBENEFIT PLANS
We sponsor several retirement programs for our employees.
This note provides details about:
•types of plans we sponsor,
•significant transactions and events affecting plans wesponsor,
•funded status of plans we sponsor,
•pension assets,
•activity of plans we sponsor and
•actuarial assumptions.
TYPES OF PLANS WE SPONSOR
The plans we sponsor in the U.S. and Canada differ accordingto each country’s requirements.
In the U.S., our pension plans are:
•qualified — plans that qualify under the Internal RevenueCode; and
•nonqualified — plans for select employees that provideadditional benefits not qualified under the Internal RevenueCode.
In Canada, our pension plans are:
•registered — plans that are registered under the Income TaxAct and applicable provincial pension acts; and
•nonregistered — plans for select employees that provideadditional benefits that may not be registered under theIncome Tax Act or provincial pension acts.
72

We also offer retiree medical and life insurance plans in theU.S. and Canada. These plans are referred to as otherpostretirement benefit plans in the following disclosures.
Employee Eligibility and Accounting
The Pension and Other Postretirement Benefit Plans section ofNote 1: Summary of Significant Accounting Policies providesinformation about employee eligibility for pension plans andpostretirement health care and life insurance benefits, as wellas how we account for the plans and benefits. See Effects ofSignificant Transactions and Events below for changes toeligibility in the pension and other postretirement benefit plans.
Measurement Date
We measure the fair value of pension plan assets and pensionand other postretirement benefit obligations as of the end ofour fiscal year. The fair value of pension plan assets areestimated at the end of the year and are revised in the first halfof the following year when the information needed to finalizefair values is received.
EFFECTS OF SIGNIFICANT TRANSACTIONS AND EVENTS
The information that is provided in this footnote is affected bythe following transactions and events.
Amendments of Pension and Other Postretirement BenefitPlans for Salaried Employees
During third quarter 2010, we made changes to ourpostretirement medical plan for certain retirees in the U.S.Specifically, Medicare eligible retirees will be covered by aHealth Reimbursement Account (HRA) as of January 1, 2011.The HRA will allow these retirees to purchase coverage througha healthcare exchange, and will provide additional options forcoverage. As a result of this plan change, the company will notbe receiving a Medicare Part D subsidy for plan years beginningon or after January 1, 2011. The loss of Medicare Part Dsubsidy is considered in the calculation of the net prior servicecredit of $3 million resulting from the plan change. This amountwill be amortized into the net periodic benefit credits (costs)over the life expectancy of the affected plan participants.
Effective December 31, 2010, the Weyerhaeuser CompanyRetirement Plan for Hourly Rated Employees was merged intothe Weyerhaeuser Company Retirement Plan for SalariedEmployees resulting in the Weyerhaeuser Pension Plan. Therewere no changes to the provisions as a result of the planmerger.
During third quarter 2009, amendments were approved for ourpostretirement medical and life insurance benefits for certainretirees and employees covered by plans in Canada. Thechanges to the Canadian plans included a decrease in the
amounts paid for postretirement medical and life insurance forcertain retirees and employees. As a result of the planchanges, the plans’ liabilities were re-measured at August 31,2009. The re-measurement and the annual re-measurement atJanuary 1, 2009 reduced the unrecognized gain by $19 million.The plan changes also generated an unrecognized prior servicecredit of $97 million which will be amortized into net periodicbenefit credits (costs) over the remaining future service years ofplan members.
During fourth quarter 2009, an amendment was approved forour postretirement life insurance benefit for certain U.S.salaried retirees. The change eliminated the life insurancebenefit for certain salaried retirees effective January 1, 2010.The plan’s liabilities were re-measured at November 30, 2009.This re-measurement and the annual re-measurement atJanuary 1, 2009 increased the unrecognized loss by $6 million.This change resulted in a $16 million prior service credit, whichwas fully recognized in 2009.
During third quarter 2009, we announced changes to theWeyerhaeuser Company Retirement Plan for SalariedEmployees for service earned on and after January 1, 2010.The changes included a reduced pension benefit, changes inhow benefits payable before age 65 are determined and achange from a single lump sum optional form of payment to anoption for seven equal annual installments. There were nochanges in the plan’s projected benefit obligation (PBO) for the2009 plan year as a result of these changes. However, therewas a change to the plan’s minimum benefit, which increasedfor all years of service including those earned prior toJanuary 1, 2010. This change did not have a significant impacton the plan’s PBO, but the effect of the change was reflected inthe PBO at December 31, 2009 and prior service cost wasestablished as of December 31, 2009. All of the changesimpacted net periodic pension benefit credits (costs) andrequired funding beginning in 2010.
During second quarter 2008, we announced amendments to ourpostretirement medical and life insurance benefit plans for U.S.salaried employees that reduced or eliminated certain medicaland life insurance benefits that were available to both past andpresent employees. These changes resulted in a $52 millioncurtailment gain in second quarter 2008 for full recognition ofthe pre-existing prior service credit for affected employees.
Restructuring Activities
The information that is provided in this footnote is affected byrestructuring activities that occurred in 2010 and 2009.
2010 Restructuring
The 2010 curtailments and special termination benefits arerelated to involuntary terminations due to company-wide
WEYERHAEUSER COMPANY > 2010 ANNUAL REPORT AND FORM 10-K 73

restructuring activities, the closure of Wood Products facilitiesand the sale of five short line railroads. The total curtailmentcharge for U.S. pension plans was $5 million. There were nocurtailment charges or credits to the Canadian pension plans,or the U.S. or Canadian postretirement plans.
Special termination benefits were provided under the pensionplan in the U.S. for those terminated employees who were notyet eligible to retire but whose age plus service was at least 65and had at least ten years of service (Rule of 65). Specialtermination charges were $5 million.
2009 Restructuring
The cumulative lump sum distributions for the year triggeredtwo settlements in the U.S. Settlement charges of $60 millionand $16 million were recognized in third and fourth quarter2009, respectively.
The 2009 curtailments and special termination benefits wererelated to involuntary terminations due to company-widerestructuring activities and the closure of Wood Productsfacilities. The total curtailment charge for the U.S. andCanadian pension plans was $22 million. The net curtailmentcredit to the Canadian postretirement benefit plans was lessthan $1 million. There were no curtailment charges or credits tothe U.S. postretirement plans.
Special termination benefits were available under both thepension and postretirement benefit plans in the U.S. andCanada, for those terminated employees who were not yeteligible to retire but whose age plus service was at least 65and had at least ten years of service (Rule of 65). Specialtermination charges were $14 million and $9 million for thepension and postretirement benefit plans, respectively.
Midyear Re-measurement of Assets and Liabilities
Our pension and other postretirement benefit plans are onlyre-measured at fiscal year-end unless a significant event occursthat requires re-measurement of the assets or liabilities at aninterim date. There were no significant events that triggeredre-measurement in 2010. During 2009, the following eventsrequired interim re-measurements:
•The amendment to the other postretirement benefit plans forcertain retirees in the U.S. required re-measurement of theplans’ liabilities as of November 30, 2009.
•The amendment to the other postretirement benefit plans forcertain retirees and employees in Canada requiredre-measurement of the plans’ liabilities as of August 31,2009.
•The volume of lump sum distributions from our U.S. qualifiedpension plan for salaried employees requiredre-measurement of the plan’s assets and liabilities as ofAugust 31, 2009, the date the settlement was triggered.
The discount rate used to re-measure the plans’ liabilities isreflective of current bond rates on the re-measurement date. Asa result of the midyear re-measurements, multiple discountrates were used in estimating our net periodic benefit cost(credit) for 2009. These rates are discussed further in theActuarial Assumptions portion of this footnote. There was nochange to the expected rate of return assumption during 2010,2009 and 2008.
Receivable From Pension Trust
During 2009 and 2008, there was a high volume of lump sumdistributions from our U.S. qualified pension plans. Retirement-eligible employees whose employment with the companyterminated in connection with the sale of our Containerboard,Packaging and Recycling business or corporate restructuringactivities could elect to receive their pension benefit as a lumpsum distribution if permitted in accordance with the plans’provisions. In addition, market events in late 2008 and early2009 adversely affected liquidity. For instance, many of thefunds in which plan assets are invested changed theirredemption terms which delayed some of the pension trusts’cash receipts. To avoid liquidating assets at depressed pricesand, as permitted by law, we elected to provide $285 million ofshort-term liquidity to the U.S. pension trust through short-termloans. These short-term loans were made in the fourth quarter2008 and first quarter 2009. The pension trust repaid$139 million in fourth quarter 2009 and the remaining$146 million in 2010.
74

FUNDED STATUS OF PLANS WE SPONSOR
The funded status of the plans we sponsor is determined bycomparing the projected benefit obligation with the fair value ofplan assets at the end of the year.
Changes in Projected Benefit Obligations of Our Pension andOther Postretirement Benefit Plans
DOLLAR AMOUNTS IN MILLIONS
PENSION OTHERPOSTRETIREMENT
BENEFITS
2010 2009 2010 2009
Reconciliation of projectedbenefit obligation:
Projected benefit obligationbeginning of year
$4,759 $4,426 $591 $ 625
Service cost 44 56 2 2
Interest cost 278 275 24 38
Plan participants’contributions
— — 26 21
Actuarial (gains) losses 458 362 (78) 62
Foreign currency exchangerate changes
44 107 4 21
Benefits paid (332) (513) (73) (74)
Plan amendments 9 15 (3) (113)
Curtailment gains — (25) — —
Settlements — 42 — —
Special termination benefits 5 14 — 9
Plan assumptions inconnection with an acquisition
2 — 3 —
Projected benefit obligation atend of year
$5,267 $4,759 $496 $ 591
Changes in Fair Value of Plan Assets
DOLLAR AMOUNTS IN MILLIONS
PENSION OTHERPOSTRETIREMENT
BENEFITS
2010 2009 2010 2009
Fair value of plan assets atbeginning of year (actual)
$4,325 $3,845 $ — $ —
Actual return on plan assets 515 691 — —
Foreign currency exchange ratechanges
32 74 — —
Employer contributions 233 62 47 53
Plan participants’ contributions — — 26 21
Benefits paid (includes lumpsum settlements)
(332) (513) (73) (74)
Fair value of plan assets at endof year (estimated)
$4,773 $4,159 $ — $ —
Funded Status of Our Pension and Other PostretirementBenefit Plans
DOLLAR AMOUNTS IN MILLIONS
PENSION OTHERPOSTRETIREMENT
BENEFITS
2010 2009 2010 2009
Noncurrent assets $ — $ 377 $ — $ —
Current liabilities (20) (20) (45) (60)
Noncurrent liabilities (474) (957) (451) (531)
Funded status $(494) $(600) $(496) $(591)
Our qualified and registered pension plans and a portion of ournonregistered pension plans are funded. We contribute to theseplans according to established funding standards. Thenonqualified pension plan, a portion of the nonregisteredpension plans, and the other postretirement benefit plans areunfunded. For the unfunded plans, we pay benefits to retireesfrom our general assets as they come due.
The Weyerhaeuser Company Retirement Plan for Hourly RatedEmployees was merged into the Weyerhaeuser CompanyRetirement Plan for Salaried Employees on December 31,2010. This merger resulted in a net underfunded status for theplan in our consolidated results. Previously, the WeyerhaeuserCompany Retirement Plan for Hourly Rated Employees was overfunded.
The values reported for our pension plan assets at the end of2010 and 2009 were estimated. Additional informationregarding the year-end values generally becomes available to usduring the first half of the following year. We increased the fairvalue of plan assets by $167 million to reflect final valuationsas of December 31, 2009.
During 2010, we contributed $150 million to our U.S. qualifiedpension plans, $58 million to our Canadian registered plan and$25 million to our non-qualified and non-registered plans.
The asset or liability on our Consolidated Balance Sheetrepresenting the funded status of the plans is different fromthe cumulative income or expense that we have recordedrelated to these plans. These differences are actuarial gainsand losses and prior service costs and credits that are deferredand will be amortized into our periodic benefit costs in futureperiods. These unamortized amounts are recorded incumulative other comprehensive income, which is a componentof total equity on our Consolidated Balance Sheet.
WEYERHAEUSER COMPANY > 2010 ANNUAL REPORT AND FORM 10-K 75
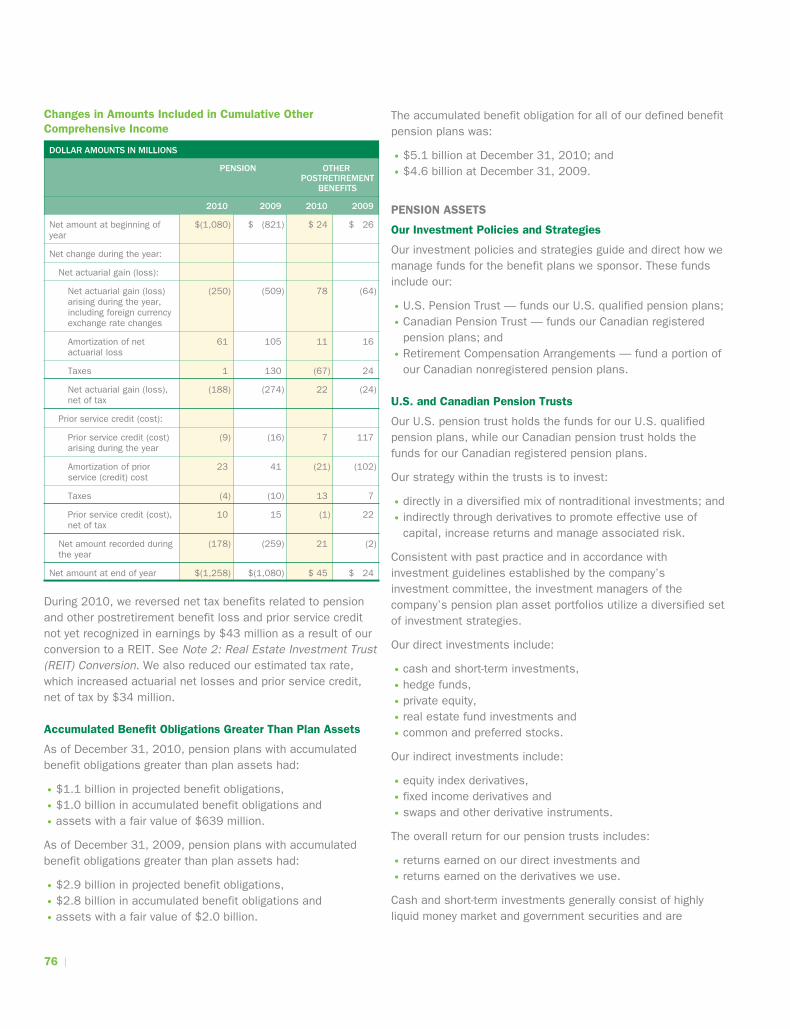
Changes in Amounts Included in Cumulative OtherComprehensive Income
DOLLAR AMOUNTS IN MILLIONS
PENSION OTHERPOSTRETIREMENT
BENEFITS
2010 2009 2010 2009
Net amount at beginning ofyear
$(1,080) $ (821) $ 24 $ 26
Net change during the year:
Net actuarial gain (loss):
Net actuarial gain (loss)arising during the year,including foreign currencyexchange rate changes
(250) (509) 78 (64)
Amortization of netactuarial loss
61 105 11 16
Taxes 1 130 (67) 24
Net actuarial gain (loss),net of tax
(188) (274) 22 (24)
Prior service credit (cost):
Prior service credit (cost)arising during the year
(9) (16) 7 117
Amortization of priorservice (credit) cost
23 41 (21) (102)
Taxes (4) (10) 13 7
Prior service credit (cost),net of tax
10 15 (1) 22
Net amount recorded duringthe year
(178) (259) 21 (2)
Net amount at end of year $(1,258) $(1,080) $ 45 $ 24
During 2010, we reversed net tax benefits related to pensionand other postretirement benefit loss and prior service creditnot yet recognized in earnings by $43 million as a result of ourconversion to a REIT. See Note 2: Real Estate Investment Trust(REIT) Conversion. We also reduced our estimated tax rate,which increased actuarial net losses and prior service credit,net of tax by $34 million.
Accumulated Benefit Obligations Greater Than Plan Assets
As of December 31, 2010, pension plans with accumulatedbenefit obligations greater than plan assets had:
•$1.1 billion in projected benefit obligations,
•$1.0 billion in accumulated benefit obligations and
•assets with a fair value of $639 million.
As of December 31, 2009, pension plans with accumulatedbenefit obligations greater than plan assets had:
•$2.9 billion in projected benefit obligations,
•$2.8 billion in accumulated benefit obligations and
•assets with a fair value of $2.0 billion.
The accumulated benefit obligation for all of our defined benefitpension plans was:
•$5.1 billion at December 31, 2010; and
•$4.6 billion at December 31, 2009.
PENSION ASSETS
Our Investment Policies and Strategies
Our investment policies and strategies guide and direct how wemanage funds for the benefit plans we sponsor. These fundsinclude our:
•U.S. Pension Trust — funds our U.S. qualified pension plans;
•Canadian Pension Trust — funds our Canadian registeredpension plans; and
•Retirement Compensation Arrangements — fund a portion ofour Canadian nonregistered pension plans.
U.S. and Canadian Pension Trusts
Our U.S. pension trust holds the funds for our U.S. qualifiedpension plans, while our Canadian pension trust holds thefunds for our Canadian registered pension plans.
Our strategy within the trusts is to invest:
•directly in a diversified mix of nontraditional investments; and
•indirectly through derivatives to promote effective use ofcapital, increase returns and manage associated risk.
Consistent with past practice and in accordance withinvestment guidelines established by the company’sinvestment committee, the investment managers of thecompany’s pension plan asset portfolios utilize a diversified setof investment strategies.
Our direct investments include:
•cash and short-term investments,
•hedge funds,
•private equity,
•real estate fund investments and
•common and preferred stocks.
Our indirect investments include:
•equity index derivatives,
•fixed income derivatives and
•swaps and other derivative instruments.
The overall return for our pension trusts includes:
•returns earned on our direct investments and
•returns earned on the derivatives we use.
Cash and short-term investments generally consist of highlyliquid money market and government securities and are
76

primarily held to fund benefit payments, capital calls andmargin requirements.
Hedge fund investments generally consist of privately-offeredmanaged pools primarily structured as limited liability entities,with the general members or partners of such limited liabilityentities serving as portfolio manager and thus beingresponsible for the fund’s underlying investment decisions.Generally, these funds have varying degrees of liquidity andredemption provisions. Underlying investments within thesefunds may include long and short public and private equities,corporate, mortgage and sovereign debt, options, swaps,forwards and other derivative positions. These funds may alsouse varying degrees of leverage.
Private equity investments consist of investments in privateequity, mezzanine, distressed, co-investments and otherstructures. Private equity funds generally participate in buyoutsand venture capital of limited liability entities through unlistedequity and debt instruments. These funds may also employborrowing at the underlying entity level. Mezzanine anddistressed funds generally follow strategies of investing in thedebt of public or private companies with additional participationthrough warrants or other equity type options.
Real estate fund investments in real property may be initiatedthrough private transactions between principals or publicmarket vehicles such as real estate investment trusts and aregenerally held in limited liability entities.
Common and preferred stocks are equity instruments thatgenerally have resulted from transactions related to privateequity investment holdings.
Swaps and other derivative instruments generally arecomprised of swaps, futures, forwards or options. Inaccordance with our investment risk and return objectives,some of these instruments are utilized to achieve target equityand bond asset exposure or to reduce exposure to certainmarket risks. Others, mainly total return swaps with limitedexchange of principal, are designed to gain exposure to thereturn characteristics of specific financial strategies.
Retirement Compensation Arrangements
Retirement Compensation Arrangements fund a portion of ourCanadian nonregistered pension plans.
Under Retirement Compensation Arrangements, ourcontributions are split:
•50 percent to our investments in a portfolio of equities; and
•50 percent to a noninterest-bearing refundable tax accountheld by Canada Revenue Agency — as required by Canadiantax rules.
The Canadian tax rules requirement means that — on average,over time — approximately 50 percent of our Canadiannonregistered pension plans’ assets do not earn returns.
Managing Risk
All investments are subject to risk, including market price,liquidity, currency, interest rate and credit risks. We haveestablished governance practices to manage these risks. Thefollowing provides an overview of these risks and describesactions we take to mitigate the potential adverse effects ofthese risks on the performance of our pension plan assets.Generally, we manage these risks through:
•selection and diversification of managers and strategies,
•use of limited-liability vehicles,
•diversification and
•constraining risk profiles to predefined limits on thepercentage of pension trust assets that can be invested incertain categories.
Market price risk is the risk that the future value of a financialinstrument will fluctuate as a result of changes in its marketprice, whether caused by factors specific to the individualinvestment, its issuer, or any other market factor that mayaffect its price. We attempt to mitigate market price risk on thecompany’s pension plan asset portfolios by investing in adiversified set of assets whose returns exhibit low correlationto those of traditional asset classes and each other. Inaddition, we and our investment advisors monitor theinvestments on a regular basis to ensure the decision to investin particular assets continues to be suitable, includingperforming ongoing qualitative and quantitative assessmentsand comprehensive investment and operational due diligence.Special attention is paid to organizational changes made by theunderlying fund managers and to changes in policy relative totheir investment objectives, valuation, hedging strategy, degreeof diversification, leverage, alignment of fund principles andinvestors, risk governance and costs.
Liquidity risk is the risk that the pension trusts will encounterdifficulty in meeting obligations associated with their financialliabilities. Our financial obligations as they relate to the pensionplans may consist of distributions and redemptions payable topension plan participants, payments to counterparties and feesto service providers. As established, pension plan assetsprimarily consist of investments in limited liability pools forwhich there is no active secondary market. As a result, theinvestments may be illiquid. Further, hedge funds are subject topotential restrictions that may affect the timing of therealization of pending redemptions. Private equity funds aresubject to distribution and funding schedules that are set bythe private equity funds’ respective managers and marketactivity. To mitigate liquidity risk on the company’s pension plan
WEYERHAEUSER COMPANY > 2010 ANNUAL REPORT AND FORM 10-K 77

asset portfolios, the hedge fund portfolios have been diversifiedacross manager’s strategies and funds that possess varyingliquidity provisions and the private equity portfolios have beendiversified across different vintage years and strategies. Inaddition, the investment committee regularly reviews cash flowsof the pension trusts and sets appropriate guidelines toaddress liquidity needs.
Currency risk arises from holding pension plan assetsdenominated in a currency other than the currency in which itsliabilities are settled. Such risk is managed generally throughnotional contracts designed to hedge the net exposure tonon-functional currencies.
Interest rate risk is the risk that a change in interest rates willadversely affect the fair value of fixed income securities. Wehave no direct exposure to fixed-income securities within thepension plan assets at December 31, 2010 or 2009.Therefore, the pension trust’s primary exposure to interest raterisk is indirect and through their investments in limited liabilitypools. Such indirect exposure is managed by the respectivefund managers in conjunction with their investment leveldecisions and predefined investment mandates.
Credit risk relates to the extent to which failures bycounterparties to discharge their obligations could reduce theamount of future cash flows on hand at the balance sheet date.The pension trusts’ exposure to counterparty credit risk isreflected as settlement receivables from derivative contractswithin the pension plan assets. In evaluating credit risk, we willoften be dependent upon information provided by thecounterparty or a rating agency, which may be inaccurate. Wedecrease exposure to credit risk by only dealing with highly-rated financial counterparties, and as of yearend, ourcounterparties each had a credit rating of at least A fromStandard and Poor’s.
We further manage this risk through:
•diversification of counterparties,
•predefined settlement and margining provisions and
•documented agreements.
We expect that none of our counterparties will fail to meet itsobligations. Also, no principal is at risk as a result of thesetypes of investments. Only the amount of unsettled netreceivables is at risk.
We are also exposed to credit risk indirectly throughcounterparty relationships struck by the underlying managers ofinvestments in limited liability pools. This indirect exposure ismitigated through a due diligence process, which focuses onmonitoring each investment fund to ensure the decision toinvest in or maintain exposure to a fund continues to besuitable for the pension plans’ asset portfolios.
While we do not target specific direct investment or derivativeallocations, we have established guidelines on the percentageof pension trust assets that can be invested in certaincategories to provide diversification by investment type fundand investment managers, as well as to manage overallliquidity.
Assets within our qualified and registered pension plans in ourU.S. and Canadian pension trusts were invested as follows:
DECEMBER 31,2010
DECEMBER 31,2009
Fixed income 16.4% 9.2%
Hedge funds 48.0 55.9
Private equity and related funds 33.1 35.5
Real estate and related funds 2.5 3.0
Common and preferred stock andequity index instruments
0.4 0.1
Net receivables — 0.1
Accrued liabilities (0.4) (3.8)
Total 100.0% 100.0%
For our nonregistered plans, we invest 50 percent of the fundswe contribute to our nonregistered pension plans. UnderCanadian tax rules for Retirement Compensation Arrangements,the other 50 percent is allocated to a noninterest-bearingrefundable tax account held by the Canada Revenue Agency.We have invested the assets that we are allowed to manage asfollows:
DECEMBER 31,2010
DECEMBER 31,2009
Equities 44.0% 38.8%
Cash and cash equivalents 56.0 61.2
Total 100.0% 100.0%
Valuation of Our Plan Assets
We estimate the fair value of pension plan assets based uponthe information available at year end. The pension assets arestated at fair value based upon the amount that would bereceived to sell an asset or paid to transfer a liability in anorderly transaction between market participants at the reportingdate. We do not value pension investments based upon aforced or distressed sale scenario. Instead, we consider bothobservable and unobservable inputs that reflect assumptionsapplied by market participants when setting the exit price of anasset or liability in an orderly transaction within the principalmarket of that asset or liability.
The pension assets are comprised of cash, derivativecontracts, common and preferred stock and fund units. Thefund units are typically limited liability interests in hedge funds,private equity funds, real estate funds and cash funds. Each of
78

these assets participates in its own unique principal market.Cash, when held directly, is valued at cost; common andpreferred stocks are valued at exit prices quoted in the publicmarkets; derivative contracts are valued at exit pricesdetermined after consideration of inputs from executedcontracts, broker dealers and counterparty quoted prices; andfund units are valued based upon the net asset value of thefund. If restrictions were imposed upon any of the limitedliability pools in which the pension plan assets were invested ata time when our interest in the fund units were being sold, it ispossible that the value to be realized in such a transactioncould be different from the reported value.
We value the pension plan assets based upon the observabilityof exit pricing inputs and classify pension plan assets basedupon the lowest level input that is significant to the fair valuemeasurement of the pension plan assets in their entirety. Thefair value hierarchy we follow is outlined below:
Level 1: Inputs are unadjusted quoted prices for identicalassets and liabilities traded in an active market.Level 2: Inputs are quoted prices in non-active markets forwhich pricing inputs are observable either directly or indirectlyat the reporting date.Level 3: Inputs are derived from valuation techniques in whichone or more significant inputs or value drivers areunobservable.
Assets with readily available quoted prices in an active marketor those for which fair value can be measured from activelyquoted prices will have a higher degree of market priceobservability and thus, a lesser degree of judgment appliedwhen measuring fair value than those with unobservablepricing inputs.
The pension trusts’ net investments exclusive of receivablesand accruals, when categorized in accordance with this fairvalue hierarchy, are as follows:
DOLLAR AMOUNTS IN MILLIONS
2010 Level 1 Level 2 Level 3 Total
Investments
Fixed income instruments $711 $ 68 $ — $ 779
Hedge funds — 315 1,969 2,284
Private equity and relatedfunds
— (4) 1,575 1,571
Real estate and relatedfunds
— — 120 120
Common and preferredstock and equity indexinstruments
2 17 — 19
Total $713 $396 $3,664 $4,773
DOLLAR AMOUNTS IN MILLIONS
2009 Level 1 Level 2 Level 3 Total
Investments
Fixed income instruments $368 $ 17 $ — $ 385
Hedge funds — 253 2,067 2,320
Private equity and relatedfunds
— — 1,473 1,473
Real estate and relatedfunds
— — 122 122
Common and preferredstock and equity indexinstruments
7 6 — 13
Total $375 $276 $3,662 $4,313
A reconciliation of the beginning and ending balances of thepension plan assets measured at fair value using significantunobservable inputs (Level 3) is presented below:
DOLLAR AMOUNTS IN MILLIONS
INVESTMENTS
Hedge funds Private equity andrelated funds
Real estate andrelated funds
Total
Balance as ofDecember 31,2008
$2,347 $1,493 $216 $4,056
Net realizedgains
97 19 2 118
Net change inunrealizeddepreciation
216 (33) (89) 94
Netpurchases,(sales) and(settlements)
(593) (6) (7) (606)
Balance as ofDecember 31,2009
2,067 1,473 122 3,662
Net realizedgains
132 146 10 288
Net change inunrealizeddepreciation
239 120 (1) 358
Netpurchases,(sales) and(settlements)
(469) (164) (11) (644)
Balance as ofDecember 31,2010
$1,969 $1,575 $120 $3,664
This table shows the fair value of the derivatives held by ourpension trusts — which fund our qualified and registeredplans — at the end of the last two years.
DOLLAR AMOUNTS IN MILLIONS
DECEMBER 31,2010
DECEMBER 31,2009
Equity index instruments $ 17 $ 6
Forward contracts (4) —
Swaps 315 253
Total $328 $259
WEYERHAEUSER COMPANY > 2010 ANNUAL REPORT AND FORM 10-K 79
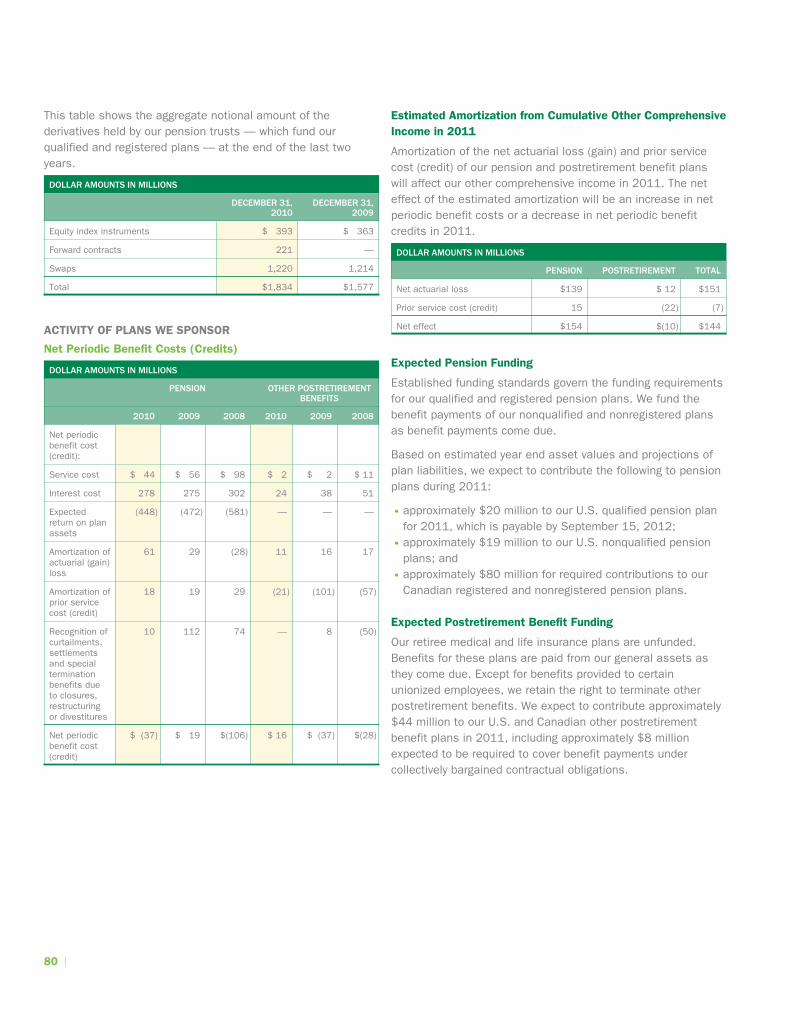
This table shows the aggregate notional amount of thederivatives held by our pension trusts — which fund ourqualified and registered plans — at the end of the last twoyears.
DOLLAR AMOUNTS IN MILLIONS
DECEMBER 31,2010
DECEMBER 31,2009
Equity index instruments $ 393 $ 363
Forward contracts 221 —
Swaps 1,220 1,214
Total $1,834 $1,577
ACTIVITY OF PLANS WE SPONSOR
Net Periodic Benefit Costs (Credits)
DOLLAR AMOUNTS IN MILLIONS
PENSION OTHER POSTRETIREMENTBENEFITS
2010 2009 2008 2010 2009 2008
Net periodicbenefit cost(credit):
Service cost $ 44 $ 56 $ 98 $ 2 $ 2 $ 11
Interest cost 278 275 302 24 38 51
Expectedreturn on planassets
(448) (472) (581) — — —
Amortization ofactuarial (gain)loss
61 29 (28) 11 16 17
Amortization ofprior servicecost (credit)
18 19 29 (21) (101) (57)
Recognition ofcurtailments,settlementsand specialterminationbenefits dueto closures,restructuringor divestitures
10 112 74 — 8 (50)
Net periodicbenefit cost(credit)
$ (37) $ 19 $(106) $ 16 $ (37) $(28)
Estimated Amortization from Cumulative Other ComprehensiveIncome in 2011
Amortization of the net actuarial loss (gain) and prior servicecost (credit) of our pension and postretirement benefit planswill affect our other comprehensive income in 2011. The neteffect of the estimated amortization will be an increase in netperiodic benefit costs or a decrease in net periodic benefitcredits in 2011.
DOLLAR AMOUNTS IN MILLIONS
PENSION POSTRETIREMENT TOTAL
Net actuarial loss $139 $ 12 $151
Prior service cost (credit) 15 (22) (7)
Net effect $154 $(10) $144
Expected Pension Funding
Established funding standards govern the funding requirementsfor our qualified and registered pension plans. We fund thebenefit payments of our nonqualified and nonregistered plansas benefit payments come due.
Based on estimated year end asset values and projections ofplan liabilities, we expect to contribute the following to pensionplans during 2011:
•approximately $20 million to our U.S. qualified pension planfor 2011, which is payable by September 15, 2012;
•approximately $19 million to our U.S. nonqualified pensionplans; and
•approximately $80 million for required contributions to ourCanadian registered and nonregistered pension plans.
Expected Postretirement Benefit Funding
Our retiree medical and life insurance plans are unfunded.Benefits for these plans are paid from our general assets asthey come due. Except for benefits provided to certainunionized employees, we retain the right to terminate otherpostretirement benefits. We expect to contribute approximately$44 million to our U.S. and Canadian other postretirementbenefit plans in 2011, including approximately $8 millionexpected to be required to cover benefit payments undercollectively bargained contractual obligations.
80

Estimated Projected Benefit Payments for the Next 10 Years
DOLLAR AMOUNTS IN MILLIONS
PENSION OTHERPOSTRETIREMENT
BENEFITS
2011 $ 309 $ 44
2012 $ 313 $ 43
2013 $ 320 $ 42
2014 $ 332 $ 41
2015 $ 340 $ 40
2016-2020 $1,841 $190
ACTUARIAL ASSUMPTIONS
We use actuarial assumptions to estimate our benefitobligations and our net periodic benefit costs.
Rates We Use in Estimating Our Benefit Obligations
We use assumptions to estimate our benefit obligations thatinclude:
•discount rates in the U.S. and Canada, including discountrates used to value lump sum distributions;
•rates of compensation increases for our salaried and hourlyemployees in the U.S. and Canada; and
•estimated percentages of eligible retirees who will elect lumpsum payments of benefits.
Discount Rates and Rates of Compensation Increase Used in Estimating Our Pension and Other Postretirement BenefitObligations
PENSION OTHER POSTRETIREMENTBENEFITS
DECEMBER 31,2010
DECEMBER 31,2009
DECEMBER 31,2010
DECEMBER 31,2009
Discount rate:
U.S. 5.40% 5.90% 5.00% 5.20%
Canada 5.30% 6.10% 5.20% 6.00%
Lump sum distributions (US salaried and nonqualified plans only) Variable(1) Variable(1) N/A N/A
Rate of compensation increase:
Salaried:
United States 1.75% for 2010,2.00% for 2011
and 3.5% thereafter
0% for 2009,1.75% for 2010
and 3.5% thereafter
N/A N/A
Canada 1.75% for 20102.00% for 2011
and 3.5% thereafter
0% for 20091.75% for 2010
and 3.5% thereafter
3.50% 3.50%
Hourly:
United States 3.00% 3.00% 3.00% 3.00%
Canada 3.25% 3.25% N/A N/A
Election of lump sum or installment distributions (US salaried and nonqualified plans only)
65.00% 72.00% N/A N/A
(1) The discount rates applicable to lump sum distributions vary based on expected retirement dates of the covered employees. The discount rates are determined in accordance with thePension Protection Act.
Estimating Our Net Periodic Benefit Costs
The assumptions we use to estimate our net periodic benefitcosts include:
•discount rates in the U.S. and Canada, including discountrates used to value lump sum distributions;
•expected returns on our plan assets;
•rates of compensation increases for our salaried and hourlyemployees in the U.S. and Canada; and
•estimated percentages of eligible retirees who will elect lumpsum payments of benefits.
This table shows the discount rates, expected returns on ourplan assets and rates of compensation increases we used thelast three years to estimate our net periodic benefit costs.
WEYERHAEUSER COMPANY > 2010 ANNUAL REPORT AND FORM 10-K 81
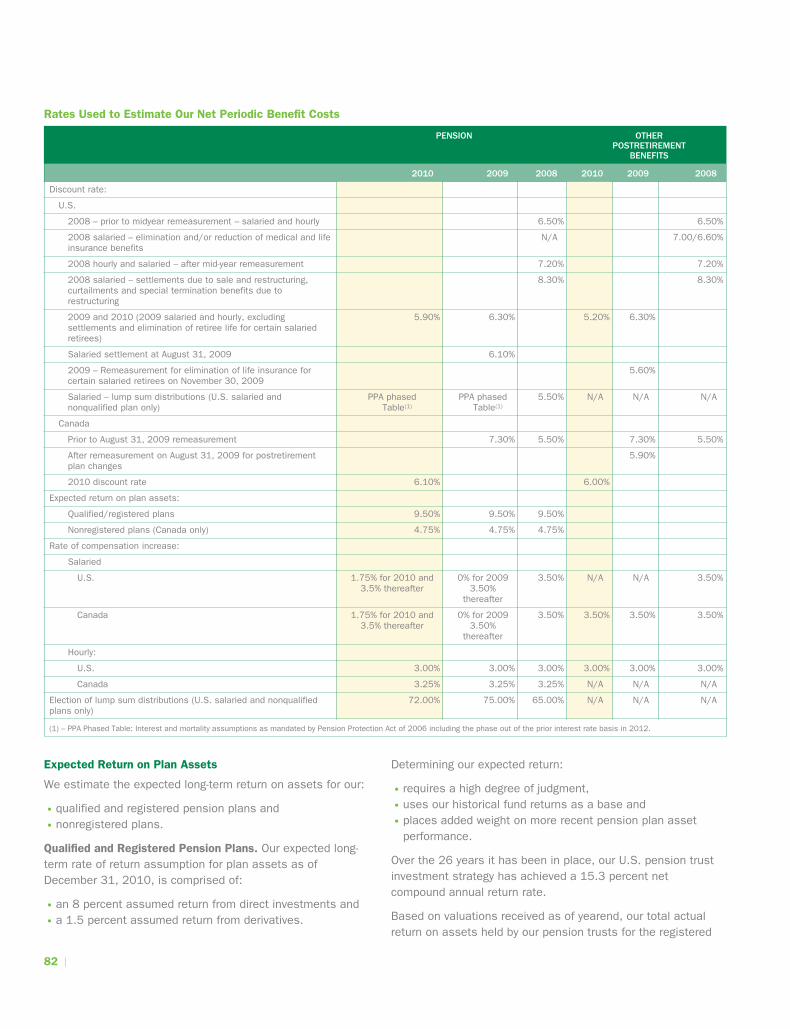
Rates Used to Estimate Our Net Periodic Benefit Costs
PENSION OTHERPOSTRETIREMENT
BENEFITS
2010 2009 2008 2010 2009 2008
Discount rate:
U.S.
2008 – prior to midyear remeasurement – salaried and hourly 6.50% 6.50%
2008 salaried – elimination and/or reduction of medical and lifeinsurance benefits
N/A 7.00/6.60%
2008 hourly and salaried – after mid-year remeasurement 7.20% 7.20%
2008 salaried – settlements due to sale and restructuring,curtailments and special termination benefits due torestructuring
8.30% 8.30%
2009 and 2010 (2009 salaried and hourly, excludingsettlements and elimination of retiree life for certain salariedretirees)
5.90% 6.30% 5.20% 6.30%
Salaried settlement at August 31, 2009 6.10%
2009 – Remeasurement for elimination of life insurance forcertain salaried retirees on November 30, 2009
5.60%
Salaried – lump sum distributions (U.S. salaried andnonqualified plan only)
PPA phasedTable(1)
PPA phasedTable(1)
5.50% N/A N/A N/A
Canada
Prior to August 31, 2009 remeasurement 7.30% 5.50% 7.30% 5.50%
After remeasurement on August 31, 2009 for postretirementplan changes
5.90%
2010 discount rate 6.10% 6.00%
Expected return on plan assets:
Qualified/registered plans 9.50% 9.50% 9.50%
Nonregistered plans (Canada only) 4.75% 4.75% 4.75%
Rate of compensation increase:
Salaried
U.S. 1.75% for 2010 and3.5% thereafter
0% for 20093.50%
thereafter
3.50% N/A N/A 3.50%
Canada 1.75% for 2010 and3.5% thereafter
0% for 20093.50%
thereafter
3.50% 3.50% 3.50% 3.50%
Hourly:
U.S. 3.00% 3.00% 3.00% 3.00% 3.00% 3.00%
Canada 3.25% 3.25% 3.25% N/A N/A N/A
Election of lump sum distributions (U.S. salaried and nonqualifiedplans only)
72.00% 75.00% 65.00% N/A N/A N/A
(1) – PPA Phased Table: Interest and mortality assumptions as mandated by Pension Protection Act of 2006 including the phase out of the prior interest rate basis in 2012.
Expected Return on Plan Assets
We estimate the expected long-term return on assets for our:
•qualified and registered pension plans and
•nonregistered plans.
Qualified and Registered Pension Plans. Our expected long-term rate of return assumption for plan assets as ofDecember 31, 2010, is comprised of:
•an 8 percent assumed return from direct investments and
•a 1.5 percent assumed return from derivatives.
Determining our expected return:
•requires a high degree of judgment,
•uses our historical fund returns as a base and
•places added weight on more recent pension plan assetperformance.
Over the 26 years it has been in place, our U.S. pension trustinvestment strategy has achieved a 15.3 percent netcompound annual return rate.
Based on valuations received as of yearend, our total actualreturn on assets held by our pension trusts for the registered
82

and qualified plans was a gain of approximately $515 millionin 2010.
These trusts fund our qualified, registered and a portion of ournon registered pension plans.
Actual Returns (Losses) on Assets Held by Our Pension Trusts
DOLLAR AMOUNTS IN MILLIONS
2010 2009 2008
Direct investments $362 $525 $(1,578)
Derivatives 153 166 (394)
Total $515 $691 $(1,972)
Nonregistered plans. Our expected overall annual return onassets that fund our nonregistered plans is 4.75 percent.
Our expected long-term annual rate of return on the equityportion of this portfolio — the portion we are allowed to investand manage — is 9.5 percent. We base that expected rate ofreturn on:
•historical experience and
•future return expectations.
Historically, the 4.75 percent expected overall annual return iscalculated by dividing 9.5 percent by two. That is becauseCanadian tax rules require that 50 percent of the assets fornonregistered plans go to a noninterest-bearing refundable taxaccount. As a result, the return we earn investing the other50 percent is spread over 100 percent of the assets.
HEALTH CARE COSTS
Rising costs of health care affect the costs of our otherpostretirement plans.
Health Care Cost Trend Rates
We use assumptions about health care cost trend rates toestimate the cost of benefits we provide. In 2010, theassumed weighted health care cost trend rate for the next yearwas:
•8.0 percent in the U.S. and
•7.5 percent in Canada.
This table shows the assumptions we use in estimating theannual cost increase for health care benefits we provide.
Assumptions We Use in Estimating Health Care Benefit Costs
2010 2009
U.S. CANADA U.S. CANADA
Weighted health care costtrend rate assumed for nextyear
8.0% 7.5% 8.0% 5.7%
Rate to which cost trendrate is assumed to decline(ultimate trend rate)
4.5% 4.5% 4.5% 4.3%
Year that the rate reachesthe ultimate trend rate
2030 2030 2029 2013
A 1 percent change in our assumed health care cost trendrates can affect our accumulated benefit obligations.
Effect of a 1 Percent Change in Health Care Costs
AS OF DECEMBER 31, 2010 (DOLLAR AMOUNTS IN MILLIONS)
1% INCREASE 1% DECREASE
Effect on total service and interest costcomponents
$ — $ —
Effect on accumulated postretirementbenefit obligation
$13 $(12)
OTHER PLANS
In addition to the pension and postretirement benefit plans weprovide, we also:
•make contributions to union-administered multiemployerpension plans and
•sponsor other postretirement and defined contribution plans.
Union-Administered Multiemployer Pension Plans
We make negotiated contributions to union-administeredmultiemployer pension plans. Our contributions wereapproximately:
•$4 million in 2010,
•$3 million in 2009 and
•$5 million in 2008.
Our contribution generally is based on fixed amounts per hourper employee. As of December 31, 2010, these plans coveredapproximately 1,300 of our employees.
Defined Contribution Plans
We sponsor various defined contribution plans for our U.S. andCanadian salaried and hourly employees. Our contributions tothese plans were:
•$12 million in 2010,
•$15 million in 2009 and
•$47 million in 2008.
Effective May 1, 2009, the company match for the salarieddefined contribution plan was temporarily suspended. Thesuspension was lifted in July 2010.
WEYERHAEUSER COMPANY > 2010 ANNUAL REPORT AND FORM 10-K 83

NOTE 10: VARIABLE INTEREST ENTITIES
This note provides details about:
•Forest Products special-purpose entities (SPEs) and
•Real Estate variable interest entities (VIEs).
FOREST PRODUCTS SPECIAL PURPOSE ENTITIES
From 2002 through 2004, Forest Products sold certainnonstrategic timberlands in five separate transactions. We arethe primary beneficiary and consolidate the assets andliabilities of certain monetization and buyer-sponsored SPEsinvolved in these transactions. We have an equity interest inthe monetization SPEs, but no ownership interest in the buyer-sponsored SPEs. The following disclosures refer to assets ofbuyer-sponsored SPEs and liabilities of monetization SPEs.However, because these SPEs are distinct legal entities:
•Assets of the SPEs are not available to satisfy our liabilitiesor obligations.
•Liabilities of the SPEs are not our liabilities or obligations.
Our Consolidated Statement of Operations includes:
•Interest expense on SPE debt of:– $32 million in 2010,– $33 million in 2009 and– $39 million in 2008.
•Interest income on SPE investments of:– $34 million in 2010,– $36 million in 2009 and– $48 million in 2008.
Sales proceeds paid to buyer-sponsored SPEs were invested inrestricted bank financial instruments with a balance of$909 million as of December 31, 2010. The weighted averageinterest rate was 3.8 percent during 2010 and 3.78 percentduring 2009. Maturities of the bank financial instruments at theend of 2010 were:
•$110 million in 2012,
•$184 million in 2013,
•$253 million in 2019 and
•$362 million in 2020.
The long-term debt of our monetization SPEs was $764 millionas of December 31, 2010, and $761 million as ofDecember 31, 2009. The weighted average interest rate was4.13 percent during 2010 and 4.11 percent during 2009.Maturities of the debt at the end of 2010 were:
•$95 million in 2012,
•$158 million in 2013,
•$209 million in 2019 and
•$302 million in 2020.
Bank financial instruments consist of bank guarantees backedby bank notes for three of the SPE transactions and letters ofcredit backed by cash deposits for two of the SPE transactions.Interest earned from each bank financial instrument is used topay interest accrued on the corresponding SPE’s debt. Anyshortfall between interest earned and interest accrued reducesour equity in the monetization SPEs.
Upon dissolution of the SPEs and payment of all obligations ofthe entities, we would receive any net equity remaining in themonetization SPEs and would be required to report deferred taxgains on our income tax return. In the event that proceeds fromthe bank financial instruments are insufficient to settle all ofthe liabilities of the SPEs, we are not obligated to contributeany funds to any of the SPEs. As of December 31, 2010, ournet equity in the five SPEs was approximately $144 million andthe deferred tax liability was estimated to be approximately$277 million.
REAL ESTATE VARIABLE INTEREST ENTITIES
In the ordinary course of business, our Real Estate segmententers into lot option purchase agreements in order to procureland and residential lots for development and the constructionof homes in the future. The use of such lot option agreementsgenerally allows us to reduce the risks associated with directland ownership and development, and reduces our capital andfinancial commitments. Pursuant to these lot option purchaseagreements, we generally provide a deposit to the seller asconsideration for the right to purchase lots at different times inthe future, usually at predetermined prices.
If the entity holding the lots under option is a VIE, our depositrepresents a variable interest in that entity. If we aredetermined to be the primary beneficiary of the VIE, weconsolidate the VIE in our financial statements and reflect itsassets and liabilities as “Consolidated assets not owned” and“Consolidated liabilities not owned.” Creditors of the entitieswith which we have option agreements have no recourseagainst us. The maximum exposure to loss under our lot optionagreements is limited to non-refundable option deposits andany capitalized pre-acquisition costs.
In determining whether we are the primary beneficiary of a VIE,we consider our ability to control activities of the VIE including,but not limited to the ability to:
•determine the budget and scope of land development work, ifany;
•control financing decisions for the VIE; and
•acquire additional land into the VIE or dispose of land in theVIE not already under contract.
84

If we conclude that we control such activities of the VIE, wealso consider whether we have an obligation to absorb lossesof or a right to receive benefits from the VIE.
As of the end of 2010 and 2009, our non-refundable optiondeposits to VIEs and capitalized pre-acquisition costs on assetsunder option from VIEs were not significant.
NOTE 11: REAL ESTATE IN PROCESS OFDEVELOPMENT AND FOR SALECarrying Value of Our Real Estate in Process of Developmentand for Sale
DOLLAR AMOUNTS IN MILLIONS
DECEMBER 31,2010
DECEMBER 31,2009
Dwelling units $215 $174
Residential lots 289 403
Commercial acreage and otherinventories
13 21
Total $517 $598
HOW WE ACCOUNT FOR OUR REAL ESTATE IN PROCESS OFDEVELOPMENT AND FOR SALE
Real estate in process of development and for sale is stated atcost unless events and circumstances trigger an impairmentreview. More information about real estate asset impairmentscan be found in Note 19: Charges for Restructuring, Closuresand Asset Impairments.
NOTE 12: SHORT-TERM BORROWINGS AND LINES OFCREDIT
This note provides details about our:
•short-term borrowings,
•lines of credit and
•other letters of credit and surety bonds.
SHORT-TERM BORROWINGS
We had $4 million of short-term borrowings outstanding as ofDecember 31, 2009.
OUR LINES OF CREDIT
At the end of 2010, we had a $1.0 billion total committed bankrevolving credit facility that expires in December 2011, with thefull amount available to us for incremental borrowings.
We entered into our line of credit in December 2006.Conditions of the line of credit include the following:
•The entire amount is available to Weyerhaeuser Company.
•$200 million of the amount is available to WeyerhaeuserReal Estate Company (WRECO).
•Neither Weyerhaeuser Company nor WRECO is a guarantor ofthe borrowing of the other.
Borrowings are at LIBOR plus a spread or at other interest ratesmutually agreed upon between the borrower and the lendingbanks. As of December 31, 2010, there were no borrowingsoutstanding under the facility.
As of December 31, 2010, Weyerhaeuser Company andWRECO were in compliance with the credit facility covenants.
In March 2010, Weyerhaeuser Company’s $400 millionrevolving credit facility expired and was not renewed.
OTHER LETTERS OF CREDIT AND SURETY BONDS
The amounts of other letters of credit and surety bonds wehave entered into as of the end of our last two years areincluded in the following table:
DOLLAR AMOUNTS IN MILLIONS
FOREST PRODUCTS REAL ESTATE
DECEMBER 31,2010
DECEMBER 31,2009
DECEMBER 31,2010
DECEMBER 31,2009
Lettersof credit
$ 29 $ 58 $ 11 $ 18
Suretybonds
$166 $156 $297 $374
Our compensating balance requirements for the other letters ofcredit and surety bonds were not significant.
NOTE 13: ACCRUED LIABILITIES
Forest Products accrued liabilities were comprised of thefollowing:
DOLLAR AMOUNTS IN MILLIONS
DECEMBER 31,2010
DECEMBER 31,2009
Wages, salaries and severance pay $165 $125
Pension and postretirement 70 84
Vacation pay 50 51
Income taxes 65 1
Taxes – Social Security and real andpersonal property
28 31
Interest 110 121
Customer rebates and volumediscounts
63 42
Deferred mineral income 20 31
Other 163 145
Total $734 $631
WEYERHAEUSER COMPANY > 2010 ANNUAL REPORT AND FORM 10-K 85

NOTE 14: LONG-TERM DEBT
This note provides details about:
•Forest Products long-term debt and the portion due withinone year,
•Real Estate long-term debt and the portion due within oneyear and
•long-term debt maturities.
Our long-term debt includes notes, debentures, revenue bondsand other borrowings. The following table lists Forest Products’long-term debt, which includes Weyerhaeuser Company debt, bytypes and interest rates at the end of our last two years andincludes the current portion.
Forest Products Long-Term Debt by Types and Interest Rates(Includes Current Portion)
DOLLAR AMOUNTS IN MILLIONS
DECEMBER 31,2010
DECEMBER 31,2009
6.75% notes due 2012 $ 518 $1,066
7.50% debentures due 2013 156 156
7.25% debentures due 2013 129 129
6.95% debentures due 2017 281 281
7.00% debentures due 2018 62 62
7.375% notes due 2019 500 500
9.00% debentures due 2021 150 150
7.125% debentures due 2023 191 191
8.50% debentures due 2025 300 300
7.95% debentures due 2025 136 136
7.70% debentures due 2026 150 150
7.35% debentures due 2026 62 62
7.85% debentures due 2026 100 100
6.95% debentures due 2027 300 300
7.375% debentures due 2032 1,250 1,250
6.875% debentures due 2033 275 275
Industrial revenue bonds, rates from6.7% to 6.8%, due 2022
88 88
Medium-term notes, rates from 6.6% to7.3%, due 2012–2013
67 94
Other 1 1
4,716 5,291
Less unamortized discounts (6) (7)
Total $4,710 $5,284
Portion due within one year $ — $ 3
In addition to repaying debt that was scheduled to mature, werepaid approximately $572 million, $367 million and$500 million of long-term debt during the years endedDecember 31, 2010, 2009 and 2008, respectively.
Weyerhaeuser recognized pretax charges in 2010 and 2009 of$50 million and $28 million, respectively, and pretax gains in2008 of $32 million, which included early retirement premiums,unamortized debt issuance costs and other miscellaneouscharges in connection with early extinguishment of debt.
Real Estate Long-Term Debt by Types and Interest Rates(Includes Current Portion)
DOLLAR AMOUNTS IN MILLIONS
DECEMBER 31,2010
DECEMBER 31,2009
Notes payable, unsecured; weightedaverage interest rates areapproximately 5.8%, due 2011-2027
$350 $402
Portion due within one year $ 33 $ 40
Amounts of Long-Term Debt Due Annually for the Next FiveYears and the Total Amount Due After 2015
DOLLAR AMOUNTS IN MILLIONS
DECEMBER 31, 2010
FOREST PRODUCTS REAL ESTATE
Long-term debt maturities:
2011 $ — $ 33
2012 $ 529 $188
2013 $ 340 $ 69
2014 $ — $ 15
2015 $ — $ —
Thereafter $3,847 $ 45
NOTE 15: FAIR VALUE OF FINANCIAL INSTRUMENTS
This note provides information about the fair value of our:
•debt and
•other financial instruments.
FAIR VALUE OF DEBT
The estimated fair values and carrying values of our long-termdebt consisted of the following:
DOLLAR AMOUNTS IN MILLIONS
DECEMBER 31, 2010 DECEMBER 31, 2009
CARRYINGVALUE
FAIRVALUE
CARRYINGVALUE
FAIRVALUE
Financial liabilities:
Long-term debt(including currentmaturities)
Forest Products $4,710 $5,029 $5,284 $5,256
Real Estate $ 350 $ 360 $ 402 $ 398
86

To estimate the fair value of long-term debt, we used thefollowing valuation approaches:
•market approach — based on quoted market prices wereceived for the same types and issues of our debt; or
•income approach — based on the discounted value of thefuture cash flows using market yields for the same type andcomparable issues of debt.
The inputs to these valuations are based on market dataobtained from independent sources or information derivedprincipally from observable market data.
The difference between the fair value and the carrying valuerepresents the theoretical net premium or discount we wouldpay or receive to retire all debt at the measurement date.
FAIR VALUE OF OTHER FINANCIAL INSTRUMENTS
We believe that our other financial instruments, including cash,short-term investments, receivables, and payables, have netcarrying values that approximate their fair values with onlyinsignificant differences. This is primarily due to:
•the short-term nature of these instruments,
•carrying short-term investments at expected net realizablevalue and
•the allowance for doubtful accounts.
NOTE 16: LEGAL PROCEEDINGS, COMMITMENTS ANDCONTINGENCIES
This note provides details about our:
•legal proceedings,
•environmental matters and
•commitments and other contingencies.
LEGAL PROCEEDINGS
We are party to legal matters generally incidental to ourbusiness. The ultimate outcome of any legal proceeding:
•is subject to a great many variables and
•cannot be predicted with any degree of certainty.
However, whenever probable losses from litigation couldreasonably be determined — we believe that we haveestablished adequate reserves. In addition, we believe theultimate outcome of the legal proceedings:
•could have a material adverse effect on our results ofoperations, cash flows or financial position in any givenquarter or year; but
•will not have a material adverse effect on our long-termresults of operations, cash flows or financial position.
ENVIRONMENTAL MATTERS
The issues we have concerning environmental matters are:
•site remediation and
•asbestos management.
Site Remediation
Under the Comprehensive Environmental Response,Compensation and Liability Act — commonly known as theSuperfund — and similar state laws, we:
•are a party to various proceedings related to the cleanup ofhazardous waste sites and
•have been notified that we may be a potentially responsibleparty related to the cleanup of other hazardous waste sitesfor which proceedings have not yet been initiated.
Our established reserves. We have established reserves forestimated remediation costs on the active Superfund sites andother sites for which we are responsible.
Changes in the Reserve for Environmental Remediation
DOLLAR AMOUNTS IN MILLIONS
Reserve balance as of December 31, 2009 $31
Reserve charges and adjustments, net 4
Payments (6)
Reserve balance as of December 31, 2010 $29
Total active sites as of December 31, 2010 55
The changes in our reserves for remediation costs reflect:
•new information on any site concerning implementation ofremediation requirements,
•updates on prior cost estimates,
•new sites and
•costs incurred to remediate sites.
Estimates. We believe it is reasonably possible — based oncurrently available information and analysis — that remediationcosts for all identified sites may exceed our reserves by up to$97 million. The increase in potential remediation costs of$67 million in 2010 is primarily due to the bankruptcy of apotentially responsible party with whom we, and other parties,are co-responsible for site remediation.
That estimate — in which those additional costs may beincurred over several years — is the upper end of the range ofreasonably possible additional costs. The estimate:
•is much less certain than the estimates on which ouraccruals are currently based and
•uses assumptions that are less favorable to us among therange of reasonably possible outcomes.
WEYERHAEUSER COMPANY > 2010 ANNUAL REPORT AND FORM 10-K 87

In estimating our current accruals and the possible range ofadditional future costs, we:
•assumed we will not bear the entire cost of remediation ofevery site,
•took into account the ability of other potentially responsibleparties to participate and
•considered each party’s financial condition and probablecontribution on a per-site basis.
We have not recorded any amounts for potential recoveriesfrom insurance carriers.
Asbestos Management
Some of our sites have asbestos containing materials. We havemet our current legal obligation to identify and manage thesematerials. In situations where we cannot reasonably determinewhen asbestos containing materials might be removed from thesites, we have not recognized a liability because its fair valuecannot be reasonably estimated.
COMMITMENTS AND OTHER CONTINGENCIES
Our commitments and contingencies include:
•guarantees of debt and performance,
•purchase obligations for goods and services and
•operating leases.
Guarantees
We have guaranteed the performance of the buyer/lessee of atimberlands lease we sold in 2005. Future payments on thelease — which expires in 2023 — are $20 million.
Our Real Estate segment has guaranteed buyer/lesseeperformance on ground leases that we sold. Future paymentson the leases — which expire in 2041 — are $13 million.
Purchase Obligations
Our purchase obligations as of December 31, 2010 were:
•$60 million in 2011,
•$25 million in 2012,
•$16 million in 2013,
•$15 million in 2014,
•$12 million in 2015 and
•$12 million beyond 2015.
Purchase obligations for goods or services are agreementsthat:
•are enforceable and legally binding,
•specify all significant terms and
•cannot be cancelled without penalty.
The terms include:
•fixed or minimum quantities to be purchased;
•fixed, minimum or variable price provisions; and
•an approximate timing for the transaction.
Our purchase obligations include items such as:
•stumpage and log purchases,
•energy and
•other service and supply contracts.
Operating Leases
Our rent expense was:
•$83 million in 2010,
•$126 million in 2009 and
•$157 million in 2008.
We have operating leases for:
•various equipment — including aircraft, shipping vessels,logging equipment, lift trucks, automobiles and officeequipment;
•office and wholesale space;
•model homes; and
•real estate ground lease.
Commitments
Our operating lease commitments as of December 31, 2010were:
•$88 million in 2011,
•$94 million in 2012,
•$48 million in 2013,
•$20 million in 2014,
•$17 million in 2015 and
•$154 million beyond 2015.
Operating lease commitments have not been reduced byminimum sublease rental income of $67 million that is due infuture periods under noncancellable sublease agreements.These commitments include a lease that has commitmentincreases based on a consumer price index built into theagreement. These lease commitment increases are notincluded in the figures above.
NOTE 17: SHAREHOLDERS’ INTEREST
This note provides details about:
•preferred and preference shares,
•common shares,
•Special Dividend,
•share-repurchase programs, and
•cumulative other comprehensive loss.
88

PREFERRED AND PREFERENCE SHARES
We had no preferred or preference shares outstanding at theend of 2010 or 2009.
However, we have authorization to issue:
•7 million preferred shares with a par value of$1 per share and
•40 million preference shares with a par value of$1 per share.
We may issue preferred or preference shares at one time orthrough a series of offerings. The shares may have varyingrights and preferences that can include:
•dividend rates,
•redemption rights,
•conversion terms,
•sinking-fund provisions,
•values in liquidation and
•voting rights.
When issued, outstanding preferred and preference shares ranksenior to outstanding common shares. That means preferredand preference shares would receive dividends and assetsavailable on liquidation before any payments are made tocommon shares.
COMMON SHARES
We had 536 million shares of common stock outstanding atyear-end 2010.
The number of common shares we have outstanding changeswhen:
•new shares are issued,
•stock options are exercised,
•restricted stock units vest,
•shares are tendered,
•shares are repurchased or
•shares are cancelled.
Reconciliation of Our Common Share Activity
IN THOUSANDS
2010 2009 2008
Outstanding at beginning of year 211,359 211,289 209,546
Retraction or redemption ofexchangeable shares
— — 1,585
Stock options exercised 133 1 68
Issued for restricted stock units 165 135 94
Issued as part of Special Dividend 324,319 — —
Repurchased — (66) —
Cancelled — — (4)
Outstanding at end of year 535,976 211,359 211,289
SPECIAL DIVIDEND
To implement our decision to be taxed as a REIT, we distributedour accumulated earnings and profits, determined under federalincome tax provisions, to our shareholders as a SpecialDividend. The Special Dividend of $5.6 billion was paidSeptember 1, 2010, and included the regular quarterly dividendof approximately $11 million. At the election of eachshareholder, the Special Dividend was paid in cash orWeyerhaeuser common shares. The aggregate amount of cashdistributed was $560 million and the number of commonshares issued was approximately 324 million. Due todifferences between book and tax earnings, the amount of theSpecial Dividend exceeded our book retained earnings. Forbook accounting purposes, the reduction in our retainedearnings was limited to the outstanding balance of our retainedearnings at the time of distribution. More information about theREIT conversion can be found in Note 2: Real EstateInvestment Trust (REIT) Conversion.
OUR SHARE REPURCHASE PROGRAM
In December 2008, we announced a stock-repurchase programunder which we are authorized to repurchase up to$250 million of outstanding shares. We repurchased a total of66,691 shares of common stock for approximately $2 millionunder the program during 2009. All common stock purchasesunder the program were made in open-market transactions. Wehave not repurchased any more common shares since 2009.
CUMULATIVE OTHER COMPREHENSIVE LOSS
The components of our cumulative other comprehensive lossare:
DOLLAR AMOUNTS IN MILLIONS
DECEMBER 31,2010
DECEMBER 31,2009
Foreign currency translationadjustments
$ 419 $ 389
Net pension and other postretirementbenefit loss not yet recognized inearnings
(1,358) (1,192)
Prior service credit not yet recognizedin earnings
145 136
Unrealized gains on available-for-salesecurities
3 3
Total $ (791) $ (664)
More information about the changes in net pension and otherpostretirement benefit loss not yet recognized in earnings andprior service credit not yet recognized in earnings can be foundin Note 9: Pension and Other Postretirement Benefit Plans.
WEYERHAEUSER COMPANY > 2010 ANNUAL REPORT AND FORM 10-K 89

NOTE 18: SHARE-BASED COMPENSATION
Share-based compensation expense was:
•$24 million in 2010,
•$26 million in 2009 and
•$47 million in 2008.
This note provides details about:
•our Long-Term Incentive Compensation Plan,
•how we account for share-based awards,
•tax benefits of share-based awards,
•types of share-based compensation and
•unrecognized share-based compensation.
OUR LONG-TERM INCENTIVE COMPENSATION PLAN
Our Long-Term Incentive Compensation Plan (the Plan) providesfor share-based awards that include:
•stock options,
•stock appreciation rights,
•restricted stock,
•restricted stock units,
•performance shares and
•performance share units.
We may issue future grants of up to 10,033,509 shares underthe Plan. We also have the right to reissue forfeited grants.
For stock options and stock appreciation rights:
•An individual participant may receive a grant of up to1,327,093 shares in any one calendar year.
•The exercise price is required to be the market price on thedate of the grant.
For restricted stock, restricted stock units, performance shares,performance share units or other equity grants:
•An individual participant may receive a grant of up to540,584 shares annually.
•The maximum aggregate number of shares that may beissued as grants is 9.2 million shares.
The compensation committee of our board of directors (theCommittee) annually establishes an overall pool of stockawards available for grants based on performance.
For stock-settled awards, we:
•issue new stock into the marketplace and
•generally do not repurchase shares in connection withissuing new awards.
Our common shares would increase by approximately 48 millionshares if all share-based awards were exercised or vested.These include:
•all options, restricted stock units, and performance shareunits outstanding at December 31, 2010 under the Plan;
•all options outstanding at December 31, 2010 under earlierplans; and
•all remaining options, restricted stock units, and performanceshare units that could be granted under the Plan.
HOW WE ACCOUNT FOR SHARE-BASED AWARDS
We:
•use a fair-value-based measurement for share-based awards,and
•recognize the cost of share-based awards in our consolidatedfinancial statements.
We recognize the cost of share-based awards in ourConsolidated Statement of Operations over the required serviceperiod — generally the period from the date of the grant to thedate when it is vested. Special situations include:
•Awards that vest upon retirement — the required serviceperiod ends on the date an employee is eligible forretirement, including early retirement.
•Awards that continue to vest following job elimination or thesale of a business — the required service period ends on thedate the employment from the company is terminated.
In these special situations, compensation expense from share-based awards is recognized over a period that is shorter thanthe stated vesting period.
TAX BENEFITS OF SHARE-BASED AWARDS
Our total income tax benefit from share-based awards — asrecognized in our Consolidated Statement of Operations — forthe last three years was:
•$4 million in 2010,
•$9 million in 2009 and
•$19 million in 2008.
Tax benefits for share-based awards are accrued as stockcompensation expense is recognized in the ConsolidatedStatement of Operations. Tax benefits on share-based awardsare realized when:
•restricted shares and restricted share units vest,
•performance shares and performance share units vest,
•stock options are exercised and
•stock appreciation rights are exercised.
90

When actual tax benefits realized exceed the tax benefitsaccrued for share-based awards, we realize an excess taxbenefit. We report the excess tax benefit as financing cashinflows rather than operating cash inflows. We had no excesstax benefits in 2010, 2009 or 2008.
TYPES OF SHARE-BASED COMPENSATION
Our share-based compensation is in the form of:
•stock options,
•restricted stock units,
•performance share units,
•stock appreciation rights and
•deferred compensation stock equivalent units.
Our Long-Term Incentive Compensation Plan requiresoutstanding stock options, stock appreciation rights andrestricted stock units to be adjusted as a result of the SpecialDividend. See Note 2: Real Estate Investment Trust (REIT)Conversion. For outstanding stock options and stockappreciation rights, the number of awards increased and theexercise price decreased, by a ratio of the closing price of ourcommon stock on the New York Stock Exchange on July 19,2010 to the opening price on July 20, 2010. Outstandingrestricted stock units were credited with the Special Dividendpaid per share.
STOCK OPTIONS
Stock options entitle award recipients to purchase shares ofour common stock at a fixed exercise price. We grant stockoptions with an exercise price equal to the market price of ourstock on the date of the grant.
The Details
Our stock options generally:
•vest over four years of continuous service and
•must be exercised within 10 years of the grant date.
Exceptions are that the stock options generally:
•vest upon retirement for employees aged 65 or older, oremployees aged 62 – 64 with at least 10 years of service;
•continue to vest following retirement for employees ages55 – 61 with at least 10 years of service; and
•continue to vest following involuntary termination due to jobelimination or the sale of a business.
During first quarter 2009, we awarded selected executives withspecial stock options that:
•vest at the end of four years of continuous service and
•must be exercised within ten years of the grant date.
Our Accounting
We use a Black-Scholes option valuation model to estimate thefair value of every stock option award on its grant date.
In our estimates, we use:
•historical data — for option exercise time and employeeterminations;
•a Monte-Carlo simulation — for how long we expect grantedoptions to be outstanding; and
•the U.S. Treasury yield curve — for the risk-free rate. We usea yield curve over a period matching the expected term of thegrant.
The expected volatility in our valuation model is based on:
•implied volatilities from traded options on our stock,
•historical volatility of our stock and
•other factors.
Weighted Average Assumptions Used in Estimating Value ofStock Options Granted
2010GRANTS
2009 GRANTS 2008GRANTS
10-YEARSTANDARD
OPTIONS
10-YEARSTANDARD
OPTIONS
10-YEAREXECUTIVE
OPTIONS
10-YEARSTANDARD
OPTIONS
Expected volatility 37.62% 36.61% 36.51% 30.84%
Expecteddividends
0.51% 3.95% 3.95% 3.87%
Expected term (inyears)
5.16 6.16 7.08 5.92
Risk-free rate 2.52% 2.54% 2.75% 3.20%
Weighted averagegrant date fairvalue
$ 5.28 $ 6.45 $ 6.69 $ 13.74
Share-based compensation expense for stock options isgenerally recognized over the vesting period. There areexceptions for stock options awarded to employees who:
•are eligible for retirement,
•will become eligible for retirement during the vestingperiod or
•whose employment is terminated during the vesting perioddue to job elimination or the sale of a business.
In these cases, we record the share-based compensationexpense over a required service period that is less than thestated vesting period.
WEYERHAEUSER COMPANY > 2010 ANNUAL REPORT AND FORM 10-K 91

Activity
The following table shows our option unit activity for 2010.
OPTIONS(IN
THOUSANDS)
WEIGHTEDAVERAGEEXERCISE
PRICE
WEIGHTEDAVERAGE
REMAININGCONTRACTUAL
TERM(IN YEARS)
AGGREGATEINTRINSICVALUE (IN
MILLIONS)
Outstanding atDecember 31,2009
11,832 $ 60.67
Granted 1,282 $ 38.82
Exercised (146) $ 22.86
Forfeited orexpired
(651) $ 37.81
Adjustment asresult ofSpecialDividend
21,062 N/A
Outstanding atDecember 31,2010
33,379 $ 22.16 5.41 $ —
Exercisable atDecember 31,2010
24,582 $ 24.31 4.43 $ —
RESTRICTED STOCK UNITS
Through the Plan, we award restricted stock units — grants thatentitle the holder to shares of our stock as the award vests.
The Details
Our restricted stock units granted in 2010 generally:
•vest over four years of continuous service; and
•will be forfeited upon termination of employment, except inthe event of involuntary termination where the units continueto vest for one year.
Our restricted stock units granted in 2009 generally:
•vest over four years of continuous service; and
•are forfeited upon termination of employment for any reason,including retirement.
Our restricted stock units granted in 2008 generally:
•vest over four years of continuous service; and
•continue to vest in the event of retirement, including earlyretirement, or upon termination of employment due to jobelimination or the sale of a business.
Our Accounting
The fair value of our restricted stock units is the market price ofour stock on the grant date of the awards.
We generally record share-based compensation expense forrestricted stock units over the four-year vesting period. For
restricted stock units granted in 2008 that continue to vestfollowing the termination of employment, we record the share-based compensation expense over a required service periodthat is less than the stated vesting period. For all other grantyears, we reverse the expense related to the unvested portionof the award following termination of employment.
Activity
The following table shows our restricted stock unit activity for2010.
STOCK UNITS(IN THOUSANDS)
WEIGHTEDAVERAGE
GRANT-DATEFAIR VALUE
Nonvested at December 31, 2009 637 $ 53.06
Granted 340 $ 39.33
Vested (234) $ 58.27
Forfeited (21) $ 43.95
Special Dividend 1,241 N/A
Nonvested at December 31, 2010 1,963 $ 26.44
Nonvested restricted stock units accrue dividends that are paidout when restricted stock units vest. The Special Dividendrepresents shares related to the Special Dividend that will beissued as units vest. Any restricted stock units forfeited will notreceive dividends.
As restricted stock units vest, a portion of the shares awardedis withheld to cover employee taxes. As a result, the number ofstock units vested and the number of common shares issuedwill differ.
PERFORMANCE SHARE UNITS
The performance period for the unvested Performance ShareUnits ended December 31, 2009. The minimum performancethreshold was not met, and all previously recognizedcompensation costs were reversed. During 2010, all unvestedperformance share unit awards were cancelled.
STOCK APPRECIATION RIGHTS
Through the Plan, we grant cash-settled stock appreciationrights as part of certain compensation awards.
The Details
Stock appreciation rights are similar to stock options.Employees benefit when the market price of our stock is higheron the exercise date than it was on the date the stockappreciation rights were granted. The differences are that theemployee:
•receives the benefit as a cash award and
•does not purchase the underlying stock.
92

The vesting conditions and exceptions are the same as for10-year stock options. Details are in the Stock Options sectionearlier in this note.
Stock appreciation rights are generally issued to employeesoutside of the U.S.
Our Accounting
We use a Black-Scholes option-valuation model to estimate thefair value of a stock appreciation right on its grant date andevery subsequent reporting date that the right is outstanding.Stock appreciation rights are liability-classified awards and thefair value is remeasured at every reporting date.
The process used to develop our valuation assumptions is thesame as for the 10-year stock options we grant. Details are inthe Stock Options section earlier in this note.
Weighted Average Assumptions Used to Re-measure Value ofStock Appreciation Rights at Year-End
DECEMBER 31, 2010
Expected volatility 39.12%
Expected dividends 1.05%
Expected term (in years) 2.73
Risk-free rate 1.01%
Weighted average fair value $3.98
Activity
The following table shows our stock appreciation rights activityfor 2010.
RIGHTS(IN
THOUSANDS)
WEIGHTEDAVERAGEEXERCISE
PRICE
AVERAGEREMAINING
CONTRACTUALTERM
(IN YEARS)
AGGREGATEINTRINSICVALUE (IN
MILLIONS)
Outstanding atDecember 31,2009
754 $62.54
Granted 71 $39.29
Exercised (3) $22.69
Forfeited orexpired
(90) $52.62
Adjustment asa result ofspecialdividend
1,257 N/A
Outstanding atDecember 31,2010
1,989 $22.74 5.84 $ —
Exercisable atDecember 31,2010
1,382 $24.92 4.94 $ —
UNRECOGNIZED SHARE-BASED COMPENSATION
As of December 31, 2010, our unrecognized share-basedcompensation cost for all types of share-based awardsincluded:
•$28 million related to non-vested equity-classified share-based compensation arrangements — expected to berecognized over a weighted-average period of approximately1.89 years; and
•$2 million related to non-vested liability-classified stockappreciation rights — expected to vest over a weighted-average period of approximately 2.1 years.
DEFERRED COMPENSATION STOCK EQUIVALENT UNITS
Certain employees and our board of directors can defercompensation into stock-equivalent units.
The Details
The plan works differently for employees and directors.
Eligible employees:
•may choose to defer all or part of their bonus into stock-equivalent units and
•receive a 15 percent premium if the deferral is for at leastfive years.
Our directors:
•have a portion of their annual retainer fee automaticallydeferred into stock-equivalent units,
•may choose to defer some or all of the remainder of theirannual retainer fee into stock-equivalent units and
•do not receive a premium for their deferrals.
Employees and directors also choose when the deferrals will bepaid out although no deferrals may be paid until after theseparation from service of the employee or director.
Our Accounting
We settle all deferred compensation accounts in cash. Inaddition, we credit all stock-equivalent accounts with dividendequivalents.
Stock-equivalent units are:
•liability-classified awards and
•re-measured to fair value at every reporting date.
The fair value of a stock-equivalent unit is equal to the marketprice of our stock.
WEYERHAEUSER COMPANY > 2010 ANNUAL REPORT AND FORM 10-K 93

Activity
The number of stock-equivalent units outstanding in ourdeferred compensation accounts was:
•1,027,768 as of December 31, 2010;
•430,789 as of December 31, 2009; and
•427,233 as of December 30, 2008.
During 2010, the number of stock-equivalent units outstandingin our deferred compensation accounts increased by 664,957as a result of the Special Dividend.
NOTE 19: CHARGES FOR RESTRUCTURING, CLOSURESAND ASSET IMPAIRMENTSItems Included in Our Restructuring, Closure and AssetImpairment Charges
DOLLAR AMOUNTS IN MILLIONS
2010 2009 2008
Restructuring and closure charges:
Termination benefits $ 23 $102 $ 104
Pension and postretirement charges 7 116 13
Other restructuring and closure costs 5 29 17
Reversal of restructuring and closurecharges recorded in prior periods
— — (7)
Subtotal: 35 247 127
Less: discontinued operations — — (7)
Charges for restructuring and closures $ 35 $247 $ 120
Impairments of long-lived assets and otherrelated charges:
Charges attributable to Weyerhaeusershareholders:
Long-lived asset impairments $ 92 $157 $ 110
Real estate impairments and charges 13 206 943
Write-off of pre-acquisition costs andabandoned community costs
5 52 74
Goodwill — 3 838
Other assets 4 17 8
Charges attributable to non-controllinginterests
— 16 31
Total impairments of long-lived assetsand other related charges
114 451 2,004
Less discontinued operations — — (6)
Impairment of long-lived assets and otherrelated charges
$114 $451 $1,998
Total charges for restructuring andimpairment of long-lived assets
$149 $698 $2,118
Impairments of investments and otherrelated charges:
Charges attributable to Weyerhaeusershareholders
3 3 128
Charges attributable to non-controllinginterests
— 4 32
Total impairments of investments and otherrelated charges
$ 3 $ 7 $ 160
RESTRUCTURING AND CLOSURES
Our restructuring and closure charges were primarily related tothe following:
•2010 and 2009 — we closed or curtailed various WoodProducts operations and restructured corporate stafffunctions to support achieving our competitive performancegoals.
•2008 — we reduced the number of employees after the saleof our Containerboard, Packaging and Recycling business andto support achieving our competitive performance goals. Inaddition, we closed or curtailed various Wood Productsoperations.
Pension and postretirement charges include a $76 millionnoncash pension charge during 2009 triggered by the amountof lump-sum distributions paid in 2009 to former employees —see Note 9: Pension and Other Postretirement Benefit Plans formore information.
Other restructuring and closure costs include lease terminationcharges, dismantling and demolition of plant and equipment,gain or loss on disposition of assets, environmental cleanupcosts and incremental costs to wind down operating facilities.
ACCRUED TERMINATION BENEFITS
Changes in accrued severance related to restructuring andfacility closures during 2010 were as follows:
DOLLAR AMOUNTS IN MILLIONS
Accrued severance as of December 31, 2009 $ 22
Charges 23
Payments (25)
Accrued severance as of December 31, 2010 $ 20
The majority of the accrued severance balance as ofDecember 31, 2010, is expected to be paid by the end of2011.
ASSET IMPAIRMENTS
The Impairment of Long-Lived Assets and Goodwill sections ofNote 1: Summary of Significant Accounting Policies providedetails about how we account for these impairments.
Long-Lived Assets
Our long-lived asset impairments were primarily related to thefollowing:
•2010 — charges are primarily related to the decision topermanently close three Wood Products facilities that werepreviously indefinitely closed. These include an engineeredwood products facility in Deerwood, Minnesota, a sawmillin Pine Hill, Alabama and an oriented strand board mill in
94

Wawa, Ontario. The fair values of the assets weredetermined using significant other observable inputs (Level2) based on market quotes and significant unobservableinputs (Level 3) based on discounted cash flow models.
•2009 — charges for Wood Products facilities included$74 million related to engineered wood products facilities inHazard, Kentucky and Valdosta, Georgia. In addition, chargesincluded $30 million related to corporate-region buildings and$11 million related to a lumber mill in Brazil. The fair valuesof the assets were determined using significant otherobservable inputs (Level 2) based on market quotes andsignificant unobservable inputs (Level 3) based ondiscounted cash flow models.
•2008 — charges for Wood Products facilities included a$27 million charge related to the assets of the Trust Joist®Commercial division and $37 million related to orientedstrand board facilities in Drayton Valley, Alberta andMiramichi, New Brunswick.
Real Estate Impairments and Charges
We review homebuilding long-lived assets and investmentswithin our Real Estate segment for impairment whenever eventsor changes in circumstances indicate that the carrying amountof the assets may not be recoverable. These assets are statedat cost unless events or circumstances trigger an impairmentreview. If a triggering event occurs and the asset’s carryingamount is not recoverable, we record an impairment loss,which is the difference between the asset’s book value andfair value. The determination of fair value is based onappraisals and market pricing of comparable assets when thatinformation is available, or the discounted value of estimatedfuture net cash flows from these assets.
During 2008 and 2009, unfavorable market conditions causedus to re-evaluate our strategy to develop certain projects,reduce sales prices, and increase customer incentives. Assetimpairments are recorded as adjustments to the cost basis ofinventory and investments. Because of such changes, wereassessed the recoverability of several of our investments,which triggered impairment charges.
The number of real estate projects owned or operated by usranged from approximately 100 to 125 during 2009 and 2010.This includes communities where we were actively building homesor developing land and land positions held for future development.The table below provides, for each period indicated:
•the number of projects that were tested for recoverability asa result of triggering events that occurred during the period,
•the number of projects for which impairment charges wererecognized in the period,
•the amount of real estate impairment charges attributable toWeyerhaeuser shareholders that were recognized in theperiod and
•additional information about the fair value of assets impairedin the period.
Real estate impairments relate primarily to projects, orcommunities, held for development. Within a community that isheld for development, there may be individual homes or parcelsof land that are currently held for sale. Impairment chargesrecognized as a result of adjusting individual held-for-saleassets within a community to estimated fair value less cost tosell are also included in the total impairment charges below. Anindividual project or held-for-sale asset may have been testedfor recoverability and impairment charges may have beenrecognized in more than one quarter.
DOLLAR AMOUNTS IN MILLIONS Fair Value Measurements Using
Number ofProjects
Tested forRecoverability
Number ofProjects
Impaired
ImpairmentCharges
Recognized
FairValue of
ImpairedAssets
SignificantOther
ObservableInputs
(Level 2)
SignificantUnobservable
Inputs(Level 3)
Real estate communities:
First Quarter 2010 12 2 $ 1 $ 7 $ 5 $ 2
Second Quarter 2010 15 1 $ 1 $ 9 $ 8 $ 1
Third Quarter 2010 11 — $ — $ — $ — $ —
Fourth Quarter 2010 15 2 $ 11 $17 $ 6 $11
Total 2010 $ 13
First Quarter 2009 59 9 $ 15 $17 $ 9 $ 8
Second Quarter 2009 44 17 $ 45 $73 $40 $33
Third Quarter 2009 41 12 $ 41 $59 $48 $11
Fourth Quarter 2009 25 8 $105 $60 $15 $45
Total 2009 $206
WEYERHAEUSER COMPANY > 2010 ANNUAL REPORT AND FORM 10-K 95

The significant unobservable inputs used in amounts reportedabove are discounted future cash flows of the projects. We usepresent value techniques based on discounting the estimatedcash flows using a rate commensurate with the inherent riskassociated with the assets and related estimated cash flowstreams. Discount rates applied to the estimated future cashflows of our homebuilding assets for 2010 ranged from15 percent to 18 percent. Discount rates applied to theestimated future cash flows of our homebuilding assets for2009 ranged from 12 percent to 25 percent.
During 2008, we recognized $69 million of charges for theimpairment of interest that previously was capitalized on RealEstate assets.
Write-off of Pre-Acquisition Costs and Abandoned CommunityCosts
In addition to owning land and residential lots, we also haveoption agreements to purchase land and lots at a future date.As of December 31, 2010, we have option agreements onapproximately 63,000 residential lots. When the economics ofa project no longer support acquisition of the land or lots underoption, we may elect not to move forward with the acquisition.Option deposits and capitalized engineering and related costsassociated with the assets under option may be forfeited atthat time. Charges for such forfeitures are reported as write-offof pre-acquisition costs.
Also included in 2009 are charges for abandoned communitycosts, which include the write-off of unamortized costs relatedto projects that have been closed prior to full build-out orrelated to model complex costs written off due to decisions tosell active communities in their current condition or to changehome styles offered within a community.
Goodwill
Our impairments of goodwill were primarily related to thefollowing:
•2009 — the goodwill associated with the hardwoods andindustrial wood products reporting unit.
•2008 — as a result of the collapse of financial markets infourth quarter 2008, accompanied by accelerateddeterioration of housing markets and declining demand forpulp products in emerging Asian markets, the estimated fairvalue of certain of our reporting units fell below the carryingvalue of those units. This triggered the goodwill impairmentsin our Wood Products segment of $744 million and$94 million in our Cellulose Fibers segment during fourthquarter.
Impairments of Investments and Other Related Charges
Impairments of investments and other related charges relate toloans and investments in unconsolidated entities.
NOTE 20: OTHER OPERATING COSTS (INCOME), NET
These costs (income):
•include both recurring and occasional income and expenseitems and
•fluctuate from year to year.
Various Income and Expense Items Included in OtherOperating Costs (Income), Net
DOLLAR AMOUNTS IN MILLIONS
2010 2009 2008
Gain on the sale of non-strategictimberlands
$ — $(163) $ —
Gain on the sale of five short line railroads (46) — —
Gain on the sale of Containerboard,Packaging and Recycling operations(Note 4)
— — (1,175)
Gain on the sale of Australian operations(Note 4)
— — (212)
Gain from change in postretirement benefits(Note 9)
— — (52)
Gain on disposition of assets (69) (22) (29)
Insurance settlement and casualty losses — (11) 19
Foreign exchange (gains) losses, net (8) (41) 48
Land management income (26) (20) (22)
Litigation expense, net 18 18 26
Other, net (37) (27) 5
(168) (266) (1,392)
Less discontinued operations — — 1,405
Total $(168) $(266) $ 13
Gain on disposition of assets in 2010 included pretax gains of$40 million from the sale of certain British Columbia forestlicenses and associated rights, $13 million from the sale ofclosed facilities, $4 million from the sale of a sawmill and$4 million from the sale of distribution centers.
The $163 million pretax gain on sale of non-strategictimberlands in 2009 resulted from the sale of 140,000 acresin northwestern Oregon.
The total pretax gain on the 2008 sale of our Australianoperations was $218 million; $212 million was recorded inother operating income, net and $6 million was recorded inequity in income of affiliates. The full $218 million is presentedon the Consolidated Statement of Operations as earnings fromdiscontinued operations, net of taxes.
Foreign exchange (gains) losses result from changes inexchange rates primarily related to our Canadian operations.
96

Land management income includes income from recreationalactivities, land permits, grazing rights, firewood sales and othermiscellaneous income related to land management activities.
Subsequent to the end of 2010, we sold 82,000 acres ofnon-strategic timberlands in southwestern Washington for apretax gain of approximately $150 million.
NOTE 21: INCOME TAXES
This note provides details about our income taxes applicable tocontinuing operations:
•earnings (loss) before income taxes,
•provision for income taxes,
•effective income tax rate,
•deferred tax assets and liabilities and
•unrecognized tax benefits.
Income taxes related to discontinued operations are discussedin Note 4: Discontinued Operations.
EARNINGS (LOSS) BEFORE INCOME TAXES
Domestic and Foreign Earnings (Loss) From ContinuingOperations Before Income Taxes
DOLLAR AMOUNTS IN MILLIONS
2010 2009 2008
Domestic earnings (loss) $110 $(673) $(2,305)
Foreign loss (14) (169) (504)
Total $ 96 $(842) $(2,809)
PROVISION FOR INCOME TAXES
Provision for Income Taxes From Continuing Operations
DOLLAR AMOUNTS IN MILLIONS
2010 2009 2008
Federal:
Current $ 58 $(350) $(475)
Deferred (1,180) 133 (290)
(1,122) (217) (765)
State:
Current 3 (2) —
Deferred (69) (22) (57)
(66) (24) (57)
Foreign:
Current 9 12 (50)
Deferred (8) (45) (28)
1 (33) (78)
Total income tax benefit $(1,187) $(274) $(900)
EFFECTIVE INCOME TAX RATE
Effective Income Tax Rate Applicable to ContinuingOperations
DOLLAR AMOUNTS IN MILLIONS
2010 2009 2008
U.S. federal statutory income tax $ 34 $(295) $(983)
State income taxes, net of federal taxbenefit
4 (25) (53)
REIT income not subject to federalincome tax
(37) — —
Foreign taxes 4 23 14
Uruguay restructuring gains — — (86)
Federal income tax credits (4) (6) (10)
Taxes on qualified timber sales — — (57)
Medicare Part D subsidy 26 2 (3)
Provision for unrecognized tax benefits (3) 18 (23)
Goodwill impairment — 1 291
REIT conversion benefit (1,064) — —
Cellulosic biofuel producer credit (149) — —
Noncontrolling interests (1) 8 25
Other, net 3 — (15)
Total income tax benefit $(1,187) $(274) $(900)
Effective income tax rate N/M* 32.5% 32.0%
* Not meaningful
In 2008, we restructured our ownership interests in Uruguay asdiscussed in Note 8: Equity Affiliates. The restructuring resulted inthe recognition of a $250 million noncash gain for financialaccounting purposes related to the partitioning of assets of a jointventure among joint venture partners. There is no tax provision onthe gain, due to a forestry exemption from income taxes inUruguay, and the assets are considered indefinitely invested.
In 2008, the company recognized goodwill-impairment chargesas discussed in Note 19: Charges for Restructuring, Closuresand Asset Impairments due to the estimated fair value ofcertain reporting units falling below the carrying value of thoseunits. These charges are not deductible for income taxpurposes and represent a permanent book-tax difference. As aresult, no tax benefit has been recognized for these charges.
In addition, timber provisions in the Food, Conservation andEnergy Act of 2008 enacted May 22, 2008, resulted in a taxbenefit of $57 million. The provision is effective for one yearand reduces the capital gains tax rate on qualified timber salesfrom 35 percent to 15 percent.
One-Time Deferred Tax Benefits/Charges
As a result of the Patient Protection and Affordable Care Act, asmodified by the Health Care and Education Reconciliation Act
WEYERHAEUSER COMPANY > 2010 ANNUAL REPORT AND FORM 10-K 97

and a change in our postretirement medical plan, it wasdetermined that previously recognized deferred tax assetsrelated to the income tax deduction for prescription drugbenefits provided to retirees and reimbursed under theMedicare Part D subsidy would not be realized and a$32 million charge was recorded in 2010.
In 2010, we reversed certain deferred income tax liabilities,primarily relating to temporary differences of timber assets, asa result of our conversion to a REIT. See Note 2: Real EstateInvestment Trust (REIT) Conversion.
There were no one-time deferred tax benefits or charges during2008 or 2009.
Fuel Credits
During 2009, the U.S. Internal Revenue Code allowed a $0.50per gallon tax credit for the alternative fuel component ofalternative fuel mixtures produced and used as a fuel in ataxpayer’s trade or business. Our application for registration asa blender based on our use of black liquor as an alternativefuel was approved in May 2009. We began blending black liquor(a byproduct of our wood pulping process) and diesel fuelduring the first week of April 2009 and blended and usedapproximately 688 million gallons of the alternative fuel mixturethrough December 31, 2009, resulting in $344 million ofcredits. The alternative fuel mixture credit expired onDecember 31, 2009.
In an IRS memo dated June 28, 2010, the IRS concluded thatblack liquor sold or used in 2009 qualifies for the cellulosicbiofuel producer credit. With the recognition that black liquorpotentially qualifies for either the cellulosic biofuel producercredit or the alternative fuel mixture credit (but not both on thesame gallon of black liquor), the IRS has provided instructionsthat would allow a taxpayer to refund alternative fuel mixturecredits already received and claim the higher cellulosic biofuelproducer credit. We received our registration as a cellulosicbiofuel producer in third quarter 2010. In an IRS memo datedOctober 5, 2010, the IRS concluded that both the alternativefuel mixture credit and the cellulosic biofuel producer creditcould be claimed by a taxpayer in the same year. During 2009,we produced approximately 238 million gallons of black liquor,which did not qualify for the alternative fuel mixture credit. Thisequals $240 million of potential cellulosic biofuel producercredit at $1.01 per gallon, or $149 million net of tax, which werecognized in fourth quarter 2010. Since this credit offsets ourincome tax liability, we will carry the credit forward.
DEFERRED TAX ASSETS AND LIABILITIES
Deferred tax assets and liabilities reflect temporary differencesbetween pretax book income and taxable income. Deferred tax
assets represent tax benefits that have already been recordedfor book purposes but will be recorded for tax purposes in thefuture. Deferred tax liabilities represent income that has beenrecorded for book purposes but will be reported as taxableincome in the future.
Deferred Income Tax Assets (Liabilities) Related toContinuing Operations by Category
DOLLAR AMOUNTS IN MILLIONS
DECEMBER 31,2010
DECEMBER 31,2009
Forest Products:
Current $ 113 $ 109
Noncurrent (366) (1,538)
Real Estate 266 299
Net deferred tax assets (liabilities) $ 13 (1,130)
Items Included in Our Deferred Income Tax Assets (Liabilities)
DOLLAR AMOUNTS IN MILLIONS
DECEMBER 31,2010
DECEMBER 31,2009
Postretirement benefits $ 172 $ 282
Incentive compensation 56 65
Pension 109 213
Real estate impairments 205 200
State tax credits 57 55
Net operating loss carryforwards 140 191
Cellulosic biofuel producers credit 240 —
Other 334 371
Gross deferred tax assets 1,313 1,377
Valuation allowance (120) (103)
Net deferred tax assets 1,193 1,274
Property, plant and equipment (668) (776)
Timber installment notes (277) (286)
Timberlands (24) (1,089)
Other (211) (253)
Deferred tax liabilities (1,180) (2,404)
Net deferred tax assets (liabilities) $ 13 $(1,130)
OTHER INFORMATION ABOUT OUR DEFERRED INCOME TAXASSETS (LIABILITIES)
Other information about our deferred income tax assets(liabilities) include:
•net operating loss carryforwards,
•valuation allowances and
•reinvestment of undistributed earnings.
98

Net Operating Loss Carryforwards
Our state and foreign net operating loss carryforwards as of theend of 2010 are as follows:
•$488 million, which expire from 2011 through 2030; and
•$130 million, which do not expire.
Valuation Allowances
With the exception of the valuation allowance discussed below,we believe it is more likely than not that we will have sufficientfuture taxable income to realize our deferred tax assets.
Our valuation allowance on our deferred tax assets was$120 million as of the end of 2010. This primarily related toforeign net operating losses and state and provincial credits.
Total changes in our valuation allowance over the last yearwere:
•$17 million net increase in 2010. This net increase resultedprimarily from:– $2 million increase due to foreign exchange;– $10 million increase due to the change in expectations of
future use of state credits and net operating losscarryforwards; and
– $5 million increase due to additional foreign losses.
Reinvestment of Undistributed Earnings
We have approximately $22 million in undistributed earningsfrom our foreign subsidiaries as of the end of 2010. We havereinvested our foreign undistributed earnings; therefore they arenot subject to U.S. income taxes. Generally, such earningsbecome subject to U.S. tax upon the remittance of dividendsand under certain other circumstances. It is not practicable toestimate the amount of deferred tax liability on suchundistributed earnings.
HOW WE ACCOUNT FOR INCOME TAXES
The Income Taxes section of Note 1: Summary of SignificantAccounting Policies provides details about how we account forour income taxes.
UNRECOGNIZED TAX BENEFITS
Unrecognized tax benefits represent potential future fundingobligations to taxing authorities if uncertain tax positions wehave taken on previously filed tax returns are not sustained.The total amount of unrecognized tax benefits as ofDecember 31, 2010, and December 31, 2009, are$180 million and $170 million, respectively, which does notinclude related interest of $30 million and $23 million,
respectively. These amounts represent the gross amount ofexposure in individual jurisdictions and do not reflect anyadditional benefits expected to be realized if such positionswere not sustained, such as the federal deduction that couldbe realized if an unrecognized state deduction was notsustained.
Reconciliation of the Beginning and Ending Amount ofUnrecognized Tax Benefits
DOLLAR AMOUNTS IN MILLIONS
DECEMBER 31,2010
DECEMBER 31,2009
Balance at beginning of year $170 $114
Additions based on tax positionsrelated to current year
1 53
Additions for tax positions of prioryears
17 —
Reductions for tax positions of prioryears
(6) (4)
Foreign currency translation 4 12
Settlements — —
Lapse of statute (6) (5)
Balance at end of year $180 $170
The net liability recorded in our Consolidated Balance Sheetrelated to unrecognized tax benefits was $48 million as ofDecember 31, 2010, and $132 million as of December 31,2009, which includes interest of $27 million and $22 millionrespectively, net of payments made in advance of settlements.
The net liability recorded for tax positions across alljurisdictions that, if sustained, would affect our effective taxrate was $98 million as of December 31, 2010, and$96 million as of December 31, 2009, which includes interestof $27 million and $22 million, respectively.
In accordance with our accounting policy, we accrue interestand penalties related to unrecognized tax benefits as acomponent of income tax expense.
As of December 31, 2010, our 2007 federal income tax auditis complete. Our 2008 and 2009 federal income tax audit hasnot yet begun. We are also undergoing examination in variousstate and foreign jurisdictions for the 2005 - 2009 tax years.We expect that the outcome of any examination will not have amaterial effect on our consolidated financial statements;however, audit outcomes and the timing of audit settlementsare subject to significant uncertainty.
In the next 12 months, we estimate a decrease of up to$3 million in unrecognized tax benefits on several individuallyinsignificant tax positions due to the lapse of applicablestatutes of limitation in multiple jurisdictions.
WEYERHAEUSER COMPANY > 2010 ANNUAL REPORT AND FORM 10-K 99

NOTE 22: GEOGRAPHIC AREAS
This note provides selected key financial data according to thegeographical locations of our customers. The selected keyfinancial data includes:
•sales to and revenues from unaffiliated customers,
•export sales from the U.S.,
•earnings from continuing operations before income taxes and
•long-lived assets.
SALES AND REVENUES
Our sales to and revenues from unaffiliated customers outsidethe U.S. are primarily to customers in Canada, China, Japanand Europe. Our export sales from the U.S. include:
•pulp, liquid packaging board, logs, lumber and wood chips toJapan;
•pulp, logs and lumber to other Pacific Rim countries; and
•pulp and hardwood lumber to Europe.
Sales and Revenues by Geographic Area
FOR THE THREE-YEAR PERIOD ENDED DECEMBER 31, 2010(DOLLAR AMOUNTS IN MILLIONS)
2010 2009 2008
Sales to and revenues fromunaffiliated customers:
U.S. $4,464 $3,961 $ 8,932
Japan 631 485 619
Europe 334 277 408
China 356 209 268
Canada 276 209 288
South America 70 49 102
Other foreign countries 421 338 784
6,552 5,528 11,401
Less discontinued operations — — (3,301)
Total $6,552 $5,528 $ 8,100
Export sales from the U.S.:
Japan $ 550 $ 447 $ 534
Other 831 707 1,115
1,381 1,154 1,649
Less discontinued operations — — (261)
Total $1,381 $1,154 $ 1,388
Discontinued operations primarily represent sales to the U.S.
EARNINGS AND LONG-LIVED ASSETS
Our long-lived assets — used in the generation of revenues inthe different geographical areas — are nearly all in the U.S. andCanada. Our long-lived assets include:
•goodwill,
•timber and timberlands and
•property and equipment, including construction in progress.
Earnings and Long-Lived Assets by Geographic Area
FOR THE THREE-YEAR PERIOD ENDED DECEMBER 31, 2010(DOLLAR AMOUNTS IN MILLIONS)
2010 2009 2008
Earnings (loss) attributable toWeyerhaeuser common shareholdersfrom continuing operations beforeincome taxes:
U.S. $ 108 $ (656) $(2,240)
Foreign countries (14) (163) (503)
Total $ 94 $ (819) $(2,743)
Long-lived assets:
U.S. $5,946 $6,226 $ 6,794
Canada 827 881 830
Other foreign countries 642 606 597
Total $7,415 $7,713 $ 8,221
100

NOTE 23: SELECTED QUARTERLY FINANCIAL INFORMATION (UNAUDITED)
Quarterly financial data provides a review of our results and performance throughout the year. Our earnings (loss) per share forthe full year do not always equal the sum of the four quarterly earnings-per share amounts because of common share activityduring the year.
Key Quarterly Financial Data for the Last Two Years
DOLLAR AMOUNTS IN MILLIONS EXCEPT PER-SHARE FIGURES
Net Salesand
Revenues
OperatingIncome
(Loss)
Earnings(Loss)
BeforeIncome
Taxes
NetEarnings
(Loss)
Net Earnings(Loss)
Attributable toWeyerhaeuser
CommonShareholders
BasicNet Earnings
(Loss) perShare Attributable
to WeyerhaeuserCommon
Shareholders
DilutedNet Earnings
(Loss) perShare Attributable
to WeyerhaeuserCommon
Shareholders
DividendsPaid per
Share
Market Prices –High/Low
2010:
First quarter $1,419 $ 84 $ 20 $ (18) $ (20) $(0.10) $(0.10) $ 0.05 $45.32 – $39.25
Second quarter $1,805 $ 164 $ 21 $ 14 $ 14 $ 0.07 $ 0.07 $ 0.05 $53.30 – $35.20
Third quarter $1,664 $ 167 $ 91 $1,116 $1,116 $ 3.52 $ 3.50 $26.46 $41.83 – $15.40
Fourth quarter $1,664 $ 53 $ (36) $ 171 $ 171 $ 0.32 $ 0.32 $ 0.05 $19.00 – $15.23
Full year $6,552 $ 468 $ 96 $1,283 $1,281 $ 4.00 $ 3.99 $26.61 $53.30 – $15.23
2009:
First quarter $1,275 $(330) $(442) $ (266) $ (264) $(1.25) $(1.25) $ 0.25 $32.03 – $19.36
Second quarter $1,391 $ (62) $(148) $ (116) $ (106) $(0.50) $(0.50) $ 0.25 $37.64 – $27.90
Third quarter $1,407 $ 123 $ 30 $ (5) $ — $ — $ — $ 0.05 $39.87 – $27.68
Fourth quarter $1,455 $(178) $(282) $ (181) $ (175) $(0.83) $(0.83) $ 0.05 $44.15 – $34.88
Full year $5,528 $(447) $(842) $ (568) $ (545) $(2.58) $(2.58) $ 0.60 $44.15 – $19.36
To implement our decision to be taxed as a REIT, we distributedto our shareholders our accumulated earnings and profits,determined under federal income tax provisions, as a “SpecialDividend.” The Special Dividend of $5.6 billion was paidSeptember 1, 2010, and included the regular quarterly dividendof approximately $11 million.
At the election of each shareholder, the Special Dividend waspaid in cash or Weyerhaeuser common shares. The aggregateamount of cash distributed was $560 million and the numberof common shares issued was approximately 324 million. Thestock portion of the Special Dividend is treated as the issuanceof new shares for accounting purposes and affects our earnings(loss) per share only for periods after the distribution. Priorperiods are not restated. The required treatment results in
earnings (loss) per share that is less than would have been thecase had the common shares not been issued. See Note 5:Net Earnings (Loss) Per Share for pro forma results giving effectto the common stock distribution for diluted earnings percommon share as if the common stock distribution hadoccurred at the beginning of each period. In addition, our stockprice decreased on the ex-dividend date to reflect the issuanceof common stock.
During third quarter 2010, we also reversed certain deferredincome tax liabilities as a result of our REIT conversion, whichresulted in a benefit in the Consolidated Statement ofOperations. See Note 2: Real Estate Investment Trust (REIT)Conversion for more information.
WEYERHAEUSER COMPANY > 2010 ANNUAL REPORT AND FORM 10-K 101
CHANGES IN ANDDISAGREEMENTS WITHACCOUNTANTS ON ACCOUNTINGAND FINANCIAL DISCLOSURENot applicable.
CONTROLS AND PROCEDURES
EVALUATION OF DISCLOSURE CONTROLS ANDPROCEDURES
The company’s principal executive officer and principal financialofficer have evaluated the effectiveness of the company’sdisclosure controls and procedures as of the end of the periodcovered by this annual report on Form 10-K. Disclosure controlsare controls and other procedures that are designed to ensurethat information required to be disclosed in the reports filed orsubmitted under the Exchange Act is recorded, processed,summarized and reported within the time periods specified inthe Securities and Exchange Commission’s (SEC) rules andforms. Disclosure controls and procedures include, withoutlimitation, controls and procedures designed to ensure thatinformation required to be disclosed by an issuer in the reportsthat it files or submits under the Act is accumulated andcommunicated to the issuer’s management, including itsprincipal executive and principal financial officers, to allowtimely decisions regarding required disclosure.
Based on their evaluation, the company’s principal executiveofficer and principal financial officer have concluded that thecompany’s disclosure controls and procedures are effective toensure that information required to be disclosed complies withthe SEC’s rules and forms.
CHANGES IN INTERNAL CONTROL
No changes occurred in the company’s internal control overfinancial reporting during the fourth quarter that have materiallyaffected, or are reasonably likely to materially affect, thecompany’s internal control over financial reporting.
The company has submitted to the New York Stock Exchange acertification that it is in compliance with the listing standards ofthe New York Stock Exchange.
MANAGEMENT’S REPORT ON INTERNAL CONTROLOVER FINANCIAL REPORTING
Management is responsible for establishing and maintainingadequate internal control over financial reporting as is definedin the Securities and Exchange Act of 1934 rules.Management, under our supervision, conducted an evaluationof the effectiveness of the company’s internal control overfinancial reporting based on the framework in InternalControl — Integrated Framework issued by the Committee ofSponsoring Organizations of the Treadway Commission (COSO).Based on our evaluation under the framework in InternalControl — Integrated Framework, management concluded thatthe company’s internal control over financial reporting waseffective as of December 31, 2010. The effectiveness of thecompany’s internal control over financial reporting as ofDecember 31, 2010, has been audited by KPMG LLP, anindependent registered public accounting firm, as stated intheir report, which is included herein.
/s/ DANIEL S. FULTON
Daniel S. FultonPresident and Chief Executive Officer
Dated: February 25, 2011
/s/ PATRICIA M. BEDIENT
Patricia M. BedientExecutive Vice President and Chief Financial Officer
Dated: February 25, 2011
102

REPORT OF INDEPENDENT REGISTERED PUBLIC ACCOUNTING FIRMThe Board of Directors and ShareholdersWeyerhaeuser Company:
We have audited Weyerhaeuser Company’s internal control over financial reporting as of December 31, 2010, based on criteriaestablished in Internal Control — Integrated Framework issued by the Committee of Sponsoring Organizations of the TreadwayCommission (COSO). Weyerhaeuser Company’s management is responsible for maintaining effective internal control over financialreporting and for its assessment of the effectiveness of internal control over financial reporting, included in the accompanyingManagement’s Report on Internal Control Over Financial Reporting. Our responsibility is to express an opinion on WeyerhaeuserCompany’s internal control over financial reporting based on our audit.
We conducted our audit in accordance with the standards of the Public Company Accounting Oversight Board (United States).Those standards require that we plan and perform the audit to obtain reasonable assurance about whether effective internalcontrol over financial reporting was maintained in all material respects. Our audit included obtaining an understanding of internalcontrol over financial reporting, assessing the risk that a material weakness exists, and testing and evaluating the design andoperating effectiveness of internal control based on the assessed risk. Our audit also included performing such other proceduresas we considered necessary in the circumstances. We believe that our audit provides a reasonable basis for our opinion.
A company’s internal control over financial reporting is a process designed to provide reasonable assurance regarding thereliability of financial reporting and the preparation of financial statements for external purposes in accordance with generallyaccepted accounting principles. A company’s internal control over financial reporting includes those policies and procedures that(1) pertain to the maintenance of records that, in reasonable detail, accurately and fairly reflect the transactions and dispositionsof the assets of the company; (2) provide reasonable assurance that transactions are recorded as necessary to permitpreparation of financial statements in accordance with generally accepted accounting principles, and that receipts andexpenditures of the company are being made only in accordance with authorizations of management and directors of thecompany; and (3) provide reasonable assurance regarding prevention or timely detection of unauthorized acquisition, use, ordisposition of the company’s assets that could have a material effect on the financial statements.
Because of its inherent limitations, internal control over financial reporting may not prevent or detect misstatements. Also,projections of any evaluation of effectiveness to future periods are subject to the risk that controls may become inadequatebecause of changes in conditions, or that the degree of compliance with the policies or procedures may deteriorate.
In our opinion, Weyerhaeuser Company maintained, in all material respects, effective internal control over financial reporting as ofDecember 31, 2010, based on criteria established in Internal Control — Integrated Framework issued by the Committee ofSponsoring Organizations of the Treadway Commission.
We also have audited, in accordance with the standards of the Public Company Accounting Oversight Board (United States), theconsolidated balance sheets of Weyerhaeuser Company and subsidiaries as of December 31, 2010 and 2009, and the relatedconsolidated statements of operations, cash flows, and changes in equity and comprehensive income for each of the years in thethree-year period ended December 31, 2010, and our report dated February 25, 2011 expressed an unqualified opinion on thoseconsolidated financial statements.
/s/ KPMG LLP
Seattle, WashingtonFebruary 25, 2011
WEYERHAEUSER COMPANY > 2010 ANNUAL REPORT AND FORM 10-K 103

DIRECTORS AND EXECUTIVEOFFICERSInformation with respect to directors of the company included inthe Notice of 2011 Annual Meeting of Shareholders and ProxyStatement for the company’s Annual Meeting of Shareholdersto be held April 14, 2011 under the headings “Nominees forElection — Terms Expire in 2013,” “Board of Directors andCommittee Information,” “Continuing Directors — Terms Expirein 2012” and “Continuing Directors — Terms Expire in 2011”is incorporated herein by reference. Information with regard toexecutive officers of the company contained in the Notice of2011 Annual Meeting of Shareholders and Proxy Statement forthe company’s Annual Meeting of Shareholders to be heldApril 14, 2011, under headings “Section 16(a) BeneficialOwnership Reporting Compliance,” and “Potential Paymentupon Termination or Change in Control — Change in Control,”and “ — Severance Agreements” is incorporated herein byreference.
DIRECTORS
Debra A. Cafaro, 53, a director of theCompany since February 2007, has beenchairman, president and chief executiveofficer of Ventas, Inc. (health care realestate investment trust) since 2003. Shewas its president and chief executiveofficer from 1999 when she joined the
company until 2003, and has been a director of the companysince 1999. She served as president and director ofAmbassador Apartments, Inc. (real estate investment trust)from 1997 until 1998 when it merged with AIMCO. She was adirector of GGP, Inc. (Real Estate Investment Trust) fromMarch 2010 to November 2010. She is the immediate pastchair of NAREIT (National Association of real estate investmenttrusts) and a member of the Real Estate Roundtable. She hasextensive REIT executive experience, with strong skills in realestate and corporate finance, strategic planning and publiccompany executive compensation.
Mark A. Emmert, 58, a director of theCompany since June 2008, has been thePresident of the National CollegiateAthletic Association since October 2010.He served as President of the Universityof Washington in Seattle, Washington,from 2004 to 2010; as Chancellor of
Louisiana State University from 1999 to 2004; and Chancellorand Provost of the University of Connecticut from 1994 to1999. Prior to 1994, he was Provost and Vice President forAcademic Affairs at Montana State University and held facultyand administrative positions at the University of Colorado. Healso is a director of Expeditors International of Washington,Inc. He is a Life Member of the Council on Foreign Relationsand is a Fellow of the National Academy of PublicAdministration. He has also been a Fullbright Fellow, a Fellowof the American Council on Education and served on manynon-profit boards.
Daniel S. Fulton, 62, was elected chiefexecutive officer and a member of theboard of directors in April 2008. He hasbeen president of WeyerhaeuserCompany since January 2008. From May2001 until March 2008 he was presidentand chief executive officer of
Weyerhaeuser Real Estate Company, a wholly ownedsubsidiary of Weyerhaeuser Company. In January 2004 he wasnamed to Weyerhaeuser Company’s senior management team.Mr. Fulton serves as the chair of United Way of King County,and is a board member of the Chief Seattle Council of the BoyScouts of America. He is a member of the Advisory Board forthe Foster School of Business at the University of Washington,and is the chair of the Policy Advisory Board of the Joint Centerfor Housing Studies at Harvard University.
John I. Kieckhefer, 66, a director of theCompany since 1990, has been presidentof Kieckhefer Associates, Inc. (investmentand trust management) since 1989, andwas senior vice president prior to thattime. He has been engaged incommercial cattle operations since 1967
and is a trustee of J.W. Kieckhefer Foundation, an Arizonacharitable trust.
104
Arnold G. Langbo, 73, was a director ofthe Company from 1999 until he retiredin April 2011. He was chairman of KelloggCompany (cereal products) from 1992until his retirement in 2000. He joinedKellogg Canada Inc. in 1956 and waselected president, chief operating officer
and a director of Kellogg Company in 1990. He served as chiefexecutive officer of Kellogg Company from 1992 to 1999. Heis also a director of Johnson & Johnson. He was a director ofThe Hershey Company from 2008 to August 2009 and ofWhirlpool Corporation from 1994 to April 2009.
Wayne W. Murdy, 66, a director of theCompany since January 2009, heldvarious management positions withNewmont Mining Corporation(international mining) from 1992 until hisretirement in 2007, including Chairman ofthe Board from 2002 to December 2007
and Chief Executive Officer from 2001 to June 2007. Beforejoining Newmont Mining, Mr. Murdy spent 15 years serving insenior financial positions in the oil and gas industry, includingpositions with Apache Corporation and Getty Oil Company. Healso is a director of BHP Billiton Limited, BHP Billiton Plc. andQwest Communications International Inc. He is a trustee of theDenver Art Museum, member of the Advisory Councils for theCollege of Engineering at the University of Notre Dame and theDaniels Business School at the University of Denver.
Nicole W. Piasecki, 48, a director of theCompany since 2003, is the head ofBusiness Development for BoeingCommercial Airlines. Previously, sheserved as president of Boeing Japan from2006 to 2010, executive vice presidentof Business Strategy & Marketing for
Boeing Commercial Airplanes, The Boeing Company, from2003 to 2006; was vice president of Commercial AirplanesSales, Leasing Companies from 2000 until January 2003; andserved in various positions in engineering, sales, marketing,and business strategy for the Commercial Aircraft Group from1991. She has been Secretary of Transportation, LaHood tothe Future of Aviation Advisory Council since 2010, a Trusteeof Seattle University since 2010 and an at-large member of theUniversity Council for Yale since 2010. She was a formermember of the Federal Aviation’s Management AdvisoryCouncil. She has extensive executive experience in capitalintensive industries, sales and marketing, strategic planningand international operations and relations.
Richard H. Sinkfield, 68, a director of theCompany since 1993, is a senior partnerin the law firm of Rogers & Hardin inAtlanta, Georgia, and has been a partnerin the firm since 1976. He was a directorof United Auto Group, Inc. (automobileretailer) from 1993 to 1999 and its
executive vice president and chief administrative officer from1997 to 1999. He was a director of Central ParkingCorporation from 2000 to February 2005. He is a formerdirector of the Metropolitan Atlanta Community Foundation,Inc. and the Atlanta College of Art. He is a Trustee ofVanderbilt University, a member of the executive board of theAtlanta Area Council of the Boy Scouts of America; a memberof the Board of Directors of the Georgia Appleseed Center forLaw and Justice and was a member of the board of governorsof the State Bar of Georgia from 1990 to 1998.
D. Michael Steuert, 62, a director of theCompany since October 2004, has beensenior vice president and chief financialofficer for Fluor Corporation (engineeringand construction) since 2001. He servedas senior vice president and chieffinancial officer at Litton Industries Inc.
(defense electronics, ship construction and electronictechnologies) from 1999 to 2001 and as a senior officer andchief financial officer of GenCorp Inc. (aerospace, propulsionsystems, vehicle sealing systems, chemicals and real estate)from 1990 to 1999. He also serves as Trustee of Prologis andwas formerly a member of the National Financial ExecutivesInstitute and the Carnegie Mellon Council on finance.
Kim Williams, 55, a director of theCompany since October 2006, was seniorvice president and associate director ofglobal industry research for WellingtonManagement Company LLP (investmentmanagement) from 2001 to 2005, waselected a partner effective January 1995
and held various management positions with Wellington from1986 to 2001. Prior to joining Wellington, she served as vicepresident, industry analyst for Loomis, Sayles & Co., Inc(investment management) from 1982 to 1986. She is also adirector of E.W. Scripps Company, MicroVest and Xcel EnergyInc. She is a member of the Overseer Committee of Brighamand Women’s Hospital in Boston, Massachusetts and aTrustee of Concord Academy, Concord, Massachusetts.
WEYERHAEUSER COMPANY > 2010 ANNUAL REPORT AND FORM 10-K 105

Charles R. Williamson, 62, a director ofthe company since October 2004 andchairman of the Board since April 2009,was the executive vice president ofChevron Corporation (international oilcompany) from August, 2005 until hisretirement on December 1, 2005. He was
chairman and chief executive officer of Unocal Corporation (oiland natural gas) until its acquisition by Chevron Corporation in2005. He served as Unocal Corporation’s executive vicepresident, International Energy Operations from 1999 to 2000;group vice president, Asia Operations from 1998 to 1999;group vice president, International Operations from 1996 to1997; and held numerous management jobs includingpositions in the United Kingdom, Thailand and the Netherlandsafter joining Unocal in 1977. He was a director of UnocalCorporation and former Chairman of the US-ASEAN BusinessCouncil. He is also a director and chairman of the board ofTalisman Energy Inc. and a director of PACCAR Inc.
EXECUTIVE OFFICERS
The executive officers of the company are as follows:
NAME TITLE AGE
Ernesta Ballard Senior Vice President 65
Patricia M. Bedient Executive Vice President 57
James M. Branson Senior Vice President untilOctober 1, 2010
55
Lawrence B. Burrows Senior Vice President 58
Srinivasan Chandrasekaran Senior Vice President 61
Miles P. Drake Senior Vice President 61
Daniel S. Fulton President and CEO 62
Thomas F. Gideon Executive Vice President 59
John A. Hooper Senior Vice President 56
Sandy D. McDade Senior Vice President 59
Peter M. Orser President, WeyerhaeuserReal Estate Company
54
Ernesta Ballard was senior vicepresident, Corporate Affairs, from 2004when she joined the company, until sheretired in January 2011. She served ascommissioner, Department ofEnvironmental Conservation for the stateof Alaska from 2002 to 2004; president,
Ballard & Associates (consulting firm) from 1994 to 2002;chief executive officer, Cape Fox Corp. (Alaska Native Villagecorporation), from 1989 to 1994; and regional administrator,Region 10, U.S. Environmental Protection Agency, from 1983to 1986. In 1997, she was appointed to serve on the Board ofGovernors of the U.S. Postal Service. She serves on theAdvisory Board for the Ruckelshaus Center and was a foundingmember and currently serves as chair of LifeCenter Northwest,the organ donation organization for Washington, Montana andAlaska.
Patricia M. Bedient has been executivevice president and chief financial officersince 2007. She was senior vicepresident, Finance and StrategicPlanning, from February 2006 to 2007.She served as vice president, StrategicPlanning, from 2003 when she joined the
company to 2006. Prior to joining the company, she was apartner with Arthur Andersen LLP (Independent Accountant)from 1987 to 2002 and served as the managing partner forthe Seattle office and as the partner in charge of the firm’sforest products practice from 1999 to 2002. She is on theBoard of Directors for Alaska Air Group and also serves asTreasurer and Board member of Overlake Hospital MedicalCenter. She is a CPA and member of the American Institute ofCPAs.
James M. Branson was senior vicepresident, Timberlands, from 2007 untilOctober 1, 2010. He was vice presidentof Southern Timberlands from 2002 to2007. He served as vice president,Plywood, from 1995 to 2002. From 1981to 2002, he held numerous leadership
roles in finance. He started with Weyerhaeuser in 1979 as anaccountant trainee in timberlands raw materials in Arkansas.
106
Lawrence B. Burrows has been seniorvice president Wood Products, sinceOctober 1, 2010. Prior to becomingsenior vice president Wood Products,Mr. Burrows served as served aspresident of Weyerhaeuser Real EstateCompany, a subsidiary of the company,
from 2008 to 2010. He was president of Winchester HomesInc., a subsidiary of the company from 2003 to 2008; itsexecutive vice president from 1998 to 2003; and held variousleadership positions at Winchester Homes from 1989, whenhe joined the company, until 1998. Prior to joining thecompany, he was vice president and regional manager forDickinson Heffner (real estate development) from 1986 to1988; and project manager and vice president of Oliver T.Carr & Co. (real estate development) from 1982 to 1986.
Srinivasan Chandrasekaran has beensenior vice president, Cellulose Fibers,since 2006. He was vice president,Manufacturing, Cellulose Fibers, from2005 to 2006; vice president and millmanager at the Kamloops, BritishColumbia, Cellulose Fibers mill from
2003 to 2005; and vice president and mill manager at theKingsport, Tennessee, paper mill from 2002 to 2003. Hejoined Weyerhaeuser in 2002 with the company’s acquisitionof Willamette Industries Inc., where he served in a number ofleadership positions.
Miles P. Drake has been senior vicepresident, Research and Development,and chief technology officer since 2006when he joined the company. He was vicepresident, research and development andchief technology officer of Air Productsand Chemicals Inc. (Industrial Gases)
from 2001 until October 2006 and held numerous otherleadership positions with Air Products and Chemicals Inc. from1986 until 2001.
Daniel S. Fulton has been chief executiveofficer and a director of the companysince April 2008 and has been itspresident since January 2008. He waspresident of Weyerhaeuser Real EstateCompany, a subsidiary of the company,from 2001 to 2008 and president of
Weyerhaeuser Realty Investors Inc., a subsidiary of thecompany, from 1998 to 2000. He joined Weyerhaeuser in1976 and has held various management and investmentpositions with the company and its subsidiaries. He alsoserves the chair of United Way of King County. He is a memberof the Advisory Board for the Foster School of Business at theUniversity of Washington and is the chair of the Policy AdvisoryBoard of the Joint Center of Housing with Harvard University.
Thomas F. Gideon has been executivevice president Timberlands, sinceOctober 1, 2010. Prior to becomingexecutive vice president Timberlands,Mr. Gideon served as executive vicepresident — Forest Products from 2008to 2010; and as senior vice president,
Containerboard, Packaging and Recycling, from 2007 until itsdisposition in 2008. He was senior vice president,Timberlands, from 2005 to 2007; vice president, WesternTimberlands, from 2003 to 2005; and director of Sales andMarketing for Western Timberlands from 1998 to 2003. Hejoined Weyerhaeuser in 1978 and held numerous humanresources and sales management positions in Wood Productsbefore moving into Western Timberlands in 1996.
John A. Hooper has been senior vicepresident, Human Resources, since July2008. He was vice president, HumanResources Operations, from 2006 to2008; Human Resources director from2003 to 2006; and strategic projectsconsultant from 2001 when he joined the
company until 2003. Prior to joining the company, he was amanagement consultant specializing in assisting smallbusiness development through his firm, SuccessfulEntrepreneur, Inc., from 2000 to 2002; and leadership,change management, human resources strategy andbenchmarking practices through his firm, People ManagementResources, Inc., from 1985 to 2000.
WEYERHAEUSER COMPANY > 2010 ANNUAL REPORT AND FORM 10-K 107

Sandy D. McDade has been senior vicepresident and general counsel sinceSeptember 2006. He was senior vicepresident, Industrial Wood Products andInternational, from 2005 to 2006; seniorvice president, Canada, from 2003 to2005; vice president, Strategic Planning,
from 2000 to 2003; and corporate secretary from 1993 to2000. He joined Weyerhaeuser in 1980 and worked as acorporate and transaction lawyer until 2000.
Peter M. Orser has been president,Weyerhaeuser Real Estate Company, asubsidiary of the company, sinceOctober 1, 2010. Prior to becomingpresident, Weyerhaeuser Real EstateCompany, Mr. Orser was president,Quadrant Corporation, a subsidiary of the
company, from 2003 to 2010. He was executive vicepresident, Quadrant Corporation, from 2001 to 2003;residential senior vice president, Quadrant Corporation, from1996 to 2001; vice president, Community Development, from1992 to 1995; and held various leadership positions withQuadrant Corporation from 1987 when he joined the companyto 1992.
108

AUDIT COMMITTEE FINANCIAL EXPERT
As of December 31, 2010, the audit committee of the board ofdirectors consisted of Mark A. Emmert, John I. Kieckhefer,D. Michael Steuert and Kim Williams. Each member isindependent as defined under the New York Stock Exchangerules. The board of directors has determined that each auditcommittee member has sufficient knowledge in financial andaccounting matters to serve on the committee and thatMr. Steuert is an “audit committee financial expert” as definedby SEC rules.
CORPORATE GOVERNANCE MATTERS
CODE OF ETHICS
The company has adopted a code of ethics that applies to allemployees, including the principal executive officer, principalfinancial officer and principal accounting officer. A copy isincorporated in the exhibits to this 10-K by reference and isavailable on the company’s website at www.weyerhaeuser.com.A copy of the code of ethics is available free of charge uponwritten request to Claire S. Grace, Corporate Secretary,Weyerhaeuser Company, P.O. Box 9777, Federal Way, WA98063-9777, or by e-mail [email protected].
CORPORATE GOVERNANCE GUIDELINES
The company has adopted corporate governance guidelines.The company’s corporate governance guidelines are availableon the company’s website at www.weyerhaeuser.com. Papercopies may be obtained by written request to Claire S. Grace,Corporate Secretary, Weyerhaeuser Company, P.O. Box 9777,Federal Way, WA 98063-9777, or by e-mail [email protected].
EXECUTIVE AND DIRECTORCOMPENSATIONInformation with respect to executive and director compensationcontained in the Notice of 2011 Annual Meeting of Shareholdersand Proxy Statement for the company’s Annual Meeting ofShareholders to be held April 14, 2011, under the headings“Board of Directors and Committee Information — Directors’Compensation,” “Compensation Discussion and Analysis,”“Compensation Committee Report,” “Compensation CommitteeInterlocks and Insider Participation,” “Summary CompensationTable,” “Grants of Plan-Based Awards,” “Outstanding EquityAwards at Fiscal Year Year-End,” “Options Exercise in Fiscal2010,” “Pension Benefits,” “Nonqualified DeferredCompensation,” and “Potential Payments Upon Termination orChange of Control” is incorporated herein by reference.
SECURITY OWNERSHIP OFCERTAIN BENEFICIAL OWNERSAND MANAGEMENT AND RELATEDSTOCKHOLDER MATTERSInformation with respect to security ownership of certainbeneficial owners and management contained in the Notice of2011 Annual Meeting of Shareholders and Proxy Statement forthe company’s Annual Meeting of Shareholders to be heldApril 14, 2011, under the heading “Beneficial Ownership ofCommon Shares” is incorporated herein by reference.
CERTAIN RELATIONSHIPS ANDRELATED TRANSACTIONSInformation with regard to certain relationships and relatedtransactions contained in the Notice of 2011 Annual Meeting ofShareholders and Proxy Statement for the company’s AnnualMeeting of Shareholders to be held April 14, 2011, under theheadings “Review, Approval or Ratification of Transactions withRelated Persons” and “Board of Directors and CommitteeInformation” is incorporated herein by reference.
PRINCIPAL ACCOUNTING FEESAND SERVICESInformation with respect to principal accounting fees andservices in the Notice of 2011 Annual Meeting of Shareholdersand Proxy Statement for the company’s Annual Meeting ofShareholders to be held April 14, 2011, under the heading“Relationships with Independent Registered Public AccountingFirm” is incorporated herein by reference.
WEYERHAEUSER COMPANY > 2010 ANNUAL REPORT AND FORM 10-K 109

EXHIBITS AND FINANCIAL STATEMENT SCHEDULESFINANCIAL STATEMENT SCHEDULE
PAGE NUMBER(S)IN FORM 10-K
Report of Independent Registered Public Accounting Firm on Financial Statement Schedule 113
Schedule II — Valuation and Qualifying Accounts 114
All other financial statement schedules have been omitted because they are not applicable or the required information is includedin the consolidated financial statements, or the notes thereto, in Financial Statements and Supplementary Data above.
EXHIBITS
3 — (i) Articles of Incorporation (incorporated by reference to Current Report on Form 8-K filed with the Securities and Exchange Commission July 15,2010 — Commission File Number 1-4825)
(ii) Bylaws (incorporated by reference to Current Report on Form 10-Q filed with the Securities and Exchange Commission August 13, 2010 —Commission File Number 1-4825)
10 — Material Contracts
(a) Form of Executive Change of Control Agreement (incorporated by reference to Form 8-K filed with the Securities and Exchange CommissionFebruary 9, 2010 — Commission File Number 1-4825)
(b) Form of Executive Severance Agreement (incorporated by reference to Form 8-K filed with the Securities and Exchange Commission February 9,2010 — Commission File Number 1-4825)
(c) Form of Executive Change of Control Agreement (Weyerhaeuser Company Limited and Weyerhaeuser Company) (incorporated by reference toFrom 8-K filed with the Securities and Exchange Commission February 15, 2006 — Commission File Number 1-4825)
(d) Weyerhaeuser Company Long-Term Incentive Compensation Plan (incorporated by reference to Form 8-K filed with the Securities and ExchangeCommission February December 16, 2008 — Commission File Number 1-4825)
(e) Form of Weyerhaeuser Company 2004 Long-Term Incentive Plan Stock Option Agreement (incorporated by reference to Form 8-K filed with theSecurities and Exchange Commission February 9, 2010 — Commission File Number 1-4825)
(f) Form of Weyerhaeuser Company 2004 Long-Term Incentive Plan Performance Plan Award Agreement (incorporated by reference to Form 8-K filedwith the Securities and Exchange Commission February 21, 2006 — Commission File Number 1-4825)
(g) Form of Weyerhaeuser Company 2004 Long-Term Incentive Plan SAR Grant Agreement (incorporated by reference to Form 8-K filed with theSecurities and Exchange Commission February 21, 2006 — Commission File Number 1-4825)
(h) Form of Weyerhaeuser Company 2004 Long-Term Incentive Plan Tandem SAR Grant Agreement (incorporated by reference to Form 8-K filed withthe Securities and Exchange Commission February 21, 2006 — Commission File Number 1-4825)
(i) Form of Weyerhaeuser Company 2004 Long-Term Incentive Plan Restricted Stock Award Terms and Conditions (incorporated by reference toForm 8-K filed with the Securities and Exchange Commission February 9, 2010 — Commission File Number 1-4825)
(j) Weyerhaeuser Company Annual Incentive Plan for Salaried Employees(k) Weyerhaeuser Company Deferred Compensation Plan (incorporated by reference to Form 8-K filed with the Securities and Exchange Commission
December 18, 2007 — Commission File Number 1-4825)(l) Weyerhaeuser Company Salaried Employees Supplemental Retirement Plan (incorporated by reference to 2004 Form 10-K filed with the
Securities and Exchange Commission January 27, 2009 — Commission File Number 1-4825)(m) Fee Deferral Plan for Directors of Weyerhaeuser Company (incorporated by reference to 2004 Form 10-K filed with the Securities and Exchange
Commission December 16, 2008 — Commission File Number 1-4825)(n) Weyerhaeuser Real Estate Company Management Short-Term Incentive Plan (incorporated by reference to Form 8-K filed with the Securities and
Exchange Commission February 9, 2010 — Commission File Number 1-4825)(o) Weyerhaeuser Real Estate Company Management Long-Term Incentive Plan (incorporated by reference to Form 8-K filed with the Securities and
Exchange Commission February 9, 2010 — Commission File Number 1-4825)(p) Fee Deferral Plan for Canadian Directors of Weyerhaeuser Company (incorporated by reference to 2004 Form 10-K filed with the Securities and
Exchange Commission March 3, 2005 — Commission File Number 1-4825)(q) Agreement with James M. Branson (incorporated by reference to quarterly report on Form 10-Q filed with the Securities and Exchange
Commission November 5, 2010 — Commission File Number 1-4825)(r) Competitive Advance and Revolving Credit Facility Agreement, dated as of December 19, 2006, among Weyerhaeuser Company, Weyerhaeuser
Real Estate Company, the Lenders, Swing-Line Banks and Initial Fronting Banks named therein, JPMorgan Chase Bank, N.A. as administrativeagent, Citibank, N.A., as syndication agent, Bank of America, N.A., The Bank of Tokyo-Mitsubishi UFJ, Ltd. and Deutsche Bank Securities Inc., asdocumentation agents, and Morgan Stanley Bank as co-documentation agent. (incorporated by reference to 2006 Form 10-K filed with theSecurities and Exchange Commission February 27, 2007 — Commission File Number 1-4825)
(s) First Amendment dated to Competitive Advance and Revolving Credit Facility Agreement, dated as of December 19, 2006, among WeyerhaeuserCompany, Weyerhaeuser Real Estate Company, the Lenders, JPMorgan Chase Bank, N.A. and, Citibank, N.A., as initial fronting banks, JPMorganChase Bank and Citibank, as swing line banks, JPMorgan Chase Bank, as administrative agent, Citibank, as syndication agent, Bank of America,N.A., Deutsche Bank Securities Inc. and The Bank of Tokyo-Mitsubishi UFJ, Ltd. as documentation agent, Morgan Stanley Bank, as co-documentation agent and the lenders named therein. (incorporated by reference to Form 8-K filed with the Securities and Exchange CommissionSeptember 14, 2009)
(t) Amended and Restated Contribution and Distribution Agreement among Weyerhaeuser Company, Domtar Paper Company LLC and DomtarCorporation dated as of January 25, 2007 (incorporated by reference to Form 8-K filed with the Securities and Exchange CommissionJanuary 31, 2007 — Commission File Number 1-4825)
(u) Amended and Restated Transaction Agreement among Weyerhaeuser Company, Domtar Corporation, Domtar Paper Company LLC, DomtarDelaware Holdings, Inc., Domtar Pacific Papers, Inc., Domtar Pacific Papers ULC, Domtar (Canada) Paper, Inc., and Domtar, Inc. dated as ofJanuary 25, 2007 (incorporated by reference to Form 8-K filed with the Securities and Exchange Commission January 31, 2007 — CommissionFile Number 1-4825)
(v) Purchase Agreement, dated as of March 15, 2008, between Weyerhaeuser Company and International Paper Company (incorporated byreference to Form 8-K filed with the Securities and Exchange Commission March 20, 2008 — Commission File Number 1-4825)
12 — Statements regarding computation of ratios
14 — Code of Business Conduct and Ethics (incorporated by reference to Form 8-K filed with the Securities and Exchange Commission December 21,2005 — Commission File Number 1-4825)
21 — Subsidiaries of the Registrant
23 — Consent of Independent Registered Public Accounting Firm
110
31 — Certification pursuant to Rule 13a-14(a) under the Securities Exchange Act of 1934, as amended
32 — Certification pursuant to Rule 13a-14(b) under the Securities Exchange Act of 1934, as amended, and Section 1350 of Chapter 63 of Title 18of the United States Code (18 U.S.C. 1350)
101.INS — XBRL Instance Document
101.SCH — XBRL Taxonomy Extension Schema Document
101.CAL — XBRL Taxonomy Extension Calculation Linkbase Document
101.DEF — XBRL Taxonomy Extension Definition Linkbase Document
101.LAB — XBRL Taxonomy Extension Label Linkbase Document
101.PRE — XBRL Taxonomy Extension Presentation Linkbase Document
WEYERHAEUSER COMPANY > 2010 ANNUAL REPORT AND FORM 10-K 111

SIGNATURES
Pursuant to the requirements of Section 13 or 15(d) of the Securities Exchange Act of 1934, the registrant has duly caused thisreport to be signed on its behalf by the undersigned, thereunto duly authorized February 25, 2011.
WEYERHAEUSER COMPANY
/s/ DANIEL S. FULTON
Daniel S. FultonPresident and Chief Executive Officer
Pursuant to the requirements of the Securities Exchange Act of 1934, this report has been signed below by the following personson behalf of the registrant in the capacities indicated February 25, 2011.
/s/ DANIEL S. FULTON /s/ WAYNE W. MURDY
Daniel S. FultonPrincipal Executive Officer
and Director
Wayne W. MurdyDirector
/s/ PATRICIA M. BEDIENT
Patricia M. BedientPrincipal Financial Officer
/s/ NICOLE W. PIASECKI
Nicole W. PiaseckiDirector
/s/ JERALD W. RICHARDS
Jerald W. RichardsPrincipal Accounting Officer
/s/ RICHARD H. SINKFIELD
Richard H. SinkfieldDirector
/s/ DEBRA A. CAFARO
Debra A. CafaroDirector
/s/ D. MICHAEL STEUERT
D. Michael SteuertDirector
/s/ MARK A. EMMERT
Mark A. EmmertDirector
/s/ KIM WILLIAMS
Kim WilliamsDirector
/s/ JOHN I. KIECKHEFER
John I. KieckheferDirector
/s/ CHARLES R. WILLIAMSON
Charles R. WilliamsonChairman of the Board and Director
/s/ ARNOLD G. LANGBO
Arnold G. LangboDirector
112

REPORT OF INDEPENDENT REGISTERED PUBLIC ACCOUNTING FIRMThe Board of Directors and ShareholdersWeyerhaeuser Company:
Under date of February 25, 2011, we reported on the consolidated balance sheets of Weyerhaeuser Company and subsidiaries asof December 31, 2010 and 2009, and the related consolidated statements of operations, cash flows, and changes in equity andcomprehensive income for each of the years in the three-year period ended December 31, 2010, which report is included in thisannual report on Form 10-K. These consolidated financial statements and our report theron are incorporated by reference in theannual report on Form 10-K for the year 2010. In connection with our audits of the aforementioned consolidated financialstatements, we also audited the related consolidated financial statement schedule in this annual report on Form 10-K. Thisfinancial statement schedule is the responsibility of the Company’s management. Our responsibility is to express an opinion onthis financial statement schedule based on our audits.
In our opinion, such financial statement schedule, when considered in relation to the basic consolidated financial statementstaken as a whole, presents fairly, in all material respects, the information set forth therein.
/s/ KPMG LLP
Seattle, WashingtonFebruary 25, 2011
WEYERHAEUSER COMPANY > 2010 ANNUAL REPORT AND FORM 10-K 113

FINANCIAL STATEMENT SCHEDULE
SCHEDULE II — VALUATION AND QUALIFYING ACCOUNTSFor the three years ended December 31, 2010
DOLLAR AMOUNTS IN MILLIONS
DESCRIPTION BALANCE ATBEGINNINGOF PERIOD
CHARGEDTO INCOME
(DEDUCTIONS)FROM/
ADDITIONS TORESERVE
BALANCE ATEND OFPERIOD
Forest Products
Allowances deducted from related asset accounts:
Doubtful accounts – accounts receivable
2010 $12 $ 2 $ (6) $ 8
2009 $ 7 $11 $ (6) $12
2008 $ 3 $ 6 $ (2) $ 7
Real Estate
Allowances deducted from related asset accounts:
Receivables
2010 $ 2 $ 1 $ — $ 3
2009 $ 4 $ — $ (2) $ 2
2008 $ 2 $ 1 $ 1 $ 4
114

CERTIFICATIONSEXHIBIT 31
Certification Pursuant to Rule 13a-14(a)Under the Securities Exchange Act of 1934
I, Daniel S. Fulton, certify that:1. I have reviewed this annual report on Form 10-K of Weyerhaeuser Company.2. Based on my knowledge, this report does not contain any untrue statement of a material fact or omit to state a material fact
necessary to make the statements made, in light of the circumstances under which such statements were made, not misleadingwith respect to the period covered by this report.
3. Based on my knowledge, the financial statements, and other financial information included in this report, fairly present in allmaterial respects the financial condition, results of operations and cash flows of the registrant as of, and for, the periodspresented in this report.
4. The registrant’s other certifying officer(s) and I are responsible for establishing and maintaining disclosure controls andprocedures (as defined in Exchange Act Rules 13a-15(e) and 15d-15(e)) and internal control over financial reporting (as definedin Exchange Act Rules 13a-15(f) and 15d-15(f)) for the registrant and have:a) designed such disclosure controls and procedures, or caused such disclosure controls and procedures to be designed
under our supervision, to ensure that material information relating to the registrant, including its consolidated subsidiaries,is made known to us by others within those entities, particularly during the period in which this report is being prepared;
b) designed such internal control over financial reporting, or caused such internal control over financial reporting to bedesigned under our supervision, to provide reasonable assurance regarding the reliability of financial reporting and thepreparation of financial statements for external purposes in accordance with generally accepted accounting principles;
c) evaluated the effectiveness of the registrant’s disclosure controls and procedures and presented in this report ourconclusions about the effectiveness of the disclosure controls and procedures, as of the end of the period covered by thisreport based on such evaluation; and
d) disclosed in this report any change in the registrant’s internal control over financial reporting that occurred during theregistrant’s most recent fiscal quarter (the registrant’s fourth fiscal quarter in the case of an annual report) that hasmaterially affected, or is reasonably likely to materially affect, the registrant’s internal control over financial reporting.
5. The registrant’s other certifying officer(s) and I have disclosed, based on our most recent evaluation of internal control overfinancial reporting, to the registrant’s auditors and the audit committee of the registrant’s board of directors (or personsperforming the equivalent functions):a) all significant deficiencies and material weaknesses in the design or operation of internal control over financial reporting
which that are reasonably likely to adversely affect the registrant’s ability to record, process, summarize and report financialinformation; and
b) any fraud, whether or not material, that involves management or other employees who have a significant role in theregistrant’s internal control over financial reporting.
Date: February 25, 2011
/S/ DANIEL S. FULTON
Daniel S. FultonPresident and Chief Executive Officer
WEYERHAEUSER COMPANY > 2010 ANNUAL REPORT AND FORM 10-K 115

I, Patricia M. Bedient, certify that:1. I have reviewed this annual report on Form 10-K of Weyerhaeuser Company.2. Based on my knowledge, this report does not contain any untrue statement of a material fact or omit to state a material fact
necessary to make the statements made, in light of the circumstances under which such statements were made, not misleadingwith respect to the period covered by this report.
3. Based on my knowledge, the financial statements, and other financial information included in this report, fairly present in allmaterial respects the financial condition, results of operations and cash flows of the registrant as of, and for, the periodspresented in this report.
4. The registrant’s other certifying officer(s) and I are responsible for establishing and maintaining disclosure controls andprocedures (as defined in Exchange Act Rules 13a-15(e) and 15d-15(e)) and internal control over financial reporting (as definedin Exchange Act Rules 13a-15(f) and 15d-15(f)) for the registrant and have:a) designed such disclosure controls and procedures, or caused such disclosure controls and procedures to be designed
under our supervision, to ensure that material information relating to the registrant, including its consolidated subsidiaries,is made known to us by others within those entities, particularly during the period in which this report is being prepared;
b) designed such internal control over financial reporting, or caused such internal control over financial reporting to bedesigned under our supervision, to provide reasonable assurance regarding the reliability of financial reporting and thepreparation of financial statements for external purposes in accordance with generally accepted accounting principles;
c) evaluated the effectiveness of the registrant’s disclosure controls and procedures and presented in this report ourconclusions about the effectiveness of the disclosure controls and procedures, as of the end of the period covered by thisreport based on such evaluation; and
d) disclosed in this report any change in the registrant’s internal control over financial reporting that occurred during theregistrant’s most recent fiscal quarter (the registrant’s fourth fiscal quarter in the case of an annual report) that hasmaterially affected, or is reasonably likely to materially affect, the registrant’s internal control over financial reporting.
5. The registrant’s other certifying officer(s) and I have disclosed, based on our most recent evaluation of internal control overfinancial reporting, to the registrant’s auditors and the audit committee of the registrant’s board of directors (or personsperforming the equivalent functions):a) all significant deficiencies and material weaknesses in the design or operation of internal control over financial reporting
that which are reasonably likely to adversely affect the registrant’s ability to record, process, summarize and report financialinformation; and
b) any fraud, whether or not material, that involves management or other employees who have a significant role in theregistrant’s internal control over financial reporting.
Date: February 25, 2011
/s/ PATRICIA M. BEDIENT
Patricia M. BedientExecutive Vice President and Chief Financial Officer
116

EXHIBIT 32
Certification Pursuant to Rule 13a-14(b)Under the Securities Exchange Act of 1934 andSection 1350, Chapter 63 of Title 18, United States Code
Pursuant to Rule 13a-14(b) under the Securities Exchange Act of 1934 and Section 1350, Chapter 63 of Title 18, United StatesCode, each of the undersigned officers of Weyerhaeuser Company, a Washington corporation (the “Company”), hereby certifiesthat:
The Company’s Annual Report on Form 10-K dated February 25, 2011 (the “Form 10-K”) fully complies with the requirements ofSection 13(a) or 15(d) of the Securities Exchange Act of 1934 and information contained in the Form 10-K fairly presents, in allmaterial respects, the financial condition and results of operations of the Company.
/S/ DANIEL S. FULTON
Daniel S. FultonPresident and Chief Executive Officer
Dated: February 25, 2011
/S/ PATRICIA M. BEDIENT
Patricia M. BedientExecutive Vice President and Chief Financial Officer
Dated: February 25, 2011
The foregoing certification is being furnished solely pursuant to Rule 13a-14(b) under the Securities Exchange Act of 1934 andSection 1350, Chapter 63 of Title 18, United States Code and is not being filed as part of the Form 10-K or as a separatedisclosure document.
WEYERHAEUSER COMPANY > 2010 ANNUAL REPORT AND FORM 10-K 117

WEYERHAEUSEREXECUTIVE OFFICERS
DANIEL S. FULTONPresident and Chief Executive Officer,Weyerhaeuser Company
PATRICIA M. BEDIENTExecutive Vice President,Chief Financial Officer
LAWRENCE B. BURROWSSenior Vice President, Wood Products
SRINIVASAN CHANDRASEKARANSenior Vice President, Cellulose Fibers
MILES P. DRAKESenior Vice President,Research and Development andChief Technology Officer
THOMAS F. GIDEONExecutive Vice President, Timberlands
JOHN A. HOOPERSenior Vice President, Human Resources
SANDY D. McDADESenior Vice President and General Counsel
PETER M. ORSERPresident, Weyerhaeuser Real Estate Company
WEYERHAEUSER OFFICERS
NANCY ARENDVice President, Hardwoods andIndustrial Wood Products
CHRISTINE DEANVice President, Timberlands Technology
ANNE GIARDINIPresident, Weyerhaeuser Company Ltd.
DAVID L. GODWINVice President, Minerals andEnergy Products
CLAIRE S. GRACEVice President, Corporate Secretary andAssistant General Counsel
CARLOS J. GUILHERMEVice President, Engineered Lumber Products
JEANNE M. HILLMANVice President andController — Operations
FLOYD W. HOLDERPresident, Trendmaker Homes
RHONDA HUNTERVice President, Southern Timberlands
NATE JORGENSENVice President, Distribution
SARA S. KENDALLVice President, Sustainability andCorporate Affairs
KEN C. KRIVANECPresident, Quadrant Corporation
SCOTT R. MARSHALLVice President, Operations Support
KATHRYN F. McAULEYVice President, Investor Relations
MICHAEL V. McGEEPresident, Pardee Homes
JEFFREY W. NITTAVice President and Treasurer
CATHERINE L. PHILLIPSVice President, Sustainable Forestry
JERALD W. RICHARDSChief Accounting Officer
MARVIN RISCOVice President, International Operations andVice President, Weyerhaeuser Solutions
ELIZABETH W. SEATONVice President, Strategic Planning
ALAN SHAPIROPresident, Winchester Homes
KEVIN H. SHEARERChief Information Officer andVice President, Information Technology
CATHERINE I. SLATERVice President, Oriented Strand Board
THOMAS M. SMITHVice President and Director of Taxes
GUY C. STEPHENSONPresident, Westwood Shipping Lines
ROBERT W. TAYLORVice President, Lumber
ANDY WARRENPresident, Maracay Homes
RICHARD C. WININGERVice President,Western Timberlands
JOHN YERKEVice President, Cellulose FibersManufacturing
118

ABOUT WEYERHAEUSERWeyerhaeuser Company, one of the world’s largest forest products companies, was incorporated in 1900. We have offi ces or operations in 10 countries, with custom-ers worldwide. We are principally engaged in the growing and harvesting of timber; the manufacture, distribution and sale of forest products; and real estate construc-tion and development.
Corporate mailing address and telephoneWeyerhaeuser CompanyPO Box 9777Federal Way, Washington98063-9777253.924.2345
Weyerhaeuser onlinewww.wy.com
Annual meetingApril 14, 2011George Hunt WalkerWeyerhaeuser BuildingFederal Way, Washington
Proxy material will be mailed on or about March 9, 2011, to each holder of record of voting shares.
Stock exchanges and symbolsWeyerhaeuser Company common stock is listed on the New York Stock Exchange and the Chicago Stock Exchange. Our NYSE symbol is WY.
TRANSFER AGENT AND REGISTRARBNY Mellon Shareowner Services480 Washington BoulevardJersey City, New Jersey 07310-1900
BNY Mellon Shareowner Services, our transfer agent, maintains the records for our registered shareholders and can help you with a variety of shareholder-related services at no charge, including:
• change of name or address,• consolidation of accounts,• duplicate mailings,• dividend reinvestment and direct stock
purchase plan enrollment,• lost stock certifi cates,• transfer of stock to another person, and • additional administrative services.
Access your investor statements online 24 hours a day, seven days a week with MLink. To fi nd out more about the services and programs available to you, please contact BNY Mellon Shareowner Services directly to access your account by internet, telephone or mail — whichever is most convenient for you.
Contact us by telephoneShareholders in the United States800.561.4405800.231.5469 TDD for hearing-impaired
Foreign shareholders201.680.6578.201.680.6610 TDD for hearing-impaired
Contact us onlinewww.bnymellon.com/shareowner/equityaccess
Contact us by mailWeyerhaeuser Companyc/o BNY Mellon Shareowner Services PO Box 358015Pittsburgh, Pennsylvania 15252-8015
WEYERHAEUSER CONTACT INFORMATIONInvestor Relations contactKathryn F. McAuleyVice President, Investor Relations 253.924.2058
Shareholder Services contactVicki A. MerrickAssistant Corporate Secretary and Manager, Shareholder [email protected]
Ordering company reportsTo order a free copy of our 2010 Annual Report and Form 10-K and other company publications, visit: www.wy.com/Company/CorporateAffairs/Contact/OrderAPublication
Production notesThis report is printed on 80 lb. Finch Opaque cover, and 50 lb. Finch Opaque text. The entire report can be recycled in most high-grade offi ce paper recycling programs. Thank you for recycling.
Printed withinks containingsoy and/orvegetable oils

FOR MORE INFORMATION, PLEASE VISIT:http://investor.weyerhaeuser.com