11 alternative transportation technologies: hydrogen, biofuels, advanced ices, hevs and phevs...
TRANSCRIPT

11
Alternative Transportation Technologies: Hydrogen, Biofuels, Advanced ICEs, HEVs and PHEVs
Results of two Reports from theNational Research Council
National Petroleum Council 10-7-10
Michael Ramage

2
Committee on Assessment of Resource Needs for Fuel Cell and Hydrogen
Technologies
• MICHAEL P. RAMAGE, NAE1, ExxonMobil Research and Engineering Company (retired), Chair
• RAKESH AGRAWAL, NAE, Purdue University• DAVID L. BODDE, Clemson University• DAVID FRIEDMAN, Union of Concerned Scientists• SUSAN FUHS, Conundrum Consulting• JUDI GREENWALD, Pew Center on Global Climate Change• ROBERT L. HIRSCH, Management Information Services, Inc.• JAMES R. KATZER, NAE, Massachusetts Institute of Technology• GENE NEMANICH, ChevronTexaco Technology Ventures (retired)• JOAN OGDEN, University of California, Davis• LAWRENCE T. PAPAY, NAE, Science Applications International Corporation (retired)• IAN W.H. PARRY, Resources for the Future• WILLIAM F. POWERS, NAE, Ford Motor Company (retired)• EDWARD S. RUBIN, Carnegie Mellon University• ROBERT W. SHAW, JR., Aretê Corporation• ARNOLD F. STANCELL, NAE, Georgia Institute of Technology• TONY WU, Southern Company
1NAE, National Academy of Engineering.

3
Major Options for Reducing Oil Use
• Improved fuel economy; evolutionary.• Biofuels; some new infrastructure required.• Hydrogen fuel cell vehicles; major technical
and infrastructure improvements needed.• Battery-powered vehicles; major technical
and some infrastructure changes needed.

44
Goals
• Establish as a goal the maximum practicable number of alternative vehicles and fuels the can penetrate the market by 2020 ( and beyond to 2050)
• Evaluate technology status
• Determine potential oil and CO2 savings
• Determine the funding, public and private, to reach that goal
• Establish a budget roadmap to achieve the goal
• Determine the government actions required to achieve the goal

55
Presentation Outline
• Scenarios
Market Penetration Rates
Technology Status
FCV and PHEV Costs• Oil and CO2 Savings
• Timing and Transition Costs to Achieve Market Competitiveness for FCVs and PHEVs
• Infrastructure Issues• Conclusions

6
SCENARIOS Case1) H2 SUCCESS H2 & fuel cells play a major
role beyond 2025
Case 2) EFFICIENCY(ICEV) Potential improvements in gasoline ICE and HEV technologies successful
Case 3) BIOFUELS Large scale use of biofuels, focus ethanol
Case 4) PLUG-IN HYBRID SUCCESS PHEVs play a major role beyond 2025
Case 5) PORTFOLIO APPROACH More efficient ICEVs + biofuels + FCVs or PHEVs introduced
7
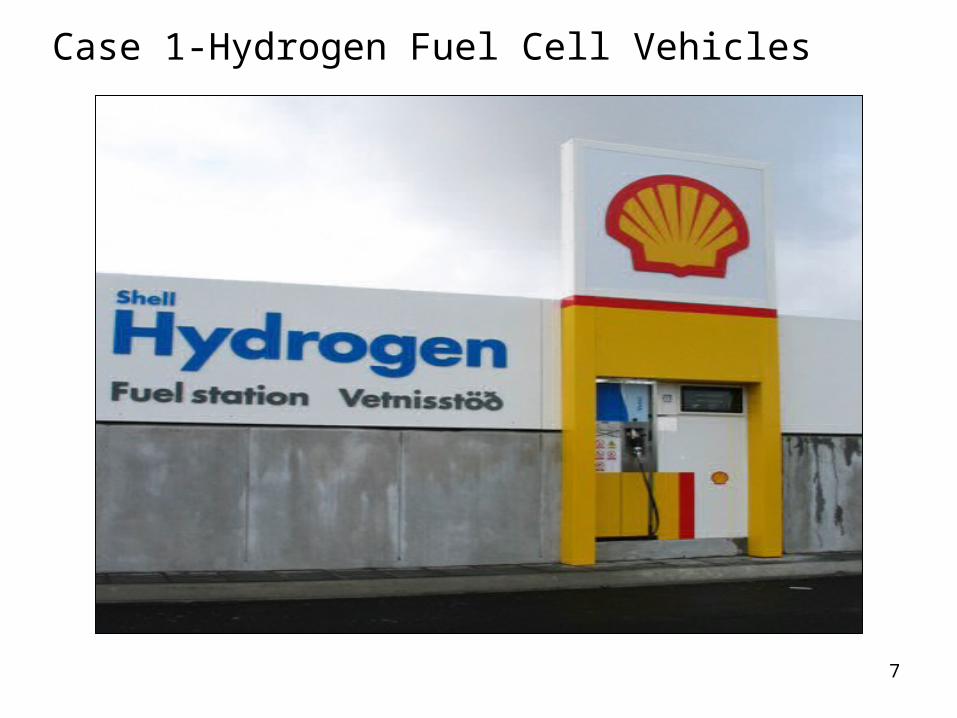
Case 1-Hydrogen Fuel Cell Vehicles

Hydrogen Fuel Cell VehiclesHydrogen Production Routes
Coal
Reformer
Gasifier
Natural Gas
Electric Power Plant
Solar PV
Hydrogen
Primary Energy Resource• Coal• Natural Gas• Nuclear• Hydro•
Renewables
Wind
Biomass
Generator
Generator
Nuclear heat
Gasifier
Electrolyzer
Steam Electrolysis
CO2 Sequestration
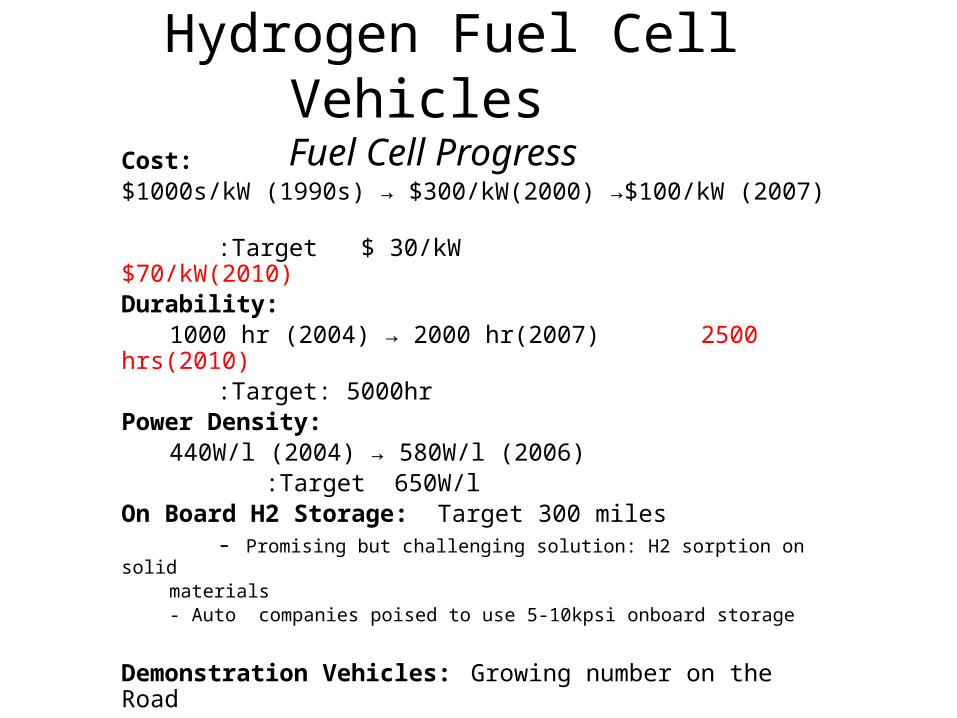
Hydrogen Fuel Cell Vehicles Fuel Cell Progress
Cost:
$1000s/kW (1990s) → $300/kW(2000) →$100/kW (2007) :Target $ 30/kW $70/kW(2010)
Durability:
1000 hr (2004) → 2000 hr(2007) 2500 hrs(2010):Target: 5000hr
Power Density:
440W/l (2004) → 580W/l (2006) :Target 650W/l On Board H2 Storage: Target 300 miles - Promising but challenging solution: H2 sorption on solid
materials - Auto companies poised to use 5-10kpsi onboard storage
Demonstration Vehicles: Growing number on the Road
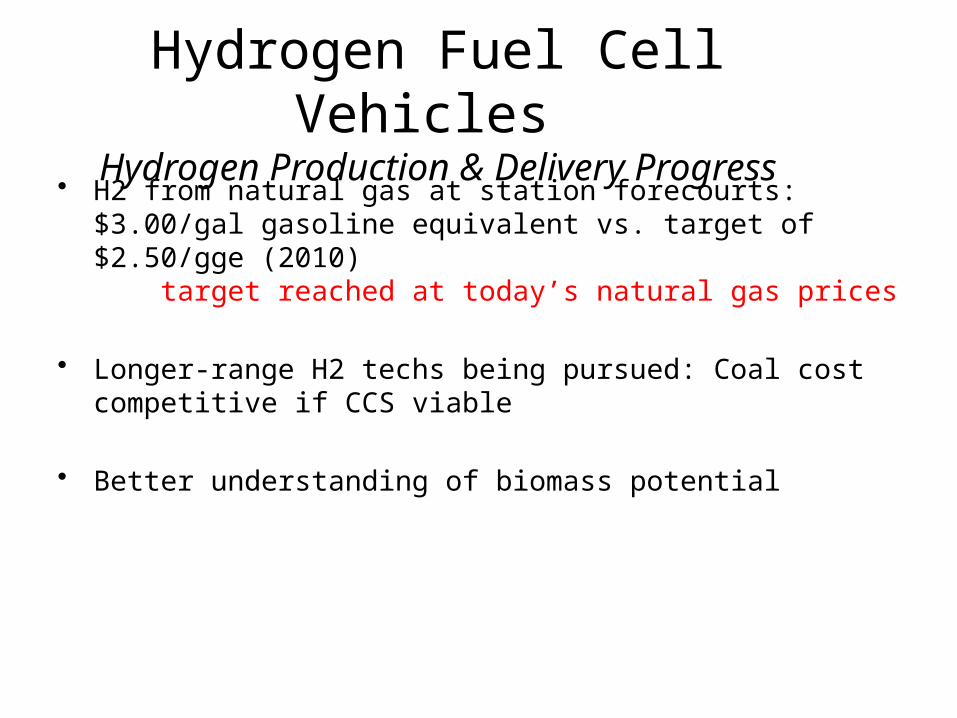
Hydrogen Fuel Cell Vehicles Hydrogen Production & Delivery Progress
• H2 from natural gas at station forecourts: $3.00/gal gasoline equivalent vs. target of $2.50/gge (2010) target reached at today’s natural gas prices
• Longer-range H2 techs being pursued: Coal cost competitive if CCS viable
• Better understanding of biomass potential

11
Hydrogen Fuel Cell VehiclesMaximum Practical Penetration Rate
Maximum practical penetration rate estimated assuming:
• Technical goals are met• Consumers accept HFCVs• Oil prices remain high (EIA high oil
price scenario used as reference case)• Policies are in effect to support HFCVs
and hydrogen production.
12
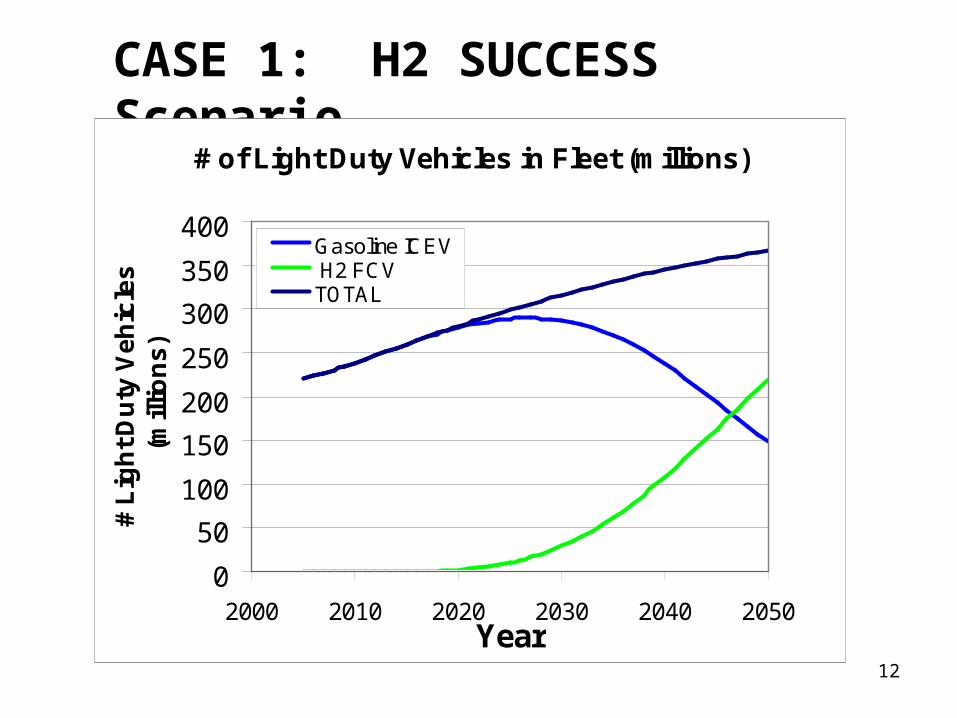
CASE 1: H2 SUCCESS Scenario
# of Light Duty Vehicles in Fleet (millions)
0
50
100
150
200
250
300
350
400
2000 2010 2020 2030 2040 2050Year
# L
igh
t D
uty
Ve
hic
les
(m
illio
ns
)
Gasoline ICEV H2 FCVTOTAL

13
Case 1 (Hydrogen Success): Gasoline Consumption
0
50000
100000
150000
200000
2000 2010 2020 2030 2040 2050
Year
Mill
ion
gal
lon
s g
aso
line
per
yea
r Case 1 (H2Success)
Reference

14
• The estimated government cost to support a transition to HFCVs is roughly $55 B from 2008 to 2023.
$40 B - the incremental cost of HFCV $8 B - the initial deployment of H2 supply infrastructure $5 B for R&D.
• Industry cost for H2 infrastructure $400 B by 2050 * -180,000 stations - 210 central plants - 80,000 miles of pipeline
* 220,000,000 HFCVs
Hydrogen Fuel Cell VehiclesImplementation Costs
15
add section title
1. Add picture of ICE and Hybrid vehicle 1 picture use something from one of the auto presentations
2. Add slide as what we did ie did not look at costs, but tech = penetration potential
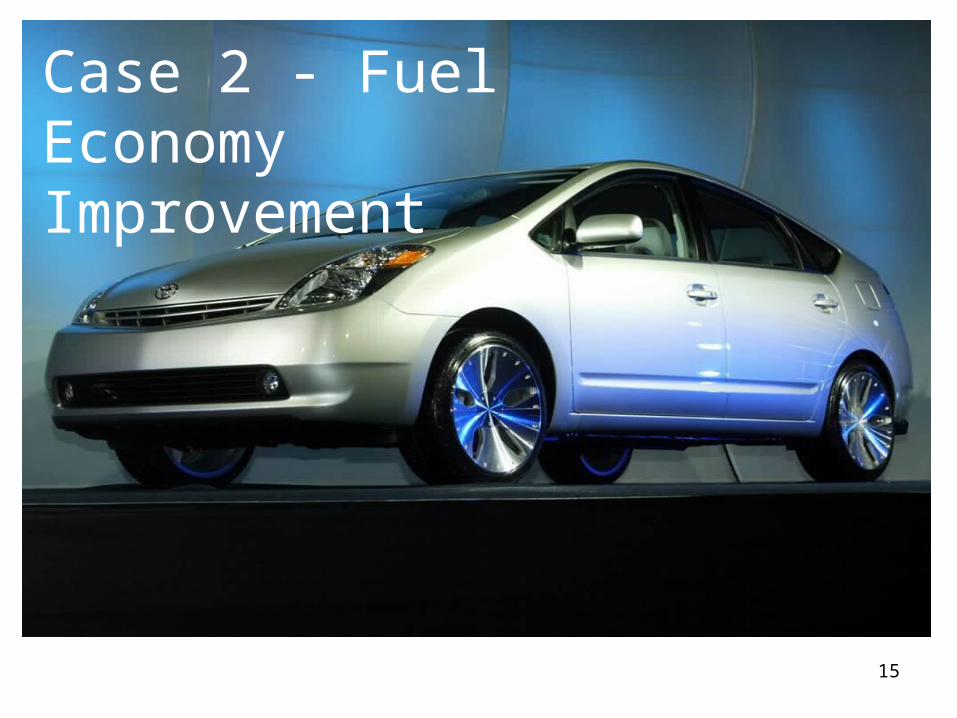
Case 2 - Fuel Economy Improvement

16
Fuel Economy Improvement
• The Energy Independence and Security Act of 2007 raises fuel economy standards to 35 mpg by 2020.
• This study evaluated technologies to improve fuel economy but did not closely examine costs.
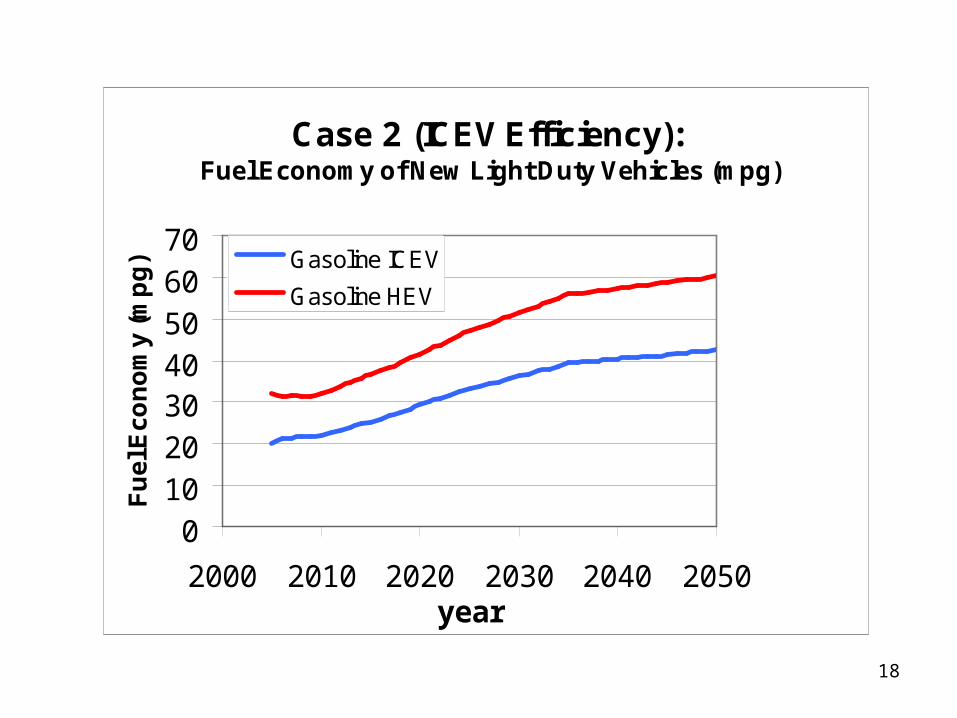
• Gasoline HEVs dominate; no FCVs or PHEVs• Continued advancements in conventional vehicles offer
significant potential• 2.6%/year 2010 to 2025• 1.7%/year 2026 to 2035• 0.5%/year 2036 to 2050

17
Fuel Economy ImprovementTechnologies
FE Improvement 2015 2025• Engine/Transmission: 14% 20%
– Variable valve timing & lift– Cylinder deactivation– Gasoline direct injection
• Weight, drag, tires: 8% 12%• Accessories: 2% 4%• Idle Stop: 3% 4%
18
Case 2 (ICEV Efficiency): Fuel Economy of New Light Duty Vehicles (mpg)
010203040506070
2000 2010 2020 2030 2040 2050year
Fu
el E
con
om
y (m
pg
) Gasoline ICEV
Gasoline HEV

19
Case 2 (ICEV Efficiency): Number of Light Duty Vehicles (millions)
0
100
200
300
400
2000 2010 2020 2030 2040 2050
Year
# V
ehic
les
(mill
ions
)Gasoline ICEV
Gasoline HEV
TOTAL

Fuel Economy Improvement Fuel Consumption
Case 2 (ICEV Efficiency): Gasoline Consumption (million gallons per year)
0
50000
100000
150000
200000
1990 2010 2030 2050
Year
Gas
olin
e C
on
sum
pti
on
(mill
ion
gal
lon
s p
er y
ear)
Case 2 (ICEVEfficiency)
Reference
21
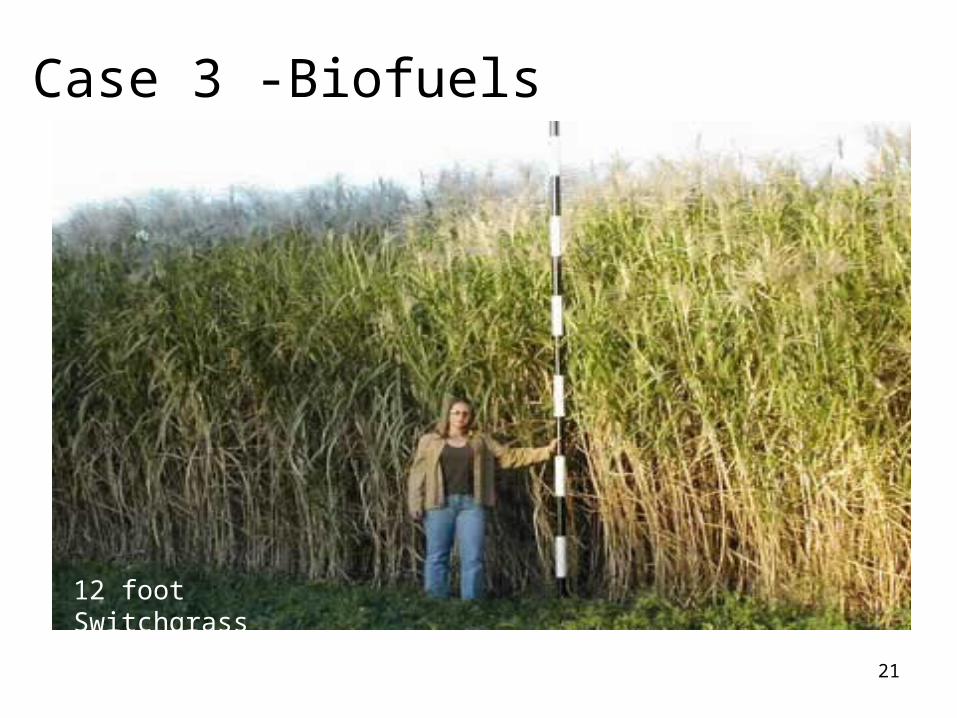
Case 3 -Biofuels
12 foot Switchgrass

Biofuels• Study analyzed
Potential amount of sustainable biomass
Technologies to convert biomass to fuels
Fuel products
• Looked at technical potential but did not closely examine costs
• Study focus was on US oil and CO2 reduction

BIOFUEL SUCCESS
• Grain and Sugar based ethanol - maximum potential 12 billion gallons/year
• Sustainable biomass (million dry tons per year)*
300 mtpy current, 500 mtpy 2030, 700 mtpy 2050• Cellulosic ethanol has significant potential, 10 billion
gallons/year by 2020 and 45 billion(gas eq) by 2050 **• Large portion of biomass could be converted other
advanced biofuels after 2020
*crop residues, energy crops, forest residues
** gasoline equilvalent
*** maximum practicable case

BiofuelsTotal Production
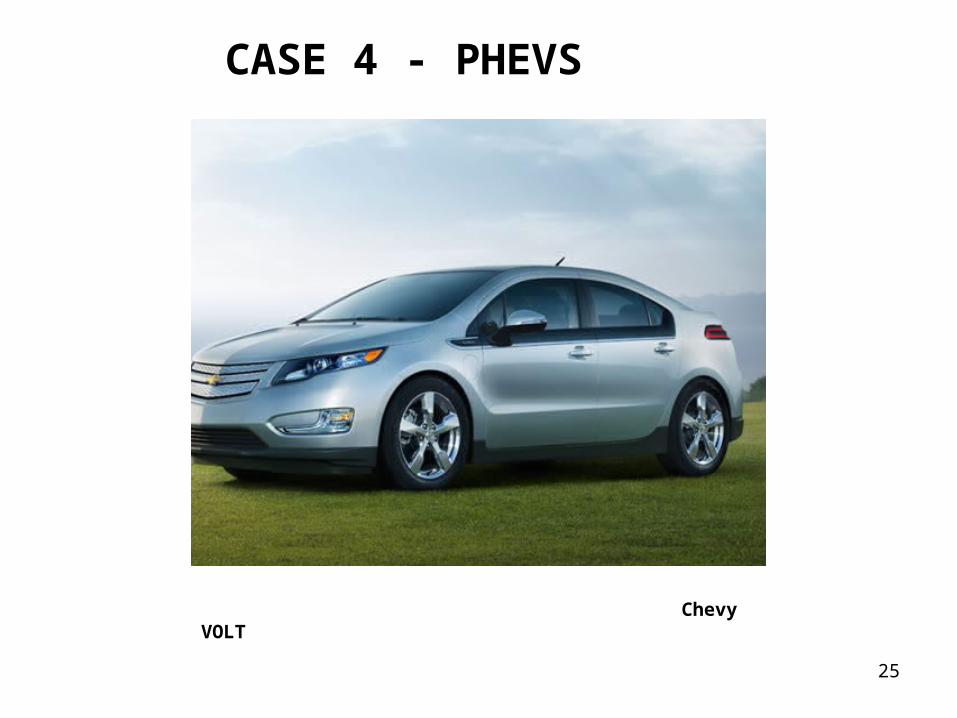
CASE 4 - PHEVS
Chevy VOLT
25

26
CASE 4: PHEVS
• 2 mid-size vehicle types: PHEV-10s, PHEV-40s• 2 market penetration rates:
– Maximum Practical (same as H2 FCVs but start earlier (2010)
– Probable• 2 electricity grid mixes (business as usual and
EPRI/NRDC scenario for de-carbonized generation in a 2007 study)
• PHEV gasoline and electricity use based on estimates by MIT, NREL, ANL

PHEV Cost Analysis: Batteries are Key
Need acceptable cost for reasonable range, durability, and safety
27

2828
Batteries
• Looked at 10 and 40 mile midsize cars - PHEV-10s and PHEV-40s
• Battery packs with 2 and 8 kWh useable
or 4 and 16kWh nameplate energy– Start of life, not after degradation– 200 Wh/mile – 50% State of Charge range (increases to compensate
for degradation)

2929
Current PHEV Battery Pack Cost* Estimates Compared ($/kWh nameplate)
• $700-1500/kWh (McKinsey Report)• $1000/kWh (Carnegie Mellon University)• $800-1000/kWh (Pesaran et al)• $500-1000/kWh (NRC: America’s Energy Future
report)• $875/kWh (probable) NRC PHEV Report• $625/kWh (optimistic) NRC PHEV Report• $560/kWh (DOE, adjusted to same basis)• $500/kWh (ZEV report for California)*Unsubsidized costs
3030
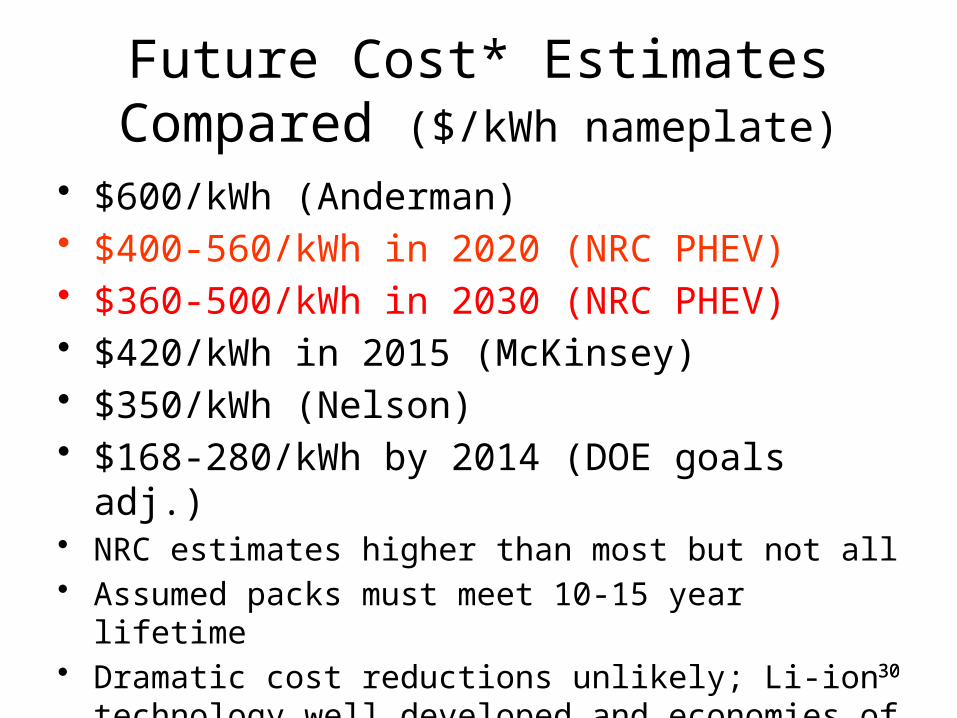
Future Cost* Estimates Compared ($/kWh nameplate)
• $600/kWh (Anderman)• $400-560/kWh in 2020 (NRC PHEV)• $360-500/kWh in 2030 (NRC PHEV)• $420/kWh in 2015 (McKinsey)• $350/kWh (Nelson)• $168-280/kWh by 2014 (DOE goals adj.)• NRC estimates higher than most but not all • Assumed packs must meet 10-15 year lifetime• Dramatic cost reductions unlikely; Li-ion technology well
developed and economies of scale limited*Unsubsidized costs

3131
Vehicle Costs
PHEV-40• Total Pack cost now $10,000 - $14,000• Total PHEV cost increment over current conventional
(non-hybrid) car: $14,000 - $18,000• PHEV cost increment in 2030: $8,800 - $11,000
PHEV-10• Total Pack cost now $2500 - $3,300• Total PHEV cost increment over current conventional
(non-hybrid) car $5,500 - $6,300• PHEV cost increment in 2030: $3,700 - $4,100

3232
Electric Infrastructure
• No major problems are likely to be encountered for several decades in supplying the power to charge PHEVs, as long as most vehicles are charged at night.
• May need smart meters with TOU billing and other incentives to charge off-peak.
• Charging time could be 12 hours for PHEV-40s at 110-V and 2-3 hours at 220-V. Thus home upgrade might be needed.
• If charged during hours when power demand is high, potential for significant issues with electric supply in some regions.

0
50
100
150
200
250
2000 2010 2020 2030 2040 2050
No
. o
f v
eh
icle
s (
mil
lio
ns
)
Maximumpracticalpenetration
Probablepenetration
33
CASE 4: PHEV Market penetration• Maximum Practical (with optimistic tech development
estimates): 4 million PHEVs in 2020 and 40 million in 2030• Probable (with probable technical development): 1.8 million
PHEVs in 2020 and 13 million in 2030
33
• Many uncertainties, especially willingness and ability of drivers to charge batteries almost every day.

3434
Gasoline Use
0
20,000
40,000
60,000
80,000
100,000
120,000
140,000
160,000
180,000
2010 2020 2030 2040 2050
Year
Ga
so
line
us
e (
mill
ion
ga
llon
s/y
r) Reference Case
Efficiency Case
PHEV-10(maximum)+Efficiency
PHEV-40(maximum) +Efficiency
CASE 4: PHEV Fuel SavingsRelative to Efficiency Case

35
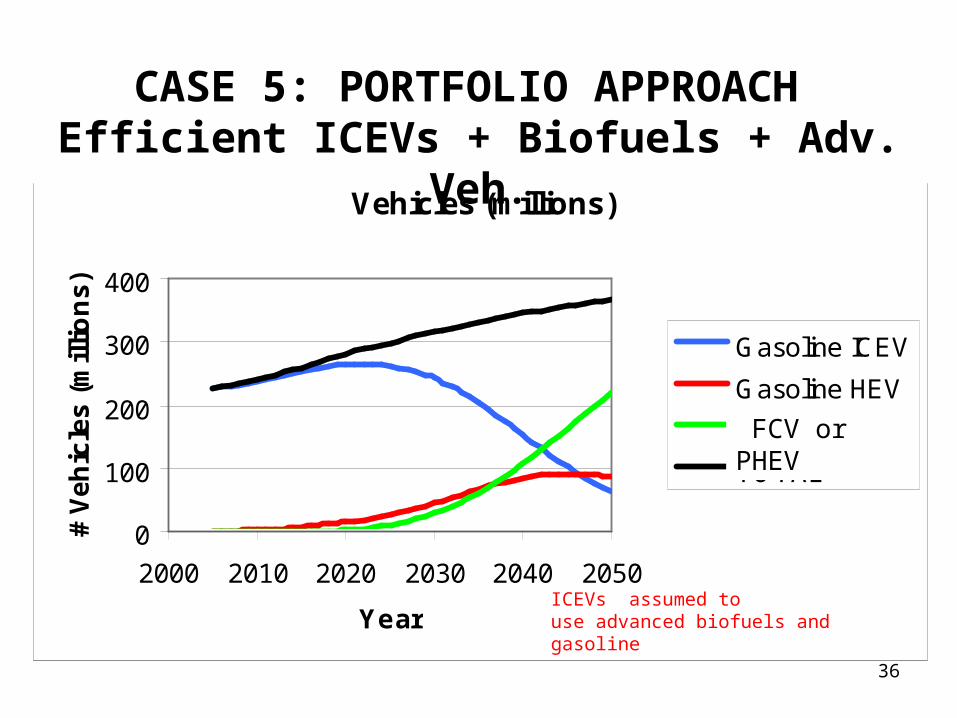
CASE 5: PORTFOLIO APPROACH
Efficient ICEVs + Biofuels + Adv. FCV+PHEVs
36
Case 4 (portfolio): Number of Light Duty Vehicles (millions)
0
100
200
300
400
2000 2010 2020 2030 2040 2050
Year
# V
eh
icle
s (
mil
lio
ns
)
Gasoline ICEV
Gasoline HEV
Hydrogen FCV
TOTAL
CASE 5: PORTFOLIO APPROACH Efficient ICEVs + Biofuels + Adv. Veh.
FCV or PHEV
ICEVs assumed to use advanced biofuels andgasoline
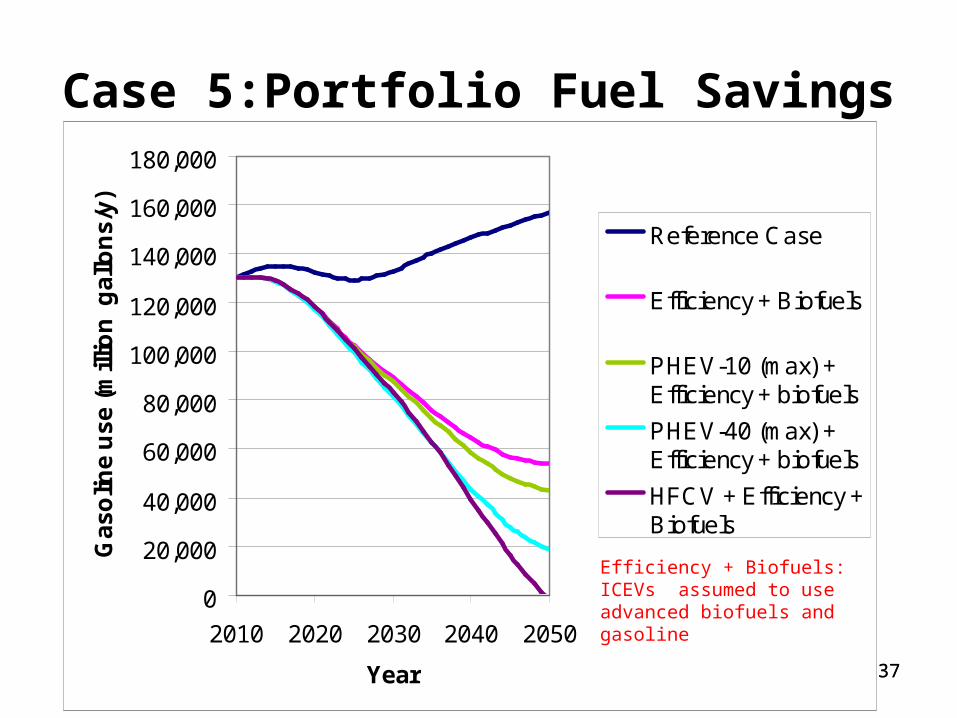
3737
Case 5:Portfolio Fuel Savings
0
20,000
40,000
60,000
80,000
100,000
120,000
140,000
160,000
180,000
2010 2020 2030 2040 2050
Year
Ga
so
line
us
e (
mill
ion
ga
llon
s/y
)
Reference Case
Efficiency + Biofuels
PHEV-10 (max) +Efficiency + biofuels
PHEV-40 (max) +Efficiency + biofuels
HFCV + Efficiency +Biofuels
Efficiency + Biofuels: ICEVs assumed to use advanced biofuels and gasoline

3838
GHG Emissions EIA Grid (million tonnes CO2e/yr)
0
200400
600800
1000
12001400
16001800
2000
2010 2020 2030 2040 2050
Year
GH
G e
mis
sio
ns
(m
illio
n t
on
ne
s C
O2
e p
er
ye
ar) Ref Case
Efficiency +Biofuels
PHEV-10 (max) +Efficiency +Biofuels
PHEV-40 (max) +Efficiency +Biofuels
HFCV + Efficiency+ Biofuels
Case 5:Portfolio GHG Emissions BAU Electric Grid

3939
GHG Emissions EPRI/NRDC Grid (million tonnes CO2e/yr)
0
200400
600800
1000
12001400
16001800
2000
2010 2020 2030 2040 2050
Year
GH
G e
mis
sio
ns
(m
illio
n t
on
ne
s C
O2
e p
er
ye
ar) Reference Case
Efficiency +Biofuels
PHEV-10 (max) +Efficiency +Biofuels
PHEV-40 (max) +Efficiency +Biofuels
HFCV + Efficiency+ Biofuels
Case 5:Portfolio GHG Emissions De-carbonized Electric Grid(EPRI/NRDC)

Potential Transition Costs for HFCV and PHEVs
40

41
PHEV-10 PHEV-40 PHEV-40 Sensitivity Cases
High Oil DOE Goal
HFCVSuccess Partial
Success
Breakeven Year
2024 2040 2025 2024 2023 2033
Cum. Cash flow to breakeven ($billion)
24 408 41 24 22 46
Cum. Vehicle Retail Price Diff to breakeven ($ billion)
82 1639 174 82 40 82
# Vehicles at breakeven (million)
10 132 13 10 5.6 10
Infrastructure Cost at breakeven ($ Billion)
10(in-home charger @$1000)
132(in-home charger @$1000)
13(in-home charger @$1000)
10(in-home charger @$1000)
8 (H2 stations for first 5.6 million FCVs)
19 (H2 stations for first 10 million FCVs)
41
TRANSITION COSTS: PHEVs and H2 FCVS
1-3 decade transition time; Transition cost $10s-100s Billions;Results very sensitive to oil price and vehicle (battery& fcell) costs

4242
Major Findings• Significant fuel and CO2 reductions can be achieved over
next 20 years with efficient ICE/HEV technologies and biofuels.
• PHEVs and HFCVs have greater long-term potential for fuel savings. HFCVs can greatly reduce CO2 emissions, but savings from PHEVs dependent on grid fuel source.
• A portfolio of technologies has potential to eliminate oil and greatly reduce CO2 from US light duty transportation by 2050
• The U.S. could have tens of millions of H2 FCVs and PHEVs on the road in several decades, but that would require tens or hundreds of billions in subsidies
• Technology breakthroughs are essential for both fuel cells and batteries; cost reductions from manufacturing economies of scale will be much greater for fuel cells than batteries

Backup Slides
43
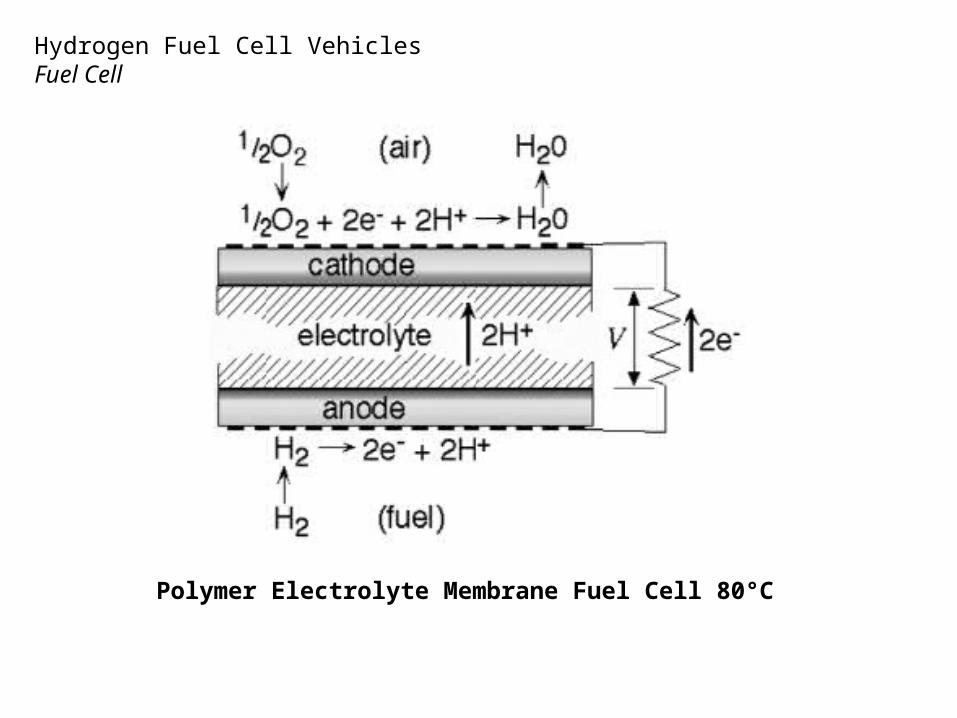
Hydrogen Fuel Cell VehiclesFuel Cell
Polymer Electrolyte Membrane Fuel Cell 80°C

Hydrogen Fuel Cell VehiclesInfrastructure Cases

4646
AEO 2008 High Oil Prices Case and EPRI/NRDC 2007. Environmental Assessment of Plug-In Hybrid Electric Vehicles. Volume 1: Nationwide Greenhouse Gas Emissions.
PHEVS CONCLUSIONS
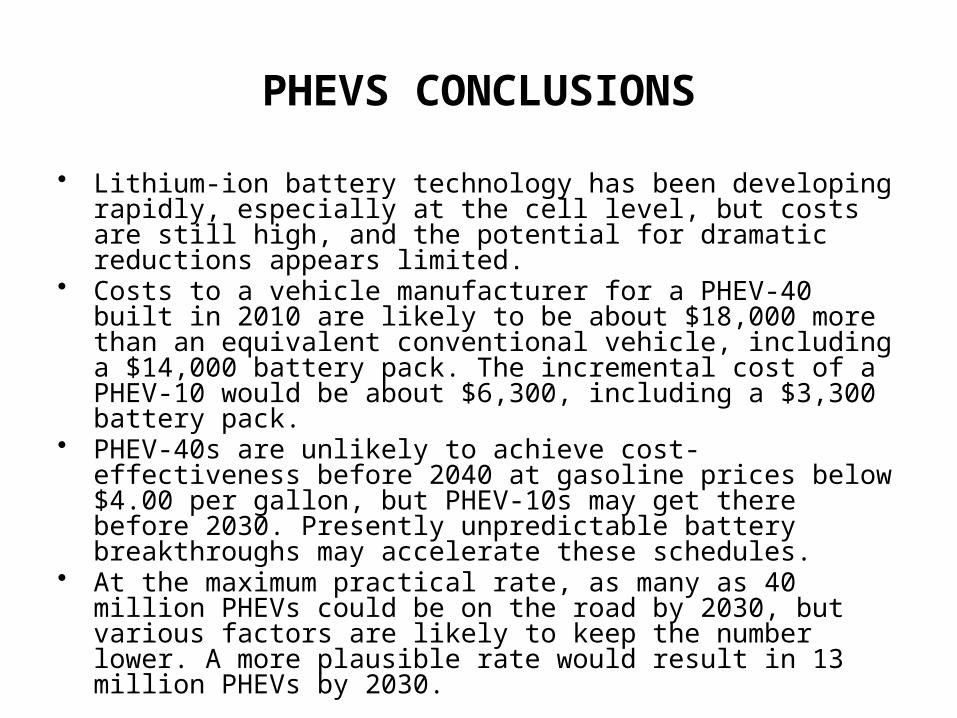
• Lithium-ion battery technology has been developing rapidly, especially at the cell level, but costs are still high, and the potential for dramatic reductions appears limited.
• Costs to a vehicle manufacturer for a PHEV-40 built in 2010 are likely to be about $18,000 more than an equivalent conventional vehicle, including a $14,000 battery pack. The incremental cost of a PHEV-10 would be about $6,300, including a $3,300 battery pack.
• PHEV-40s are unlikely to achieve cost-effectiveness before 2040 at gasoline prices below $4.00 per gallon, but PHEV-10s may get there before 2030. Presently unpredictable battery breakthroughs may accelerate these schedules.
• At the maximum practical rate, as many as 40 million PHEVs could be on the road by 2030, but various factors are likely to keep the number lower. A more plausible rate would result in 13 million PHEVs by 2030.

PHEVS CONCLUSIONS cont• PHEVs will have little impact on oil consumption before 2030
because there will not be enough of them in the fleet. More substantial reductions could be achieved by 2050. PHEV-10s will reduce oil consumption only slightly more than can be achieved by HEVs.
• PHEV-10s will emit less carbon dioxide than nonhybrid vehicles, but show little advantage over HEVs after accounting for emissions from the electric power generation.
• No major problems are likely to be encountered for several decades in supplying the power to charge PHEVs, as long as most vehicles are charged at night.
• A portfolio approach to research, development, demonstration, and, perhaps, market transition support is essential.

Liquid Fuel DemandGlobal, United States, and U.S. Imports
2006
2006
2006
2030
2030
2030
2030
2030
2030
0
20
40
60
80
100
120
140
Global Demand U.S. Demand U.S. Imports (net)
Mil
lio
n B
arre
ls p
er D
ay
2006 - Actual
2030 - Reference
2030 - High Price
Non-OPEC
Saudi Arabia
Venezuela
Nigeria
Algeria
Iraq
Kuwait
Other OPEC
OPEC

50
United States
United States
Global
Global
0
2000
4000
6000
8000
10000
12000
14000
2006 2030
Mill
ion
Met
ric T
ons
of C
arbo
nCarbon Emissions
51
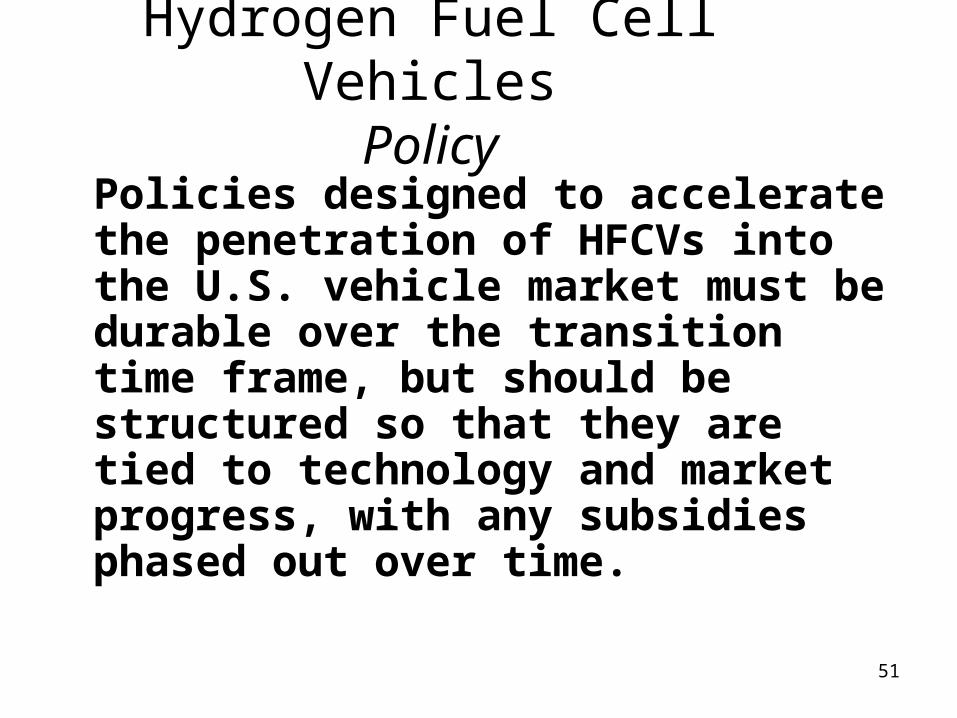
Policies designed to accelerate the penetration of HFCVs into the U.S. vehicle market must be durable over the transition time frame, but should be structured so that they are tied to technology and market progress, with any subsidies phased out over time.
Hydrogen Fuel Cell VehiclesPolicy

Transportation Energy Policy
Hydrogen fuel cell vehicles and other emerging technologies collectively
- potential to eliminate oil demand from LDT 2050.
- reduce GHG emissions to less than 20% of current
Policies must support a portfolio of technologies to achieve these results and be durable and sustainable

53
Type of Hydrogen Supply over Time
Case 1 (Hydrogen Success) 2020 2035 2050
No. of cars served (percentage of total fleet)
1.8 million (0.7%) 61 million (18%) 219 million (60%)
Infrastructure capital cost $2.6 billion $139 billion $415 billion
Total No. of stations 2,112 (all on-site SMR)
56,000 (40% on-site SMR)
180,000 (44% on-site SMR)
No. of central plants 0 113 (20 coal, 93 biomass)
210 (79 coal, 131 biomass)
Pipeline length (miles) 0 39,000 80,000
Hydrogen demand (tonnes per day)
1,410 (100% NG)
38,000 (22% NG, 42% biomass, 36% coal with CCS)
120,000 (31% NG, 25% biomass, 44% coal with CCS)
NOTE: NG = natural gas.