the viability of phevs in kenya
DESCRIPTION
A Detailed Research Paper carried out by A masters Degree Student on the viability of PHEVs in the Kenyan Market. Includes research methods which justify reasoning and conclusions attained,TRANSCRIPT

(i)
University of Sunderland – Intel College
MBA Dissertation
The Viability of Plug-in Hybrid Electric Vehicles in the
Kenyan Market: A Strategic Study
Author: Zuhair Hassan Jaffer
Student Number: 119157215
Supervisor: Dr. E.O. Awuor

(ii)
ACKNOWLEDGEMENT
I would like to acknowledge all those who have supported me in taking up this endeavor, and
have helped me succeed in compiling this dissertation, the rest of the modules within this MBA
program and generally finding success in life.
I know that without the hand of the Almighty above my hand, there would be no success, and
thus I would like to first and foremost thank Him. Without strength from Him in my limbs I
would not be able to get as far as I have.
My wife; the one who nudged me forward with encouragement which helped fuel the late night
fires, and helped me make steady steps, propelling the compilation forward. Without her strong
will and comforting nature, I would be lost.
My supervisor; Dr. Awour; with this tireless efforts and dedication to get my work to a level of
exceptionality and to ensure that areas of requirement were met if not exceeded.
My parents and siblings; who either directly or indirectly motivated me to create something I
would be proud of in the future.
My friends and colleagues; who had their own ways of pushing me on.
Thank you all.

(iii)
PERSONAL DEVELOPMENT
Every task man decides to undertake is oft due to a clear path he has woven for himself. As for
me; like most others, my path lies through personal development toward honing skill sets that
will enable me to build a stronger future. One of the very key skills I would like to develop is my
leadership ability.
With a clear goal in mind, anyone is able to achieve great things. I have a clear goal, and to reach
it I have set numerous milestones for myself. One of these milestones is to start my own
company and to run it using leadership principles that I have gained from this MBA, as well as
the experience that I have been through, both under employment and in the research of the
dissertation currently in front of you.

(iv)
LIST OF ACRONYMS
PHEV – Plug-in Hybrid Electric Vehicle
V2G – Vehicle to Grid
KMI – Kenya Motor vehicle Institution
GMEA – General Motors East Africa
AER – All Electric Range
VMT – Vehicle Miles Travelled
ICE – Internal Combustion Engine
ANOVA – Analysis of Variance

(v)
LIST OF TABLES
Table Page
Table 1.1: Electricity Tariffs in Kenya 30
Table 2.1: Basic PHEV Costings 31
Table 3.1:
Table 3.2:
Table 3.3:
Table 3.4:
Table 3.5:

(vi)
LIST OF FIGURES
Figure Page
Figure 1.1: A full energy performance assessment of PHEV 29
Figure 2.1: Conceptual Framework of the study 35
Figure 3.1.1
Figure 3.1.2
Figure 3.1.3
Figure 3.1.4
Figure 3.2.1
Figure 3.2.2
Figure 3.2.3
Figure 3.2.4
Figure 3.3.1
Figure 3.3.2
Figure 3.3.3
Figure 3.3.4
Figure 3.4.1
Figure 3.4.2
Figure 3.4.3

(vii)
Figure 3.4.4
Figure 3.5.1
Figure 3.5.2
Figure 3.5.3
Figure 3.5.4

(viii)
ABSTRACT
Numerous factors point toward the requirement of a change in the vehicle industry in the Kenyan
market, and in the global environment in general. Environmental pollution, lack of efficiency,
and high costs of petrol and traditional fuels, are just a few. Looking into options to bring this
required change, we find that technology has brought us to a stand-off, whereby although the
electric vehicles of today would prevent many of the flaws with traditional fuel driven vehicles,
the standard requirements set by drivers; such as long distance travel and regular fuel station
stops, would not be met by the electric vehicles. Therefore we need to look at a mix between the
benefits of electric and traditional vehicles, and that is the PHEV. This dissertation covers
various aspects in determining the viability of introducing Plugin Hybrid Electric Vehicles into
the Kenyan market. The objectives have been categorized into four major aspects including the
market viability, the technical viability, the economic viability and lastly a proposed business
strategy which should enable quick adaptation into the market. The target of the study is the
vehicle distribution agencies in Kenya, and both quantitative and qualitative data collection
methods are employed. The data is analyzed using content analysis for the qualitative data and
ANOVA for the quantitative data. The results of the data analysis show best practices when
introducing PHEVs into the Kenyan market; such as the improvement of the electrical
infrastructure, and the partnering with supermarkets to introduce charging stations in their
parking lots. These best practices are then translated into a business strategy which is shown in
detail.
Analysis of various countries which have adapted the idea and brought in PHEVs into the market
is then covered showing the feasibility and comparing it with the Kenyan market using the
differences in fuel and electricity prices as well as the economy, living standards and
environmental factors.

(ix)
TABLE OF CONTENTS
Declaration ..................................................................................... Error! Bookmark not defined.
Acknowledgement .......................................................................................................................... ii
Personal Development ................................................................................................................... iii
List of Acronyms ........................................................................................................................... iv
List of Tables .................................................................................................................................. v
List of Figures ................................................................................................................................ vi
Abstract ........................................................................................................................................ viii
Table of Contents ........................................................................................................................... ix
CHAPTER ONE ............................................................................................................................. 1
INTRODUCTION .......................................................................................................................... 1
1.1 Chapter Introduction ........................................................................................................ 1
1.2 Background of the Study ...................................................................................................... 1
1.3 Problem Statement ................................................................................................................ 2
1.4 Objectives of the Study ......................................................................................................... 2
1.4.1 Broad Research Question ............................................................................................... 2
1.4.2 Specific Research Objectives ......................................................................................... 2
1.5 Research Questions ............................................................................................................... 3
1.6 Scope of the Study ................................................................................................................ 3
1.7 Significance of the Study ...................................................................................................... 3
1.7.1 Vehicle Distribution Agencies ....................................................................................... 4
1.7.2 The Kenyan Government ............................................................................................... 4
1.7.3 The consumers and vehicle owners ............................................................................... 4

(x)
1.8 Limitations of the Study........................................................................................................ 5
1.9 Chapter Summary ................................................................................................................. 5
CHAPTER TWO ............................................................................................................................ 6
LITERATURE REVIEW ............................................................................................................... 6
2.1 Chapter Introduction ............................................................................................................. 6
2.2 Theoretical Literature Review .............................................................................................. 6
2.2.1 Market Viability ............................................................................................................. 6
2.2.2 Technological Viability ............................................................................................... 12
2.2.3 Economic Viability ...................................................................................................... 15
2.2.4 Effective Business Strategy ......................................................................................... 18
2.3 Critical Literature Review ................................................................................................... 21
2.4 Conceptual Framework ....................................................................................................... 21
2.5 Chapter Summary ............................................................................................................... 22
CHAPTER THREE ...................................................................................................................... 23
METHODOLOGY ....................................................................................................................... 23
3.1 Introduction ......................................................................................................................... 23
3.2 Research Design.................................................................................................................. 23
3.3 Target Population ................................................................................................................ 23
3.4 Data Collection ................................................................................................................... 24
3.5 Data Analysis ...................................................................................................................... 24
3.6 Chapter Summary ............................................................................................................... 25
CHAPTER FOUR ......................................................................................................................... 26
RESEARCH RESULTS & aNALYSIS........................................................................................ 26
4.1 Introduction ......................................................................................................................... 26

(xi)
4.2 Feedback of the study ......................................................................................................... 26
4.3 Findings of the Study .......................................................................................................... 44
4.4 Analysis of Results ............................................................................................................. 27
4.4.1 Adopted Technique ...................................................................................................... 27
4.4.2 Content Analysis .......................................................................................................... 27
4.4.3 Analysis of Variance .................................................................................................... 29
4.5 Chapter Summary ............................................................................................................... 44
CHAPTER FIVE .......................................................................................................................... 46
CONCLUSIONS AND RECOMMENDATIONS ....................................................................... 46
5.1 Introduction ......................................................................................................................... 46
5.2 Summary of Key Findings .................................................................................................. 46
5.2.1 Research Question 1: ................................................................................................... 46
5.2.2 Research Question 2 .................................................................................................... 46
5.2.3 Research Question 3 .................................................................................................... 46
5.2.4 Research Question 4 .................................................................................................... 47
5.3 Conclusion .......................................................................................................................... 47
5.3.1 Specific Objective 1 ..................................................................................................... 47
5.3.2 Specific Objective 2 ..................................................................................................... 47
5.3.3 Specific Objective 3 ..................................................................................................... 47
5.3.4 Specific Objective 4 ..................................................................................................... 47
5.4 Recommendations ............................................................................................................... 47
5.6 Chapter Summary ............................................................................................................... 47
References ..................................................................................................................................... 48
Appendix 1 ....................................................................................................................................... a

(xii)
Business Strategy ......................................................................................................................... a
1 Introduction ........................................................................................................................... a
2 Benefits and Costs................................................................................................................. a
3 Product Development........................................................................................................... b
4 Financial Implications .......................................................................................................... b
5 Strategy ................................................................................................................................ d
6 Conclusion ........................................................................................................................... d
Appendix 2 ...................................................................................................................................... d
Used Car Dealers in Kenya ......................................................................................................... d
New Car Dealers in Kenya .......................................................................................................... i
Appendix 3 ..................................................................................................................................... m
Sample Size Calculator .............................................................................................................. m
Appendix 4 ...................................................................................................................................... n
Questionnaire .............................................................................................................................. n
Appendix 5 ....................................................................................................................................... s
General Interview Schedule for Vehicle distributors ................................................................... s
Opening .................................................................................................................................... s
Body ......................................................................................................................................... s
Closing .................................................................................................................................... v
Appendix 6 ..................................................................................................................................... w
Introduction Letter ..................................................................................................................... w

(1)
CHAPTER ONE
INTRODUCTION
1.1 Chapter Introduction
Being the first chapter of the research, it is necessary to introduce the various aspects of the
technology being scrutinized and the objectives of the study.
1.2 Background of the Study
The entire world, greedily, turns towards the natural resource found under our very feet; this
resource is none other than that of black gold. But with the unlimited demand of desires and the
very limited supply of this resource, it is inevitable that there will come a point when alternatives
will look much more attractive to the consumer.
In the year 2008 the total amount of money spent by Kenya on Oil Imports was $3.05 billion,
while each litre of fuel consumed by motorists reached a high of 110 kshs (the economic watch,
2011). The average consumption of petrol and diesel over the same year was 7.6 litres for every
100km (GFEI Kenyan Baseline, 2011).
There are fewer cars on the Kenyan roads during mid to end month when salaries have been
depleted, this is because of the high prices of fuel, which forces consumers to look at the
opportunity cost of fuel.
With these ever increasing figures, it becomes more and more attractive for consumers to look
for alternative substitutes to fuel. One of the more dominant substitutes which has been adopted
by various countries is that of plug-in hybrid electric vehicles (PHEV).
PHEVs are vehicles which run on electricity as well as fuel, allowing consumers to use
electricity to charge their vehicles at home before travelling and at the same time leaving the
possibility for them to use fuel to run the vehicles when it becomes necessary. This ultimately
reduces the dependency on fuel.

(2)
The current technology of PHEVs allows approximately 196km of travel for a fully charged
battery; which is good enough for most urban journeys, but for long distance travel, it would be
necessary to add fuel as well.
1.3 Problem Statement
In 1950 there were approximately 50 million cars across the globe, and in 1994 this number
increased to 600 million cars, that’s 1 car for every 10 people, if this trend continues by 2050 we
would have over 3 billion cars in the face of the Earth (Sperling, 1995)
Kenya is no exception from this trend, having an annual average growth of cars in the country of
approximately 20% (GFEI Kenya Baseline, 2011)
Over the years, the transport sector in Kenya generally consumed 70% of the total net domestic
sales of petroleum products, with the overall amount of petroleum demanded by the transport
sector projected to rise from 1.9 million tons in 2004 to 8.6 million tons, 5.3 million tons and 6.8
million tons (depending on Business As Usual, Medium and Low scenarios) by 2030 (UNEP,
2006)
With this in mind, it is evident that there is need for a solution to the rising demand of petroleum
products. Other countries have also noted this problem, and a number of solutions are being
looked into. One of these solutions which has succeeded and is growing rapidly all over the
globe is that of PHEVs.
1.4 Objectives of the Study
1.4.1 Broad Research Question
Plug-in hybrid electric verses fuel based vehicles: which is more viable in the Kenyan market?
1.4.2 Specific Research Objectives
1) To assess the market viability of PHEVs in Kenya
2) To evaluate the technical viability of PHEVs in the Kenyan environment
3) To determine the economic viability of the introduction of PHEVs in Kenya
4) To recommend an effective business strategy for the introduction of PHEVs in the Kenyan
market

(3)
1.5 Research Questions
The specific research objectives are used as guidelines to ensure that the study concentrates on
certain areas and is not side tracked. These objectives need to be phrased as questions so that by
the end of the study it is clear whether the answers to these questions have been found and what
exactly they are.
Therefore the research questions for this study are:
1) Is the Kenyan market ready for the introduction of PHEVs?
2) Taking into consideration the extent of technological development of PHEVs currently, is
the Kenyan environment technically ready for PHEVs?
3) Will the economic status of Kenya allow consumers to purchase PHEVs?
4) What would the most effective business strategy be; for a vehicle distributor in Kenya, to
successfully introduce PHEVs?
1.6 Scope of the Study
The scope of this study is within the vehicle distribution industry in the Kenyan market. The
various aspects of viability will also require including the consumer readiness to adapt this new
technology and the infrastructure availability within the region.
With 230 registered distributers in the country across the major cities, the scope would
encompass all the major cities and will be done within a period of 3 months in the year 2013.
The study is to be carried out using both questionnaires and interviews to key stakeholders in the
vehicle distribution industry and the objective would be to gather the answers to the research
questions mentioned above.
1.7 Significance of the Study
This research is meant to pave the way forward for development of new innovations in terms of
environment friendly, electric and hybrid vehicles in the Kenyan Market.

(4)
1.7.1 Vehicle Distribution Agencies
The impact of the study to vehicle distribution agencies is that it is meant to direct them towards
successfully introducing PHEVs into the market, and to show them using previous literature and
current research what would be required to ensure their viability in the Kenyan environment.
It would be prudent to mention here that based on the outcome of the research, the impact could
also be to prevent vehicle distribution agencies from venturing into PHEVs at the current time
due to the lack of suitability in the Kenyan market. The study would also clearly indicate basic
factors which would bring about the suitability of PHEVs and vehicle distribution agencies
would know what to look for before venturing into this new product.
1.7.2 The Kenyan Government
The study is meant to bring to focus the various benefits of PHEVs, especially to a developing
country such as Kenya. Benefits such as pollution reduction would cause the Kenyan
government to encourage the importation and distribution of PHEVs in larger scales.
The various factors inhibiting the introduction of the PHEVs into the market, such as the lack of
electrical infrastructure that would enable reliable charging of cars at home; among others, which
can be corrected by the government, would be highlighted by the study and impact the decision
of the government to act quickly to ensure these factors are mitigated.
1.7.3 The consumers and vehicle owners
Vehicle owners need to have a clear understanding of what to expect from a PHEV and exactly
what benefits and costs would be involved with owning one.
If they are going to save in the long-term, and whether they will be willing to invest in a home
charging station with the power fluctuations experienced in the country; these are all determining
factors for the success of the adoption of PHEVs in the market.
This study is meant to improve the understanding of the consumers so that they can make better
informed decisions.

(5)
1.8 Limitations of the Study
The study is limited to the point of view of the distributors of vehicles in Kenya. It would be
prudent to get the government and consumers to also provide insight on the viability. Other
stakeholders would need to be convinced of the prudence of the introduction of PHEVs and this
study will not cover them, leaving room for future researchers to take this study further.
Not all the distributors can be reached given the timelines provided for the study, if this research
is to be taken to the next level, it would be necessary for more time to be given to collect data
thoroughly.
1.9 Chapter Summary
To begin with, the background of the research is looked into to bring understanding as to why
this study was chosen, and once that has been sufficiently explained, it would be simpler to break
down the problem into objectives and research questions.
(6)
CHAPTER TWO
LITERATURE REVIEW
2.1 Chapter Introduction
When conducting a thorough research on a specific topic, it is necessary to review all previous
literature on that topic to enable a broader insight and better understanding. In this chapter the
literature covering the four specific objectives of the study; as indicated in the previous chapter,
is brought into light and various credible sources are taken into account.
Due to the fact that the PHEV technology is one which is evolving, there are still areas which
have not been covered by previous literature; it is necessary to highlight these areas, especially
those which pertain to this study.
Finally a conceptual framework; showing the design of this study and how the various elements
of the study relate to each other, is to be portrayed so as to give an idea of what the inputs and
outcomes of the study are meant to be.
2.2 Theoretical Literature Review
2.2.1 Market Viability
According to Sperling (1995) the first most important step to ensure market viability is to have a
clear central vision and strict guiding principles. He argues that without this central vision,
consumers would be bewildered by the large array of options in the fuel and vehicle industries.
On the other hand Eaton (1993) states clearly that vision is overrated due to the fact the car
industry is mature. He states that a more important measure would be to have quantifiable short-
term results.
From these arguments we can deduce that the viability of a market requires certain mind-sets
which determine how well a particular product is taken up by the consumers in that environment;
whether these mind-sets are in-terms of clear vision or short-term results.

(7)
Kenya does not have domestic vehicle production and relies on imports. The light duty vehicle
stock saw an 85% increase between the years 1998-2008, with the majority (around 80%) of
newly registered vehicles being second-hand imports from Japan (UNEP, 2010)
The established dealers face intense competition from imported second-hand vehicles, mainly
from Japan and United Arab Emirates. These imports now account for about 70% of the market.
The last decade witnessed a significant decline in the number of new vehicles sold in the
country. There has been a steady recovery in the last four years, but the numbers achieved still
fall far short of the numbers recorded a decade ago. In 2004, the leading motor vehicle
companies recorded sales of 9,979 units. Although 27% better than the previous year, this is still
well below the levels achieved in the early 1990’s. The slump in the volume of new cars sold is
attributable the increased competition from second hand vehicles and the depressed economic
environment (PWC, 2013).
This reliance on imports will benefit the PHEV introduction as the consumers in the market are
well acquainted with imported vehicles.
Because the adoption pathways of new technologies often follow S-shaped logistic growth
curves (Geroski 2000), one of two cases apply to logistic growth curves of PHEV sales; the first
models an aggressive 25 year transition to 100% market share for PHEVs, and the second
models an extreme transition to 100% PHEV market share in 12 years. Both these models
revolve around a changing world where pollution leads governments to ensure the uptake of
PHEVs.
In the case of Kenya, certain infrastructure changes will be required to adapt the PHEV
technology, such as, to allow charging from homes; Dowds et al. (2009) discusses some possible
physical impacts on the transmission and distribution system. Transformers for instance could be
subject to increased average operating temperatures under an additional load such as that
required by PHEV charging stations. This could shorten their life, thus adding costs to the
electricity grid.
Those concerns require the operators of the electricity grid to deploy new techniques to monitor,
and remotely control the electricity demand. This is actually already one of the elements of the
role of electricity grid operators in demand side energy management. (Nemry et al, 2009)

(8)
Many factors affect consumer choices about vehicles, and PHEVs may have desirable attributes
other than fuel savings (Heffner et al., 2007), but promised fuel savings may be important in
achieving large numbers of sales.
An interesting point to consider in the Kenyan market is the power outages. Sources of electricity
in Kenya are hydro, thermal oil, geothermal and co-generation, with hydro being the highest
contributor of electricity. KNBS data shows that all consumer categories recorded an increased
demand in electricity with domestic, commercial and industrial, and rural electrification
increasing by 10.8%, 7.6% and 3.5% respectively. Standby generation involves use of generators
during times of high demand on utilities to avoid extra "peak-demand" charges or during periods
of power shortage and outages in order to ensure continuous supply of power. From KIPPRA
energy study, standby generation is estimated at about 22 percent in the manufacturing sector
and 31 percent in the furniture related enterprises respectively. Other sectors such agro industry,
construction related industries, machinery, metals and chemical plants have high standby
generation levels. (KIPPRA, 2010)
Keeping this in mind, the ability of PHEVs to provide power to the grid would come in handy as
a marketing factor to increase demand. In the more integrated system, the "Vehicle to grid" –
V2G, the PHEV is capable to send power to the electric grid generally when it is parked. V2G
concept was proposed by Amori Lovins in 1995 and afterwards several developments have been
done especially by Willet Kempton. At present, an automobile capable of vehicle to grid (V2G)
interaction is sometimes referred as 'mobile energy' or 'smart charging' (Williams and Kurani,
2006, 2007).
With the V2G technology, the unused electric car could supply electricity to the grid when
required. It makes sense if most vehicles would remain parked at any point of time. (Nemry et al,
2009)
V2G technology is also envisioned as a solution to the intermittency of renewable energy sources
of which role is expected to grow in the future. V2G would indeed provide both backup and
storage that are the typical ways to cope with intermittency. It is suggested that the V2G
technology could simultaneously accelerate the penetration of PHEVs and allow a reliable high
penetration of renewable electricity (Kempton and Tomic, 2005).

(9)
However, three elements are required for V2G (Tomic and Kempton, 2007), the first being a
power connection for electrical energy flow from the vehicle to the grid. The second is a control
or communication device to enable the grid operator to determine available capacity, requested
power from the vehicle, and meter the result. The final element required is precision certified
metering on board the vehicle to track energy flows to measure exactly how much power a
vehicle provided and at which times.
Also, potential challenges, relating to standards need to be resolved (smartgridnews, 2008); these
include the communications standards and networks, the connection standards (Where does the
intelligence reside: in the vehicle, at the utility, or at a third-party aggregator and how do they
talk to each other?) and the integration of control methods.
Recently, the Michigan Public Service Commission (MPSC, 2008) established that the higher
PHEV penetration depends on smart grid infrastructure research and developments. Thus, the US
Department of Energy’s (DOE) Office of Electricity Delivery and Energy Reliability has
identified seven principal characteristics of a smart electric grid to allow PHEV penetration:
i. Self-Healing - a grid able to rapidly detect, analyze, respond, and restore from
perturbations.
ii. Empower and Incorporate the Consumer - a grid able to incorporate consumer equipment
and behavior.
iii. Tolerant of a Security Attack - a grid that mitigates and stands resilient to physical and
cyber security attack.
iv. Provides Power Quality Needed by 21st Century Users - a grid that provides a quality of
power consistent with consumer and industry needs.
v. Accommodates a Wide Variety of Generation Options - a grid that allows and takes
advantage of a wide variety of local and regional generation technologies (including
green power).
vi. Fully Enables Electricity Markets - a grid that fully enables maturing electricity markets.
vii. Optimizes Asset Utilization - a grid that employs IT and monitoring technologies to
continually optimize its capital assets while minimizing operations and maintenance costs
(O&M).

(10)
One of the possibilities to increase market viability for the small and medium size vehicle
distributors in Kenya would be the formation of cooperatives. In general, cooperatives are
formed because they allow members to do things they cannot do when acting independently.
Members can work together to negotiate favorable terms of trade, combine capital resources to
finance value-added enterprises, secure guaranteed markets for their commodities, and share the
risks involved in growing and managing a business (Cropp 2001; Barton 1989; Schrader 1989).
Currently there is no cooperative which deals directly with vehicle distributers in Kenya. The
numerous benefits of cooperatives have been highlighted by Schrader (1989); although with
benefits come risks, the cooperative businesses clearly reduce risks to individuals by pooling
resources and stabilizing returns. For example, profits from combined production, processing and
marketing functions are likely to be more stable than any one component alone, especially in
cyclical commodity systems.
The Automotive industry in Kenya is primarily involved in the retail and distribution of motor
vehicles. There are a number of motor vehicle dealers operating in the country, with the most
established being Toyota (East Africa), Cooper Motor Corporation, General Motors, Simba Colt
and DT Dobie. There are also three vehicle assembly plants in the country, which concentrate on
the assembly of pick-ups and heavy commercial vehicles (PWC, 2013).
The Kenya Motor Industry Association (KMI), the representative body of the corporate
participants in the motor industry, has been lobbying hard to reverse this trend. Some of these
measures have helped the industry recover from its lowest point in 2000, when only 5,869 units
were sold. On their part, the companies themselves have become more innovative in responding
to customer needs. Some of the measures that KMI has been advocating include:
i. Implementation of strict criteria on importation of second hand vehicles
ii. Incentives to promote local assembling of commercial vehicles
iii. Export incentives aimed at encouraging car manufacturers to expand operations in the
region.
Data from the KMI show that while the total new vehicle market grew 10% year-on-year (y-o-y)
in 2011, the Japanese earthquake and tsunami had the biggest impact on the country's larger
dealers. As a result, those that the association groups as smaller dealers saw their market share

(11)
increase from 6.5% in 2010 to 10%, while their sales rose 69% compared with 6.1% growth for
the combined larger dealers. General Motors East Africa (GMEA) offset some of the negative
impact of restricted supplies for its Isuzu truck brand, however, through its domestic production,
which underlines the advantages to be gained in an increasingly competitive vehicle segment.
According to data from the KMI, growth in the agriculture, manufacturing and trade sectors is
driving demand for pick-up trucks, which accounted for 35% of total vehicle sales in the nine-
month period.
Sales of heavy commercial vehicles still account for 26.8% of the market, behind pick-ups. We
also believe that construction projects in the region will fuel sales in the heavier segments over
our forecast period. Further growth in Kenya's construction sector is forecast over the next two
years by BMI's Infrastructure team, supporting the favourable conditions for the commercial
vehicle segment. BMI expects growth in construction industry value to remain at roughly the
same level as 2010 in 2011 and 2012, with industry value reaching KES159bn (US$2.1bn) by
2012. There could also be good news on the pricing front if the Central Bank of Kenya's
monetary tightening measures result in the shilling's appreciation.
BMI has previously commented on the effects of a weakening Kenyan shilling on the country's
used car segment and new data show the extent of the problem, with figures not expected to
improve in the short term. Data from the Kenya National Bureau of Statistics show that used car
sales for the eight months to August 2011 were down 20% year-on-year (y-o-y) to 33,073 units,
from 39,790 in the same period of 2010 previous year.
Dealers have reported a 30% increase since the start of 2011 in the charges associated with
importing used cars, including the exchange rate against the yen and US dollar and higher freight
costs. The shilling reached a record low of below KES100.0/US$ on September 26 2011, and the
Central Bank of Kenya expects sustained currency volatility over the next six months. Inflation
has exacerbated the situation and, according to Kwame Owino, chief executive of the Institute of
Economic Affairs, this has particularly hit the middle class, which is the biggest customer base
for used cars.
Domestic production is one solution to such issues and Kenya is attracting investment,
particularly from Chinese companies. Commercial vehicle manufacturer Beiqi Foton Motor

(12)
launched its first domestically produced trucks in June 2011, after establishing a local subsidiary
in the country in late 2010. The Foton Slip Double Cab pick-up truck was assembled at the
Kenya Vehicle Manufacturers facility, where it will be assembled until Foton's own plant comes
onstream. As part of a growing focus on Africa by Chinese auto companies, the company is
building its own vehicle assembly plant, which is scheduled to begin operations in May 2012.
Chery Automobile will be the next Chinese carmaker to invest in Kenya. According to Justus
Nguu, director of Chery's local franchise holder Stantech Motors, Chery is now in negotiations
with the Chinese government to secure financing of US$50mn for the Kenyan plant, which the
carmaker plans to open in 2013.
(reference: http://www.marketresearch.com/Business-Monitor-International-v304/Kenya-Autos-
Q2-6844269/)
2.2.2 Technological Viability
Plug-in hybrid electric vehicles (PHEVs) have been proposed as a next step in the evolution of
transportation technologies towards increased energy efficiency and less pollution (Romm and
Frank, 2006 & Suppes, 2006).
A key reason for exploring PHEV technology is its ability to achieve significant petroleum
consumption reduction benefits. A PHEV has essentially two operating modes: a charge
sustaining mode and a charge-depleting mode. The total consumption benefits of a PHEV are a
combination of the charge-depleting and charge sustaining mode improvements. (Markel and
Simpson, 2005)
New PHEVs will likely have a life of more than 15 years and the vehicle miles travelled (VMT)
continues to grow. (Davis and Diegel, 2004)
The ability of PHEVs to drive independently (or not) from electrical and/or chemical energy
make their fuel efficiency assessment a complex task. As underlined by (Silva et al., 2009)
PHEVs are differentiated according to their All-electric range (AER) i.e. the distance driven
electrically up to the point at which the ICE engine first turns on. It can be also defined as the
distance travelled before the vehicle switches from charge-depleting to charge-sustaining
(13)
operation (Gonder and Simpson, 2007). This is measured for a reference driving cycle, usually
on urban driving cycle.
The notation "PHEVx" is commonly used to specify the PHEVs AER. For instance a PHEV30
corresponds to a PHEV with a 30 miles electric range. Typical PHEVs AER are in the range 20-
60 miles. The PHEVx notation is more indicative for the case where, in practice, a PHEV would
operate on all-electric CD mode over the first x kilometres, and after in CS mode3. But this
definition is less appropriate if a PHEV operating in CD blended mode for which both electricity
and gasoline are used to power the vehicle. In this case, it would be more convenient to define
the suffix x as the equivalent distance of petroleum-based fuel displaced by electricity from the
battery (Gonder and Simpson, 2007).
Typically, the shortest the daily trips, the higher the utility factor will be since most of the
distance will be driven on electric mode (depending of course on the AER capability of the
PHEV). The typical utility factor in U.S. is estimated to be around 50% for a PHEV with a 50
km AER (see e.g. (MIT, 2008)). (EPRI/NRDC, 2007) assumes the utility factors to be 12%, 49%
and 66% respectively for PHEV10, PHEV20 and PHEV40 (in miles). An example of UF curve
is given in Figure 11 for the U.S. (Elgowainy et al., 2009).
A typical PHEV can reduce gasoline consumption by about 30–45% over that of a comparable
conventional vehicle (Markel, 2007)
PHEVs will likely use more advanced batteries such as lithium-ion batteries, and these more
advanced batteries need not use the lead-acid batteries’ charging method and may not need to
charge for as long (Linden and Reddy 2002).
The energy storage capacity (kWh) is of high importance since it will directly determine the
distance the vehicle can drive on the CD mode, as well as the mass of the battery pack. For
PHEVs, the energy storage requirement considered in the literature typically varies from ~6 kWh
to 30 kWh depending on the CD range (compared to 1-2 kWh for conventional hybrids and 30-
50 kWh for BEVs). The energy storage capacity represents the 'available' or 'total' energy
capacity depending on whether the SOC window is taken into account or not (e.g. a 10 kWh of
total energy capacity operating with a 65% charge swing would have only 6.5 kWh of available

(14)
energy). Generally, the battery usable energy increases linearly with the CD range (Rousseau et
al., 2007).
The peak battery power (W) required primarily depends on the CD range, the CD energy
management mode and on the total vehicle weight. For instance, a PHEVx operating in CD
blended mode would require less power than the one operating in CD all-electric mode. The peak
power is generally assumed to remain constant as the AER increases (Rousseau et al., 2007).
Nickel Metal Hydride (NiMH) batteries are the current typical batteries used by car
manufacturers in mass-produced HEVs (e.g. Toyota). However NiMH batteries are considered to
have reached their maximum potential. For the future, experts do not expect significant new
technical improvements and cost reductions (Anderman, 2008; Kalhammer et al., 2007; Kromer
and Heywood, 2007).
One method to ensure efficiency of fuel and electric energy consumption when using PHEVs is
that when the engine is on, it is used only to provide supplemental power beyond the capabilities
of the energy storage system; substantial fuel displacement can still be achieved via a strategy
where energy storage and engine operate in a blended manner. (Markel and Simpson, 2005)
A full energy performance assessment of PHEV implies to quantify both the fuel and the
electricity consumptions over the considered distance driven. Compared to BEVs (that
exclusively use electricity) and to HEVs (for which fuel is the sole source of energy), the final
energy consumption equation for PHEV is more complex. As illustrated in figure 1.1 below, it
will depend on the distance travelled on all-electric range, which will be influenced by both the
charging pattern and the driving behavior. (Nemry et al, 2009)

(15)
Figure 1.1: A full energy performance assessment of PHEV
2.2.3 Economic Viability
To analyze clearly the extent of economic viability for the introduction of PHEVs, one of the
areas we need to understand is the consumers perspective, which is; how much does it really cost
to own a car? Studies conducted prove that initial payment to buy a vehicle only amounts for
around 25% of all the expenses involved with owning a vehicle. The rest of the expenses come
from fuel, maintenance, parking fees and the like. (Sperling, 1995)
The basic cost projections for the implementation of this solution in the Kenyan market are those
suggested by Electric Power Research Institute. (Duval, 2004)
Manufacturer costs result from engine and transmission, motor/inverter, controller, battery and
charger as well as certain vehicle upgrades. In total, the additional manufacturer costs are
reported in a range $4000-10000 compared to conventional gasoline vehicles, and roughly 10-
30% higher than for conventional HEVs ($2000- 4000 for a sedan; greater than $5000 for a
SUV). Cost of batteries accounts for the higher contribution (~50%) and obviously increases
with the battery storage capacity as determined by the AER (Pesaran and Markel, 2007).

(16)
Maintenance costs mainly depend on the battery replacement frequency: around 80000km for
lead acid batteries and around 240000 km (150000 miles) for Ni-MH and Liion batteries.
(Nemry et al, 2009)
Current battery prices for PHEV applications are difficult to determine reliably, but they are
expected to be over $600 per kWh for a 5.1 kWh battery even after substantial mass production
(Kalhammer et al 2007)
The break-even battery costs for full-size SUV PHEVs with efficiencies as in EPRI (2002) are
generally about 1.5 times the values for compact car PHEVs, suggesting that SUV PHEVs may
become economical first.
Since buying the more expensive PHEV is a partially irreversible investment in efficiency
technology and since fuel prices over the lifetime of a vehicle are uncertain, an option value
premium would further lower the acceptable cost difference between a PHEV and other types of
vehicles, also suggesting a need for still cheaper batteries (Dixit and Pindyck 1994).
Note that the electricity consumption (in Wh/km) increases linearly with the vehicle mass,
around 6-7 Wh/km for every 100 kg in vehicle mass added (Rousseau et al., 2007).
A compact car PHEV with an all-electric range of 20 miles has gasoline-fueled efficiency of 52.7
miles/gallon and all-electric efficiency of 4.010 miles/kWh, compact car HEV efficiency is 49.4
miles/gallon, and compact car conventional vehicle (CV) efficiency is 37.7 miles/gallon. The all-
electric efficiency includes losses from charging (EPRI 2001).
Compact car PHEVs charge at a rate of 1 kWh/h and require 4.1 kWh to recharge their batteries,
and with Kenya Power and Lighting Co. LTD providing 1kWh for an average of 8 Kenya
Shillings, this comes up to about 25 kshs per charge. This in-turn will give the user an average of
4.01 miles per kWh or about 6.5 kilometers per kWh; giving a grand total of approximately 27
kilometers of travel. (EPRI, 2002)
The Electricity tariff in Kenya in 2008 was US Cents 9.4 per kWh. This was higher than that of
South Africa (US Cents 6.6 per KWh) and Egypt (US Cents 3 per KWh) who are her major
competitor in trade and services in East and South Africa India which has one of the highest
(17)
populations in the world and is currently experiencing growth rate of about 10% has very low
and competitive tariffs (5.38US cents per kWh) and this is good for the households and industry.
The UK and Singapore have some of the highest tariffs in the World at 21.9 and 18.4 US cents
per kWh respectively compared to the USA and South Korea. Although power tariffs in South
Africa
are lower than that of Kenya, there is a general trend for them increasing while those in Kenya
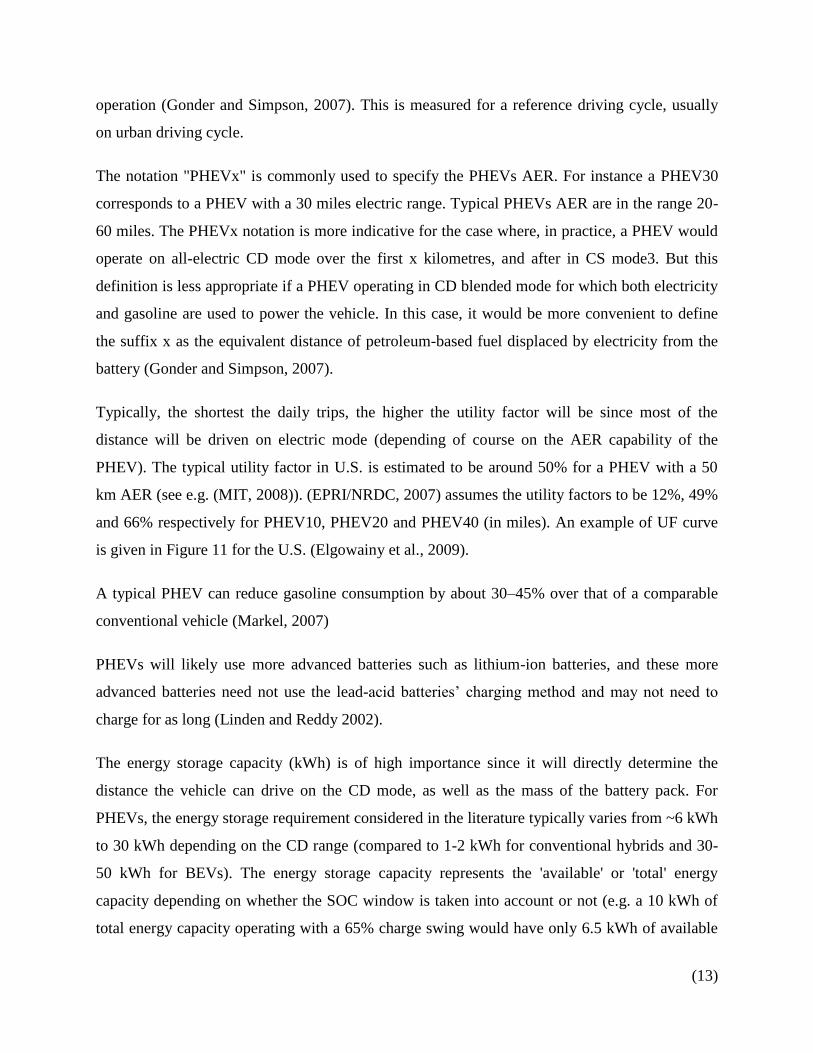
between 2005-2008 have remained fairly stable. Table 4.1 shows the electricity tariffs in Kenya,
according to the National Energy Survey 2009, the electricity tariffs Kshs/kWh are lowest for
households (Kshs. 11.38/kWh) but highest in transport and communications (Kshs. 13.21/kWh)
firms and manufacturing sector (Kshs. 13.01/kWh). These two sub sectors comprise the large
commercial/industrial from the KPLC consumer category. (KIPPRA, 2010)
Table 1.1: Electricity Tariffs in Kenya
Source: National Energy Survey, 2009
As compared to purely petroleum and gasoline fuelled vehicles, PHEVs allow the user to travel
more than a kilometer per shilling, according to the calculations above. Whereas gasoline
The overall picture needs also to be looked at, considering all costs components, including
maintenance and fuel costs. Such a comparison was made by (Karplus et al., 2009), considering
a PHEV30, and using the long-term cost estimates and energy performance from (Simpson,
2006). He derived a 8 year payback period.
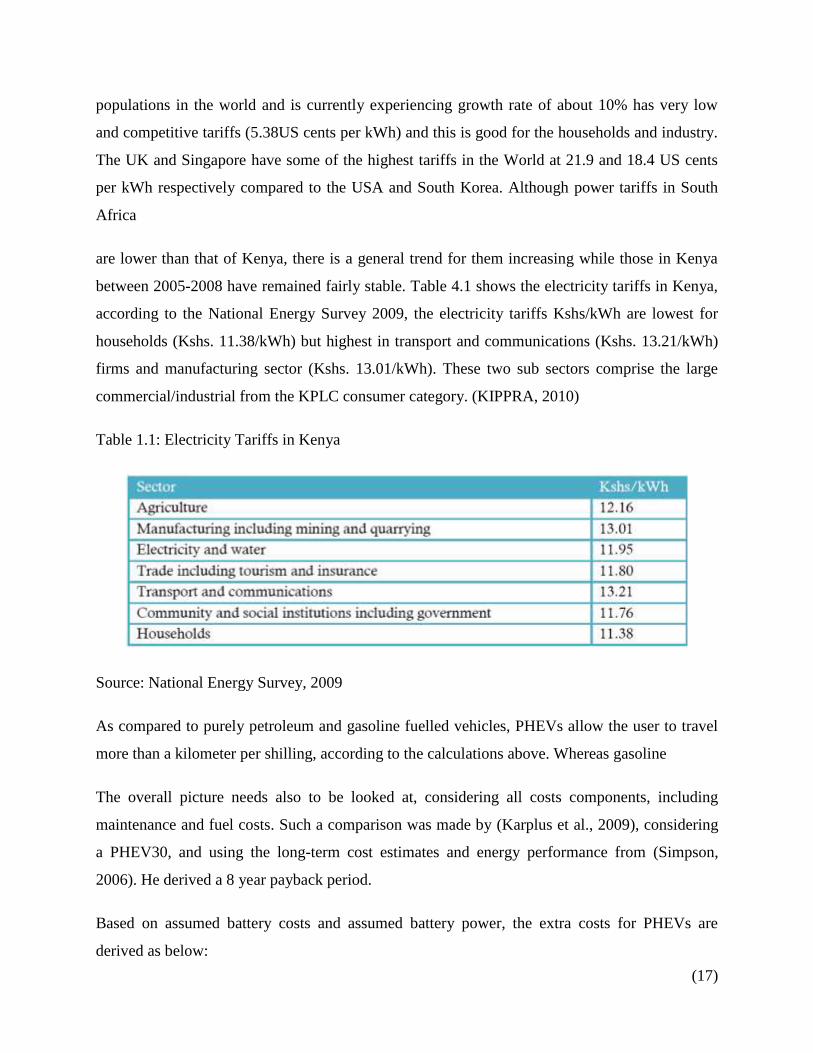
Based on assumed battery costs and assumed battery power, the extra costs for PHEVs are
derived as below:
(18)
Table 2.1: Basic PHEV Costing
By the rate at which the industry is growing as indicated earlier; with growth rates of up to 27%
per annum, we find that this industry is very profitable and there is little barrier to entry for new
players.
2.2.4 Effective Business Strategy
Based on certain key strengths such as the reduction in CO2 emissions, impact on the
consumption of petroleum, fast moving innovation improving the various technologies used in
the design and manufacturing of PHEVs, all add up when trying to create an effective business
strategy.
CO2 released during fossil fuel combustion and deforestation is the single largest contributor to
radioactive forcing of climate change (IPCC, 2007)
High concentrations of ground level ozone remain one of the most pervasive urban air quality
problems worldwide, and vehicles are among the most significant sources of emissions leading
to ozone formation (Cooper and Arbrandt 2004, Sawyer et al 2000).
Motorized transport is by far the most dominant transportation in Kenya and is a major source of
pollution and GHG emission, especially in the urban areas. (UNFCCC, 2002)
If the predictions about sustainable development are accurate, neglecting the environment and
social issues may be a barrier to long-term survival at both the micro or macro level.
Consequently, those companies that can effectively manage their environment and the social will
also help make themselves economically sustainable. (Doane and MacGillivray, 2001)

(19)
Plug-in hybrid electric vehicles (PHEVs) have attracted attention as promising approaches for
reducing emissions from on-road mobile sources. Vehicles that commute less that 50 km day−1
represent about 60% of all commuting vehicles in the United States (US Department of
Transportation, 2001), suggesting that many short trips could be accomplished purely on
electrical power. PHEVs reduce on-road emissions
by using electricity from the power grid as their source of energy; however, the use of PHEVs
has the potential to increase emissions from stationary electricity generation units, depending on
the nature of the electricity generating units used to charge the PHEV batteries.
The Electric Power Research Institute (EPRI) and the Natural Resources Defense Council
(NRDC) performed an environmental assessment of PHEVs for the year 2030 (EPRI; Knipping
and Duvall 2007). The study investigated the air quality impacts of PHEVs if 40% of US on-road
vehicles were converted to battery power. The study used the Community Multiscale Air Quality
(CMAQ) model to examine ozone mixing ratio, particulate matter concentrations, deposition of
sulfate, total nitrogen and mercury concentrations. One of the important assumptions made in
this study was that the new electricity generation capacity was met by increasing the load of
current coal-fired generation units. The study did not account for additional emissions
regulations or constraints in the future. The study showed that PHEVs would reduce exposure to
ozone and PM, and reduce deposition rates for acids and mercury in most regions. However,
some regions showed increases in ozone and PM exposure.
The incremental vehicle costs together with the availability and incurred costs from possible
battery charging parameters will largely determine the large scale deployment of BEVs and
PHEVs and, also, its effects on e.g. the electricity grid and sector. This will also determine the
real environmental benefit stemming from the fuel displacement to electricity. Infrastructure
geographical availability can for instance influence the required on-board energy storage energy
capacity and vehicle performances. (Nemry et al, 2009)
PHEVs have been designed using conductive or inductive chargers. While inductive chargers
have the advantage of intrinsic safety and pre-existing infrastructure, the conductive ones have
efficiency advantages (87% charger efficiency (Pratt, 2007)), are generally lighter weight and
more compact and can allow for bidirectional power flow (Bradley and Frank, 2009).

(20)
Three possible methods can be implemented to recharge the battery. In a charge infrastructure
review, describes three charge "levels" defined by the US Electric Power Research Institute
(EPRI):
The level 1 method uses the US standard 120 VAC, 15A or 20A branch circuit, used in the
residential and commercial buildings. This delivers a 1.44 kW maximum power. This method
would for the user, to install a new dedicated circuit to avoid overload. This is the most
immediate solution.
The level 2 method is based on a 240VAC, single phase, branch circuit with up to 40A, requiring
a dedicated circuit. Under 15A, the maximum charge power would be 3.3 kW. This method
could be implemented for both residential and public charging.
The level 3 is the method suitable for fast charging through public facilities, based on 480 VAC,
three-phase circuit, and enabling 60-150 kW charging power. This option implies a number of
specific safety precautions. (Morrow et al., 2008)
The immediate expectation is that PHEVs would be charged overnight on a standard 220V
outlet, in garages for instance. This would, in most cases, result in the optimal aggregated battery
charging profile as it would be associated with low demand (off peak period). (Nemry et al.,
2009)
However, the assumptions that recharging would occur after each trip and overnight are
contradicted by surveys made on a sample of early PHEV in the U.S. which instead suggested
that only 19% resulted in a charge event and the vehicles were predominantly charged during
daytimes hours. (Morrow et al., 2008)
The availability of public charging would thus make PHEV driving more flexible but would also
result in a reduced required onboard energy storage capacity, with also consequences on the
energy performance and costs of the vehicle. (Nemry et al, 2009)

(21)
2.3 Critical Literature Review
When critically examining the literature available on PHEVs, it is necessary to take into
consideration all the diverse opinions at Brown and Keeley (1997) state; “…any reasoning
provides raw material for critical-thinking practice.”
Certain gaps can been found within the research on PHEVs done earlier and the literature
available to us. These gaps include details on how viable PHEVs would be introduced in a
developing country, and what strategy should be adopted when implementing them in such an
environment.
Being able to recognize flaws in an argument is a useful skill. It helps you to identify weak
points in other people’s arguments and to pinpoint areas for you to investigate more closely so
you can make more informed decisions. (Cottrell, S., 2005)
Although the literature available on PHEVs; as categorized by the specific objectives of the
study, provide a variety of subject matter, certain aspects relating to the viability of introducing
PHEVs into a developing economy have not been broached in the detail and depth that would be
ideal.
We have certain literature on the infrastructural requirements; such as information on what is
needed to introduce reliable charging units at every house, but details of what these requirements
mean for developing countries and what steps they would need to follow in-order to meet them is
not clarified.
2.4 Conceptual Framework
Market Viability
Technical Viability
Economic Viability
PHEVs in the Kenyan
Market Business Strategy

(22)
Figure 2.1 Conceptual Framework of the study
As the conceptual framework suggests, the desired output of the study is a clear and concise
business strategy for vehicle distributers to introduce PHEVs in the Kenyan market. In-order to
ensure that the business strategy will be successful it is necessary to understand the various
factors which will influence its success.
These factors can be consolidated as the viability of PHEVs in terms of market acceptability,
current technology, and economic environment in the target country. Thus the input of the study
will be based on these three specific areas.
2.5 Chapter Summary
With this literature review

(23)
CHAPTER THREE
METHODOLOGY
3.1 Introduction
The detailed method of how the study will be conducted is outlined in this chapter; focusing on
the target population of vehicle distributors in Kenya and how information will be gathered from
them to highlight key objectives of the research. The method of analysis will then be discussed to
ensure that results derived are appropriate to the required outcomes to determine the answers to
the research questions.
3.2 Research Design
Using the concept of epistemology, the research for this study will be carried out with a
descriptive survey design to ensure that data related to the viability of PHEVs in Kenya is
gathered adequately. Although some people dismiss descriptive research as `mere description',
good description is fundamental to the research enterprise and it has added immeasurably to our
knowledge of the shape and nature of our society. (De Vaus, 2001)
The research philosophy used will blend between phenomenological and positivist paradigms so
as to ensure that both facts and their meanings are focused upon. (Easterby-Smith, et al., 1991)
The survey will be conducted with the various car distributors in Kenya with a census of all
distributors of international brands that have either developed PHEV models or have not yet
ventured into that technology.
3.3 Target Population
Kenya Car Bazaar (2012) indicates a total of 153 registered used car distributors and 90 new car
distributors in Kenya. Using this figure and the sample size table as appears in Saunders, et al.,
(2009), the ideal sample size would be a census sample. Using the sample size calculator on the
Creative Research Systems Website (Appendix 1) with a confidence level of 95% and a
confidence interval of 4 yields a sample size of 125.

(24)
Given that a majority of SMEs are owner-managed (Synovate, 2009) and would not be very
approachable, this would prove to be a very difficult exercise, given the time and financial
constraints in a study of this level.
3.4 Data Collection
Primary data collection will include both questionnaires and interviews. Secondary data will be
gathered from results of previously implemented PHEVs in other countries. The questionnaire to
be used can be found in Appendix 4 and the interview schedule in Appendix 5.
A simple and dynamic flow of questions have been adopted for the questionnaire; including a
mix of open ended and multiple choice questions. This allows users not to find it monotonous,
and gives flexibility in some areas where it is required.
The interview schedule is meant to act as a guideline during the interview so that no critical areas
are overlooked. Certain questions may be skipped if the situation calls for that, and others may
be added that are not part of the schedule. A basic introduction is placed in the beginning to
bring the interviewee up to speed with what this is all about; the body then includes all four
sections in-line with the objectives of the study, followed by the conclusion where the
interviewee is thanked. Transitions are clearly marked between topics, and certain areas are left
blank where the interviewer will have to fill in according to the situation.
During the data collection process, it will be ensured that all data will be ethically acquired by
making sure participants are not be coerced into providing information, and by making sure that
secondary data sources are not be obtained without required permissions. For the study to be
replicable, you need to monitor and report your analytical procedures and processes as
completely and truthfully as possible (Patton, 2002).
3.5 Data Analysis
Content analysis will be used for qualitative data analysis. Performed using both inductive and
deductive analysis processes, so that content which has either been studied previously or has not,
is analysed and patterns are identified and compared. (Elo and Kyngas, 2008). As Schamber
(2000) pointed out, content analysis functions both as a secondary observational tool for
identifying variables in text and an analytical tool for categorization.

(25)
Critical analysis of quantitative data will then follow to provide clear results and
recommendations. These results will be tabulated and presented graphically in the form of Pie
Charts and Bar Graphs, as recommended by Saunders, et al., (2009).
The Analysis of Variance test (ANOVA), will then be used on the responses to determine
interaction of variables. Tharenou, et al., (2007) explains ANOVA as an instrument to compare
the means of multiple independent groups. Blaxter, et al., (2006) also concurs with this
explanation describing ANOVA as a measure of determining how independent variables interact
with each other and impact the dependent variable.
3.6 Chapter Summary

(26)
CHAPTER FOUR
RESEARCH RESULTS & ANALYSIS
4.1 Introduction
This chapter discusses the feedback from the data collection process and then shows how the
analysis was done in detail. It is necessary to show the various steps involved in the data analysis
stage so as to grant credibility to the findings and allow easy tracking of where the source of the
conclusions lie.
Both content analysis for the qualitative data and ANOVA for the quantitative data will be
described and findings will then been listed so that each finding will be deduced from the
analysis and explained.
4.2 Feedback of the study
The study comprised of both interviews and questionnaires. The interviews were conducted with
5 vehicle distributors from various segments of the market, these 5 were asked questions as
shown in the interview schedule (Appendix 5) and results were tabulated using the unit of
analysis and a coding scheme.
An introduction letter (Appendix 6) was sent to all the 153 used vehicle distributors and 90 new
vehicle distributors that were present in the sampling frame (Appendix 2) requesting for their
participation in this study. All the 243 companies were then telephoned with a follow up of the
same request.
Bearing in mind the constraints mentioned is the previous chapters, a cut-off date of 30th June
and a minimum response of 100 usable questionnaires was set as a compromising balance
between resources and credibility of the sample. A total of 125 usable responses were received
by 30th June 2013, and these were used as a representative sample of vehicle distributors in
Kenya.

(27)
4.3 Analysis of Results
4.3.1 Adopted Technique
In-order to analyze the results of the study, we need to employ various methods which should
give us a clear understanding of what the results mean and how they affect the viability of
PHEVs in the Kenyan Market.
We had both qualitative and quantitative data collection methods which require separate analysis
techniques to gather accurate conclusions from the results, thus the techniques adopted include
both content analysis and analysis of variance.
4.3.2 Content Analysis
As one of today’s most extensively employed analytical tools, content analysis has been used
fruitfully in a wide variety of research applications in information and library science (ILS)
(Allen & Reser, 1990).
After gathering the various answers to the critical interview questions from the 5 interviews
conducted, the unit of analysis was defined. The unit of analysis refers to the basic unit of text to
be classified during content analysis. Messages have to be unitized before they can be coded, and
differences in the unit definition can affect coding decisions as well as the comparability of
outcomes with other similar studies (De Wever et al., 2006). In this case the unit of analysis was
described as “a word or group of words that could be coded under one objective to determine
viability of PHEVs in Kenya.”
A category and coding scheme was then developed, using a preliminary model which was
modified during the course of analysis to suit the content gathered, as Miles and Huberman,
(1994) state, you can generate an initial list of coding categories from the model or theory, and
you may modify the model or theory within the course of the analysis as new categories emerge
inductively.
The coding scheme was then applied to a sample of the answers in the interviews, and whenever
the percentage of agreement did not reach an acceptable level, the coding scheme was revised.
When consistency was achieved, the modified coding scheme was adopted for all the content.
The coding scheme which was derived with the results are below:

(28)
Table 3.1: Content Analysis Coding Scheme and Results
Theme Subcategories Subcategory recurrence
Comments
Market Viability
High turnover experienced in the company
4 out of 5
This shows that the market is active
Fast movement of vehicles
5 out of 5
The rate at which vehicles are imported and sold is high
Small vehicles move faster 3 out of 5 2 of the interviewees stated that larger vehicles moved faster
Market readily accepts change 4 out of 5 Many changes have been adopted in the market before
Technological Viability
Current technology has problems
3 out of 5 Pollution and fuel prices were the major concerns
Market not aware of PHEV technology
4 out of 5 Benefits of owning PHEVs would need to be highlighted
PHEVs technology not yet fully developed
5 out of 5 News of the development of new features is a frequent occurrence
Technological infrastructure not ready
3 out of 5 The requirement for reliable electricity and better infrastructure
Economic Viability
Economy is growing rapidly 3 out of 5 The new political regime was mentioned to bring growth
Opportunity available to introduce new products
5 out of 5 Daily introduction of various new products in other industries
Steady growth experienced in the market
5 out of 5 All interviewees agreed that they have seen growth
Political factors will effect PHEV introduction
5 out of 5 Previous experience when dealing with nationwide projects
Business Strategy
Huge marketing requirement to bring awareness
3 out of 5 New product introduction will require collaborative effort
Partnerships with both private and public sector
4 out of 5 Partnerships for charging stations and political motivation
Technological infrastructure enhancement
5 out of 5 Infrastructure would be a key hindrance to PHEV introduction
Slow introduction of PHEVs 5 out of 5 Parallel product selling of PHEVs and fuel driven vehicles
Certain conclusions can be drawn from the content analysis carried out above, these will be
discussed in detail in the findings of the study (Chapter 4.4). A graphical presentation of the
above table can be viewed below:

(29)
4.3.3 Analysis of Variance
In order to analyze the data collected using the quantitative approach, it was found that the
ANOVA technique would allow the derivation of accurate finding which would allow us to
determine certain answers to the research questions posed in the first chapter of the study.
The feedback of the questionnaire was fragmented into relevant areas including two variables
each. This data was then fed into a statistical calculator which allowed the formulation of graphs
which analyzed the variance between these variables. Each of these sets of variables and their
results are shown below:
Table 4.1: Turnover against Size of Vehicle Distribution Agent
Turnover for the past year 1-10 staff 11-50 staff 50-100 staff above 100 staff Total below $100,000 10 2 0 0 12 $100,000-$500,000 49 7 2 0 58 $500,000-$1m 25 5 2 0 32 $1m-$5m 4 6 9 1 20 Above $5m 0 1 0 2 3 Total 88 21 13 3 125
0 1 2 3 4 5
High turnover experienced in the company
Small vehicles move faster
Current technology has problems
PHEVs technology not yet fully developed
Economy is growing rapidly
Steady growth experienced in the market
Huge marketing requirement to bring awareness
Technological infrastructure ehancement
Mar
ket
Via
bili
tyTe
chn
olo
gica
l Via
bili
tyEc
on
om
icV
iab
ility
Bu
sin
ess
Stra
tegy
Content Analysis Coding Scheme
Subcategory recurrence

(30)
Figure 4.1.1: Pie charts showing the turnover and size of vehicle distributors
With the above data, using the code plot.design(data1) a general graphical presentation of
turnover and the size of the company is shown below:
Figure 4.1.2: Graph showing the distribution of number of companies for 2 variables
Then one way ANOVA is performed to check if the means of the number of companies vary
with Size of the company. Our null hypothesis is that size of the company has no influence. If the
below $100,000
$100,000-$500,000
$500,000-$1m
$1m-$5m
1-10 staff
11-50 staff
50-100 staff
above 100 staff

(31)
F value is greater than the 95% F Tabulated value then we reject the null hypothesis and say with
95% confidence that there is a difference between in the means and size has an effect on the
number of companies.
Two ways ANOVA is also performed to ensure that the size has an effect on the turnover and
vice versa. A 95% family-wise confidence level graph is then plotted so that we can see exactly
which size of company influenced the data most and which amount of turnover. We use the
following code:
> tk1=TukeyHSD(anova2, "Size.of.company")
>plot(tk1)
> tk2=TukeyHSD(anova2, "Turnover")
>plot(tk2)
Figure 4.1.3: Graph showing the 95% family-wise confidence level for company size

(32)
Figure 4.1.4: Graph showing the 95% family-wise confidence level for turnover
Conclusion: From the results of the Anova tests above it is clear to see that the calculated F
Values are greater than the tabulated F Values at the 95% confidence interval. Thus we conclude
that there is a definite effect of the size of the business on the turnover for that year.
Table 4.2: Willingness against Location of Vehicle Distribution Agent
Willingness to venture into PHEVs Nairobi Mombasa Nakuru Eldoret Kisumu Other Total None 0 0 0 0 0 0 0 little 14 6 1 1 1 0 23 average 22 3 3 1 1 0 30 enthusiastic 40 15 3 2 1 1 62 very enthusiastic 9 1 0 0 0 0 10 Total 85 25 7 4 3 1 125
None
little
average
enthusiastic
Nairobi
Mombasa
Nakuru
Eldoret
Kisumu
Other
(33)
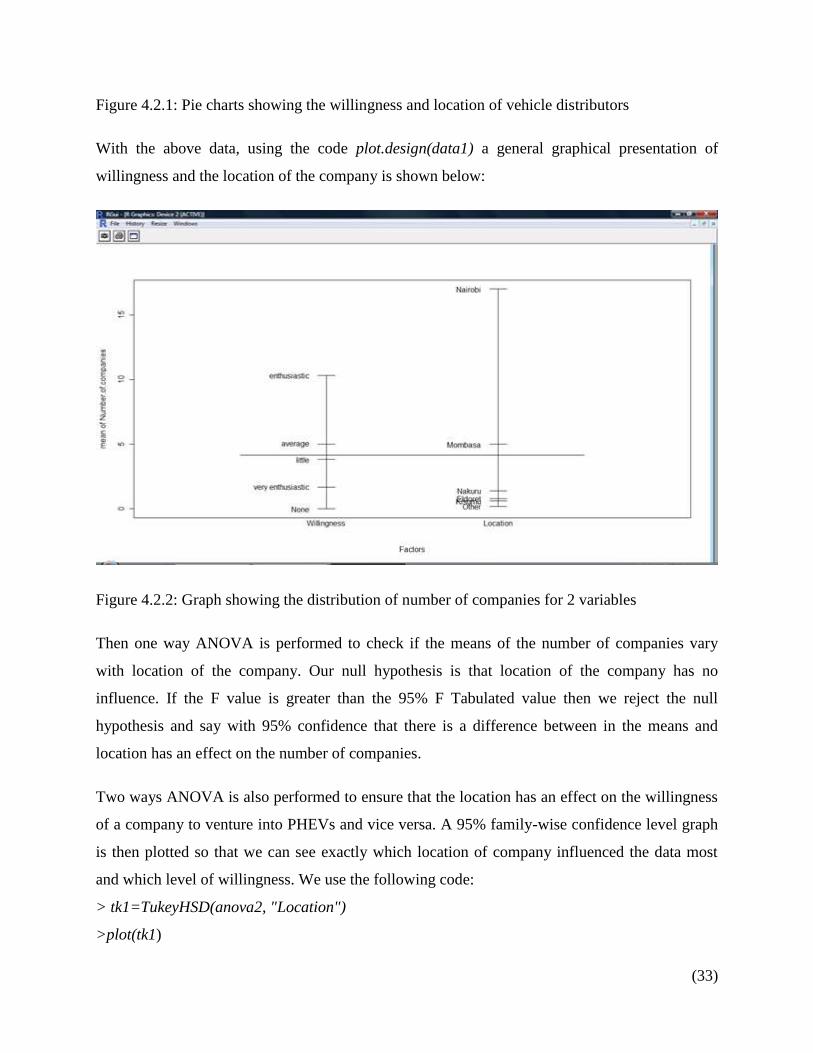
Figure 4.2.1: Pie charts showing the willingness and location of vehicle distributors
With the above data, using the code plot.design(data1) a general graphical presentation of
willingness and the location of the company is shown below:
Figure 4.2.2: Graph showing the distribution of number of companies for 2 variables
Then one way ANOVA is performed to check if the means of the number of companies vary
with location of the company. Our null hypothesis is that location of the company has no
influence. If the F value is greater than the 95% F Tabulated value then we reject the null
hypothesis and say with 95% confidence that there is a difference between in the means and
location has an effect on the number of companies.
Two ways ANOVA is also performed to ensure that the location has an effect on the willingness
of a company to venture into PHEVs and vice versa. A 95% family-wise confidence level graph
is then plotted so that we can see exactly which location of company influenced the data most
and which level of willingness. We use the following code:
> tk1=TukeyHSD(anova2, "Location")
>plot(tk1)

(34)
> tk2=TukeyHSD(anova2, "Willingness")
>plot(tk2)
Figure 4.2.3: Graph showing the 95% family-wise confidence level for company location
Figure 4.2.4: Graph showing the 95% family-wise confidence level for willingness

(35)
Conclusion: From the results of the Anova tests above it is clear to see that the calculated F
Values are greater than the tabulated F Values at the 95% confidence interval. Thus we conclude
that there is a definite effect of the location of the distributor on the level of willingness to
venture into PHEVs.
Table 4.3: Age against Knowledge of PHEVs
Age of company None
word of mouth average
Clear knowledge
Deep knowledge Total
0-1 year 4 14 1 3 0 22 1-2 years 1 12 5 1 0 19 2-4 years 0 13 2 13 0 28 4-6 years 0 24 6 2 0 32 6-8 years 0 9 3 4 0 16 Above 8 years 0 2 5 1 0 8 Total 5 74 22 24 0 125
Figure 4.3.1: Pie charts showing the Age and Knowledge of PHEVs
With the above data, using the code plot.design(data1) a general graphical presentation of age
and the knowledge of PHEVs is shown below:
0-1 year
1-2 years
2-4 years
4-6 years
6-8 years
Above 8 years
None
word of mouth
average
Clearknowledge

(36)
Figure 4.3.2: Graph showing the distribution of number of companies for 2 variables
Then one way ANOVA is performed to check if the means of the number of companies vary
with knowledge of PHEVs. Our null hypothesis is that knowledge of PHEVs has no influence. If
the F value is greater than the 95% F Tabulated value then we reject the null hypothesis and say
with 95% confidence that there is a difference between in the means and knowledge has an effect
on the number of companies.
Two ways ANOVA is also performed to ensure that the knowledge has an effect on the age and
vice versa. A 95% family-wise confidence level graph is then plotted so that we can see exactly
which level of knowledge of PHEVs influenced the data most and which age. We use the
following code:
> tk1=TukeyHSD(anova2, "knowledge.of.PHEVs")
>plot(tk1)
> tk2=TukeyHSD(anova2, "Age")
>plot(tk2)

(37)
Figure 4.3.3: Graph showing the 95% family-wise confidence level for knowledge of PHEVs
Figure 4.3.4: Graph showing the 95% family-wise confidence level for age of company

(38)
Conclusion: From the results of the Anova tests above it is clear to see that the calculated F
Values are greater than the tabulated F Values at the 95% confidence interval. Thus we conclude
that there is a definite effect of the age of the company on the level of knowledge it has about
PHEVs.
Table 4.4: Vehicle Type against Market Acceptability to Change
Type of vehicles which are fast moving very bad bad average good
very good Total
Sports 0 0 0 0 0 0 Luxury 0 0 1 2 3 6 Large 2 2 12 2 4 22 Mid-sized 3 15 5 3 2 28 Small 2 5 29 26 7 69 Total 7 22 47 33 16 125
Figure 4.4.1: Pie charts showing the Type and Acceptability to change
With the above data, using the code plot.design(data1) a general graphical presentation of type
and the market acceptability to change is shown below:
Sports
Luxury
Large
Mid-sized
Small
very bad
bad
average
good
very good

(39)
Figure 4.4.2: Graph showing the distribution of number of companies for 2 variables
Then one way ANOVA is performed to check if the means of the number of companies vary
with Type of vehicle which are fast moving. Our null hypothesis is that type of vehicle has no
influence. If the F value is greater than the 95% F Tabulated value then we reject the null
hypothesis and say with 95% confidence that there is a difference between in the means and type
has an effect on the number of companies.
Two ways ANOVA is also performed to ensure that the type has an effect on the acceptability to
change and vice versa. A 95% family-wise confidence level graph is then plotted so that we can
see exactly which types influenced the data most and which level of acceptability. We use the
following code:
> tk1=TukeyHSD(anova2, "type.of.vehicles")
>plot(tk1)
> tk2=TukeyHSD(anova2, "Market.acceptability.to.change")
>plot(tk2)

(40)
Figure 4.4.3: Graph showing the 95% family-wise confidence level for type of Vehicles
Figure 4.4.4: Graph showing the 95% family-wise confidence level for market acceptability

(41)
Conclusion: From the results of the Anova tests above it is clear to see that the calculated F
Values are greater than the tabulated F Values at the 95% confidence interval. Thus we conclude
that; although market acceptability to change does not really influence the data as much as type
of vehicle does, there is an effect of the type of vehicle on the level of market acceptability to
change.
Table 4.5: Vehicles Imported against Market readiness for PHEVs
Number of vehicles imported in average per month very bad bad average good very good Total less than 5 20 26 28 2 0 76 5-10 5 3 14 11 2 35 10-15 0 0 1 2 0 3 15-20 0 0 4 0 0 4 20-25 0 1 0 4 0 5 above 25 0 0 0 2 0 2 Total 25 30 47 21 2 125
Figure 4.5.1: Pie charts showing the Vehicles imported and Market readiness
With the above data, using the code plot.design(data1) a general graphical presentation of
average number of vehicles imported per month and market readiness for PHEVs is shown
below:
less than 5
5-10
10-15
15-20
20-25
above 25
very bad
bad
average
good
very good

(42)
Figure 4.5.2: Graph showing the distribution of number of companies for 2 variables
Then one way ANOVA is performed to check if the means of the number of companies vary
with market readiness for PHEVs. Our null hypothesis is that market readiness has no influence.
If the F value is greater than the 95% F Tabulated value then we reject the null hypothesis and
say with 95% confidence that there is a difference between in the means and market readiness
has an effect on the number of companies.
Two ways ANOVA is also performed to ensure that the market readiness has an effect on the
number of vehicles imported and vice versa. A 95% family-wise confidence level graph is then
plotted so that we can see exactly which types influenced the data most and which level of
acceptability. We use the following code:
> tk1=TukeyHSD(anova2, "market.readiness")
>plot(tk1)
> tk2=TukeyHSD(anova2, "vehicles.imported")
>plot(tk2)

(43)
Figure 4.5.3: Graph showing the 95% family-wise confidence level for market readiness
Figure 4.5.4: Graph showing the 95% family-wise confidence level for vehicles imported

(44)
Conclusion: From the results of the Anova tests above we can see that the calculated F Values
are greater than the tabulated F Values at the 95% confidence interval. Thus we conclude that the
market readiness effects the number of vehicles imported per month and vice versa. However,
the market readiness only meets the quota slightly, i.e. if we use a greater confidence interval e.g.
99% the market readiness would not influence the number of vehicles imported per month.
4.4 Findings of the Study
From the interview and questionnaire certain facts were found, including various opinions that
seemed to hold more weight due to their consistency in the answers from numerous vehicle
distributors. Of the 20 questions asked in the questionnaire, 14 were restricted to a set of options,
1 was a list and 5 were open ended. A total of 125 valid responses were gathered. And from the
interview schedule, some facts found in the questionnaire were reinforced. Here is a brief
overview of the facts that were gathered.
General observations:
i. Of the 125 responses, Nairobi had the maximum number of responses adding up to 85.
On the other hand the percentage response rate of Nairobi of 60% was still lower as
compared to Mombasa’s 67%. The average response rate was higher than 50% which
was a positive sign.
ii. The most responses were between 4-6 years old companies, which made 32 of the total
125 response. 22 were new companies of between 0-1 years of age. This indicates that
the barriers to entry into the market don’t seem too high and the industry is still young
and growing.
iii. An astounding 88 responses indicated that they had minimum staff, showing that it is not
a labour intensive industry, and that most companies dealing with importing and
distributing vehicles are still small sized.
iv. Most companies who filled out the questionnaire showed a turnover of between
$100,000 and $500,000. This gives us an idea of the profitability of the industry.
v. Although the questionnaire responses indicate that most vehicle distributors import and
sell less than 5 vehicles in a month, the interview results show that all five interviewees
indicated vehicles were fast moving. This gives us a conclusion that each interviewee
had their own opinion of what it meant for vehicles to be fast moving.

(45)
Observations from the content analysis:
i. We find from the content analysis that
4.5 Chapter Summary

(46)
CHAPTER FIVE
CONCLUSIONS AND RECOMMENDATIONS
5.1 Introduction
The final chapter in the study will basically highlight the key areas of the results to the data
analysis and relate them to the objectives; this should give us answers to the research questions.
With these answers, conclusions can be drawn and the conclusions should enable us to make
various recommendations.
One of the specific objectives of the study is that of the formulation of a business strategy and
this requires the results of the data analysis as well as the recommendations drawn from the study
to enable it to be an accurate business strategy. A basic outline of this strategy has been drawn
out in Appendix 1 and will be referred to within this chapter.
5.2 Summary of Key Findings
The results of the data analysis can be filtered out to give us what was required to fulfill the
objectives of the study, in-order to do this we will look at the research questions and provide
answers as per the results and these should form the basis of our key findings of this study.
5.2.1 Research Question 1:
Is the Kenyan market ready for the introduction of PHEVs?
From the findings of the study in Chapter 4, we find that the answer to this research question can
be split into various categories. The Kenyan market seems positive toward change, and this is a
major factor when introducing a new technology that would see an entire change in lifestyle. On
the other hand we find that
5.2.2 Research Question 2
Taking into consideration the extent of technological development of PHEVs currently, is the
Kenyan environment technically ready for PHEVs?
5.2.3 Research Question 3
Will the economic status of Kenya allow consumers to purchase PHEVs?

(47)
5.2.4 Research Question 4
What would the most effective business strategy be; for a vehicle distributor in Kenya, to
successfully introduce PHEVs?
5.3 Conclusion
Various conclusions can be drawn from the study and these can be used to either support or
contradict previous literature discussed in the second chapter of this research document. As we
will see in the four areas below, some results of the data analysis have gone against views
discussed in the literature review.
5.3.1 Specific Objective 1
To assess the market viability of PHEVs in Kenya
5.3.2 Specific Objective 2
To evaluate the technical viability of PHEVs in the Kenyan environment
5.3.3 Specific Objective 3
To determine the economic viability of the introduction of PHEVs in Kenya
5.3.4 Specific Objective 4
To recommend an effective business strategy for the introduction of PHEVs in the Kenyan
market
5.4 Recommendations
5.6 Chapter Summary
A lot of this chapter is dependent on the business strategy (Appendix 1) and other than a brief
summary, the conclusions and recommendations have been explained in more detail in the
various sub-sections of the business strategy.

(48)
REFERENCES
1. The Economic Watch. (2011). Retrieved May 28th 2012 from www.economywatch.com.
http://www.economywatch.com/economic-statistics/country/Kenya/year-2008/
2. GFEI Kenyan Baseline. (2011). Vehicle Fuel Efficiency Baselines: Practicalities and
Results Global Fuel Economy Initiative in Africa. UNEP.
3. UNEP. (2006). Integrated assessment of the Energy Policy - with focus on the transport
and household energy sectors.
4. Price Waterhouse Coopers (PWC), (2013), Taken from source as at August 2013,
http://www.pwc.com/ke/en/industries/automotive.jhtml
5. Sperling, D. (1995). Future Drive: Electric Vehicles And Sustainable Transportation.
Island Press publishers, Washington.
6. Eaton, R. (1993). The Wall Street Journal. 4th October, p. 1ff.
7. UNFCCC. (2002). Kenya’s climate change technology needs assessment report under the
UNFCCC.
8. Hirsch, R., Bezdek, R., and Wendling, R. (2005). Peaking of World Oil Production:
Impacts, Risks, and Mitigation.
9. Davis, S., Diegel, S. (2004). Transportation Energy Databook. (Edition 24).
10. Markel, T., Simpson, A. (2005). Plug-In Hybrid Electric Vehicle Energy Storage System
Design. Conference Paper NREL/CP-540-39614.
11. Duval, M. (2004). Advanced Batteries for Electric Drive Vehicles. EPRI Technical
Report #1009299.
12. De Vaus, D. A. (2001). Research design in social research. London: Sage Publications
Ltd.
13. Easterby-Smith, M., Thorpe, R. & Lowe, A. (1991). Management Research: An
Introduction. SAGE Publications Ltd.
14. Elo S. & Kyngas H. (2008) The qualitative content analysis process. Journal of Advanced
Nursing 62(1), 107–115. doi: 10.1111/j.1365-2648.2007.04569.
15. Saunders, M., Lewis, P., & Thornhill, A. (2009). Research Methods for Business
Students (5th ed.).Harlow: Pearson Education Ltd.
16. Tharenou, P., Donohue, R., & Cooper, B. (2007). Management Research Methods.
Cambridge: Cambridge University Press.

(49)
17. Blaxter, L., Hughes, C., & Tight, M. (2006). How To Research (3rd ed.). Berkshire. Open
University Press.
18. O' Leary, Z. (2004). The Essential Guide to doing Research. London: Sage Publications
Ltd.
19. Brown, N. & Keeley, S., (1997), Asking the Right Questions: A Guide to Critical
Thinking, Pearson: London (ISBN: 0131829939)
20. Cottrell, S., (2005), Critical Thinking Skills, Palgrave: Basingstoke; ISBN: 1-4039-9685-
7
21. Creative Research Systems, (1982), URL http://www.surveysystem.com/sscalc.htm
22. Patton, M.Q. (2002). Qualitative Research and Evaluation Methods.Thousand Oaks, CA:
Sage.
23. Allen, B., & Reser, D. (1990). Content analysis in library and information science
research. Library & Information Science Research, 12 (3), 251-260.
24. Berg, B.L. (2001). Qualitative Research Methods for the Social Sciences. Boston: Allyn
and Bacon.
25. Bradley, J. (1993). Methodological issues and practices in qualitative research. Library
Quarterly, 63(4), 431-449.
26. De Wever, B., Schellens, T., Valcke, M., & Van Keer, H. (2006). Content analysis
schemes to analyze transcripts of online asynchronous discussion groups: A review.
Computer & Education, 46,6-28.
27. Denzin, N.K. (1989). Interpretive Interactionism.Newbury Park, CA: Sage.
28. Foster, A. (2004). A nonlinear model of information-seeking behavior. Journal of the
American Society for Information Science & Technology, 55(3), 228-237.
29. Glaser, B.G., & Strauss, A.L. (1967). The Discovery of Grounded Theory: Strategies for
Qualitative Research. New York: Aldine.
30. Hsieh, H.-F., & Shannon, S.E. (2005). Three approaches to qualitative content analysis.
Qualitative Health Research, 15(9), 1277-1288.
31. Lincoln, Y.S., & Guba, E.G. (1985). Naturalistic Inquiry. Beverly Hills, CA: Sage
Publications.

(50)
32. Mayring, P. (2000). Qualitative content analysis. Forum: Qualitative Social Research,
1(2). Retrieved July 28, 2008, fromhttp://217.160.35.246/fqs-texte/2-00/2-00mayring-
e.pdf.
33. Schamber, L. (2000). Time-line interviews and inductive content analysis: Their
effectivenss for exploring cognitive behaviors. Journal of the American Society for
Information Science, 51(8), 734-744.
34. Miles, M., & Huberman, A.M. (1994). Qualitative Data Analysis. Thousand Oaks, CA:
Sage Publications.
35. Belliveau, Paul, Abbie Griffin and Stephen Somermeyer, Eds. (2002). The PDMA
Toolbook 1 for New Product Development, New York: John Wiley & Sons, Inc.
36. Christensen, C. (1997), The Innovator's Dilemma: When New Technologies Cause Great
Firms to Fail, Boston: Harvard Business School Press.
37. Clark, K. B. and S. C. Wheelwright. 1995. The Product Development Challenge, Boston:
Harvard Business School Press. (Alternative to several HBR articles listed below)
38. Cooper, Robert G., Scott Edgett and Elko Kleinschmidt. 2001. Portfolio Management for
New Products, 2nd ed., Reading, MA: Perseus Books.
39. Cooper, Robert G. 2001. Winning at New Products: Accelerating the Process from Idea
to Launch, 3rd ed. Reading, MA: Perseus Books.
40. Cooper, Robert G., Scott Edgett. 2007. Generating Breakthrough New Product Ideas,
Feeding the Innovation Funnel, Canada: Product Development Institute.
(a)
APPENDIX 1
Business Strategy
1. Introduction
Having found the results of the study and analyzed the various areas of viability, the next stage is
to formulate a strategy of implementation so as to guide vehicle distribution agencies in Kenya;
who are willing to take this path, towards success.
New products are an obvious way to grow sales, but their issuance often is poorly executed (D.
Richards, http://entrepreneurs.about.com/od/businessplan/a/growthstrategy.htm). It is important
to have a clear plan when venturing into something new, so that certain eventualities are
predicted and catered for. In the case of PHEVs we find from the literature review as well as the
research conducted, that if certain key factors are taken into consideration, the introduction of
PHEVs into the Kenyan market would be extremely successful and a lucrative business venture
for the vehicle distribution agencies.
2. Benefits and Costs
As highlighted in the literature review, PHEVs come with their own advantages and
disadvantages, and thus venturing into the business of introducing them into the Kenyan market
will have both benefits and costs, and here we will discuss how a good business strategy will
ensure that the benefits outweigh the costs.
Just to summarize briefly, benefits of PHEVs are three fold, to the government, it would benefit
the country as a whole by reducing pollution and if technology permits, it would improve the
electricity grid reliability and supply using the V2G technology. Secondly it would benefit end
users by reducing fuel costs and providing better technology. Even end-users would benefit from
the V2G technology for their homes. And lastly the PHEVs would benefit the vehicle
distributors by giving them a new product to differentiate them from their competitors and would
allow them diversify into charging stations.

(b)
Disadvantages of the PHEV technology also include a few main areas; the first being the initial
cost of the vehicles is slightly higher than that of fuel driven vehicles; although this is rapidly
changing. Also, the limited choices when it comes to types of vehicles that are PHEV; again
because more and more vehicle manufacturers are producing PHEVs, this should also be
changed.
Then there is the issue of charging stations, training of end-users to use home charging stations,
and a requirement to have charging stations across the country through various partnerships so as
to allow end-users to charge their vehicles when they are far from home as they do with fuel. The
electrical infrastructure for the introduction of charging stations may be another hurdle; but the
implementation of a higher standard of electricity reliability in Kenya would benefit the
population in many ways other than the use of charging stations, and this should encourage the
government to invest in this project.
The maintenance of PHEVs is slightly different from that of fuel driven vehicles due to the
batteries and this will require skills which have not been developed locally. Also the power
output for the PHEVs is known to be less than that of fuel driven cars; although this is being
improved in newer electric vehicles.
3. Product Development
4. Financial Implications
One of the considerations in this proposal is the financial resources required to successfully
rollout PHEVs in Kenya. These resources will include the actual cash outlay for purchase of both
second hand and brand new PHEVs from various overseas suppliers, in addition to the human
resource and physical resources, as elaborated in the product development plan above.
The cash flow required for this project will necessitate that any vehicle distribution agency
should have some form of financial backing. This will be in addition to a cash inflow of Kenya
Shillings 5 million in the form of a bank overdraft to cover the fixed costs and running expenses

(c)
for the first two years from the launch date. It is projected that this overdraft will be repaid by the
end of the fifth year. The cash flows will have substantial positive inflows from the increase of
consumer awareness about PHEVs, and this has been taken into consideration.
The projected cash movement, balance sheet and profit and loss statement should be based on the
following key assumptions.
i. Revenue for the first year is estimated at 8 PHEV sales of an average value of Kshs
1,500,000.00 each, totaling Kshs 12,000,000.00. Certain sales will include home charging
stations. These transactions will yield additional revenue of Kshs 180,000.00 and it is
expected that within the first year all consumers will purchase these home charging units
totaling the revenue to Kshs 13,440,000.00.
ii. Revenue for the subsequent years is increased at a steady rate to show the uptake of
PHEVs in the market and the adoption of various partnerships to enable recharging at
shopping malls and petrol stations.
iii. A base lending rate of 15% per annum is assumed for the financial backing required for
the initial capital as well as the operational costs involved.
iv. A Loan Amortization schedule for Ksh. 8,000,000.00 over two years at 15% would be
required. This schedule would have a monthly repayment of Ksh. 387,893.00 amounting
to Ksh. 4,654,716.00 annually. The schedule also calculates the total amount of Interest
payable being Ksh. 1,309,463.00 of which Ksh. 952,308.00 is payable in the first year
and the balance in the second year. These values represent the estimated cost of
equipment for the first year, and should be used as a yardstick for subsequent years’
revenue and costs.
v. Partnerships with various private sector firms would add to the cash flow and profitability
and reduce some expenses such as marketing; which would be shared among both parties
of the partnership.
vi. Overhead costs are estimated based on a portion of the average current operations costs
of vehicle distributors. Insurance is estimated at 1% of expected revenue.
vii. A provision for Bad Debts is estimated at 3% of expected Income. This provides better
protection in case of default.

(d)
5. Strategy
Risk assessment, marketing strategy
6. Conclusion
Further research required

(d)
APPENDIX 2
Used Car Dealers in Kenya
A-Plus Motors Ltd.
Phone Contacts: +254 20
3861384 , +254 20 3746119
Location: Nairobi
AUTO LEHMANN
Phone Contacts: 0049 162 15
64 007, 0049 40 329 699 524
Location: Other
Bae Auto Phone Contacts: +254 753 300
300, +254 753 300 300
Location: Nairobi
JasAuto Solutions Ltd Phone Contacts: 0725160228,
0725160228
Location: Nairobi
Matuto Mwalimu Motors Phone Contacts: 0722 515239,
020 2015699
Location: Nairobi
MAYGUY MOTORS Phone Contacts:
+254715234342, 0715234342
Location: Nairobi
Mombasa Car Ltd. Phone Contacts: 0722404937,
041231400
Location: Mombasa
Mulkan Motors Ltd. Phone Contacts: 0722 626 600,
0722 626 600
Location: Mombasa
1st for 4x4 exports. ROBIN
WARD 4X4
Phone Contacts:
00447787503891,
00441530224053
Location: Other
AAA tycooncars.com Phone Contacts:
+447865147860,
+441444390786
Location: Other
Ace Motors Ltd Phone Contacts: , 053 2030010
Location: Eldoret
ADVANCE TRADE CO.,
LTD. Phone Contacts: 81-
9093293126, 81-45777-3399
Location: Other
Africpak Motors Ltd Phone Contacts: 0722 783777,
Location: Mombasa
Aichi Trading Company (K)
Ltd Phone Contacts: , 020 556700
Location: Nairobi
Ali Global General Trading
LLC , UAE Phone Contacts:
+971552631747,
+971552631747
Location: Other
ALI GLOBAL TRADING Phone Contacts: 81-80-4548-
1986, 81-80-4548-1986
Location: Other
ALUMNAS AGENCIES Phone Contacts: 0710506008,
0710506008
Location: Nairobi
Anything Express Phone Contacts:
+447939943886,
+447812686503
Location: Other
AUTO EQUATOR Phone Contacts: 65 94375002,
65 64754484
Location: Other
AWAN INTERNATION .K.K Phone Contacts:
+996709445446,
+819030913914
Location: Other
Cameroon Corporation
Phone Contacts:
818043731366, 81257281366
Location: Other
Car Master
Phone Contacts: 0729026999,
0729026999
Location: Nairobi
CarMAx East Africa Limited
Phone Contacts: 0720392386,
0787392386
Location: Nairobi
CarVectoR International Co.,
LTD
Phone Contacts: +81 345 2093
42, +81 345 2093 42
Location: Other
CCM Intertrade Co., Ltd
Phone Contacts: +81-029-274-
0027, +81-029-274-0027
Location: Other

(e)
Classic Marques Overseas
Ltd
Phone Contacts:
00441423563044,
00441423563044
Location: Nairobi
COAST COMMERCIAL
TRUCKS LTD
Phone Contacts:
00254787330622,
000254412221128
Location: Mombasa
Crown Trading
Phone Contacts: +81-90-6628-
4790, +81-44-200-0985
Location: Other
Derrickson systems
Phone Contacts: 0722478121,
0722478121
Location: Mombasa
Dimex Autos
Phone Contacts: 0728600530,
0728600530
Location: Nairobi
etwelve cars
Phone Contacts:
+447749125592,
+447749125592
Location: Other
Exclusive Autos Kenya
Phone Contacts:
+447438862464,
+447438862464
Location: Other
Export UK Motors Ltd
Phone Contacts:
447876485615, 442089861254
Location: Other
HENGTONG
INTERNATIONAL
DEVELOPMENT CO.,LTD.
Phone Contacts: +81-4-7136-
7986, +81-4-2266-0822
Location: Other
Imran's Auto Selection
Phone Contacts: 0723980353,
0720469193
Location: Mombasa
Isaac Auto Spares &
Hardware
Phone Contacts: , 020 2219883
Location: Nairobi
Italian Engineering Works
Ltd
Phone Contacts: , 041 2490446
Location: Mombasa
Jam City Motors Ltd
Phone Contacts: , 020 601546
Location: Nairobi
Jasena Auto Spares
Phone Contacts: , 066 248530
Location: Nairobi
Jayden Motor Ltd
Phone Contacts: , 020 2211421
Location: Nairobi
Jime Agencies Ltd
Phone Contacts: , 020 333912
Location: Nairobi
Jiwaji Enterprises
Phone Contacts: , 041 2493885
Location: Mombasa
Joyker Agencies
Phone Contacts: 0723 993157,
020 2089336
Location: Nairobi
JPC TRADE
Phone Contacts: +81-80-6426-
6215, +81-3-5245-7731
Location: Other
Kalenburg Motors
Phone Contacts: , 020 786571
Location: Nairobi
Kalis Motors (Kenya) Ltd
Phone Contacts: , 020 556215
Location: Nairobi
Kamwana Auto Spares
Phone Contacts: , 020 312948
Location: Nairobi
Kangwana Motor Dealers
Phone Contacts: , 051 44627
Location: Nakuru
Kansai Trading Ltd
Phone Contacts: 0724 710610,
020 2736900
Location: Nairobi
Karen Auto Mart Ltd
Phone Contacts: 0720 791992,
020 3884603
Location: Nairobi
Kasarini Auto work
Phone Contacts: , 020 512666
Location: Nairobi
Kaswa Enterprise
Phone Contacts: 0722 416924,
041 2318468
Location: Mombasa
Katco Investment Ltd
Phone Contacts: 0722 766226,
Location: Mombasa
Katiba Executive Motor
Autodrome
Phone Contacts: 0722 270708,
020 8560685
Location: Nairobi

(f)
Kenmuch Motor Limited
Phone Contacts: 0722 847121,
Location: Nairobi
kenscope shipping company
Phone Contacts:
+254750697822,
+2547250697822
Location: Nairobi
Keyman Motor Ltd
Phone Contacts: , 061 55039
Location: Nyeri
Kheng Keng Auto (K) Ltd
Phone Contacts: , 020 2733591
Location: Nairobi
Lumheroagencies car
importer
Phone Contacts: 0721101890,
0729598324
Location: Eldoret
Malugei Agencies Ltd
Phone Contacts: , 051 40915
Location: Nakuru
Mascot Metal Africa Ltd
Phone Contacts:
+254733983344,
+254733983344
Location: Mombasa
mc evoys
Phone Contacts:
00447720404091,
0044284065026
Location: Other
Micma Investment
Phone Contacts: 0722 312486,
Location: Nairobi
Mid Africa Investment
Company
Phone Contacts: , 020 533294
Location: Nairobi
Migingo Motor Dealers
Phone Contacts: , 058 21207
Location: Kisii
Milestone Cars
Phone Contacts: 0722 522477,
041 2314796
Location: Mombasa
Million Access
Phone Contacts: +81-90-5306-
6050, +81-42-499-6663
Location: Other
Minase Auto Car Sales (K)
Ltd
Phone Contacts: 0721 792181,
020 2243915
Location: Nairobi
Minase Auto Car Sales (K)
Ltd
Phone Contacts: , 020 252315
Location: Nairobi
Monarch Motor Ltd
Phone Contacts: , 041 2491539
Location: Mombasa
Motherland Motors Ltd
Phone Contacts: 0722 376556,
020 6006706
Location: Nairobi
Motor Bank services Ltd
Phone Contacts: 0722 712174,
020 252041
Location: Nairobi
Motor Boutique Ltd
Phone Contacts: , 020 3006333
Location: Nairobi
Motor Care Ltd
Phone Contacts: , 020 6002482
Location: Nairobi
Motor Mania Ltd
Phone Contacts: 0721 875211,
020 557742
Location: Nairobi
Motor Mart Group Ltd
Phone Contacts: , 042 2131485
Location: Malindi
Motor Options
Phone Contacts: 0722 514601,
020 3875002
Location: Nairobi
Motorlink Ltd
Phone Contacts: 0720 582289,
020 3875317
Location: Nairobi
Motormax
Phone Contacts: 0722 791173,
Location: Nairobi
Mutindwa Enterprise Ltd
Phone Contacts: , 064 20346
Location: Meru
Naif centre (HON's)
Phone Contacts: 0722 591931,
Location: mombasa
Nathu Khan & Company Ltd
Phone Contacts: , 020 3868724
Location: Nairobi
Nathu Khan & Company Ltd
Phone Contacts: , 051 2211174
Location: Nakuru
Ndemi Motors Company
Phone Contacts: , 020 6008948
Location: Nairobi

(g)
Nebima Motors Ltd
Phone Contacts: , 053 2033061
Location: Eldoret
New Rafiki Machinery &
Motor Sale
Phone Contacts: , 067 2020960
Location: Ruiru
Ngeeru Enterprise
Phone Contacts: , 020 6761057
Location: Nairobi
Nichibo Kenya Ltd
Phone Contacts: 0726 339329,
020 2215109
Location: Nairobi
Njilux Motor Ltd
Phone Contacts: , 020 3748830
Location: Nairobi
Njima Investment Ltd Phone Contacts: 0722 517698,
020 3748830
Location: Nairobi
NK Investment (K) Ltd
Phone Contacts: 0722 411718,
041 2317756
Location: Mombasa
Norway Spare Parts Kenya
Ltd
Phone Contacts: , 020 531834
Location: Nairobi
Nyandarua Motors Ltd
Phone Contacts: , 020 542228
Location: Nairobi
Nyandarua Motors Ltd
Phone Contacts: , 065 2032375
Location: Nyahururu
Nyanduko Motors
Phone Contacts: , 020 6763680
Location: Nairobi
Ombimahs Motors Dealers
Ltd
Phone Contacts: , 051 2211185
Location: Nakuru
Overseas Cars Import
Trading Ltd
Phone Contacts: 0721 290684,
020 341439
Location: Nairobi
Patience Motors
Phone Contacts: 0722 388422,
020 604674
Location: Nairobi
Peacock Motors Ltd
Phone Contacts: , 051 2211929
Location: Nakuru
Prestige Vehicle Importers
services
Phone Contacts: 0722 920928,
020 2248585
Location: Nairobi
Principle Investment
Phone Contacts: , 020 785618
Location: Nairobi
Puma Cars Ltd
Phone Contacts: 0720 266134,
020 2076328
Location: Nairobi
R B Shaw (Africa) Ltd
Phone Contacts: , 020 530605
Location: Nairobi
Rainbow Vehicle Dealers Ltd
Phone Contacts: , 051 2214487
Location: Nakuru
Real Cars Ltd
Phone Contacts: 0722 144726,
020 6750160
Location: Nairobi
Real Motors Ltd
Phone Contacts: , 020 350200
Location: Nairobi
Real Time & Mada Motors
Phone Contacts: 0722 603870,
Location: Mombasa
Rehal Services Ltd
Phone Contacts: , 020 553031
Location: Nairobi
Renroc Motors Ltd
Phone Contacts: , 041 2228049
Location: Mombasa
Resma Motors
Phone Contacts: , 051 2212593
Location: Nakuru
Revenup Inc. Ltd. UK
Phone Contacts:
+447773730758,
+441273221421
Location: Other
Rising Motors
Phone Contacts: , 020 780990
Location: Nairobi
Riverland Motors Ltd
Phone Contacts: , 064 30331
Location: Meru
Rocate Automobiles Ltd
Phone Contacts: 0720 568486,
020 2216582
Location: Nairobi
Rossyn Export & Imports
Company
Phone Contacts: , 020 2227246
Location: Nairobi

(h)
Royal Motors Ltd
Phone Contacts: , 020 3744307
Location: Nairobi
RUIFA INVESTMENTS
Phone Contacts: 0724805255,
0724805255
Location: Nairobi
Saba Star Cars
Phone Contacts: 0722 852115,
041 2229265
Location: Mombasa
Sakai Trading
Phone Contacts: 0722 272829,
020 2067440
Location: Nairobi
Salama Motor Ltd
Phone Contacts: , 020 558817
Location: Nairobi
Sapodilla
Phone Contacts: , 020 2211158
Location: Nairobi
Saratonic Enterprise
Phone Contacts: 0722 524779,
Location: Nairobi
SBT Kenya Ltd
Phone Contacts: 0723 382525,
Location: Mombasa
SBTJapan
Phone Contacts: +81-45-290-
9485 ext#9568, +81-45-290-
9485 ext#9568
Location: Other
Seaways Kenya Ltd
Phone Contacts: 0722 513493,
020 3872660
Location: Nairobi
Shabana Motors Ltd
Phone Contacts: , 058 31922
Location: Kisii
Shahid Automobiles Ltd
Phone Contacts: , 020 6762654
Location: Nairobi
Shahzad Motors Ltd
Phone Contacts: 0733 333468,
041 2220764
Location: Mombasa
Shamir's Automobiles
Phone Contacts: , 020 553985
Location: Nairobi
Shapla Motors Ltd
Phone Contacts: 0715 777800,
020 2426440
Location: Nairobi
Shecamo Hub
Phone Contacts: 0714 817779,
020 2713779
Location: Nairobi
Shiotsu Autotrade
Phone Contacts: +81-90-3266-
8113, +81-72-967-1495
Location: Other
Sidra Motors Ltd
Phone Contacts: 0722 370050,
041 2220303
Location: Mombasa
Simbili Motors
Phone Contacts: 0722 802786,
020 2249025
Location: Nairobi
Sira motors
Phone Contacts: , 020 3449657
Location: Nairobi
Skyways Motor Works
Phone Contacts: 0721 805723,
020 6531440
Location: Nairobi
SOUTHERN QUALITY
GROUP
Phone Contacts: 0723970231,
0716344382
Location: Nairobi
Specialised Motor Ltd
Phone Contacts: 0722 914024,
020 8561827
Location: Nairobi
Sports Cars Ltd
Phone Contacts: , 020 2223349
Location: Nairobi
Sports Cars Ltd
Phone Contacts: , 020 534366
Location: Nairobi
Ssi-Zyder (africa-N-America)
Ltd
Phone Contacts: , 020 820462
Location: Nairobi
Tokyo Auto Company
Phone Contacts: +81-90-8582-
2229, +81-4-7711-3342
Location: Other
Tradebuy Autos
Phone Contacts:
007850821888,
00441375482783
Location: Other
uk-exports
Phone Contacts:
00447738048042,
00447738048042
Location: Other
Warwick Motors
Phone Contacts: 0721 541050,
020 7125804
Location: Nairobi

(i)
Western Auto Dealers
Phone Contacts: , 020 2228251
Location: Nairobi
Western Automobile
Company Ltd
Phone Contacts: 020 2215925
Location: Nairobi
Western Automobile
Company Ltd
Phone Contacts: , 020 2222220
Location: Nairobi
Westfield Motors Ltd
Phone Contacts: , 054 20985
Location: Kitale
Wheatland Motors & General Agencies
Phone Contacts: , 053 2062770
Location: Eldoret
YAMAKATSU CO., LTD.
Phone Contacts: 81524330010,
81524330010
Location: Other
YUASA MOTORS LTD
Phone Contacts: 0715222222,
0206006145
Location: Nairobi
Zest Motors
Phone Contacts:
+254723488400, +254-
532062100
Location: Eldoret
New Car Dealers in Kenya
DT Dobie Phone Contacts: 0711 057 000 ,
020 6977000
Location: Nairobi
DT Dobie Phone Contacts: 0722 203314,
041 2316701
Location: Mombasa
A Jiwa Shamji Phone Contacts: , 058 30090
Location: Kisii
Associated Auto Centre Ltd Phone Contacts: , 051 221 2340
Location: Nakuru
Associated Auto Centre Ltd Phone Contacts: 0733 500 100,
057 202 1312
Location: Kisumu
Central Farmers Garage Phone Contacts: , 020 352 2435
Location: Nairobi
Central Farmers Garage Phone Contacts:
Location: Kitale
Kenya Coach Industries Phone Contacts: , 020 653 6795
Location: Nairobi
Ryce East Africa Ltd Phone Contacts: 0724 256665,
020 6531786
Location: Nairobi
Ryce East Africa Ltd Phone Contacts: , 041 222 6365
Location: Mombasa
Thika Motor Dealers Phone Contacts: , 067 22262
Location: Thika
Crater Phone Contacts: 0736 212055,
051 2212055
Location: Nakuru
Crater Phone Contacts: 020 2363915,
020 559814
Location: Nairobi
Crater Phone Contacts: , 057 2024087
Location: Kisumu
Crater Phone Contacts: , 053 2060531
Location: Eldoret
One Autospare Phone Contacts: 0722 767363,
020 554997
Location: Nairobi
Alfa Motors Ltd Phone Contacts: , 020 653 6071
Location: Nairobi
Al-lkhlas Motors Phone Contacts: , 020 600 1104
Location: Nairobi
Amazon Motors Ltd Phone Contacts: , 020 653 2304
Location: Nairobi
Amazon Motors Ltd Phone Contacts: , 020 222 4392
Location:
Atsushi&Brothers investment
Ltd Phone Contacts: 020 2215705
Location: Nairobi

(j)
B T Automobile Ltd Phone Contacts: 0720 619688,
020 2212151
Location: Nairobi
Balco International Ltd Phone Contacts: 0722 525395,
020 2212410
Location: Nairobi
Bavaria Auto Ltd Phone Contacts: 0716 555524,
020 2308823
Location: Nairobi
Bhatia Auto (Kenya) Ltd Phone Contacts: 0734 348888,
020 3001093
Location: Nairobi
Bhavin Motors Ltd Phone Contacts: , 041 2315040
Location: Mombasa
Bhinder Trading Co Ltd Phone Contacts: 0722 415044,
041 2226441
Location: Mombasa
Bhogal's Motors Mart Ltd Phone Contacts: 0722 512774,
Location: Nairobi
Bravia Auto Kenya Ltd Phone Contacts: , 020 230 8823
Location: Nairobi
C M C Motors Group Ltd Phone Contacts:
Location: Nairobi
C M C Motors Group Ltd Phone Contacts: , 041 2230490
Location: Mombasa
C M C Motors Group Ltd
Phone Contacts: , 053 2020061
Location: Eldoret
C M C Motors Group Ltd Phone Contacts: , 064 309847
Location: Meru
C M C Motors Group Ltd Phone Contacts: , 054 30382
Location: Kitale
Car & General(Trading) Ltd
Phone Contacts: 0721 395397,
Location: Nairobi
Chery Motors EA Ltd Phone Contacts: 0728 736 736,
020 807 0402
Location: Nairobi
Country Motors Ltd Phone Contacts: , 057 2020457
Location: Kisumu
Coverpoint Automobiles Ltd
Phone Contacts: 0721 290684,
020 2211910
Location: Nairobi
Crystal Kenya Co Ltd Phone Contacts: 0722 789635,
020 2245076
Location: Nairobi
Crystal Net Auction Phone Contacts: , 020 2241291
Location: Nairobi
Daewoo Corporation Phone Contacts: , 020 2228686
Location: Nairobi
Daewoo International Corp Phone Contacts: 0714 714505,
020 2050229
Location: Nairobi
Dynacorp Motors Ltd Phone Contacts: , 020 651 471
Location:
Gachewa Motors Ltd Phone Contacts: 0722 200532,
020 3755033
Location: Nairobi
Heavy Vehicle & Plant
suppliers Ltd Phone Contacts: , 020 497 0000
Location: Nairobi
Jas Auto Solution Ltd Phone Contacts: 0721 873533,
020 3002152
Location: Nairobi
Kenya Car Bazaar Phone Contacts: 0722 400920,
020 2018181
Location: Nairobi
Kenya Grange Vehicle
Industries Ltd Phone Contacts: 0722 203813,
020 554 018/4
Location: Nairobi
Kenya Grange Vehicle
Industries Ltd Phone Contacts: 0728 651 078,
041 2492713
Location: Mombasa
Kinza Motors Ltd Phone Contacts: 0722 374399,
020 828788
Location: Nairobi
Krue Investment Company
Ltd Phone Contacts: 0722 559044,
Location: Mombasa

(k)
Lian Motors Ltd Phone Contacts: , 020 344
094/8
Location: Nairobi
Marshalls East Africa Ltd Phone Contacts: 0722 205 776,
020 222 9547/8/9
Location: Nairobi
Marshalls East Africa Ltd Phone Contacts: 0722 208819,
020 559163
Location: Nairobi
Marshalls East Africa Ltd Phone Contacts: 0722 208823,
020 535035
Location: Nairobi
Mashariki Motors Ltd Phone Contacts: , 020 531288
Location: Nairobi
Mashariki Motors Ltd Phone Contacts: , 041 2313504
Location: Mombasa
Panij Automobiles Kenya Ltd
Phone Contacts: 0722 816364,
041 2317606
Location: Mombasa
Panjatani Auto Spares Phone Contacts: , 041 2224619
Location: Mombasa
Safari M Park Motors Phone Contacts: , 020 8562311
Location: Nairobi
Signature Cars Ltd Phone Contacts: 0722 338071,
020 3860562
Location: Nairobi
Simba Colt Motors Ltd Phone Contacts: , 020 6534800
Location: Nairobi
Simba Colt Motors Ltd Phone Contacts: , 020 6531230
Location: Nairobi
Simba Colt Motors Ltd Phone Contacts: , 041
2493051/2/3
Location: Mombasa
Singapore Motors Ltd Phone Contacts: 0722 116116,
020 2228037
Location: Nairobi
World Wide Automobiles Ltd
Phone Contacts: 0721 216443,
020 2013624
Location: Nairobi
Worldlink Holding Ltd Phone Contacts: 0720 671717,
020 3050184
Location: Nairobi
Yatal Automobiles Phone Contacts: 0722 329344,
Location: Mombasa
Yaya Motors Phone Contacts: , 020 3875748
Location: Nairobi
Yuasa Motors Phone Contacts: 0715 111222 ,
020 6006145
Location: Nairobi
Sam-Con Ltd Phone Contacts: , 020 821 252
Location: Nairobi
Subaru Kenya Phone Contacts: 0722 203 782,
020 65 2266/7/8
Location: Nairobi
Symc Motors (K) Ltd Phone Contacts: , 020 273 2008
Location: Nairobi
Tata Africa Holdings Phone Contacts: ,
Location:
Toyota east Africa Ltd Phone Contacts: 0722 206 108,
020 696 7000
Location: Nairobi
Toyota east Africa Ltd Phone Contacts: , 020 696 7000
Location: Nairobi
Toyota east Africa Ltd Phone Contacts: 0721 331 168 ,
041 222 3071
Location: Mombasa
Toyota east Africa Ltd Phone Contacts: 0722 203 367,
054 232 446
Location: Lokichogio
Toyota east Africa Ltd Phone Contacts: , 051 221
17800
Location: Nakuru
Toyota east Africa Ltd Phone Contacts: , 020 201 9868
Location: Kisumu
Toyota east Africa Ltd Phone Contacts: , 061 230 3444
Location: Nyeri
Toyota east Africa Ltd Phone Contacts: , 062 203 2088

(l)
Location: Nanyuki
Toyota east Africa Ltd Phone Contacts: , 052 31172
Location: Kericho
Toyota east Africa Ltd Phone Contacts: , 057 251 2874
Location: Eldoret
Transafrica Motors Ltd Phone Contacts: , 020 550 695
Location: Nairobi
Transallied Ltd Phone Contacts: , 020 808 6717
Location: Nairobi
uk-exports Phone Contacts:
00447738048042,
00447738048042
Location: Other
L.C.V Intertrade Co., Ltd. Phone Contacts: +81-029-274-
0027, +81-029-274-0027
Location: Other
ray Phone Contacts: 4324353423,
4454245667
Location: Eldoret
kenscope car sales ltd Phone Contacts:
+254750697822,
+254750697822
Location: Nairobi

(m)
APPENDIX 3
Sample Size Calculator

(n)
APPENDIX 4
Questionnaire
University of Sunderland
Questionnaire to gather information on the viability of Plug-in Hybrid Electric Vehicles in Kenya Want to be the first to introduce this wonderful new product and increase your sales??
Zuhair Jaffer – MBA
Kindly write your answers in capital letters and tick choices where available
Date: ________________________________
Company Name: ________________________________________________________________

(o)
Background information
How long has the company been in existence?
(a) 0-1 year
(c) 2-4 years (e) 6-8 years
(b) 1-2 years (d) 4-6 years (f) Above 8 years
Where is the company situated?
(a) Nairobi
(c) Nakuru (e) Kisumu
(b) Mombasa (d) Eldoret (f) Other
How many Staff does the company employ?
(a) 1-10 Staff
(c) 50-100 Staff
(b) 11-50 Staff (d) Above 100 Staff
What is the Position you hold in the company:
(a) CEO
(c) COO (e) Sales Admin
(b) CTO (d) Manager (f) Other
Could you share the approximate turnover the company received for the past year?
(a) below $100,000
(c) $500,000-$1m (e) Above $5m
(b) $100,000-$500,000 (d) $1m-$5m
Market Viability
What is the current market positioning for company?
What are your future projections and proposals for growth?

(p)
How willing would the company be to venture into PHEVs?
(a) None
(c) Average (e) Very enthusiastic
(b) Little (d) Enthusiastic
Kindly rate the below questions:
Very Bad
Bad
Average
Good
Very Good
Opinion of PHEVs
Market acceptability to change
Market readiness for PHEVs
Technological Viability
What are the problems faced with current technology used in vehicles?
What problems do you expect might be faced when introducing PHEVs?
How would you describe your knowledge of PHEVs?
(a) None
(c) Average (e) Deep Knowledge
(b) Word of Mouth (d) Clear Knowledge
Have you ever dealt with PHEVs before?

(q)
(a) Never
(c) Few times
(b) Once (d) All the time
Economic Viability
Which is the fastest moving type of vehicle in the company?
(a) Sports
(c) Large (e) Small
(b) Luxury (d) Mid-Sized
Can you list the top 3 types of vehicles sold:
Make Model
Make Model
Make Model
Could you state an approximate number of vehicles sold in average per month?
(a) less than 5
(c) 10-15 (e) 20-25
(b) 5-10 (d) 15-20 (f) more than 25
Could you state an approximate number of vehicles imported in average per month?
(a) less than 5
(c) 10-15 (e) 20-25
(b) 5-10 (d) 15-20 (f) more than 25
Effective Business Strategy
Kindly highlight key requirements that you feel will lead to a successful business strategy to introduce PHEVs in the
Kenyan Market.

(r)

(s)
APPENDIX 5
General Interview Schedule for Vehicle distributors
Opening
A. (Establish Rapport) (shake hands) My name is ______________ and as a Masters student of the MBA
program from Sunderland university in UK, I am doing a research study on the viability of Plug-in Hybrid
Electric Vehicles in the Kenyan market.
B. (Purpose) In-order to find out whether or not this technology would be viable in the Kenyan market, I
would like to ask you some questions about the background of your vehicle distribution agency, and some
details about your opinions on the market, technology and economic environment.
C. (Motivation) I hope to use this information to find out whether Plug-in Hybrid Electric Vehicles are
viable in our market, and if so then what prerequisites would be required. This should allow me to come up with
an effective business strategy that should be adopted by vehicle distribution agencies when introducing this
technology.
D. (Time Line) The interview should take about 30 minutes. Are you available to respond to some
questions at this time?
E. (Transition: Let me begin by asking you some questions about this vehicle distribution agency)
Body
A. (Topic) Background
1. How long has this firm been in existence?
(Question1. may not have to be asked because this information could be found earlier)
a. Have you been in this industry since your incorporation?
b. I saw on your website that you also deal in___________________. Was there any particular reason why you
went into that?

(t)
c. Why did you decide to become a vehicle distributor?
(Question 1.c may only be asked if the owner or decision maker is being interviewed)
2. Would you term this a small or large company?
a. How many staff do you have?
b. Please describe your position in the firm.
c. What is the staff turnover rate? Is the company growing?
(Transition to the next topic:
______________________________________________________________)
B.(Topic) Market Viability
1. How is business?
a. How many cars are sold in a month on average?
b. How many cars are imported in a month on average?
2. What is the market positioning of this firm?
a. What type of vehicle sells fastest here?
3. Do you think this market accepts change readily?
a. Do you know of Plug-in Hybrid Electric Vehicles?
b. Do you think PHEVs can be introduced successfully? Why?
c. What type of people do you think would buy them? Why?

(u)
(Transition to the next topic:
______________________________________________________________)
C. (Topic) Technological Viability
1. You stated on your website that you have various makes and models available.
a. Could you mention any problems faced with the current technology being used in vehicles?
b. Could you suggest reasons as to why these problems exist?
c. Do you think having PHEVs would reduce these problems?
2. What problems do you think would hamper the introduction of PHEVs in the market?
a. What type of incentives do you think would encourage both vehicle distributors and vehicle owners to
purchase PHEVs?
3. Do you know any details about PHEVs? What?
a. Have you dealt with them before? When?
b. What was your experience with the technology adopted in PHEVs?
(Transition to the next topic:
______________________________________________________________)
D. (Topic) Economic Viability
1. You mentioned earlier which type of vehicle sells fastest, could you mention some of the makes and models
which you know would sell easily?
2. How is the economic environment right now?

(v)
a. What is causing this?
b. Does it affect your company? How?
c. What are people looking for with the current economic situation?
E. (Topic) Effective Business Strategy
1. What would you ensure, if you were to venture into PHEVs?
a. Are there any particular prerequisites?
2. How would you market the idea to consumers?
a. Who else would you target? Why?
(Transition: Well, it has been a pleasure finding out more about you. Let me briefly summarize the information
that I have recorded during our interview.)
Closing
A. (Summarize) In summary, this is a ______________ company with a lot of growth potential, and from
your answers it seems that you _____________ be willing to venture into PHEVs. Your opinion seems
________________ towards this new technology.
B. (Maintain Rapport) I appreciate the time you took for this interview. Is there anything else you think
would be helpful for me to know so that I can successfully compile the research?
C. (Action to be taken) I should have all the information I need. Would it be alright to call you in case of
any more questions? Thanks again. I look forward to placing your opinions within the study.

(w)
APPENDIX 6
Introduction Letter
Zuhair Jaffer
James Gichuru
Nairobi, Kenya
[Date]
[Recipient Name]
[Title]
[Company Name]
[Street Address]
[City, ST ZIP Code]
Dear [Recipient Name]:
I would like to gather some information on the viability of Plug-in Hybrid Electric Vehicles (PHEVs) in the
Kenyan market, and have identified [Company Name] as one of the firms in the vehicle distribution industry.
If you would be willing to fill in the attached questionnaire with just a few questions about [Company Name]
and your opinions about the viability of PHEVs in our market, I would be grateful.
I can also share the results of my research study when it is completed to benefit [Company Name]
Sincerely,
Zuhair Jaffer
MBA Student
University of Sunderland