11. comparison of radon in soil gas and indoor radon - · pdf filestudies soil gas –...
TRANSCRIPT

56
tion) characteristics. Both types of data are regionalized
in the 3 × 3 km grid with distance weighted interpolation
within geological units and detailized into 0.5 × 0.5 km
grid. The predition of indoor radon levels from geogenic
radon potential emphasizes also the role of housing condi-
tions and density of sampling plus the scale of geological
maps used to improve the accuracy of prediction. Detailed
studies soil gas – indoor radon performed in 68 counties
with different geological basement support the presented
method.
In Belgium the present methodics is oriented to
8 radon prone areas derived both from geological data
(985 soil gas radon measurements) and indoor radon mea-
surements (1366). Within the project of Federal Agency for
Nuclear Control (DEHANDSCHUTTER 2006) the soil gas and
indoor radon measurements were performed in the grid net
1 × 1 km, where transfer factor (indoor/soil gas) was cal-
culated for each grid cell to determine the radon potential.
The detailization is performed into grid 250 × 250 m. After
solving problems with clustering data the geological and
pedological factors seem to be the main source of regular-
ity or anisotropy of data. Further studies are oriented to
using the kriging with various parameters (TONDEUR 2006)
and geometric indoor mean is considered to refl ect best the
variations between areal units.
MILES et al. (2005, 2007) have presented the Indica-
tive Atlas of Radon in England and Wales based on indoor
radon measurements in 460 000 homes and further imply-
ing the selection criteria after the geological boundaries
between geological units and 1 km grid cells. Bedrock
and superfi cial layers georeferenced after maps of Brit-
ish Geological Survey at a scale 1 : 50 000. Together with
georeferencing the indoor measurements geometric indoor
mean and percentage of houses above action level in one
grid square were calculated. The radon potential is derived
within 1 grid square where criterion of more than one per-
cent occurence limit of the highest radon potential was
set for indicating the highest radon potential in the whole
cell.
Additional method was presented by SCHEIB et al. (2006). The method was tested in Derbyshire (Central England,
area 14 000 km2) and is based on the 1 × 1 km gridded data
of airborne and ground gammaspectrometry accompanied
by 70 m long soil gas radon traverses. The correlations of
geometric mean eU data and geometric mean indoor radon
data with estimated percentage of houses above the action
level showed a very good correlation (R2 = 0.89 to 0.97).
The resulting correlation is also infl uenced by clay con-
tents of soil which can be related to K concentration from
gammaspectrometric measurements.
The indoor radon survey (about 40 000 measurements
in 17 000 rooms in 8500 dwellings) was performed in
Austria within the radon project ÖNRAP (FRIEDMANN and
GRÖLLER 2006, DUBOIS et al. 2007). The indoor data were
gathered and grouped within municipalities’ borders.
The indoor data were expressed in the 3 radon potential
levels. Further specifi cation required implying the bedrock
characteristics. The radon potential is therefore newly cal-
culated using Bayes statistics (GRÖLLER and FRIEDMANN
2007) as the weighted average of radon potential at the
measurement sites and the weight is probability derived
from the geological information. Due to the geological
similarity the soil gas data from the Czech Republic and
Germany are used for characterization of particular rock
types in Austria (Bohemian Masssif for crystalline and
magmatic formations and Alpine belt for sedimentary
formations).
A wide range of soil and geological radiometric meth-
ods was used for setting the radon risk map of Estonia
1 : 500 000 (PETERSELL et al. 2005). On 566 observation
points covering the major geological units and lithological
types the soil gas radon concentration (direct) and recal-
culated from U, gammaspectrometry K, U, Th and natural
radiation of soil. The resulting radon risk map from bed-
rock is also accompanied by indoor radon measurements
(annual mean indoor concentrations) for municipalities.
11. Comparison of radon in soil gas and indoor radon
11.1. METHOD AND DATA SOURCES
The soil gas – indoor radon comparison is based on the
results of indoor radon measurements (National Radia-
tion Protection Institute – NRPI) and radon database of the
Czech Geological Survey. Until 2007 the indoor measure-
ments were performed in about 130 000 dwellings within
the Czech Republic. Even if the track etch detectors were
situated preferably into areas of predicted high risk, the
resulting coverage of indoor measurements within particu-
lar rock types seems to be relatively equable (see Tab. 11-2)
and refl ects partly the areal occurrence of different rocks.
The Czech Statistical Offi ce granted the coordinates of
centroids of municipalities and dwellings coming from
the digitised cadastral maps from census. These data were
linked to data of indoor radon measurements using the
house number, which is unique and nonrecurring for each
house in one administrative unit – municipality (or part
of municipality in case of cities). The link to underlying
geological units and rock types was made in ArcGIS 9.1.
programme.
11.2. PILOT STUDY OF SOIL GAS AND INDOOR RADON CORRELATIONS
The fi rst regionally based comparison of indoor radon
concentrations and rock types’prevailing radon index was
started in 2001. After the statistical evaluation of till then
performed indoor measurements the NRPI has selected
three types of municipalities concerning the prediction of
indoor radon values. The centroids of municipalities and
radon risk map at a scale 1 : 500 000 was used for georef-
erencing. The basic selection criterion was at least 30 %
of measured dwellings within the particular municipality
(464 municipalities were selected). The fi rst type com-

57
prises the municipalities where less than 1 % of dwellings
was expected to exceed the action level – “low munici-
palities” (200 Bq . m–3 equivalent radon concentration used
in that time, this value is equal to present value of indoor
radon concentration 400 Bq . m–3). The second type was
chosen for the same criterion 1–10 % dwellings exceed-
ing the action level (“medium minicipalities“) and the
third type was over 10 % above the action level (“high
municipalities“). The prevailing radon risk from bedrock
in intravilans of these municipalities was derived from the
radon risk map at a scale 1 : 500 000. The main aim of this
pilot sudy was to test the infl uence of bedrock on general-
ised indoor levels in three geologically defi ned radon risk
categories. The results of this comparison are given in the
following fi gures (Figs 11-1 to 11-3).
From the above presented fi gures it is obvious that
the probability of correct geological prediction of indoor
radon levels in municipalities reaches 70–80 %. The dif-
ferences remaining to 100 % fi t are caused by variability
of local geological environment and also by the fact that
the intermediate radon risk category used for inhomoge-
neous Quaternary sediments was suppressed due to the
scale of used geological map serving as a base for deter-
mining radon risk categories. However the results allowed
to follow the targeted indoor radon distribution preferably
into areas of defi ned high radon risk from bedrock.
11.3. COMPARISON IN CENTRAL BOHEMIAN PLUTONIC COMPLEX
The growing number of targeted indoor radon measure-
ments as well as improving the detailness of radon risk
maps published since 1999 (term radon index maps is
used for the scale 1 : 50 000) enabled to concentrate the
attention to the largest radon prone area of the Bohemian
Massif – the granitoid Central Bohemian Plutonic Com-
plex (CBPC). The plutonic complex is emplaced between
two terranes – the weakly metamorphosed Barrandian
on the NW and medium to high grade metamorphosed
Moldanubian assemblage of Precambrian and Proterozoic
rocks on the SE. The granitoids intruded along probable
suture zone with major axis SW (Klatovy) – NE (Říčany)
on the area of about 3200 km2 and they are considered to
be the major radon prone are in the Czech Republic.
For comparison of soil gas – indoor radon relation-
ship four databases of indoor radon measurements, soil
gas radon measurements, vectorised geological and radon
maps and geographical coordinates of particular dwellings
were used (BARNET et al. 2003, 2005). The positioning of
particular dwellings with geographical coordinates (Czech
Statistical Offi ce) was linked to the indoor radon data-
base of the National Radiation Protection Institute via the
unique evidence number of house within the particular
municipalities. The georeferencing resulted in building the
common database with annual mean indoor radon concen-
tration and corresponding lithological type and mean soil
Fig. 11-1. Percentage of prevailing radon risk category in intravi-
lan of municipalities (expected less than 1 % of dwellings above
the action level) – 38 municipalities.
Fig.11-2. Percentage of prevailing radon risk category in intra-
vilan of municipalities (expected 1–10 % of dwellings above the
action level) – 150 municipalities.
Fig.11-3. Percentage of prevailing radon risk category in intra-
vilan of municipalities (expected more than 10 % of dwellings
above the action level) – 276 municipalities.
Fig. 11-4. Position of studied districts.

58
Fig. 11-5. Comparison of indoor Rn and soil gas Rn in the rock types of 6 Central Bohemian districts. – Explanation of rock
types: SS – Silurian sediments, DR – durbachites (syenites), GR – granites, GD – granodiorites, KR – Moldanubian paragneisses,
POR – Palaeozoic volcanites, MS – quartzites, erlanes, GN – Moldanubian orthogneisses, DS – Devonian sediments, PT – Proterozoic
metasediments, SPR – loess, A – amphibolites, Q – Quaternary, GA – gabbros, OS – Ordovician sediments, KAS – Cambrian sedi-
ments, Qgravel – Quaternary gravel, N – Neogene sediments, AL – alluvial sediments, PTs – Proterozoic silicites.
59
gas radon value for each house. The data were processed in
ArcGIS 9.1 programme. The resulting database comprises
16145 data enabling to fi nd correlation between radon in
dwellings and radon in rock types occurring within the
area of CBPC (Figs 11-4 and 11-5, Tab. 11-1). The data-
base follows the administrative division into 7 districts,
covering the area of CBPC: Praha – east (444), Benešov
(2985), Příbram (6341), Písek (2164), Strakonice (1779),
Plzeň – south (1596) and Klatovy (836) covering the areal
extent of CBPC.
Except of Prague east district, where houses were
situated only on Quaternary sediments and granites (insuf-
fi cient for graphical presentation), in all other mentioned
districts there was found positive correlation between soil
gas radon in geological basement and indoor radon con-
centration within particular lithological types. The highest
indoor and soil gas radon concentrations among the rock
types of the CBPC were measured in durbachites, granites
and granodiorites. The Silurian black shales and Protero-
zoic metasilicites (both concentrating uranium) also belong
to the rocks with enhanced soil gas and indoor radon con-
centration. The differences in indoor radon concentration
can be found also in local types of granitoids of the CPBC
(see Tab. 11-1).
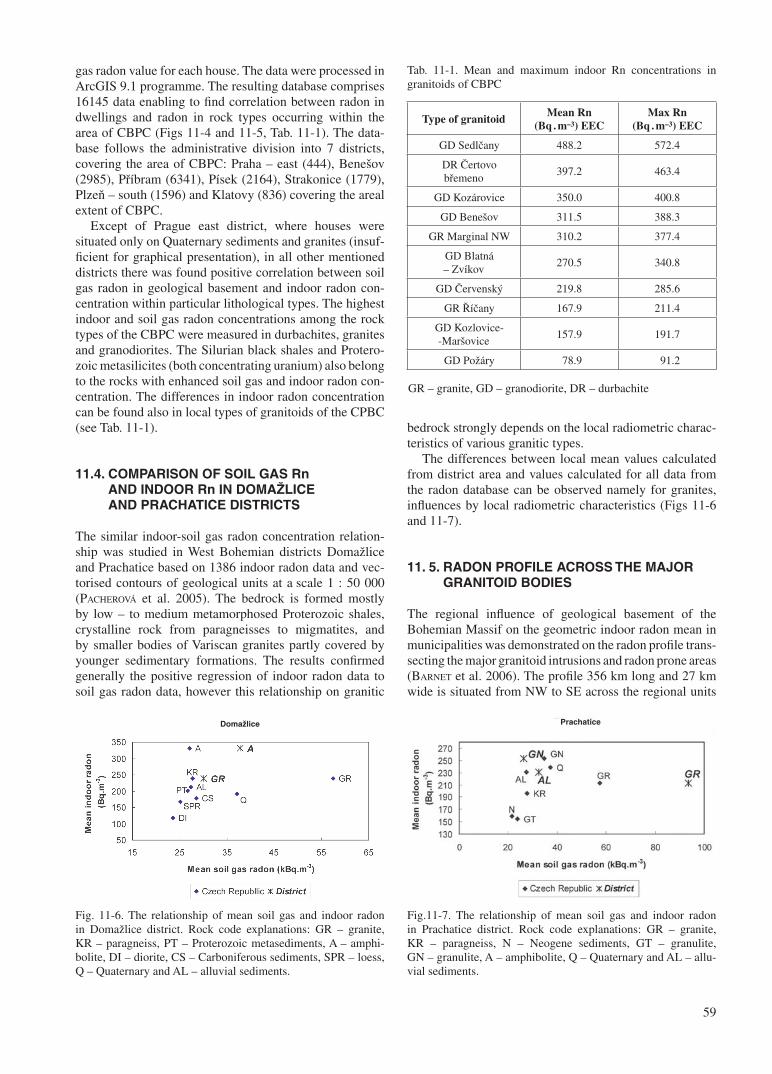
11.4. COMPARISON OF SOIL GAS Rn AND INDOOR Rn IN DOMAŽLICE AND PRACHATICE DISTRICTS
The similar indoor-soil gas radon concentration relation-
ship was studied in West Bohemian districts Domažlice
and Prachatice based on 1386 indoor radon data and vec-
torised contours of geological units at a scale 1 : 50 000
(PACHEROVÁ et al. 2005). The bedrock is formed mostly
by low – to medium metamorphosed Proterozoic shales,
crystalline rock from paragneisses to migmatites, and
by smaller bodies of Variscan granites partly covered by
younger sedimentary formations. The results confi rmed
generally the positive regression of indoor radon data to
soil gas radon data, however this relationship on granitic
bedrock strongly depends on the local radiometric charac-
teristics of various granitic types.
The differences between local mean values calculated
from district area and values calculated for all data from
the radon database can be observed namely for granites,
infl uences by local radiometric characteristics (Figs 11-6
and 11-7).
11. 5. RADON PROFILE ACROSS THE MAJOR GRANITOID BODIES
The regional infl uence of geological basement of the
Bohemian Massif on the geometric indoor radon mean in
municipalities was demonstrated on the radon profi le trans-
secting the major granitoid intrusions and radon prone areas
(BARNET et al. 2006). The profi le 356 km long and 27 km
wide is situated from NW to SE across the regional units
Type of granitoidMean Rn
(Bq . m–3) EECMax Rn
(Bq . m–3) EEC
GD Sedlčany 488.2 572.4
DR Čertovo
břemeno397.2 463.4
GD Kozárovice 350.0 400.8
GD Benešov 311.5 388.3
GR Marginal NW 310.2 377.4
GD Blatná
– Zvíkov270.5 340.8
GD Červenský 219.8 285.6
GR Říčany 167.9 211.4
GD Kozlovice-
-Maršovice157.9 191.7
GD Požáry 78.9 91.2
Tab. 11-1. Mean and maximum indoor Rn concentrations in
granitoids of CBPC
Fig. 11-6. The relationship of mean soil gas and indoor radon
in Domažlice district. Rock code explanations: GR – granite,
KR – paragneiss, PT – Proterozoic metasediments, A – amphi-
bolite, DI – diorite, CS – Carboniferous sediments, SPR – loess,
Q – Quaternary and AL – alluvial sediments.
Fig.11-7. The relationship of mean soil gas and indoor radon
in Prachatice district. Rock code explanations: GR – granite,
KR – paragneiss, N – Neogene sediments, GT – granulite,
GN – granulite, A – amphibolite, Q – Quaternary and AL – allu-
vial sediments.
Domažlice Prachatice
GR – granite, GD – granodiorite, DR – durbachite

60
– terranes – Saxothuringian, Teplá-Barrandian, Moldanu-
bian and Moravian between covering Krušné hory pluton,
Čistá-Jesenice massif, Central Bohemian Plutonic Com-
plex, area of Silurian black shales, Central Moldanubian
Pluton, Třebíč syenite massif and Brno pluton. 705 test
sites of soil gas radon measurements and 421 indoor radon
geometric means in municipalities were selected after the
geographical coordinates (Fig. 11-8) and converted into
graphs given in Fig. 11-9.
The relationship of inreased radon concentrations both
in bedrock and indoor was observed in Variscan granitoid
bodies throughout the whole profi le. The radiopotential
infl uence of granitoid bodies is not limited only to present
surfi cial outcrops (after the geological maps) but extends to
distance of about 15 rim around them. This fact is impor-
tant in using the geologically based radon risk maps and in
targeting the indoor radon surveys.
From top to bottom Fig. 11-9 comprises the moving
average 10 of indoor geometric mean radon in munici-
palities along the profi le. The central graph displays the
raw mean soil gas radon data in kBq . m–3 and the bottom
graph shows the moving average 10 of the radon index on
particular test sites along the profi le. All three graphs are
displayed above the hypothetical geological profi le identi-
cal with the course of the radon profi le transsecting the
granitoid bodies. The lithological exception in the pro-
fi le are the Silurian black shales of Barrandian marked
by number 3. These shales differ from other sedimentary
formations of the Bohemian Massif by high concentra-
tion of uranium, bound to the organic matter (BARNET
1994). The extreme soil gas radon concentrations in the
black shales even exceed the top mean values for Varis-
can granitoid plutons (approx. 300 kBq . m–3). However the
area of surfi cial outcrops is small compared to granitoid
bodies and therefore the Silurian black shales constitute
only the radon hazard of a local scale. All Variscan gran-
itoid bodies are manifested both by increase of mean soil
Fig. 11-8. Radon profi le
across the Bohemian Massif
(based on the radon risk map
1 : 500 000).
Fig. 11-9. The indoor radon, soil gas radon and radon index
along the profi le. Georeferenced positions of granitoid bodies
and Silurian black shales: 1 – Krušné hory pluton, 2 – Čistá-Jese-
nice massif, 3 – Silurian black shales in Barrandian, 4 – Central
Bohemian Plutonic Complex, 5 – Central Moldanubian Pluton,
6 – Třebíč syenite massif and 7 – Brno pluton.

61
gas radon values, of mean radon index at the test sites and
of increased radon geometric mean in municipalities with
the exception of older Cadomian granites of Brno pluton
(number 7).
11.6. INDOOR AND SOIL GAS Rn IN MAJOR ROCK TYPES OF THE CZECH REPUBLIC
The growing number of data from soil gas and indoor Rn
measurements enables to compare the relationship of both
mentioned quantities in major rock types, forming the
basement and sedimentary cover of the Czech Republic.
The 92 276 indoor radon data were georeferenced to vec-
torised geological units after the atlas GEOČR500 (1998).
The basic statistical results are given in the Tab. 11-2 and
graphically presented in Fig. 11-10. The detailed statistics
for particular rock types is described in chapter 8.
From Fig. 11-10 it is obvious that the relationship of
mean soil gas Rn and indoor Rn can be found in all rock
types with a fair determination coeffi cient (R2 = 0.85)
along the whole range of indoor and soil gas Rn concen-
trations, the greater deviations can be found in magmatic
rocks (difference from the ideal regression line in Variscan
granodiorites – higher indoor Rn due to the increased gam-
madose rate in the CBPC compared to Variscan granites).
The highest soil gas and indoor Rn values are observed in
durbachites of Čertovo břemeno type and Třebíč syenite
pluton. The resulting category of radon index determined
from the soil gas Rn concentrations and permeability cor-
responds well to the expected indoor Rn values.
11.7. SOIL GAS RN AND INDOOR Rn COMPARISON BASED ON GAMMA DOSE RATE CATEGORIES
The gamma dose rate map of the Czech Republic (MANOVÁ
and MATOLÍN 1998) was divided into areas < 35, 36–55,
56–85, 86–105, > 105 nGy.h–1 (mean value in the Czech
Rock typeGeolmean(kBq . m–3)
Inmean(Bq . m–3)
code Num indoor Num geol
Syenites 96.2 624.5 DR 5 651 84
Variscan granodiorites 51.3 468.2 GD 10 936 333
Palaeozoic metamorphites 49.2 353.6 MS 1 039 145
Variscan granitoids 63.0 299.5 GR 6 583 379
Orthogneisses 37.6 286.7 GN 2 601 224
Proterozoic–Palaeozoic volcanites 28.5 273.0 PV 1 658 172
Proterozoic–Prevariscan metamorphites 32.5 269.3 PT 5 996 719
Palaeozoic unmetamorphosed 30.7 243.7 PAL 5 037 732
Diorites, gabbros 21.6 226.7 DI 410 44
Moldanubian variagated 30.1 212.9 KRV 5 415 252
Moldanubian paragneisses 30.8 203.2 KR 7 094 472
Prevariscan granitoids 19.9 200.2 GRP 1 364 141
Tertiary sediments 25.7 168.9 N 1 989 356
Permo-Carboniferous sediments 28.3 167.9 PCS 4 791 297
Quaternary 21.6 155.1 Q 19 418 2259
Tertiary Alpine folded 17.4 147.9 NK 1 257 244
Tertiary volcanites 21.1 142.8 NV 582 69
Mesozoic sediments 18.3 135.6 KS 9 524 987
Mesozoic Alpine folded 16.9 129.0 KSK 870 226
Tab. 11-2. Mean soilgas Rn and indoor Rn in major rock types of the Czech Republic
Fig. 11-10. Relationship of mean indoor radon concentration
and mean soil gas radon concentration in major rock types of the
Czech Republic. O sedimentary with prevailing low radon index, metamorphic with prevailing medium radon index, ♦ magmatic
with prevailing high radon index.

62
Republic is calculated from polygons of vectorised gamma
dose rate map to 72 nGy . h–1, the upper range of mean inter-
val was set to 85 nGy . h–1). The position of 92 276 dwellings
with existing indoor Rn measurements was georeferenced
to 5 gamma dose rate categories in ArcGIS 9.2. programme
and mean values of indoor radon concentration was cal-
culated for particular groups of dwellings (BARNET and
FOJTÍKOVÁ 2007). The results given in Fig. 11-11 show that
a tight relationship of indoor Rn concentration and gamma
dose rate from underlying rock types can be observed
only in the above-mean categories, which means that the
detailed prognosis of indoor Rn based on the gamma dose
rate is an unsuitable method for lower ranges. However, the
gamma dose rate can support the targeted indoor radon
search for houses exceeding the action level in the rock
types with enhanced natural radioactivity (Fig. 11-11).
11.8. INDOOR RADON IN MUNICIPALITIES RELATED TO RADON INDEX FROM BEDROCK
The relationship of geometric indoor Rn mean and radon
index of underlying rock was also calculated from data of
the National Radiation Protection Insitute. From all muni-
cipalities (6395) only those were selected, where at least
20 % of dwellings were measured within the municipal-
ity and currently more than 20 dwellings were measured.
The selected database comprised 1627 municipalities
BARNET and FOJTÍKOVÁ 2006). After that the centroids of
these municipalities (coordinates by the Czech Statistical
Offi ce) were positioned over the radon index map at a scale
1 : 500 000 and corresponding radon index was deter-
mined. The numbers of municipalities in different radon
index categories are relatively even (353 on low radon
index, 336 on intermediate radon index, 602 on medium
radon index and 336 on high radon index). The clear dif-
ference in indoor radon distributions can be seen between
low, medium and high radon index bedrock, the close
position of indoor Rn distributions in low and intermedi-
ate index is explained by difference in permeability as can
be seen from Tab. 11-3 (lower permeability in intermedi-
Fig. 11-11. Relationship of indoor and soil gas Rn in gamma dose
rate categories (categories in nGy . h–1).
Mean Rn index
Meanpermeability
% of clay cover
Mean Rn (kBq . m–3) Number
Intermediate
Rn index1.56 1.67 44.1 24.7 1188
Low
Rn index1.51 2.26 28.9 19.8 3894
Tab. 11-3. Differences in
mean Rn index and concen-
tration and mean permeability
between low and intermediate
Rn index bedrock
Fig. 11-12. Distribution of
geometric indoor Rn means of
municipalities in radon index
categories.
Indoor Rn (Bq . m–3)

63
ate index bedrock decreases the indoor Rn concentration,
however the soil gas Rn concentrations are higher in inter-
mediate than in low radon index bedrock).
11.9. PERCENTAGE OF RADON INDEX CATEGORIES WITHIN THE MUNICIPALITIES
The above presented comparisons of soil gas Rn and
indoor Rn relationships are focused to select the munici-
palities, where the indoor Rn measurements of majority of
dwellings is required due to the expected high indoor Rn
concentrations from bedrock. The general calculation can
be based also on the percentage ratio of particular radon
index categories within the area of municipality (NUTS5
borders). This calculation is performed in ArcGIS 9.2. pro-
gramme using the intersection of vectorised polygons of
radon index category (after the radon index maps at a scale
1 : 50 000 and the area of municipality (datasets of the
Czech Geological Survey and the Czech Statistical Offi ce).
The percentage of low, intermediate, medium and high
radon index categories within the area of municipality are
presented in Figs 11-13 to 11-16. The areal conformity
of the high radon index rocks with the indoor Rn con-
centrations in municipalitites is clearly demonstrated on
Fig. 11-17.
Fig.11-13. Percentage of low
radon index.
Fig. 11-14. Percentage of inter-
mediate radon index.

64
Fig. 11-15. Percentage of me -
dium radon index.
Fig. 11-16. Percentage of high
radon index.
Fig. 11-17. Extent of high
Rn index rocks and mean
indoor Rn concentration in
municipalities. HIGH RISK