11 emergency management - productivity commission
TRANSCRIPT

EMERGENCYMANAGEMENT
567
11 Emergency management
Emergency management aims to reduce the level of risk to the community from theoccurrence of emergencies, reduce the adverse effects of emergencies, and improvethe level and perception of safety in the community. This chapter reports on someactivities of State and Territory government fire and ambulance services(pre-hospital care, treatment and transport services).1 Except for information insection 11.1 on the scope of activities, the chapter does not report on the total rangeof State and Territory emergency services.
A profile of emergency management appears in section 11.1, followed by adiscussion of recent policy developments in section 11.2. Together, these sectionsprovide a context for assessing the performance indicators presented later in thechapter. A framework of performance indicators is outlined in section 11.3. Thedata are discussed in sections 11.4 and 11.5, and future directions for performancereporting are discussed in section 11.6. Jurisdictions’ comments are provided insection 11.7. Section 11.8 provides information on sample data. The chapterconcludes with definitions in section 11.9.
Major changes in this year’s chapter include:
� the inclusion of text boxes detailing specific programs focused on Indigenouscommunities;
� the provision of information on the variety of agencies involved in providingresponses to a range of emergencies to improve understanding of the breadth ofemergency management;
� the presentation of information on the scope and type of State and TerritoryEmergency Services (SES/TES) activities;
� a change to the way in which the Report refers to ambulance services toaccommodate future expansion of event-type services reporting; and
� the provision of data on revenue sources for event-type services.
1 Ambulance services are defined as pre-hospital care, treatment and transport services in this
chapter.

568 REPORT ONGOVERNMENTSERVICES 2002
Data have been improved by refining revenue data items (for both fire andambulance services) to clarify the reporting of revenue received directly andindirectly by agencies. Improvements include revised definitions for:
� staff numbers, to ensure categories are mutually exclusive and it is clear towhich category staff belong;
� caseload, to avoid miscounting of patient transport vehicles;
� response times, to clarify the categories; and
� cardiac arrest survival, to enable more jurisdictions to report against this item.
These changes have improved data comparability.
Supporting tables
Supporting tables for chapter 11 are provided on the CD-ROM enclosed with theReport. The files are provided in Microsoft Excel 97 format as\Publications\Reports\2002\Attach11A.xls and in Adobe PDF format as\Publications\Reports\2002\Attach11A.pdf.
Supporting tables are identified in references throughout this chapter by an ‘A’suffix (for example, table 11A.3 is table 3 in the electronic files). These tables maybe subject to revision. The most up-to-date versions of these files can be found onthe Review web page (www.pc.gov.au/gsp). Users without Internet access cancontact the Secretariat to obtain up-to-date versions of the tables (see details insidethe front cover of the Report).
11.1 Profile of emergency management
The emergency management sector includes a range of service providers engaged inactivities of prevention, preparedness, response and post-emergency recovery.Emergency management providers address a range of events, including fires,medical transport and emergencies, rescues, other natural events (such as floods,earthquakes, landslides, heatwaves, cyclones and other storms), technological andhazardous material incidents (such as chemical spills, harmful gas leaks,radiological contamination, explosions and spills of petroleum and petroleumproducts), quarantine and control of diseases and biological contaminants.

EMERGENCYMANAGEMENT
569
Roles and responsibilitiesThe management of major emergencies and disasters requires cooperation amongCommonwealth, State, Territory and local governments, industry, communityorganisations and the community in general.
The primary role of the Commonwealth Government is to support and developnational emergency management capability by:
� coordinating the Commonwealth’s material and technical assistance to Statesand Territories in the event of large scale emergencies (through EmergencyManagement Australia);
� providing financial assistance to States, Territories and authorities for floodprevention/mitigation (through the Regional Flood Mitigation Program of theDepartment of Transport and Regional Services) and for bearing the costs ofnatural disasters (through the Natural Disaster Relief Arrangements of theDepartment of Transport and Regional Services);
� providing information, best practice materials and training programs (throughEmergency Management Australia); and
� supporting community awareness activities (through Emergency ManagementAustralia, the Bureau of Meteorology and Geoscience Australia).
Commonwealth Government agencies also have specific emergency managementresponsibilities, such as: the control of exotic animal diseases; aviation andmaritime search and rescue; the management of major marine pollution andmeteorological and geological hazards; the provision of firefighting services atsome airports and some defence installations; human quarantine; and research anddevelopment.
State and Territory governments are responsible for instituting regulatoryarrangements and have the primary responsibility for delivering emergencyservices, including fire and ambulance services, directly to the community.Commonwealth, State and Territory governments are also jointly responsible fordeveloping building fire safety codes, undertaking fire related research, formulatingpolicies and providing advice on fire safety.
Local governments in most States and Territories are involved to varying degrees inemergency management. Their roles and responsibilities include:
� considering public safety in town planning and development to assist inpreventing emergencies such as fires, floods and hazardous material incidents;
� improving community preparedness through local emergency and disaster plans;

570 REPORT ONGOVERNMENTSERVICES 2002
� issuing hazard reduction notices to private land holders and clearing vegetationin high risk public areas;
� collecting statutory levies to fund fire services;
� allocating resources for response and recovery activities; and
� providing financial and operational assistance to rural fire brigades and/or othervoluntary emergency service units.
Fire services
State and Territory governments provide a range of emergency managementactivities through fire services, including prevention, preparedness, response andrecovery (see section 11.3). Fire services across jurisdictions generally:
� respond to structural, bush, forest, vehicle and other fires;
� develop building fire safety codes and inspect fire safety measures;
� provide rural land management advice on the role and use of fire;
� train and educate the community about fire safety and awareness and road safetyissues;
� conduct road accident rescue;
� manage chemicals and hazardous material incidents; and
� administer legislation relating to fire safety, hazardous materials facilities andhazard mitigation.
The management structure and activities of fire services differ across jurisdictions(box 11.1). Separate urban and rural fire services deliver fire services in mostjurisdictions. Land management departments also typically provide rural fireservices. Jurisdictions with more than one fire authority may separate services indifferent ways; for example, NSW separates fire services on the basis of servicefunction and geographic area, whereas Victoria separates fire services bygeographic area only.

EMERGENCYMANAGEMENT
571
Box 11.1 Delivery and scope of activity of primary fire servicesa
Urban Rural
Attend residential and commercialstructural fires; incidents involvinghazardous materials; and roadaccidents within major urban centres.
Attend local structural fires and otherevents outside major urban centres;rural non-structural fires (includingcrop, bushland and grassland fires onprivate property); and fires in nationalparks and State forests.
NSW NSW Fire Brigades — the brigadesreport to the Minister for EmergencyServices directly.
NSW Rural Fire Service — day-to-daymanagement of each brigade rests with thelocal councils, but each brigade isstrategically and operationally responsibleto the NSW Rural Fire Service, whichreports to the Minister for EmergencyServices.
Vic Metropolitan Fire and EmergencyServices Board — this statutory authorityreports to the Minister for Police andEmergency Services and the EmergencyServices Commissioner.
Department of Natural Resources andEnvironment — this department isresponsible for public lands.
Country Fire Authority — this statutory authority reports to the Minister for Police andEmergency Services and the Emergency Services Commissioner.
Qld Queensland Fire and Rescue Authority — this statutory authority, incorporating the RuralFire Service, reports to the Minister for Emergency Services via the Director-General,Department of Emergency Services.
WA Fire and Emergency Services Authority of WA — this umbrella statutory authority reports tothe Minister for Police and Emergency Services directly and incorporates the Bush FireService, State Emergency Service and Fire and Rescue Service.
SA Metropolitan Fire Service — this statutoryauthority reports to the Minister forEmergency Services directly.
Country Fire Service — the board of thisauthority reports to the Minister forEmergency Services directly.
Tas Tasmania Fire Service — this is the operational arm of the State Fire Commission, whichreports to the Minister for Health and Human Services.
ACT ACT Fire Brigade and ACT Bushfire Service — these are agencies of the ACT EmergencyServices Bureau, which reports to the ACT Minister for Police, Emergency Services andCorrections.
NT NT Fire and Rescue Service — this is abranch of the larger Department ofPolice, Fire and Emergency Services.The Chief Fire Officer reports to theCommissioner for Police, who reports tothe Minister for Police, Fire andEmergency Services.
Bush Fires Council b — this is a board,which reports to the Minister for Parks andWildlife.
a Excludes brigades employed by large-scale public and private land managers; port, mining and otherinfrastructure brigades; and land management departments and brigades operating under Commonwealthjurisdiction (for example, airport and defence installations). b The NT Bush Fires Council is primarily a landmanagement organisation and responds to only grass fires and bushfires on land outside the Fire andRescue Service response areas. The NT statistics in this chapter do not apply to the Bush Fires Councilunless stated.
Source: State and Territory governments (unpublished).

572 REPORT ONGOVERNMENTSERVICES 2002
Fire services provided to Indigenous communities are described in box 11.2.
Box 11.2 Fire services for Indigenous communitiesA number of Australian fire services have implemented specific programs to improveservices to Indigenous people. The jurisdictions that report having targeted fire serviceinitiatives are NSW, Victoria, Queensland, WA and the NT.
These initiatives generally aim to :
� improve the representation of Indigenous people working within fire services;
� establish partnership projects in which fire services and Indigenous communitieswork together to address the risks faced by Indigenous communities; and
� improve the success of fire service education and awareness programs in reachingIndigenous communities.
Some fire services have, for example, implemented programs to increase the numberof firefighters from the Indigenous community. These include preparatory Technicaland Further Education programs for applicants for firefighter jobs in NSW, thepromotion of career opportunities to Indigenous people in Victoria, and thedevelopment and implementation of the Aboriginal and Torres Strait IslanderEmployment Program 2001 in Queensland.
Some fire services are also implementing cultural awareness programs for staff tosupport Indigenous firefighters and improve awareness of cultural issues relevant toimproving service delivery to Indigenous communities. The NSW Fire Brigade hasestablished an Aboriginal Services Officer position, to assist with the development ofprograms for Indigenous communities.
In NSW, WA and the NT, fire services have implemented volunteer programs forIndigenous communities, which include the provision of training, equipment, assistancewith firebreak projects and other support to promote fire safety and communityprotection. These projects also contribute to general capacity building goals withinIndigenous communities.
In NSW, WA and the NT, fire services are developing or have already produced firesafety awareness programs in conjunction with Indigenous communities or Indigenoushousing authorities. The programs will address local fire safety issues, addressing localneeds in a culturally appropriate manner.
Source: Commonwealth, State and Territory governments (unpublished).
Ambulance services
Ambulance services across jurisdictions:� provide emergency pre-hospital patient care and transport in response to sudden
injury and illness;� retrieve emergency patients;
EMERGENCYMANAGEMENT
573
� access emergency pre-hospital patients (for example, in confined spaces andhazardous environments);
� undertake inter-hospital patient transport;� conduct road accident rescue; and� plan and coordinate patient services in multi-casualty events.
Some government ambulance services also provide first aid training courses, as dothe non-government providers St John Ambulance Australia and the Australian RedCross. The Royal Flying Doctor Service (RFDS) responds to medical emergenciesin remote inland areas of Australia. It was contracted in 1999-2000, for example, bythe Ambulance Service of NSW for routine and emergency work in the north-westsector of NSW. The RFDS is not included in the Report.
State and Territory governments provide ambulance services in most jurisdictions.In WA and the NT, St John Ambulance is under contract to the respectivegovernments as the primary provider of ambulance services (box 11.3).
Box 11.3 Relationships of primary ambulance response andmanagement agencies to government
NSW Ambulance Service of NSW — a statutory authority reporting to the Minister forHealth
Vic Metropolitan Ambulance Service, Rural Ambulance Victoria, and Alexandra andDistrict Ambulance Service — separate statutory bodies reporting to the Minister forHealth
Qld Queensland Ambulance Service — a statutory authority reporting to the Minister forEmergency Services through the Director-General
WA St John Ambulance — an incorporated not-for-profit organisation under contract tothe WA Government
SA SA Ambulance Service — an incorporated joint venture between the State Ministerfor Health and St John Priory Australia
Tas Tasmanian Ambulance Service — a statutory service of the Hospital andAmbulance Division of the Department of Health and Human Services
ACT ACT Ambulance Service — an agency of the ACT Emergency Services Bureaureporting to the ACT Minister for Police, Emergency Services and Corrections
NT St John Ambulance — an incorporated not-for-profit organisation under contract tothe NT Government
Source: State and Territory governments (unpublished).
Jurisdictions have special arrangements for the provision of ambulance services toIndigenous communities. Ambulance services provided to Indigenous communitiesin Queensland are described as an example in box 11.4.

574 REPORT ONGOVERNMENTSERVICES 2002
Box 11.4 Ambulance services for Indigenous communitiesThe provision of ambulance services for some Indigenous communities posesparticular challenges. These challenges have been analysed in some detail by theQueensland Ambulance Service through a series of studies funded by externalresearch bodies.
The provision of services is made difficult by the remoteness, size and physicalisolation of some rural and remote communities, which lead to difficulties incommunications, education and support. The homeland outstation movement placesfurther challenges upon service providers to meet community needs.
Some Indigenous communities have relatively high rates of illness, traumatic injuries,substance abuse and violence compared with the wider community. In remote areas,the alternative transport available is often very limited and distances are great. Thelevel of demand for ambulance services is, therefore, comparatively high.
Cultural issues in Indigenous communities have an impact on ambulance services inrelation to the lack of acceptance of non-Indigenous staff members. Yet, serviceprovision by Indigenous community members can be difficult because they must spendtime away from their community during ambulance related training.
There is an expectation that ambulance services in Indigenous communities willprovide wider roles, including:
� leadership in problem solving around health access problems;
� community wide first aid training;
� close integration with primary health services;
� integrated health transport;
� training of local people as ambulance officers;
� health promotions and injury prevention strategies;
� support for traditional healing initiatives; and
� support for outstations.
Officers require appropriate education and training in cultural awareness and skills toaddress issues faced by some Indigenous communities.
Source: Queensland Ambulance Service (unpublished).
Other emergency management organisations
The Review does not yet report on the performance of Commonwealth or localgovernment emergency management services or their agencies, or the SES/TES.The Review intends, however, to explore the inclusion of the SES/TES services infuture in relation to some emergency events, because these services are an integral

EMERGENCYMANAGEMENT
575
part of emergency management. Table 11.1 describes the scope of activities of theSES/TES.
Table 11.1 Description of SES/TES activitiesa
Activities NSW VIC QLD WA SA TAS ACT NTStorm damage � � � � � � � �
Flood response � � � � � � � �
Road accidentrescue
� � � � � � �
Earthquakes �(s) � � � � �(s)Civil defence � � � � � � �
Land searchand rescue
�(s) � � � � � �(s) �
Inland searchand rescue
�(s) � � � � � �
Offshore searchand rescueb
� � � � �
Diving �
Support otheremergencyserviceorganisations
� � � � � � � �
Assistance formunicipalplanning
� � � � � � �
Conduct ofemergencymanagementcourses
� � � � � �
Air observerb �(s) �(s) � � �
Vertical rescue �(s) � �(s) � � � �
Public safetyawarenessand education
� � � � � � � �
a (s) indicates that the role is to provide support to another agency in this activity. b WA SES undertakes airobserver duties only, off shore. WA SES does not participate in sea rescue.Source: Australian Council of State Emergency Services (unpublished).
Emergency services operate in all States and Territories. Their specific functionsvary across jurisdictions, although all services undertake work to mitigate theeffects of flood, storm and earthquake, and all have civil defence responsibilities. Inaddition, most of the SES/TES undertake road accident rescue services and assistpolice and other accredited agencies to carry out search and rescue on land and ininland waters. Some also provide search and rescue support in offshore waters.Most of the SES/TES provide rescue from heights and depths, and some providespecialist activities such as diving, trench collapse, building collapse, urban andforensic search, rescue and animal rescue. All the SES/TES provide support to other

576 REPORT ONGOVERNMENTSERVICES 2002
emergency service organisations, under predetermined State and Territoryagreements, on request.
Most of the SES/TES provide support to local government councils to assess risksand develop plans to prevent, prepare for, respond to and recover from emergencies.Most also provide training in emergency management through tailored courses.
Funding
Fire services
The primary sources of funding across all jurisdictions in 2000-01 were grants fromState, Territory and local governments, levies on insurance companies and propertyowners, user charges, and fundraising and donations. Levies on insurancecompanies were the primary source of funding for NSW, Victoria and WA. Levieson property owners were the primary source of funding for Queensland, SA andTasmania. Territory governments were the most important source of funds for theACT and the NT (table 11A.1). In addition to relying on funded resources, all Statesand Territories rely on volunteer firefighters who make a significant contribution tothe community.
Total funding of fire services covered in this Report was $1.3 billion in 2000-01.Across jurisdictions funding was highest in NSW ($429 million) and lowest in theNT ($21 million). Funding increased (when measured in real terms) in Victoria,Queensland, SA, Tasmania, the ACT and the NT between 1999-2000 and 2000-01,and decreased in NSW and WA (table 11.2).
Fire services are funded by a variety of sources, with non-government organisationsmaking a significant contribution. Fire services received direct government fundingof 23.8 per cent nationally in 2000-01. Across jurisdictions, the highest proportionof direct government funding was in the NT (90.6 per cent) and the lowest was inSA (0.4 per cent) (figure 11.1).

EMERGENCYMANAGEMENT
577
Table 11.2 Funding of fire services (2000-01$ million)a, b
NSWc Vicd Qld WA SA Tas ACTe NTf Total
1998-99 393 283 209 85 88 36 35 21 1151
1999-2000 441 286 230 101 109 36 22 20 1246
2000-01 429 310 239 97 110 37 25 21 1268a� Totals may not sum as a result of rounding. b Indirect revenue is counted in government grants in table
11A.1. The totals are the sum of government grants, levies, user charges and other revenue. c The 1999-2000 figure for NSW Fire Services has been artificially inflated by abnormal items of $23 million. d 2000-01was the first year of funding for a special resources initiative in Victoria. e The ACT funding change for 1999-2000 and 2000-01 reflects the revised method of attributing funds to the Emergency Services Bureau by eventtype. f 1999-2000 NT data include a Commonwealth Government (National Heritage Trust) grant for a firemanagement research project. ‘User charges' include charges to landholders for aerial control burning andfirebreaks. ‘Other' includes the sale of assets.Source: State and Territory governments (unpublished); table 11A.1.
Figure 11.1 Major sources of fire services funding, 2000-01a
0102030405060708090
100
NSW Vic Qld WA SA Tas ACT NT Total
Per c
ent
Indirect government and non-government revenue Direct government revenue
b c
a� Government revenue is equal to government grants less indirect revenue. Indirect revenue is counted in
indirect government and non-government revenue. b 2000-01 was the first year of funding for a specialresources initiative in Victoria. c The ACT funding change for 2000-01 reflects the revised method ofattributing funds to the Emergency Services Bureau by event type.Source: State and Territory governments (unpublished); table 11A.1.
Ambulance services
Nationally, ambulance services receive funding from different sources, includingtransport fees (from government hospitals, private citizens and insurance),subscriptions and levies, and government contributions. The distribution of fundingsources varies across jurisdictions. Data for NT were not available for this Report.

578 REPORT ONGOVERNMENTSERVICES 2002
State and Territory governments were the largest contributors to ambulance servicesin all States and Territories except WA. The contribution from this level ofgovernment in 2000-01 was highest in Tasmania (98.5 per cent) and lowest in WA(21.9 per cent). The primary source of funds in WA was transport fees(61.7 per cent). All jurisdictions except NSW and Tasmania received funding fromsubscriptions. Queensland relied more on this funding source (23.4 per cent) thandid any other jurisdiction (table 11A.16). There is an ambulance subscriptionscheme in NSW, but these funds are deposited in the consolidated revenue of NSWTreasury.
Total funding of ambulance services covered in this Report was $885 million in2000-01. Across jurisdictions, funding was highest in NSW ($280 million) andlowest in the ACT ($9 million). Compared with 1999-2000, funding increased inreal terms in NSW, Victoria, Queensland, decreased in SA and Tasmania, andremained the same in WA and the ACT (table 11.3).
Table 11.3 Funding of ambulance services (2000-01$ million)a, b
NSWc Vic Qld WAd SA Tas ACTe NT Total1998-99 250 201 182 48 62 15 na 10 7671999-2000 270 206 205 59 72 15 9 9 8442000-01 280 227 226 59 70 14 9 na 885a Totals may not sum as a result of rounding. b Indirect revenue is counted in government grants in table11A.16. The totals are the sum of government grants, subscription fees, transport fees, donations and otherrevenue. c NSW has a subscription scheme but funds are deposited in the consolidated revenue of NSWTreasury. d For 1999-2000, WA subscription fees are for country regions only; insurance transport feesinclude those covered by private health insurance; and workers’ compensation transport fees are notseparately identified and are included with the uninsured. e The ACT funding change for 1999-2000 and2000-01 reflects the revised method of attributing funds to the Emergency Services Bureau by event type. naNot available.Source: State and Territory governments (unpublished); table 11A.16.
Ambulance services are funded by a variety of sources, with non-governmentorganisations making a significant contribution. Ambulance services received directgovernment funding of 59.9 per cent nationally in 2000-2001. Across jurisdictions,direct government funding was highest in Tasmania (97.7 per cent) and lowest inWA (21.9 per cent). Total government funding is equal to that of State and Territorygovernments because no funding was provided from the Commonwealth and localgovernments (figure 11.2).

EMERGENCYMANAGEMENT
579
Figure 11.2 Major sources of ambulance services funding, 2000-01a
0102030405060708090
100
NSW Vic Qld WA SA Tas ACT NT Total
Per c
ent
Indirect government and non-government revenue Direct government revenue
cb
a� Government revenue is equal to government grants less indirect revenue. Indirect revenue is counted in
indirect government and non-government revenue. b� NSW has a subscription scheme but funds are
deposited in the consolidated revenue of NSW Treasury. c The ACT funding change for 2000-01 reflects therevised method of attributing funds to the Emergency Services Bureau by event type.Source: State and Territory governments (unpublished); table 11A.16.
Indigenous funding
At a national level, expenditure per person on patient transport for Indigenouspeople ($106 per Indigenous person) was higher than that for non-Indigenouspeople ($31 per person) in 1998-99 (AIHW 2001). This difference is explained bythe higher costs and greater reliance of Indigenous people on the RFDS (AIHW2001).
Data are affected by the difficulties associated with the identification of Indigenouspeople. Indigenous identification is incomplete, so the data need to be treated withcare.
Size and scope
Fire services
The scope of activity within fire service delivery is broad and varies acrossjurisdictions (table 11A.28).

580 REPORT ONGOVERNMENTSERVICES 2002
Incidents
Information on reported fires and other incidents was provided separately for fireagencies in each jurisdiction. Data were not available for all fire services acrossjurisdictions. Fire services are required by legislation to respond to all calls, and anincident cannot be deemed to be a false report until the fire service has respondedand investigated the site. Nationally, 36.8 per cent of reported incidents in 2000-01were fires or explosions (table 11A.2).
The proportions of incident types varied substantially across jurisdictions in2000-01. Victorian fire services, for example, attended 69 456 incidents, of which35.8 per cent were fires and explosions, 13.7 per cent were fire alarm systemnotifications not involving fire, and 50.4 per cent were false alarms, false calls andother incidents. The WA fire brigades responded to 28 533 incidents, of which60.2 per cent were fires and explosions, 17.1 per cent were fire alarm systemnotifications not involving fire, and 22.7 per cent were false alarms, false calls andother incidents (table 11A.2).
Staffing
A staff member is any person delivering a firefighting or firefighting related service,or managing the delivery of this service, including:
� firefighters (qualified paid and volunteer firefighters); and
� support staff (any paid and volunteer person directly supporting the operationalprovider, including technical and communications staff and personnel staff).
Nationally, 11 937 full time equivalent paid staff were involved in the delivery offire services in 2000-01. Across jurisdictions, the number of paid staff ranged from3959 full time equivalent staff in NSW to 177 full time equivalent staff in the NT.The majority of paid staff were firefighters (80.6 per cent). Across jurisdictions, thisproportion was highest in SA (88.6 per cent) and lowest in Tasmania (67.1 per cent)(table 11A.3).
Volunteer firefighters (218 253 people) participated in the delivery of fire servicesin 2000-01. The number of volunteer firefighters varied across jurisdictions from68 350 in NSW to 580 in the NT (table 11A.3).
Ambulance services
The scope of activity within ambulance service delivery is broad and varies acrossjurisdictions (table 11A.28).

EMERGENCYMANAGEMENT
581
Incidents
Ambulance services attended two million incidents nationally in 2000-01. Most ofthese were emergency incidents (45.4 per cent), followed by non-emergencyincidents (37.8 per cent) and urgent incidents (25.3 per cent). Only Queensland andWA attended casualty room incidents (1.8 per cent or less). The proportion ofemergency incidents was highest in NSW (65.1 per cent) and lowest in WA(26.1 per cent) (table 11A.17).
Staffing
Data on staffing for ambulance services are improved in this Report because morespecific definitions were applied. The data are reported by operational status on afull time equivalent basis to provide a detailed description of the human resourcesprofile for ambulance agencies.
A staff member is any person involved in delivering an ambulance service ormanaging the delivery of this service, including:
� ambulance operatives (including qualified ambulance officers, advanced lifesupport officers, student ambulance officers, patient transport officers,communications staff and other operatives, including public education officers,flight nurses and medical staff);
� operational and business support staff (including management, corporate supportstaff, non-operative communications and technical staff, and training staff); and
� remunerated and non-remunerated volunteers and retained staff (any paid andvolunteer staff providing ambulance services on an on-call basis).
Nationally, 8443 full time equivalent salaried staff were involved with the deliveryof ambulance services. Across jurisdictions, the number of salaried ambulance staffranged from 2942 full time equivalent staff in NSW to 107 in the ACT. Themajority of salaried ambulance staff in 2000-01 were ambulance operatives(83.8 per cent). Across jurisdictions, this proportion ranged from 88.2 per cent inNSW to 72.9 per cent in WA (table 11A.18).
Non-remunerated volunteer and retained ambulance staff numbering 6001, alongwith 406 remunerated volunteers and retained staff, participated in the delivery ofambulance services in 2000-01. Across jurisdictions, the number ofnon-remunerated volunteer and retained ambulance operatives varied acrossjurisdictions from 3767 in WA to zero in Victoria and the ACT. Volunteeroperational and business support staff (898) were used in WA. Because of the

582 REPORT ONGOVERNMENTSERVICES 2002
decentralised structure of its ambulance services, WA is the only jurisdiction withvolunteer operational and business support staff (table 11A.18).
Other emergency management services
Other types of emergency for which performance reporting has yet to be developedinclude: rescues; natural events; technological and hazardous material incidents;emergency relief and recovery; and quarantine and disease control. State andTerritory Emergency Management Committee executive officers acrossjurisdictions identified which emergency management departments and agenciesprovide relevant services in these areas in the 2000 Survey of EmergencyManagement Activities by the Review (table 11A.28).
11.2 Policy developments in emergency management
Emergency management organisations have continued to pursue developmentsidentified in Reports from previous years. These include computer aided dispatch,risk management and increased multi-service cooperation. This Report focuses ondevelopments in the following areas:
� the Australian Emergency Management Committee;
� major reviews established by the Council of Australian Governments (COAG);
� the International Year of Volunteers;
� leadership and management; and
� training.
Australian Emergency Management Committee
The Australian Emergency Management Committee (AEMC) has replaced theNational Emergency Management Committee as the peak national strategicadvisory group for emergency management. The AEMC comprises senior State andTerritory emergency management officials and is chaired by the Director-General,Emergency Management Australia. Its objectives include (1) the promotion ofemergency management as a critical community safety issue on the strategic policymainstream agenda and (2) the development of national emergency managementcapability.

EMERGENCYMANAGEMENT
583
Major COAG reviews
The COAG announced two major reviews which have an impact on the emergencymanagement sector. The first review concerns Australia’s approach to naturaldisaster relief and mitigation. The objectives of the review are to determine whethercurrent arrangements provide an effective framework to meet the needs of thoseaffected by natural disasters and, where appropriate, to develop options forimproving existing arrangements. An underlying premise of the review is that anyarrangements should facilitate the maximum involvement of State, Territory andlocal governments in contributing to disaster relief and mitigation, and continuedCommonwealth cost sharing arrangements. The review also includes an assessmentof the Natural Disaster Relief Arrangements, Exceptional Circumstances relief forfarmers, and access to insurance coverage for natural disasters (expected to report in2002).
The second review has been given a high priority by COAG. Its objective is therevision of national whole-of-government frameworks for the prevention,preparedness for, and management of a major animal disease outbreak emergency,such as Foot and Mouth Disease (FMD). An FMD Taskforce was established underthe oversight of COAG senior officials to coordinate the development of theseframeworks (expected to report in March 2002).
These reviews could have an impact on the scope of emergency managementactivities discussed in the profile section of future reports.
2001 International Year of Volunteers
The year 2001 was designated by the United Nations as the International Year ofVolunteers. The contributions of more than 500 000 volunteers to emergencymanagement were recognised through many activities conducted throughout thecountry. A national summit was held on 11–12 October 2001 in Canberra, focusingon recognition, funding, training and legal issues. The key outcomes from thesummit are to be incorporated in a report to governments.
Leadership and management
In recent times, there have been some distinct changes in the leadership andmanagement of services engaged in emergency management. These changes haveneeded to accommodate the complex, diverse and rapidly changing socioeconomicenvironments in which agencies operate, and to create opportunity and capabilityfor improving service delivery and organisational performance. There has been aclear shift away from a paramilitary response-style approach in the industry to a

584 REPORT ONGOVERNMENTSERVICES 2002
more collaborative and inclusive community and intersectoral partnership model,including:
� better tailoring of services to at-risk and special needs groups (IndigenousAustralians, people from non-English speaking backgrounds, people with adisability, older Australians and children);
� building community capability for self help through programs such ascommunity fire units at bushland interfaces;
� a whole-of-government or ‘joined-up-government’ approach to developingservice delivery policy and community safety programs; and
� partnering with universities and learning centres to ensure evidence basedplanning.
Training
The Public Safety Training Package has been launched. The package is acomprehensive education and training tool based on input from public safetyindustry representatives from each State and Territory. The package details thecompetency standards identified as necessary for safe, effective and efficientoperations within the industry. It also includes assessment guidelines and the rangeof national qualifications for the industry from entry level to management. It appliesto workers (both paid and volunteer) in the emergency management, state andterritory emergency services, and police sectors.
The Convention of Ambulance Authorities has established the AustralianAmbulance Education Council as a body responsible for the identification anddevelopment of education standards for the ambulance industry in Australia. Newcompetency standards have been established for educational programs with theVocational Education and Tertiary sector. These standards are currently under finalconsideration by the Australian National Training Authority.
11.3 Framework of performance indicators
The broad aim of emergency management is to reduce the level of risk to thecommunity from emergencies. The framework of performance indicators in thischapter is based on the objectives for emergency management, which are commonto all Australian emergency management agencies (box 11.5).

EMERGENCYMANAGEMENT
585
Box 11.5 Objectives for emergency managementEmergency management services aim to provide highly effective, efficient andaccessible services that:
� reduce the adverse effects of emergencies and disasters on the Australiancommunity (including people, property, infrastructure, economy and environment);
� contribute to the management of risks to the Australian community; and
� enhance public safety.
The general performance indicator framework has been applied to both fire andambulance services (pre-hospital care, treatment and transport services). The aim ofthe indicator framework is to provide information on the efficiency andeffectiveness of government provided and/or funded emergency managementservices (figure 11.3).
Figure 11.3 General performance indicators framework for emergencymanagement
Effectiveness
PERFORMANCE
Input to outputEfficiency
Outputs
Input to outcomes
Prevention/mitigation
Preparedness
Recovery
Response
Outcomes
The performance framework includes overarching indicators of the effects of aservice on the community, economy and environment. The indicators may suggestthe degree of service success. Outcomes indicators include: fire death rate; fireinjury rate; the value of property lost and saved from fire incidents; the number offire incidents relative to the population; and the survival rate from out-of-hospitalcardiac arrest.

586 REPORT ONGOVERNMENTSERVICES 2002
The framework uses the widely accepted ‘comprehensive approach’(prevention/mitigation, preparedness, response and recovery) to classify the keyfunctions common to emergency agencies. The Review uses a somewhat similarapproach to examine health management (chapter 7). Outputs for emergencyservices are grouped accordingly:
� prevention and mitigation — the results of strategies and services to prevent orreduce the frequency of emergency events or to lessen their effects. Activitiesthat contribute to outputs of prevention and mitigation include: advice on ruralland management practice for hazard reduction and fire prevention; theinspection of property and buildings for fire hazards, fire standards complianceand levels of safe fire practices; the preparation of risk assessment andemergency management plans; hazard categorisation for public informationcampaigns; and public information campaigns to promote safe practices by thecommunity;
� preparedness — the results of strategies and services to position providers andthe community to respond to emergency events quickly and effectively.Activities that contribute to outputs of preparedness include: public educationand training; emergency detection and response planning (including theinstallation of smoke alarms and/or sprinklers); hazardous chemicals andmaterial certification, and inspection of storage and handling arrangements; theexercising, training and testing of emergency service personnel; and standby andresource deployment and maintenance. Preparedness also involves establishingequipment standards and monitoring adherence to these standards;
� response — the results of strategies and services to control, limit or modify theemergency to reduce the consequences. Activities that contribute to outputs ofresponse include: the implementation of emergency plans and procedures; theissuing of emergency warnings; the mobilisation of resources in response toemergency incidents; the suppression of hazards (for example, fire containment);the provision of immediate medical assistance and relief; and search and rescue;
� recovery (emergency services) — the results of strategies and services to returnagencies to a state of preparedness after emergency situations. Activities thatcontribute to outputs of emergency services recovery include: critical incidentstress debriefing; and salvage and restoration of the emergency site to a safestate; and
� recovery (community) — the results of strategies and services to support affectedcommunities in their reconstruction of physical infrastructure and restoration ofemotional, social, economic and physical wellbeing. Activities that contribute tooutputs of community recovery include: the restoration of essential services;counselling programs; temporary housing; long term medical care; and publichealth and safety information.

EMERGENCYMANAGEMENT
587
Effective prevention activities reduce the requirement to respond to, and recoverfrom, emergency events. Efficient resource use reduces the risk to the communityby supporting a greater availability of services. Greater emphasis is being placed onpreventative activities in every jurisdiction.
Descriptor information is also provided in this chapter and appendix A to assist inthe interpretation of reported performance.
11.4 Key performance indicator results — fire services
A performance indicator framework for fire services (figure 11.4) has beendeveloped from the framework described in figure 11.3. Definitions of all indicatorsare provided in table 11.7.
Performance information has been reported for a number of indicators. Theseresults may have been influenced by factors such as differences in climatic andweather conditions, the socio-demographic and topographic composition ofjurisdictions, property values and dwelling construction types. Appendix A containsdetailed statistics and short profiles on each State and Territory, which may assist ininterpreting the performance indicators presented in this chapter. Importantly,jurisdictions have diverse legislative fire protection requirements.
There has been some progress in the reporting of data, but the results need to betreated with care because data either were derived from small samples — as in thecase of the Australian Bureau of Statistics (ABS) Population Survey Monitor(PSM) — or are highly variable as a result of the relatively small populations inTasmania, the ACT and the NT. The role of volunteers, particularly for country andrural fire brigades, needs to be considered in the interpretation of indicators (forexample, fire expenditure per person). Specifically, volunteer staff provide asubstantial proportion of fire services (and emergency services more generally, ABS2001a). While costs such as training and equipment associated with volunteers areincluded in calculating the cost of fire service provision, the labour costs ofproviding fire services would be much greater without volunteers (assuming thesefunctions were still performed).
Further, information was not reported for all fire agencies in each jurisdiction. Ruralfire services are sometimes excluded from reported results. Partly for this reason,performance data are not always strictly comparable across jurisdictions. Fireservices are cooperating to improve and enhance the standards for the collection offire data. Differences in counting rules are expected to be minimised for futurereports.

588 REPORT ONGOVERNMENTSERVICES 2002
Figure 11.4 Performance indicators for fire services
INDICATORS
Effectiveness
PERFORMANCE
Median $ lossesfrom fire
Outcomes
Input to outputs
Efficiency
Prevention/mitigation
Preparedness
Response
Recovery
Outputs
Input to outcomes
Fire death rate
Fire injury rate
Total property lossesfrom fire
Fire incidents per100 000 persons
Level of safe firepractices in the
community
Proportion of residentialstructures with smoke
alarms
Proportion ofcommercial structures
with sprinklers
50th percentileresponse times
90th percentileresponse times
Containment room oforigin
To be determined
To be determined
Expenditure per person
To be determined
Text Provided on a comparable basis for this ReportText Information not complete or not strictly comparable
Text Yet to be developed or not collected for this Report
Key to indicators
Text Yet to be developed or not collected for this Report
In relation to time series comparisons, population data in several jurisdictions for1998-99, 1999-2000 and 2000-01 have been adjusted to reflect population coverageby fire services that have provided data in this Report. Thus, efficiency and someeffectiveness data for 1998-99, 1999-2000 and 2000-01 are not strictly comparablewith 1997-98 data.

EMERGENCYMANAGEMENT
589
Effectiveness
Outcomes
The indicators of outcomes reported here relate to the objective of fire services tominimise the effect of fire on life, property and the environment. The fire death rateand the fire injury rate are indicators of outcomes in terms of the effect of fire onlife. However, caution in interpreting data must be exercised, given the relativelysmall numbers of deaths and significant fluctuations from year to year, particularlyfor jurisdictions with relatively smaller populations.
The fire death rate in 2000-01 was highest in Tasmania (with 2.3 fire deathsper 100 000 persons) and lowest in the ACT and the NT (with no fire deaths)(figure 11.5). When data are expressed as a three year rolling average, theTasmanian rate was still highest (1.9 deaths per 100 000 persons) and the ACT ratewas lowest (with no deaths) (table 11A.4).
The definitions used to count fire deaths varied across jurisdictions. Fire deathsreported in some jurisdictions were verified by the respective State coroner’sfindings, while fire deaths in other jurisdictions were estimated by fire agencies.Future reports are expected to use more uniform reporting methods.
Figure 11.5 Fire death ratea, b, c
0
0.5
1
1.5
2
2.5
3
NSW Vic Qld WA SA Tas ACT NT Total
Dea
th/1
00 0
00 p
erso
ns
1998-99 1999-2000 2000-01
d e
a�The small number of deaths needs to be considered when interpreting fluctuations in the data. Fire deaths
relate to all fire exposures. b Figures for NSW, Victoria, Queensland, WA and Tasmania in 1999-2000 and2000-01 refer to total fires deaths and include deaths involving civilians and operational staff. c 1998-99figures have been validated by State coroners for NSW, Queensland, WA, Tasmania, the ACT and the NT.1999-2000 figures have been validated by State coroners for NSW, Queensland, WA, Tasmania, the ACT andthe NT. 2000-01 figures have been validated by State coroners for NSW and WA. d� Victorian data excludemurders and suicides where a fire subsequently occurred. e The ACT had no fire deaths between 1998-99and 2000-01.Source: State and Territory governments (unpublished); table 11A.4.

590 REPORT ONGOVERNMENTSERVICES 2002
Fire injuries data describe the number of hospital admissions (excluding emergencydepartment non-admitted casualties). Deaths from fire injuries after hospitalisationhave been removed from 1998-99 and 1999-2000 data because these are counted inthe fire death rate.
Nationally, the fire injury rate was 14.4 per 100 000 people in 1999-2000. Acrossjurisdictions, the rate was highest in the NT, with 59.9 fire injuries per100 000 people, and lowest in the ACT, with 7.4 per 100 000 people (figure 11.6).When data are expressed as a three year rolling average, the NT rate was stillhighest (31.9 fire injuries per 100 000 people) and the ACT rate was lowest (8.0 fireinjuries per 100 000 people) (table 11A.5).
The median dollar loss per structural fire and the total property loss from structuralfires are indicators of outcomes in terms of the effect of fire on property. Structuralfires are those fires contained in housing and other buildings. The data have notbeen adjusted for jurisdictional differences in the costs and values of various typesof building. Information for some jurisdictions includes only urban fire services, sothe results across jurisdictions are not strictly comparable. Further, the method ofvaluing property loss from fire varies across jurisdictions.
Figure 11.6 Fire injury ratea,b
0
10
20
30
40
50
60
70
NSW Vic Qld WA SA Tas ACT NT Total
Inju
ries/
100
000
pers
ons
1997-98 1998-99 1999-2000
a� Fire injuries are defined as the number of persons admitted to public and private hospitals. Excludes
emergency department non-admitted casualties. b All years data exclude fire deaths. The 2001 Reportincluded deaths in 1998-99 data. These data have been revised this year to exclude fire deaths. In addition tothe removal of fire deaths data, the Australian Institute of Health and Welfare (AIHW) revised the fire injuriesdata for 1998-99 subsequent to publication of its Australian Hospital Statistics, 1998-99 (AIHW 2000).Source: AIHW (unpublished); table 11A.5.
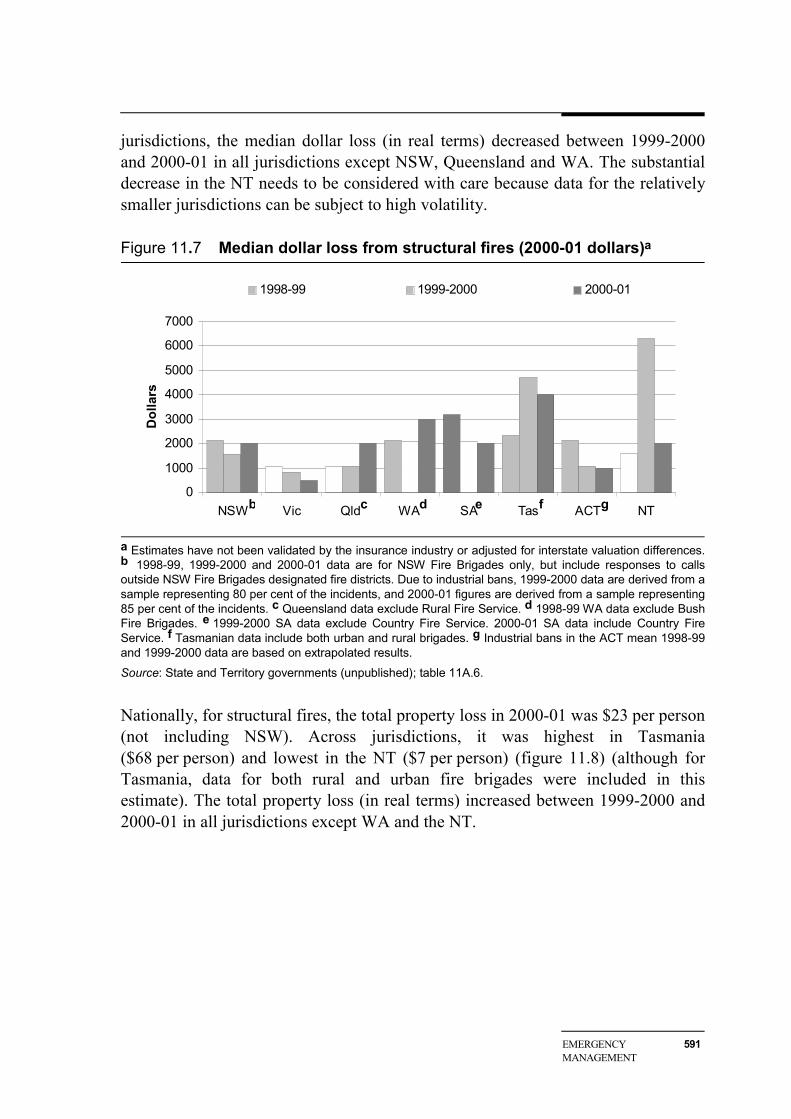
The median dollar loss in 2000-01 was highest in Tasmania ($4000 per structuralfire) and lowest in Victoria ($500 per structural fire) (figure 11.7). Across
EMERGENCYMANAGEMENT
591
jurisdictions, the median dollar loss (in real terms) decreased between 1999-2000and 2000-01 in all jurisdictions except NSW, Queensland and WA. The substantialdecrease in the NT needs to be considered with care because data for the relativelysmaller jurisdictions can be subject to high volatility.
Figure 11.7 Median dollar loss from structural fires (2000-01 dollars)a
0
1000
2000
3000
4000
5000
6000
7000
NSW Vic Qld WA SA Tas ACT NT
Dol
lars
1998-99 1999-2000 2000-01
b dc fe g
a Estimates have not been validated by the insurance industry or adjusted for interstate valuation differences.b� 1998-99, 1999-2000 and 2000-01 data are for NSW Fire Brigades only, but include responses to calls
outside NSW Fire Brigades designated fire districts. Due to industrial bans, 1999-2000 data are derived from asample representing 80 per cent of the incidents, and 2000-01 figures are derived from a sample representing85 per cent of the incidents. c Queensland data exclude Rural Fire Service. d 1998-99 WA data exclude BushFire Brigades. e 1999-2000 SA data exclude Country Fire Service. 2000-01 SA data include Country FireService. f Tasmanian data include both urban and rural brigades. g Industrial bans in the ACT mean 1998-99and 1999-2000 data are based on extrapolated results.Source: State and Territory governments (unpublished); table 11A.6.
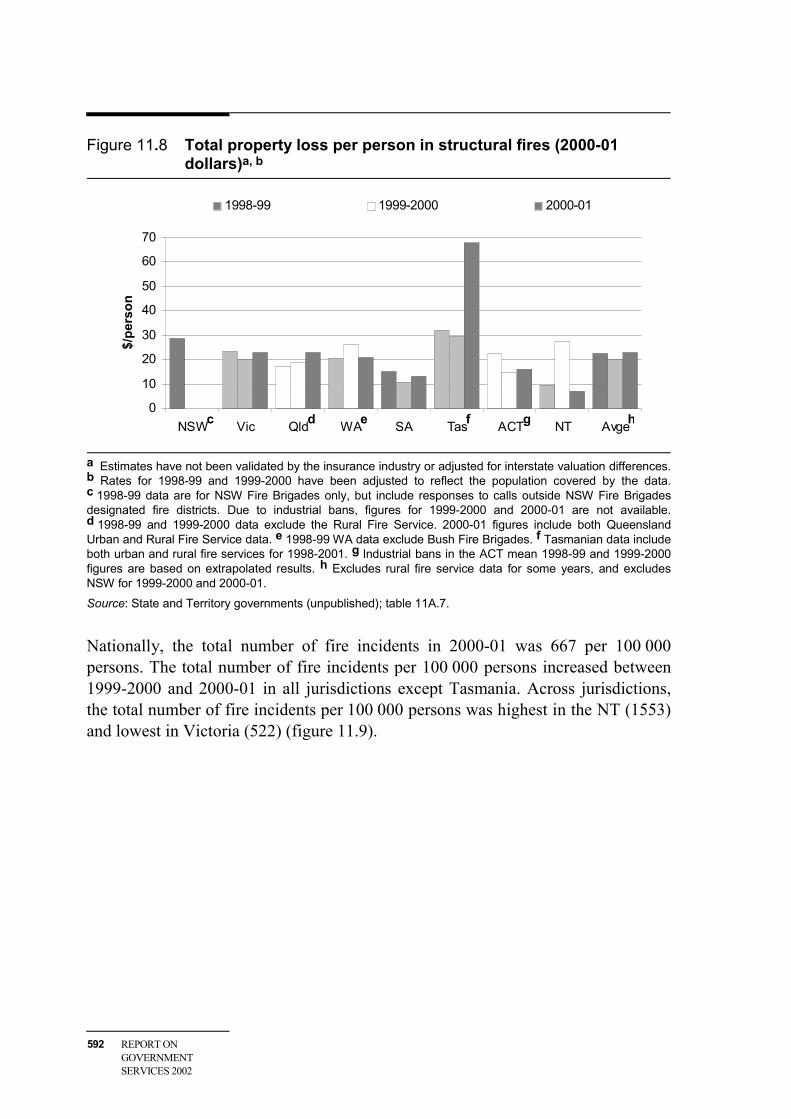
Nationally, for structural fires, the total property loss in 2000-01 was $23 per person(not including NSW). Across jurisdictions, it was highest in Tasmania($68 per person) and lowest in the NT ($7 per person) (figure 11.8) (although forTasmania, data for both rural and urban fire brigades were included in thisestimate). The total property loss (in real terms) increased between 1999-2000 and2000-01 in all jurisdictions except WA and the NT.
592 REPORT ONGOVERNMENTSERVICES 2002
Figure 11.8 Total property loss per person in structural fires (2000-01dollars)a, b
0
10
20
30
40
50
60
70
NSW Vic Qld WA SA Tas ACT NT Avge
$/pe
rson
1998-99 1999-2000 2000-01
c d e f g h
a� Estimates have not been validated by the insurance industry or adjusted for interstate valuation differences.
b Rates for 1998-99 and 1999-2000 have been adjusted to reflect the population covered by the data.c 1998-99 data are for NSW Fire Brigades only, but include responses to calls outside NSW Fire Brigadesdesignated fire districts. Due to industrial bans, figures for 1999-2000 and 2000-01 are not available.d 1998-99 and 1999-2000 data exclude the Rural Fire Service. 2000-01 figures include both QueenslandUrban and Rural Fire Service data. e 1998-99 WA data exclude Bush Fire Brigades. f Tasmanian data includeboth urban and rural fire services for 1998-2001. g Industrial bans in the ACT mean 1998-99 and 1999-2000figures are based on extrapolated results. h Excludes rural fire service data for some years, and excludesNSW for 1999-2000 and 2000-01.Source: State and Territory governments (unpublished); table 11A.7.
Nationally, the total number of fire incidents in 2000-01 was 667 per 100 000persons. The total number of fire incidents per 100 000 persons increased between1999-2000 and 2000-01 in all jurisdictions except Tasmania. Across jurisdictions,the total number of fire incidents per 100 000 persons was highest in the NT (1553)and lowest in Victoria (522) (figure 11.9).

EMERGENCYMANAGEMENT
593
Figure 11.9 Total fire incidents per 100 000 peoplea
0200400600800
10001200140016001800
NSW Vic Qld WA SA Tas ACT NT Avge
Fire
s/10
0 00
0 pe
ople
1998-99 1999-2000 2000-01
b c d e f g h
a �Population figures used to calculate the rates have been adjusted to represent population coverage by fire
agencies. b� 1998-99 data are for NSW Fire Brigades only, but include responses to calls outside NSW FireBrigades designated fire districts. 1999-2000 and 2000-01 data include both Rural Fire Service and NSW FireBrigades. Due to an industrial ban 1999-2000 and 2000-01 figures from NSW Fire Brigades are derived from asample representing 80 per cent and 85 per cent of the incidents respectively. Data for areas serviced by theNSW Rural Fire Service are derived from one third of Rural Fire Districts. c 1998-99 and 1999-2000Queensland data exclude the Rural Fire Service. 2000-01 figures include both Queensland Urban and RuralFire Service data. d WA 1998-99 data exclude Bush Fire Brigades. e Excludes SA Country Fire Service data.f Tasmanian data include urban and rural fire brigades. g Industrial bans in the ACT mean 1998-99 and1999-2000 data are based on extrapolated results. h Excludes the NT Bushfire Council, the WA Bush FireBrigades for 1998-99 and the SA Country Fire Service.Source: State and Territory governments (unpublished); table 11A.8.
Outputs
Prevention
Indicators of fire prevention focus on the level of fire safety practices in thecommunity. The ABS PSM supplied national level data on household fire safetymeasures installed or prevention procedures followed. These data were collected fornine quarters from November 1998 to November 2000 (providing data for 1998-99and 1999-2000). Data for the quarters before November 1999 were reportedpreviously. The precision of survey estimates depends on the survey sample sizeand the sample estimate. Larger sample sizes result in higher precision, whilesmaller sample sizes result in lower precision. Consequently, caution needs to beused when interpreting small differences in results because these may be due tosample size rather than an actual difference in the population (section 11.8).
Household fire safety measures include operational smoke alarms or detectors,sprinkler systems, safety switches, fire extinguishers, fire blankets, fire evacuation

594 REPORT ONGOVERNMENTSERVICES 2002
plans, external water supplies, the removal of external fuel sources, and externalsprinklers. Nationally, 89.4 per cent of total households had at least one fire safetymeasure installed for the four quarters from February 2000 to November 2000.Across jurisdictions, this proportion was highest in SA (98.7 per cent) and lowest inNSW (82.3 per cent). It increased across all jurisdictions except Victoria (whichremained the same) and Tasmania between the November 1999 to August 2000 andFebruary 2000 to November 2000 quarters. This change was minimal, however, andonce standard errors are considered, data indicate that there was no change acrossjurisdictions (figure 11.10).
Figure 11.10 Households with at least one fire safety measurea, b, c
0102030405060708090
100
NSW Vic Qld WA SA Tas ACT NT Aust
Per c
ent
Nov 1999 to Aug 2000 Feb 2000 to Nov 2000
a� Confidence intervals have been indicated on the bars in this figure. Small differences in the results should
be viewed with care as they may be affected by sample and estimate size (section 11A.8). b The total numberof households with at least one fire safety measure is smaller than the sum of the individual components (table11A.11) because a number of households have more than one fire safety measure installed or followed. cOnly the final quarter are new data because the PSM ceased. Three quarters already reported were repeatedwith the new data to preserve data integrity.Source: ABS (2001b); table 11A.9.
Nationally, of those households with a fire safety measure installed in the February2000 to November 2000 quarters, 72.0 per cent had a smoke alarm or detector,54.6 per cent had a safety switch or circuit breaker, and 24.3 per cent had a fireextinguisher (figure 11.11). The proportion of households with a fire safety measureincreased for smoke alarms/smoke detectors and safety switches/circuit breakersand decreased for fire extinguishers in the February 2000 and November 2000quarters (ABS 2001b). When standard errors are considered, however, thesedifferences are negligible. Data for the remaining safety measures were notavailable for the November 2000 quarter (table 11A.10).

EMERGENCYMANAGEMENT
595
Figure 11.11 Households with a fire safety measure, by fire safety measureinstalled or followeda, b, c
01020304050607080
Per c
ent
Nov 1999 to Aug 2000 Feb 2000 to Nov 2000
a Confidence intervals have been indicated on the bars in this figure. Small differences in the results shouldbe viewed with care as they may be affected by sample and estimate size (section 11.8). b The total numberof households with at least one fire safety measure is smaller than the sum of the individual componentsbecause a number of households have more than one fire safety measure installed or followed. c Only thefinal quarter are new data because the PSM ceased. Three quarters already reported were repeated with thenew data to preserve data integrity.Source: ABS (2001b); table 11A.10.
Preparedness
Preparedness relates to both the community and the fire service. Indicators used forthe preparedness of the community are reported as the level of community trainingin fire responsiveness, and the installation of fire safety equipment. Thepreparedness of the fire service relates to its level of contingent capacity (includingthe competency of personnel and the appropriateness of equipment) and thematching of resources with potential risks. Fire services also need to allow forseasonal influences (in drought years, for example) and population variations (inholiday destinations, for example).
This chapter focuses on the level of preparedness of the community in terms of theproportion of residential buildings and commercial buildings with fire safetyequipment and systems. The ABS PSM supplied national level data on theproportion of household dwellings with fire safety equipment for nine quarters fromNovember 1998 to November 2000. These data provide information on thepreparation of residential buildings only. It should be noted that there are diverselegislative fire protection requirements across jurisdictions.

596 REPORT ONGOVERNMENTSERVICES 2002
In the February 2000 to November 2000 quarters, the proportion of households withan operational smoke alarm or smoke detector was highest in Victoria and SA(both 95.0 per cent) and lowest in the NT (40.0 per cent) (figure 11.12).
Figure 11.12 Households with an operational smoke alarm or smoke detectorinstalleda, b, c
0
20
40
60
80
100
NSW Vic Qld WA SA Tas ACT NT Aust
Per c
ent
Nov 1999 to Aug 2000 Feb 2000 to Nov 2000
a Confidence intervals have been indicated on the bars in this figure. Caution needs to be used where thereare small differences in the results, which are affected by sample and estimate size (section 11.8). b The totalnumber of households with at least one fire safety measure is smaller than the sum of the individualcomponents because a number of households have more than one fire safety measure installed or followed.c Only the final quarter are new data because the PSM ceased. Three quarters already reported wererepeated with the new data to preserve data integrity.Source: ABS (2001b); table 11A.11.
Response
Response times and containment of structural fires (to the object or room of origin)are indicators of the effectiveness of fire services in terms of their ability to respondto and suppress fires. Response times to structural fires are reported first, followedby containment of structural fires to the object/room of origin.
The response time is defined as the interval between the receipt of the call at thedispatch centre and the arrival of the vehicle at the scene (that is, when the vehicleis stationary and the handbrake is applied). This and other intervals are illustrated infigure 11.13. Response times are provided on a jurisdictional basis, so they are notagency specific (which is consistent with information provided for other indicatorsin this chapter).

EMERGENCYMANAGEMENT
597
Figure 11.13 Response time points and indicators
Receivecall oralarm
Dispatchfire crew
Mobilisefire
appliance
Arrive atscene
Get fireundercontrol
Departscene
Call processing time
Turnout timeResponse time
Travel time
Incident duration
Control time
The information provided is for response times to structural fires. The resultsindicate the performance of only the agency (or agencies) reported, not necessarilyof all fire services within each jurisdiction. Response time data need to be viewedwith care because performance is not strictly comparable across jurisdictions, giventhat:
� response time data for some jurisdictions represent responses to urban, rural andremote areas;
� responses may include career firefighters, auxiliary/part time firefighters andvolunteers;
� response times can be affected by the dispersion of the population; and
� definitions on response times vary across jurisdictions (that is, the agreeddefinition for the Review is not always applied).
The 50th percentile response time refers to the time within which 50 per cent of thefirst responding fire resources arrived at the scenes. The 50th percentile responsetime in 2000-01 was highest in Tasmania (7.2 minutes) and lowest in Victoria andthe NT (5.3 minutes) (figure 11.14).
The 90th percentile response time refers to the time within which 90 per cent of thefirst responding fire resources arrived at the scenes. The 90th percentile responsetime in 2000-01 was highest in Queensland (13.2 minutes) and lowest in Victoria(8.3 minutes). Response time data for Victoria, however, are not yet strictlycomparable (figure 11.14).

598 REPORT ONGOVERNMENTSERVICES 2002
Figure 11.14 Response times to structural firesa
50th percentile
0123456789
NSW Vic Qld WA SA Tas ACT NT
Min
utes
1998-99 1999-2000 2000-01
b, c d b be b, gf
90th percentile
02468
1012141618
NSW Vic Qld WA SA Tas ACT NT
Min
utes
1998-99 1999-00 2000-01
b, c d b be b, gf
a�Definitions of response times may vary from jurisdiction to jurisdiction. Also, some agencies use a manual
system to calculate response time figures while other services retrieve the data from computer aided dispatchsystems. b In NSW, Queensland, SA and the ACT, data for 1998-99 have been revised by including structuralfires only, to maintain comparability with 1999-2000 and 2000-01 data. Excludes the Queensland Rural FireService for all years and SA Country Fire Service prior to 2000-01.� c Data are for NSW Fire Brigades only,but include responses to calls outside NSW Fire Brigades’ designated fire districts. Due to an industrial ban1999-2000 data are derived from a sample representing 80 per cent of the incidents, and 2000-01 figures arederived from a sample representing 85 per cent of the incidents. d Victorian data for 1998-99 have beenamended by including structural fires only, to maintain comparability with 1999-2000 and 2000-01 data.Victorian data are not uniformly consistent with the definition in the Review’s data dictionary used by otherjurisdictions. e� WA 1998-99 data exclude Bush Fire Brigades. f Tasmanian 2000-01 data exclude Rural FireBrigades. g Industrial bans in the ACT mean 1998-99 and 1999-2000 data are based on extrapolated results.Source: State and Territory governments (unpublished); table 11A.12.
Another indicator of response effectiveness is the proportion of structural firescontained to the object or room of origin. The proportion of fires contained to theobject or room of origin in 2000-01 was highest in Victoria (90.0 per cent) andlowest in the NT (65.0 per cent) (figure 11.15).

EMERGENCYMANAGEMENT
599
Recovery
Recovery refers to the effectiveness of fire service strategies in both returningagencies to a state of preparedness after emergency situations, and supportingcommunities in their reconstruction of physical infrastructure and restoration ofemotional, social, economic and physical wellbeing. These strategies include therestoration of essential services, counselling programs, temporary housing,long-term medical care, and public health and safety information. Indicators ofeffectiveness in terms of recovery are yet to be developed.
Figure 11.15 Structural fires contained to the object/room of origin
0102030405060708090
100
NSW Vic Qld WA SA Tas ACT NT Avge
Per c
ent
1998-99 1999-2000 2000-01
a b c cd ge f
a 1998-2001 data are for NSW Fire Brigades only, but include responses to calls outside NSW Fire Brigades’designated fire districts. Due to an industrial ban 1999-2000 data are derived from a sample representing80 per cent of the incidents, and 2000-01 data are derived from a sample representing 85 per cent of theincidents. b
� Victorian data include the Metropolitan Fire and Emergency Services Board and exclude theCountry Fire Authority. c Excludes the Queensland Rural Fire Service and SA Country Fire Servicerespectively. d WA 1998-99 data exclude Bush Fire Brigades. e Tasmanian 2000-01 data exclude Rural FireBrigades. f Industrial bans in the ACT mean 1998-99 and 1999-2000 data are based on extrapolated results.g Average excludes rural fire services for some years.Source: State and Territory governments (unpublished); table 11A.13.
Efficiency
Efficiency indicators report on the unit cost of service delivery. Calculation of unitcosts requires the specification of outputs. For fire services, this is a difficult task,given the diversity of activities undertaken. The fire sector has considered a rangeof options for specified outputs. Expenditure per person is employed as a proxy forefficiency. Expenditure per fire is not used as a proxy for fire services efficiencybecause a fire service that devotes more resources to the prevention andpreparedness components to reduce the number of fire incidents could erroneouslyappear to be less efficient.

600 REPORT ONGOVERNMENTSERVICES 2002
The indicator of efficiency for fire services is the level of inputs per person in thepopulation. The quality of unit cost data has improved following reporting of theuser cost of capital. The data are not fully comparable because there are differencesin the reporting of payroll tax and asset related costs.
Expenditure is reported as both the total cost (total expenditure) and net cost(expenditure less non-government revenue) to government of fire services. Totalexpenditure is a measure of efficiency for fire services, and net cost is a measure ofthe cost to government. Both were reported in the 2001 Report and are reportedagain this year because non-government revenue is significant for a number ofjurisdictions. Nationally, the net cost to government per person in 2000-01 was$17.40, ranging across jurisdictions from $85.30 per person in the NT to$0.40 per person in SA (figure 11.16).
Figure 11.16 Fire expenditure less indirect government and non-governmentrevenue, and total expenditure, 2000-01a
0102030405060708090
100
NSW Vic Qld WA SA Tas ACT NT Total
$/pe
r per
son
Expenditure less indirect government and non-government revenue Total expenditure
b dc
a Revenue from indirect government and non-government sources includes levies on insurance companiesand property owners, user charges, fundraising and donations and indirect revenue. b 2000-01 was the firstyear of funding for a special resources initiative in Victoria. c Excludes adjustment for payroll tax exemptstatus in the ACT. d NT data exclude depreciation.Source: State and Territory governments (unpublished); table 11A.15.
11.5 Key performance indicator results — ambulanceservices (pre-hospital care, treatment and transportservices)
An indicator framework for ambulance services (pre-hospital care, treatment andtransport services) (figure 11.17) has also been developed from the generic

EMERGENCYMANAGEMENT
601
framework for all emergency services. Performance has been reported for a numberof indicators, but different delivery contexts, locations and types of client mayaffect these indicators. Appendix A contains detailed statistics and short profiles oneach State and Territory, which may assist in interpreting the performanceindicators presented in this section.
Figure 11.17 Performance indicators for ambulance services (pre-hospitalcare, treatment and transport services)
INDICATORS
Effectiveness
PERFORMANCE
Key to indicators
Proportion of emergencycases which receive a
paramedic level ofresponse
50th percentile and90th percentileresponse times
Level of patientsatisfaction
Outcomes
Input to outputs
Efficiency
Preparedness
Response
Recovery
Outputs
Input to outcomes
To be determined
To be determined
Unit cost
Expenditure per urgentand non-urgent
response
Expenditure per person
Prevention/mitigation
Survival rate fromout-of-hospitalcardiac arrest
Text
Text Information not complete or not strictly comparable
Text Yet to be developed or not collected for this Report
Provided on a comparable basis for this Report
Effectiveness
Outcomes
The survival rate from out-of-hospital cardiac arrest is a measure of the outcomesachieved by ambulance services. Reporting against this indicator is improved thisyear, with four jurisdictions (compared with two in the 2001 Report) able to providethese data: Victoria, Queensland, WA and the ACT (table 11A.19). The highestsurvival rate from out-of-hospital cardiac arrest in 2000-01 was in the ACT(19.7 per cent) and the lowest rate was in WA (1.9 per cent). The ACT data are notstrictly comparable with data from other jurisdictions because the ACT provided a

602 REPORT ONGOVERNMENTSERVICES 2002
six year moving average to December 2000 to overcome the potential error from theACT’s small population.
Outputs
Prevention
Prevention focuses on the extent to which community education programs improvethe health and safety in the community — for example, the effectiveness of first aidtraining courses. The role of ambulance services in the prevention of medicalemergencies differs across jurisdictions, so indicators of effectiveness in terms ofprevention are yet to be developed.
Preparedness
The ability of ambulance services to dispatch staff with a paramedic level oftraining quickly to a medical emergency requiring such a level of response is anindicator of their preparedness for such emergencies. No data are yet available forthis indicator.
Response
The response time is defined as the time taken between the initial receipt of the callfor an emergency ambulance to the ambulance’s arrival at the scene of theemergency (figure 11.18).
Figure 11.18 Response time points and indicators
Receivecall
Dispatchambulance
Mobiliseambulance
Arrive atscene
Departscene
Arrive atmedical
care
Activation timeTurnout timeResponse time
Travel timeTransport
time
Clear case
Total case time
Treatmenttime
Hospital turnaround time

EMERGENCYMANAGEMENT
603
Emergency responses are categorised by an assessment of the severity of themedical problem. These categories are:
� code I — responses to potentially life threatening situations using warningdevices; and
� code II — responses to acutely ill patients (not in life threatening situations)where attendance is necessary but no warning devices are used.
The level of responsiveness is reported as the times during which 50 per cent and90 per cent of first responding ambulance resources actually respond in code Isituations (figure 11.19). Information is also reported on the national level of patientsatisfaction and the national level of community satisfaction.
In 2000-01, the 50th percentile response time — the time within which 50 per centof first ambulance resources actually responded — was highest in NSW andTasmania (10 minutes) and lowest in the ACT (7 minutes). The 90th percentileresponse time in 2001 was highest in NSW and Tasmania (21 minutes) and lowestin the ACT (12 minutes) (figure 11.19).

604 REPORT ONGOVERNMENTSERVICES 2002
Figure 11.19 Ambulance response times
50th percentile
0
5
10
15
20
25
30
NSW Vic Qld WA SA Tas ACT NT
min
utes
1998-99 1999-2000 2000-01
a b c d
90th percentile
05
101520253035404550
NSW Vic Qld WA SA Tas ACT NT
min
utes
1998-99 1999-2000 2000-01
a b c d
a NSW does not triage emergency calls. Results for code 1 cases represent ‘000’ and urgent medicalincidents. b 1998-99 Victorian data include Metropolitan Ambulance Service only. Therefore, response timedata for that year are not strictly comparable across jurisdictions. 1999-2000 and 2000-01 Victorian data arejurisdiction wide. Response times are estimated. Data are incomplete due to industrial action. c QueenslandAmbulance Service responded to 91.4 per cent of all urgent cases in less than or equal to 16 minutes. d NTdata were not available for 1998-99 and 2000-01.Source: State and Territory governments (unpublished); table 11A.20.
The performance of ambulance services in providing response services can bemeasured in terms of the satisfaction of those persons who did (figure 11.20) anddid not directly use the service (table 11A.22).

EMERGENCYMANAGEMENT
605
Figure 11.20 Satisfaction with ambulance services, persons who had usedan ambulance service in the last 12 monthsa, b, c
Nov 1999 to Aug 2000
0102030405060708090
100
NSW Vic Qld WA SA Tas ACT NT Total
Per c
ent
Very satisfied Satisfied Other
Feb 2000 to Nov 2000
0102030405060708090
100
NSW Vic Qld WA SA Tas ACT NT Total
Per c
ent
Very satisfied Satisfied Other
a� Data are obtained quarterly for persons aged 18 years and over. b Small differences in the results should
be viewed with care as they may be affected by sample and estimate size (see section 11.8). c Only the finalquarter is new data because the PSM ceased. Three quarters already reported were repeated with the newdata to preserve data integrity.Source: ABS (2001b); table 11A.21.
Nationally, 5 per cent of the population surveyed in the February 2000 to November2000 quarters had used an ambulance in the previous 12 months (ABS 2001b). Theproportion of persons who were either satisfied or very satisfied with ambulanceservices was higher in all jurisdictions for those who had used an ambulance servicein the previous 12 months (94.0 per cent) compared with those who had not(71.7 per cent) (table 11A.21 and 11A.22). There was little difference within

606 REPORT ONGOVERNMENTSERVICES 2002
jurisdictions in the proportion of persons who had used an ambulance service whowere either very satisfied or satisfied from February 2000 to November 2000quarters (figure 11.20).
Across jurisdictions, the proportion of ambulance users who were either verysatisfied or satisfied increased in Tasmania and the NT, decreased in NSW, Victoriaand WA and remained constant in Queensland and SA between the 10 monthsending August 2000 and November 2000 respectively. The proportion of ambulanceusers who were either very satisfied or satisfied was highest in SA (95.8 per cent),and lowest in Victoria (90.8 per cent) (table 11A.21).
There was no change in the satisfaction level of those who had not used anambulance service in the 10 months ending August 2000 to November 2000,nationally (remaining at 72 per cent) (ABS 2001b). Across jurisdictions, theproportion of people who had not used ambulance services who were either verysatisfied or satisfied was highest in Queensland (79.8 per cent) and lowest inthe ACT (67.7 per cent). There was minimal change within jurisdictions betweenthe 10 months ending August 2000 and November 2000 respectively(table 11A.22).
Recovery
Indicators of effectiveness expressed in terms of recovery are yet to be developed.
Efficiency
The main efficiency indicator is ambulance expenditure per person. As with fireservices, the quality of unit cost data provided by ambulance services has improvedfollowing the reporting of the user cost of capital and payroll tax. The data are stillnot fully comparable, however, because there are differences in payroll tax exemptstatus and geography. Expenditure per urgent and non-urgent response will bepresented in future reports.
Expenditure is reported as both the total cost (total expenditure) and net cost(expenditure less indirect government and non-government revenue) to governmentof ambulance services. Total expenditure is a more appropriate measure ofefficiency for ambulance services, given that non-government revenue is significantfor a number of jurisdictions.
Nationally, ambulance expenditure less indirect government and non-governmentrevenue per person was $30 in 2000-01. Across jurisdictions, Tasmania had thehighest ($40 per person) and WA had the lowest ($8 per person) (figure 11.21).

EMERGENCYMANAGEMENT
607
Care needs to be taken when comparing data across jurisdictions, because there aredifferences in the reporting of a range of cost items (including payroll tax and theuser cost of capital) as well as funding arrangements (funding policies and taxingregimes). Some jurisdictions, for example, have a greater proportion of governmentfunds than that of other jurisdictions.
Figure 11.21 Ambulance expenditure less indirect government andnon-government revenue, and total expenditure, 2000-01a
0
10
20
30
40
50
60
70
NSW Vic Qld WA SA Tas ACT NT Total
$/pe
rson
Expenditure less indirect government and non-government revenue Total expenditure
b c
a �Indirect government and non-government revenue includes subscription fees, transport fees, donations and
indirect revenue. b Excludes expenditure on administration of the ambulance subscription scheme, hospitalbased transport services, independent ambulance services, first aid training and clinic transport services. c NTdata are not available.Source: State and Territory governments (unpublished); table 11A.24.
11.6 Future directions in performance reporting
A number of developments are under way to improve data quality andcomparability in the chapter for future reports. A priority for the Review is toimprove reporting on services to Indigenous Australians. No data are currentlyavailable because Indigenous people are generally not identified for data collectionpurposes. At least one jurisdiction advises that there are developments inIndigenous reporting, which if expanded nationally, may lead to data possibilitiesfor future reports in the long term.
The Survey of Emergency Management Activities outlined in the profile identifiedthe agencies involved in various event-type services. Road accident rescue has beenselected as the next event-type service to report, and a subgroup formed this yearcommenced work on development of a performance indicator framework.

608 REPORT ONGOVERNMENTSERVICES 2002
Data for the new road accident rescues framework are expected to be presented inthe 2003 Report. The development of detailed indicators and data collection will bean iterative process extending over several years.
The survey also identified that land management agencies should be included in theReport to improve the coverage of data for fires. It is expected that some data forlandscape fires may be available for future reports. Other types of event-typeservice for which performance reporting have yet to be developed include: rescues(other than road accident); natural events; technological and hazardous materialincidents; emergency relief and recovery; and quarantine and disease control.
Improving the comparability and accuracy of response times data is also a priorityfor the Review. Descriptive performance indicators for fire and ambulance servicesare being improved with the assistance of the Australasian Fire Authorities Counciland the Convention of Ambulance Authorities. In particular, these twoorganisations, under the auspices of the Review, are separately investigatingmethods for disaggregating response times data to account for geographic and otherfactors that may differ across jurisdictions. The Convention of AmbulanceAuthorities expects to conduct a pilot test in 2002, applying theAccessibility/Remoteness Index of Australia geographic classification to responsetime data for ambulance services.
Further, as outlined in the key performance indicator sections, the PSM is no longerpart of the ABS collection. It is envisaged that jurisdictions will be responsible forcollecting similar data on fire safety measures and ambulance services patientsatisfaction. Instruments and arrangements to collect these data are at thedevelopmental stage. Some data are expected to be available for the 2003 Report;these data will be less comparable than the PSM collection (because they will not becollected nationally for fire at least), although more meaningful.
Financial data are expected to improve in future reports. A subgroup has beenformed this year to work on financial data issues, including cost allocation acrossevent-type services, the impact of different leasing arrangements on asset valuationsand expenses, the comparability of the treatment of assets and implications of newAustralian accounting standards relating to asset measurement techniques.
The possibility of reporting an indicator for drug overdoses has been discussed.While data in this area are not collected, this issue is on the agenda for investigationduring 2002, which may lead to reporting on drug overdoses in the ambulanceservices key performance indicators section in future reports.

EMERGENCYMANAGEMENT
609
11.7 Jurisdictions’ comments
This section provides comments from each jurisdiction on the services covered inthis chapter and attachment 11A on the CD-ROM. Appendix A contains detailedstatistics and short profiles on each State and Territory, which may assist ininterpreting the performance indicators presented in this chapter. The informationcovers aspects such as age profile, geographic distribution of the population, incomelevels, education levels, tenure of dwellings and cultural heritage (such asIndigenous and ethnic status).

610 REPORT ONGOVERNMENTSERVICES 2002
New South Wales Government comments
“ The NSW Government recognises the value of performance information toenhance service delivery and for planning and policy development to build asafer, confident community. This information is also used in demonstrating to thecommunity that emergency services are delivering the best possible servicesand value. It should be noted however, that the chapter reports only on a subsetof the functions of the total emergency management sector in NSW. The role ofemergency services in the multi-agency planning and operations that helpeddeliver the successful Sydney 2000 Olympic and Paralympic Games forexample, is not reported in the chapter.
Some caution is necessary with the interpretation of data. NSW recognises thatproblems with data consistency and comparability still exist and that more workis required in some areas. To this end, NSW emergency services continue toinvest in programs through the Convention of Ambulance Authorities and theAustralasian Fire Authorities Council in improving performance reporting anddata quality.
Fire and Ambulance Services in NSW face similar policy developments aimed atimproving service delivery and the value of emergency services. The mostsignificant developments have been:
� the construction of additional fire and ambulance stations, and the upgradingof firefighting and ambulance vehicle fleets,
� changes to management structures to accommodate the increasinglycomplex and changing social, economic and physical environments in orderto manage risks and develop, implement and monitor community riskmanagement programs,
� engaging the community through collaborative and partnership models indeveloping service delivery policy and community safety and riskmanagement programs, and
� using information and community advice to evaluate and improve servicedelivery.
The year 2001 also provided emergency services the opportunity to recognisethe value of volunteers to service delivery. Volunteers come from a wide rangeof backgrounds and their motivation for joining emergency services range from aneed to protect their properties to a desire to serve the community. Thesebackgrounds reflect the demographics of the communities they serve.Volunteers have a strong connection with and understanding of their localcommunities, and have a depth of local knowledge of the threat of fire and otheremergencies and the way in which they can be managed. Volunteers, like othermembers of the community, are increasingly facing more challenging and busierprofessional and private lives. This impacts on their availability, a challenge thatemergency services are addressing by implementing a range of systems andsupport services. ”

EMERGENCYMANAGEMENT
611
Victorian Government comments
“ Victorian emergency services continue to deliver effective and efficient servicesto the community. In keeping with its commitment to ensure consistent service tothe community and maximum resource sharing, the Office of the EmergencyServices Commissioner initiated a process for developing a Model of Fire Coverfor Victoria. This model will provide a long term planning framework for equitablefire cover and enhanced and relevant performance measurement. TheGovernment continues to emphasise prevention/preparedness and partnershipprograms, through initiatives such as householder bushfire safety campaigns,the MFESB's (Metropolitan Fire and Emergency Services Board) OperationHome Safe and partnerships such as the formation of forestry industry firebrigades. In recognition of the value and contribution of its volunteer-basedservice, the Government introduced the first year of Special Resources Initiativefunding, strategically targeted towards ensuring CFA (Country Fire Authority)brigades are trained, equipped and supported to professional standards. Duringthe year 12 827 volunteers commenced the Minimum Skills program. Skillsmaintenance and development are also important issues for the professionalfirefighters in the State.
The introduction of simultaneous dispatch of ambulance and suitably trained andequipped MFESB fire units in Melbourne’s Emergency Medical Response pilotprogram has improved response times to cases of suspected cardiac arrest. Thecompletion of a 26 per cent expansion of Metropolitan emergency ambulanceservices has also improved response time performance, particularly in outermetropolitan areas. In addition, 31 000 people were trained to administer CPRthrough the free ‘Learn CPR — the Key to Survival’ initiative. All ambulanceparamedics commenced training in advanced life support skills.
In a continuing Government initiative with benefits of particular importance toVictorians living in rural and regional areas, Air Ambulance has significantlyenhanced its transport capability. A new state-of-the-art ambulance helicopterservice began operating in Bendigo with the two existing air ambulancehelicopter services scheduled to be upgraded to ‘Category A’ by December 2001and arrangements were made with private helicopter operators to provide back-up craft when necessary. In addition, four old Cessna Titan aircraft werereplaced with new pressurised King Air planes. Other initiatives to improveambulance services in regional and rural Victoria included the establishment ofnew professional branches, the extension of two-officer crewing and theprovision of 24 hour intensive care paramedics in provincial cities.
Contract execution occurred for the implementation of electronic data capture inthe field through the Victorian Ambulance Clinical Information System. Thesystem will offer unprecedented opportunities for pre-hospital research and willprovide a comprehensive picture of the profile of ambulance patients and thelevel of paramedic intervention. ”

612 REPORT ONGOVERNMENTSERVICES 2002
Queensland Government comments
“ The past year has been one of continuing developments in the EmergencyServices Portfolio in Queensland with continued progress towards achieving keycorporate outcomes and objectives, which directly contribute to the QueenslandGovernment’s policy priorities.
Queensland has, in a single portfolio, skills in all aspects of emergencymanagement — from prevention and preparation activities to response andrecovery. Most uniquely Queensland has these skills in the areas of ambulance,fire, search, rescue, disaster management and mitigation, and hazardousmaterials. This combination of skills allows us to provide and improveemergency services to the community in an integrated and holistic way.
A key priority for the emergency services within Queensland has been to raiseawareness across all levels of government of our broad role in ensuring thesafety of the community in areas such as injury prevention, home based safetyprograms and disaster mitigation and planning.
The Dangerous Goods Safety Management Act 2001 was passed in May 2001.This legislation covers the storage and handling of dangerous goods, and theoperation of high risk major hazard facilities, and mandates specific public safetyrequirements.
In response to the tragic fire in the Childers backpacker hostel last year, a multi-agency Building Fire Safety Taskforce was established. A Regulatory ImpactStatement providing options for improvement of fire safety in budgetaccommodation has been released for public comment, and responses havebeen incorporated into legislative reforms aimed at improved building fire safetystandards.
QAS (Queensland Ambulance Service) successfully commissioned its ComputerAided Dispatch and Automatic Vehicle Location technologies which, along withprocedural changes, have dramatically improved ambulance response times,with 70 per cent of the most urgent cases being attended to in 10 minutes orless. Ninety-one per cent of cases are responded to within 16 minutes.
QFRA (Queensland Fire and Rescue Authority) were successful in maintainingtheir emergency response times for full-time permanent stations and were ableto reach 93 per cent of incidences within 14 minutes.
Our International Year of Volunteers (IYV) program has significantly increasedcommunity recognition of our volunteers and their vital contribution to publicsafety and community support.
As we move forward our focus will remain on providing the best possibleservices to our diverse and geographically spread community. Our key areas ofaction will be on enhancing community safety and prevention, enhancing servicedelivery, continuing to develop and support our staff and volunteers, disastermitigation enhancements and establishing emergency management on thestrategic policy mainstream of Government. ”

EMERGENCYMANAGEMENT
613
Western Australian Government comments
“ The Fire and Emergency Services Authority (FESA) and St John AmbulanceAustralia (WA) Inc. have been actively participating in the development ofimproved nationally comparable performance data for emergency management,including the review of performance measures which commenced in 2001.1
As these agencies cover all key emergency services areas in Western Australia,the proposed introduction of data from additional sources (for example, relatingto rescues, and other human and natural hazard events) is welcomed.
A number of challenges continue to influence the provision of emergencyservices throughout the State (some of which may encroach on the ability toprovide comparative performance information). Many relate to the State’s hugeland mass and sparse, widely dispersed rural/remote population; for example,WA is the largest area in the world covered by a single ambulance service.
Metropolitan ambulance services are provided almost entirely using paidambulance officers and paramedics. In the country, however, the figure is lessthan 10 per cent. The remaining services are provided entirely by more than3 500 volunteers who contribute over 3 000 000 hours of service annually.Despite this unique challenge, St John Ambulance provides services with a totalcost per capita equal to the ACT and significantly less than any other State.
Associated issues for FESA include providing adequate levels of service in linewith different demand profiles and (often low) economies of scale, the relianceon volunteers, and potentially lengthy response times in rural/remote areas. TheState’s size and resultant climatic variability also means that numerous hazards(for example, bush fires, flooding) need to be addressed on a year-round basis.
Other issues include substantial population and industrial growth in the Perthmetropolitan area and the State’s south west (in contrast to other regions),continuing advancements in the coordination and collocation of services, and anincreasing focus on prevention services.
During the year, FESA began working towards community centred emergencymanagement. This strategic intention seeks to heighten local communityinvolvement in prevention programs, and assist communities to become moreself-reliant and better prepared in case of emergencies. One particular focus ison increasing the capacity of remote indigenous communities to minimise theimpact of hazards, including fires, floods and cyclones.1 St John Ambulance is a non-profit incorporated association that provides the ambulanceservice in WA under contract with the State Health Department. FESA is a statutory authoritysupporting more than 830 career firefighters and 2500 volunteer firefighters (Fire and RescueService), 17 900 volunteer firefighters (Bush Fire Brigades) as well as around 2500 StateEmergency Service volunteers and 2400 Volunteer Marine Rescue Services volunteers. ”
614 REPORT ONGOVERNMENTSERVICES 2002
South Australian Government Comments
“ The South Australian Government has committed to the following strategicpriorities for emergency services to better achieve outcomes in Public Safety:
� Introducing a funding system that is equitable, transparent, accountable andintegrated with strategic and risk based management;
� Revising structural and governance arrangements to deliver services moreeffectively and efficiently;
� Increasing support for voluntarism and regional communities;� Collocating emergency services for integrated service delivery;� Introducing a strategic framework for resource management;� Adopting a strategic approach to providing emergency services;� Achieving more cost effective delivery of emergency services; and� Improving telecommunications for emergency services and Police.
The strategic reform agenda has delivered:
� The Community Emergency Services Fund (CESF), collected from levies onmobile and fixed property;
� The Emergency Services Administrative Unit (ESAU) to provide strategic andsupport services to the SAMFS (SA Metropolitan Fire Service), CFS (CountryFire Service) and SES (State Emergency Service) and strategic advice to theCESF, which directly advises the Minister on the allocation of funding;
� A Strategic Directions Framework for all emergency services to provide acontext for agency planning and performance measurement;
� Enhanced processes for Emergency Risk Management; and� The Metropolitan Transfer Service to enable more efficient matching of
clinical resources to medical casetypes, thus enhancing the efficiency ofSAAS.
SA Ambulance Service (SAAS) is a stand-alone agency that is not funded by theCESF, except for its rescue activity. SAAS continues to work closely with theother emergency agencies to ensure effective management of incidents. SAASpursues co-location with these Services wherever feasible, conducts and is partyto, state disaster planning and regular exercises involving all emergencyagencies and is heavily involved in a number of multi-agency projects.
Major emergency management initiatives for 2001-02 include:
� Collaboratively developing Emergency Services Resourcing Standards foroptimal resource allocation planning and management;
� Finalising, in conjunction with the Minister for Emergency Services and StJohn Priory, the withdrawal of St John from SAAS;
� Developing and implementing a new incident response system to enablebetter matching of clinical resources to pre-hospital medical cases; and
� Reviewing the country ambulance service to improve the delivery ofambulance services in country SA. ”

EMERGENCYMANAGEMENT
615
Tasmanian Government comments
“ Tasmania has a number of key issues which impact on the provision of both fireand ambulance services throughout the State. These issues include:• the small population and subsequent lack of economies of scale;• the widely dispersed population which affects fire and ambulance response
times. At 59.1 per cent, Tasmania has the largest proportion of ruralpopulation of all jurisdictions;
• the reliance on volunteers in rural and remote areas affecting turnout times;and
• the State’s rugged topography which impacts on response times andinfrastructure costs (for example, the radio system).
Fire ServicesTasmania Fire Service (TFS) is comprised of four career brigades and 235volunteer brigades that respond to fires in all metropolitan and rural areas. Allincidents attended by TFS brigades are reported on, and the TFS bears the fullcost of funding both the operating and capital costs of these brigades.The 2000-01 fire season was exceptionally busy for the second year in a rowand included some extended incidents due to an usually dry summer. Theseconditions contributed to the TFS attending more than twice the number of bushand scrub fires for consecutive years in comparison to 1998-99 levels.TFS continued its commitment to the other key responsibility of fire preventionand the fostering of greater fire safety in the community. TFS has identifiedthose in the community who are most at risk from fire and has established abroad range of programs to assist these people to prevent fires and minimise theimpact of fires when they occur. Figures suggest fire prevention programs arehelping to reduce property fires with the number of property fires in 2000-01dropping significantly after being relatively static for the past seven years.Ambulance Services
Tasmania is the only State which provides free ambulance services to thegeneral public, and as a consequence there is a far greater reliance ongovernment funding than all other jurisdictions.
Unlike most other jurisdictions expenditure on ambulance service provision inTasmania does not include expenditure on operating an ambulance subscriptionscheme.
Tasmania continues to train a far greater proportion of its salaried ambulancepersonnel to paramedic level than most jurisdictions, with up to 70 per cent of allemergencies in Tasmania responded to at the paramedic level.
Tasmania’s major influencing factor is the addition of 16 salaried officers to theservice since last report. In addition, the ambulance replacement program forurban and rural areas is progressing rapidly. ”

616 REPORT ONGOVERNMENTSERVICES 2002
“Australian Capital Territory Government commentsThe ACT is unique and fundamentally different to other jurisdictions in a numberof aspects relevant to emergency management. The relatively small geographicsize of the Territory, and the fact that the ACT has city/State functions; and ahigh proportion of urban area all impact on the provision of emergency services.There are no other counterparts in Australia that provide both Territorial (State)and municipal functions in the one government structure. In addition the revenueraising capabilities of some other jurisdictions are greater and more flexible thanthose of the ACT.In the ACT the focus in emergency management is on the delivery of outputs bycooperation of all emergency agencies in partnership with a preparedcommunity. Output classes for the ACT Emergency Services Bureau are basedon the national emergency management principles of prevention/mitigation,preparedness, response and recovery and are not individually identified againstthe specific emergency agency. The emergency management arrangements inthe ACT reflect both Territorial (State) and municipal funding arrangements inthe budget of the ACT Emergency Services Bureau. The bureau’s Standards ofEmergency Response are time and risk based, and the positioning of resourcesaffects the impact of the multiple town centres, ‘greenbelts’ and Commonwealthassets of National importance.Emergency activities, which in other jurisdictions are spread across manyagencies, are concentrated in the fewer agencies comprising the ACTEmergency Services Bureau. Consequently, the expenditure per person in theACT for the reported fire and ambulance agencies may be inflated by the cost ofthose activities not yet included for other jurisdictions.Given the indication that the average annual growth rate in the over 65 agegroup in the ACT is the second highest for all States and Territories in the sevenyears since 1993, the ACT has placed emphasis on a Community Liaison andAdvisory Safety Project (CLASP) as part of a prevention strategy. CLASP aimsto facilitate the continued independent living of the older population by providingadvice on improvements to personal safety and security. This is a cooperativeventure between the ACT Council on the Ageing, the ACT Ambulance Service,the ACT Fire Brigade and the Australian Federal Police.The ACT has been fortunate to experience no fire deaths in the last threereporting years and to have the lowest fire injury rate of all jurisdictions in thelatest reported period. The ACT Fire Brigade continues to maintain preventativeprograms for fire education for school children, an intervention program forpotential juvenile fire lighters and smoke alarms installation in residences toprevent or minimise the impact of fire in structures. ”

EMERGENCYMANAGEMENT
617
Northern Territory Government comments
“ As with previous reports, the Ambulance Service in the Northern Territory (NT)has not been commented on in this chapter. St John Ambulance is anincorporated non-profit organisation and works under a contract arrangementwith Territory Health Services, an agency of the Northern Territory Government.
The Northern Territory is fundamentally different from other States andTerritories in a number of areas relevant to emergency management. Therelatively large geographic size of the Territory, and its small population, impactheavily on the provision of emergency services to the NT community.
The tyranny of distance is a major issue for fire stations at remote locationsacross the Territory. Auxiliary and volunteer firefighters regularly have to travelup to 200 kilometres to attend motor vehicle accidents and chemical spills. Thevast distances between centres means that brigades in these locations get noback-up from other brigades when dealing with large fires. The career andauxiliary members in these locations must rely on their own abilities andequipment to deal with any emergency.
To this end, Government is providing brigades in rural locations with betterresources to help carry out the important task of emergency response. Largerappliances have been purchased for volunteer brigades in Elliott, Timber Creek,Pine Creek and Batchelor to assist firefighters in these towns to provide a betterservice to their community and the travelling public. Each new vehicle will enableup to seven volunteers to travel to an incident in the one vehicle while carrying3000 litres of water, as well as firefighting and rescue equipment.
New tankers have also been purchased for the permanent and auxiliarybrigades in Palmerston and Tennant Creek.
A new Memorandum of Understanding (MOU) was signed between the NT andthe Commonwealth, for the NT Government to provide fire protection toCommonwealth facilities in the Territory. The MOU will enable the NorthernTerritory Fire and Rescue Service (NTFRS) to obtain additional staff andresources that will assist it to provide appropriate fire protection.
The primary focus of the NTFRS during the reporting period remains prevention,preparedness, response and recovery. The past 12 months have seen adramatic improvement in NTFRS response times to emergency incidents, areduction in deaths attributable to grass and structure fires, a reduction in thenumber of structure fires and a reduction in dollar loss from structure andproperty fires.
Fire prevention strategies such as hazard reduction planning in emergencyresponse areas and hazard reduction burning on Crown land continues to playan important role in the fire prevention strategies of the NTFRS.
School based education also continues to play an important role in our fireprevention strategies with schools in every emergency response being visited byfirefighters during the year. ”

618 REPORT ONGOVERNMENTSERVICES 2002
11.8 Information on sample data
Some of the results reported are estimates obtained by conducting surveys ofsamples of the group or population in question. Results are therefore subject tosampling error. The data obtained from a sample may be different from the ‘true’data that would have been obtained from the entire group or population — not just asample — using the same methods. Consequently, when using survey results, it isnecessary to be cautious (see section A, appendix A, for further details).
The standard error is a measure of sampling error. It indicates the extent to whichthe estimate may differ by chance from the ‘true value’ because only a sample wastaken. If the survey is performed repeatedly, then the difference between the sampleestimate and the population value will be less than one standard error about68 per cent of the time. The difference will be less than two standard errors95 per cent of the time. It will be less than three standard errors 99 per cent of thetime. Another way of expressing this is to say that in 68 (95, 99) of every hundredsamples, the estimate obtained from a single survey will be within one (two, three)standard errors of the ‘true’ value.
The chance that an estimate falls within a certain range of the true value is known asthe confidence of the estimate. For any particular survey, there is a tradeoff betweenthe confidence of the estimate (68 per cent, 95 per cent or 99 per cent) and theacceptable range of error (in terms of standard errors) attached to the estimate. Theappropriate level of confidence chosen depends on the purpose of obtaining theestimate.
The relative standard error is the standard error expressed as a percentage of theestimate to which it relates. It indicates the margin of error that should be attachedto the estimate. The smaller the estimate, the higher is the relative standard error.
Table 11.4 presents the relative standard errors associated with ABS PSM estimatesby jurisdiction. The ABS estimated, for example, that over the four quarters fromNovember 1999 to August 2000, 95 per cent of households in Victoria (or1 643 000) installed an operational smoke alarm or smoke detector (table 11A.11).Table 11A.11 shows that the associated relative standard error is 1.4 per cent. Thereis a 68 per cent probability that the proportion of the population having the deviceinstalled is within one relative standard error of the estimated proportion. We can be68 per cent confident that the true value lies between 95 per cent plus or minus 1.4per cent of 95 per cent — that is, 93.7 per cent to 96.3 per cent. (Note: this is notequivalent to 94 per cent plus or minus 1.4 per cent.) We can be 95 per centconfident that the true value lies within two relative standard errors — that is,between 92.3 per cent and 97.7 per cent. The higher the level of confidence, the lessprecise the estimate is likely to be.

EMERGENCYMANAGEMENT
619
Table 11.4 Relative standard error of estimates for four quarters of thePSM (per cent)a
Estimate NSW Vic Qld WA SA Tas ACT NT Aust1 000 110.0 120.0 90.0 70.0 80.0 50.0 40.0 40.0 80.02 000 85.0 85.0 75.0 55.0 60.0 35.0 25.0 30.0 65.05 000 58.0 58.0 52.0 38.0 40.0 22.0 14.0 18.0 46.010 000 43.0 43.0 38.0 27.0 28.0 16.0 9.0 12.0 36.020 000 31.0 30.5 27.5 19.0 20.0 10.5 6.0 8.0 26.550 000 19.2 18.8 17.0 11.2 12.2 6.2 3.2 4.6 17.0100 000 13.0 12.7 11.4 7.3 8.2 4.0 1.9 2.9 11.9200 000 8.6 8.4 7.4 4.6 5.5 2.5 1.1 1.8 8.1500 000 4.7 4.7 4.0 2.3 3.1 1.3 .. .. 4.7800 000 3.4 3.4 2.9 1.6 2.3 .. .. .. 3.51 000 000 2.9 2.9 2.4 1.4 2.0 .. .. .. 3.01 500 000 2.2 2.2 1.8 1.0 1.5 .. .. .. 2.32 000 000 1.8 1.8 1.4 0.8 1.2 .. .. .. 1.85 000 000 0.9 0.9 0.7 0.3 0.6 .. .. .. 0.9a The ABS considers that only estimates with relative standard errors of 25 per cent or less are sufficientlyreliable for most purposes. Estimates greater than 25 per cent are subject to sampling variability too high formost practical purposes; they need to be treated with caution and viewed as merely indicative of themagnitude involved. .. Not applicable.Source: ABS (2001b).

620 REPORT ONGOVERNMENTSERVICES 2002
11.9 Definitions
Table 11.5 Terms and indicatorsTerm or indicator DefinitionAlarm notificationnot involving fire
Fire alarm notification due to the accidental operation of an alarm, thefailure to notify fire services of an incorrect test by service personnel or astorm induced voltage surge.
Ambulance services Pre-hospital care, treatment and transport services.Ambulanceexpenditure
Includes salaries and payments in the nature of salaries to ambulancestaff, capital expenditure (such as depreciation and user cost of capital)and other operating expenditure (such as running expenditure, contractexpenditure, provision for losses and other recurrent expenditure).Excludes interest on borrowings.
Ambulance non-government revenue
Includes revenue from subscription fees, transport fees, donations andother non-government revenue. Excludes funding revenue fromCommonwealth, State and local governments.
Ambulance staff Any person employed by the ambulance service provider who delivers anambulance service, manages the delivery of this service or providessupport for the delivery of this service. This includes salaried, volunteerand retained ambulance staff.
Emergencyambulanceresponse
An emergency ambulance response to a pre-hospital medical incident oraccident which necessitates the use of ambulance warning devices.
False report An incident in which the fire service responds to and investigates a site,and may restore a detection system.
Fire death A fatality that the reporting officer deems as directly attributable to theincident or the action of handling the fire incident. Excludes fatalities wherea fire conceals a death that occurred before the fire incident. Thisinformation may be verified by coronial information.
Fire expenditure Includes salaries and payments in the nature of salaries to fire staff, capitalexpenditure (such as depreciation and user cost of capital) and otheroperating expenditure (such as running expenditure, training expenditure,maintenance expenditure, communications expenditure, provision forlosses and other recurrent expenditure). Excludes interest on borrowings.
Fire non-government revenue
Includes revenue from levies on insurance companies and propertyowners, user charges (such as subscriptions and other fees) and othernon-government revenue (such as sale of plant and equipment, donationsand industry contributions). Excludes funding revenue fromCommonwealth, State and local governments.
Fire incident A fire that is reported to a fire service and requires a response.Fire injury An injury resulting from a fire or flames, requiring admission to a hospital.
Excludes emergency department outpatients.Fire safety measure � Operational smoke alarm or detector;
� Fire sprinkler system;� Safety switch or circuit breaker;� Fire extinguisher;� Fire blanket;� Fire evacuation plan;� External water supply;� The removal of an external fuel source;
(Continued on next page)

EMERGENCYMANAGEMENT
621
Table 11.5 (Continued)
Term or indicator Definition� External sprinkler; or� Other fire safety measure.
Fire staff Any person employed by the fire service provider who delivers afirefighting or firefighting related service, or manages the delivery ofthis service. This includes paid and volunteer firefighters and supportstaff.
Indirect revenue All revenue or funding received indirectly by the fire agency (forexample directly to treasury or other entity such as subscription fees)that arises from the agency’s actions.
Non-emergencyambulance response
A non-emergency ambulance response which does not necessitatethe use of ambulance warning devices.
Non-structural fire A fire outside a building or structure — including a fire involvingmobile properties (such as vehicles), a rubbish fire, a bush or grassfire, and an explosion.
Other incident An incident other than fire that is reported to a fire service andrequires a response. This may include:� an overpressure rupture (for example, steam or gas), explosion or
excess heat (no combustion);� a rescue (for example, industrial accidents or vehicle accidents);� a hazardous condition (for example, escape of hazardous
materials);� salvage; and� a storm or extreme weather.
Paramedic response A level of emergency care categorised as advanced life supportResponse time The interval between the receipt of the call at the dispatch centre
and the arrival of the vehicle at the scene (that is, when the vehicleis stationary and the handbrake is applied).
Structural fire A fire inside a building or structure, whether or not there is damageto the structure.
Urgent ambulanceresponse
An urgent ambulance response to a pre-hospital medical incident oraccident which does not necessitate the use of ambulance warningdevices.
User cost of capital Calculated as 8 per cent of the current value of non-current physicalassets (including land, plant and equipment).
50th percentile ambulanceservice response times
The time within which 50 per cent of first ambulance resourcesactually respond.
50th percentile fire serviceresponse times
The time within which 50 per cent of first fire resources actuallyrespond.
Fire death rate The number of fire deaths per 100 000 persons in the totalpopulation.
Fire injury rate The number of fire injuries per 100 000 persons in the totalpopulation.
90th percentile ambulanceservice response times
The time within which 90 per cent of first ambulance resourcesactually respond.
Median dollar loss perstructural fire
The median (middle number in a given sequence) of the structuralloss in $’000 per structural fire incident.
(Continued on next page)

622 REPORT ONGOVERNMENTSERVICES 2002
Table 11.5 (Continued)
90th percentile fire serviceresponse times
The time within which 90 per cent of first fire resources actuallyrespond.
Structural fire contained toobject or room of origin
A fire where direct fire/flame is contained to the room of origin (thatis, excludes wildfires and vehicle fires in unconfined spaces). A roomis an enclosed space, regardless of its dimensions or configuration.This category includes fires in residential and nonresidentialstructures.