110 hunting plc 2019 annual report and accounts
TRANSCRIPT
110 Hunting PLC / 2019 Annual Report and Accounts
Independent Auditor’s Report to the Members of Hunting PLCFor the year ended 31 December 2019
1. OpinionIn our opinion:
• the financial statements of Hunting PLC (the “parent Company”) and its subsidiaries (the “Group”) give a true and fair view of the state of the Group’s and of the parent Company’s affairs as at 31 December 2019 and of the Group’s profit for the year then ended;
• the Group financial statements have been properly prepared in accordance with International Financial Reporting Standards (IFRSs) as adopted by the European Union;
• the parent Company financial statements have been properly prepared in accordance with IFRSs as adopted by the European Union and as applied in accordance with the provisions of the Companies Act 2006; and
• the financial statements have been prepared in accordance with the requirements of the Companies Act 2006 and, as regards the Group financial statements, Article 4 of the IAS Regulation.
We have audited the financial statements which comprise:
• the consolidated income statement; • the consolidated statement of comprehensive income; • the consolidated and parent company balance sheets; • the consolidated and parent company statements of changes in equity; • the consolidated and parent company statement of cash flows; and • the related notes 1 to 42 for the consolidated financial statements, and notes C1 – C19 for the parent company financial statements.
The financial reporting framework that has been applied in their preparation is applicable law and IFRSs as adopted by the European Union and, as regards the parent Company financial statements, as applied in accordance with the provisions of the Companies Act 2006.
2. Basis for opinionWe conducted our audit in accordance with International Standards on Auditing (UK) (ISAs (UK)) and applicable law. Our responsibilities under those standards are further described in the auditor’s responsibilities for the audit of the financial statements section of our report.
We are independent of the Group and the parent Company in accordance with the ethical requirements that are relevant to our audit of the financial statements in the UK, including the Financial Reporting Council’s (the “FRC’s”) Ethical Standard as applied to listed public interest entities, and we have fulfilled our other ethical responsibilities in accordance with these requirements. We confirm that the non-audit services prohibited by the FRC’s Ethical Standard were not provided to the group or the parent company.
We believe that the audit evidence we have obtained is sufficient and appropriate to provide a basis for our opinion.
3. Summary of our audit approach
Key audit matters The key audit matters that we identified in the current year were: • inventory valuation; • goodwill and non-current asset impairment; and • revenue recognition.
Materiality The materiality that we used for the Group financial statements was $3.8 million which was determined on the basis of profit before tax before exceptional items.
Scoping The scope of our Group audit includes a number of reporting units across the Group, whose results taken together account for 91% of the Group’s revenue and 93% of net assets.We conducted our audit work in five countries, covering 22 reporting units, including a number of head office entities. We visited four of these five countries, including the financially significant component Hunting Titan Inc in the United States.
4. Conclusions relating to going concern, principal risks and viability statement
4.1. Going concernWe have reviewed the Directors’ statement in note 1 to the financial statements about whether they considered it appropriate to adopt the going concern basis of accounting in preparing them and their identification of any material uncertainties to the Group’s and Company’s ability to continue to do so over a period of at least 12 months from the date of approval of the financial statements.
We considered as part of our risk assessment the nature of the group, its business model and related risks, including where relevant the impact of Brexit, the requirements of the applicable financial reporting framework and the system of internal control. We evaluated the Directors’ assessment of the Group’s ability to continue as a going concern, including challenging the underlying data and key assumptions used to make the assessment, and evaluated the Directors’ plans for future actions in relation to their going concern assessment.
We are required to state whether we have anything material to add or draw attention to in relation to that statement required by Listing Rule 9.8.6R(3) and report if the statement is materially inconsistent with our knowledge obtained in the audit.
Going concern is the basis of preparation of the financial statements that assumes an entity will remain in operation for a period of at least 12 months from the date of approval of the financial statements.
We confirm that we have nothing material to report, add or draw attention to in respect of these matters.

111 Hunting PLC / 2019 Annual Report and AccountsP
urpose and C
ultureB
usiness Mod
el and Stakehold
ersG
overnanceP
erformance
Business S
trategy F
ina
nc
ial sta
tem
en
ts
4.2. Principal risks and viability statementBased solely on reading the directors’ statements and considering whether they were consistent with the knowledge we obtained in the course of the audit, including the knowledge obtained in the evaluation of the directors’ assessment of the Group’s and the Company’s ability to continue as a going concern, we are required to state whether we have anything material to add or draw attention to in relation to:
• the disclosures on pages 41 to 47 that describe the principal risks, procedures to identify emerging risks, and an explanation of how these are being managed or mitigated;
• the Directors’ confirmation on page 41 that they have carried out a robust assessment of the principal and emerging risks facing the Group, including those that would threaten its business model, future performance, solvency or liquidity; or
• the Directors’ explanation on page 68 as to how they have assessed the prospects of the Group, over what period they have done so and why they consider that period to be appropriate, and their statement as to whether they have a reasonable expectation that the Group will be able to continue in operation and meet its liabilities as they fall due over the period of their assessment, including any related disclosures drawing attention to any necessary qualifications or assumptions.
We are also required to report whether the directors’ statement relating to the prospects of the group required by Listing Rule 9.8.6R(3) is materially inconsistent with our knowledge obtained in the audit.
Viability means the ability of the Group to continue over the time horizon considered appropriate by the directors.
We confirm that we have nothing material to report, add or draw attention to in respect of these matters.
5. Key audit mattersKey audit matters are those matters that, in our professional judgement, were of most significance in our audit of the financial statements of the current period and include the most significant assessed risks of material misstatement (whether or not due to fraud) that we identified. These matters included those which had the greatest effect on: the overall audit strategy, the allocation of resources in the audit; and directing the efforts of the engagement team.
These matters were addressed in the context of our audit of the financial statements as a whole, and in forming our opinion thereon, and we do not provide a separate opinion on these matters.
Inventory valuation
Key audit matter description
The Group holds inventory of $350.8 million (2018: $348.2 million), net of provisions of $26.5 million (2018: $24.5 million). The cyclical and often challenging trading environment and market conditions continue to pose the risk of inventory being carried at an amount greater than its net realisable value. In addition, future market demand for both existing and new products will impact future sales, especially in respect of the longevity of some of the Group’s products. These factors, with the level of inventory carried, could lead to a risk of over-valuation of inventories.
Management’s judgements in assessing the valuation of inventory is primarily based on expectations of future sales and inventory utilisation plans. Given the level of judgement, we consider there to be a potential risk of fraud.
Refer to page 108 of the Audit Committee Report and note 20 to the financial statements.How the scope of our audit responded to the key audit matter
We understood the process for recording inventory and assessed the nature of the Group’s inventory through enquiries with management, physical inspection of inventory (where applicable) and review of the utilisation of aged inventory products. Across all components in the Group, as part of our risk assessment procedures, we have reviewed the basis for the provision recorded across all categories of inventory, analysing the consistency of this provision in line with the Group’s accounting policy. For those which pose a greater risk, we have focused our audit effort and tailored our procedures accordingly. Specifically we have:
• obtained an understanding of the relevant controls over the inventory valuation process; • obtained and reviewed the inventory provisioning models used and determined if they remain appropriate
methodologies with reference to the level of write-offs and evidence of sale of slow-moving stock in the period to 31 December 2019;
• for components that calculate inventory reserves based on the date the inventory was last used, performed an analysis of movements between ageing categories during the year and tested a sample of items;
• considered the available support, including current sales transactions, used to determine an appropriate net realisable value to confirm that inventory is being held at an appropriate amount;
• where inventory consists of recently produced and newer products, we independently researched the addressable market to ensure there was no contradictory evidence indicating that this inventory will not be sold; and
• where appropriate, compared forecast sales against relevant third party market forecasts.Key observations Based on the procedures performed, we obtained evidence that the inventory valuation is appropriate.

112 Hunting PLC / 2019 Annual Report and Accounts
Goodwill and non-current asset impairment
Key audit matter description
The Group holds $230.2 million (2018: $229.9 million) of goodwill on the balance sheet, which is tested annually for impairment. The intangible assets held of $78.5 million (2018: $99.8 million) include customer relationships, unpatented technology and patents and trademarks. The property, plant and equipment balance is $354.7 million (2018: $360.2 million). The right of use asset amounted to $36.7 million (2018: $39.7 million).
Testing a cash-generating unit (“CGU”) for impairment requires determination of its recoverable amount, which is a judgemental assessment that depends on the future financial performance of the CGU and future market performance. The Group continues to operate in challenging markets, with excess production capacity at certain locations. Given the decline in the medium-term outlook for the Group’s onshore drilling tools business, a $19.0 million impairment has been recognised as an exceptional item.
Following our detailed risk assessment procedures we pinpointed the risk of impairment to the following CGUs: Canada; UK Well Intervention; Drilling Tools; and Specialty.
Refer to page 108 of the Audit Committee Report and note 16 to the financial statements.How the scope of our audit responded to the key audit matter
We tested management’s identification of CGUs to assess the appropriateness of their determination, considering business changes that could prompt a change in CGU. Across each CGU we:
• sensitised each key driver of the cash flow forecasts, including the underlying assumptions listed above, by determining what we considered to be a reasonably possible change in the assumptions, based on current market data and historical and current business performance; and
• calculated the degree to which the key assumptions would need to change before an impairment was triggered.
In respect of the CGUs that we specifically identified, we challenged the following:
• whether the future cash flow forecasts and the timing of the forecast recovery in performance of these forecasts for the identified CGUs are appropriate;
• the forecast revenue and margin growth rate assumptions and how management have incorporated the impact of any changes in the relevant markets subsequent to year-end, by comparing them to historical results, comparing the short- and medium-term growth rates to independent specialist third party published reports and considering the impact already observed within the market;
• the terminal growth rates by comparing them to economic and industry forecast; and • the discount rates by comparing the cost of capital assumption for each CGU against comparable
organisations and independently calculated discount rates with involvement from our valuations specialists.
Where an impairment was identified, we challenged management’s analysis of the impairment booked by assessing the methodology applied, and testing the underlying source data.
We also reviewed the sensitivity disclosures included in the Annual Report.Key observations Based on the procedures performed we are satisfied that management’s calculated recoverable amounts
on the remaining CGUs exceed the carrying amounts and therefore no additional impairment should be recognised.
We consider that the sensitivity disclosures in the Annual Report fairly present the CGUs that are most sensitive to potential future changes in key assumptions.
Revenue recognition
Key audit matter description
The revenue in the Group for 2019 was $960.0 million (2018: $911.4 million).
The Group’s revenue recognition policy does not generally require a high level of judgement however the quantum of the revenue, contractual terms used with customers and the volume of sales that occur close to period end have guided the focus of our audit effort. We have also placed due consideration of components who recognise revenue over time. We consider this to be a potential fraud risk. The key risks in respect of revenue recognition are:
• the cut-off of sales made close to the period end, with specific consideration to ensuring control has passed to the customer; and
• the appropriateness of revenue recognition criteria for revenue that is recognised over time.
Refer to note 3 to the financial statements.
Independent Auditor’s Report to the Members of Hunting PLC continued

113 Hunting PLC / 2019 Annual Report and AccountsP
urpose and C
ultureB
usiness Mod
el and Stakehold
ersG
overnanceP
erformance
Business S
trategy F
ina
nc
ial sta
tem
en
ts
How the scope of our audit responded to the key audit matter
We obtained an understanding of the relevant controls over the revenue process. We evaluated the key contractual terms in place with customers and determined an appropriate period for testing sales close to the period end based on the date of invoicing versus the latest date control may pass, and evaluated whether the sales had been appropriately recognised based on the contractual terms and underlying proof of when control has passed.
For over time revenue recognition, we identified any significant contracts and assessed the appropriateness of the revenue recognition model in place, with due consideration of the underlying contractual agreement, challenging how these terms have been interpreted under IFRS 15 Revenue from Contracts with Customers.
Key observations Based on the procedures performed, we obtained evidence that the revenue was recognised appropriately and in accordance with IFRS 15 Revenue from Contracts with Customers.
6. Our application of materiality
PBT*Group materiality
Group materiality$3.8m
Component materiality range $2.2m to $1.4m
Audit Committee reporting threshold $0.2m
* Profit before tax before exceptional items.
6.1. MaterialityWe define materiality as the magnitude of misstatement in the financial statements that makes it probable that the economic decisions of a reasonably knowledgeable person would be changed or influenced. We use materiality both in planning the scope of our audit work and in evaluating the results of our work.
Based on our professional judgement, we determined materiality for the financial statements as a whole as follows:
Group financial statements Parent Company financial statements
Materiality $3.8 million $2.2 million.Basis for determining materiality
We determined materiality as 6% of profit before tax before exceptional items.
Parent Company materiality equates to 1% of net assets. For the purposes of the group audit, we have capped this materiality to be 59% of Group materiality.
Rationale for the benchmark applied
We consider that a profit benchmark is appropriate in determining materiality given investor focus on the performance of the business. We have used profit before tax before exceptional items as the benchmark that reflects the underlying performance of the business.
The Company is a holding company, not a trading entity, and therefore we have not used a profit-based benchmark for determining materiality. We concluded that net assets is the most appropriate measure given that the Company’s balance sheet is mostly made up of investments and intercompany receivables.
6.2. Performance materialityWe set performance materiality at a level lower than materiality to reduce the probability that, in aggregate, uncorrected and undetected misstatements exceed the materiality for the financial statements as a whole. Group performance materiality was set at 65% of group materiality for the 2019 audit. In determining performance materiality, we considered the following factors:
• the fact that this is our first period of appointment as auditor;• our overall assessment of the control environment and likely misstatements; and• our planned testing approach for reliance on controls.
6.3. Error reporting thresholdWe agreed with the Audit Committee that we would report to the Committee all audit differences in excess of $0.2 million, as well as differences below that threshold that, in our view, warranted reporting on qualitative grounds. We also report to the Audit Committee on disclosure matters that we identified when assessing the overall presentation of the financial statements.

114 Hunting PLC / 2019 Annual Report and Accounts
7. An overview of the scope of our audit7.1. Identification and scoping of componentsThe Group has 55 reporting units, and the financial statements reflect a consolidation of entities covering centralised functions, operating units and non-trading legal entities. The systems, processes and controls in place vary across the group and therefore our audit scoping procedures considered each operating unit individually.
Our scoping consisted of three levels with audit effort split across each scoping level. We identified 12 operating units across the Group that were subject to full scope reporting on their complete financial information, which included four holding company reporting units. Specific audit procedures over certain balances were performed at a further 10 operating units, including two holding company entities, to give appropriate coverage on all material balances at the Group level. The remaining operating units and balances not included above were subject to analytical review procedures. Together, the reporting units subject to audit procedures accounted for 91% of the Group’s revenue and 93% of the Group’s net assets. The range of component materiality levels is $1.4 million to $2.2 million.
Full audit scopeSpecified audit proceduresReview at group level
Revenue
20%
7%
73%
Net assets
28%
7%
65%
7.2. Working with other auditorsIn doing our scoping procedures as described above, we conducted work in 5 countries, and the Group team visited reporting locations in Aberdeen, Singapore, Canada and the United States.
We directed and supervised our component audit teams through regular discussions and interactions during the planning phase of our audit, and throughout the year-end procedures. We performed a detailed review of their work over areas such as key judgements and significant risks. We also requested a number of reporting documents to be completed by each team for our review.
Further, specific audit procedures over the central functions and areas of significant judgement, including taxation, treasury and impairment, were performed by the Group audit team centrally.
8. Other informationThe directors are responsible for the other information. The other information comprises the information included in the Annual Report, other than the financial statements and our auditor’s report thereon.
Our opinion on the financial statements does not cover the other information and, except to the extent otherwise explicitly stated in our report, we do not express any form of assurance conclusion thereon.
In connection with our audit of the financial statements, our responsibility is to read the other information and, in doing so, consider whether the other information is materially inconsistent with the financial statements or our knowledge obtained in the audit or otherwise appears to be materially misstated.
If we identify such material inconsistencies or apparent material misstatements, we are required to determine whether there is a material misstatement in the financial statements or a material misstatement of the other information. If, based on the work we have performed, we conclude that there is a material misstatement of this other information, we are required to report that fact.
In this context, matters that we are specifically required to report to you as uncorrected material misstatements of the other information include where we conclude that:
• Fair, balanced and understandable – the statement given by the directors that they consider the annual report and financial statements taken as a whole is fair, balanced and understandable and provides the information necessary for shareholders to assess the Group’s position and performance, business model and strategy, is materially inconsistent with our knowledge obtained in the audit; or
• Audit Committee reporting – the section describing the work of the Audit Committee does not appropriately address matters communicated by us to the Audit Committee; or
• Directors’ statement of compliance with the UK Corporate Governance Code – the parts of the directors’ statement required under the Listing Rules relating to the Company’s compliance with the UK Corporate Governance Code containing provisions specified for review by the auditor in accordance with Listing Rule 9.8.10R(2) do not properly disclose a departure from a relevant provision of the UK Corporate Governance Code.
We have nothing to report in respect of these matters.
9. Responsibilities of directorsAs explained more fully in the Statement of Directors’ Responsibilities, the Directors are responsible for the preparation of the financial statements and for being satisfied that they give a true and fair view, and for such internal control as the Directors determine is necessary to enable the preparation of financial statements that are free from material misstatement, whether due to fraud or error.
Independent Auditor’s Report to the Members of Hunting PLC continued

115 Hunting PLC / 2019 Annual Report and AccountsP
urpose and C
ultureB
usiness Mod
el and Stakehold
ersG
overnanceP
erformance
Business S
trategy F
ina
nc
ial sta
tem
en
ts
In preparing the financial statements, the directors are responsible for assessing the Group’s and the parent Company’s ability to continue as a going concern, disclosing as applicable, matters related to going concern and using the going concern basis of accounting unless the directors either intend to liquidate the group or the parent company or to cease operations, or have no realistic alternative but to do so.
10. Auditor’s responsibilities for the audit of the financial statementsOur objectives are to obtain reasonable assurance about whether the financial statements as a whole are free from material misstatement, whether due to fraud or error, and to issue an auditor’s report that includes our opinion. Reasonable assurance is a high level of assurance, but is not a guarantee that an audit conducted in accordance with ISAs (UK) will always detect a material misstatement when it exists. Misstatements can arise from fraud or error and are considered material if, individually or in the aggregate, they could reasonably be expected to influence the economic decisions of users taken on the basis of these financial statements.
Details of the extent to which the audit was considered capable of detecting irregularities, including fraud and non-compliance with laws and regulations are set out below.
A further description of our responsibilities for the audit of the financial statements is located on the FRC’s website at: www.frc.org.uk/auditorsresponsibilities. This description forms part of our Auditor’s Report.
11. Extent to which the audit was considered capable of detecting irregularities, including fraudWe identify and assess the risks of material misstatement of the financial statements, whether due to fraud or error, and then design and perform audit procedures responsive to those risks, including obtaining audit evidence that is sufficient and appropriate to provide a basis for our opinion.
11.1. Identifying and assessing potential risks related to irregularitiesIn identifying and assessing risks of material misstatement in respect of irregularities, including fraud and non-compliance with laws and regulations, we considered the following:
• the nature of the industry and sector, control environment and business performance including the design of the Group’s remuneration policies, key drivers for directors’ remuneration, bonus levels and performance targets;
• results of our enquiries of management and the audit committee about their own identification and assessment of the risks of irregularities; • any matters we identified having obtained and reviewed the Group’s documentation of their policies and procedures relating to:
– identifying, evaluating and complying with laws and regulations and whether they were aware of any instances of non-compliance; – detecting and responding to the risks of fraud and whether they have knowledge of any actual, suspected or alleged fraud; – the internal controls established to mitigate risks of fraud or non-compliance with laws and regulations; and
• the matters discussed among the audit engagement team including significant component audit teams and involving relevant internal specialists, including tax, IT, and financial instruments specialists regarding how and where fraud might occur in the financial statements and any potential indicators of fraud.
As a result of these procedures, we considered the opportunities and incentives that may exist within the organisation for fraud and identified the greatest potential for fraud in the following areas: inventory valuation and revenue recognition. In common with all audits under ISAs (UK), we are also required to perform specific procedures to respond to the risk of management override.
We also obtained an understanding of the legal and regulatory frameworks in which the Group operates, focusing on provisions of those laws and regulations that had a direct effect on the determination of material amounts and disclosures in the financial statements. The key laws and regulations we considered in this context included the UK Companies Act, Listing Rules, tax legislation and pensions legislation.
In addition, we considered provisions of other laws and regulations that do not have a direct effect on the financial statements but compliance with which may be fundamental to the Group’s ability to operate or to avoid a material penalty. These included employment and minimum wage legislation, health, safety and the environment (“HSE”), international trading laws, the group’s operating licence, their regulatory solvency requirements and environmental regulations.
11.2. Audit response to risks identifiedAs a result of performing the above, we identified inventory valuation and revenue recognition as key audit matters related to the potential risk of fraud. The key audit matters section of our report explains the matters in more detail and also describes the specific procedures we performed in response to those key audit matters.
In addition to the above, our procedures to respond to risks identified included the following:
• reviewing the financial statement disclosures and testing to supporting documentation to assess compliance with provisions of relevant laws and regulations described as having a direct effect on the financial statements;
• enquiring of management, the audit committee and external legal counsel concerning actual and potential litigation and claims; • performing analytical procedures to identify any unusual or unexpected relationships that may indicate risks of material misstatement
due to fraud; • reading minutes of meetings of those charged with governance, reviewing internal audit reports and reviewing correspondence with
HMRC; and • in addressing the risk of fraud through management override of controls, testing the appropriateness of journal entries and other
adjustments; assessing whether the judgements made in making accounting estimates are indicative of a potential bias; and evaluating the business rationale of any significant transactions that are unusual or outside the normal course of business.
We also communicated relevant identified laws and regulations and potential fraud risks to all engagement team members including internal specialists and significant component audit teams, and remained alert to any indications of fraud or non-compliance with laws and regulations throughout the audit.

116 Hunting PLC / 2019 Annual Report and Accounts
Report on other legal and regulatory requirements
12. Opinions on other matters prescribed by the Companies Act 2006In our opinion the part of the Directors’ Remuneration Report to be audited has been properly prepared in accordance with the Companies Act 2006.
In our opinion, based on the work undertaken in the course of the audit:
• the information given in the Strategic Report and the Directors’ Report for the financial year for which the financial statements are prepared is consistent with the financial statements; and
• the Strategic Report and the Directors’ Report have been prepared in accordance with applicable legal requirements.
In the light of the knowledge and understanding of the Group and the parent Company and their environment obtained in the course of the audit, we have not identified any material misstatements in the Strategic Report or the Directors’ Report.
13. Matters on which we are required to report by exception13.1. Adequacy of explanations received and accounting recordsUnder the Companies Act 2006 we are required to report to you if, in our opinion:
• we have not received all the information and explanations we require for our audit; or • adequate accounting records have not been kept by the parent Company, or returns adequate for our audit have not been received
from branches not visited by us; or • the parent Company financial statements are not in agreement with the accounting records and returns.
We have nothing to report in respect of these matters.
13.2. Directors’ remunerationUnder the Companies Act 2006 we are also required to report if in our opinion certain disclosures of Directors’ remuneration have not been made or the part of the Directors’ Remuneration Report to be audited is not in agreement with the accounting records and returns.
We have nothing to report in respect of these matters.
14. Other matters14.1. Auditor tenureFollowing the recommendation of the audit committee, we were appointed by the Directors on 17 April 2019 to audit the financial statements for the year ending 31 December 2019 and subsequent financial periods. Our total uninterrupted period of engagement is one year, covering periods from our appointment through to the period ending 31 December 2019.
14.2. Consistency of the audit report with the additional report to the Audit CommitteeOur audit opinion is consistent with the additional report to the Audit Committee we are required to provide in accordance with ISAs (UK).
15. Use of our reportThis report is made solely to the Company’s members, as a body, in accordance with Chapter 3 of Part 16 of the Companies Act 2006. Our audit work has been undertaken so that we might state to the Company’s members those matters we are required to state to them in an Auditor’s Report and for no other purpose. To the fullest extent permitted by law, we do not accept or assume responsibility to anyone other than the Company and the Company’s members as a body, for our audit work, for this report, or for the opinions we have formed.
William Smith(Senior statutory auditor)For and on behalf of Deloitte LLPStatutory AuditorLondon27 February 2020
Independent Auditor’s Report to the Members of Hunting PLC continued

117 Hunting PLC / 2019 Annual Report and AccountsP
urpose and C
ultureB
usiness Mod
el and Stakehold
ersG
overnanceP
erformance
Business S
trategy F
ina
nc
ial sta
tem
en
ts
Consolidated income statementFor the year ended 31 December 2019
Notes
2019 2018i
Before amortisationii
and exceptional items
$m
Amortisationii
and exceptional items
(note 6)$m
Total$m
Before amortisationii and exceptional items
$m
Amortisationii and exceptional
items (note 6)
$mTotal
$m
Revenue 3 960.0 – 960.0 911.4 – 911.4Cost of sales (693.6) (19.0) (712.6) (636.3) – (636.3)Gross profit 266.4 (19.0) 247.4 275.1 – 275.1Other operating income 4 10.8 – 10.8 7.8 – 7.8Operating expenses 5 (182.9) (28.5) (211.4) (178.2) (29.3) (207.5)Profit (loss) from operations 7 94.3 (47.5) 46.8 104.7 (29.3) 75.4Finance income 9 4.2 – 4.2 2.6 – 2.6Finance expense 9 (5.4) – (5.4) (3.3) – (3.3)Profit (loss) before tax from operations 93.1 (47.5) 45.6 104.0 (29.3) 74.7Taxation 10 (17.0) 12.8 (4.2) (22.0) 33.0 11.0Profit (loss) for the year 76.1 (34.7) 41.4 82.0 3.7 85.7
Profit (loss) attributable to:Owners of the parent 74.4 (34.7) 39.7 84.8 4.5 89.3Non-controlling interests 1.7 – 1.7 (2.8) (0.8) (3.6)
76.1 (34.7) 41.4 82.0 3.7 85.7
Earnings per share cents cents cents cents
Basic 11 45.0 24.0 51.6 54.4Diluted 11 43.9 23.5 49.6 52.3
i. From 1 January 2019, the Group has adopted IFRS 16 Leases (“IFRS 16”) by applying the modified retrospective approach; consequently the comparatives for the 2018 reporting period have not been restated, as permitted under the specific transitional provisions in IFRS 16. The impact of implementing IFRS 16 can be seen in note 41.
ii. Relates to amortisation of intangible assets arising on the acquisition of businesses (referred to hereafter as amortisation of acquired intangible assets).
118 Hunting PLC / 2019 Annual Report and Accounts
Consolidated Statement of Comprehensive IncomeFor the year ended 31 December 2019
Notes2019
$m2018
$m
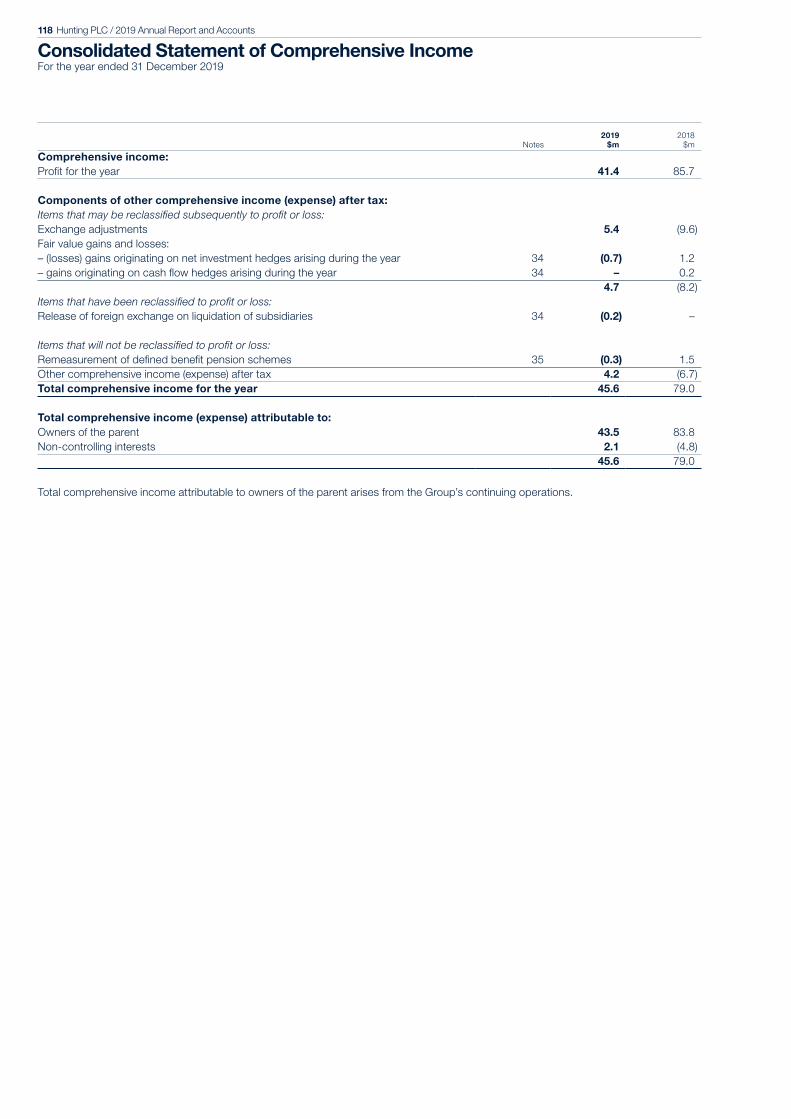
Comprehensive income:Profit for the year 41.4 85.7
Components of other comprehensive income (expense) after tax:Items that may be reclassified subsequently to profit or loss:Exchange adjustments 5.4 (9.6)Fair value gains and losses:– (losses) gains originating on net investment hedges arising during the year 34 (0.7) 1.2– gains originating on cash flow hedges arising during the year 34 – 0.2
4.7 (8.2)Items that have been reclassified to profit or loss:Release of foreign exchange on liquidation of subsidiaries 34 (0.2) –
Items that will not be reclassified to profit or loss:Remeasurement of defined benefit pension schemes 35 (0.3) 1.5Other comprehensive income (expense) after tax 4.2 (6.7)Total comprehensive income for the year 45.6 79.0
Total comprehensive income (expense) attributable to:Owners of the parent 43.5 83.8Non-controlling interests 2.1 (4.8)
45.6 79.0
Total comprehensive income attributable to owners of the parent arises from the Group’s continuing operations.

119 Hunting PLC / 2019 Annual Report and AccountsP
urpose and C
ultureB
usiness Mod
el and Stakehold
ersG
overnanceP
erformance
Business S
trategy F
ina
nc
ial sta
tem
en
ts
Consolidated Balance SheetAt 31 December 2019
Notes2019
$m2018i
$m
ASSETSNon-current assetsProperty, plant and equipment 12 354.7 360.2Right-of-use assets 13 36.7 –Goodwill 14 230.2 229.9Other intangible assets 15 78.5 99.8Investments 17 2.3 2.4Trade and other receivables 18 2.7 3.5Deferred tax assets 19 29.9 26.0
735.0 721.8
Current assetsInventories 20 350.8 348.2Trade and other receivables 18 202.0 231.0Cash and cash equivalents 21 128.6 67.9Current tax assets 0.2 0.1Investments 17 0.5 –
682.1 647.2
LIABILITIESCurrent liabilitiesTrade and other payables 22 121.2 140.9Lease liabilities 24 9.8 –Borrowings 25 1.6 2.7Provisions 27 3.2 4.7Current tax liabilities 9.5 11.2
145.3 159.5Net current assets 536.8 487.7
Non-current liabilitiesTrade and other payables 22 2.7 3.8Lease liabilities 24 35.4 –Borrowings 25 3.9 3.9Provisions 27 5.2 9.5Deferred tax liabilities 19 0.8 1.2
48.0 18.4Net assets 1,223.8 1,191.1
Equity attributable to owners of the parentShare capital 33 67.3 66.7Share premium 33 153.0 153.0Other components of equity 34 56.5 75.8Retained earnings 35 931.1 881.6
1,207.9 1,177.1Non-controlling interests 15.9 14.0Total equity 1,223.8 1,191.1
i. From 1 January 2019, the Group has adopted IFRS 16 Leases (“IFRS 16”) by applying the modified retrospective approach; consequently the comparatives for the 2018 reporting period have not been restated, as permitted under the specific transitional provisions in IFRS 16. The impact of implementing IFRS 16 can be seen in note 41.
The notes on pages 122 to 167 are an integral part of these consolidated financial statements. The financial statements on pages 117 to 167 were approved by the Board of Directors on 27 February 2020 and were signed on its behalf by:
Jim Johnson Peter RoseDirector Director Registered number: 0974568

120 Hunting PLC / 2019 Annual Report and Accounts
Consolidated Statement of Changes in Equity
Notes
Year ended 31 December 2019
Sharecapital
$m
Sharepremium
$m
Other components
of equity$m
Retained earnings
$mTotal
$m
Non-controlling
interests$m
Totalequity
$m
At 31 December 2018 as previously reported 66.7 153.0 75.8 881.6 1,177.1 14.0 1,191.1Adjustment on adoption of IFRS 16 41 – – – (1.1) (1.1) (0.2) (1.3)At 1 January 2019 amended 66.7 153.0 75.8 880.5 1,176.0 13.8 1,189.8
Profit for the year – – – 39.7 39.7 1.7 41.4Other comprehensive income (expense) – – 4.1 (0.3) 3.8 0.4 4.2Total comprehensive income – – 4.1 39.4 43.5 2.1 45.6
Dividends to equity shareholders 36 – – – (16.6) (16.6) – (16.6)Shares issued– share option schemes and awards 33 0.6 – – – 0.6 – 0.6Treasury shares– purchase of treasury shares 35 – – – (5.0) (5.0) – (5.0)– disposal of treasury shares 35 – – – 0.3 0.3 – 0.3Share options and awards– value of employee services 34 – – 9.0 – 9.0 – 9.0– discharge 34,35 – – (11.6) 10.8 (0.8) – (0.8)– taxation – – – 0.9 0.9 – 0.9Transfer between reserves – – (20.8) 20.8 – – –Total transactions with owners 0.6 – (23.4) 11.2 (11.6) – (11.6)
At 31 December 2019 67.3 153.0 56.5 931.1 1,207.9 15.9 1,223.8
Notes
Year ended 31 December 2018
Sharecapital
$m
Sharepremium
$m
Other components
of equity$m
Retained earnings
$mTotal
$m
Non-controlling
interests$m
Totalequity
$m
At 31 December 2017 66.4 153.0 91.7 782.2 1,093.3 18.8 1,112.1Adjustment on adoption of IFRS 9 – – – (0.2) (0.2) – (0.2)At 1 January 2018 66.4 153.0 91.7 782.0 1,093.1 18.8 1,111.9
Profit (loss) for the year – – – 89.3 89.3 (3.6) 85.7Other comprehensive (expense) income – – (7.0) 1.5 (5.5) (1.2) (6.7)Total comprehensive income – – (7.0) 90.8 83.8 (4.8) 79.0
Hedging losses transferred to the carrying value of inventory purchased in the year 34 – – (0.1) – (0.1) – (0.1)
Dividends to equity shareholders 36 – – – (6.6) (6.6) – (6.6)Shares issued– share option schemes and awards 33 0.3 – – – 0.3 – 0.3Treasury shares– purchase of treasury shares 35 – – – (5.7) (5.7) – (5.7)Share options and awards– value of employee services 34 – – 13.1 – 13.1 – 13.1– discharge 34,35 – – (9.7) 9.2 (0.5) – (0.5)– taxation – – – (0.3) (0.3) – (0.3)Transfer between reserves – – (12.2) 12.2 – – –Total transactions with owners 0.3 – (8.8) 8.8 0.3 – 0.3
At 31 December 2018 66.7 153.0 75.8 881.6 1,177.1 14.0 1,191.1

121 Hunting PLC / 2019 Annual Report and AccountsP
urpose and C
ultureB
usiness Mod
el and Stakehold
ersG
overnanceP
erformance
Business S
trategy F
ina
nc
ial sta
tem
en
ts
Consolidated Statement of Cash FlowsFor the year ended 31 December 2019
Notes2019
$m2018i
$m
Operating activitiesReported profit from operations 46.8 75.4Acquisition amortisation and exceptional items 6 47.5 29.3Depreciation and non-acquisition amortisation 7 45.4 37.6Underlying EBITDA (NGM A) 139.7 142.3Share-based payments expense 9.1 13.2Increase in inventories (0.2) (72.7)Decrease (increase) in receivables 29.0 (47.3)(Decrease) increase in payables (21.2) 23.4Decrease in provisions (2.4) (3.8)Net taxation paid (7.7) (2.6)Receipt of surplus pension assets – 10.6Payment of US pension scheme liabilities – (10.4)Net gain on disposal of property, plant and equipment (1.5) (1.0)Proceeds from disposal of property, plant and equipment held for rental 2.7 3.9Purchase of property, plant and equipment held for rental (5.6) (5.8)Gain on disposal of intangible assets (2.3) –Gain on disposal of business (2.0) –Other non-cash flow items (0.4) 2.9Net cash inflow from operating activities 137.2 52.7Investing activitiesInterest received 1.3 0.4Net movement on loans to and from associates 0.3 –Proceeds from disposal of associates – 1.3Proceeds from disposal of investments – 10.4Proceeds from disposal of property, plant and equipment 0.9 12.5Proceeds from disposal of intangible technology 4 2.3 –Proceeds from disposal of business 4 3.0 –Purchase of subsidiaries 39 (12.5) –Purchase of property, plant and equipment (30.4) (24.3)Purchase of intangible assets (10.2) (6.6)Net cash outflow from investing activities (45.3) (6.3)Financing activitiesInterest and bank fees paid (1.2) (2.4)Payment of capitalised lease liabilities (10.6) –Repayment of borrowings (0.9) –Proceeds from new borrowings – 0.9Dividends paid to equity shareholders 36 (16.6) (6.6)Share capital issued 0.6 0.3Purchase of Treasury shares (5.0) (5.7)Disposal of Treasury shares 0.3 –Net cash outflow from financing activities (33.4) (13.5)
Net cash inflow in cash and cash equivalents 58.5 32.9Cash and cash equivalents at the beginning of the year 66.1 34.3Effect of foreign exchange rates 2.4 (1.1)Cash and cash equivalents at the end of the year 127.0 66.1
Cash and cash equivalents at the end of the year comprise:Cash and cash equivalents included in current assets 21 128.6 67.9Bank overdrafts included in borrowings 25 (1.6) (1.8)
127.0 66.1
i. From 1 January 2019, the Group has adopted IFRS 16 Leases (“IFRS 16”) by applying the modified retrospective approach; consequently the comparatives for the 2018 reporting period have not been restated, as permitted under the specific transitional provisions in IFRS 16. The impact of implementing IFRS 16 can be seen in note 41.

122 Hunting PLC / 2019 Annual Report and Accounts
Notes to the Consolidated Financial Statements
1. Basis of Preparation
Hunting PLC is a premium-listed public company limited by shares, with its Ordinary shares quoted on the London Stock Exchange. Hunting PLC was incorporated in the United Kingdom under the Companies Act and is registered in England and Wales. The address of the Company’s registered office is shown on page 185. The principal activities of the Group and the nature of the Group’s operations are set out in note 2 and in the Strategic Report on pages 6 to 69. The financial statements consolidate those of Hunting PLC (the “Company”) and its subsidiaries (together referred to as the “Group”), include the Group’s interests in associates and are presented in US dollars, the currency of the primary economic environment in which the Group operates.
The consolidated financial statements have been prepared in accordance with the Companies Act 2006 as applicable to companies using IFRS and those International Financial Reporting Standards (“IFRS”) and interpretations issued by the IFRS Interpretations Committee (“IFRS IC”) as adopted by the European Union. The financial statements have been prepared on a going concern basis under the historical cost convention as modified by the revaluation of the US deferred compensation plan and those financial assets and financial liabilities held at fair value. The Board’s consideration of the applicability of the going concern basis is detailed further in the Strategic Report on pages 68 and 69.
The principal accounting policies applied in the preparation of these financial statements are set out in note 40. These policies have been consistently applied to all the years presented, except for IFRS 16 Leases as described below.
Critical Judgements and Key EstimatesCritical judgements are those that the Directors have made in the process of applying the Group’s accounting policies and that have the most significant effect on the amounts recognised in the Group’s financial statements. Key assumptions are those assumptions concerning the future and other key sources of estimation uncertainty at the reporting period are those that may have a significant risk of causing a material adjustment to the carrying amounts of assets and liabilities within the next financial year. Other than judgements made regarding the recognition of certain inventory provisions (see note 20) and estimates regarding future cash flows for the purposes of impairment testing (see note 16), management believe that there are no other critical judgements or estimates applied in the preparation of the financial statements.
Adoption of New Standards, Amendments and InterpretationsIFRS 16 Leases (“IFRS 16”) has been adopted and is effective for the financial year beginning as of 1 January 2019. The Group has changed its accounting policies as a result of adopting IFRS 16. The new accounting policy and the impact of adopting this accounting standard have been shown in note 41.
A number of amendments to IFRS became effective for the financial year beginning on 1 January 2019, however the Group did not have to change its accounting policies or make retrospective adjustments as a result of adopting these amendments:
• IFRIC 23 Uncertainty over Income Tax Treatments • Annual Improvements to IFRS Standards 2015-2017 Cycle • Amendments to IAS 28: Long-term Interests in Associates and Joint Ventures
The following standards, amendments and interpretations are effective subsequent to the year-end, which have not been early adopted, and are being assessed to determine whether there is a significant impact on the Group’s results or financial position:
• IFRS 17 Insurance Contractsi
• Amendment to IAS 1 and IAS 8: Definition of Material • Amendment to IFRS 3 Business Combinationsi
• Interest Rate Benchmark Reform (Amendments to IFRS 9, IAS 39 and IFRS 7) • Amendment to IAS 1: Classification of Current and Non-current Liabilitiesi
i. Not yet endorsed by the European Union.
An assessment of the impact of adopting the amendments to IFRS 9, IAS 39 and IFRS 7 regarding Interest Rate Benchmark Reform is ongoing. A preliminary assessment indicates that none of the Group’s hedge accounting will be impacted by the reform regarding LIBOR. However, the Group’s RCF and other bilateral funding arrangements will be impacted by the move away from LIBOR, as LIBOR is currently used as the base for the interest rate applied.

123 Hunting PLC / 2019 Annual Report and AccountsP
urpose and C
ultureB
usiness Mod
el and Stakehold
ersG
overnanceP
erformance
Business S
trategy F
ina
nc
ial sta
tem
en
ts
2. Segmental Reporting
Following a restructuring in reporting lines and the reduced operations in Africa and the Middle East, the Middle East, Africa and Other operating segment has been combined with the Europe operating segment to form the Europe, Middle East and Africa segment (“EMEA”). In addition, due to diminished materiality, the Exploration and Production segment has been combined with the US segment. Therefore, for the year ended 31 December 2019, the Group has been reporting on five operating segments in its internal management reports, which are used to make strategic decisions by the Hunting PLC Board, the Group’s Chief Operating Decision Maker (“CODM”). The segment information for 2018 has been restated to reflect these changes.
The Group’s operating segments are strategic business units that offer different products and services primarily to international oil and gas companies and who undertake exploration and production activities. The Board assesses the performance of the operating segments based on revenue and underlying operating results. Underlying operating result is a profit-based measure and excludes the effects of amortisation of acquired intangible assets and any exceptional items (see note 6). The Directors believe that using the underlying operating result provides a more consistent and comparable measure of the operating segment’s performance.
Interest income and expenditure are not allocated to segments, as this type of activity is overseen by the central treasury function, which manages the funding position of the Group.
Inter-segment sales are priced in line with the Group’s transfer pricing policy on an arm’s-length basis. Costs and overheads are apportioned to the operating segments on the basis of time attributed to those operations by senior executives.
Further, the Board is also provided revenue information by product group, in order to help with an understanding of the drivers of Group performance trends.
Hunting Titan: Hunting Titan manufactures and distributes a broad range of well completion products and accessories. The segment’s products include both integrated and conventional gun systems and hardware, a complete portfolio of shaped charges and other energetics products, addressable and analogue switch technology and electronic instrumentation for certain measurements required in the oil and gas industry. Key products include H-1™ gun systems, ControlFire™ switches, EQUAfrac™ shaped charges, the T-Set™ line of setting tools and the PowerSet family of power charges. The business has manufacturing facilities in the US, Canada, China and Mexico, and is supported by strategically-located distribution centres across North America.
US: The US businesses supply premium connections, oil country tubular goods (“OCTG”), drilling tools, subsea equipment, intervention tools, electronics and complex deep hole drilling and precision machining services for the US and overseas markets. The segment also manufactures perforating system products for Hunting Titan. The segment also includes the Group’s legacy exploration and production activities in the Southern US and offshore Gulf of Mexico.
Canada: Hunting’s Canadian business manufactures premium connections and accessories for oil and gas operators in Canada, often focused on heavy oil plays, which require specialist tubing technologies. Canada also manufactures perforating guns for Hunting Titan.
Europe, Middle East and Africa (“EMEA”): Revenue from this segment is generated from the supply of OCTG and well intervention equipment to operators in the North Sea as well as the sale and rental of in-field well intervention products across the Middle East region. In the Middle East, the operations also act as a sales hub for other products manufactured globally by the Group, including OCTG and Perforating Systems.
Asia Pacific: Revenue from the Asia Pacific segment is primarily from the manufacture of premium connections and OCTG supply. Asia Pacific also manufactures perforating guns for sale to Hunting Titan and for sale in its domestic markets.
Due to its size and nature of operations, Hunting Titan’s activities are reported separately. Although the Canada segment does not meet the quantitative thresholds required by IFRS 8 for reportable segments, this segment is separately reported as it is separately monitored by the Board.
Accounting policies used for segmental reporting reflect those used for the Group.
The UK is the domicile of Hunting PLC.

124 Hunting PLC / 2019 Annual Report and Accounts
Notes to the Consolidated Financial Statements continued
2. Segmental Reporting continued
The following tables present the results of the operating segments on the same basis as that used for internal reporting purposes to the CODM.
(a) Segment Revenue and Profit
2019
Total segment revenue
$m
Inter-segment revenue
$m
Total external revenue
$m
Underlying result
$m
Amortisationi
and exceptional items
$m
Reported result
$m
Hunting Titan 375.5 (4.3) 371.2 68.6 (26.5) 42.1 US 363.2 (44.5) 318.7 26.9 (21.0) 5.9 Canada 35.7 (8.6) 27.1 (4.3) – (4.3)EMEA 123.0 (7.2) 115.8 (1.3) – (1.3)Asia Pacific 146.3 (19.1) 127.2 4.4 – 4.4 Total from operations 1,043.7 (83.7) 960.0 94.3 (47.5) 46.8
Net finance expense (1.2) – (1.2)Profit (loss) before tax from operations 93.1 (47.5) 45.6
Restatedii
2018
Total segment revenue
$m
Inter-segment revenue
$m
Total external revenue
$m
Underlying result
$m
Amortisationi and exceptional
items $m
Reported result
$m
Hunting Titan 418.2 (6.9) 411.3 106.9 (26.1) 80.8US 329.7 (43.0) 286.7 14.2 (3.2) 11.0Canada 44.8 (9.6) 35.2 (1.8) – (1.8)EMEA 107.3 (9.9) 97.4 (13.8) – (13.8)Asia Pacific 107.0 (26.2) 80.8 (0.8) – (0.8)Total from operations 1,007.0 (95.6) 911.4 104.7 (29.3) 75.4
Net finance expense (0.7) – (0.7)Profit (loss) before tax from operations 104.0 (29.3) 74.7
i. Relates to amortisation of intangible assets arising on the acquisition of businesses (referred to hereafter as amortisation of acquired intangible assets). ii. The segment information for 2018 has been restated for the change in the Group’s operating segments reported to the CODM, as discussed above.
Revenue from external customers attributable to the UK, the Group’s country of domicile, is $64.7m (2018 – $55.9m).
A breakdown of external revenue by products and services is presented below:
2019$m
Restatedi
2018$m
Perforating Systems 363.0 404.1OCTG 357.0 277.4Advanced Manufacturing 104.5 98.5Intervention Tools 51.7 55.1Subsea 44.5 30.5Drilling Tools 22.3 27.6Other 17.0 18.2Total 960.0 911.4
i. The amounts for 2018 have been restated to show the Well Testing product line as part of Intervention Tools and the Organic Oil Recovery product line has been included in Other as this presentation better represents those products produced by the Group’s companies.

125 Hunting PLC / 2019 Annual Report and AccountsP
urpose and C
ultureB
usiness Mod
el and Stakehold
ersG
overnanceP
erformance
Business S
trategy F
ina
nc
ial sta
tem
en
ts
2. Segmental Reporting continued
(b) Other Segment Items
2019 chargeRestatediii
2018 charge (credit)
Depreciationi
$mAmortisation
$mImpairmentii
$mDepreciation
$mAmortisation
$mImpairmentii
$m
Hunting Titan 7.7 27.3 1.4 5.3 26.7 1.3US 22.8 4.1 21.5 20.9 4.1 2.6Canada 1.7 0.1 1.0 1.3 – –EMEA 5.0 0.7 1.0 3.8 0.9 (0.1)Asia Pacific 4.4 0.1 1.1 3.7 0.2 0.5Total 41.6 32.3 26.0 35.0 31.9 4.3
i. Depreciation in 2019 comprises depreciation of property, plant and equipment $33.7m and depreciation of right-of-use assets $7.9m.ii Impairment comprises impairment of property, plant and equipment $19.0m (2018 – $1.0m), reversal of impairment of property, plant and equipment $nil
(2018 – $2.0m), impairment of trade and other receivables $1.1m (2018 – $1.1m) and impairment of inventories $5.9m (2018 – $4.2m).ii. From 1 January 2019, the Group has adopted IFRS 16 Leases (“IFRS 16”) by applying the modified retrospective approach; consequently the comparatives
for the 2018 reporting period have not been restated, as permitted under the specific transitional provisions in IFRS 16. However, the segment information for 2018 has been restated for the change in the Group’s operating segments reported to the CODM, as discussed above.
(c) Geographical Non-current AssetsInformation on the physical location of non-current assets is presented below. The allocated non-current assets below exclude deferred tax assets.
2019$m
Restated2018
$m
Hunting Titan – US 298.9 311.6 Hunting Titan – Canada 2.5 1.5 Hunting Titan – Other 0.8 0.7Hunting Titan 302.2 313.8US 314.9 311.9Canada 12.2 4.6Europei 61.1 49.6Middle East 2.3 3.2Asia Pacific 12.4 12.7
705.1 695.8Unallocated assetsDeferred tax assets 29.9 26.0Total non-current assets 735.0 721.8
i. The value of non-current assets located in the UK, the Group’s country of domicile, is $45.7m (2018 – $42.5m).
(d) Major CustomerThe Group received revenue of $112.6m (2018 – $117.1m) from the Halliburton Company Group, which is 12% (2018 – 13%) of the Group’s revenue from external customers. All of Hunting’s core operating segments have benefited from trading with Halliburton.

126 Hunting PLC / 2019 Annual Report and Accounts
Notes to the Consolidated Financial Statements continued
3. Revenue
In the following tables, a breakdown of the Group’s different revenue streams by segment has been given, including the disaggregation of revenue from contracts with customers.
2019
Revenue from
contracts with
customers$m
Rental revenue
$m
Other revenue
$m
Total external revenue
$m
Hunting Titan 371.2 – – 371.2 US 292.0 24.6 2.1 318.7 Canada 27.0 0.1 – 27.1 EMEA 109.1 6.7 – 115.8 Asia Pacific 127.2 – – 127.2 Total 926.5 31.4 2.1 960.0
Restatedi
2018
Revenue from
contracts with
customers$m
Rental revenue
$m
Other revenue
$m
Totalexternal revenue
$m
Hunting Titan 411.3 – – 411.3US 254.5 29.6 2.6 286.7Canada 35.1 0.1 – 35.2EMEA 87.8 9.6 – 97.4Asia Pacific 80.8 – – 80.8Total 869.5 39.3 2.6 911.4
i. The segment information for 2018 has been restated for the change in the Group’s operating segments reported to the CODM, as discussed above.
There is no material difference in the timing of revenue recognition between contracts with customers at a point in time and contracts with customers over time, as the majority of Hunting’s performance obligations are relatively short. Invoices for products are issued when the product is shipped or made available to customers for collection and invoices for services are issued either on completion of the service or, at a minimum, monthly for services covering more than one month.
4. Other Operating Income
2019$m
2018$m
Operating lease rental income 1.4 1.5Gain on disposal of property, plant and equipment 2.0 3.0Gain on disposal of intangible technology 2.3 –Gain on disposal of business 2.0 –Foreign exchange gains 0.5 2.1Other incomei 2.6 1.2
10.8 7.8
i. Includes fair value gains on derivatives not designated in a hedge of $0.6m (2018 – $nil).
During the year, the Clear-RunTM intangible technology was sold for $2.3m, with a gain on disposal of $2.3m and consideration from the sale of the Thru-Tubing business in Dubai was $2.4m, with a gain on disposal of $1.7m.
5. Operating Expenses
2019$m
2018$m
Administration expensesi before amortisationii and exceptional items 121.3 117.4Distribution and selling costs 61.1 58.8Loss on disposal of property, plant and equipment 0.5 2.0Operating expenses before amortisationii and exceptional items 182.9 178.2Amortisationii and exceptional items (note 6) 28.5 29.3
211.4 207.5
i. Includes foreign exchange losses of $2.7m (2018 – $1.1m) and a fair value loss on derivatives not designated in a hedge of $0.2m (2018 – $0.5m).ii. Relates to amortisation of intangible assets acquired as part of a business combination.

127 Hunting PLC / 2019 Annual Report and AccountsP
urpose and C
ultureB
usiness Mod
el and Stakehold
ersG
overnanceP
erformance
Business S
trategy F
ina
nc
ial sta
tem
en
ts
6. Amortisation and Exceptional Items
2019$m
2018$m
Impairment of Drilling Tools rental tools (notes 12 and 16(d)(i)) 19.0 – Closure of South African facility – (2.0) Closure of Kenya joint venture – 2.0 Charged to cost of sales 19.0 – Amortisation of intangible assets charged to operating expenses 28.5 29.3Total amortisation and exceptional items charged to profit (loss) from operations 47.5 29.3Taxation on amortisation and exceptional items (note 10) (12.8) (33.0)
34.7 (3.7)
Due to their size and nature, the following items have been disclosed as exceptional items in the financial statements.
During the year, impairment of our drilling tools motor fleet and associated parts of $19.0m has been recognised, with the majority of assets expected to be scrapped. For further detail on the impairment, please see note 16(d)(i).
In 2018, the Group reversed $2.0m of the impairment provision for property, plant and equipment in relation to the closure of the South African facility in Cape Town. The Group received $8.0m in 2018 in relation to the disposal of property, plant and equipment from the South African facility.
Also, given the modest drilling activity forecast for East Africa in the medium term, the Board made the decision to close its Kenyan joint venture in Mombasa in H1 2018. An impairment of property, plant and equipment totalling $1.0m, a loss on disposal of Kenya’s rental fleet of $0.5m and a provision for costs of $0.5m relating to the closure of the facility were recognised in 2018, totalling $2.0m.
7. Profit (Loss) from Operations
The following items have been charged (credited) in arriving at profit (loss) from operations:
2019$m
2018$m
Staff costs (note 8) 222.5 221.3Depreciation of property, plant and equipment (note 12) 33.7 35.0 Amortisation of intangible assets from business combinations 28.5 29.3 Amortisation of other intangible assets 3.8 2.6Amortisation of intangible assets – reported (included in operating expenses) (note 15) 32.3 31.9Impairment of property, plant and equipment – exceptional (included in cost of sales) (note 6) 19.0 1.0Gain on disposal of intangible technology (note 4) 2.3 –Gain on disposal of business (note 4) 2.0 – Net gain on disposal of property, plant and equipment – underlying (1.5) (1.0) Loss on disposal of property, plant and equipment – exceptional items (note 6) – 0.5Net gain on disposal of property, plant and equipment – reported (1.5) (0.5) Depreciation charge of Right-of-Use Assets (note 13) 7.9 – Expense relating to short-term leases and leases of low-value assets 3.0 –Expenses charged to the income statement under IFRS 16 Leases (note 24) 10.9 –Expenses charged to the income statement under IAS 17 Leases (note 24) – 13.8Research and development expenditure 4.2 3.4
Fees payable to the Group’s independent auditor and its associates are for:
2019i
$m2018ii
$m
The audit of these financial statements 1.7 1.7The audit of the financial statements of the Company’s subsidiaries 0.5 0.4Total audit 2.2 2.1Audit-related assurance services 0.1 0.1Total audit and audit-related services 2.3 2.2
i. Fees payable in 2019 are to the Group’s independent auditor, Deloitte LLP, and its associates.ii. Fees payable in 2018 are to the Group’s previous independent auditor, PricewaterhouseCoopers LLP, and its associates.

128 Hunting PLC / 2019 Annual Report and Accounts
Notes to the Consolidated Financial Statements continued
8. Employees
2019$m
2018$m
Wages and salaries (including annual cash bonuses) 190.7 183.7Social security costs 14.5 15.1Share-based payments (note 37) 9.1 13.2Other pension costs– defined contribution schemes (note 32) 8.7 7.6– defined benefit schemes (note 32) 0.1 2.5Pension income – net interest included in net finance expense (note 32) (0.2) (0.3)Staff costs for the year 222.9 221.8
Staff costs for the year are included in the financial statements as follows:
2019$m
2018$m
Staff costs included in profit (loss) from operations (note 7) 222.5 221.3Staff costs – pension income included in net finance expense (0.2) (0.3)Staff costs capitalised as R&D 0.6 0.8
222.9 221.8
The average monthly number of employees by geographical area (including executive Directors) during the year was:
2019Number
2018Number
US 1,962 1,798Canada 142 149Europe 265 274Asia Pacific 459 430Middle East, Africa and Mexico 48 76 2,876 2,727
The average monthly number of employees by operating segment (including executive Directors) during the year was:
2019Number
2018Number
Hunting Titan 684 646US 1,262 1,149Canada 127 133EMEA 292 326Asia Pacific 443 415Central 68 58 2,876 2,727
The actual number of employees at the year-end was:
2019Number
2018Number
Male 2,327 2,182Female 629 590 2,956 2,772

129 Hunting PLC / 2019 Annual Report and AccountsP
urpose and C
ultureB
usiness Mod
el and Stakehold
ersG
overnanceP
erformance
Business S
trategy F
ina
nc
ial sta
tem
en
ts
8. Employees continued
Key management comprises the Board and the Executive Committee, which was formed on 30 August 2018. Their aggregate remuneration in the year was:
2019$m
2018i
$m
Salaries, annual cash bonuses and short-term employee benefits 5.7 5.4Social security costs 0.4 0.3Post-employment benefits 0.3 0.3Share-based payments 2.1 2.7
8.5 8.7
i. The 2018 numbers for the Executive Committee are pro-rata from formation on 30 August 2018 to 31 December 2018.
Remuneration of the Board, included as part of Key Management compensation, can be found in the Annual Report on Remuneration on pages 94 and 95. The Annual Report on Remuneration disclosures do not include Executive Committee members who are not part of the Board and discloses share scheme remuneration on a vested rather than accruals basis.
Short-term employee benefits comprise healthcare insurance, company cars and fuel benefits. Post-employment benefits comprise employer pension contributions. Share-based payments comprise the charge to the income statement.
9. Net Finance Expense
2019$m
2018$m
Finance income:Bank balances and deposits 0.4 0.2Pension interest income 0.3 0.4Foreign exchange gains 2.4 0.9Fair value gains on derivative financial instruments 0.5 0.9Fair value gains on Money Market Funds 0.6 0.1Other finance income – 0.1 4.2 2.6Finance expense:Interest on lease liabilities (2.2) –Bank fees and commissions (1.3) (1.2)Foreign exchange losses (0.8) (1.4)Fair value losses on derivative financial instruments (0.7) (0.1)Bank borrowings – (0.1)Other finance expense (0.4) (0.5)
(5.4) (3.3)Net finance expense (1.2) (0.7)
10. Taxation
2019 2018
Before amortisationi
and exceptional items
$m
Amortisationi and exceptional
items$m
Total$m
Before amortisationi
and exceptional items
$m
Amortisationi and exceptional
items$m
Total$m
Current tax – current year charge 10.2 – 10.2 13.4 – 13.4– adjustments in respect of prior years (3.5) – (3.5) (3.7) – (3.7)
6.7 – 6.7 9.7 – 9.7Deferred tax– origination and reversal of temporary
differences 14.1 (12.8) 1.3 17.1 (7.7) 9.4– recognition of US deferred tax asset – – – (3.6) (25.3) (28.9)– change in tax rate – – – (0.4) – (0.4)– adjustments in respect of prior years (3.8) – (3.8) (0.8) – (0.8)
10.3 (12.8) (2.5) 12.3 (33.0) (20.7)Taxation charge (credit) 17.0 (12.8) 4.2 22.0 (33.0) (11.0)
i. Relates to amortisation of intangible assets arising on the acquisition of businesses.

130 Hunting PLC / 2019 Annual Report and Accounts
Notes to the Consolidated Financial Statements continued
10. Taxation continued
The effective tax rate applicable to operations before amortisation and exceptional items is 18% (2018 – 21%).
A tax credit of $8.4m (2018 – $7.7m) in respect of current year amortisation of intangible assets recognised as part of amortisation and exceptional items and a tax credit of $4.4m in respect of the impairment of drilling tools have been included in the income statement. In 2018, a further credit of $25.3m relating to the recognition of US deferred tax assets was shown as a credit against amortisation and exceptional items, consistent with our tax treatment on amortisation in prior years. The deferred tax asset was recognised for the US due to strong performance in 2018. It is still appropriate to continue recognising the deferred tax assets following the strong performance from the US in 2019 and current projections for the next two years.
The adjustment in respect of prior years of $3.5m (2018 – $3.7m) for current tax includes the release of provisions for uncertain tax positions that are no longer required and normal true-ups.
The reconciliation below reconciles the tax on the Group’s reported profit before tax to a weighted average tax rate for the Group based on the tax rates applicable to each entity in the Group. A weighted average applicable rate for the year has been used, as this reflects the applicable rates for the countries in which the Group has earned profits. The total tax charge (2018 – credit) for the year is lower (2018 – lower) than the weighted average rate of tax of 19% (2018 – 27%) for the following reasons:
2019$m
Restatedi
2018$m
Reported profit before tax 45.6 74.7Tax at 19% (2018 – 27%) 8.5 19.9Permanent differences including tax credits 3.6 2.6Current year losses not recognised 2.7 0.5Previously unrecognised tax losses (3.3) (29.1)Change in tax rates – (0.4)Adjustments in respect of prior years (7.3) (4.5)Taxation 4.2 (11.0)
i. Previously, the tax reconciliation reconciled the tax on the Group’s reported profit before tax to the UK’s rate of corporation tax. The reconciliation has been restated as the revised presentation is considered to provide the most meaningful information to users of the financial statements as the Group’s profits are earned across a number of jurisdictions.
A number of changes to the UK corporation tax system were announced in the Chancellor’s Autumn Budget on 29 October 2018. The Finance Act 2019 was enacted on 12 February 2019. The Finance Bill 2016, which received Royal Assent on 15 September 2016, included reductions to the main rate of corporation tax to reduce the rate to 17% from 1 April 2020.
The Chancellor of the Exchequer has announced a budget on Wednesday 11 March 2020 and it is highly anticipated that the UK corporation tax rate will remain at 19%, with the Finance Bill 2016 rate of 17% from 1 April 2020 being revoked. Our accounts reflect the tax legislation enacted at the date of preparation but the future change of corporation tax rate is not expected to have a material impact on the Group’s tax balances.
Tax effects relating to each component of other comprehensive income were as follows:
2019 2018
Before tax$m
Tax (charged) credited
$mAfter tax
$mBefore tax
$m
Tax (charged) credited
$mAfter tax
$m
Exchange adjustments 5.5 (0.1) 5.4 (9.8) 0.2 (9.6)Release of foreign exchange on liquidation of subsidiaries (0.3) 0.1 (0.2) – – –Fair value (losses) gains originating on net investment hedge arising during the year (0.8) 0.1 (0.7) 1.4 (0.2) 1.2Fair value gains originating on cash flow hedges arising during the year – – – 0.3 (0.1) 0.2Remeasurement of defined benefit pension schemes (0.2) (0.1) (0.3) 1.1 0.4 1.5
4.2 – 4.2 (7.0) 0.3 (6.7)

131 Hunting PLC / 2019 Annual Report and AccountsP
urpose and C
ultureB
usiness Mod
el and Stakehold
ersG
overnanceP
erformance
Business S
trategy F
ina
nc
ial sta
tem
en
ts
11. Earnings per Share
Basic earnings per share (“EPS”) is calculated by dividing the earnings attributable to Ordinary shareholders by the weighted average number of Ordinary shares outstanding during the year.
For diluted earnings per share, the weighted average number of outstanding Ordinary shares is adjusted to assume conversion of all dilutive potential Ordinary shares. The dilution in respect of share options applies where the exercise price is less than the average market price of the Company’s Ordinary shares during the year and the possible issue of shares under the Group’s long-term incentive plans.
Reconciliations of the earnings and weighted average number of Ordinary shares used in the calculations are set out below:
2019$m
2018$m
Reported earnings attributable to Ordinary shareholders 39.7 89.3Add: amortisationi and exceptional items after taxation (note 6) 34.7 (4.5)
Underlying earnings attributable to Ordinary shareholders 74.4 84.8
millions millions
Basic weighted average number of Ordinary shares 165.2 164.1Long-term incentive plans 3.9 6.6Adjusted weighted average number of Ordinary shares 169.1 170.7
cents cents
Reported earnings per shareBasic EPS 24.0 54.4Diluted EPS 23.5 52.3
Underlying earnings per shareBasic EPS 45.0 51.6Diluted EPS 43.9 49.6
i. Relates to amortisation of intangible assets arising on the acquisition of businesses.
12. Property, Plant and Equipment
Year ended 31 December 2019
Land and buildings
$m
Plant, machinery and motor
vehicles$m
Rental tools$m
Oil and gas exploration and
developmenti $m
Total$m
Cost:At 1 January 250.0 341.3 80.9 182.3 854.5 Exchange adjustments 1.5 1.6 0.5 – 3.6 Additions 7.2 23.2 5.5 – 35.9 Acquisition of subsidiary 8.3 4.0 – – 12.3 Disposals – (8.2) (3.3) (54.1) (65.6)Disposal of business – (0.3) (3.4) – (3.7)Reclassification to other intangible assets – (1.4) – – (1.4)Reclassification to inventories – – (0.1) – (0.1)At 31 December 2019 267.0 360.2 80.1 128.2 835.5
Accumulated depreciation and impairment:At 1 January 45.5 231.6 37.6 179.6 494.3 Exchange adjustments 0.4 1.5 0.4 – 2.3 Charge for the year 6.2 23.7 3.1 0.7 33.7 Impairment of assets (note 6) – – 19.0 – 19.0 Disposals – (7.7) (2.1) (54.1) (63.9)Disposal of business – (0.3) (3.2) – (3.5)Reclassification to other intangible assets – (0.9) – – (0.9)Reclassification to inventories – – (0.2) – (0.2)At 31 December 2019 52.1 247.9 54.6 126.2 480.8
Net book amount 214.9 112.3 25.5 2.0 354.7
i. The accumulated cost, depreciation and impairment of those oil and gas exploration and development assets whose licences have expired have been disposed of during the year.
During the year, impairment of our drilling tools motor fleet and associated parts of $19.0m has been recognised, with the majority of assets expected to be scrapped. The impairment is shown in the US segment (note 2). For further detail on the impairment, please see note 16(d)(i).

132 Hunting PLC / 2019 Annual Report and Accounts
Notes to the Consolidated Financial Statements continued
12. Property, Plant and Equipment continued
Included in the net book amount is expenditure relating to assets in the course of construction of $2.6m (2018 – $2.5m) for buildings and $5.5m (2018 – $7.1m) for plant and machinery.
Group capital expenditure committed for the purchase of property, plant and equipment, but not provided for in these financial statements, amounted to $2.2m (2018 – $15.0m).
The net book amount of land and buildings of $214.9m (2018 – $204.5m) comprises freehold land and buildings of $213.2m (2018 – $202.4m) and capitalised leasehold improvements of $1.7m (2018 – $2.1m).
The Group sub-lets certain items of property, plant and equipment under operating leases. The net book value of items that are sub-let included in the table above is $3.9m for land and buildings.
In accordance with the amendments made to the Group’s core committed bank facility in July 2016, security has been granted over specific properties, plant and equipment in the UK and US, which have a carrying value of $217.2m (2018 – $229.6m).
Year ended 31 December 2018
Land and buildings
$m
Plant, machinery and motor
vehicles$m
Rental tools$m
Oil and gas exploration and
development$m
Total$m
Cost:At 1 January 262.3 336.2 87.3 181.8 867.6Exchange adjustments (2.7) (4.7) (1.2) – (8.6)Additions 3.6 20.1 5.8 0.5 30.0Disposals (13.2) (10.3) (9.7) – (33.2)Reclassification to inventories – (0.1) (1.2) – (1.3)Reclassification – 0.1 (0.1) – –At 31 December 2018 250.0 341.3 80.9 182.3 854.5
Accumulated depreciation and impairment:At 1 January 46.2 218.0 41.4 178.7 484.3Exchange adjustments (0.8) (3.8) (1.1) – (5.7)Charge for the year 6.4 23.6 4.1 0.9 35.0Impairment of assets (note 6) – 1.0 – – 1.0Reversal of impairment of assets (1.9) (0.1) – – (2.0)Disposals (4.4) (6.8) (5.8) – (17.0)Reclassification to inventories – (0.4) (0.9) – (1.3)Reclassification – 0.1 (0.1) – –At 31 December 2018 45.5 231.6 37.6 179.6 494.3
Net book amount 204.5 109.7 43.3 2.7 360.2
In 2018, the Group reversed $1.9m of the impairment provision for the Cape Town property and $0.1m for plant and machinery, which were sold in 2018 following the Board’s decision to close the South African facility. The reversal of the impairment was recorded in the 2018 financial statements as an exceptional item (see note 6) and is shown in the EMEA operating segment (note 2).
Given the modest drilling activity forecast for East Africa in the medium term, the Board has made the decision to close its Kenyan joint venture in Mombasa in H1 2018. Plant, machinery and motor vehicles were impaired by $1.0m. The impairment was recorded in the 2018 financial statements as an exceptional item (see note 6) and is shown in the EMEA segment (note 2).
The net book amount of property, plant and equipment at 1 January 2018 was $383.3m.
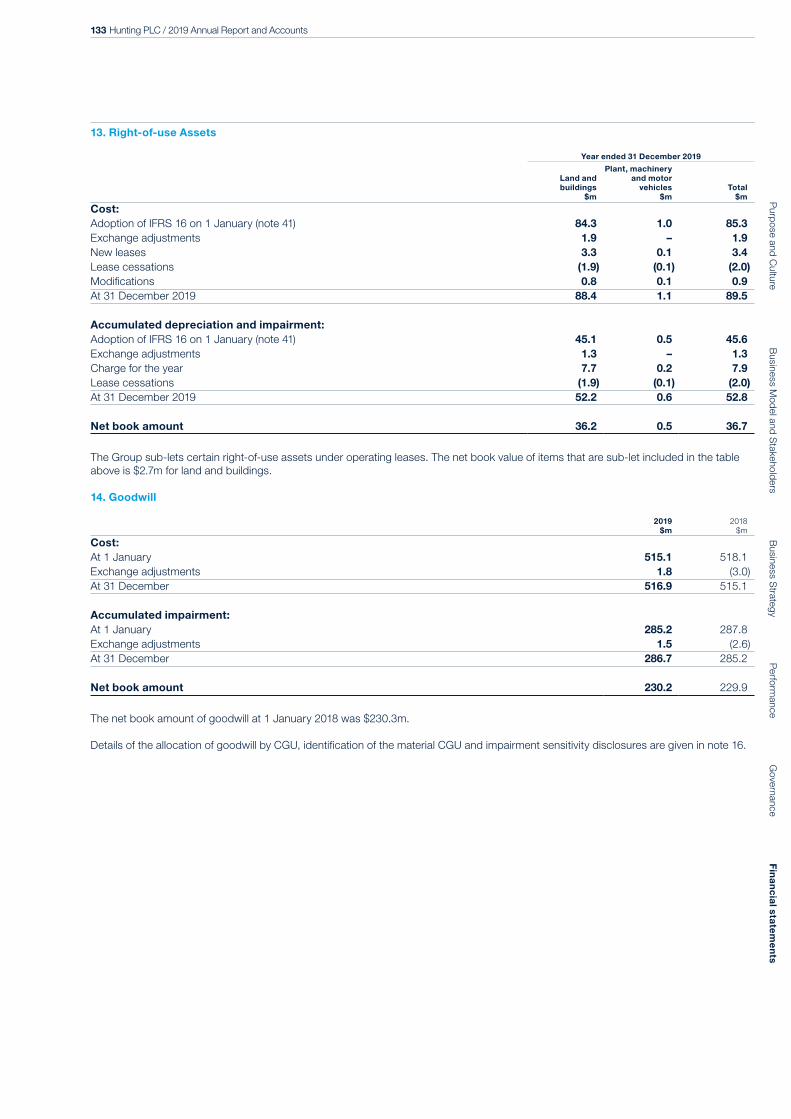
133 Hunting PLC / 2019 Annual Report and AccountsP
urpose and C
ultureB
usiness Mod
el and Stakehold
ersG
overnanceP
erformance
Business S
trategy F
ina
nc
ial sta
tem
en
ts
13. Right-of-use Assets
Year ended 31 December 2019
Land and buildings
$m
Plant, machinery and motor
vehicles$m
Total$m
Cost:Adoption of IFRS 16 on 1 January (note 41) 84.3 1.0 85.3 Exchange adjustments 1.9 – 1.9 New leases 3.3 0.1 3.4 Lease cessations (1.9) (0.1) (2.0)Modifications 0.8 0.1 0.9 At 31 December 2019 88.4 1.1 89.5
Accumulated depreciation and impairment:Adoption of IFRS 16 on 1 January (note 41) 45.1 0.5 45.6 Exchange adjustments 1.3 – 1.3 Charge for the year 7.7 0.2 7.9 Lease cessations (1.9) (0.1) (2.0)At 31 December 2019 52.2 0.6 52.8
Net book amount 36.2 0.5 36.7
The Group sub-lets certain right-of-use assets under operating leases. The net book value of items that are sub-let included in the table above is $2.7m for land and buildings.
14. Goodwill
2019$m
2018$m
Cost:At 1 January 515.1 518.1Exchange adjustments 1.8 (3.0)At 31 December 516.9 515.1
Accumulated impairment:At 1 January 285.2 287.8Exchange adjustments 1.5 (2.6)At 31 December 286.7 285.2
Net book amount 230.2 229.9
The net book amount of goodwill at 1 January 2018 was $230.3m.
Details of the allocation of goodwill by CGU, identification of the material CGU and impairment sensitivity disclosures are given in note 16.

134 Hunting PLC / 2019 Annual Report and Accounts
Notes to the Consolidated Financial Statements continued
15. Other Intangible Assets
2019
Customer relationships
$m
Unpatented technology
$m
Patents and trademarks
$mOther
$mTotal
$m
Cost:At 1 January 246.9 77.9 58.1 22.0 404.9 Exchange adjustments – 0.2 0.1 0.2 0.5 Additions – 4.0 1.1 5.2 10.3 Disposals (35.0) – – (16.3) (51.3)Reclassification from property, plant and equipment – – – 1.4 1.4 Reclassification – (0.3) 0.1 0.2 – At 31 December 211.9 81.8 59.4 12.7 365.8
Accumulated amortisation and impairment:At 1 January 193.6 42.3 47.7 21.5 305.1 Exchange adjustments – 0.1 0.1 0.1 0.3 Charge for the year (included in operating expenses) 20.8 8.3 2.4 0.8 32.3 Disposals (35.0) – – (16.3) (51.3)Reclassification from property, plant and equipment – – – 0.9 0.9 Reclassification – (0.1) – 0.1 – At 31 December 179.4 50.6 50.2 7.1 287.3
Net book amount 32.5 31.2 9.2 5.6 78.5
2018
Customer relationships
$m
Unpatented technology
$m
Patents and trademarks
$mOther
$mTotal
$m
Cost:At 1 January 247.1 72.8 57.3 22.0 399.2Exchange adjustments (0.2) (0.3) (0.1) (0.3) (0.9)Additions – 5.4 0.9 0.3 6.6At 31 December 246.9 77.9 58.1 22.0 404.9
Accumulated amortisation and impairment:At 1 January 172.1 35.6 45.1 21.0 273.8Exchange adjustments (0.2) (0.1) – (0.3) (0.6)Charge for the year 21.7 6.8 2.6 0.8 31.9At 31 December 193.6 42.3 47.7 21.5 305.1
Net book amount 53.3 35.6 10.4 0.5 99.8
The net book amount of other intangible assets at 1 January 2018 was $125.4m.
Other intangible assets of $5.6m (2018 – $0.5m) include software of $5.4m (2018 – $0.4m).
Internally generated intangible assets have been included within unpatented technology. The carrying value at the beginning of the year was $20.8m (2018 – $17.1m). Additions during the year were $4.0m (2018 – $5.4m) and the amortisation charge for the year was $2.9m (2018 – $1.4m). After positive foreign exchange movements of $0.2m (2018 – $0.3m adverse), the carrying value at the end of the year was $22.1m (2018 – $20.8m).
Internally generated intangible assets have also been included within patents. The carrying value at the beginning of the year was $4.4m (2018 – $4.5m). Additions during the year were $1.0m (2018 – $0.9m) and the amortisation charge for the year was $0.6m (2018 – $0.9m). After foreign exchange movements of $nil (2018 – $0.1m adverse movement), the carrying value at the end of the year was $4.8m (2018 – $4.4m).
All intangible assets are regarded as having a finite life and are amortised accordingly. All amortisation charges relating to intangible assets have been charged to operating expenses.
Individual Material Intangible AssetsIncluded in the table above are customer relationships, purchased as part of the Titan acquisition with a net book value of $32.5m (2018 – $51.5m). The cost brought forward and at the year-end was $190.2m (2018 – $190.2m). Following the amortisation charge of $19.0m for the year (2018 – $19.0m), accumulated amortisation at the year-end was $157.7m (2018 – $138.7m). The intangible asset has a remaining amortisation period at the year-end of 1.8 years (2018 – 2.8 years).

135 Hunting PLC / 2019 Annual Report and AccountsP
urpose and C
ultureB
usiness Mod
el and Stakehold
ersG
overnanceP
erformance
Business S
trategy F
ina
nc
ial sta
tem
en
ts
16. Impairment of Non-financial Assets
(a) Impairment Testing Process (i) Cash-generating Units (“CGUs”)The recoverable amount for each CGU has been determined using a fair value less costs of disposal (“FVLCD”) method, which represents the value of the CGU in a sales transaction on an arm’s-length basis. As there is no active market for the Group’s CGUs, the FVLCD is determined using discounted cash flow techniques based on the estimated future gross cash flows that are expected to be generated by the CGU and discounted at a rate that is determined for each CGU in isolation by consideration of their business risk profiles. This method allows approved capital projects that are in progress to be included. The recoverable amount calculations use discounted pre-tax nominal cash flow projections. The FVLCD is a Level 3 measurement as per the fair value hierarchy as defined within IFRS 13 due to unobservable inputs used in the valuation.
The key assumptions for the recoverable amount calculations are revenue growth rates, taking into account the impact these have on margins, terminal growth rates and the discount rates applied.
For 2020, cash flows are based on the approved Board budget. For 2021 to 2024, management has made revenue projections using Spears & Associates “Drilling and Production Outlook” independent reports as a default basis, selecting the most appropriate geographic markets and drivers (rig count, footage drilled or E&P spend) for each CGU. Management has then applied judgemental changes to revenue growth expectations, if appropriate, to reflect circumstances specific to the CGU. Having determined the projected revenues, management has then modelled the expected impact on margins and cash flow from the resulting revenue projections. This process can give a diverse range of outcomes depending on market or business specific conditions. Compound annual growth rates (“CAGR”) for revenue for the CGUs from 2019 to 2024 vary between 3% and 12% (2018 – CAGR from 2018 to 2023 between 3% and 13%). After 2024, a terminal value has been calculated assuming growth of 25 basis points above assumed inflation (2018 – 50 basis points), giving nominal growth rates between 1% and 2% (2018 – between 2% and 3%).
Cash flows have been discounted using nominal pre-tax rates between 9% and 10% (2018 – 10% and 11%). The discount rates reflect current market assessments of the equity market risk premiums, the volatility of returns, the risks associated with the cash flows, the likely external borrowing rate of the CGU and expected levels of leverage. Consideration has also been given to other factors such as currency risk, operational risk and country risk.
(ii) Individual assetsFor individual assets, an impairment test is conducted if there are indicators of impairment. Impairment arises when the carrying value of the asset is greater than the higher of its fair value less costs of disposal or its value in use. If the cash flows of an asset cannot be assessed individually the asset or a group of assets are aggregated into a CGU and tested as described above.
(b) Impairment Tests for GoodwillGoodwill is allocated to the Group’s cash-generating units (“CGUs”) as follows:
CGU2019
$m2018
$m
Hunting Titan 180.5 180.4Hunting Stafford “Subsea” (formally National Coupling Company) 15.0 15.0Dearborn 12.5 12.5US Manufacturing 12.5 12.5Hunting Specialty 5.0 5.0European Well Intervention (Welltonic acquisition) 4.7 4.5At 31 December 230.2 229.9
Goodwill is tested annually for impairment. No impairment charges have been recorded as a result of the goodwill impairment review carried out in the year (2018 – $nil).
(i) Material CGU Hunting Titan – Hunting Titan represents 78% of the goodwill balance at the year-end (2018 – 78%) and has a carrying value, including amounts recognised on consolidation such as goodwill, of $444.1m (2018 – $500.8m). Projected annual growth rates from 2019 to 2024 vary between minus 6% and 6% with a CAGR of 3% (2018 – growth rates from 2018 to 2023 between 2% and 5% with a CAGR of 3%). Growth rates are more volatile given expected declines in US onshore activity in 2020. Cash flows have been discounted at a nominal pre-tax rate of 10% (2018 – 11%). There is no reasonably foreseeable change in revenue growth rates, or terminal growth rates, or discount rates, which will give rise to impairment charges.
(ii) Sensitivities Management has reviewed various downside sensitivities versus the base case assumptions used in our projections. These covered revenue growth rates, terminal revenue growth rates and discount rates. Management has identified the following reasonably possible changes which could result in an impairment:
• For our European Well Intervention CGU, if the CAGR from 2019 to 2024 is below 7% (2018 – CAGR from 2018 to 2023 below 6%), this will result in an impairment to the $4.7m goodwill carrying value (2018 – $4.5m).
For other CGUs that carry goodwill, management has concluded that there are no reasonably foreseeable changes in key assumptions that will give rise to goodwill impairment charges.

136 Hunting PLC / 2019 Annual Report and Accounts
Notes to the Consolidated Financial Statements continued
16. Impairment of Non-financial Assets continued
(c) Impairment Tests for Other Intangible Assets Included in other intangible assets are balances for CGUs that may be subject to impairment sensitivities as follows: European Well Intervention $2.9m (2018 – $2.8m) and Canada $2.0m (2018 – $1.9m). Details of the sensitivity for the European Well Intervention CGU can be found in (b) above and for Canada details can be found in (d) below.
(d) Impairment Tests for PPE (i) US Drilling ToolsIn 2019, our US Drilling Tools business was impacted by a 10% reduction in the US onshore rig count over the course of the year, which was a significantly worse outcome than expected at the end of 2018. A further decline in US onshore rig activity is now expected in 2020.
In 2019, the market situation has been further impacted by an excess level of tools available for rental, partly through new entrants to the market in recent years. The market has also been evolving towards the usage of higher torque/higher speed mud motors influenced by increasing lateral lengths in horizontal drilling. Hunting’s drilling tools fleet includes a number of older motors which have a lower torque and drilling speed than modern tools and these have had very low rates of utilisation. Rental rates on these motors fell by approximately 50% during the year. The business has, therefore, significantly underperformed versus its 2019 budget and 2018 results.
As a result of these impairment indicators, a detailed review of our motor fleet and associated parts has been carried out considering each category/configuration of motor to determine the economic viability of these assets. Our view is that for a number of categories/configurations of motors utilisation is unlikely to return to meaningful levels and an impairment of $19.0m has been recognised, with the majority of assets expected to be scrapped. Given the materiality of this write-off, this has been treated as exceptional as disclosed innote 6. The carrying value of PPE at 2019, which could be subject to further impairment if market conditions are worse than expected, is $23.6m. If growth rates in our projection period from 2020 to 2024 are less than 4% per annum, which is a reasonably possible change, further impairments may arise.
(ii) CanadaFor the Canada CGU, if the CAGR from 2019 to 2024 is below 3%, which is a reasonably possible change, this will result in an impairment (2018 – below 4% CAGR for 2018 to 2023). The net book value of PPE in Canada is $2.8m (2018 – $2.7m).
For other CGUs, management has concluded that there are no reasonably foreseeable changes in key assumptions that will give rise to PPE impairment charges.
(iii) Exploration and Production (“E&P”) The productive and development oil and gas assets of our E&P business are tested for impairment at least annually. Following a valuation of oil and gas reserves at 31 December 2019, performed for impairment purposes, no impairment charges were required (2018 – $nil). The recoverable amount of oil and gas development expenditure is based on value-in-use. These calculations use discounted cash flow projections based on estimated oil and gas reserves, future production and the income and costs in generating this production. Cash flows are based on productive lives between one and 15 years and are discounted using a nominal pre-tax rate of 10% (2018 – 10%).
17. Investments
2019$m
2018$m
Non-current:Listed equity investments and mutual funds 1.6 1.7Investments in associates 0.7 0.7
2.3 2.4Current:Listed equity investments and mutual funds 0.5 – 2.8 2.4
The listed equity investments and mutual funds are equity instruments measured at fair value though profit or loss. Returns on the listed equity investments and mutual funds of $0.3m (2018 – $nil) have been included in finance income in note 9.
18. Trade and Other Receivables
2019$m
2018$m
Non-current:Loan note – 0.6Prepayments 2.0 2.5Other receivables 0.7 0.4 2.7 3.5

137 Hunting PLC / 2019 Annual Report and AccountsP
urpose and C
ultureB
usiness Mod
el and Stakehold
ersG
overnanceP
erformance
Business S
trategy F
ina
nc
ial sta
tem
en
ts
18. Trade and Other Receivables continued
2019
Contracts with
customers$m
Rental receivables
$m
Other receivables
$mTotal
$m
Current:Contract assets 8.3 – – 8.3 Trade receivables 149.0 10.4 – 159.4 Accrued revenue 12.0 0.3 – 12.3 Gross receivables 169.3 10.7 – 180.0 Less: provision for impairment (3.6) (0.3) – (3.9)Net receivables 165.7 10.4 – 176.1 Prepayments – – 21.9 21.9 Loan note – – 0.7 0.7 Other receivables – – 3.3 3.3 Net book amount 165.7 10.4 25.9 202.0
2018
Contracts with
customers$m
Rental receivables
$m
Other receivables
$mTotal
$m
Current:Contract assets 11.8 – – 11.8Trade receivables 172.1 12.6 0.3 185.0Accrued revenue 5.3 2.6 – 7.9Gross receivables 189.2 15.2 0.3 204.7Less: provision for impairment (2.7) (0.3) – (3.0)Net receivables 186.5 14.9 0.3 201.7Prepayments – – 22.5 22.5Loan note – – 0.6 0.6Other receivablesi – – 6.2 6.2Net book amount 186.5 14.9 29.6 231.0
i. Other receivables include a provision for impairment of $0.1m.
Trade receivables of $159.4m (2018 – $185.0m), accrued revenue of $12.3m (2018 – $7.9m) and the loan note of $0.7m (2018 – $1.2m) are financial assets measured at amortised cost. Interest income on the loan note is included within other finance income in note 9. The amount is immaterial in 2019 and 2018. Interest charged on the loan is based on three-month LIBOR plus 2.75%.
Other receivables generally arise from transactions outside the usual operating activities of the Group and comprise receivables from tax receivables (VAT, GST, franchise taxes, and sales and use taxes) of $2.0m (2018 – $4.1m), derivative financial assets $0.3m (2018 – $0.7m) associates of $nil (2018 – $0.4m) and other receivables of $1.0m (2018 – $1.4m). Receivables from associates and other receivables are financial assets measured at amortised cost. Derivative financial assets of $0.2m (2018 – $0.5m) are held for trading measured at fair value through profit or loss and derivative financial assets of $0.1m (2018 – $0.2m) are designated in a hedge measured at fair value.
The Group does not hold any collateral as security and no assets have been acquired through the exercise of any collateral previously held. In accordance with the amendments made to the Group’s core committed bank facility in July 2016, security has been granted over certain trade receivables and other receivables in the UK, US and Canada, which have a gross value of $127.3m (2018 – $153.6m). For the receivables pledged as security, their carrying value approximates their fair value.
Impairment of Trade and Other ReceivablesThe Group has chosen to apply lifetime expected credit losses (“ECLs”) to trade receivables, accrued revenue and contract assets upon their initial recognition. Each entity within the Group uses provision matrices for recognising ECLs on its receivables, which are based on actual credit loss experience over the past two years, at a minimum. Receivables are appropriately grouped by geographical region, product type or type of customer, and separate calculations produced, if historical or forecast credit loss experience shows significantly different loss patterns for different customer segments. Actual credit loss experience is then adjusted to reflect differences in economic conditions over the period the historical data was collected, current economic conditions, forward-looking information and the Group’s view of economic conditions over the expected lives of the receivables.
The Group assesses, on a forward-looking basis, the ECLs at each balance sheet date associated with its loan note that is carried at amortised cost. The impairment methodology applied, following the adoption of the general model under IFRS 9, will depend on whether there has been a significant increase in credit risk. To assess whether there has been a significant increase in credit risk, the risk of default occurring on the loan as at 31 December 2019 is compared with the risk of default occurring as at the date of initial recognition, being 31 March 2015. Indications of a significant increase in credit risk include events that have a negative impact on the estimated future cash flows and if any payments under the terms of the debt are more than 30 days overdue. Macroeconomic information is also considered, including the current state of the tanker shipping market. The terms of the loan note were revised during 2017. There have been no breaches of the revised terms during 2019. Therefore, the Group does not consider there to have been a significant increase in credit risk.

138 Hunting PLC / 2019 Annual Report and Accounts
Notes to the Consolidated Financial Statements continued
18. Trade and Other Receivables continued
Impairment of Trade and Other Receivables continuedAt 31 December 2019, the ageing of the Group’s gross financial assets, based on days overdue, is as follows:
Not overdue
$m
1 – 30 days
$m
31 – 60 days
$m
61 – 90 days
$m
91 – 120 days
$m
More than 120 days
$m
Total gross financial
assets$m
Contract assets 8.3 – – – – – 8.3 Trade receivables – contracts with customers 79.4 28.5 16.3 8.6 8.2 8.0 149.0 Trade receivables – rental receivables 2.7 4.5 1.2 0.9 0.4 0.7 10.4 Accrued revenue – contracts with customers 12.0 – – – – – 12.0 Accrued revenue – rental receivables 0.3 – – – – – 0.3 Loan note 0.7 – – – – – 0.7 Other receivables 1.2 – – 0.1 – – 1.3 104.6 33.0 17.5 9.6 8.6 8.7 182.0
Not overdue
$m
1 – 30 days
$m
31 – 60 days
$m
61 – 90 days
$m
91 – 120 days
$m
More than 120 days
$m
Total gross financial
assets$m
Contract assets 11.8 – – – – – 11.8 Trade receivables – contracts with customers 102.0 36.5 8.5 8.7 8.2 8.2 172.1 Trade receivables – rental receivables 4.4 4.0 1.3 2.4 – 0.5 12.6 Trade receivables – other 0.3 – – – – – 0.3 Accrued revenue – contracts with customers 5.3 – – – – – 5.3 Accrued revenue – rental receivables 2.6 – – – – – 2.6 Loan note 1.2 – – – – – 1.2 Other receivables 2.0 0.2 – – – 0.4 2.6 129.6 40.7 9.8 11.1 8.2 9.1 208.5
Concentrations of credit risk with respect to trade receivables are limited due to the Group’s wide and unrelated customer base. The maximum exposure to credit risk is the carrying amount of each class of financial assets mentioned above. The carrying value of each class of receivable approximates their fair value as described in note 29.
Whilst a proportion, 11%, (2018 – 9%) of the Group’s trade receivables are more than 90 days overdue these have not been impaired. Some of these debts have become overdue due to billing issues and others because the customer has just been slow to pay. As there is no history of bad debts and there are no indicators that the debts will not be settled, these have not been impaired. These customers are monitored very closely for any indicators of impairment.
During the year, the movements on the provision for impairment were as follows:
2019
Contracts with
customers$m
Rental receivables
$m
Other receivables
$mTotal
$m
At 1 January 2.7 0.3 0.1 3.1Charge to the income statement – lifetime expected credit losses 1.6 – – 1.6Unused provisions released to the income statement (0.4) – (0.1) (0.5)Utilised against receivables written off (0.3) – – (0.3)
3.6 0.3 – 3.9
2018
Contracts with
customers$m
Rental receivables
$m
Other receivables
$mTotal
$m
At 1 January (calculated under IAS 39) 4.4 0.4 – 4.8Amounts restated through opening retained earnings 0.2 – – 0.2At 1 January restated (calculated under IFRS 9) 4.6 0.4 – 5.0Exchange adjustments (0.1) – – (0.1)Charge to the income statement – lifetime expected credit losses 0.9 0.6 0.1 1.6Unused provisions released to the income statement (0.3) (0.2) – (0.5)Utilised against receivables written off (2.4) (0.5) – (2.9)
2.7 0.3 0.1 3.1
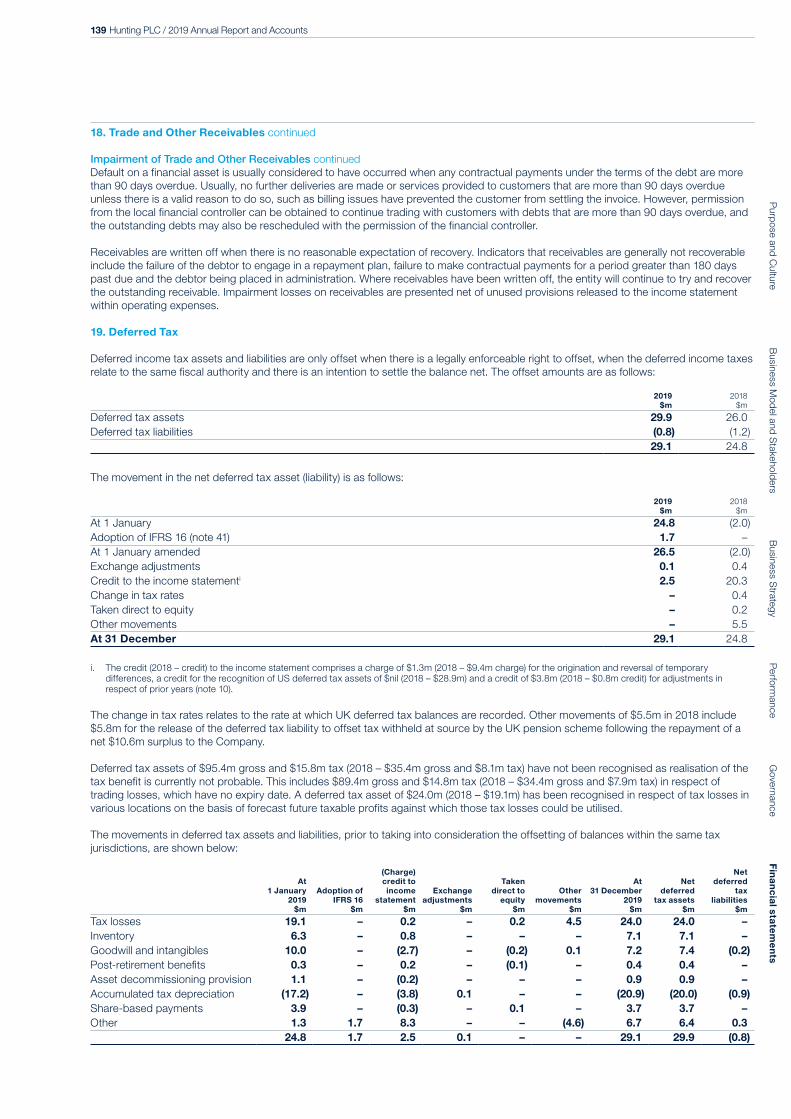
139 Hunting PLC / 2019 Annual Report and AccountsP
urpose and C
ultureB
usiness Mod
el and Stakehold
ersG
overnanceP
erformance
Business S
trategy F
ina
nc
ial sta
tem
en
ts
18. Trade and Other Receivables continued
Impairment of Trade and Other Receivables continuedDefault on a financial asset is usually considered to have occurred when any contractual payments under the terms of the debt are more than 90 days overdue. Usually, no further deliveries are made or services provided to customers that are more than 90 days overdue unless there is a valid reason to do so, such as billing issues have prevented the customer from settling the invoice. However, permission from the local financial controller can be obtained to continue trading with customers with debts that are more than 90 days overdue, and the outstanding debts may also be rescheduled with the permission of the financial controller.
Receivables are written off when there is no reasonable expectation of recovery. Indicators that receivables are generally not recoverable include the failure of the debtor to engage in a repayment plan, failure to make contractual payments for a period greater than 180 days past due and the debtor being placed in administration. Where receivables have been written off, the entity will continue to try and recover the outstanding receivable. Impairment losses on receivables are presented net of unused provisions released to the income statement within operating expenses.
19. Deferred Tax
Deferred income tax assets and liabilities are only offset when there is a legally enforceable right to offset, when the deferred income taxes relate to the same fiscal authority and there is an intention to settle the balance net. The offset amounts are as follows:
2019$m
2018$m
Deferred tax assets 29.9 26.0Deferred tax liabilities (0.8) (1.2) 29.1 24.8
The movement in the net deferred tax asset (liability) is as follows:
2019$m
2018$m
At 1 January 24.8 (2.0)Adoption of IFRS 16 (note 41) 1.7 –At 1 January amended 26.5 (2.0)Exchange adjustments 0.1 0.4Credit to the income statementi 2.5 20.3Change in tax rates – 0.4Taken direct to equity – 0.2Other movements – 5.5At 31 December 29.1 24.8
i. The credit (2018 – credit) to the income statement comprises a charge of $1.3m (2018 – $9.4m charge) for the origination and reversal of temporary differences, a credit for the recognition of US deferred tax assets of $nil (2018 – $28.9m) and a credit of $3.8m (2018 – $0.8m credit) for adjustments in respect of prior years (note 10).
The change in tax rates relates to the rate at which UK deferred tax balances are recorded. Other movements of $5.5m in 2018 include $5.8m for the release of the deferred tax liability to offset tax withheld at source by the UK pension scheme following the repayment of a net $10.6m surplus to the Company.
Deferred tax assets of $95.4m gross and $15.8m tax (2018 – $35.4m gross and $8.1m tax) have not been recognised as realisation of the tax benefit is currently not probable. This includes $89.4m gross and $14.8m tax (2018 – $34.4m gross and $7.9m tax) in respect of trading losses, which have no expiry date. A deferred tax asset of $24.0m (2018 – $19.1m) has been recognised in respect of tax losses in various locations on the basis of forecast future taxable profits against which those tax losses could be utilised.
The movements in deferred tax assets and liabilities, prior to taking into consideration the offsetting of balances within the same tax jurisdictions, are shown below:
At 1 January
2019$m
Adoption of IFRS 16
$m
(Charge) credit to income
statement$m
Exchange adjustments
$m
Taken direct to
equity$m
Other movements
$m
At 31 December
2019 $m
Net deferred
tax assets$m
Net deferred
tax liabilities
$m
Tax losses 19.1 – 0.2 – 0.2 4.5 24.0 24.0 – Inventory 6.3 – 0.8 – – – 7.1 7.1 – Goodwill and intangibles 10.0 – (2.7) – (0.2) 0.1 7.2 7.4 (0.2)Post-retirement benefits 0.3 – 0.2 – (0.1) – 0.4 0.4 – Asset decommissioning provision 1.1 – (0.2) – – – 0.9 0.9 – Accumulated tax depreciation (17.2) – (3.8) 0.1 – – (20.9) (20.0) (0.9)Share-based payments 3.9 – (0.3) – 0.1 – 3.7 3.7 – Other 1.3 1.7 8.3 – – (4.6) 6.7 6.4 0.3 24.8 1.7 2.5 0.1 – – 29.1 29.9 (0.8)

140 Hunting PLC / 2019 Annual Report and Accounts
Notes to the Consolidated Financial Statements continued
19. Deferred Tax continued
At 1 January
2018$m
Exchange adjustments
$m
(Charge) credit to income
statement$m
Change in tax rates
$m
Taken direct to
equity$m
Other movements
$m
At 31 December
2018 $m
Net deferred tax assets
$m
Net deferredtax
liabilities$m
Tax losses 2.8 0.1 11.9 (0.1) – 4.4 19.1 19.1 –Inventory 5.2 – 6.0 – – (4.9) 6.3 6.3 –Goodwill and intangibles 11.7 – 10.2 – – (11.9) 10.0 10.2 (0.2)Post-retirement benefits (4.8) 0.3 – 0.4 0.4 4.0 0.3 0.3 –Asset decommissioning provision 1.2 – 1.1 – – (1.2) 1.1 1.1 –Accumulated tax depreciation (14.5) 0.1 (16.9) – – 14.1 (17.2) (16.0) (1.2)Share-based payments 0.8 – 3.3 – (0.2) – 3.9 3.9 –Other (4.4) (0.1) 4.7 0.1 – 1.0 1.3 1.1 0.2 (2.0) 0.4 20.3 0.4 0.2 5.5 24.8 26.0 (1.2)
Following the recognition of deferred tax assets in full for the US, the net adjusted tax assets for goodwill and intangibles is shown as a net deferred tax asset.
20. Inventories
2019$m
2018$m
Raw materials 105.4 113.8Work in progress 65.4 67.7Finished goods 206.5 191.2Gross inventories 377.3 372.7Less: provisions for losses (26.5) (24.5)Net inventories 350.8 348.2
The Group’s inventory is highly durable and is well maintained. It can, therefore, hold its value well with the passing of time. When volume demand falls, or prices are reduced, management has to assess whether the carrying value of inventory can still be achieved. For some markets and product lines there may a limited number, or even no sales, to form a benchmark in the current year. In these cases, management look at historic activity levels and have to form a judgement as to likely future demand in the light of market forecasts and likely competitor activities. As a result of such judgements, the net inventory balance comprises $301.4m of inventory carried at cost (2018 – $295.2m) and $49.4m carried at net realisable value which represents 14% of net inventories (2018 – $53.0m at NRV representing 15% of net inventories). Provisions for inventories held at NRV are subject to change if expectations change.
Gross inventories have increased $4.6m from $372.7m at 31 December 2018 to $377.3m at 31 December 2019. Additions to inventories were $673.1m (2018 – $670.4m), inventories from acquisitions of $0.4m (2018 – $nil) and foreign exchange movements of $3.0m (2018 – $6.8m reduction) were offset by inventories expensed to cost of sales of $667.5m (2018 – $592.8m) and inventories written off of $4.3m (2018 – $7.3m) against the inventory provision and inventories transferred to PPE of $0.1m (2018 – $nil).
The inventory provision has increased by $2.0m from $24.5m at 31 December 2018 to $26.5m at 31 December 2019, as a result of an impairment charge included in cost of sales of $7.5m (2018 – $6.2m) and foreign exchange movements of $0.4m (2018 – $0.6m increase) offset by $4.3m (2018 – $7.3m) of the provision being utilised in the year against inventories written off and the reversal of previous write-downs of $1.6m (2018 – $2.0m) also included in cost of sales. The reversal of previous write-downs occurred when inventory was sold for an amount higher than its net realisable value and also where older inventories, which had previously been written off, were sold as market conditions improved in the oil and gas sector. Overall, Hunting’s provision for inventory losses has remained static at 7% of gross inventory balances at 31 December 2019.
The Group expects that $293.0m (2018 – $290.0m) of the Group’s inventories of $350.8m (2018 – $348.2m) will be realised within 12 months of the balance sheet date and $57.8m (2018 – $58.2m) will be realised after 12 months.
In accordance with the amendments made to the Group’s core committed bank facility in July 2016, security has been granted over inventories in certain subsidiaries in the UK, US and Canada, which have a gross value of $229.9m (2018 – $234.1m).
21. Cash and Cash Equivalents
2019$m
2018$m
Cash at bank and in hand 66.6 32.4Money Market Funds 26.2 26.1Short-term deposits of less than three month’s maturity 35.8 9.4 128.6 67.9
Cash at bank and in hand and short-term deposits are carried at amortised cost. Money Market Funds are financial assets carried at fair value through profit or loss.
As shown in note 26, cash and cash equivalents for cash flow statement purposes also includes bank overdrafts shown in borrowings in note 25.

141 Hunting PLC / 2019 Annual Report and AccountsP
urpose and C
ultureB
usiness Mod
el and Stakehold
ersG
overnanceP
erformance
Business S
trategy F
ina
nc
ial sta
tem
en
ts
22. Trade and Other Payables
2019$m
2018$m
Non-current:Accruals 0.5 1.4Social security and other taxes 0.6 0.7US deferred compensation plan obligation (note 32) 1.6 1.7 2.7 3.8
2019$m
2018$m
Current:Trade payables 56.3 62.3 Accruals 45.3 59.9 Social security and other taxes 7.7 8.8 Contract liabilities 6.8 5.5 US deferred compensation plan obligation (note 32) 0.5 –Other payables 4.6 4.4 121.2 140.9
Trade payables of $56.3m (2018 – $62.3m), accruals of $45.8m (2018 – $61.3m) and other payables of $3.4m (2018 – $4.3m) are financial liabilities measured at amortised cost. Other payables also include derivative financial liabilities of $1.0m (2018 – $0.1m) held for trading measured at fair value through profit or loss and derivative financial liabilities designated in a net investment hedge measured at fair value of $0.2m (2018 – $nil).
23. Contract Assets and Liabilities
The following table provides information about receivables, contract assets and contract liabilities from contracts with customers.
2019$m
2018$m
2017$m
Contract assets (note 18) 8.3 11.8 6.8Contract liabilities (note 22) (6.8) (5.5) (9.1)
Trade receivables – contracts with customers (note 18) 149.0 172.1 139.9Loss allowance (3.6) (2.7) (4.4)Net trade receivables – contracts with customers 145.4 169.4 135.5
There was an impairment write-down of $1.6m (2018 – $0.9m) recognised in relation to receivables arising on the Group’s contracts with customers, foreign exchange movements of $nil (2018 – $0.1m), $0.3m (2018 – $2.4m) of the provision was utilised in the year against receivables written off and $0.4m (2018 – $0.3m) reversal of an impairment write-down in relation to receivables arising on contracts with customers.
(a) Significant Changes in Contract Assets and Contract Liabilities Contract assets have decreased from $11.8m in 2018 to $8.3m due to decreased levels of bespoke customer work-in-progress in Hunting Dearborn and a reduction in work on customer-owned products at the year-end in US Manufacturing.
Contract liabilities represent deposits received on contracts relating to the purchase of pipe in the Asia Pacific businesses, prior to Hunting placing an order with the steel mills, and have increased from $5.5m in 2018 to $6.8m due to a change in the mix of orders at the year-end, whereby more customers were required to pay a deposit when placing an order.
(b) Revenue Recognised in Relation to Contract LiabilitiesThe following table shows how much of the revenue recognised in the current reporting period relates to carried-forward contract liabilities and how much relates to performance obligations that were satisfied in a prior year.
2019$m
2018$m
Revenue recognised that was included in the contract liability balance at the beginning of the year 5.5 8.8Revenue recognised from performance obligations satisfied (or partially satisfied) in previous years – –Total 5.5 8.8
(c) Unsatisfied Performance ObligationsThe aggregate amount of the transaction price allocated to partially or fully unsatisfied performance obligations as at the year-end on confirmed purchase orders received prior to the year-end is $239.0m (2018 – $250.2m). It is expected that 95% or $227.4m (2018 – 97% or $243.0m) will be recognised as revenue in the 2020 financial year and the remaining 5% or $11.6m (2018 – 3% or $7.2m) in future years.

142 Hunting PLC / 2019 Annual Report and Accounts
Notes to the Consolidated Financial Statements continued
24. Leases
From 1 January 2019, the Group has adopted IFRS 16 Leases (“IFRS 16”) by applying the modified retrospective approach; consequently the comparatives for the 2018 reporting period have not been restated, as permitted under the specific transitional provisions in IFRS 16.
The Group leases various offices, warehouses, equipment and vehicles. Rental contracts for offices and warehouses are typically made for fixed periods of between 3 and 10 years, but may have extension options as described in below. Rental contracts for equipment and vehicles are typically made for fixed periods of between 3 and 7 years. Lease terms are negotiated on an individual basis and contain a wide range of different terms and conditions.
The lease agreements do not impose any covenants.
Extension and break options are included in a number of property and equipment leases across the Group. These terms are used to maximise operational flexibility in terms of managing contracts. For extension and break options that are exercisable only by the Group and not by the respective lessor, management considers all facts and circumstances that create an economic incentive for the Group to exercise an extension option, or not exercise a break option in determining the lease term. The lease term has been determined according to management’s expectation of exercising any available extension and break options. Extension or termination options are only adjusted in the lease term if the lease option is reasonably certain to be exercised.
(a) Amounts Recognised in the Balance SheetAnalysis of right-of-use assets is presented in note 13.
At 31 December
2019 $m
Lease LiabilitiesCurrent 9.8Non-current 35.4 45.2
The analysis of the contractual, undiscounted cash flows relating to lease liabilities is shown in note 30.
As at 31 December 2019, the Group did not have any commitments for leases that were due to commence in 2020 or later.
(b) Amounts Recognised in the Income Statement in 2019 under IFRS 16The income statement includes the following amounts relating to leases:
2019$m
Depreciation charge of Right-of-Use Assets (note 13): Land and buildings 7.7 Plant, machinery and motor vehicles 0.2Expense relating to short-term leases and leases of low-value assets (included in cost of sales and operating expenses) 3.0Lease charges included in profit (loss) from operations 10.9Interest on lease liabilities (included in finance costs (note 9)) 2.2Lease charges included in profit (loss) before tax 13.1
The Group sub-lets a number of properties, which have been capitalised as right-of-use assets. Income from subleasing these assets during the year was $0.8m (2018 – $0.8m) and is included in operating lease rental income in note 4. The Group also earns revenue from the rental of rental tools, which are items of property, plant and equipment, as disclosed in note 12. Rental revenue earned during the year was $31.4m (2018 – $39.3m) as shown in note 3.
(c) Amounts Recognised in the Statement of Cash Flows in 2019 under IFRS 16
2019$m
Payments for short-term and low-value leases 3.0Payments for capitalised leases 10.6
13.6

143 Hunting PLC / 2019 Annual Report and AccountsP
urpose and C
ultureB
usiness Mod
el and Stakehold
ersG
overnanceP
erformance
Business S
trategy F
ina
nc
ial sta
tem
en
ts
24. Leases continued
(d) Operating Leases: The Group as Lessee – IAS 17 DisclosuresOperating lease charges mainly represent rentals payable by the Group for properties:
2018
Property$m
Others$m
Total$m
Operating lease charges in the income statementi:Lease and rental payments 12.1 1.7 13.8
i. Operating lease charges to the income statement in 2018 include an interest element, which is separated out and charged to finance expense under IFRS 16 in 2019.
In 2018, the Group had provisions of $4.1m for onerous contracts in respect of some leasehold properties, some of which are not used for Group trading purposes and are either vacant or sub-let to third parties (note 27).
Total future aggregate minimum lease payments under non-cancellable operating leases:
2018
Property$m
Others$m
Total$m
Within one year 9.5 0.6 10.1Between one and five years 30.0 0.7 30.7After five years 19.1 – 19.1Total lease payments 58.6 1.3 59.9
(e) The Group as LessorA number of the Group’s properties included within property, plant and equipment and capitalised as right-of-use assets are let under operating lease agreements.
Future minimum lease payments expected to be received in relation to non-cancellable operating leases are:
2019Property
$m
2018Property
$m
Within one year 1.1 1.8Between one and five years 1.6 3.3Total lease income receivable 2.7 5.1
25. Borrowings
2019$m
2018$m
Non-current:Other unsecured loans 3.9 3.9
Current:Bank overdrafts secured 1.6 1.8Unsecured bank loans – 0.9
1.6 2.7
Total borrowings 5.5 6.6
In accordance with the amendments made to the Group’s committed facility in July 2016, security has been granted over certain property, plant and equipment, receivables and inventory. The carrying amounts of the assets pledged as security are disclosed in notes 12, 18 and 20.

144 Hunting PLC / 2019 Annual Report and Accounts
Notes to the Consolidated Financial Statements continued
25. Borrowings continued
Analysis of Borrowings by CurrencyThe carrying amount of the Group’s borrowings is denominated in the following currencies:
US dollars$m
ChineseCNY
$mTotal
$m
Other unsecured loans 3.9 – 3.9Bank overdrafts secured 1.6 – 1.6At 31 December 2019 5.5 – 5.5
US dollars$m
ChineseCNY
$mTotal
$m
Other unsecured loans 3.9 – 3.9Bank overdrafts secured 1.8 – 1.8Unsecured bank loans – 0.9 0.9At 31 December 2018 5.7 0.9 6.6
26. Changes in Net Cash (Debt)
Hunting operates a centralised treasury function that manages all cash and loan positions throughout the Group and ensures funds are used efficiently through the use of cash concentration account structures and other such measures. As the Group manages funding on a net cash/debt basis, internal reporting focuses on changes in net cash/debt and this is presented in the Strategic Report. The net cash/debt reconciliation provides an analysis of the movement in the year for each component of net debt split between cash and non-cash items. Net cash/debt comprises cash at bank and in hand, short-term deposits and Money Market Funds less bank overdrafts, current and non-current lease liabilities, and current and non-current borrowings.
At 1 January
2019 $m
Adoption of IFRS 16
$m
At 1 January
2019amended
$m
Cash flow
$m
Non-cash movements
on lease liabilitiesi
$m
Exchange movements
$m
At 31 December
2019 $m
Cash and cash equivalents (note 21) 67.9 – 67.9 58.3 – 2.4 128.6Bank overdrafts (note 25) (1.8) – (1.8) 0.2 – – (1.6)Cash and cash equivalents – per cash flow statement 66.1 – 66.1 58.5 – 2.4 127.0
Total lease liabilities (note 24) – (49.0) (49.0) 10.6 (5.9) (0.9) (45.2)Unsecured bank loans (note 25) (0.9) – (0.9) 0.9 – – –Non-current borrowings (note 25) (3.9) – (3.9) – – – (3.9)Liabilities arising from financing activities (4.8) (49.0) (53.8) 11.5 (5.9) (0.9) (49.1)
Total net cash (debt) 61.3 (49.0) 12.3 70.0 (5.9) 1.5 77.9
i. Non-cash movements on lease liabilities comprise new leases of $3.4m, interest expense of $2.2m and lease modifications of $0.3m.
At 1 January
2018$m
Cash flow$m
Exchange movements
$m
At 31 December
2018$m
Cash and cash equivalents (note 21) 36.4 32.6 (1.1) 67.9Bank overdrafts (note 25) (2.1) 0.3 – (1.8)Cash and cash equivalents – per cash flow statement 34.3 32.9 (1.1) 66.1
Other current borrowings (note 25) – (0.9) – (0.9)Non-current borrowings (note 25) (3.9) – – (3.9)Liabilities arising from financing activities (3.9) (0.9) – (4.8)
Total net cash (debt) 30.4 32.0 (1.1) 61.3
During the year, $0.4m (2018 – $0.5m) loan facility fees were paid, $nil (2018 – $0.6m) was accrued and $0.4m (2018 – $0.4m) fees were amortised.
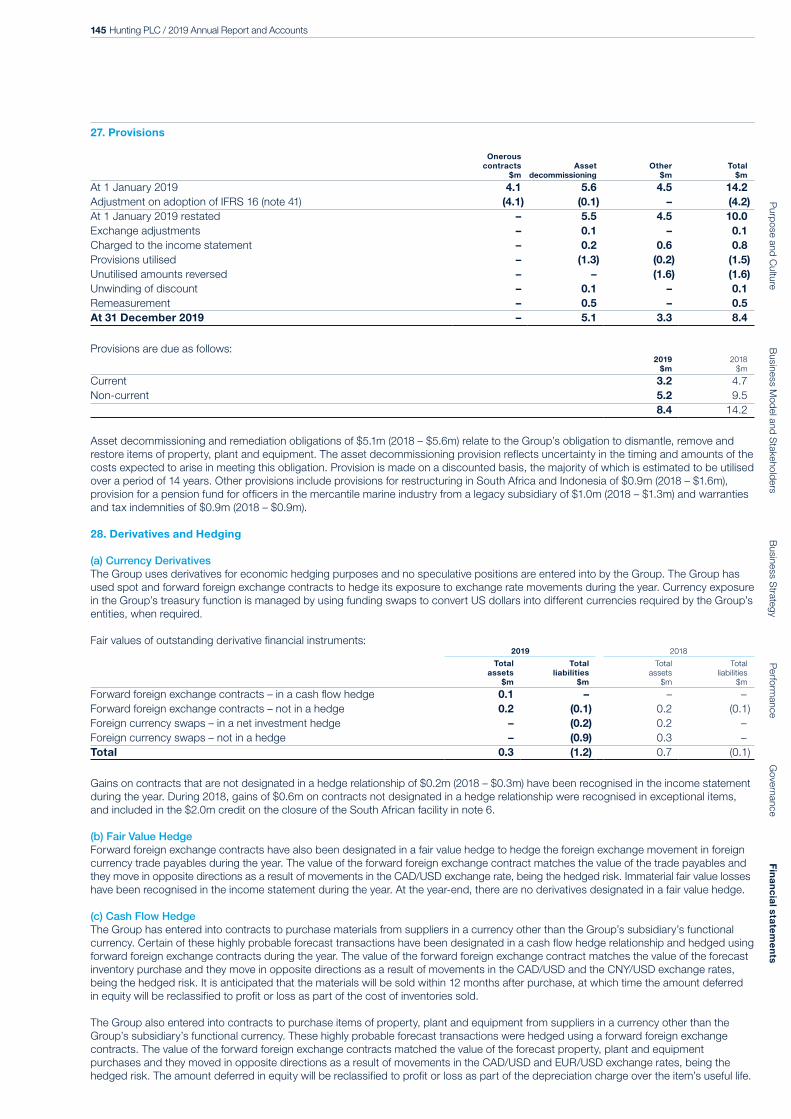
145 Hunting PLC / 2019 Annual Report and AccountsP
urpose and C
ultureB
usiness Mod
el and Stakehold
ersG
overnanceP
erformance
Business S
trategy F
ina
nc
ial sta
tem
en
ts
27. Provisions
Onerous contracts
$mAsset
decommissioningOther
$mTotal
$m
At 1 January 2019 4.1 5.6 4.5 14.2Adjustment on adoption of IFRS 16 (note 41) (4.1) (0.1) – (4.2)At 1 January 2019 restated – 5.5 4.5 10.0Exchange adjustments – 0.1 – 0.1 Charged to the income statement – 0.2 0.6 0.8 Provisions utilised – (1.3) (0.2) (1.5)Unutilised amounts reversed – – (1.6) (1.6)Unwinding of discount – 0.1 – 0.1 Remeasurement – 0.5 – 0.5 At 31 December 2019 – 5.1 3.3 8.4
Provisions are due as follows:2019
$m2018
$m
Current 3.2 4.7Non-current 5.2 9.5 8.4 14.2
Asset decommissioning and remediation obligations of $5.1m (2018 – $5.6m) relate to the Group’s obligation to dismantle, remove and restore items of property, plant and equipment. The asset decommissioning provision reflects uncertainty in the timing and amounts of the costs expected to arise in meeting this obligation. Provision is made on a discounted basis, the majority of which is estimated to be utilised over a period of 14 years. Other provisions include provisions for restructuring in South Africa and Indonesia of $0.9m (2018 – $1.6m), provision for a pension fund for officers in the mercantile marine industry from a legacy subsidiary of $1.0m (2018 – $1.3m) and warranties and tax indemnities of $0.9m (2018 – $0.9m).
28. Derivatives and Hedging
(a) Currency DerivativesThe Group uses derivatives for economic hedging purposes and no speculative positions are entered into by the Group. The Group has used spot and forward foreign exchange contracts to hedge its exposure to exchange rate movements during the year. Currency exposure in the Group’s treasury function is managed by using funding swaps to convert US dollars into different currencies required by the Group’s entities, when required.
Fair values of outstanding derivative financial instruments:2019 2018
Total assets
$m
Total liabilities
$m
Total assets
$m
Total liabilities
$m
Forward foreign exchange contracts – in a cash flow hedge 0.1 – – –Forward foreign exchange contracts – not in a hedge 0.2 (0.1) 0.2 (0.1)Foreign currency swaps – in a net investment hedge – (0.2) 0.2 –Foreign currency swaps – not in a hedge – (0.9) 0.3 –Total 0.3 (1.2) 0.7 (0.1)
Gains on contracts that are not designated in a hedge relationship of $0.2m (2018 – $0.3m) have been recognised in the income statement during the year. During 2018, gains of $0.6m on contracts not designated in a hedge relationship were recognised in exceptional items, and included in the $2.0m credit on the closure of the South African facility in note 6.
(b) Fair Value HedgeForward foreign exchange contracts have also been designated in a fair value hedge to hedge the foreign exchange movement in foreign currency trade payables during the year. The value of the forward foreign exchange contract matches the value of the trade payables and they move in opposite directions as a result of movements in the CAD/USD exchange rate, being the hedged risk. Immaterial fair value losses have been recognised in the income statement during the year. At the year-end, there are no derivatives designated in a fair value hedge.
(c) Cash Flow HedgeThe Group has entered into contracts to purchase materials from suppliers in a currency other than the Group’s subsidiary’s functional currency. Certain of these highly probable forecast transactions have been designated in a cash flow hedge relationship and hedged using forward foreign exchange contracts during the year. The value of the forward foreign exchange contract matches the value of the forecast inventory purchase and they move in opposite directions as a result of movements in the CAD/USD and the CNY/USD exchange rates, being the hedged risk. It is anticipated that the materials will be sold within 12 months after purchase, at which time the amount deferred in equity will be reclassified to profit or loss as part of the cost of inventories sold.
The Group also entered into contracts to purchase items of property, plant and equipment from suppliers in a currency other than the Group’s subsidiary’s functional currency. These highly probable forecast transactions were hedged using a forward foreign exchange contracts. The value of the forward foreign exchange contracts matched the value of the forecast property, plant and equipment purchases and they moved in opposite directions as a result of movements in the CAD/USD and EUR/USD exchange rates, being the hedged risk. The amount deferred in equity will be reclassified to profit or loss as part of the depreciation charge over the item’s useful life.
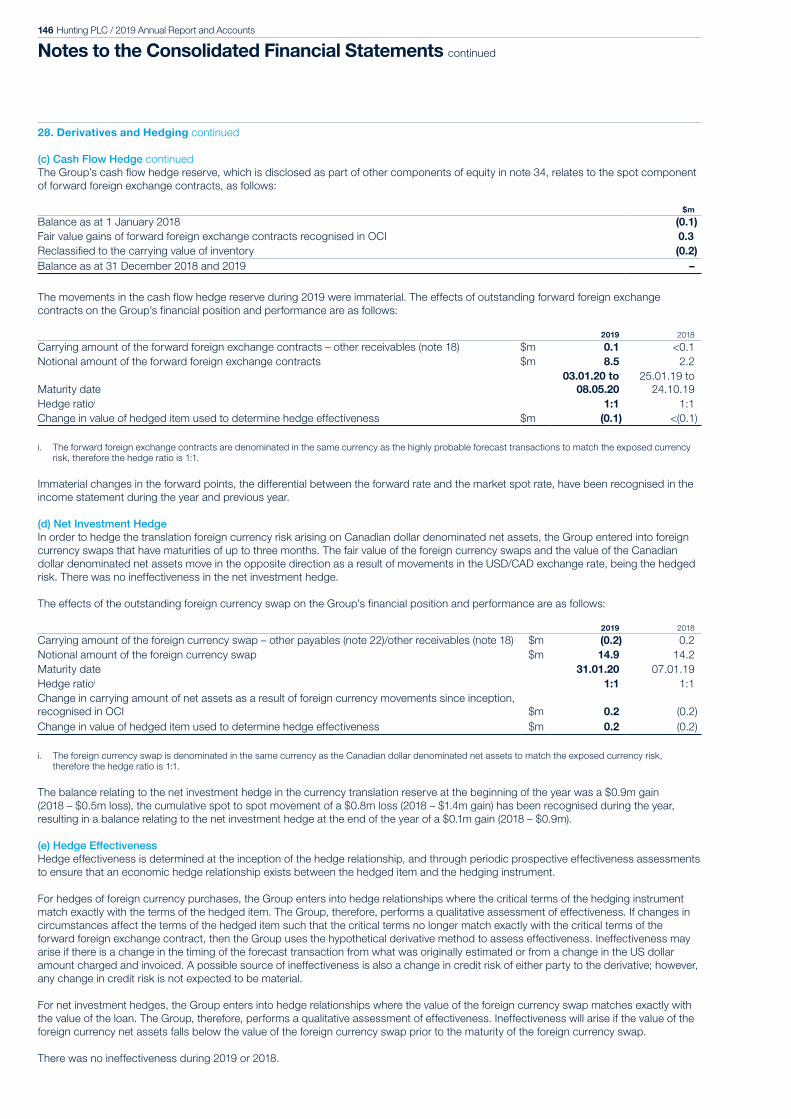
146 Hunting PLC / 2019 Annual Report and Accounts
Notes to the Consolidated Financial Statements continued
28. Derivatives and Hedging continued
(c) Cash Flow Hedge continuedThe Group’s cash flow hedge reserve, which is disclosed as part of other components of equity in note 34, relates to the spot component of forward foreign exchange contracts, as follows:
$m
Balance as at 1 January 2018 (0.1)Fair value gains of forward foreign exchange contracts recognised in OCI 0.3Reclassified to the carrying value of inventory (0.2)Balance as at 31 December 2018 and 2019 –
The movements in the cash flow hedge reserve during 2019 were immaterial. The effects of outstanding forward foreign exchange contracts on the Group’s financial position and performance are as follows:
2019 2018
Carrying amount of the forward foreign exchange contracts – other receivables (note 18) $m 0.1 <0.1Notional amount of the forward foreign exchange contracts $m 8.5 2.2
Maturity date03.01.20 to
08.05.2025.01.19 to
24.10.19Hedge ratioi 1:1 1:1Change in value of hedged item used to determine hedge effectiveness $m (0.1) <(0.1)
i. The forward foreign exchange contracts are denominated in the same currency as the highly probable forecast transactions to match the exposed currency risk, therefore the hedge ratio is 1:1.
Immaterial changes in the forward points, the differential between the forward rate and the market spot rate, have been recognised in the income statement during the year and previous year.
(d) Net Investment HedgeIn order to hedge the translation foreign currency risk arising on Canadian dollar denominated net assets, the Group entered into foreign currency swaps that have maturities of up to three months. The fair value of the foreign currency swaps and the value of the Canadian dollar denominated net assets move in the opposite direction as a result of movements in the USD/CAD exchange rate, being the hedged risk. There was no ineffectiveness in the net investment hedge.
The effects of the outstanding foreign currency swap on the Group’s financial position and performance are as follows:
2019 2018
Carrying amount of the foreign currency swap – other payables (note 22)/other receivables (note 18) $m (0.2) 0.2Notional amount of the foreign currency swap $m 14.9 14.2Maturity date 31.01.20 07.01.19Hedge ratioi 1:1 1:1Change in carrying amount of net assets as a result of foreign currency movements since inception, recognised in OCI $m 0.2 (0.2)Change in value of hedged item used to determine hedge effectiveness $m 0.2 (0.2)
i. The foreign currency swap is denominated in the same currency as the Canadian dollar denominated net assets to match the exposed currency risk, therefore the hedge ratio is 1:1.
The balance relating to the net investment hedge in the currency translation reserve at the beginning of the year was a $0.9m gain (2018 – $0.5m loss), the cumulative spot to spot movement of a $0.8m loss (2018 – $1.4m gain) has been recognised during the year, resulting in a balance relating to the net investment hedge at the end of the year of a $0.1m gain (2018 – $0.9m).
(e) Hedge EffectivenessHedge effectiveness is determined at the inception of the hedge relationship, and through periodic prospective effectiveness assessments to ensure that an economic hedge relationship exists between the hedged item and the hedging instrument.
For hedges of foreign currency purchases, the Group enters into hedge relationships where the critical terms of the hedging instrument match exactly with the terms of the hedged item. The Group, therefore, performs a qualitative assessment of effectiveness. If changes in circumstances affect the terms of the hedged item such that the critical terms no longer match exactly with the critical terms of the forward foreign exchange contract, then the Group uses the hypothetical derivative method to assess effectiveness. Ineffectiveness may arise if there is a change in the timing of the forecast transaction from what was originally estimated or from a change in the US dollar amount charged and invoiced. A possible source of ineffectiveness is also a change in credit risk of either party to the derivative; however, any change in credit risk is not expected to be material.
For net investment hedges, the Group enters into hedge relationships where the value of the foreign currency swap matches exactly with the value of the loan. The Group, therefore, performs a qualitative assessment of effectiveness. Ineffectiveness will arise if the value of the foreign currency net assets falls below the value of the foreign currency swap prior to the maturity of the foreign currency swap.
There was no ineffectiveness during 2019 or 2018.
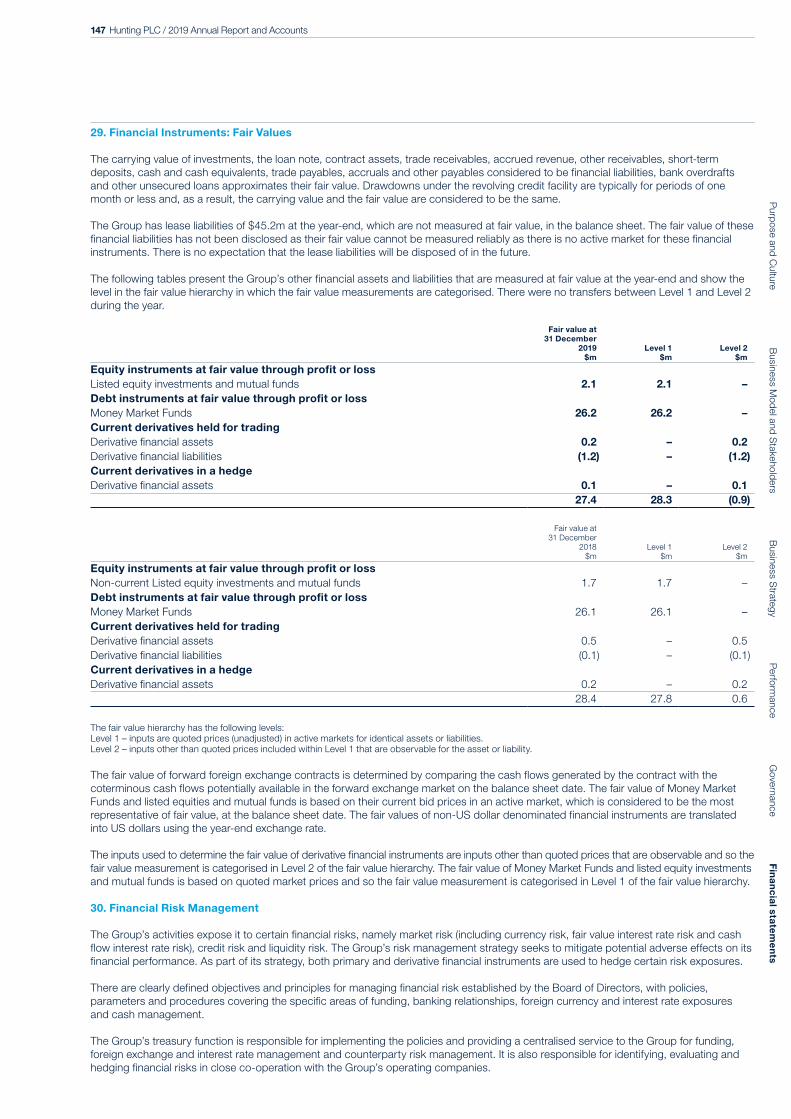
147 Hunting PLC / 2019 Annual Report and AccountsP
urpose and C
ultureB
usiness Mod
el and Stakehold
ersG
overnanceP
erformance
Business S
trategy F
ina
nc
ial sta
tem
en
ts
29. Financial Instruments: Fair Values
The carrying value of investments, the loan note, contract assets, trade receivables, accrued revenue, other receivables, short-term deposits, cash and cash equivalents, trade payables, accruals and other payables considered to be financial liabilities, bank overdrafts and other unsecured loans approximates their fair value. Drawdowns under the revolving credit facility are typically for periods of one month or less and, as a result, the carrying value and the fair value are considered to be the same.
The Group has lease liabilities of $45.2m at the year-end, which are not measured at fair value, in the balance sheet. The fair value of these financial liabilities has not been disclosed as their fair value cannot be measured reliably as there is no active market for these financial instruments. There is no expectation that the lease liabilities will be disposed of in the future.
The following tables present the Group’s other financial assets and liabilities that are measured at fair value at the year-end and show the level in the fair value hierarchy in which the fair value measurements are categorised. There were no transfers between Level 1 and Level 2 during the year.
Fair value at 31 December
2019$m
Level 1$m
Level 2$m
Equity instruments at fair value through profit or lossListed equity investments and mutual funds 2.1 2.1 –Debt instruments at fair value through profit or lossMoney Market Funds 26.2 26.2 –Current derivatives held for tradingDerivative financial assets 0.2 – 0.2Derivative financial liabilities (1.2) – (1.2)Current derivatives in a hedgeDerivative financial assets 0.1 – 0.1
27.4 28.3 (0.9)
Fair value at 31 December
2018 $m
Level 1$m
Level 2$m
Equity instruments at fair value through profit or lossNon-current Listed equity investments and mutual funds 1.7 1.7 –Debt instruments at fair value through profit or lossMoney Market Funds 26.1 26.1 –Current derivatives held for tradingDerivative financial assets 0.5 – 0.5Derivative financial liabilities (0.1) – (0.1)Current derivatives in a hedgeDerivative financial assets 0.2 – 0.2
28.4 27.8 0.6
The fair value hierarchy has the following levels:Level 1 – inputs are quoted prices (unadjusted) in active markets for identical assets or liabilities.Level 2 – inputs other than quoted prices included within Level 1 that are observable for the asset or liability.
The fair value of forward foreign exchange contracts is determined by comparing the cash flows generated by the contract with the coterminous cash flows potentially available in the forward exchange market on the balance sheet date. The fair value of Money Market Funds and listed equities and mutual funds is based on their current bid prices in an active market, which is considered to be the most representative of fair value, at the balance sheet date. The fair values of non-US dollar denominated financial instruments are translated into US dollars using the year-end exchange rate.
The inputs used to determine the fair value of derivative financial instruments are inputs other than quoted prices that are observable and so the fair value measurement is categorised in Level 2 of the fair value hierarchy. The fair value of Money Market Funds and listed equity investments and mutual funds is based on quoted market prices and so the fair value measurement is categorised in Level 1 of the fair value hierarchy.
30. Financial Risk Management
The Group’s activities expose it to certain financial risks, namely market risk (including currency risk, fair value interest rate risk and cash flow interest rate risk), credit risk and liquidity risk. The Group’s risk management strategy seeks to mitigate potential adverse effects on its financial performance. As part of its strategy, both primary and derivative financial instruments are used to hedge certain risk exposures.
There are clearly defined objectives and principles for managing financial risk established by the Board of Directors, with policies, parameters and procedures covering the specific areas of funding, banking relationships, foreign currency and interest rate exposures and cash management.
The Group’s treasury function is responsible for implementing the policies and providing a centralised service to the Group for funding, foreign exchange and interest rate management and counterparty risk management. It is also responsible for identifying, evaluating and hedging financial risks in close co-operation with the Group’s operating companies.

148 Hunting PLC / 2019 Annual Report and Accounts
Notes to the Consolidated Financial Statements continued
30. Financial Risk Management continued
(a) Market Risk: Foreign Exchange RiskThe Group’s international base is exposed to foreign exchange risk from its investing, financing and operating activities, particularly in respect of Sterling, Canadian dollars and Chinese Yuan Renminbi. Foreign exchange risks arise from future transactions and cash flows, and from recognised monetary assets and liabilities that are not denominated in the functional currency of the Group’s local operations.
The Group’s material foreign exchange rates are:
Sterling Canadian dollar
2019 2018 2019 2018
Average exchange rate to US dollars 0.78 0.75 1.33 1.30Year–end exchange rate to US dollars 0.75 0.79 1.30 1.37
(i) Transactional RiskThe exposure to exchange rate movements in significant future transactions and cash flows is hedged by using forward foreign exchange contracts. Certain forward foreign exchange contracts have been designated as hedging instruments of highly probable forecast transactions. Operating companies prepare quarterly rolling 12-month cash flow forecasts to enable working capital currency exposures to be identified. Exposures are also identified and hedged, if necessary, on an ad-hoc basis, such as when a purchase order in a foreign currency is placed. Currency exposures arise where the cash flows are not in the functional currency of the entity. Exposures arising from committed long-term projects beyond a 12-month period are also identified. The currency flows to be hedged are committed foreign currency transactions greater than $50,000 equivalent. Exposures of less than $50,000 equivalent will also be hedged but only where the underlying foreign currency cash flow is expected to occur 60 days or more from the point of entering into the transaction.
The table below shows the carrying values of the Group’s financial instruments at 31 December, including derivative financial instruments, on which exchange differences would potentially be recognised in the income statement in the following year. The table excludes derivatives designated in a cash flow hedge as fair value gains and losses arising on these are recognised in other comprehensive income.
At 31 December 2019
Currency of denomination
Total$m
Sterling$m
US dollars$m
AED$m
ChineseCNY
$mEuro
$mAUD
$m
Other currencies
$m
Functional currency of Group’s entities:Sterling – (5.0) – – (0.4) – 0.2 (5.2)US dollars (2.6) – (1.6) (1.0) (0.6) 1.3 (1.5) (6.0)Canadian dollars – (1.2) – – – – – (1.2)Singapore dollars – 2.7 – – – – – 2.7Euro (0.1) 0.8 – – – – – 0.7Chinese CNY – (0.6) – – – – – (0.6) (2.7) (3.3) (1.6) (1.0) (1.0) 1.3 (1.3) (9.6)
The Sterling, US dollar, United Arab Emirates (“UAE”) Dirham (“AED”), Australian dollar (“AUD”) and Chinese Yuan Renminbi (“CNY”) denominated financial instruments consist of cash balances, trade and other receivables, accrued revenue, trade and other payables, accrued expenses, finance lease liabilities, provisions and intra-Group loans.
At 31 December 2018
Currency of denomination
Total$m
Sterling$m
US dollars$m
AED$m
ChineseCNY
$mEuro
$mAUD
$m
Other currencies
$m
Functional currency of Group’s entities:Sterling – (3.5) – – (0.1) – – (3.6)US dollars (2.4) – (1.4) 1.0 (0.1) – (0.1) (3.0)Canadian dollars – (0.3) – – – – – (0.3)Singapore dollars – 2.3 – – – – – 2.3Euro (0.8) – – – – – – (0.8)Chinese CNY – – – – – – (0.2) (0.2)
(3.2) (1.5) (1.4) 1.0 (0.2) – (0.3) (5.6)
The Sterling, US dollar, United Arab Emirates (“UAE”) Dirham (“AED”) and Chinese Yuan Renminbi (“CNY”) denominated financial instruments consist of cash balances, trade and other receivables, accrued revenue, trade and other payables, accrued expenses, provisions and intra-Group loans.

149 Hunting PLC / 2019 Annual Report and AccountsP
urpose and C
ultureB
usiness Mod
el and Stakehold
ersG
overnanceP
erformance
Business S
trategy F
ina
nc
ial sta
tem
en
ts
30. Financial Risk Management continued
(a) Market Risk: Foreign Exchange Risk continued(ii) Translational RiskForeign exchange risk also arises from financial assets and liabilities not denominated in the functional currency of an entity’s operations and forward foreign exchange contracts are used to manage the exposure to changes in foreign exchange rates. Where appropriate, hedge accounting is applied to the forward foreign exchange contracts and the hedged item to remove any accounting mismatch.
Foreign exchange risk also arises from the Group’s investments in foreign operations. During the year, foreign currency swaps have been designated in a net investment hedge to hedge the translation foreign currency risk arising on a Canadian dollar denominated investment.
The foreign exchange exposure arising from the translation of its net investments in foreign operations into the Group’s presentation currency of US dollars has also previously been managed by designating any borrowings that are not US dollar denominated as a hedge of the net investment in foreign operations.
The foreign exchange exposure primarily arises from Sterling and Canadian dollar denominated net investments.
(b) Market Risk: Interest Rate RiskVariable interest rates on cash at bank, short-term deposits, overdrafts and borrowings expose the Group to cash flow interest rate risk and fixed interest rates on loans and short-term deposits expose the Group to fair value interest rate risk. The treasury function manages the Group’s exposure to interest rate risk and uses interest rate swaps and caps, when considered appropriate.
(c) Credit RiskThe Group’s credit risk arises from its cash at bank and in hand, Money Market Funds, short-term deposits, investments, derivative financial instruments, the loan note, accrued revenue, outstanding trade receivables and contract assets.
At the year-end, the Group had credit risk exposures to a wide range of counterparties. Credit risk exposure is continually monitored and no individual exposure is considered to be significant in the context of the ordinary course of the Group’s activities. Exposure limits are set for each approved counterparty, as well as the types of transactions that may be entered into. Approved institutions that the treasury function can invest surplus cash with must all have a minimum A2, P2 or F2 short-term rating from Standard & Poor’s, Moody’s or Fitch rating agencies respectively and AAAm S&P rating for Money Market Funds. The Money Market Funds aim to have a stable Net Asset Value per share of 1 (this means that for every $1 or £1 that is in the fund there will be an asset to cover it) and the funds have overnight liquidity. At the year-end, deposits in Money Market Funds totalled $26.2m (2018 – $26.1m).
At the year-end, cash at bank and in hand totalled $66.6m (2018 – $32.4m), with $48.4m (2018 – $18.0m) deposited with banks with Fitch short-term ratings of F1 to F1+. Of the remaining $18.2m (2018 – $14.4m), $16.6m (2018 – $13.5m) was held with two financial institutions within mainland China which, given the Group’s operations in this jurisdiction, were deemed necessary. Despite not having formal credit ratings, an internal assessment determined that the banks’ credit profiles were appropriate for the amounts held on deposit. There are no formal restrictions on this cash as such, however, prior approval would be required from various state authorities in China before any cash could be paid offshore.
Surplus cash held in short-term deposits totalled $35.8m (2018 – $9.4m) and are held with banks with Fitch short-term ratings of F1 and F1+.
The credit risk of foreign exchange contracts is calculated before the contract is acquired and compared to the credit risk limit set for each counterparty. Credit risk is calculated as a fixed percentage of the nominal value of the instrument.
Trade and other receivables are continuously monitored. Credit account limits are primarily based on the credit quality of the customer and past experience through trading relationships. To reduce credit risk exposure from outstanding receivables, the Group has taken out credit insurance with an external insurer, subject to certain conditions.
The Group operates a defined benefit pension scheme in the US, which is unfunded. Contributions are paid into a separate investment vehicle and invested in a wide portfolio of US mutual funds that are recognised as current and non-current investments. Investments at the year-end amounted to $2.1m (2018 – $1.7m) and are expected to be fully recovered.
(d) Liquidity RiskThe Group needs to ensure that it has sufficient liquid funds available to support its working capital and capital expenditure requirements. All subsidiaries submit weekly and bi-monthly cash forecasts to the treasury function to enable them to monitor the Group’s requirements.
The Group has sufficient credit facilities to meet both its long- and short-term requirements. The Group’s credit facilities are provided by a variety of funding sources and total $164.2m (2018 – $164.9m) at the year-end. The facilities comprise $160.0m of secured committed facilities (2018 – $159.5m) and $4.2m secured uncommitted facilities (2018 – $5.4m).
The Group’s $160m Revolving Credit Facility (“RCF”) is due to mature in December 2022, with an option to extend for a further one year to December 2023. The main features of the RCF are as follows:
• The base margin on amounts drawn under the facility is 1.00%. • Market standard financial covenants of the facility, as discussed below. • A $75.0m accordion feature, providing Hunting with additional flexibility to increase the size of the bank facility to $235.0m, subject to
approval of its bank lending group.
Security is granted over certain properties, plant and equipment, receivables and inventory. The carrying amounts of the assets pledged as security are disclosed in notes 12, 18 and 20.

150 Hunting PLC / 2019 Annual Report and Accounts
Notes to the Consolidated Financial Statements continued
30. Financial Risk Management continued
(d) Liquidity Risk continuedThe covenants to 31 December 2019 include: • The ratio of net debt to consolidated EBITDA permitted under the revolving credit facility must not exceed a multiple of three times. • Consolidated EBITDA must also cover relevant finance charges by a minimum of four times.
For covenant testing purposes, the Group’s definition of consolidated EBITDA is adjusted to exclude exceptional items, include the share of associates’ post-tax results and exclude the fair value charge for share awards. Consolidated EBITDA is also adjusted to reflect it on a pre-IFRS 16 basis. Similarly, net cash (debt) and finance expenses are adjusted to accord with the definition within the facility agreement. Consolidated EBITDA, for covenant test purposes, is based on the previous 12-month period, measured twice yearly at 30 June and 31 December. Throughout the year and at 31 December 2019 both these covenants were met.
The Group’s treasury function ensures flexibility in funding by maintaining availability under committed credit facilities. The Group had undrawn committed borrowing facilities available at the year-end totalling $160.0m (2018 – $159.5m), which expire between one and five years from 31 December 2019.
The following tables analyse the Group’s non-derivative financial liabilities into relevant maturity groupings based on the remaining period at the balance sheet date to the contractual maturity date of the financial liabilities. The amounts are the contractual, undiscounted cash flows. The carrying amounts in the balance sheet are the discounted amounts. Balances due within one year have been included in the maturity analysis at their carrying amounts, as the impact of discounting is not significant.
2019
On demand or within one year
$m
Between one and
five years$m
After five years
$mTotal
$m
Non-derivative financial liabilities:Trade payables 56.3 – – 56.3Accruals 45.3 0.4 0.1 45.8Other payables 3.4 – – 3.4Lease liabilities 10.3 28.1 14.6 53.0Secured bank loans 0.6 1.1 – 1.7Other unsecured loans – – 3.9 3.9Bank overdrafts secured 1.6 – – 1.6Total 117.5 29.6 18.6 165.7
2018
On demand or within one year
$m
Between one and
five years$m
After five years
$mTotal
$m
Non-derivative financial liabilities:Trade payables 62.3 – – 62.3Accruals 59.9 0.9 0.5 61.3Other payables 4.3 – – 4.3Onerous lease contracts 1.1 3.0 – 4.1Secured bank loans 0.6 1.1 – 1.7Unsecured bank loans 0.9 – – 0.9Other unsecured loans – – 3.9 3.9Bank overdrafts secured 1.8 – – 1.8Total 130.9 5.0 4.4 140.3
The Group had no net settled financial liabilities at the year-end (2018 – none).
The table below analyses the Group’s derivative financial instruments, which will be settled on a gross basis, into maturity groupings based on the period remaining from the balance sheet date to the contractual maturity date. The amounts disclosed in the table are the contractual, undiscounted cash flows.
On demand or within one year
2019$m
On demand or within one year
2019$m
Currency derivatives – inflows 111.8 86.9– outflows (112.7) (86.3)
(e) Capital Risk ManagementThe Group’s objectives, policies and processes for managing capital are outlined in the Strategic Report within the Financial Capital Management section on page 53. Within this section, the Group provides a definition of capital, provides details of the external financial covenants imposed, key measures for managing capital and the objectives for managing capital. Quantitative disclosures have been made together with the parameters for meeting external financial covenants.

151 Hunting PLC / 2019 Annual Report and AccountsP
urpose and C
ultureB
usiness Mod
el and Stakehold
ersG
overnanceP
erformance
Business S
trategy F
ina
nc
ial sta
tem
en
ts
31. Financial Instruments: Sensitivity Analysis
The following sensitivity analysis is intended to illustrate the sensitivity to changes in market variables on the Group’s financial instruments and show the impact on profit or loss and shareholders’ equity. Financial instruments affected by market risk include cash at bank and in hand, Money Market Funds, short-term deposits, trade and other receivables, trade and other payables, lease liabilities, borrowings and derivative financial instruments. The sensitivity analysis relates to the position as at 31 December 2019. The analysis excludes the impact of movements in market variables on the carrying value of pension and other post-retirement obligations, provisions and non-financial assets and liabilities of foreign operations.
The following assumptions have been made in calculating the sensitivity analysis:
• Foreign exchange rate and interest rate sensitivities have an asymmetric impact on the Group’s results, that is, an increase in rates does not result in the same amount of movement as a decrease in rates;
• For floating rate assets and liabilities, the amount of asset or liability outstanding at the balance sheet date is assumed to be outstanding for the whole year;
• Fixed-rate financial instruments that are carried at amortised cost are not subject to interest rate risk for the purpose of this analysis; and
• The carrying values of financial assets and liabilities carried at amortised cost do not change as interest rates change.
Positive figures represent an increase in profit or equity.
(a) Interest Rate SensitivityThe sensitivity rate of 0.25% (2018 – 0.5%) for US interest rates represents management’s assessment of a reasonably possible change, based on historical volatility and a review of analysts’ research and banks’ expectations of future interest rates.
The post-tax impact on the income statement, with all other variables held constant, at 31 December, for an increase or decrease of 0.25% (2018 – 0.5%) in US interest rates, is not material (2018 – not material). There is no impact on other comprehensive income (“OCI”) for a change in interest rates.
(b) Foreign Exchange Rate SensitivityThe sensitivity rates disclosed in the table below, represent management’s assessment of a reasonably possible change, based on historical volatility and a review of analysts’ research and banks’ expectations of future foreign exchange rates.
The table below shows the post-tax impact for the year of a reasonably possible change in foreign exchange rates, with all other variables held constant, at 31 December.
2019 2018
Income statement
$mOCI$m
Income statement
$mOCI$m
Sterling exchange rate +5% (2018: +10%) (0.3) – (0.4) –Sterling exchange rate -5% (2018: -10%) 0.3 – 0.4 –Singapore dollar exchange rate +5% (2018: +5%) (0.2) – (0.2) –Singapore dollar exchange rate -5% (2018: -5%) 0.2 – 0.2 –Chinese Yuan Renminbi exchange rate +2% (2018: +5%) (0.1) (0.1) (0.2) –Chinese Yuan Renminbi exchange rate -2% (2018: -5%) 0.1 0.1 0.2 –Canadian dollar exchange rate +5% (2018: +10%) 0.1 – 0.1 0.1Canadian dollar exchange rate -5% (2018: -10%) (0.1) – – –
The movements in the income statement mainly arise from cash, intra-Group balances, trade and other receivables, payables, accrued expenses and provisions, where the functional currency of the entity is different to the currency that the monetary items are denominated in. The movements in OCI arise from foreign exchange contracts designated in a cash flow hedge.
The post-tax impact on the income statement of reasonably possible changes in the Euro, Australian dollar and UAE Dirham exchange rates were considered and were immaterial.
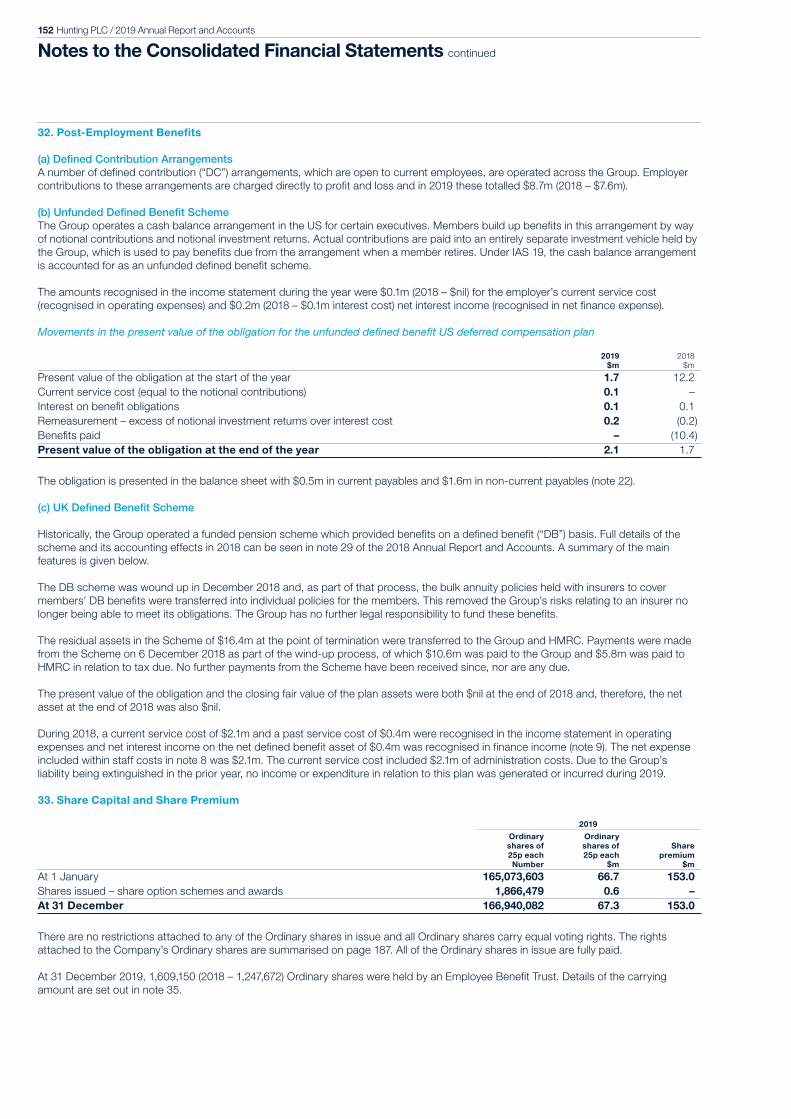
152 Hunting PLC / 2019 Annual Report and Accounts
Notes to the Consolidated Financial Statements continued
32. Post-Employment Benefits
(a) Defined Contribution ArrangementsA number of defined contribution (“DC”) arrangements, which are open to current employees, are operated across the Group. Employer contributions to these arrangements are charged directly to profit and loss and in 2019 these totalled $8.7m (2018 – $7.6m). (b) Unfunded Defined Benefit SchemeThe Group operates a cash balance arrangement in the US for certain executives. Members build up benefits in this arrangement by way of notional contributions and notional investment returns. Actual contributions are paid into an entirely separate investment vehicle held by the Group, which is used to pay benefits due from the arrangement when a member retires. Under IAS 19, the cash balance arrangement is accounted for as an unfunded defined benefit scheme.
The amounts recognised in the income statement during the year were $0.1m (2018 – $nil) for the employer’s current service cost (recognised in operating expenses) and $0.2m (2018 – $0.1m interest cost) net interest income (recognised in net finance expense).
Movements in the present value of the obligation for the unfunded defined benefit US deferred compensation plan
2019$m
2018$m
Present value of the obligation at the start of the year 1.7 12.2Current service cost (equal to the notional contributions) 0.1 –Interest on benefit obligations 0.1 0.1Remeasurement – excess of notional investment returns over interest cost 0.2 (0.2)Benefits paid – (10.4)Present value of the obligation at the end of the year 2.1 1.7
The obligation is presented in the balance sheet with $0.5m in current payables and $1.6m in non-current payables (note 22).
(c) UK Defined Benefit Scheme
Historically, the Group operated a funded pension scheme which provided benefits on a defined benefit (“DB”) basis. Full details of the scheme and its accounting effects in 2018 can be seen in note 29 of the 2018 Annual Report and Accounts. A summary of the main features is given below.
The DB scheme was wound up in December 2018 and, as part of that process, the bulk annuity policies held with insurers to cover members’ DB benefits were transferred into individual policies for the members. This removed the Group’s risks relating to an insurer no longer being able to meet its obligations. The Group has no further legal responsibility to fund these benefits.
The residual assets in the Scheme of $16.4m at the point of termination were transferred to the Group and HMRC. Payments were made from the Scheme on 6 December 2018 as part of the wind-up process, of which $10.6m was paid to the Group and $5.8m was paid to HMRC in relation to tax due. No further payments from the Scheme have been received since, nor are any due.
The present value of the obligation and the closing fair value of the plan assets were both $nil at the end of 2018 and, therefore, the net asset at the end of 2018 was also $nil.
During 2018, a current service cost of $2.1m and a past service cost of $0.4m were recognised in the income statement in operating expenses and net interest income on the net defined benefit asset of $0.4m was recognised in finance income (note 9). The net expense included within staff costs in note 8 was $2.1m. The current service cost included $2.1m of administration costs. Due to the Group’s liability being extinguished in the prior year, no income or expenditure in relation to this plan was generated or incurred during 2019.
33. Share Capital and Share Premium
2019
Ordinary shares of 25p eachNumber
Ordinary shares of 25p each
$m
Share premium
$m
At 1 January 165,073,603 66.7 153.0Shares issued – share option schemes and awards 1,866,479 0.6 – At 31 December 166,940,082 67.3 153.0
There are no restrictions attached to any of the Ordinary shares in issue and all Ordinary shares carry equal voting rights. The rights attached to the Company’s Ordinary shares are summarised on page 187. All of the Ordinary shares in issue are fully paid.
At 31 December 2019, 1,609,150 (2018 – 1,247,672) Ordinary shares were held by an Employee Benefit Trust. Details of the carrying amount are set out in note 35.

153 Hunting PLC / 2019 Annual Report and AccountsP
urpose and C
ultureB
usiness Mod
el and Stakehold
ersG
overnanceP
erformance
Business S
trategy F
ina
nc
ial sta
tem
en
ts
33. Share Capital and Share Premium continued
2018
Ordinary shares of 25p eachNumber
Ordinary shares of 25p each
$m
Share premium
$m
At 1 January 164,173,603 66.4 153.0Shares issued – share option schemes and awards 900,000 0.3 –At 31 December 165,073,603 66.7 153.0
34. Other Components of Equity
2019
Merger reserve
$m
Share-based payments
reserve$m
Capital redemption
reserve$m
Currency translation
reserve$m
Total$m
At 1 January 67.2 22.3 0.2 (13.9) 75.8Exchange adjustments – – – 5.0 5.0Release of foreign exchange on liquidation of subsidiaries net of tax – – – (0.2) (0.2)Fair value gains and losses– losses originating on net investment hedges arising
during the year net of tax – – – (0.7) (0.7)Share options and awards– value of employee services – 9.0 – – 9.0– discharge – (11.6) – – (11.6)Transfer between reserves (20.8) – – – (20.8)At 31 December 46.4 19.7 0.2 (9.8) 56.5
The merger reserve comprises the proceeds received, net of transaction costs, in excess of the nominal value of the Ordinary shares issued by way of the share placing completed on 31 October 2016. In accordance with section 612 of the Companies Act 2006, the premium was credited to the merger reserve, instead of to the share premium account, because the share placing was pursuant to the Company securing over 90% of another entity. The proceeds were used to pay down the Group’s borrowings at that time.
The reserve is currently non-distributable and is transferred to distributable retained earnings when the proceeds meet the definition of a qualifying consideration. During the year, $20.8m (2018 – $12.2m) was transferred from the merger reserve to retained earnings. This portion of the reserve was considered to be realised, as the equivalent amount of the proceeds from the share placing in 2016 have now met the definition of qualifying consideration.
2018
Merger reserve
$m
Cash flow hedge reserve
$m
Share-based payment
reserve$m
Capital redemption
reserve$m
Currency translation
reserve$m
Total$m
At 1 January 79.4 (0.1) 18.9 0.2 (6.7) 91.7Exchange adjustments – – – (8.4) (8.4)Fair value gains and losses– gains originating on cash flow hedges
arising during the year net of tax – 0.2 – – – 0.2– gains originating on net investment hedges
arising during the year net of taxes – – – – 1.2 1.2– losses transferred to the carrying value of
inventory purchased in the year net of tax – (0.1) – – – (0.1)Share options and awards– value of employee services – – 13.1 – – 13.1– discharge – – (9.7) – – (9.7)Transfer between reserves (12.2) – – – – (12.2)At 31 December 67.2 – 22.3 0.2 (13.9) 75.8

154 Hunting PLC / 2019 Annual Report and Accounts
Notes to the Consolidated Financial Statements continued
35. Retained Earnings
2019$m
2018$m
At 31 December as previously reported 881.6 782.2Adjustment on adoption of IFRS 16 – note 41 (2018 – IFRS 9) (1.1) (0.2)At 1 January amended 880.5 782.0Profit for the year 39.7 89.3Remeasurement of defined benefit pension schemes net of tax (0.3) 1.5Dividends paid to equity shareholders (16.6) (6.6)Purchase of treasury shares (5.0) (5.7)Disposal of treasury shares 0.3 –Share options and awards– discharge 10.8 9.2– taxation 0.9 (0.3)Transfer between reserves 20.8 12.2At 31 December 931.1 881.6
The share options and awards taxation credit taken directly to equity of $0.9m (2018 – $0.3m charge) comprises $0.1m (2018 – $0.2m charge) deferred tax credit and $0.8m (2018 – $0.1m charge) current tax credit.
Retained earnings include the following amounts in respect of the carrying amount of Treasury shares:
2019$m
2018$m
Cost:At 1 January (11.2) (7.2)Purchase of Treasury shares (5.0) (5.7)Disposal of Treasury shares 3.4 1.7At 31 December (12.8) (11.2)
The loss on disposal of Treasury shares during the year, which is recognised in retained earnings, was $3.1m (2018 – $1.7m).
36. Dividends Paid to Equity Shareholders
2019 2018
Cents per share $m
Cents per share $m
Ordinary dividends:2019 interim paid 5.0 8.3 – –2018 final paid 5.0 8.3 – –2018 interim paid – – 4.0 6.6
10.0 16.6 4.0 6.6
A final dividend of 6.0 cents per share has been proposed by the Board, amounting to an estimated distribution of $9.9m. The proposed final dividend is subject to approval by the shareholders at the Annual General Meeting to be held on 15 April 2020 and has not been provided for in these financial statements. If approved, the dividend will be paid in Sterling on 15 May 2020, to shareholders on the register on 17 April 2020, and the Sterling value of the dividend payable per share will be fixed, and announced approximately two weeks prior to the payment date, based on the average spot exchange rate over the three business days preceding the announcement date. Guidance on the Company’s position on declaring and paying future dividends is provided within the Strategic Report on page 14.
37. Share-Based Payments
(a) 2009 Performance Share Plan (“PSP”)(i) Performance-Based Awards and OptionsThe Company granted nil-cost performance-based share awards and options under the PSP between 2009 and 2013. Under the PSP, annual conditional awards of shares and options were made to executive Directors and senior employees. Awards and options are subject to performance conditions during the vesting period. The PSP was replaced by the 2014 Hunting Performance Share Plan (“HPSP”) following shareholder approval of the HPSP at the Annual General Meeting (“AGM”) of the Company on 16 April 2014. The final grant under the PSP occurred in 2013, with the final measurements of the performance conditions being completed in 2016. The fair value charge to the income statement attributable to the performance-based PSP was $nil (2018 – $nil).

155 Hunting PLC / 2019 Annual Report and AccountsP
urpose and C
ultureB
usiness Mod
el and Stakehold
ersG
overnanceP
erformance
Business S
trategy F
ina
nc
ial sta
tem
en
ts
37. Share-Based Payments continued
(a) 2009 Performance Share Plan (“PSP”) continued(ii) Time-Based Awards and OptionsThe Company granted nil-cost, time-based share awards and options under the PSP between 2009 and 2013. Annual awards of shares and options were made to employees, subject to continued employment, during the vesting period. There were no performance conditions attached. Time-based awards continue to be granted under the HPSP. The final grant under the PSP occurred in 2013 and vested in 2016. Details of the time-based PSP awards and options movements during the year are as follows:
2019Number of
shares
2018Number of
shares
Outstanding at the beginning of the year 7,004 15,606Vested and exercised during the year (1,947) (8,602)Lapsed during the year (1,456) –Outstanding and exercisable at the end of the year 3,601 7,004
The weighted average share price at the date of exercise during 2019 was 569.1 pence (2018 – 786.4 pence).
Details of the time-based PSP awards and options outstanding at 31 December 2019 are as follows:
2019Number of
shares
2018Number of
sharesNormal
vesting date
Date of grant:25 February 2011 875 875 25.02.1417 April 2012 1,725 2,446 17.04.1520 March 2013 1,001 3,683 20.03.16Outstanding and exercisable at the end of the year 3,601 7,004
The fair value charge to the income statement attributable to the time-based PSP is $nil (2018 – $nil).
(b) 2014 Hunting Performance Share Plan (“HPSP”)(i) Performance-Based AwardsThe Company grants performance-based share awards annually to executive Directors and senior employees under the HPSP. Awards are granted at nil cost under the HPSP. Up to 2017, the performance-based HPSP awards to the executive Directors were divided equally into three tranches. From 2018, the performance-based HPSP awards were divided into four tranches of differing proportions. Each tranche is subject to a three-year vesting period, and is also subject to performance conditions. Up to 2017, the three conditions were Company performance over a three-year period against (i) the TSR of a bespoke comparator group, (ii) underlying diluted earnings per share (“EPS”) growth, and (iii) average underlying Return on Capital Employed (“ROCE”) achieved. The fourth performance condition added in 2018 is based on a Balanced Scorecard, comprising of non-financial KPIs including Quality and Safety performance. The 2018 award weightings are EPS 25%; TSR 25%; ROCE 35% and the Balanced Scorecard 15%. The performance period for the 2018 awards granted under the HPSP is 1 January 2018 to 31 December 2020. The vesting date of the 2018 award is 19 April 2021. Details of the performance-based HPSP awards movements during the year are set out below:
2019Number of
shares
2018Number of
shares
Outstanding at the beginning of the year 3,372,764 3,446,240Granted during the year to executive Directorsii 541,708 373,709Granted during the year to senior managersi/ii 835,464 579,573Vested and exercised during the year (977,588) (157,292)Lapsed during the year (407,126) (869,466)Outstanding at the end of the year 3,365,222 3,372,764
i. The 2017 HPSP awards granted to senior managers incorporates a fourth performance condition based on Hunting’s reported internal manufacturing reject rate.
ii. The 2018 HPSP awards granted to the executive Directors and senior managers incorporates a Balanced Scorecard, in addition to the TSR, EPS and ROCE performance conditions.

156 Hunting PLC / 2019 Annual Report and Accounts
Notes to the Consolidated Financial Statements continued
37. Share-Based Payments continued
(b) 2014 Hunting Performance Share Plan (“HPSP”) continued(i) Performance-Based Awards continuedDetails of the performance-based HPSP awards outstanding at 31 December 2019 are as follows:
2019Number of
shares
2018Number of
sharesNormal
vesting date
Date of grant:11 March 2016 36,474 1,402,897 11.03.193 March 2017 1,027,356 1,027,356 03.03.2019 April 2018 924,220 942,511 19.04.2121 March 2019 1,377,172 – 21.03.22Outstanding at the end of the year 3,365,222 3,372,764
In 2019, 977,588 awards vested and were exercised in respect of the 2016 HPSP grant. The weighted average share price at the date of exercise during 2019 was 516.9 pence.
In 2018, 157,292 awards vested and were exercised in respect of the 2015 HPSP grant. The weighted average share price at the date of exercise during 2018 was 801.2 pence.
(ii) Time-Based AwardsThe Company also grants time-based share awards annually under the HPSP. Annual awards of shares may be made to employees subject to continued employment during the vesting period. There are no performance conditions attached. Awards are granted at nil cost under the HPSP.
Details of the time-based HPSP awards movements during the year are set out below:
2019Number of
shares
2018Number of
shares
Outstanding at the beginning of the year 3,249,426 3,462,942Granted during the year 1,053,039 787,667Vested and exercised during the year (1,246,670) (868,167)Lapsed during the year (119,398) (133,016)Outstanding at the end of the year 2,936,397 3,249,426
The weighted average share price at the date of exercise during 2019 was 521.5 pence (2018 – 797.3 pence).
Details of the time-based HPSP awards outstanding at 31 December 2019 are as follows:
2019Number of
shares
2018Number of
sharesNormal
vesting date
Date of grant:1 May 2014 4,112 6,121 01.05.1728 April 2015 14,630 27,250 28.04.1811 March 2016 80,119 1,290,754 11.03.193 March 2017 1,102,403 1,157,072 03.03.2019 April 2018 714,048 768,229 19.04.2121 March 2019 1,021,085 – 21.03.22Outstanding at the end of the year 2,936,397 3,249,426
(iii) Fair Value of HPSP AwardsThe fair value of awards granted under the HPSP is calculated using two separate models:
(1) The fair value of awards subject to a market-related performance condition, specifically Company performance against the TSR of a bespoke peer group, has been calculated using the Stochastic pricing model (also known as the “Monte Carlo” model).
The assumptions used in this model were as follows:
2019 2018
Date of grant/valuation date 21.03.19 19.04.18Weighted average share price at grant 573.5p 785.0pExercise price nil nilExpected dividend yield nil nilExpected volatility 39.0% 48.9%Risk-free rate 0.67% 0.85%Expected life 3 years 3 yearsFair value 380.4p 616.0p

157 Hunting PLC / 2019 Annual Report and AccountsP
urpose and C
ultureB
usiness Mod
el and Stakehold
ersG
overnanceP
erformance
Business S
trategy F
ina
nc
ial sta
tem
en
ts
37. Share-Based Payments continued
(b) 2014 Hunting Performance Share Plan (“HPSP”) continued(iii) Fair Value of HPSP Awards continued(2) The fair value of performance-based awards not subject to a market-related performance condition, include the EPS and ROCE performance targets and the time-based HPSP awards, with the fair value being calculated using the Black-Scholes pricing model.
The assumptions used in this model were as follows:
2019 2018
Date of grant/valuation date 21.03.19 19.04.18Weighted average share price at grant 573.5p 785.0pExercise price nil nilExpected dividend yield nil nilExpected volatility 39.0% 48.9%Risk-free rate 0.67% 0.85%Expected life 3 years 3 yearsFair value 573.5p 785.0p
The methods to calculate the assumptions for both models are: • The expected volatility was calculated using historic weekly volatility, equal in length to the remaining portion of the performance period
at the date of grant. • The expected life of the award has been calculated commensurate with the vesting period. The risk-free rate is based on the UK gilt
rate commensurate with the vesting period prevailing at the date of grant. • Participants are entitled to a dividend equivalent over the number of shares that make up their award. It is accumulated over the vesting
period and released subject to the achievement of the performance conditions. This is factored into the fair value calculation and as a result the dividend yield assumption is set to zero.
• The initial accounting charge of the performance-based HPSP awards granted under the HPSP incorporates an estimate of the number of shares that are expected to lapse for those participants who cease employment during the vesting period. The estimate of the expected forfeiture rate is 5% per annum. The subsequent accounting charge includes an adjustment to the initial accounting charge to allow for actual lapses rather than estimated lapses.
The amount charged to the income statement attributable to the performance-based HPSP awards is $1.6m (2018 – $5.4m) and the charge to the income statement in respect of time-based HPSP awards is $7.4m (2018 – $7.7m). These are recognised in operating expenses.
(c) Cash Conditional Share AwardsThe Company also grants Cash Conditional Awards annually to employees in certain overseas tax jurisdictions. These awards are aligned with the rules of HPSP and are subject to employees continued employment during the vesting period. There are no performance conditions attached. Awards are granted at nil cost and are settled at the closing mid market price of a Hunting PLC ordinary share on the third anniversary of the date of grant.
Details of the cash conditional award movements during the year are set out below:
2019Number of
shares
2018Number of
shares
Outstanding at the beginning of the year 10,697 4,575Granted during the year 75,981 6,122Vested and exercised during the year (745) –Lapsed during the year (7,553) –Outstanding at the end of the year 78,380 10,697
The weighted average share price at the date of exercise during 2019 was 447.9 pence (2018 – nil).
Details of the cash conditional awards outstanding at 31 December 2019 are as follows:
2019Number of
shares
2018Number of
sharesNormal
vesting date
Date of grant:3 March 2017 4,575 4,575 03.03.2019 April 2018 6,122 6,122 19.04.2121 March 2019 67,683 – 21.03.22Outstanding at the end of the year 78,380 10,697
The charge to the income statement attributable to the cash conditional awards is $0.1m (2018 – $<0.1m).
The fair value of the cash conditional awards is calculated using the same assumptions and model as the fair value of performance-based awards not subject to a market-related performance condition (see (b)(iii) above). The fair value of the award at 31 December 2019 was 417.4 pence.
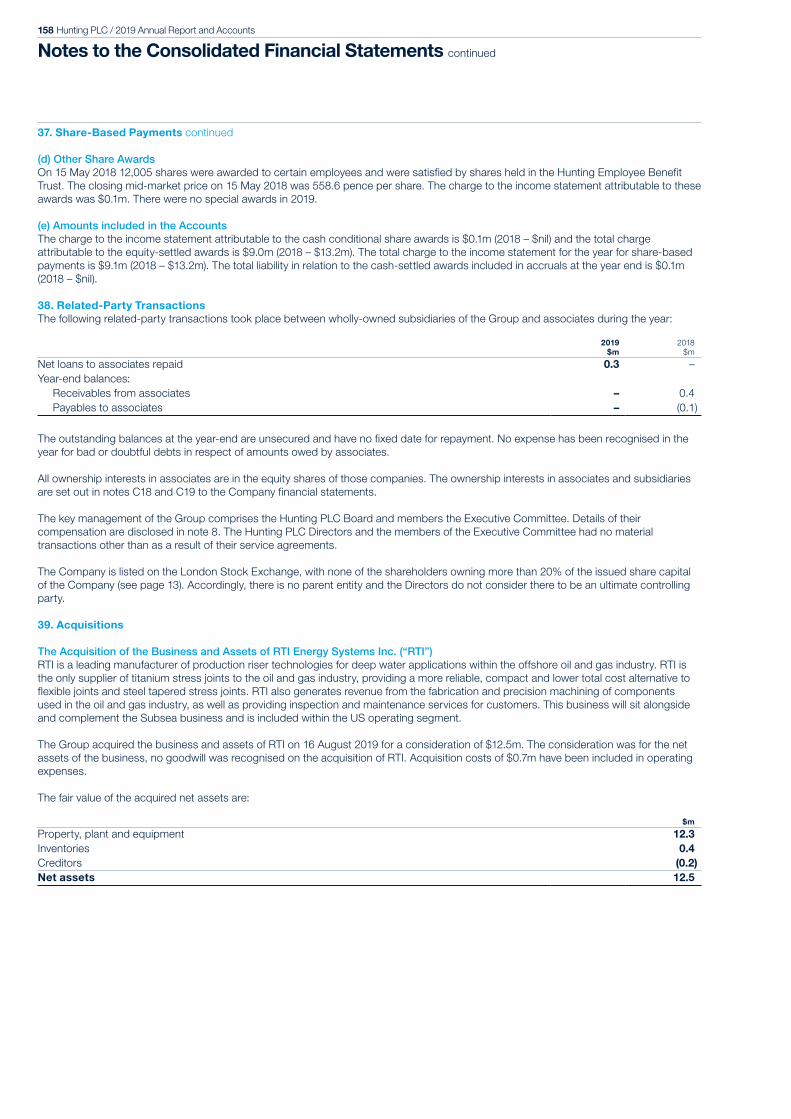
158 Hunting PLC / 2019 Annual Report and Accounts
Notes to the Consolidated Financial Statements continued
37. Share-Based Payments continued
(d) Other Share AwardsOn 15 May 2018 12,005 shares were awarded to certain employees and were satisfied by shares held in the Hunting Employee Benefit Trust. The closing mid-market price on 15 May 2018 was 558.6 pence per share. The charge to the income statement attributable to these awards was $0.1m. There were no special awards in 2019.
(e) Amounts included in the AccountsThe charge to the income statement attributable to the cash conditional share awards is $0.1m (2018 – $nil) and the total charge attributable to the equity-settled awards is $9.0m (2018 – $13.2m). The total charge to the income statement for the year for share-based payments is $9.1m (2018 – $13.2m). The total liability in relation to the cash-settled awards included in accruals at the year end is $0.1m (2018 – $nil).
38. Related-Party TransactionsThe following related-party transactions took place between wholly-owned subsidiaries of the Group and associates during the year:
2019$m
2018$m
Net loans to associates repaid 0.3 –Year-end balances: Receivables from associates – 0.4 Payables to associates – (0.1)
The outstanding balances at the year-end are unsecured and have no fixed date for repayment. No expense has been recognised in the year for bad or doubtful debts in respect of amounts owed by associates.
All ownership interests in associates are in the equity shares of those companies. The ownership interests in associates and subsidiaries are set out in notes C18 and C19 to the Company financial statements.
The key management of the Group comprises the Hunting PLC Board and members the Executive Committee. Details of their compensation are disclosed in note 8. The Hunting PLC Directors and the members of the Executive Committee had no material transactions other than as a result of their service agreements.
The Company is listed on the London Stock Exchange, with none of the shareholders owning more than 20% of the issued share capital of the Company (see page 13). Accordingly, there is no parent entity and the Directors do not consider there to be an ultimate controlling party.
39. Acquisitions
The Acquisition of the Business and Assets of RTI Energy Systems Inc. (“RTI”)RTI is a leading manufacturer of production riser technologies for deep water applications within the offshore oil and gas industry. RTI is the only supplier of titanium stress joints to the oil and gas industry, providing a more reliable, compact and lower total cost alternative to flexible joints and steel tapered stress joints. RTI also generates revenue from the fabrication and precision machining of components used in the oil and gas industry, as well as providing inspection and maintenance services for customers. This business will sit alongside and complement the Subsea business and is included within the US operating segment.
The Group acquired the business and assets of RTI on 16 August 2019 for a consideration of $12.5m. The consideration was for the net assets of the business, no goodwill was recognised on the acquisition of RTI. Acquisition costs of $0.7m have been included in operating expenses.
The fair value of the acquired net assets are:
$m
Property, plant and equipment 12.3Inventories 0.4Creditors (0.2)Net assets 12.5

159 Hunting PLC / 2019 Annual Report and AccountsP
urpose and C
ultureB
usiness Mod
el and Stakehold
ersG
overnanceP
erformance
Business S
trategy F
ina
nc
ial sta
tem
en
ts
40. Principal Accounting Policies
The Group’s principal accounting policies are described below:
(a) Consolidation • The Group financial statements include the results of the Company and its subsidiaries, together with its share of associates. • Subsidiaries are consolidated from the date on which control is transferred to the Group and are de-consolidated from the date control
ceases. • The Group uses the acquisition method of accounting for business combinations. Consequently, the consideration is determined as
the fair value of the net assets transferred to the vendor and includes an estimate of any contingent consideration. The net assets acquired are also measured at their respective fair values for initial recognition purposes on the acquisition date.
• Acquisition-related costs are expensed to the income statement as incurred.
(b) Revenue(i) Revenue from Contracts with Customers • Revenue from contracts with customers is measured as the fair value of the consideration received or receivable for the provision of
goods and services in the ordinary course of business, net of trade discounts, volume rebates, and sales taxes. • Revenue is recognised when control of the promised goods or services is transferred to the customer. Consequently revenue for the
sale of a product is recognised either: 1. Wholly at a single point in time when the entity has completed its performance obligation, which is most commonly indicated by
shipment of the products or the products are made available to the customer for collection; or 2. Piecemeal over time during the period that control incrementally transfers to the customer while the good is being manufactured or
the service is being performed. • Hunting’s activities that require revenue recognition over time comprise:
1. Work undertaken to enhance customer-owned products – most commonly the lathing of a thread onto the ends of customer-owned plain-end pipe;
2. The manufacture of goods that are specifically designed for and restricted to the use of a particular customer, such as the manufacture of bespoke specialised circuitry and housing, and for which Hunting is entitled to a measure of recompense that reflects the fair value of the stage of production prior to their completion; and
3. The provision of services in which the customer obtains the benefit while the service is being performed – most commonly the storage and management services of customer-owned pipe.
• Hunting’s activities that require revenue recognition at a point in time comprise: 1. The sale of goods that are not specifically designed for use by one particular customer. Products include tubulars acquired by
Hunting as plain-end pipe on which lathing work has been applied and which is resold as threaded pipe; and 2. The manufacture of goods that are specifically designed for one particular customer but for which Hunting is not entitled to a
measure of recompense that reflects the fair value of the stage of production prior to completion.
(ii) Rental RevenueRental revenue is measured as the fair value of the consideration received or receivable for the provision of rental equipment in the ordinary course of business, net of trade discounts and sales taxes.
Revenue from the rental of plant and equipment is recognised as the income is earned.
(c) Amortisation and Exceptional Items Exceptional items are items of income or expense that the Directors believe should be separately disclosed by virtue of their significant size or nature to enable a better understanding of the Group’s financial performance. The Group discloses such items in the “middle column” of the income statement. In applying this policy, the following items have been treated as exceptional:
• Costs of restructuring the Group’s operations, including the cost of business closures and redundancies, in response to the decline in regional opportunities for growth.
• Defined benefit pension curtailment. • Impairment of property, plant and equipment.
The tax effect of any transaction considered to be exceptional is also treated as exceptional.
Amortisation expenses for intangible assets recognised as part of a business combination are also shown in the “middle column” due to the significance of these amounts and to clearly identify the effect on profits, which will arise as current balances become fully written-off, or as new acquisitions give rise to new expenses. The post-acquisition profits of acquired businesses shown in the underlying column do not, therefore, reflect these costs.
(d) InterestInterest income and expense is recognised in the income statement using the effective interest method.

160 Hunting PLC / 2019 Annual Report and Accounts
Notes to the Consolidated Financial Statements continued
40. Principal Accounting Policies continued
(e) Foreign Currencies(i) Individual Subsidiaries’ and Associates’ Financial Statements • The financial statements for each of the Group’s subsidiaries and associates are denominated in their functional currency. • The functional currency is the currency of the primary economic environment in which the entity operates. • Transactions denominated in currencies other than the functional currency are translated into the functional currency at the exchange
rate ruling at the date of the transaction. • Monetary assets and liabilities, except borrowings designated as a hedging instrument in a net investment hedge, denominated in non-
functional currencies are retranslated at the exchange rate ruling at the balance sheet date and exchange differences are taken to the income statement.
• Borrowings designated as a hedging instrument in a net investment hedge are retranslated at the exchange rate ruling at the balance sheet date and exchange differences are taken direct to equity.
(ii) Group Consolidated Financial Statements • The presentation currency of the Group is US dollars. • The net assets of non-US dollar denominated subsidiaries and associates are translated into US dollars at the exchange rates ruling at
the balance sheet date. • The income statements of subsidiaries and associates are translated into US dollars at the average rates of exchange for the year. • Exchange differences are recognised directly in equity in the currency translation reserve (“CTR”), together with exchange differences
arising on foreign currency loans used to finance foreign currency net investments. • Upon adoption of IFRS on 1 January 2004, accumulated exchange differences arising on consolidation prior to 31 December 2003
were reset to zero and the CTR recommenced under IFRS on 1 January 2004. • The balance on the CTR represents the exchange differences arising on the retranslation of non-US dollar amounts into US dollars
since 1 January 2004. • On the disposal of a business, the cumulative exchange differences previously recognised in the CTR relating to that business are
transferred to the income statement as part of the gain or loss on disposal.
(f) Taxation • The taxation recognised in the income statement comprises current tax and deferred tax arising on the current year’s result before tax
and adjustments to tax arising on prior years’ results. • Current tax is the expected tax payable or receivable arising in the current year on the current year’s result before tax, using tax rates
enacted or substantively enacted at the balance sheet date, plus adjustments to tax in respect of prior years’ results. • Deferred tax is the tax that is expected to arise when the assets and liabilities recognised in the Group’s balance sheet are realised,
using tax rates enacted or substantively enacted at the balance sheet date that are expected to apply when the asset is realised or the liability is settled.
• Full provision is made for deferred taxation, using the liability method, on all taxable temporary differences. Deferred tax assets and liabilities are recognised separately on the balance sheet and are reported as non-current assets and liabilities.
• Deferred tax assets are recognised only to the extent that they are expected to be recoverable. Deferred taxation on unremitted overseas earnings is provided for to the extent a tax charge is foreseeable.
• When items of income and expense are recognised in other comprehensive income, the current and deferred tax relating to those items is also recognised in other comprehensive income.
• Tax arising on the discharge of share options and awards is recognised directly in equity.
(g) Segmental Reporting • Financial information on operating segments that corresponds with information regularly reviewed by the Chief Operating Decision
Maker (“CODM”) is disclosed in the financial statements. Consequently, the Group’s principal segmental reporting is established on a geographical basis.
• The geographical information is based on the location of where the sale originated and where the non-current assets are located. • Revenue is also disclosed by product group, which is provided to assist in investor understanding of the underlying performance
trends. Each product group consists of goods and services that are similar in nature or serve similar markets.
(h) Property, Plant and Equipment(i) General • Property, plant and equipment is stated at cost less accumulated depreciation and any impairment in value. Cost includes expenditure
that is directly attributable to the acquisition and installation of the asset. • Land, pre-production oil and gas exploration costs and assets under construction are not depreciated. • With the exception of drilling tools and rental tools, which are depreciated using the units of production method, and oil and gas
exploration and production equipment (see (ii) below), assets are depreciated using the straight-line method at the following rates:
Freehold buildings – 2% to 10% Leasehold buildings – life of lease Plant, machinery and motor vehicles – 6% to 33 1∕3%
The assets’ residual values and useful lives are reviewed, and adjusted if appropriate, at the end of each reporting period.
161 Hunting PLC / 2019 Annual Report and AccountsP
urpose and C
ultureB
usiness Mod
el and Stakehold
ersG
overnanceP
erformance
Business S
trategy F
ina
nc
ial sta
tem
en
ts
40. Principal Accounting Policies continued
(h) Property, Plant and Equipment continued(ii) Exploration Expenditure • Oil and gas exploration and appraisal costs are initially capitalised pending determination of the existence of commercial reserves and
are included in the asset category Oil and Gas Exploration and Development. • Upon determination that commercially viable quantities of hydrocarbons are not found, the costs are charged immediately to the
income statement. • Depreciation of oil and gas expenditure commences when production commences. The costs are depreciated using the unit of
production method.
(i) Leases – lessees • Lessees are required to recognise lease obligations as a liability and a right-of-use asset. The cost of the lease is subsequently
recognised in the income statement as interest charged on the liability and as depreciation charged on the right-of-use asset. Hunting has adopted the two exemptions that permit lessees to charge the cost of certain leases directly to the income statement on a straight-line basis. The two exemptions apply to:
(i) leases that have a duration of one year or less; and (ii) leases of assets that would have cost $5,000 or less, when new, to acquire if the asset had been purchased rather than leased. • With regard to capitalised leases of motor vehicles and forklifts, Hunting has applied the option that permits lessees to combine the
non-lease component with the lease component and recognise the two payment streams as a single arrangement.
(j) Goodwill • Goodwill arises when the fair value of the consideration paid for a business exceeds the fair value of the Group’s share of the net assets
acquired. • Goodwill is recognised as an asset and is carried at cost less accumulated impairment losses. • Goodwill is allocated to cash-generating units for the purpose of impairment testing. The allocation is made to the cash-generating
units or groups of cash-generating units that are expected to benefit from the business combination in which the goodwill arose. • On the disposal of a business, goodwill relating to that business that remains on the balance sheet at the date of disposal is included in
the determination of the profit or loss on disposal.
(k) Other Intangible Assets • Other intangible assets, whether obtained through acquisition or internal development, are capitalised when it is probable that the
future economic benefits that are attributable to the asset will be generated, provided the cost of the asset can be measured reliably. • Capitalisation only occurs from the point technical and commercial feasibility of the asset has been established. Prior to this costs are
expensed. • For internally generated assets, only costs directly attributable to the development of the asset are capitalised. This typically includes
employee remuneration and the cost of materials and services, such as testing, consumed in generating the intangible asset. • Other intangible assets are stated at cost less accumulated amortisation and impairment losses where applicable. • These assets have a finite life and are amortised in accordance with the pattern of expected future economic benefits, or when this
cannot be reliably estimated, by using the straight-line method. • Intangible assets are amortised over the following periods:
Customer relationships – eight to ten years Patents – eight to ten years Unpatented technology – eight to ten years Trademarks and domain names – one to five years
(l) Impairments • The Group performs goodwill impairment reviews at least annually. • The Group also assesses at least annually whether there have been any events or changes in circumstances that indicate that
property, plant and equipment and intangible assets other than goodwill may be impaired. An impairment review is carried out whenever the assessment indicates that the carrying amount may not be fully recoverable.
• For the purposes of impairment testing, assets are grouped at the lowest levels for which there are separately identifiable cash flows. • Where impairment exists, the asset is written down to the higher of (a) its fair value minus costs to sell; and (b) its value in use.
Impairments are recognised immediately in the income statement. • An impairment to goodwill is never reversed. When applicable, an impairment of any other asset is reversed, but only to the extent that
the consequent carrying value does not exceed what would have been the carrying value had the impairment not originally been made.
(m) Inventories • Inventories are stated at the lower of cost and net realisable value. • Cost is determined using the first-in-first-out method and net realisable value is the estimated selling price less costs of disposal in the
ordinary course of business. The cost of inventories includes direct costs plus production overheads.
(n) Cash and Cash Equivalents • Cash and cash equivalents comprise cash at bank and in hand, short-term deposits with a maturity of less than three months from the
date of deposit and Money Market Funds. • Short-term deposits and Money Market Funds have been classified as cash and cash equivalents as they are short-term, highly liquid,
are readily convertible to a known amount of cash and are subject to an insignificant risk of change in value. • For cash flow statement purposes, cash and cash equivalents include bank overdrafts. In the balance sheet, bank overdrafts are
shown within borrowings in current liabilities.

162 Hunting PLC / 2019 Annual Report and Accounts
Notes to the Consolidated Financial Statements continued
40. Principal Accounting Policies continued
(o) Financial Assets • At initial recognition, the Group measures a financial asset at its fair value plus, in the case of a financial asset not at fair value through
profit or loss (“FVTPL”), transaction costs. Transaction costs of financial assets at FVTPL are expensed immediately to the income statement.
• Subsequent measurement of debt instruments depends on each Group entity’s business model for managing the asset in order to generate cash flows and the cash flow characteristics of the financial asset. The Group’s debt instruments are classified either into amortised cost or fair value through profit or loss.
• Debt instruments that are held for the collection of contractual cash flows, where those cash flows represent solely payments of principal and interest, are subsequently measured at amortised cost. Interest income from these financial assets is included in finance income using the effective interest method. If collection is expected in one year or less they are classified as current assets, otherwise they are presented as non-current assets. Debt instruments held for collection of contractual cash flows include the loan note, contract assets, trade receivables, accrued revenue and other receivables.
• Any other debt instruments, including Money Market Funds, that are subsequently not measured at amortised cost have been measured at fair value through profit or loss.
• The Group’s financial assets that are equity instruments are subsequently measured at fair value through profit or loss. Changes in the fair value of the equity instruments are recognised in other operating income, operating expenses, finance income or finance expense, as appropriate. Financial assets that are equity instruments comprise listed equity investments and mutual funds.
• The Group assesses on a forward-looking basis the expected credit losses (“ECLs”) at each balance sheet date associated with its loan note that is carried at amortised cost. The impairment methodology applied, following the adoption of the general model under IFRS 9, will depend on whether there has been a significant increase in credit risk. Indications of a significant increase in credit risk include events that have a negative impact on the estimated future cash flows and if any payments under the terms of the debt are more than 30 days overdue.
• The Group has chosen to apply lifetime ECLs to trade receivables, accrued revenue, contract assets and lease receivables, both short-term and long-term, upon their initial recognition.
(p) Financial Liabilities • Financial liabilities are initially recognised at fair value at the trade date which is normally the consideration received less, in the case of
financial liabilities that are not measured at fair value through profit or loss, transaction costs. The Group subsequently remeasures all of its non-derivative financial liabilities, including trade payables, at amortised cost.
• Payables are classified as current liabilities if payment is due within one year, otherwise they are presented as non-current liabilities.
(q) Derivatives and Hedging • Derivatives are initially recognised at fair value on the date the derivative contract is entered into and are subsequently remeasured to
their fair value at the end of each reporting period. • The full fair value of a derivative is classified as a non-current asset or liability when the remaining maturity of the hedged item is more
than 12 months from the balance sheet date. • The accounting for subsequent changes in fair value depends on whether the derivative is designated as a hedging instrument, and if
so, the nature of the item being hedged. • Where the derivatives are not designated in a hedge and accounted for using hedge accounting, they are classified as “held for
trading” and are accounted for at fair value through profit or loss, with changes in the fair value recognised immediately within the income statement.
• The Group designates certain derivatives as: (i) hedges of the fair value of recognised assets and liabilities; or (ii) hedges of a particular risk associated with the cash flows of highly probable forecast transactions; or (iii) a hedge of the net investment in a foreign operation.
(i) Fair Value Hedges• Fair value gains or losses on derivatives designated in a fair value hedge are recognised immediately in the income statement if the
changes in the fair value of the hedged item are taken to the income statement.(ii) Cash Flow Hedges• When forward foreign exchange contracts are designated in a cash flow hedge of forecast transactions, the Group generally
designates only the change in fair value of the forward contract relating to the spot component as the hedging instrument. Gains or losses relating to the effective portion of the change in the spot component of the forward contracts are recognised in the cash flow hedge reserve within equity. The Group has chosen to recognise the change in the forward element of the contract that relates to the hedged item, defined as the forward points, within the income statement immediately rather than in equity. The forward points are discounted, where material.
• Where the hedged item subsequently results in the recognition of a non-financial asset, such as inventory or PPE, the deferred hedging gains and losses in equity are included within the initial cost of the asset. The deferred amounts are subsequently recognised in profit or loss when the hedged item affects profit or loss (for example through cost of sales or depreciation).
• When a hedging instrument expires, or is sold or terminated, or when a hedge no longer meets the criteria for hedge accounting, any cumulative deferred gain or loss in equity at that time remains in equity until the forecast transaction occurs. When the forecast transaction is no longer expected to occur, the cumulative gain or loss of hedging that was reported in equity is immediately reclassified to the income statement.
(iii) Net Investment Hedges• Fair value gains or losses relating to the effective portion on derivatives designated in a net investment hedge are recognised in the
other comprehensive income and accumulated in equity in the cumulative translation reserve (“CTR”). The gain or loss relating to the ineffective portion is recognised immediately in profit or loss. The cumulative gain or loss in the CTR is reclassified to the income statement as part of the gain or loss on disposal when the foreign subsidiary is disposed of or liquidated.
163 Hunting PLC / 2019 Annual Report and AccountsP
urpose and C
ultureB
usiness Mod
el and Stakehold
ersG
overnanceP
erformance
Business S
trategy F
ina
nc
ial sta
tem
en
ts
40. Principal Accounting Policies continued
(r) Provisions • Provisions are recognised when the Group has a present obligation as a result of a past event and it is probable that an outflow of
resources will be required to settle the obligation. • The measurement of a provision is based on the most likely amount and timing of the expenditures. Payments that are expected to
arise after more than one year are discounted to their present value using a risk-free interest rate that is relevant to the region in which the past event occurred. The risk-free interest rate is based on the redemption yields of government securities.
(s) Post-Employment Benefits • Payments to defined contribution retirement schemes are charged to the income statement when they fall due.
(t) Share-Based Payments • The Group issues equity-settled, share-based payments (HPSP awards) to certain employees as consideration for services received
from the employees. The fair value of the employees’ services is recognised as an expense in the income statement on a straight-line basis over the vesting period based on the Group’s estimate of awards that will ultimately vest. The obligation to settle these awards is recognised within other components of equity.
(u) Share Capital • The Company’s share capital comprises a single class of Ordinary shares, which are classified as equity. • Incremental costs directly attributable to the issue of new shares are charged to equity as a deduction from the proceeds, net of tax.
(v) Merger Reserve • The merger reserve comprises the proceeds received, net of transaction costs, in excess of the nominal value of the Ordinary shares
issued by way of the share placing completed on 31 October 2016. In accordance with section 612 of the Companies Act 2006, the premium was credited to the merger reserve, instead of to the share premium account, because the share placing was pursuant to the Company securing over 90% of another entity. The proceeds were used to pay down the Group’s borrowings at that time. The reserve is currently non-distributable and will be transferred to distributable retained earnings when the proceeds meet the definition of a qualifying consideration.
(w) Dividends • Dividends to the Group’s shareholders are recognised as liabilities in the Group’s financial statements in the period in which the
dividends are approved by shareholders. Interim dividends are recognised when paid. All dividends are dealt with in the statement of changes in equity.
41. Change in Accounting Policies
IFRS 16 Leases (“IFRS 16”) has replaced IAS 17 Leases (“IAS 17”) and its related interpretations. IFRS 16 establishes new principles for the recognition, measurement, presentation and disclosure of leases and became effective for the Group on 1 January 2019.
This note explains the impact of the adoption of IFRS 16 on the Group’s financial statements and discloses the new accounting policies that have been applied from 1 January 2019.
IFRS 16 has been adopted by applying the modified retrospective approach from 1 January 2019; consequently the comparatives for the 2018 reporting period have not been restated, as permitted under the specific transitional provisions in IFRS 16. The reclassifications and the adjustments arising from the new leasing rules are recognised in the opening balance sheet on 1 January 2019.
Under IFRS 16, lessor accounting requirements remain largely unchanged from IAS 17, and continue to require a lessor to classify a lease either as an operating lease or a finance lease. There has been no impact on the Group’s lessor accounting following the adoption of IFRS 16.
(a) Practical expedients applied on Adoption of IFRS 16In applying IFRS 16 for the first time, the Group has applied the following practical expedients as permitted by the standard:
• for contracts entered into before the transition date, the Group has relied on its assessment made when applying IAS 17 and IFRIC 4 Determining Whether an Arrangement Contains a Lease. Contracts have not been reassessed to determine if a contract is, or contains, a lease at the date of initial application;
• the accounting for operating leases with a remaining lease term of 12 months or less as at 1 January 2019 as short-term leases, with costs charged directly to the income statement;
• the exclusion of initial direct costs for the measurement of the right-of-use asset at the date of initial application; and• the use of hindsight in determining the lease term where the contract contains options to extend or terminate the lease.
(b) Adjustments Recognised on Adoption of IFRS 16On adoption of IFRS 16, the Group has recognised lease liabilities in relation to leases previously identified as operating leases in accordance with IAS 17 Leases and IFRIC 4 Determining Whether an Arrangement Contains a Lease. These lease liabilities were measured at 1 January 2019 at the present value of the remaining lease payments payable after that date. The associated right-of-use assets have been recognised as at 1 January 2019 on a retrospective basis as if IFRS 16 had always been applied.

164 Hunting PLC / 2019 Annual Report and Accounts
Notes to the Consolidated Financial Statements continued
41. Change in Accounting Policies continued
(b) Adjustments Recognised on Adoption of IFRS 16 continuedThe lease term has been determined according to management’s expectation of exercising any available extension/break/purchase options.
Note2019
$m
Total future aggregate minimum lease payments under non-cancellable operating leases (IAS 17) i 59.9Less: commitments in respect of leases that are not capitalised under IFRS 16 ii (0.5)Less: lease that was incepted before 31.12.18 but which commenced after 31.12.18 iii (0.6)Total future aggregate minimum lease payments of leases that are capitalised under IFRS 16 58.8Less: Impact of discounting the future payments to their present value as at 31.12.18 iv (9.8)Lease liability recognised as at 1 January 2019 49.0
Lease liabilities recognised on the balance sheet as at 1 January 2019:Current lease liabilities 9.3Non-current lease liabilities 39.7
49.0
Notesi. As disclosed in note 24. Under IAS 17, these future payments are not discounted for the time value of money.ii. Hunting PLC has elected to not capitalise leases that have a term of one year or less and leases that are for assets for which the Group would have had to
have paid $5,000 or less if they were purchased, as new, instead of being leased.iii. The Group signed, and therefore “incepted”, a lease in November 2018 and which, therefore, was a lease commitment as at 31 December 2018 under IAS 17.
The property was first made available to the Group in February 2019, which is the commencement date for recognising the lease liability under IFRS 16.iv. Under IFRS 16, the Group’s capitalised future lease commitments have been discounted using their relevant incremental borrowing rate, which has been
determined by reference to the financial position of the operating unit that is leasing the asset, the amount of the gross lease obligation, the weighted average length of the lease term, the economic environment in which the lease takes place and the type of asset that is leased. The weighted average lessee’s incremental borrowing rate applied to the lease liabilities on 1 January 2019 was 4.7%.
The Group has elected not to apply the practical expedient of relying on its previous assessment of whether a lease is onerous as at 1 January 2019. Therefore, the measurement of certain right-of-use assets as at 1 January 2019 has been adjusted by an impairment charge. As a result of this, onerous lease provisions, required by IAS 17, of $4.1m have been derecognised and dilapidation provisions of $0.1m have also been derecognised. Lease incentive liabilities and rent expense accruals previously recognised in relation to operating leases of $2.3m have also been derecognised, together with rent prepayments of $0.4m, as these have been taken into account in the measurement of the lease liabilities and right-of-use assets.
The recognised right-of-use assets relate to the following types of assets:
At 31 December
2019 $m
At 1 January
2019 $m
Land and buildings 36.2 39.2Plant, machinery and motor vehicles 0.5 0.5
36.7 39.7

165 Hunting PLC / 2019 Annual Report and AccountsP
urpose and C
ultureB
usiness Mod
el and Stakehold
ersG
overnanceP
erformance
Business S
trategy F
ina
nc
ial sta
tem
en
ts
41. Change in Accounting Policies continued
(b) Adjustments Recognised on Adoption of IFRS 16 continuedThe change in accounting policy affected the following items in the balance sheet on 1 January 2019:
As previously reported at
31 December 2018
$mIFRS 16
$m
At 1 January
2019 $m
ASSETSNon-current assetsRight-of-use assets – 39.7 39.7Deferred tax assets 26.0 1.7 27.7Other non-current assets 695.8 – 695.8
721.8 41.4 763.2
Current assetsTrade and other receivables 231.0 (0.4) 230.6Other current assets 416.2 – 416.2
647.2 (0.4) 646.8
LIABILITIESCurrent liabilitiesTrade and other payables 140.9 (2.5) 138.4Lease liabilities – 9.3 9.3Borrowings 2.7 – 2.7Provisions 4.7 (1.1) 3.6Current tax liabilities 11.2 – 11.2
159.5 5.7 165.2Net current assets 487.7 (6.1) 481.6
Non-current liabilitiesLease liabilities – 39.7 39.7Provisions 9.5 (3.1) 6.4Other non-current liabilities 8.9 – 8.9
18.4 36.6 55.0Net assets 1,191.1 (1.3) 1,189.8
Equity attributable to owners of the parentRetained earnings 881.6 (1.1) 880.5Other equity reserves 295.5 – 295.5
1,177.1 (1.1) 1,176.0Non-controlling interests 14.0 (0.2) 13.8Total equity 1,191.1 (1.3) 1,189.8
The opening balance adjustments on the adoption of IFRS 16 Leases have been updated since the issue of the Half Year Report 2019.

166 Hunting PLC / 2019 Annual Report and Accounts
Notes to the Consolidated Financial Statements continued
41. Change in Accounting Policies continued
(c) Impact on the 31 December 2019 Income Statement of the Adoption of IFRS 16Underlying profit from operations has increased by $1.4m from $92.9m to $94.3m and underlying profit before tax has decreased by $0.8m from $93.9m to $93.1m following the adoption of IFRS 16. Reported profit from operations has increased by $1.4m from $45.4m to $46.8m for the period and reported profit before tax has decreased by $0.8m from $46.4m to $45.6m following the adoption of IFRS 16.
2019 $m
Underlying and reported profit before taxation is stated after charging: Depreciation on right-of-use assets 7.9 Interest on lease liabilities 2.2
The underlying result and the reported result for the year ended 31 December 2019 for the operating segments increased by $1.4m. The impact on the operating segments of adopting of IFRS 16 is shown below:
Underlying result Reported result
Pre IFRS 16 $m
IFRS 16 $m
Revised total
$mPre IFRS 16
$mIFRS 16
$m
Revised total
$m
Hunting Titan 68.3 0.3 68.6 41.8 0.3 42.1 US 26.3 0.6 26.9 5.3 0.6 5.9 Canada (4.6) 0.3 (4.3) (4.6) 0.3 (4.3)EMEA (1.3) – (1.3) (1.3) – (1.3)Asia Pacific 4.2 0.2 4.4 4.2 0.2 4.4
92.9 1.4 94.3 45.4 1.4 46.8
Underlying basic earnings per share decreased by 0.6 cents per share to 45.0 cents per share and underlying diluted earnings per share decreased by 0.6 cents per share to 43.9 cents per share for the year ended 31 December 2019 as a result of the adoption of IFRS 16. Reported basic earnings per share decreased by 0.6 cents per share to 24.0 cents per share and reported diluted earnings per share decreased by 0.6 cents per share to 23.5 cents per share for the year ended 31 December 2019 as a result of the adoption of IFRS 16.
Under IAS 17, all operating lease payments were included in cash flows from operating activities. Under IFRS 16, for capitalised leases, the lease payments are presented within financing activities and therefore cash inflows from operating activities have increased by $10.6m to $137.2m and cash outflows from financing activities have increased by $10.6m to $33.4m. For non-capitalised short-term leases and low-value asset leases cash outflows will be included in operating activities as was the case under IAS 17.
(d) Accounting Treatment of Leases and Right-of-use Assets(i) LeasesThe Group assesses whether a contract is, or contains, a lease at the inception of the contract.
Until the 2018 financial year, leases of property, plant and equipment were classified as either finance or operating leases, however the Group did not have any leases classified as finance leases. Payments made under operating leases (net of any incentives received from the lessor) were charged to profit or loss on a straight-line basis over the period of the lease.
From 1 January 2019, leases are recognised as a right-of-use asset and a corresponding liability at the date at which the leased asset is available for use by the Group. The finance cost is charged to profit or loss over the lease period so as to produce a constant periodic rate of interest on the remaining balance of the liability for each period.
Assets and liabilities arising from a lease are initially measured on a present value basis. Lease liabilities include the net present value of the following lease payments:
• fixed payments (including in-substance fixed payments), less any lease incentives receivable; • variable lease payments are included once known; • amounts expected to be payable by the lessee under residual value guarantees; • the exercise price of a purchase option if the lessee is reasonably certain to exercise that option; and • payments of penalties for terminating the lease, if the lease term reflects the lessee exercising that option.
In applying IFRS 16, the Group has elected to apply both of the available exemptions that permit lessees, under pre-defined conditions, not to recognise a lease liability and right-of-use asset in respect of certain leases. Payments associated with short-term leases and leases of low-value assets are recognised on a straight-line basis as an expense in profit or loss. Short-term leases are leases with a lease term of 12 months or less. Low-value assets have a low value purchase price when new, typically $5,000 or less, and comprise items such as office equipment and small items of office furniture.

167 Hunting PLC / 2019 Annual Report and AccountsP
urpose and C
ultureB
usiness Mod
el and Stakehold
ersG
overnanceP
erformance
Business S
trategy F
ina
nc
ial sta
tem
en
ts
41. Change in Accounting Policies continued
(d) Accounting Treatment of Leases and Right-of-use Assets continued(ii) Right-of-use AssetsRight-of-use assets are initially measured at cost comprising the following:
• the amount of the initial measurement of lease liability; • any lease payments made at or before the commencement date less any lease incentives received; • any initial direct costs; and • restoration costs, where the initial amount is equal to the restoration liability.
The right-of-use asset is normally depreciated over the lease term on a straight-line basis, except where an option to purchase the asset is available, and it is reasonably certain that the option will be exercised, and then the asset will be depreciated over its useful life.
Right-of-use assets are presented as non-current assets in the balance sheet.
42. Events After the Balance Sheet DateEnproOn 21 February 2020, the Group announced the acquisition of 100% of the share capital of Enpro Subsea Limited (“Enpro”) for a consideration of $33.0m, with an additional maximum earn-out of $3.0m agreed, subject to key financial milestones being met.
Enpro was founded in 2011 and, since this time, has developed leading subsea production technology that has been adopted by offshore operators within the global oil and gas industry. Enpro’s products focus on delivering production-enhancing technologies and include Flow Access Modules, Flow Intervention Services and Decommissioning. These products offer low-cost, flexible, field development solutions to clients including production and intervention modules to enhance recovery from oil and gas wells. The business will be classified as part of the US segment. The provisional fair values of the acquired net assets are yet to be determined, as work is continuing in respect of the fair value exercise.

168 Hunting PLC / 2019 Annual Report and Accounts
Company Balance Sheet at 31 December 2019
Notes2019
$m2018
$m
ASSETSNon-current assetsInvestments in subsidiaries C4 436.8 436.8Other receivables C5 284.3 286.0 721.1 722.8
Current assetsOther receivables C5 1.1 1.1
LIABILITIESCurrent liabilitiesOther payables C6 6.1 1.3Provisions 0.4 0.6Current tax liability 0.2 0.4 6.7 2.3Net current liabilities 5.6 1.2
Non-current liabilitiesBorrowings – 0.6Provisions 0.6 0.8 0.6 1.4Net assets 714.9 720.2
Equity attributable to owners of the parentShare capital C12 67.3 66.7Share premium C12 153.0 153.0Other components of equity C13 47.1 70.5Retained earnings C14 447.5 430.0Total equity 714.9 720.2
The Company has elected to take the exemption under Section 408 of the Companies Act 2006 from presenting its own income statement and statement of comprehensive income. Profit and total comprehensive income for the year of $7.2m (2018 – $7.3m) has been accounted for in the financial statements of the Company.
The notes on pages 171 to 178 are an integral part of these financial statements. The financial statements on pages 168 to 178 were approved by the Board of Directors on 27 February 2020 and were signed on its behalf by:
Jim Johnson Peter Rose Director Director Registered number: 0974568
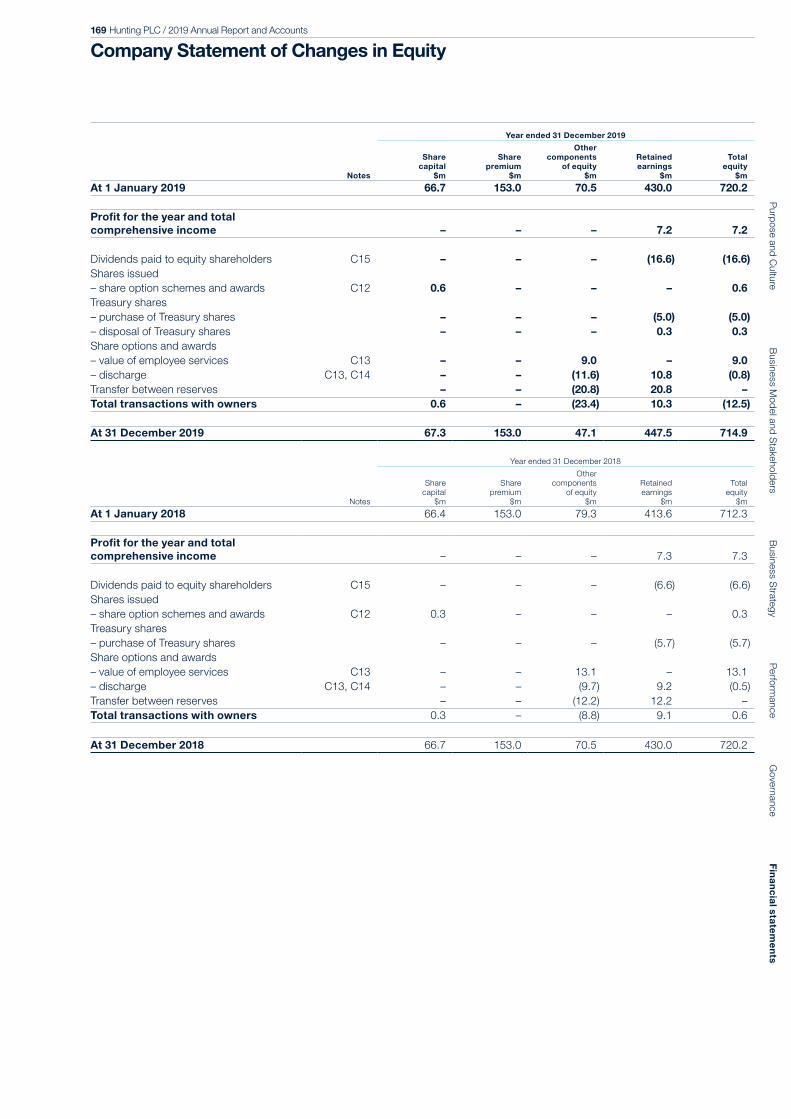
169 Hunting PLC / 2019 Annual Report and AccountsP
urpose and C
ultureB
usiness Mod
el and Stakehold
ersG
overnanceP
erformance
Business S
trategy F
ina
nc
ial sta
tem
en
ts
Company Statement of Changes in Equity
Notes
Year ended 31 December 2019
Share capital
$m
Share premium
$m
Other components
of equity$m
Retained earnings
$m
Total equity
$m
At 1 January 2019 66.7 153.0 70.5 430.0 720.2
Profit for the year and total comprehensive income – – – 7.2 7.2
Dividends paid to equity shareholders C15 – – – (16.6) (16.6)Shares issued– share option schemes and awards C12 0.6 – – – 0.6Treasury shares– purchase of Treasury shares – – – (5.0) (5.0)– disposal of Treasury shares – – – 0.3 0.3Share options and awards– value of employee services C13 – – 9.0 – 9.0– discharge C13, C14 – – (11.6) 10.8 (0.8)Transfer between reserves – – (20.8) 20.8 –Total transactions with owners 0.6 – (23.4) 10.3 (12.5)
At 31 December 2019 67.3 153.0 47.1 447.5 714.9
Notes
Year ended 31 December 2018
Share capital
$m
Share premium
$m
Other components
of equity$m
Retained earnings
$m
Total equity
$m
At 1 January 2018 66.4 153.0 79.3 413.6 712.3
Profit for the year and total comprehensive income – – – 7.3 7.3
Dividends paid to equity shareholders C15 – – – (6.6) (6.6)Shares issued– share option schemes and awards C12 0.3 – – – 0.3Treasury shares– purchase of Treasury shares – – – (5.7) (5.7)Share options and awards– value of employee services C13 – – 13.1 – 13.1– discharge C13, C14 – – (9.7) 9.2 (0.5)Transfer between reserves – – (12.2) 12.2 –Total transactions with owners 0.3 – (8.8) 9.1 0.6
At 31 December 2018 66.7 153.0 70.5 430.0 720.2

170 Hunting PLC / 2019 Annual Report and Accounts
Company Statement of Cash FlowsFor the year ended 31 December 2019
Notes2019
$m
2018Restated
$m
Operating activities(Loss) profit from operations (0.3) 0.6Share-based payments expense 9.1 13.2Decrease in receivables – 0.2Increase (decrease) in payables 3.7 (1.6)(Decrease) increase in provisions (0.4) 0.1Net exchange differences 0.2 0.7Taxation (paid) received (2.0) 0.6Net cash inflow from operating activities 10.3 13.8Investing activitiesInterest received 9.5 8.7Loan issued C1 (19.2) (22.9)Loan issued repaid C1 20.7 12.2Net cash inflow from investing activities 11.0 (2.0)Financing activitiesInterest and bank fees paid – (0.1)Dividends paid to equity shareholders C15 (16.6) (6.6)Share capital issued 0.6 0.3Purchase of treasury shares (5.0) (5.7)Disposal of treasury shares 0.3 –Loan received repaid (0.6) –Loan received – 0.3Net cash outflow from financing activities (21.3) (11.8)
Net cash inflow (outflow) in cash and cash equivalents – –Cash and cash equivalents at the beginning of the year – –Cash and cash equivalents at the end of the year – –

171 Hunting PLC / 2019 Annual Report and AccountsP
urpose and C
ultureB
usiness Mod
el and Stakehold
ersG
overnanceP
erformance
Business S
trategy F
ina
nc
ial sta
tem
en
ts
Notes to the Company Financial Statements
C1. Basis of Preparation
Hunting PLC is a premium-listed public company limited by shares, with its Ordinary shares listed on the London Stock Exchange. Hunting PLC was incorporated in the United Kingdom under the Companies Act and is registered in England and Wales. The address of the Company’s registered office is shown on page 185. The Company acts as a holding company for the Hunting PLC Group. Details of the Company’s subsidiaries are given in note C19. The financial statements of Hunting PLC have been prepared in accordance with the Companies Act 2006 as applicable to companies using IFRS and those International Financial Reporting Standards (“IFRS”) and IFRS Interpretations Committee (“IFRS IC”) Interpretations as adopted by the European Union. The financial statements have been prepared on a going concern basis under the historical cost convention. The Board’s consideration of going concern is detailed further in the Strategic Report on pages 68 and 69.
The Company’s principal accounting policies applied in the preparation of these financial statements are the same as those set out innote 40 of the Group’s financial statements, except for investments in subsidiaries that are stated at cost, which is the fair value of the consideration paid, less provision for impairment. These policies have been consistently applied to all the years presented. Cash flows related to the depositing of funds and repayment of deposited funds with the Group’s Treasury company have been reclassified as investing activities. Comparatives have been restated accordingly.
From the perspective of the Company, the principal risks and uncertainties are integrated with the principal risks of the Hunting PLC Group and are not managed separately. The principal risks and uncertainties of the Hunting PLC Group, which include those of the Company, are discussed in note 40 of the Group’s financial statements and further detail on financial risks is provided within note C9.
IFRS 16 LeasesIFRS 16 Leases replaces IAS 17 Leases and its related interpretations. IFRS 16 establishes principles for the recognition, measurement, presentation and disclosure of leases for both lessees and lessors. The standard was effective for the Company from 1 January 2019, however, there was no impact on the Company’s financial position or results following the adoption of IFRS 16 on 1 January 2019.
C2. Employees
The Company had no employees during the current or prior year.
C3. Auditor’s Remuneration
2019i
$m2018ii
$m
Fees payable to the Company’s independent auditor and its associates are for:
The audit of these financial statements 0.5 0.5
i. Fees payable in 2019 are to the Company’s independent auditor, Deloitte LLP, and its associates.ii. Fees payable in 2018 are to the Company’s previous independent auditor, PricewaterhouseCoopers LLP, and its associates.
C4. Investments in Subsidiaries
2019$m
2018$m
Cost:At 1 January and 31 December 436.8 436.8
Impairment:At 1 January and 31 December – –
Net book amount 436.8 436.8
The Company’s subsidiaries are detailed in note C19. Investments in subsidiaries are recorded at cost, which is the fair value of the consideration paid, less impairment. The Directors believe that the carrying value of the investments is supported by their underlying net assets.

172 Hunting PLC / 2019 Annual Report and Accounts
Notes to the Company Financial Statements continued
C5. Other Receivables
2019$m
2018$m
Non-current:Loan receivable from a subsidiary – interest-bearing 284.2 285.9Prepayments 0.1 0.1 284.3 286.0
Current:Receivables from subsidiaries 0.8 0.8Prepayments 0.2 0.2Other receivables 0.1 0.1 1.1 1.1
The loan receivable from a subsidiary and current receivables from subsidiaries are financial assets measured at amortised cost. Other receivables relate to VAT balances, which are not financial assets.
None of the Company’s receivables (2018 – none) were overdue at the year-end and the Company does not consider it necessary to provide for any impairments as there is no recent history of default or any indications that the contractual payments will not be made. The Company’s maximum exposure to credit risk is the fair value of each class of receivable, as described in note C8. The Company does not hold any collateral as security and no assets have been acquired through the exercise of any collateral previously held. The interest-bearing loan receivable from a subsidiary is unsecured and interest is charged based on a margin over bank lending rates. Current receivables due from subsidiaries are current accounts and are unsecured, interest free and repayable on demand.
C6. Other Payables
2019$m
2018$m
Current:Payables to subsidiaries 5.3 0.2Accruals 0.5 0.6Other payables 0.3 0.5 6.1 1.3
Payables to subsidiaries, accruals and other payables are financial liabilities carried at amortised cost. Current payables due to subsidiaries are unsecured, interest free and repayable on demand.
C7. Derivatives and Hedging
The Company has used forward foreign exchange contracts to hedge its exposure to exchange rate movements during the year. At 31 December 2019, the Company had no outstanding forward foreign exchange contracts (2018 – $nil).
Gains and losses on contracts that are not designated in a hedge relationship are taken directly to the income statement. Changes in the fair value of currency derivatives not designated in a hedge relationship amounting to a $0.7m gain (2018 – $0.4m loss) were recognised in the income statement during the year.
C8. Financial Instruments: Fair Values
Due to their short-term nature, the carrying value of current receivables from subsidiaries, other receivables, payables to subsidiaries, accruals, other payables, provisions, borrowings and bank overdrafts approximates their fair value. The carrying value of the loan receivable from subsidiaries approximates its fair value as interest is charged based on a margin over current bank lending rates.
173 Hunting PLC / 2019 Annual Report and AccountsP
urpose and C
ultureB
usiness Mod
el and Stakehold
ersG
overnanceP
erformance
Business S
trategy F
ina
nc
ial sta
tem
en
ts
C9. Financial Risk Management
The Company’s activities expose it to certain financial risks, namely market risk (including currency risk, cash flow interest rate risk and fair value interest rate risk), credit risk and liquidity risk. From the perspective of the Company, these financial risks are integrated with the financial risks of the Hunting PLC Group and are not managed separately.
(a) Foreign Exchange RiskThe Company is mainly exposed to foreign exchange risk from its financing and operating activities in respect of Sterling. Foreign exchange risks arise from future transactions and cash flows and from recognised monetary assets and liabilities that are not denominated in US dollars and, where appropriate, forward foreign exchange contracts are used to manage the exposure to changes in foreign exchange rates. The Company has Sterling denominated financial assets and financial liabilities.
The carrying amount of the Company’s financial assets included in current receivables from subsidiaries at 31 December on which exchange differences would be recognised in the income statement in the following year, is $0.2m (2018 – $0.7m) for Sterling denominated financial assets.
The carrying amount of the Company’s financial liabilities included in accruals, other payables and provisions at 31 December, on which exchange differences would be recognised in the income statement in the following year, is $0.8m (2018 – $3.2m) for Sterling denominated financial liabilities.
(b) Interest Rate RiskThe Company is exposed to cash flow interest rate risk from its loan receivable from a subsidiary and borrowings payable to a subsidiary, which are at variable interest rates.
(c) Credit RiskThe Company’s credit risk arises from its outstanding current receivables and loan receivable from a subsidiary. The Company is exposed to credit risk to the extent of non-receipt of its financial assets, however, it has no significant concentrations of credit risk other than from related parties. Credit risk is continually monitored and no individual exposure is considered to be significant in the ordinary course of the Company’s activities.
The interest-bearing loan receivable due from a subsidiary has not been impaired as no losses are expected from non-performance of this counterparty. The credit risk at the time the loan was taken out was deemed to be low and there has not been an increase in the credit risk since the time the loan was initially recognised. Therefore, management does not believe that there is a significant increase in credit risk such that the loan moves from stage 1 to stage 2 of the IFRS 9 general impairment model. There is no history of default and previously all payments under the original terms of the loan have been made. The loan is with the Group’s central treasury company, which has sufficient cash, short-term deposits and credit facilities, in the form of the RCF, to repay the loan. Management does not have any reason to believe that any future payments will not be made in accordance with the terms of the loan. Therefore no provision for 12-month expected credit losses has been made under IFRS 9.
The Company’s outstanding receivables due from subsidiaries are current accounts and no losses are expected from non-performance of these counterparties.

174 Hunting PLC / 2019 Annual Report and Accounts
Notes to the Company Financial Statements continued
C9. Financial Risk Management continued
(d) Liquidity RiskThe Company has sufficient facilities available to satisfy its requirements.
The Group’s treasury function has put in place a cash concentration structure across the Hunting Group’s bank accounts in the UK, such that at the end of each day balances in any of their bank accounts are swept to the Group’s central treasury function, with a corresponding increase or decrease in the loan receivable balance with fellow group companies. As a result, at the end of the year, cash at bank is $nil.
The Company is party to a cross-guarantee and set-off arrangement with Barclays Bank Plc. There is no set-off in the presentation of cash balances held by the Company in the financial statements. Under this arrangement the Company is jointly and severally liable for any gross liability position held by any of the companies’ party to the aforementioned arrangements in the event of default. Any gross liability limit cannot exceed a combined facility limit of $2.2m.
The table below analyses the Company’s non-derivative financial liabilities into relevant maturity groupings based on the remaining period at the balance sheet date to the contractual maturity date of the financial liabilities. The amounts presented in the table are the contractual undiscounted cash flows, whereas the carrying amounts in the balance sheet are the discounted amounts.
2019On demand
or within one year
$m
2018On demand
or within one year
$m
Non-derivative financial liabilities:Payables to subsidiaries 5.3 0.2Borrowings – payable due to subsidiary – 0.6Accruals 0.5 0.6Other payables 0.3 0.5 6.1 1.9
The Company did not have any derivative financial liabilities at the end of 2018 or 2019.
(e) Capital Risk ManagementThe Company’s capital consists of equity and net cash. Net cash comprises the loan receivable from a subsidiary and borrowings. It is managed with the aim of maintaining an appropriate level of financing available for the Company’s activities, having due regard to interest rate risks and the availability of borrowing facilities. Changes in equity arise from the retention of earnings and from issues of share capital. Net cash is monitored on a periodic basis. At the year-end, capital comprised:
2019$m
2018$m
Total equity 714.9 720.2Net cash:Borrowings – payable due to subsidiary – 0.6Loan receivable from subsidiary (note C5) (284.2) (285.9)Capital employed 430.7 434.9
The decrease in total equity during the year is mainly attributable to the retained profit for the year of $7.2m and the increase in the share-based payments reserve of $9.0m being offset by the payment of dividends of $16.6m and the net purchase of treasury shares of $4.7m. The loan receivable from a subsidiary decreased by $1.7m largely due to royalty income received during the year being offset by dividend payments. There have been no significant changes in the Company’s funding policy during the year.

175 Hunting PLC / 2019 Annual Report and AccountsP
urpose and C
ultureB
usiness Mod
el and Stakehold
ersG
overnanceP
erformance
Business S
trategy F
ina
nc
ial sta
tem
en
ts
C10. Financial Instruments: Sensitivity Analysis
The following sensitivity analysis is intended to illustrate the sensitivity to changes in market variables on the Company’s financial instruments and show the impact on profit or loss and shareholders’ equity. Financial instruments affected by market risk include non-current receivables from subsidiaries and borrowings. The sensitivity analysis relates to the position as at 31 December 2019.
The analysis excludes the impact of movements in market variables on the carrying value of provisions and on non-financial assets and liabilities.
The following assumptions have been made in calculating the sensitivity analysis:
• Foreign exchange rate and interest rate sensitivities have an asymmetric impact on the Company’s results, that is, an increase in rates does not result in the same amount of movement as a decrease in rates;
• For floating rate assets and liabilities, the amount of asset or liability outstanding at the balance sheet date is assumed to be outstanding for the whole year; and
• The carrying values of financial assets and liabilities carried at amortised cost do not change as interest rates change.
(a) Interest Rate SensitivityThe post-tax impact on the income statement, with all other variables held constant, at 31 December 2019, for an increase of 0.25% (2018 – 0.5%) in US interest rates, is to increase profits by $0.6m (2018 – $1.2m). If the US interest rates were to decrease by 0.25% (2018 – 0.5%), then the post-tax impact would be to reduce profits by $0.6m (2018 – $1.2m). The movements arise on US dollar denominated intra-Group loans. There is no impact on OCI for a change in interest rates.
(b) Foreign Exchange Rate SensitivityThe post-tax impact on the income statement, with all other variables held constant, at 31 December 2019, for an increase or decrease of 5% (2018 – 10%) in the Sterling foreign exchange rate, is not material. The movement in the income statement arises from Sterling denominated accruals, other payables and borrowings, offset by Sterling loans receivable from subsidiaries. There is no impact on OCI for a change in foreign exchange rates.
C11. Post-Employment Benefits
The Company has no employees and therefore does not participate in any of the post-employment benefit schemes shown in note 32 of the Group’s financial statements, although it does guarantee the contributions due by the participating employers.
C12. Share Capital and Share Premium
Please see note 33 of the Group’s financial statements.

176 Hunting PLC / 2019 Annual Report and Accounts
Notes to the Company Financial Statements continued
C13. Other Components of Equity
Year ended 31 December 2019
Capital redemption
reserve$m
Share-based payments
reserve$m
Currency translation
reserve$m
Merger reserve
$mTotal
$m
At 1 January 0.2 22.3 (19.2) 67.2 70.5Share options and awards– value of employee services – 9.0 – – 9.0– discharge – (11.6) – – (11.6)Transfer between reserves – – – (20.8) (20.8)At 31 December 0.2 19.7 (19.2) 46.4 47.1
The merger reserve comprises the proceeds received, net of transaction costs, in excess of the nominal value of the Ordinary shares issued by way of the share placing completed on 31 October 2016. In accordance with section 612 of the Companies Act 2006, the premium was credited to the merger reserve, instead of to the share premium account, because the share placing was pursuant to the Company securing over 90% of another entity. The proceeds were used to pay down the Group’s borrowings at that time. The reserve is currently non-distributable and will be transferred to distributable retained earnings when the proceeds meet the definition of a qualifying consideration.
During the year, $20.8m (2018 – $12.2m) was transferred from the merger reserve to retained earnings. This portion of the reserve is now considered to be realised as the equivalent amount of the proceeds from the share placing in 2016 have now met the definition of qualifying consideration.
Year ended 31 December 2018
Capital redemption
reserve$m
Share-based payments
reserve$m
Currency translation
reserve$m
Merger reserve
$mTotal
$m
At 1 January 0.2 18.9 (19.2) 79.4 79.3Share options and awards– value of employee services – 13.1 – – 13.1– discharge – (9.7) – – (9.7)Transfer between reserves – – – (12.2) (12.2)At 31 December 0.2 22.3 (19.2) 67.2 70.5
C14. Retained Earnings
2019$m
2018$m
At 1 January 430.0 413.6Profit for the year 7.2 7.3Dividends paid to equity shareholders (note C15) (16.6) (6.6)Purchase of treasury shares (5.0) (5.7)Disposal of treasury shares 0.3 –Share options and awards– discharge 10.8 9.2Transfer between reserves 20.8 12.2At 31 December 447.5 430.0
Retained earnings include the following amounts in respect of the carrying amount of Treasury shares.
2019$m
2018$m
Cost:At 1 January (11.2) (7.2)Purchase of treasury shares (5.0) (5.7)Disposal of treasury shares 3.4 1.7At 31 December (12.8) (11.2)
The loss on disposal of Treasury shares during the year, which is recognised in retained earnings, was $3.1m (2018 – $1.7m).

177 Hunting PLC / 2019 Annual Report and AccountsP
urpose and C
ultureB
usiness Mod
el and Stakehold
ersG
overnanceP
erformance
Business S
trategy F
ina
nc
ial sta
tem
en
ts
C15. Dividends Paid to Equity Shareholders
Please see note 36 of the Group’s financial statements.
C16. Share-Based Payments
Please see note 37 of the Group’s financial statements.
C17. Related Party Transactions
The following related party transactions took place between the Company and subsidiaries of the Group during the year:
2019$m
2018$m
Transactions: Royalties receivable 11.0 14.7 Management fees payable (9.8) (11.7) Recharges of share options and awards and administrative expenses 15.0 13.3 Loan to subsidiary (19.8) (22.9) Loan from subsidiary – 0.3 Loans to subsidiary repaid 20.7 12.2 Interest receivable on inter-company loans 9.5 8.7 Dividends received from subsidiaries – –Year-end balances: Payables to subsidiaries (5.3) (0.2) Receivables from subsidiaries 0.8 0.8 Loans owed to subsidiaries – (0.6) Loans owed by subsidiaries 284.2 285.9
All balances between the Company and its subsidiaries are unsecured.
The Company previously served as the Group’s intermediary for the provision of UK Group tax relief, VAT and certain Group insurances. At the year-end, the outstanding receivable for UK Group tax relief was $nil (2018 – $1.2m).
The key management of the Company comprises the Hunting PLC Board and members of the Executive Committee. A summary of their remuneration is disclosed in note 8 of the Group’s financial statements. The Hunting PLC Board and members of the Executive Committee had no material transactions other than as a result of their service agreements.
The Company is listed on the London Stock Exchange, with none of the shareholders owning more than 20% of the issued share capital of the Company (see page 13). Accordingly, there is no parent entity and the Directors do not consider there to be an ultimate controlling party.
C18. Associates
Associatesi Registered address
Tianjin Huaxin Premium Connection Pipe Co Ltd (28.5%) Jintang Road, Dongli District, Tianjin, 300301, ChinaHunting Airtrust Tubulars Pte. Ltd (50%) 19, Keppel Road, 08-05 JIT Poh Building, 089058, Singapore
Notes:i All interests in associates are in the equity shares of those companies.

178 Hunting PLC / 2019 Annual Report and Accounts
Notes to the Company Financial Statements continued
C19. Subsidiaries
All Companies listed below are wholly owned by the Group, except where otherwise indicated.
Subsidiariesi/iii Registered address
Operating activitiesHunting Energy Services (Australia) Pty Ltd Level 40, Governor Macquarie Tower, 1 Farrer Place, Sydney, NSW 2000, Australia Hunting Energy Services (Canada) Ltd 5550 Skyline Way NE, Calgary, Alberta, T2E 7Z7, CanadaHunting Energy Services (Wuxi) Co. Ltd (70%) No. 17, Xin DongAn Road, Shuo Fang Industrial, New District Wuxi City, Jiangsu
Province, ChinaHunting Energy Completion Equipment (Wuxi) Co., Ltd No. 17, Xin DongAn Road, Shuo Fang Industrial, New District Wuxi City, Jiangsu
Province, ChinaHunting Energy Services (International) Limited 5 Hanover Square, London, W1S 1HQ, England Hunting Energy Services Overseas Holdings Limited 5 Hanover Square, London, W1S 1HQ, EnglandHunting Energy Services (UK) Limited (60%) 5 Hanover Square, London, W1S 1HQ, EnglandPT Hunting Energy Asia Complex Dragon Industrial Park, Block D, Jalan Pattimura, Kabil Batam, 29467,
IndonesiaHunting Alpha (EPZ) Limited (60%)v Block XLVIII/150, Off Mbaraki Road, P.O. Box 83344-80100 Mombasa, KenyaHunting Energy Services Kenya Ltd 5th Floor, West Wing, ICEA Lion Centre, Riverside Park, Chiromo Road, Nairobi,
KenyaHunting Energy de Mexico Avenida Los Olmos #105, Parque Industrial El Sabinal, Apodaca, Nuevo Leon,
Monterrey, MexicoHunting Energy Services B.V. (60%) Olieweg 10, 1951 NH Velsen-Noord, NetherlandsHunting Energy Services (Well Testing) B.V. Olieweg 10, 1951 NH Velsen-Noord, Netherlands Hunting Energy Services (Norway) AS Arabergveieb 6, 4050 Sola, NorwayHunting Energy Saudi Arabia LLC (60%) Dhahran, Building No: 7612, P.O. Box: 3104, Zip Code: 34521, Saudi ArabiaHunting Energy Services (Well Intervention) Limited Badentoy Avenue, Badentoy Park, Portlethen, Aberdeen, AB12 4YB, ScotlandHunting Welltonic Limitedv Badentoy Avenue, Badentoy Park, Portlethen, Aberdeen, AB12 4YB, ScotlandHunting Energy Services (International) Pte. Ltd. 2 International Business Park, #04-13/14, The Strategy 609930, SingaporeHunting Energy Services Pte. Ltd. 2 International Business Park, #04-13/14, The Strategy 609930, SingaporeHunting Energy Services (China) Pte. Ltd. (70%) 2 International Business Park, #04-13/14, The Strategy 609930, SingaporeHunting Energy Services (Well Intervention) Pte. Ltd 15 Scotts Road, #04-01/03, Thong Teck Building, 228218, SingaporeHunting Energy Services South Africa (Pty) Ltd Trident Park 1, 1 Niblick Way, Somerset West, 7130, South AfricaHunting Energy Services (Thailand) Limited (49%) 436/27, Moo 2, Thanadee-Klongwong Road, Tambol Phawong, Amphur Muong
Songkhla, 90100, ThailandNational Coupling Company, Inc. 1316 Staffordshire Road, Staffordshire, Texas, 77477, USAHunting Energy Services, LLC 16825 Northchase Drive, Suite 600, Houston, Texas, 77060 USAPremium Finishes, Inc. 16825 Northchase Drive, Suite 600, Houston, Texas, 77060 USAHunting Dearborn, Inc. 6 Dearborn Drive, Fryeburg, Maine, USAHunting Energy Services (Drilling Tools), Inc. 16825 Northchase Drive, Suite 600, Houston, Texas, 77060 USA Hunting Innova, Inc. 8383 North Sam Houston Parkway West, Houston, Texas, 77064, USAHunting Specialty, Inc. 16825 Northchase Drive, Suite 600, Houston, Texas, 77060 USA Hunting Titan, Inc. 16825 Northchase Drive, Suite 600, Houston, Texas, 77060 USA Hunting Titan ULC 5550 Skyline Way NE, Calgary, Alberta, T2E 7Z7, CanadaTenkay Resources, Inc. 16825 Northchase Drive, Suite 600, Houston, Texas, 77060 USA
Corporate activitiesHunting Energy Holdings Limitedii 5 Hanover Square, London, W1S 1HQ, EnglandHunting Oil Holdings Limitedii 5 Hanover Square, London, W1S 1HQ, EnglandHunting Knightsbridge Holdings Limited 5 Hanover Square, London, W1S 1HQ, EnglandHunting Knightsbridge (US) Finance Limitediv 5 Hanover Square, London, W1S 1HQ, EnglandHuntaven Properties Limited 5 Hanover Square, London, W1S 1HQ, EnglandHunting Pension Trust Limitedii/iv 5 Hanover Square, London, W1S 1HQ, England HG Management Services Ltd 5 Hanover Square, London, W1S 1HQ, EnglandHuntfield Trust Limitediv 5 Hanover Square, London, W1S 1HQ, EnglandStag Line Limitediv 5 Hanover Square, London, W1S 1HQ, EnglandHunting Aviation Limitediv 5 Hanover Square, London, W1S 1HQ, EnglandField Insurance Limitedv The Albany, South Esplanade, St Peter Port, GY1 4NF, GuernseyHunting U.S. Holdings, Inc. 16825 Northchase Drive, Suite 600, Houston, Texas, 77060 USA
Notes:i. Except where otherwise stated, companies are wholly owned, being incorporated and operating in the countries indicated.ii. Interest in company is held directly by Hunting PLC.iii. All interests in subsidiaries are in the equity shares of those companies. The proportion of voting rights is represented by the interest in the equity shares of
those companies.iv. Hunting Pension Trust Limited (registered number 01346797), Huntfield Trust Limited (registered number 00372215), Stag Line Limited (registered number
00151320), Hunting Aviation Limited (registered number 00297743) and Hunting Knightsbridge (US) Finance Limited (registered number 08319706) are dormant companies that are exempt from being audited, are exempt from the requirements to prepare individual accounts under section 394A of the Companies Act 2006 and are exempt from filing individual accounts under section 448A of the Companies Act 2006.
v. Company has been placed into voluntary liquidation.

Purp
ose and business mod
elB
usiness strategyG
overnanceP
erformance
Fin
an
cia
l state
me
nts
179 Hunting PLC / 2019 Annual Report and Accounts
Non-GAAP Measures (unaudited)
The Directors believe it is appropriate to include in the Strategic Report and financial statements a number of non-GAAP measures (“NGMs”) that are commonly used within the business. These measures supplement the information provided in the IFRS “reported” financial statements and accompanying notes, providing additional insight to the users of the Annual Report.
This section provides a definition of the non-GAAP measures, the purpose for which the measure is used, and a reconciliation of the non-GAAP measure to the reported IFRS numbers. The auditors are required under the Companies Act 2006 to consider whether these non-GAAP measures are prepared consistently with the financial statements.
Income Statement Non-GAAP Measures
The Directors have applied the provisions of IAS 1 with regards to exceptional items and have chosen to present these, together with amortisation of intangible assets recognised as part of a business combination, in a separate column on the face of the income statement. All profit and loss measures adjusted for amortisation of intangible assets recognised as part of a business combination and exceptional items are referred to as “underlying”. This is the basis used by the Directors in assessing performance and in determining certain components of senior management and executive remuneration..
A. EBITDAPurpose: This profit measure is used as a simple proxy for pre-tax cash flows from operating activities.
Calculation definition: Underlying results before share of associates’ post-tax results, interest, tax, depreciation, impairment and amortisation.
2019ii
$m2018i
$m
Reported profit from operations (consolidated income statement) 46.8 75.4Add: Depreciation charge for the year on property, plant and equipment (note 12) 33.7 35.0 Depreciation charge for right-of-use assets (note 13) 7.9 – Amortisation of other intangible assets (note 15) 32.3 31.9 Impairment of property, plant and equipment (note 12) 19.0 1.0Less: Reversal of impairment of property, plant and equipment and other assets (note 12) – (2.0)Reported EBITDA 139.7 141.3Add: Exceptional items impacting EBITDA Restructuring costs (note 6) – 0.5 Loss on disposal of Kenya rental fleet (note 6) – 0.5Underlying EBITDA 139.7 142.3
i. From 1 January 2019, the Group has adopted IFRS 16 Leases (“IFRS 16”) by applying the modified retrospective approach; consequently the comparatives for the 2018 reporting period have not been restated, as permitted under the specific transitional provisions in IFRS 16.
ii. EBITDA for 2019 has benefited by $9.3m, which represents operating lease charges that would have been recognised in the income statement under IAS 17 Leases and have now been replaced by a depreciation charge of $7.9m for right-of-use assets under IFRS 16.
B. Underlying Tax RatePurpose: The effective tax rate represents the level of tax, both current and deferred, being borne by operations on an underlying basis.
Calculation definition: Taxation on underlying profit before tax divided by underlying profit before tax, expressed as a percentage.
2019$m
2018$m
Underlying taxation charge (note 10) (17.0) (22.0)Underlying profit before tax for the year (consolidated income statement) 93.1 104.0
Underlying tax rate 18% 21%

Hunting PLC / 2019 Annual Report and Accounts180
Non-GAAP Measures (unaudited) continued
Balance Sheet Non-GAAP Measures
C. Working CapitalPurpose: Working Capital is a measure of the Group’s liquidity identifying whether the Group has sufficient assets to cover liabilities as they fall due.
Calculation definition: Trade and other receivables excluding receivables from associates, derivative financial assets and loan notes, plus inventories less trade and other payables excluding payables due to associates, derivative financial liabilities, dividend liabilities and retirement plan obligations.
2019$m
2018$m
Trade and other receivables – non-current (note 18) 2.7 3.5Trade and other receivables – current (note 18) 202.0 231.0Inventories (note 20) 350.8 348.2Trade and other payables – current (note 22) (121.2) (140.9)Trade and other payables – non-current (note 22) (2.7) (3.8)Less: non-working capital loan note (note 18) (0.7) (1.2)Add: non-working capital US deferred compensation plan obligation (note 22) 2.1 1.7Less: non-working capital current other receivables and other payables 0.3 (2.0) 433.3 436.5
D. Inventory DaysPurpose: This is a working capital efficiency ratio that measures inventory balances relative to business activity levels.
Calculation definition: Inventory at the year-end divided by underlying cost of sales for the last three months of the year multiplied by 92 days, adjusted for the impact of acquisitions and disposals.
2019$m
2018$m
Inventory (note 20) 350.8 348.2Underlying cost of sales for October to December 150.6 173.0
Inventory days 214 days 185 days
E. Trade Receivables DaysPurpose: This is a working capital efficiency ratio that measures receivable balances relative to business activity levels.
Calculation definition: Net trade receivables, contract assets and accrued revenue at the year-end divided by revenue for the last three months of the year multiplied by 92 days, adjusted for the impact of acquisitions and disposals.
2019$m
2018$m
Net trade receivables (note 18) 155.5 182.0Contract assets 8.3 11.8Accrued revenue 12.3 7.9Net receivables 176.1 201.7
Revenue for October to December 205.7 236.6
Trade receivable days 79 days 78 days

Purp
ose and business mod
elB
usiness strategyG
overnanceP
erformance
Fin
an
cia
l state
me
nts
181 Hunting PLC / 2019 Annual Report and Accounts
Balance Sheet Non-GAAP Measures continued
F. Other Net AssetsPurpose: Provides an analysis of other net assets in the Summary Group Balance Sheet in the Strategic Report.
2019$m
2018$m
Investments (note 17) 2.8 2.4Non-working capital loan note (NGM C) 0.7 1.2Non-working capital US deferred compensation plan obligation (NGM C) (2.1) (1.7)Non-working capital current other receivables and other payables (NGM C) (0.3) 2.0 1.1 3.9
G. Capital EmployedPurpose: Used in the calculation of the return on average capital employed (see NGM N).
Calculation definition: Capital employed is the amount of capital that the Group has invested in its business and comprises the historic value of total equity plus net (cash) debt at amortised cost.
The Group’s capital comprised:
2019$m
2018$m
Total equity (consolidated balance sheet) 1,223.8 1,191.1Net cash (note 26) (77.9) (61.3) 1,145.9 1,129.8
Cash Flow Non-GAAP Measures
H. Cash Flow Working Capital MovementsPurpose: Reconciles the working capital movements in the Summary Group Cash Flow in the Strategic Report.
2019$m
2018$m
Working capital – opening balance 436.5 344.0Adjustment on adoption of IFRS 16 (note 41) 2.1 –Working capital – opening balance amended 438.6 344.0Foreign exchange 3.1 (4.6)Acquisition (note 39) 0.2 –Business disposal (0.6) –Adjustments: Transfer to property, plant and equipment (note 12) (0.1) – Transfer from provisions – (0.1) Capital investment debtors/creditors cash flows 0.1 0.1 Asset disposals debtors/creditors cash flows 0.3 – Other non-cash flow movements (0.1) 0.7 Other cash flow movement (0.6) (0.2)Working capital – closing balance (NGM C) (433.3) (436.5)Cash flow 7.6 (96.6)

Hunting PLC / 2019 Annual Report and Accounts182
Non-GAAP Measures (unaudited) continued
Cash Flow Non-GAAP Measures continued
I. Capital InvestmentPurpose: Capital investment identifies the cash resources being absorbed organically within the business to maintain or enhance operating activity levels.
Calculation definition: Capital investment is the cash paid on tangible non-current assets to maintain existing levels of operating activity and to grow the business from current operating levels and enhance operating activity.
2019$m
2018$m
Property, plant and equipment additions (note 12) 35.9 30.0Capital investment debtors/creditors cash flows (NGM H) 0.1 0.1Cash flow 36.0 30.1
Hunting Titan 14.3 12.6US 19.3 15.7Canada 1.0 0.9EMEA 0.6 0.5Asia Pacific 0.7 0.2Central 0.1 0.2Cash flow 36.0 30.1
J. Other Operating Cash and Non-Cash MovementsPurpose: Reconciles other operating cash and non-cash movements in the Summary Group Cash Flow in the Strategic Report.
2019$m
2018$m
Loans from associates repaid (consolidated statement of cash flows) 0.3 –Decrease in provisions (consolidated statement of cash flows) (2.4) (3.8)Proceeds on disposal of associate (consolidated statement of cash flows) – 1.3Other non-cash flow items Pensions – 2.5 Other (0.4) 0.4
(2.5) 0.4
K. Free Cash FlowPurpose: Free cash flow is a measure of financial performance and represents the cash that the Group is able to generate. Free cash flow represents the amount of cash the Group has available to either retain for investment, whether organic or by way of acquisition, or to return to shareholders.
Calculation definition: All cash flows before transactions with shareholders, investment in non-current assets and lease financing costs. The definition has been updated to take into account the adoption of IFRS 16 Leases from 1 January 2019. Comparatives for 2018 have not been restated.
2019i
$m2018
$m
Underlying EBITDA (NGM A) 139.7 142.3Add: share-based payment charge 9.1 13.2
148.8 155.5Working capital movements (NGM H) 7.6 (96.6)Net interest, bank fees and tax paid (consolidated statement of cash flows) (7.6) (4.6)Proceeds from disposal of assets 5.9 16.4Disposal of business 3.0 –Gains on business and asset disposals (5.8) (1.0)UK pension scheme refund – 10.6Other operating cash and non-cash movements (NGM J) (2.5) 0.4
149.4 80.7
i. Free cash flow for 2019 has benefited by $10.6m due to the conversion of lease accounting from IAS 17 Leases to IFRS 16 Leases.

Purp
ose and business mod
elB
usiness strategyG
overnanceP
erformance
Fin
an
cia
l state
me
nts
183 Hunting PLC / 2019 Annual Report and Accounts
Other Non-GAAP Measures
L. Dividend Per Share DeclaredPurpose: Identifies the total amount of dividend declared in respect of a period. This is also used in the calculation of dividend cover (see NGM M).
Calculation definition: The amount in cents returned to Ordinary shareholders.
2019Cents per share
2018Cents per share
Interim dividend 5.0 4.0Final dividend 6.0 5.0
11.0 9.0
M. Dividend CoverPurpose: An indication of the Company’s ability to maintain the level of its dividend and indicates the proportion of earnings being retained in the business for future investment versus that returned to shareholders.
Calculation definition: Earnings per share attributable to Ordinary shareholders divided by the cash dividend per share to be returned to Ordinary shareholders, on an accruals basis.
2019 2018
Underlying Reported Underlying Reported
Earnings per shareBasic (note 11) 45.0c 24.0c 51.6c 54.4cDiluted (note 11) 43.9c 23.5c 49.6c 52.3c
Dividend (NGM L) 11.0c 11.0c 9.0c 9.0c
Dividend coverBasic 4.1x 2.2x 5.7x 6.0xDiluted 4.0x 2.1x 5.5x 5.8x
N. Return on Average Capital EmployedPurpose: Measures the levels of return the Group is generating from its capital employed.
Calculation definition: Underlying profit before interest and tax, adjusted for the share of associates’ post-tax results, as a percentage of average gross capital employed. Average gross capital employed is a monthly average of capital employed based on 13 balance sheets from the closing December balance in the prior year to the closing December balance in the current year.
2019$m
2018$m
Average monthly gross capital employed (13 point average) 1,192.0 1,120.8
Underlying profit from operations (consolidated income statement) 94.3 104.7
Return on average capital employed 8% 9%

Hunting PLC / 2019 Annual Report and Accounts184
Financial Recordi (unaudited)
2019ii
$m2018
$m2017
$m2016
$m2015
$m
Revenue 960.0 911.4 724.9 455.8 810.5EBITDA 139.7 142.3 56.0 (48.9) 61.9Depreciation and non-exceptional amortisation and impairment (45.4) (37.6) (41.7) (43.3) (45.5)Profit (loss) from continuing operations 94.3 104.7 14.3 (92.2) 16.4Net finance expense (1.2) (0.7) (1.5) (0.7) (6.8)Share of associates’ post-tax losses – – (1.3) (0.3) (0.2)Profit (loss) before tax from continuing operations 93.1 104.0 11.5 (93.2) 9.4Taxation (17.0) (22.0) (1.0) 19.9 (5.4)Profit (loss) for the year 76.1 82.0 10.5 (73.3) 4.0
cents cents cents cents cents
Basic earnings (loss) per share 45.0 51.6 8.0 (45.3) 3.1Diluted earnings (loss) per share 43.9 49.6 8.0 (45.3) 3.1
Dividend per shareiii 11.0 9.0 – – 8.0
$m $m $m $m $m
Balance sheetProperty, plant and equipment 354.7 360.2 383.3 419.0 460.8Right-of-use assets 36.7 – – – –Goodwill and other intangible assets 308.7 329.7 355.7 380.5 411.0Working capital 433.3 436.5 344.0 300.2 365.8Taxation (current and deferred) 19.8 13.7 (6.0) (3.4) 10.7Provisions (8.4) (14.2) (18.0) (15.7) (18.0)Other net assets 1.1 3.9 22.7 38.7 48.3Capital employed 1,145.9 1,129.8 1,081.7 1,119.3 1,278.6Net cash (debt) before lease liabilities 123.1 61.3 30.4 (1.9) (110.5)Lease liabilities (45.2) – – – –Net assets 1,223.8 1,191.1 1,112.1 1,117.4 1,168.1Non-controlling interests (15.9) (14.0) (18.8) (19.3) (26.2)Equity attributable to owners of the parent 1,207.9 1,177.1 1,093.3 1,098.1 1,141.9
cents cents cents cents cents
Net assets per share 733.3 721.4 677.3 682.6 785.0
i. Information is stated before exceptional items and amortisation of intangible assets recognised as part of a business combination. ii. Information for 2019 includes the adoption of IFRS 16 Leases with effect from 1 January 2019 (see note 41). The modified retrospective approach was applied
and consequently information for the years 2015 to 2018 has not been restated, as permitted under the specific transitional provisions in IFRS 16 Leases. iii. Dividend per share is stated on a declared basis. Following the change in functional currency from Sterling to US dollar in 2013, dividends are declared in
US dollars and paid in Sterling. The Sterling value of dividends paid is fixed and announced approximately two weeks prior to the payment date.