hunting plc annual report & accounts 07
TRANSCRIPT
Excellence in Energy Services. . . for over 100 years
www.hunting.plc.uk
Contents
Chairman’s Statement _________________________________________________________ 2
Business Review _____________________________________________________________ 4
Board of Directors___________________________________________________________ 16
Report of the Directors ________________________________________________________ 18
Corporate Social Responsibility_________________________________________________ 24
The Remuneration Committee’s Report __________________________________________ 26
Corporate Governance ________________________________________________________ 34
Report of the Auditors _________________________________________________________ 39
Principal Accounting Policies __________________________________________________ 41
Consolidated Income Statement ________________________________________________ 47
Consolidated and Company Statement of Recognised Income and Expense ___________ 48
Consolidated Balance Sheet____________________________________________________ 49
Company Balance Sheet_______________________________________________________ 50
Cash Flow Statement__________________________________________________________ 51
Notes to the Financial Statements _______________________________________________ 52
Shareholder Information_______________________________________________________102
Financial Record _____________________________________________________________103
H u n t i n g P L C a n n u a l r e p o r t & a c c o u n t s
t w o t h o u s a n d & s e v e n 07
3 Cockspur Street, London SW1Y 5BQTel: 020 7321 0123 Fax: 020 7839 2072
www.hunting.plc.uk
HU
NT
ING
PLC
AN
NU
AL R
EPO
RT
AN
D A
CC
OU
NT
S 20
07
Professional Advisers
Solicitors
CMS Cameron McKenna LLP
Auditors
PricewaterhouseCoopers LLP
Brokers
Hoare Govett Limited
Merchant Bankers
Close Brothers Corporate Finance Limited
Insurance Brokers
Willis Limited
Pension Advisers & Actuary
Lane Clark & Peacock LLP
Registrars and Transfer Office
Equiniti Limited
Aspect House
Spencer Road, Lancing
West Sussex BN99 6DA
Telephone 0871 384 2030
Registered Office: 3 Cockspur Street, London SW1Y 5BQ
Registered Number: 974568 (Registered in England and Wales)
Telephone: 020 7321 0123 Facsimile: 020 7839 2072
Internet Web Site: www.hunting.plc.uk
Designed by Marshall Design, Godalming, Surrey.
Printed by Park Communications on paper manufactured from Elemental Chlorine Free (ECF) pulp sourced from sustainable forests.
Park Communications is certified to ISO 14001:2004 Environmental Management System and is a CarbonNeutral® company.
Hunting PLC Global Market www.hunting.plc.uk
a n n u a l r e p o r t & a c c o u n t s t w o t h o u s a n d & s e v e n a n n u a l r e p o r t & a c c o u n t s t w o t h o u s a n d & s e v e n
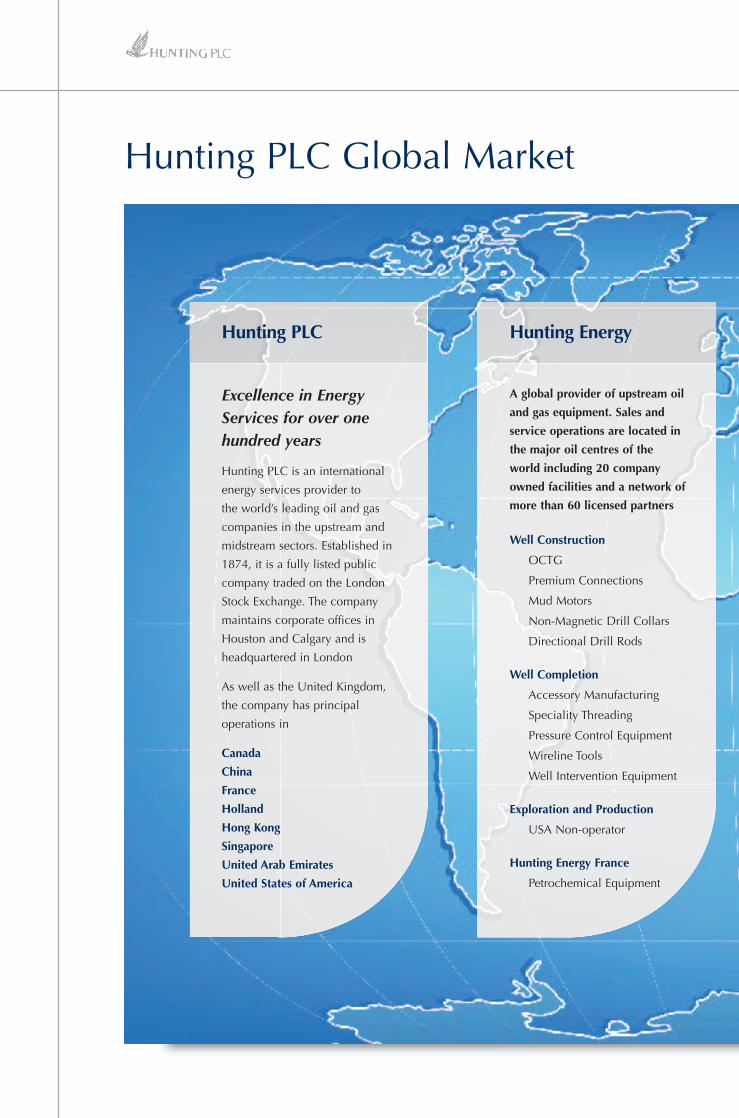
Excellence in EnergyServices for over onehundred years
Hunting PLC is an international
energy services provider to
the world’s leading oil and gas
companies in the upstream and
midstream sectors. Established in
1874, it is a fully listed public
company traded on the London
Stock Exchange. The company
maintains corporate offices in
Houston and Calgary and is
headquartered in London
As well as the United Kingdom,
the company has principal
operations in
Canada
China
France
Holland
Hong Kong
Singapore
United Arab Emirates
United States of America
Hunting PLC
A global provider of upstream oil
and gas equipment. Sales and
service operations are located in
the major oil centres of the
world including 20 company
owned facilities and a network of
more than 60 licensed partners
Well Construction
OCTG
Premium Connections
Mud Motors
Non-Magnetic Drill Collars
Directional Drill Rods
Well Completion
Accessory Manufacturing
Speciality Threading
Pressure Control Equipment
Wireline Tools
Well Intervention Equipment
Exploration and Production
USA Non-operator
Hunting Energy France
Petrochemical Equipment
Hunting Energy
Marketing
Crude Oil
Diluent
Natural Gas Liquids
Natural Gas
Truck Transportation
Crude Oil
Asphalt
Diluent
Natural Gas Liquids
Liquid Petroleum Gases
Carbon Dioxide
Industrial Chemicals
Terminals and Pipelines
Pipelines
Custom Terminals
Storage
Blending
Canada’s largest independent midstream energy company
playing a significant role in the country’s oil and gas industry
linking upstream producers with downstream refiners
Gibson Energy
Gibson Shipbrokers
Propane Marketing andDistribution
Retail Distribution
Wholesale Supply
Moose Jaw Refinery
Asphalt
Roofing Flux
Well Site Fluids
Light distillates
Crude Oil and Products
Specialised Tankers
LPG and LNG
Dry Cargo
Sale and Purchase
Offshore
Research 07

Professional Advisers
Solicitors
CMS Cameron McKenna LLP
Auditors
PricewaterhouseCoopers LLP
Brokers
Hoare Govett Limited
Merchant Bankers
Close Brothers Corporate Finance Limited
Insurance Brokers
Willis Limited
Pension Advisers & Actuary
Lane Clark & Peacock LLP
Registrars and Transfer Office
Equiniti Limited
Aspect House
Spencer Road, Lancing
West Sussex BN99 6DA
Telephone 0871 384 2030
Registered Office: 3 Cockspur Street, London SW1Y 5BQ
Registered Number: 974568 (Registered in England and Wales)
Telephone: 020 7321 0123 Facsimile: 020 7839 2072
Internet Web Site: www.hunting.plc.uk
Designed by Marshall Design, Godalming, Surrey.
Printed by Park Communications on paper manufactured from Elemental Chlorine Free (ECF) pulp sourced from sustainable forests.
Park Communications is certified to ISO 14001:2004 Environmental Management System and is a CarbonNeutral® company.
Hunting PLC Global Market www.hunting.plc.uk
a n n u a l r e p o r t & a c c o u n t s t w o t h o u s a n d & s e v e n a n n u a l r e p o r t & a c c o u n t s t w o t h o u s a n d & s e v e n
Excellence in EnergyServices for over onehundred years
Hunting PLC is an international
energy services provider to
the world’s leading oil and gas
companies in the upstream and
midstream sectors. Established in
1874, it is a fully listed public
company traded on the London
Stock Exchange. The company
maintains corporate offices in
Houston and Calgary and is
headquartered in London
As well as the United Kingdom,
the company has principal
operations in
Canada
China
France
Holland
Hong Kong
Singapore
United Arab Emirates
United States of America
Hunting PLC
A global provider of upstream oil
and gas equipment. Sales and
service operations are located in
the major oil centres of the
world including 20 company
owned facilities and a network of
more than 60 licensed partners
Well Construction
OCTG
Premium Connections
Mud Motors
Non-Magnetic Drill Collars
Directional Drill Rods
Well Completion
Accessory Manufacturing
Speciality Threading
Pressure Control Equipment
Wireline Tools
Well Intervention Equipment
Exploration and Production
USA Non-operator
Hunting Energy France
Petrochemical Equipment
Hunting Energy
Marketing
Crude Oil
Diluent
Natural Gas Liquids
Natural Gas
Truck Transportation
Crude Oil
Asphalt
Diluent
Natural Gas Liquids
Liquid Petroleum Gases
Carbon Dioxide
Industrial Chemicals
Terminals and Pipelines
Pipelines
Custom Terminals
Storage
Blending
Canada’s largest independent midstream energy company
playing a significant role in the country’s oil and gas industry
linking upstream producers with downstream refiners
Gibson Energy
Gibson Shipbrokers
Propane Marketing andDistribution
Retail Distribution
Wholesale Supply
Moose Jaw Refinery
Asphalt
Roofing Flux
Well Site Fluids
Light distillates
Crude Oil and Products
Specialised Tankers
LPG and LNG
Dry Cargo
Sale and Purchase
Offshore
Research 07

a n n u a l r e p o r t & a c c o u n t s t w o t h o u s a n d & s e v e n 1
Financial HighlightsDouble-digit growthonce again as the costand availability of energycontinues to dominatethe public arena.
Global oil servicescontinue to expanddriven by unrelentingenergy demand fromrapid industrialisation ofthe developing world andweak supply gains inproducing regions.
The Company foreseesheightened oil and gasactivity and demand for its expertisecontinuing to be strong.
072007 2006
Revenue +8% £1,950m £1,810m
Profit from operations +14% £98.5m £86.3m
Profit before tax andexceptional items +8% £93.0m £85.8m
Profit before tax +12% £90.7m £80.8m
Basic earnings per share +17% 44.0p 37.6p
Dividend declared +10% 8.25p 7.5p

I am pleased to report the Company’sthird consecutive year of recordresults. Profit before taxation in 2007was £90.7m (2006 – £80.8m), a 12%increase.
The Company continues to be focusedon North America with increasingcontributions from the internationalarena. The energy markets we serveare volatile, but your Company hasperformed well, increasing its pre-taxprofits despite sterling (our reportingcurrency) strengthening significantlyagainst the US and Canadian dollarsin which we mainly trade.
Two significant international trendsfrom the last few years have comeincreasingly to the fore. Hydrocarbonresources have become harder to findand deliver to consumers. The world’soil and gas reserves, once mainly inthe hands of the major international oilcompanies, are now substantiallycontrolled by state-owned national oilcompanies. Both of these trends playto the Company’s strengths. Deeperand higher pressure reserves requiredisproportionately large quantities ofour highly engineered upstreamproducts, while national oil companiesoften require more from the oil serviceindustry than do the oil majors.
Gibson Energy, the Company’smidstream services operation wasonce again busy and successful in thevery active Western Canadian scene,producing similar results to last year.Even more attention is being paid bythe company to the increasingproportion of hydrocarbon productionderiving from conventional heavy oiland from the huge Athabasca tarsands reserves. The key performers in2007 were the Truck Transportationoperation (with the largest crude oilfleet in Western Canada) and theTerminals and Pipelines operation.Although the Marketing Divisionfound that very high oil price levelsand volatility impacted on some of itstrading opportunities, it remainedhighly profitable.
Hunting Energy Services concentrateson the upstream side of the oilindustry, providing sophisticatedequipment mainly for below-ground
applications. It produced profits morethan 36% above last year, thanks toexcellent markets and efficientproduction, especially in USManufacturing, in the North Sea andin South-East Asia.
Capital expenditure increasedsubstantially to meet continued highdemand and to replace equipmentwhich has been working flat-out forsome years. A number of smalleracquisitions were also made.
Basic earnings per share were 44.0p,an increase of 17% on the previousyear. We are recommending a finaldividend of 5.7p per share, giving atotal of 8.25p for the year, a 10%increase.
We intend to appoint a new FinanceDirector, Peter Rose CA, with effectfrom the Company’s Annual GeneralMeeting. Peter has been with us sinceJuly 1997, initially as Group FinancialController and also as CompanySecretary since August 2004.
The current Finance Director, DennisClark, has been in the post since theformation of Hunting PLC in 1989. Heoriginally joined the Group in 1972and has had a distinguished career,culminating in his active involvementin the remarkable growth of the pastfew years. I would like to extend mygratitude and that of the rest of theBoard and of his colleagues forDennis’s outstanding achievements.
This has been a fine year for yourCompany. Although the worldeconomic outlook is cloudier than inrecent years, it seems certain thathydrocarbon demand and the need forour products and services willcontinue to be strong. I expect theCompany to continue to perform well.
I thank our staff for their hard workand dedication during anothersuccessful year.
Richard HuntingChairman
a n n u a l r e p o r t & a c c o u n t s t w o t h o u s a n d & s e v e n2
07
Chairman’s Statement

a n n u a l r e p o r t & a c c o u n t s t w o t h o u s a n d & s e v e n 3
a n n u a l r e p o r t & a c c o u n t s t w o t h o u s a n d & s e v e n
At Canwest Propane, Western andDel’s Propane companies wereacquired for £4.1m. In addition, theacquisition of MP Energy in EasternCanada for £8.8m occurred in thesecond half of 2007, which increasedvolumes in wholesale distribution.
Hunting Energy Services invested£36.5m in capital expenditure during2007 of which £7.0m was forexploration and productionexpenditure. The balance of £29.5mincluded expenditure of £8.3m foradditional facilities in Casper, Wyomingand new tools and spare parts forPerformance mud motor equipment. Inthe US manufacturing facilities,spending on the oil country tubulargoods finishing facility in Houston, deepwater accessory manufacturing facilityin Houma, Louisiana and the expansionof the Lafayette, Louisiana facilitytotalled £3.0m for the year. Additionalequipment in Asia, Aberdeen andHolland totalled approximately £2.0m.Hunting Oryx was acquired in Octoberfor £8.6m. Hunting Oryx is a distributorof non-magnetic drill collars.
Health, Safety and the Environment
Gibson Energy’s lost time incidentrecord was 26% below the AlbertaProvincial average in 2007. Gibsonwas also recognised for itscommitment to Health, Safety and theEnvironment as a recipient of the 2007Certificate of Recognition (COR), anindustry health and safety standard,with a score at the 90% level. Gibsonand its affiliates received the following
awards related to Health, Safety andEnvironment of their employees andcommunity in which they operate.
1. Work Safe Alberta 2006 BestPerformer Award.
2. Leader status in the EnviroVista,Environmental Leadership Program,awarded to Gibson’s “BulkPetroleum Storage and TransfersFacility” in Hardisty by the Ministerfor Alberta Environment.
3. Chemical Shipper’s Safety Award –awarded to the Moose Jaw Refineryby the Canadian Pacific Railway fordemonstrating excellence intransportation safety.
4. CNR Safe Handling – awarded tothe Moose Jaw Refinery andGibson’s Edmonton Terminal by theCanadian National Railway as partof the “Partners in Responsible CareGold Award”.
Hunting Energy Services’ USmanufacturing operations incurred atotal of twenty-six recordableaccidents which reduced by 20% from2006. Approximately 50% of theincidents were by inexperiencedworkers with less than one year’semployment at Hunting. Hunting’sincident rate of 2.69 remains farbelow the Bureau of Labour Statisticsindustry average of approximately 7.5.
The European facilities’ accidentstatistics were once again below thelevel of the industry average inengineering and manufacturing.
Therefore, the Company applied fortheir sixth consecutive National SafetyAward by the British Safety Counciland retained the Five Star rating forthe tenth consecutive year.
No environmental issues occurred inthe year and all of Hunting EnergyServices’ primary manufacturingfacilities are ISO 14001 EnvironmentalManagement System certified.
Our goals remain simply put – noaccidents, no harm to people and nodamage to the environment.
Outlook
Oil accounts for more than 95% oftransportation energy, andtransportation is an economicnecessity. There are no easy energysubstitutes. In addition, the soaring oiluse throughout the developing worldwill challenge the oil and gasindustry’s ability to meet futuredemand. Some experts’ view of anannual 4% average depletion rate forexisting fields is often rebutted with alevel of 8%, thus posing a furtherobstacle to supply growth. At currentcommodity price levels, oil and gasproducers are once again increasingtheir investment to boost reserves andproduction capabilities. The 11%investment growth will placeadditional pressure on the existing and over stretched manpowerresources, but will continue to provide excellent growth opportunities for the oil serviceindustry.
5
Technology has played a veryimportant role in findinghydrocarbons. However, technologyhas enabled producers to extract thehydrocarbons faster and morecompletely, but often at the expenseof a reservoir’s longevity. Futureproduction, often at greater welldepths, or deeper and larger miningoperations, will require furthertechnology improvements.
In the Canadian heavy oil fields,volume increases will place anincreased strain on midstreamdelivery and storage assets. Noabatement of investment growth isforeseen to bring these known andsecure volumes of oil to markets inthe US.
Hunting PLC is uniquely positioned tocapitalise on the above scenario.Quality, mature assets and recordspend on new assets, whether ontrucks, storage or refinery capacity inCanada or manufacturing facilityexpansion throughout the world willprovide sustained growth.
a n n u a l r e p o r t & a c c o u n t s t w o t h o u s a n d & s e v e n6
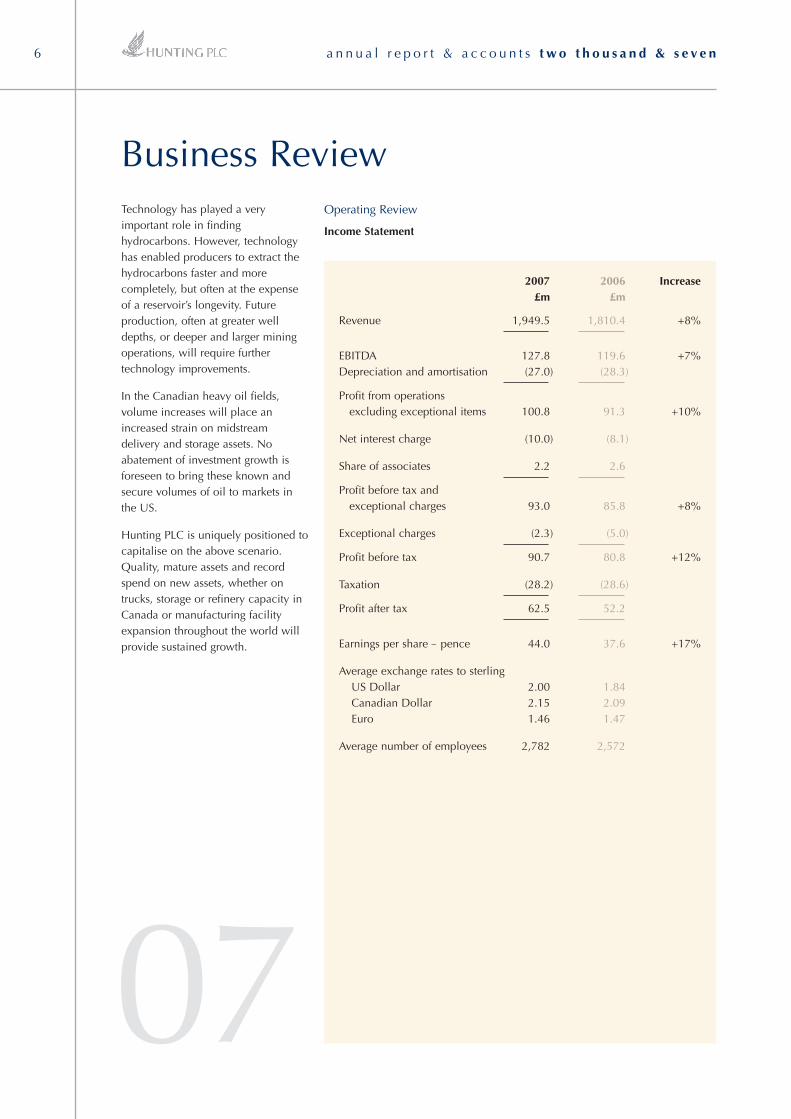
2007 2006 Increase£m £m
Revenue 1,949.5 1,810.4 +8%
EBITDA 127.8 119.6 +7%Depreciation and amortisation (27.0) (28.3)
Profit from operationsexcluding exceptional items 100.8 91.3 +10%
Net interest charge (10.0) (8.1)
Share of associates 2.2 2.6
Profit before tax andexceptional charges 93.0 85.8 +8%
Exceptional charges (2.3) (5.0)
Profit before tax 90.7 80.8 +12%
Taxation (28.2) (28.6)
Profit after tax 62.5 52.2
Earnings per share – pence 44.0 37.6 +17%
Average exchange rates to sterlingUS Dollar 2.00 1.84Canadian Dollar 2.15 2.09Euro 1.46 1.47
Average number of employees 2,782 2,572
Operating Review
Income Statement
Business Review
07
a n n u a l r e p o r t & a c c o u n t s t w o t h o u s a n d & s e v e n 7
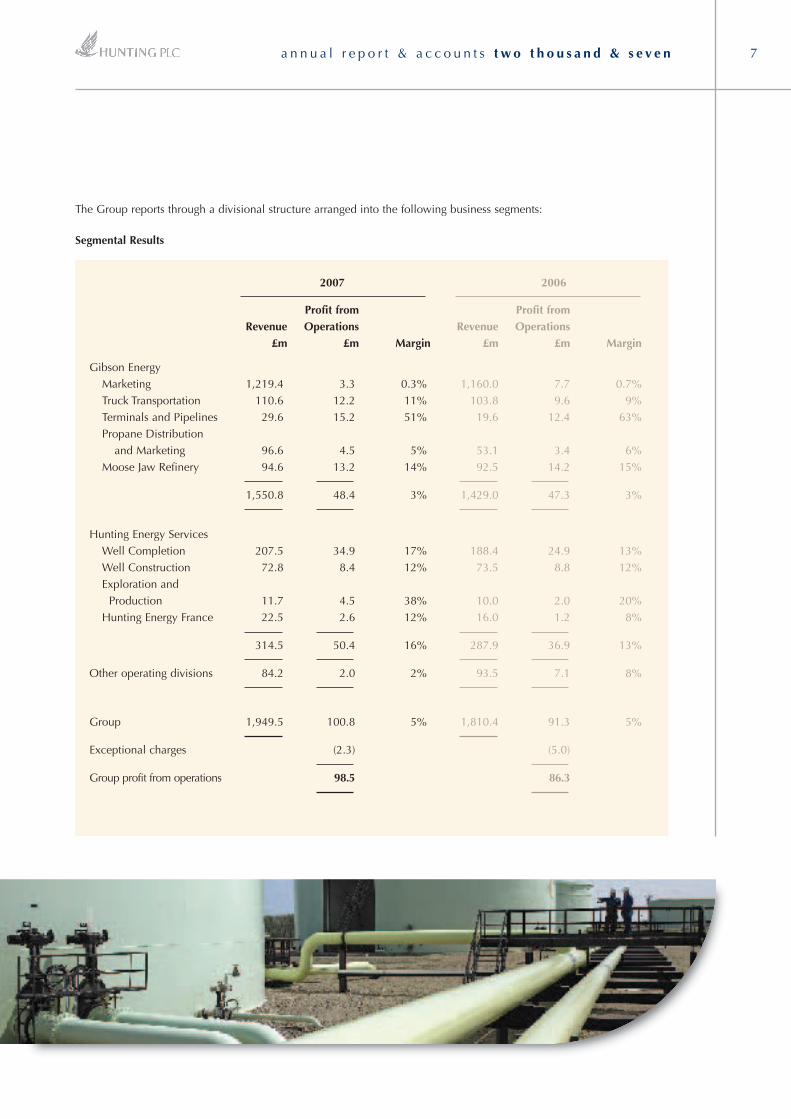
The Group reports through a divisional structure arranged into the following business segments:
Segmental Results
2007 2006
Profit from Profit fromRevenue Operations Revenue Operations
£m £m Margin £m £m Margin
Gibson EnergyMarketing 1,219.4 3.3 0.3% 1,160.0 7.7 0.7%Truck Transportation 110.6 12.2 11% 103.8 9.6 9%Terminals and Pipelines 29.6 15.2 51% 19.6 12.4 63%Propane Distribution
and Marketing 96.6 4.5 5% 53.1 3.4 6%Moose Jaw Refinery 94.6 13.2 14% 92.5 14.2 15%
1,550.8 48.4 3% 1,429.0 47.3 3%
Hunting Energy ServicesWell Completion 207.5 34.9 17% 188.4 24.9 13%Well Construction 72.8 8.4 12% 73.5 8.8 12%Exploration and
Production 11.7 4.5 38% 10.0 2.0 20%Hunting Energy France 22.5 2.6 12% 16.0 1.2 8%
314.5 50.4 16% 287.9 36.9 13%
Other operating divisions 84.2 2.0 2% 93.5 7.1 8%
Group 1,949.5 100.8 5% 1,810.4 91.3 5%
Exceptional charges (2.3) (5.0)
Group profit from operations 98.5 86.3
end the year at levels near 2006. As aresult, year on year operating profitsfor Gibson Energy were £48.4m (2006– £47.3m).
Marketing activities comprise thebuying, selling and blending of crudeoil, diluent, natural gas and well sitefluids across North America. The pricerisk on volumes purchased andinventories is managed throughpublicly traded commodityinstruments. Gibson remains one ofCanada’s largest independent crudeoil marketing companies dealing withall of the major, intermediate andsmaller Canadian producingcompanies and income trusts. It isfocused on the physical buying andselling of hydrocarbon productsutilising proprietary risk managementtechniques and strong customerrelationships to minimise risk andoptimise profitability. Marketingaccounted for 6.8% of Gibson’s profit from operations. While tradingmargins from marketing were robustduring most of the year, volatilemovement in differentials had animpact in the fourth quarter. Inaddition, extraordinary gains from theSuncor oil sands coker fire in 2006were not repeated, as diluent was notin historical short supply. Blendingvolumes, however, at the elevencustom terminals were nearexpectations, but margins were lowerthan in 2006. Further, the EdmontonNorth terminal began the yearpositively with good results throughmid-year, but suffered negatively fromwide differentials and lower inventoryvalues in October and December.
Truck Transportation operates a fleetof 1,180 trailers and 660 tractors thatmove in excess of 93 million barrelsof oil equivalent per year acrossWestern Canada and theNorthwestern United States. TruckTransportation accounted for 25.2% of Gibson’s profit from operations – a27% profit improvement over 2006. Itis the largest crude oil truck hauler inWestern Canada. The large scale of its
The Company’s technologyinvestments will further its earningsgrowth from well cost savings tocompletion and productionimprovements. Its market sharestrength in Truck Transportation inCanada; proprietary tubularconnections; global manufacturingcapacity; and crude oil tankerbrokering will provide further marginenhancement. The respectivesynergistic assets of Gibson Energyand Hunting Energy will continue tomaximise profit from each barrel ofcrude oil and each operator purchaseorder. Hunting’s five yearcompounded annual growth rate of41% is exceptional. With a strongbalance sheet, a tested strategy and2,782 dedicated employees, HuntingPLC will continue delivering excellentvalue to its shareholders.
Gibson Energy
For Canada, crude oil remained thedominant commodity for increasedactivity in 2007, while natural gaswell completions experienced a 25%decline. 2007 was a year of extremevolatility for crude oil price marketswhich experienced a large year onyear gain in West Texas intermediateposting from US$54.35 to US$91.74/barrel. This was offset by an evenlarger increase in heavy/sourdifferentials for Canadian crude oilfrom the $16/barrel range to over$40/barrel at year end. This factorcombined with the reversal in futurecontracts from contango (increasingfuture prices) to backwardation(decreasing future prices) has madetrading unpredictable. Accordinglyprovisions were recorded in the fourthquarter from mark to marketderivatives which are regularly placedto protect physical volumes tradedinto the future. The extraordinarilywide differential for the heavy oilprices in December actually devaluedinventories as West Texas intermediateprices increased. This movementcaused the results for Moose JawRefinery and the Marketing group to
fleet operations allows Gibson to carry out logistically complex andhigh margin jobs regardless of thevolume or destination. A strong focuson health, safety and environmentalperformance is maintained, given thefact that these combined units travelapproximately 143,000 miles per day.
Terminals and Pipelines operationsincorporate an infrastructure of over270 miles of pipelines and eleventerminals with a storage capacityexceeding 2.3 million barrels. Theseassets provide tariff based pipelineservices and fee based storage andterminaling services for crude oil anddiluent products. The custom terminalscapture the spreads between high andlow quality crude oil through itsblending, terminaling andtransportation service offerings. Thisdivision accounted for 31.4% ofGibson Energy’s profit fromoperations, a 23% year on yearimprovement. Volumes from Suncor’sFort McMurray operations steadilyincreased throughout the year as didoverall heavy crude volumes. TheHardisty Terminal Frac Plant iscapable of processing approximately5,000 barrels per day of NGL intobutane, propane and other by-products.
Propane Distribution and Marketingincludes the operations of CanwestPropane Limited, the second largestCanadian retail distributor of propane,utilising a fleet of over 200 fullyequipped delivery and service trucksand operating through forty-eightstrategically located branch officesand storage facilities across WesternCanada and the Northwest US.Volumes almost doubled in 2007 to480 million litres and represented9.3% of Gibson’s operating profits – a32% increase.
Moose Jaw Refinery processesapproximately 3.9 million barrels ofheavy crude each year into A Gradeasphaltic and lighter distillate productsincluding road asphalt, roofing flux
a n n u a l r e p o r t & a c c o u n t s t w o t h o u s a n d & s e v e n8
Business Review
a n n u a l r e p o r t & a c c o u n t s t w o t h o u s a n d & s e v e n
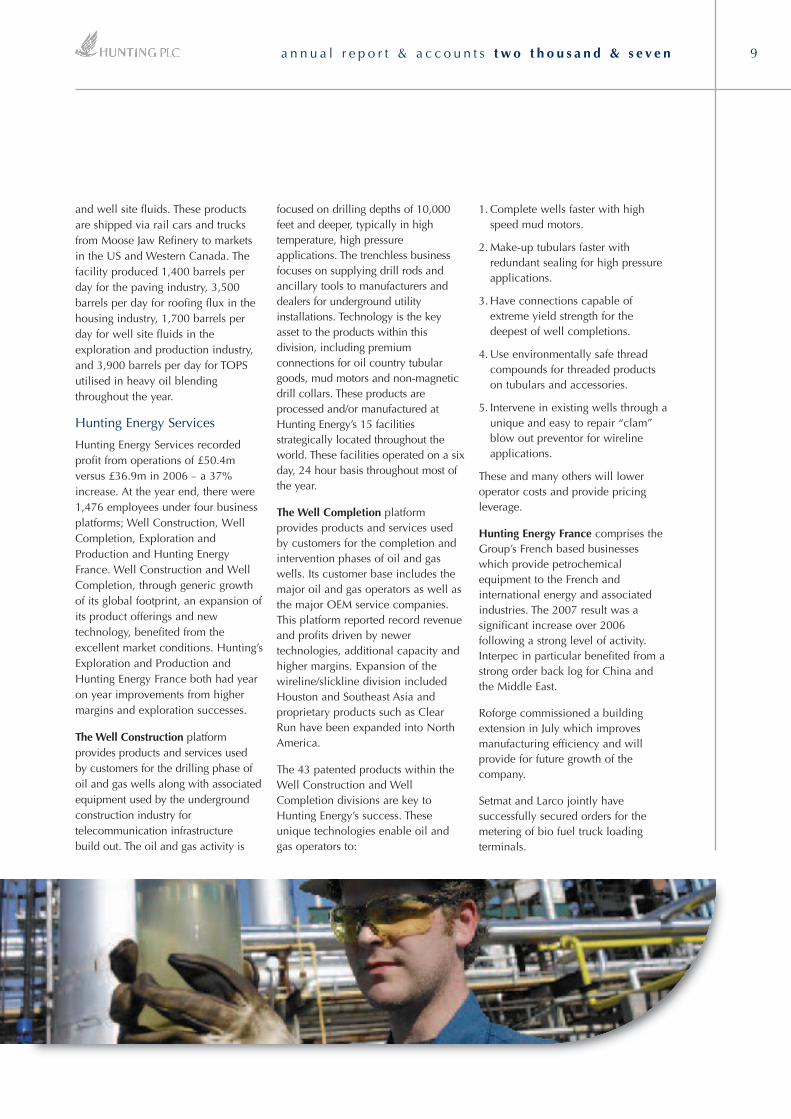
and well site fluids. These productsare shipped via rail cars and trucksfrom Moose Jaw Refinery to marketsin the US and Western Canada. Thefacility produced 1,400 barrels perday for the paving industry, 3,500barrels per day for roofing flux in thehousing industry, 1,700 barrels perday for well site fluids in theexploration and production industry,and 3,900 barrels per day for TOPSutilised in heavy oil blendingthroughout the year.
Hunting Energy Services
Hunting Energy Services recordedprofit from operations of £50.4mversus £36.9m in 2006 – a 37%increase. At the year end, there were1,476 employees under four businessplatforms; Well Construction, WellCompletion, Exploration andProduction and Hunting EnergyFrance. Well Construction and WellCompletion, through generic growthof its global footprint, an expansion ofits product offerings and newtechnology, benefited from theexcellent market conditions. Hunting’sExploration and Production andHunting Energy France both had yearon year improvements from highermargins and exploration successes.
The Well Construction platformprovides products and services usedby customers for the drilling phase ofoil and gas wells along with associatedequipment used by the undergroundconstruction industry fortelecommunication infrastructurebuild out. The oil and gas activity is
focused on drilling depths of 10,000feet and deeper, typically in hightemperature, high pressureapplications. The trenchless businessfocuses on supplying drill rods andancillary tools to manufacturers anddealers for underground utilityinstallations. Technology is the keyasset to the products within thisdivision, including premiumconnections for oil country tubulargoods, mud motors and non-magneticdrill collars. These products areprocessed and/or manufactured atHunting Energy’s 15 facilitiesstrategically located throughout theworld. These facilities operated on a sixday, 24 hour basis throughout most ofthe year.
The Well Completion platformprovides products and services usedby customers for the completion andintervention phases of oil and gaswells. Its customer base includes themajor oil and gas operators as well asthe major OEM service companies.This platform reported record revenueand profits driven by newertechnologies, additional capacity andhigher margins. Expansion of thewireline/slickline division includedHouston and Southeast Asia andproprietary products such as ClearRun have been expanded into NorthAmerica.
The 43 patented products within theWell Construction and WellCompletion divisions are key toHunting Energy’s success. Theseunique technologies enable oil andgas operators to:
1. Complete wells faster with highspeed mud motors.
2. Make-up tubulars faster withredundant sealing for high pressureapplications.
3. Have connections capable ofextreme yield strength for thedeepest of well completions.
4. Use environmentally safe threadcompounds for threaded productson tubulars and accessories.
5. Intervene in existing wells through aunique and easy to repair “clam”blow out preventor for wirelineapplications.
These and many others will loweroperator costs and provide pricingleverage.
Hunting Energy France comprises theGroup’s French based businesseswhich provide petrochemicalequipment to the French andinternational energy and associatedindustries. The 2007 result was asignificant increase over 2006following a strong level of activity.Interpec in particular benefited from astrong order back log for China andthe Middle East.
Roforge commissioned a buildingextension in July which improvesmanufacturing efficiency and willprovide for future growth of thecompany.
Setmat and Larco jointly havesuccessfully secured orders for themetering of bio fuel truck loadingterminals.
9
liquefied natural and petroleum gasand other related services.
Despite a weaker US dollar tosterling exchange rate, Gibson’srevenues remained strong.
Challenging trading conditions forTankers were offset by improvedresults from Gas and SpecialisedTankers and in particular by thestrong performance of the Dry Cargo and Sale & PurchaseDepartments which achievedincreases of over 70% and 40%respectively.
Further expansion is expected duringthe year in the Far East to takeadvantage of identified opportunities.
Field Aviation Canada modifies,repairs and overhauls regional aircraftfor international customers fromCanadian facilities in Toronto andCalgary.
The Toronto Modification Center hada number of excellent projects thatwere successfully completed duringthe year, including US Customs andAustralian Coastwatch aircraft.However, delays in the delivery ofthree Swedish Coast Guard aircraftaffected results. Customer acceptanceof these aircraft is now in progresswith departure planned for April2008. Production capability for thenext 18 months is already presoldwith strong profits expected for 2008and 2009.
The Calgary Maintenance, Repair andOverhaul Facility made its highestprofit for many years, even thoughthe strength of the Canadian versusthe US dollar increased competitionfor commercial heavy maintenancework in North America. Themanufacturing facility wasreorganised in the year to address theexpected growth over the coming twoyears. Current production deliveriesextend into 2009.
Exploration and Production includesthe Group’s oil and gas explorationand production activities in theSouthern US and offshore Gulf ofMexico. The Group takes minoritynon-operating equity holdings andcurrently participates in over seventyoil and gas production facilities.
Markedly higher prices for oil andstable prices for natural gas, inconjunction with increasedproduction levels, contributed to asuccessful year for the Texas basedExploration and Production division.On a Net Equivalent Barrel (“NEB”)basis, production was up 20%compared to 2006 as a result ofsuccessful drilling in the shallowwaters of the Gulf of Mexico andonshore Texas and Louisiana. Thecompany participated in the drillingof 16 wells with 8 successes – 5 gas,1 oil and gas, 2 oil. Full year outputof 457,000 NEB was enhancedprimarily by higher natural gasproduction as a result of new wells.Profit from operations increased125% as compared to 2006. Year-end reserves of oil and gas on anSEC basis were 2.2m NEB comparedwith 2.3m NEB at the end of theprevious year.
Hunting Specialized Products is a USbased business supplying productsand services for the trenchlessrehabilitation of pipelines.
Revenues increased over 11% on theprevious year as a result of therecently launched structuralrehabilitation products; PolySprayand HydraWrap.
Investment in product and servicedevelopment was maintained tosupport the product development.
Other Operating Divisions
E. A. Gibson Shipbrokers is aninternational London based shipbrokerengaged in the transportation of crudeoil and other petroleum products,
Performance Measures
A number of performance measuresare used to compare thedevelopment, underlying businessperformance and position of theGroup and its business segments.These are used collectively andperiodically reviewed to ensurethey remain appropriate andmeaningful monitors of the Group’sperformance.
• Earnings before interest, tax,depreciation and amortisation(“EBITDA”).
• Profit before taxation (“PBT”).
• Return on capital employed(“ROCE”) – measures the profitbefore interest expressed as apercentage of the capitalemployed. Capital employed is theaverage of the aggregate of totalequity and the net debt at the startand end of the financial period.Also used as a benchmark fortarget acquisitions or capitalexpenditure proposals.
• Earnings per share (“EPS”).
• Free cash flow.
• Health and Safety arrangementswithin the Group are monitoredthrough regular reporting to theBoard.
Each of these performancemeasures are commented uponwithin the tables contained in theAnnual Report.
Indicators of future Groupperformance closely monitored bymanagement include:
• Drilling rig activity.
• Oil and gas commodity prices.
• Order book/backlog.
a n n u a l r e p o r t & a c c o u n t s t w o t h o u s a n d & s e v e n10
Business Review

effective rate of 31.1% (2006 –
35.4%). The lower rate than in
previous years is primarily a result of
a significant reduction in Canadian
Federal Tax effective December 2007.
Balance Sheet
Net Assets
Net assets at 31 December 2007
increased by 47% and include the
result of a property revaluation which
added £66.2m to property, plant and
equipment at the year end and the
retained result for the year of £62.5m.
Capital expenditure and acquisitions
together with high commodity prices
contributed to the 25% increase in
total assets year on year.
Property Revaluation
Group properties were revalued at
31 December 2007 giving rise to
an uplift of £66.2m in Group property
values. The resultant after tax increase
to the Group revaluation reserve was
£51.0m. The increase is principally
due to the strong economic conditions
driving property values in Alberta,
Canada.
Net Debt
Net debt increased to £139.2m
(2006 – £69.3m). Gearing increased
from 33% at the end of 2006 to
45% at 31 December 2007.
Finance Director’s ReviewResults Overview
Another strong year with revenuesand margins at record levels.
Revenue was £1,949.5m (2006 –£1,810.4m) with profit fromoperations up 14% at £98.5m (2006– £86.3m). This was achieved, eventhough both the US and Canadiandollars weakened against sterling.
Profit before tax recorded a 12%increase at £90.7m (2006 – £80.8m).If the 2007 results had been translatedusing 2006 rates the profit before taxwould have been £4.1m higher.
The results include a £2.3m exceptionalcharge relating to the disposal of ourformer Italian company, Aero Sekur.
Net Finance Costs
Net finance costs increased to £10.0m(2006 – £8.1m) following acquisitions,the increase in capital expenditure andhigher levels of working capital.Interest cover was 10 times.
Exchange Rates
Earnings Per Share
Basic earnings per share increased by17% from 37.6p in 2006 to 44.0p in2007. The average number of sharesused in calculating the earnings pershare in 2007 was 130.4m comparedto 128.9m in 2006.
Taxation
The tax charge for 2007 was £28.2m(2006 – £28.6m) which reflects an
2007 2006Average Year End Average Year End
US Dollar 2.00 1.99 1.84 1.96Canadian Dollar 2.15 1.96 2.09 2.28
Rates quoted to sterling
2007 2006£m £m
Total assets 920.2 735.3
Total liabilities (608.3) (523.8)
Net assets 311.9 211.5
Net debt 139.2 69.3
Gearing ratio 45% 33%
a n n u a l r e p o r t & a c c o u n t s t w o t h o u s a n d & s e v e n 11
07

a n n u a l r e p o r t & a c c o u n t s t w o t h o u s a n d & s e v e n12
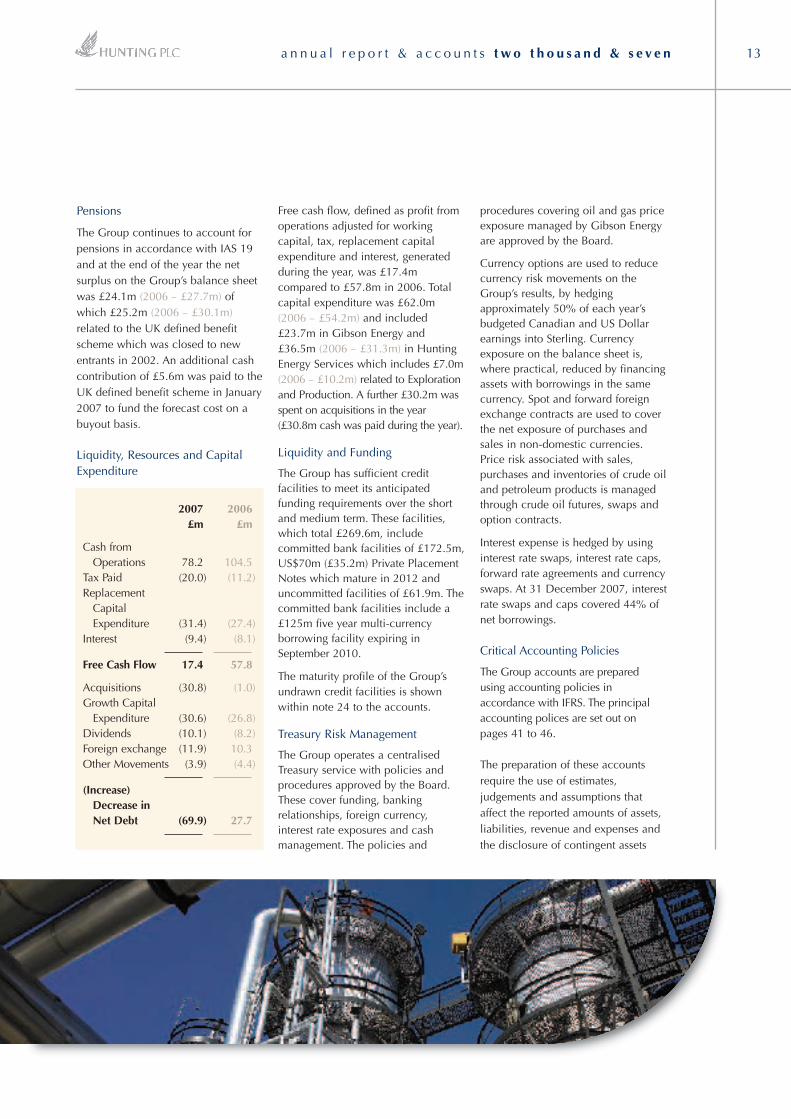
Pensions
The Group continues to account forpensions in accordance with IAS 19and at the end of the year the netsurplus on the Group’s balance sheetwas £24.1m (2006 – £27.7m) ofwhich £25.2m (2006 – £30.1m)related to the UK defined benefitscheme which was closed to newentrants in 2002. An additional cashcontribution of £5.6m was paid to theUK defined benefit scheme in January2007 to fund the forecast cost on abuyout basis.
Liquidity, Resources and CapitalExpenditure
Cash Flow2007 2006
£m £m
Cash fromOperations 78.2 104.5
Tax Paid (20.0) (11.2)Replacement
CapitalExpenditure (31.4) (27.4)
Interest (9.4) (8.1)
Free Cash Flow 17.4 57.8
Acquisitions (30.8) (1.0)Growth Capital
Expenditure (30.6) (26.8)Dividends (10.1) (8.2)Foreign exchange (11.9) 10.3Other Movements (3.9) (4.4)
(Increase)Decrease inNet Debt (69.9) 27.7
Free cash flow, defined as profit fromoperations adjusted for workingcapital, tax, replacement capitalexpenditure and interest, generatedduring the year, was £17.4mcompared to £57.8m in 2006. Totalcapital expenditure was £62.0m(2006 – £54.2m) and included£23.7m in Gibson Energy and£36.5m (2006 – £31.3m) in HuntingEnergy Services which includes £7.0m(2006 – £10.2m) related to Explorationand Production. A further £30.2m wasspent on acquisitions in the year(£30.8m cash was paid during the year).
Liquidity and Funding
The Group has sufficient creditfacilities to meet its anticipatedfunding requirements over the shortand medium term. These facilities,which total £269.6m, includecommitted bank facilities of £172.5m,US$70m (£35.2m) Private PlacementNotes which mature in 2012 anduncommitted facilities of £61.9m. Thecommitted bank facilities include a£125m five year multi-currencyborrowing facility expiring inSeptember 2010.
The maturity profile of the Group’sundrawn credit facilities is shownwithin note 24 to the accounts.
Treasury Risk Management
The Group operates a centralisedTreasury service with policies andprocedures approved by the Board.These cover funding, bankingrelationships, foreign currency,interest rate exposures and cashmanagement. The policies and
procedures covering oil and gas priceexposure managed by Gibson Energyare approved by the Board.
Currency options are used to reducecurrency risk movements on theGroup’s results, by hedgingapproximately 50% of each year’sbudgeted Canadian and US Dollarearnings into Sterling. Currencyexposure on the balance sheet is,where practical, reduced by financingassets with borrowings in the samecurrency. Spot and forward foreignexchange contracts are used to coverthe net exposure of purchases andsales in non-domestic currencies.Price risk associated with sales,purchases and inventories of crude oiland petroleum products is managedthrough crude oil futures, swaps andoption contracts.
Interest expense is hedged by usinginterest rate swaps, interest rate caps,forward rate agreements and currencyswaps. At 31 December 2007, interestrate swaps and caps covered 44% ofnet borrowings.
Critical Accounting Policies
The Group accounts are preparedusing accounting policies inaccordance with IFRS. The principalaccounting polices are set out onpages 41 to 46.
The preparation of these accountsrequire the use of estimates,judgements and assumptions thataffect the reported amounts of assets,liabilities, revenue and expenses andthe disclosure of contingent assets
a n n u a l r e p o r t & a c c o u n t s t w o t h o u s a n d & s e v e n 13
and liabilities. Directors’ estimates arebased on historical experience,consultation with experts and othermethods that they believe arereasonable and appropriate.
Employee Benefits
The Group operates a defined benefitpension scheme in the UK, which wasclosed to new entrants with effect from31 December 2002, as well as anumber of smaller defined benefitschemes and defined contributionschemes within the Group. Thesedefined benefit schemes are accountedfor under IAS 19. The main actuarialassumptions used for the UK definedbenefit scheme are shown within note29 to the accounts and include:
Property Plant and Equipment
The Group’s property plant andequipment is subject to annual rates ofdepreciation intended to spread thecost of the assets over their estimatedservice life. These rates are regularlyreviewed. The rates currently in useare set out on page 42. The propertyrevaluation undertaken at the year endrelies on the judgements and estimatesmade by the Group’s qualifiedindependent property valuers.
Goodwill
The carrying value of goodwill heldon balance sheet is reviewed forimpairment at least annually. Thereview compares the carrying valuewith the estimated future cash flowsfrom the business unit to which the
a n n u a l r e p o r t & a c c o u n t s t w o t h o u s a n d & s e v e n14
goodwill relates. The cash flows arebased on management’s view offuture trading prospects. Any shortfallidentified is treated as an impairmentand written off.
Taxation
The effective tax rate for the full yearis 31.1% and is the combined ratearising from the regional mix ofGroup results. The rate also takes intoaccount the estimated futureutilisation of tax losses and theagreement with regional tax authoritiesof corporate tax computations.
Deferred Tax
A deferred tax asset and liability arerecorded within the financialstatements at 31 December 2007 of£7.1m and £98.1m respectively.These balances are derived fromassumptions which include the futureutilisation of trading losses andprovisions at assumed tax rates.
Share Based Payments
The estimated cost of grants ofequity instruments is spread evenlyover the vesting period. The actuarialassumptions used in determiningthe charge to income are set out innote 37.
Provisions
Provisions amounting to £19.9m areheld on balance sheet at the yearend. These are based on Directors’estimates of the future cost of currentobligations.
Primary Risks and UncertaintiesFacing the Business
The Group has an established riskmanagement monitoring and reviewprocess described in the CorporateGovernance report on pages 34 to 38.The process requires all businesses toidentify, evaluate and monitor risksand take steps to reduce, eliminate ormanage the risk. These risks arereviewed by the board three times a
year. In addition Risk Management isan agenda item at all Board meetings.
The primary risks and uncertaintiesfacing the business which could havea material adverse impact on theGroup include:
Commodity prices – Although notunder the control of the Company a material movement in commodity pricing could impactdemand for the Group’s products and services.
Effective control over subsidiaries –Group subsidiaries operate within aGroup framework with a degree ofautonomy vested in localmanagement. The operations ofsubsidiaries are subject to regularchecking by management togetherwith external and internal audit.
Health, Safety and Environmental(“HS&E”) – The adherence to GroupHS&E policy, local regulations andcompliance is discussed and reportedat all Board meetings. There is regularHS&E compliance reporting to theBoard.
Loss of key executives –Remuneration packages are regularlyreviewed to ensure key executivesand senior management are properlyremunerated.
Dennis ProctorChief Executive
Dennis ClarkFinance Director
Business Review
Assumption 2007 2006
Rate of inflation 3.5% 3.1%
Discountrate 5.7% 5.1%
Expected futurelifetime (yrs) 23.7 20.9
Expected future lifetime is the number ofyears a 65 year old male is expected tolive based on current mortality tables.

a n n u a l r e p o r t & a c c o u n t s t w o t h o u s a n d & s e v e n 15a n n u a l r e p o r t & a c c o u n t s t w o t h o u s a n d & s e v e n 15
a n n u a l r e p o r t & a c c o u n t s t w o t h o u s a n d & s e v e n16
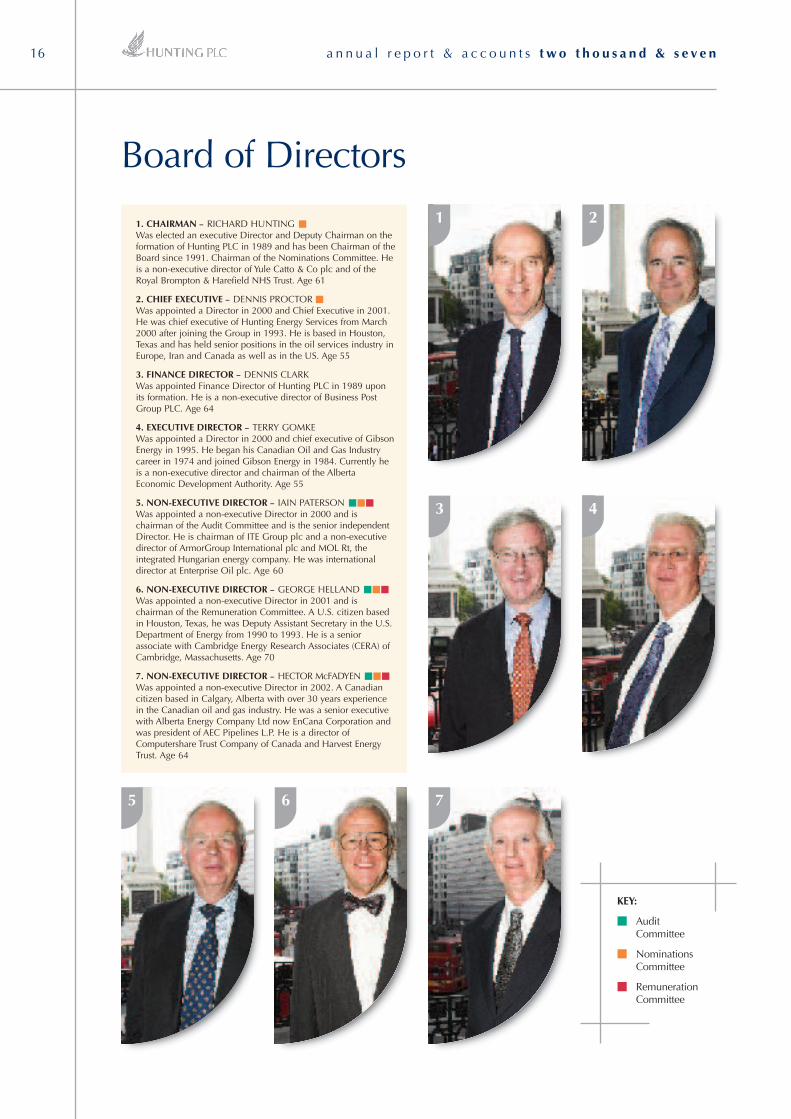
1. CHAIRMAN – RICHARD HUNTING ■Was elected an executive Director and Deputy Chairman on theformation of Hunting PLC in 1989 and has been Chairman of theBoard since 1991. Chairman of the Nominations Committee. Heis a non-executive director of Yule Catto & Co plc and of theRoyal Brompton & Harefield NHS Trust. Age 61
2. CHIEF EXECUTIVE – DENNIS PROCTOR ■Was appointed a Director in 2000 and Chief Executive in 2001.He was chief executive of Hunting Energy Services from March2000 after joining the Group in 1993. He is based in Houston,Texas and has held senior positions in the oil services industry inEurope, Iran and Canada as well as in the US. Age 55
3. FINANCE DIRECTOR – DENNIS CLARKWas appointed Finance Director of Hunting PLC in 1989 uponits formation. He is a non-executive director of Business PostGroup PLC. Age 64
4. EXECUTIVE DIRECTOR – TERRY GOMKEWas appointed a Director in 2000 and chief executive of GibsonEnergy in 1995. He began his Canadian Oil and Gas Industrycareer in 1974 and joined Gibson Energy in 1984. Currently heis a non-executive director and chairman of the AlbertaEconomic Development Authority. Age 55
5. NON-EXECUTIVE DIRECTOR – IAIN PATERSON ■■■Was appointed a non-executive Director in 2000 and ischairman of the Audit Committee and is the senior independentDirector. He is chairman of ITE Group plc and a non-executivedirector of ArmorGroup International plc and MOL Rt, theintegrated Hungarian energy company. He was internationaldirector at Enterprise Oil plc. Age 60
6. NON-EXECUTIVE DIRECTOR – GEORGE HELLAND ■■■Was appointed a non-executive Director in 2001 and ischairman of the Remuneration Committee. A U.S. citizen basedin Houston, Texas, he was Deputy Assistant Secretary in the U.S.Department of Energy from 1990 to 1993. He is a seniorassociate with Cambridge Energy Research Associates (CERA) ofCambridge, Massachusetts. Age 70
7. NON-EXECUTIVE DIRECTOR – HECTOR McFADYEN ■■■Was appointed a non-executive Director in 2002. A Canadiancitizen based in Calgary, Alberta with over 30 years experiencein the Canadian oil and gas industry. He was a senior executivewith Alberta Energy Company Ltd now EnCana Corporation andwas president of AEC Pipelines L.P. He is a director ofComputershare Trust Company of Canada and Harvest EnergyTrust. Age 64
Board of Directors
KEY:
■ AuditCommittee
■ NominationsCommittee
■ RemunerationCommittee
1 2
3 4
765
a n n u a l r e p o r t & a c c o u n t s t w o t h o u s a n d & s e v e n 17a n n u a l r e p o r t & a c c o u n t s t w o t h o u s a n d & s e v e n 17
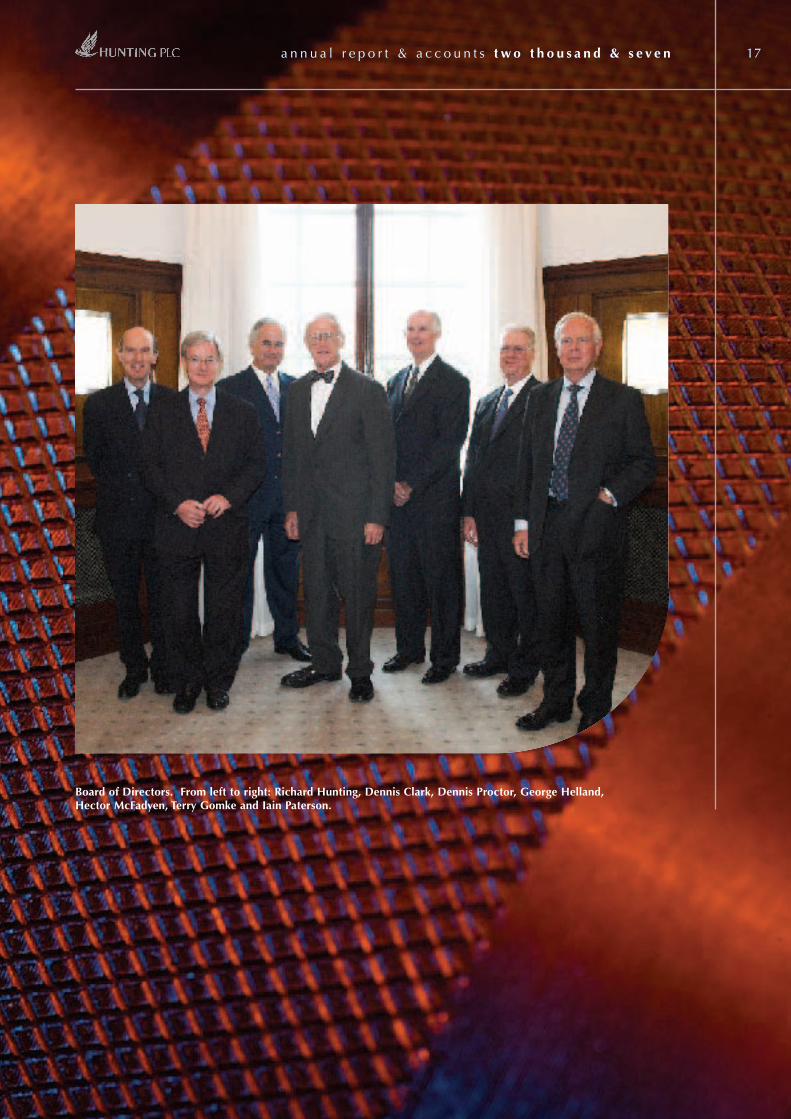
Board of Directors. From left to right: Richard Hunting, Dennis Clark, Dennis Proctor, George Helland,Hector McFadyen, Terry Gomke and Iain Paterson.
a n n u a l r e p o r t & a c c o u n t s t w o t h o u s a n d & s e v e n18
Report of the Directors
The Directors present their report, together with the audited financial statements for the year ended 31 December
2007.
Business Review and Principal ActivitiesThe Company is an industrial holding company, whose subsidiaries are primarily involved in international oil and
gas services. The Business Review, encompassing the Chief Executive’s Review and the Finance Director’s Review on
pages 4 to 14 together with the Chairman’s Statement on page 2, reports on the activities during the year ended
31 December 2007 and likely future developments. Details of the Company’s principal subsidiary and associated
undertakings are set out in note 46.
ResultsThe results of the Group are set out in the Consolidated Income Statement on page 47.
DividendsThe final dividend for 2006 of 5.2p per share (2005 – 4.0p) was paid on 2 July 2007 and on 21 November 2007 the
2007 interim dividend of 2.55p per Ordinary share was paid (2006 – 2.3p). The Directors recommend a final
Ordinary dividend of 5.7p per share (2006 – 5.2p) payable on 1 July 2008 to shareholders on the register at 30 May
2008.
DirectorsBrief biographies of the Directors are shown on page 16.
In accordance with the Articles of Association, Dennis Proctor and George Helland retire by rotation at the Annual
General Meeting and, being eligible, offer themselves for re-election. In addition, Richard Hunting offers himself for
re-election in accordance with the Combined Code on Corporate Governance.
No Director during the year had a material interest in any contract of significance to which either the Company or any
of its subsidiaries were a party. Directors’ interests in the shares of the Company are shown on pages 30 and 31. As at
31 December 2007, no Director of the Company had any beneficial interest in the shares of subsidiary companies.
Directors’ and Officers’ Liability InsuranceThe Company maintains insurance against certain liabilities which could arise from a negligent act or a breach of
duty by its Directors and officers in the discharge of their duties.
Principal AcquisitionsDuring 2007, the Group made the following six acquisitions, all of which were in Canada and all of which were for
a cash consideration only: Del’s Propane Ltd on 1 February for a consideration of £2.8m; Western Propane and Gas
Services on 31 May for £1.3m; Boychuk Energy Inc on 1 June for £6.2m; Rev Fluids Solutions Inc on 1 September
for £2.5m; MP Energy Partnership on 1 October for £8.8m and on 2 October, Hunting Oryx Ltd was acquired for
£8.6m, of which £1.0m is deferred. All the acquisitions were for 100% of the share capital except MP Energy
Partnership, which was an acquisition of its partnership units. Further details are provided in note 38 to the accounts.
a n n u a l r e p o r t & a c c o u n t s t w o t h o u s a n d & s e v e n 19
Report of the Directors continued
DisposalsOn 12 July 2007, the Group disposed of its interests in Aero Sekur SpA, its former Italian subsidiary, for a
consideration of £2.0m. Further details are provided in note 39 to the accounts.
Major ShareholdingsAs at 12 February 2008, major shareholdings in the Ordinary shares of the Company, other than Directors’ interests,
notified to the Company in accordance with the Disclosure and Transparency Rules of the Financial Services
Authority, were as follows:
Percentage
Number of of issued
Ordinary Ordinary
Notes shares shares
Legal & General Investment Management 11,443,226 8.70
Hunting Investments Limited (i) 10,884,743 8.28
AXA S.A. and Group Companies 9,387,047 7.14
Slaley Investments Limited 6,411,679 4.88
F Godson – as trustee (ii) 6,155,089 4.68
Schroder Investment Management 5,580,100 4.24
DRL Hunting 199,910
– other beneficial (iii) 2,484,583
– as trustee (ii) 2,549,117
5,233,610 3.98
Globeflex Capital 5,146,384 3.91
Liontrust Asset Management 5,055,126 3.84
Prudential PLC (iv) 4,963,619 3.77
Barclays Global Investors 4,098,888 3.12
JP Morgan Chase and Co. 4,045,079 3.08
JA Trafford – as trustee (ii) 3,974,200 3.02
Notes:
(i) Included in the holding are 9,437,743 Ordinary shares held by Huntridge Limited, a wholly owned subsidiary
of Hunting Investments Limited. Neither of these companies are owned by Hunting PLC, either directly or
indirectly.
(ii) After elimination of duplicated holdings, the total Hunting family trustee interests shown above amount to
6,458,783 Ordinary shares.
(iii) Arise because DRL Hunting and his children are or could become beneficiaries under the relevant family trusts
of which DRL Hunting is a trustee.
(iv) Held by certain of its subsidiaries.
a n n u a l r e p o r t & a c c o u n t s t w o t h o u s a n d & s e v e n20
Corporate Social ResponsibilityDetails of the Group’s policies on employment, health, safety and the environment are contained within the Business
Review on page 5 and within the Corporate Social Responsibility Report on pages 24 and 25.
Research and DevelopmentGroup subsidiaries undertake, where appropriate, research and development to meet particular market and product
needs. The amount incurred and written off by the Group during the year was £0.7m (2006 – £1.0m).
Charitable and Political ContributionsDuring the year the Group donated £57,000 (2006 – £49,000) to UK charitable organisations and £213,000 (2006
– £137,000) to overseas charities. No UK political donations were made (2006 – £nil).
Property, Plant and EquipmentDetails of movements in property, plant and equipment are shown in note 12 to the financial statements.
Annual General Meeting The Annual General Meeting of the Company will be held on Wednesday 23 April 2008 at The Royal Automobile
Club, 89 Pall Mall, London SW1Y 5HS commencing at 10.30 a.m.
Further details of resolutions the Company is seeking for the allotment, issue and purchase of its Ordinary shares are
set out in the letter containing details of the Annual General Meeting which accompanies the Notice of the Annual
General Meeting to be held on 23 April 2008.
Powers of the Directors Subject to the Company’s Memorandum and Articles of Association, UK legislation and any directions prescribed by
ordinary resolution of the Company in general meeting, the business of the Company is managed by the Board. The
Directors have been authorised to allot and issue Ordinary shares and to make market purchases of the Company’s
Ordinary shares. These powers are exercised under authority of resolutions of the Company passed at its Annual
General Meeting.
Share Capital The Company’s issued share capital comprises a single class of share capital which is divided into Ordinary shares
of 25 pence each. Details of the share capital of the Company are set out in note 30 to the financial statements. The
rights and obligations attaching to the Company’s Ordinary shares are set out in the Company’s Articles of
Association, copies of which can be obtained from Companies House in the UK or by writing to the Company
Secretary. Subject to applicable statutes, shares may be issued with such rights and restrictions as the Company may
by ordinary resolution decide, or (if there is no such resolution or so far as it does not make specific provision) as
the Board may decide. Holders of Ordinary shares are entitled to speak at general meetings of the Company, to
appoint one or more proxies and, if they are corporations, corporate representatives and to exercise voting rights.
Holders of Ordinary shares may receive a dividend and on a liquidation may share in the assets of the Company.
Holders of Ordinary shares are entitled to receive the Company’s annual report and accounts. Subject to meeting
certain thresholds, holders of the Ordinary shares may require a general meeting of the Company to be held or the
proposal of resolutions at Annual General Meetings.
Report of the Directors continued
a n n u a l r e p o r t & a c c o u n t s t w o t h o u s a n d & s e v e n 21
Report of the Directors continued
Authority to Allot Shares and Disapply Statutory Pre-Emption Rights The Directors will seek to renew their authorities to allot unissued shares and to disapply statutory pre-emption rights
at the Annual General Meeting to be held on 23 April 2008.
Purchase of Own Shares At the Annual General Meeting held on 25 April 2007, the Company was given authority to purchase up to
13,106,858 of its Ordinary shares until the date of its next Annual General Meeting. No purchases were made during
the year. The Directors will be seeking a new authority for the Company to purchase its Ordinary shares at the Annual
General Meeting to be held on 23 April 2008. Any shares purchased will be cancelled and the number of Ordinary
shares in issue reduced accordingly.
Voting Rights and Restrictions on Transfer of Shares On a show of hands at a general meeting of the Company every holder of Ordinary shares present in person or by
proxy and entitled to vote has one vote and on a poll every member present in person or by proxy and entitled to
vote has one vote for every Ordinary share held. Further details regarding voting at the Annual General Meeting can
be found in the notes to the Notice of the Annual General Meeting. None of the Ordinary shares carry any special
rights with regard to control of the Company. Proxy appointments and voting instructions must be received by the
Company’s Registrars not later than 48 hours before a general meeting. A shareholder can lose his entitlement to vote
at a general meeting where that shareholder has been served with a disclosure notice and has failed to provide the
Company with information concerning interests in those shares.
The Directors may refuse to register a transfer of a certificated share which is not fully paid, provided that the refusal
does not prevent dealings in shares in the Company from taking place on an open and proper basis. The Directors
may also refuse to register a transfer of a certificated share unless the instrument of transfer: (i) is lodged, duly
stamped (if stampable), at the registered office of the Company or any other place decided by the Directors
accompanied by the certificate for the share to which it relates and/or such other evidence as the Directors may
reasonably require to show the right of the transferor to make the transfer; (ii) is in respect of only one class of shares;
(iii) is in favour of a person who is not a minor, bankrupt or a person of unsound mind; or (iv) is in favour of not more
than four transferees.
Transfers of uncertificated shares must be carried out using CREST and the Directors can refuse to register a transfer
of an uncertificated share in accordance with the regulations governing the operation of CREST.
The Directors may decide to suspend the registration of transfers, for up to 30 days a year, by closing the register of
shareholders. The Directors cannot suspend the registration of transfers of any uncertificated shares without obtaining
consent from CREST.
There are no restrictions on the transfer of Ordinary shares in the Company other than:
• certain restrictions may from time to time be imposed by laws and regulations (for example insider trading
laws);
• pursuant to the Company’s share dealing code whereby the Directors and certain employees of the Company
require approval to deal in the Company’s shares; and

a n n u a l r e p o r t & a c c o u n t s t w o t h o u s a n d & s e v e n22
• where a shareholder with at least a 0.25% interest in the Company’s certificated shares has been served with
a disclosure notice and has failed to provide the Company with information concerning interests in those
shares.
The Company is not aware of any agreements between shareholders that may result in restrictions on the transfer of
Ordinary shares or on voting rights.
Articles of Association The Company’s Articles of Association may only be amended by special resolution at a general meeting of the
shareholders. At the Annual General Meeting to be held on 23 April 2008, a resolution will be put to shareholders
proposing the adoption of new Articles of Association. A summary of the principal proposed changes can be found
in the Appendix to the Notice of Annual General Meeting.
Significant Agreements The Company is a party to certain funding agreements in which the counterparties can determine whether or not tocancel the agreements where there has been a change of control of the Company.
The service agreements of the executive Directors include provisions that provide for compensation for loss of officeor employment as a result of a change of control. Further details of the Directors’ service contracts can be found inthe Remuneration Committee’s Report on pages 28 and 29.
Appointment and Replacement of Directors Rules for the appointment and replacement of Directors are set out in the Company’s Articles of Association.Directors are appointed by the Company by ordinary resolution at a general meeting of holders of Ordinary sharesor by the Board on the recommendation of the Nomination Committee. The Company may also remove a Director.The Corporate Governance Report sets out further details of the requirements for re-election of Directors on page 34.In addition, further details of the workings of the Nomination Committee are set out on page 35.
Policy on Payment of CreditorsThe Company’s and Group’s policy is to pay all creditors in accordance with agreed terms of business. The Companyitself has no substantial trade payables. The total amount of Group trade payables falling due within one year at31 December 2007 represents 40 days worth (2006 – 33 days), as a proportion of the total amount invoiced bysuppliers during the year ended on that date.
Statement on Disclosure of Information to AuditorsIn accordance with Companies Act requirements all Directors in office as at the date of this report have confirmedso far as they are aware there is no relevant audit information of which the Company’s auditors are unaware andeach Director has taken all reasonable steps necessary in order to make himself aware of any relevant auditinformation and to establish that the Company’s auditors are aware of that information.
Going ConcernThe Directors, after making enquiries and on the basis of current financial projections and the facilities available,believe that the Company and the Group have adequate financial resources to continue in operation for theforeseeable future. For this reason, they continue to adopt the going concern basis in preparing the financialstatements.
Report of the Directors continued
a n n u a l r e p o r t & a c c o u n t s t w o t h o u s a n d & s e v e n 23
Report of the Directors continued
AuditorsPricewaterhouseCoopers LLP have indicated their willingness to continue in office as auditors. A resolution to reappoint
them as auditors to the Company will be proposed at the Annual General Meeting to be held on 23 April 2008.
By order of the BoardPeter RoseCompany Secretary
28 February 2008
a n n u a l r e p o r t & a c c o u n t s t w o t h o u s a n d & s e v e n24
IntroductionThis report describes the policies and procedures put in place by the board to ensure that the Company operates in
a safe and responsible manner and where practical takes steps to protect the environment.
The Company acknowledges and is committed to its corporate social responsibilities within the areas in which it
operates. Its contribution and involvement is determined by the regional custom and best practice in those locations
and is subject to regular monitoring and review by the board and divisional management.
Employment and TrainingThe Company recognises that its success and reputation is dependent upon the efforts and the integrity of its people.
It encourages and promotes an awareness of the financial and economic factors affecting the performance of the
Company through regular communication and consults with employees to the degree relevant to local conditions.
• As a responsible employer, full and fair consideration is given to applications for positions from disabled persons
and to their training and career advancement. Every effort is made to retain in employment those who become
disabled while employed by the Company.
• Appropriate training is provided to employees to suit their particular work environment within the Company.
• Communication with employees is undertaken through a variety of media including the bi-annual Hunting
Review magazine.
Health and SafetyThe Company is committed to achieving and maintaining the highest standards of safety for its employees,
customers, suppliers and the public. The Group operates a range of facilities and installations and each location has
in place a tailored health and safety programme designed to at a minimum comply with local regulatory
requirements. All subsidiaries target continuous improvement to their Health and Safety Standards. The Health and
Safety policies include:
• Regular review and audit of equipment, practices and procedures to assure compliance with prevailing standards
and legislation.
• Accreditation is sought and procedures are aligned with long standing company programmes to internationally
recognised Quality Assurance standards.
• Monitoring is a management task which is documented and reported at each board meeting.
• Appropriate training and education of all staff.
The Chief Executive, who is directly responsible for Health and Safety, presents a Health and Safety report at every
PLC board meeting.
EnvironmentThe Group’s environmental policy is to look for opportunities and adopt practices that create a safer and cleaner
environment. It is particularly sensitive to the challenges for the industry in which it operates. The Group has
programmes in place to monitor environmental impact from its operational activities and remains focused on
ensuring environmental consideration is at the forefront of its business practices.
Corporate Social Responsibility

a n n u a l r e p o r t & a c c o u n t s t w o t h o u s a n d & s e v e n 25
Corporate Social Responsibility continued
Key aspects of the environmental policies include:
• Policies, procedures and practices are in place so that any adverse effects on the environment are reduced to a
practicable minimum.
• The Group encourages the reduction of waste and emissions and promotes awareness of recycled materials and
use of renewable resources.
• Each operating unit develops and implements its own procedures and conducts structured reviews to ensure that
they are maintained and refined.
• Employees are encouraged to pay special regard to environmental concerns in the communities in which the
Group operates.
Regulatory EnvironmentThe Company is listed on the London Stock Exchange and is subject to regulation by the Financial Services Authority
in the United Kingdom as well as compliance with UK Company Law. With the aim of maintaining standards and to
comply with customer trading requirements a high proportion of our operating facilities are either ISO or API
registered or subject to other similar registrations or industry qualifications.
Business EthicsThe Group targets and encourages the highest standards of integrity and honesty in all business dealings. The
objective is to maintain and enhance the reputation of the Company and enforce ethical dealings with customers
and suppliers.
The Board has established “whistle blowing” procedures for any employee to raise in confidence any concerns they
may have about possible financial improprieties or other matters with either the Chairman of the Board or the senior
independent Director. Details of the procedure have been communicated to all employees.
Hunting in the CommunitySubsidiaries support a range of charitable and community projects in their local areas. Of particular note in 2007,
was the annual Hunting Art competition held in Houston, Texas, which raised in excess of US$100,000 for SIRE, a
local charity assisting disabled people.
Dennis Proctor
Chief Executive
28 February 2008
a n n u a l r e p o r t & a c c o u n t s t w o t h o u s a n d & s e v e n26
Remuneration CommitteeThe Remuneration Committee of the Board (“the Committee”), which met four times in 2007, comprises the non-executive Directors of the Company.
George Helland (chairman), Iain Paterson and Hector McFadyen all served throughout the year. The Committee isresponsible for determining in particular the remuneration of the Chairman and executive Directors, including thesetting of annual performance targets and participation in the executive share option plans.
During the year Hewitt Bacon & Woodrow, who were appointed by the Committee, provided advice and assistanceon Directors’ remuneration, executive incentive plans and share scheme matters. The Company also received adviceon various remuneration matters during the year from Buck Consultants Limited.
The Board determines fees payable to the non-executive Directors who do not participate in the Group’s share plansor receive any other benefits.
The constitution and operation of the Committee during the year has complied with the Combined Code’s guidanceon Directors’ remuneration, except for the recommended period of notice for executive Directors as referred tobelow.
Remuneration PolicyThe Company’s policy on remuneration aims to ensure that the individual rewards and incentives are competitiveand appropriate to attract, motivate and retain executives of high ability, experience and commitment.
The executive Directors’ remuneration packages consist of an annual salary, health cover, and where appropriate,car and fuel benefits, life and disability insurance, an annual performance linked cash bonus plan, pensioncontributions, participation in performance-linked share plans and a performance-linked long term incentive plan.Performance targets are established to achieve consistency with the interests of shareholders with an appropriatebalance between long and short-term goals.
Basic salaries are reviewed annually. In considering appropriate salary levels, the Committee takes into account theremuneration paid by comparable companies in terms of asset size, revenues, profits, the number of employees,market capitalisation and the complexity and international spread of the Group’s operations as well as applicablerates of inflation. The Company’s practice is to target basic salaries at the mid-market level in the appropriate marketfor the executive position. In determining executive salaries consideration is given to their experience and generalperformance level.
The Company operates an executive share option scheme to provide longer term incentives for executives andexecutive Directors. This reflects market practice, provides longer term focus and aligns the interests of executivesand shareholders. The award of options under the scheme are performance related and are principally aligned to thebasic salary of the Director. The right to exercise an option is subject to the growth performance of the Company’sbasic earnings per share (“BEPS”) over a three year period in comparison to that of comparator companies, whocomprise UK, US and Canadian oil and gas services companies. No shares are exercisable if the growth in BEPS doesnot exceed the rate of inflation by at least 3% per annum over the three year period. The number of sharesexercisable, expressed as a percentage, by a Director can range from nil if the Company’s performance is below themedian level, to 40% at the median level and up to 100% if the Company’s performance is between the median andupper quartile levels of the comparator group.
The Company’s Long Term Incentive Plan (“LTIP”) is intended to link key executives’ remuneration to the long-termsuccess and performance of the Group.
The Remuneration Committee’s Report
a n n u a l r e p o r t & a c c o u n t s t w o t h o u s a n d & s e v e n 27
The Remuneration Committee’s Report continued
The LTIP is a performance-linked plan with an incentive pool which for 2007 is calculated using the sum of theGroup’s after tax operating income after deducting a charge for the after tax cost of capital at a rate of 7% on averageshareholders’ funds. The incentive has two components, the first being 2% of the absolute value added, and thesecond being 5% of the incremental value added. These performance conditions align the interests of the executiveswith those of the Group and its shareholders and will only produce value to the participants if value is created forthe Group.
Awards are determined for each participant at the beginning of a three-year performance cycle and are settled at theend of each cycle either in shares or in cash. The award for each participant is calculated as a percentage of theincentive pool resulting from the performance of the business over the performance cycle as determined by theCommittee.
At 31 December 2007 the pool available for distribution has increased from £4,526,761 to £6,219,577 following anincrease in the pool of £1,692,816.
Following vesting, the amount payable under any single award may not exceed a certain multiple of the basic annualsalary of each participant as at the relevant award date. The maximum award levels under the LTIP rules as a multipleof base salaries are 3.5 times annual salary for the Chief Executive and 1.75 times annual salary for other executiveDirectors. As the pool was greater than these maximum levels, the awards were restricted to these multiples. Theamount of the pool awarded to all participants as a result of this restriction was £3,542,693.
In 2007 an annual performance-linked cash bonus scheme was in place for the executive Directors. The scheme,which is not pensionable, is designed to provide an incentive and reward for performance and reflects thecompetitive markets in which the Group conducts its business.
Dennis Proctor and Dennis Clark are eligible for a bonus under the scheme when 80% of the Group budgeted pretax profit is achieved. Below this level no bonus is payable. The amount payable under the scheme whenperformance achieves the budgeted profit before tax and return on capital targets, is 65% of base salary for DennisProctor and 50% of base salary for Dennis Clark. When actual results achieve 120% of these performance targetsDennis Proctor and Dennis Clark are entitled to a maximum cash bonus of 130% and 100% of base salaryrespectively. Terry Gomke has a similar scheme based on the same percentages as set out above for Dennis Clark.However his entitlement is based on the results of Gibson Energy.
Richard Hunting has no bonus entitlement and his remuneration and that of the non-executive Directors is whollynon-performance related.
The current balance between fixed and variable remuneration is approximately 28% deriving from salary andbenefits and 72% from variable incentives.
Bonus schemes are also in place for the majority of Group employees.

a n n u a l r e p o r t & a c c o u n t s t w o t h o u s a n d & s e v e n28
Performance graphThe graph below compares the total shareholder return for an investment in Hunting PLC Ordinary shares with the
return for the same investment in the FTSE Oil and Gas index commencing on 31 December 2002.
Total Shareholder Return vs FTSE Oil & Gas Index
In the opinion of the Directors the FTSE Oil and Gas Index is the most appropriate index against which the total
shareholder return of the Company should be compared, because this is the sector in which the Company is quoted.
Directors’ Service ContractsThe Company’s policy on executive Directors’ contracts is to comply with the guidance in the Combined Code. Thecontracts of Richard Hunting, Dennis Proctor and Dennis Clark are in compliance with that guidance. Terry Gomke’scontract pre-dates this policy and presently the Remuneration Committee does not consider it appropriate to seek toamend his contract which is in accordance with Canadian practice.
All the Directors’ Service Agreements contain standard provisions allowing the Company to terminate summarily forcause, such as gross misconduct.
Dennis Proctor entered into an Employment Agreement with Hunting Energy Services Inc, a wholly ownedsubsidiary of the Company, on 7 February 2001. This Agreement is governed by the laws of the State of Delaware,USA. Under the terms of the Agreement both Hunting Energy Services Inc and Dennis Proctor are required to giveone year’s notice of termination.
The Agreement contains a pay in lieu of notice clause which provides for payment of base salary, performance bonusand vacation pay based on an annual entitlement of four weeks. There are special provisions on a change of control.These provide for payment of one year’s base salary together with an amount equal to the average performance bonuspaid in the previous two years. In addition, Dennis Proctor would be entitled to continue to participate in the groupinsurance programmes for one year following the change of control and, unless otherwise provided in the relevantoption agreement, all stock options and stock based awards granted to him will become exercisable at the date ofthe change of control and will remain exercisable for one year.
900
800
700
600
500
400
300
200
100
0Dec 02 Dec 03 Dec 04 Dec 05 Dec 06 Dec 07
Hunting PLC total FTSE Oil & Gas Index Source: Hewitt Bacon and Woodrow
900
800
700
600
500
400
300
200
100
0
shareholder return
December 2002 = 100
The Remuneration Committee’s Report continued
a n n u a l r e p o r t & a c c o u n t s t w o t h o u s a n d & s e v e n 29
The Remuneration Committee’s Report continued
Richard Hunting and Dennis Clark both entered into Service Agreements with the Company on 15 December 1989.These were amended effective 1 March 2004 whereby both the Company and the Directors are required to give oneyear’s notice of termination.
Under the terms of the Service Agreements, the Company reserves the right to pay them in lieu of notice (whethergiven by the Company or by them). The payment in lieu comprises salary only for Richard Hunting and salary andbonus only for Dennis Clark. The Company also has the option to put Richard Hunting and Dennis Clark on paidleave of absence on payment of a sum equivalent to salary for Richard Hunting and salary and bonus for DennisClark (based on the previous 12-month period), subject to them complying with the terms of the Service Agreement.These conditions also apply on termination following a change of control.
Terry Gomke has an Employment Contract with Gibson Energy Ltd (“Gibson”) entered into on 20 May 1999. Thiscontract is governed by the laws of the Province of Alberta and the federal laws of Canada. Under the terms of thecontract, Terry Gomke is generally required to give 180 days notice of termination. However, if he resigns to join anorganisation which is not a direct competitor of Gibson, he is only required to give 90 days notice. If, at the time heresigns, a bonus has been declared but not paid to him, he shall be entitled to be paid such bonus. If the bonus hasnot been declared at the date of resignation, he shall have no entitlement to it.
Gibson may terminate the contract at any time without prior notice. However, Gibson would have to pay Terry Gomketwice his annual salary, being his base salary, vehicle allowance, regular remuneration (excluding health insurancebenefits and bonus) and a 10% gross up on his base salary in lieu of benefits. If the bonus has been declared at thedate of termination, but not paid, it remains payable. In addition, he would be entitled to receive two further years’bonuses. These would be payable at the same time as bonuses for those years are paid to other executives and shallbe calculated using the same percentage of pre-tax profits applied to him in the year prior to the termination of hisemployment. Any payments made under these provisions will be subject to mitigation. Special terminationprovisions apply where there is a change of control or where Terry Gomke terminates the contract within 90 days ofa material breach or material change to the terms of his contract without his consent. In such circumstances, hewould be entitled to twice his annual salary (as described above) and twice the average bonus paid to him in theprevious two years. No reduction for mitigation would be applied in this case.
Non-executive Directors are initially appointed for a fixed term of three years and thereafter, subject to approval ofthe Board, for a further three-year term. In the event of early termination by the Company non-executive Directorsare not entitled to receive compensation for loss of office. George Helland was reappointed for a third three yearterm from 1 October 2007.
Non-executive Director Date of first Unexpired term fromappointment 28 February 2008
George Helland 1 October 2001 31 monthsHector McFadyen 4 September 2002 6 monthsIain Paterson 6 June 2000 15 months
The Company has authorised the executive Directors to undertake non-executive directorships outside of the Group provided these do not interfere with their primary duties. Executive Directors holding external non-executivepositions during the year were Richard Hunting and Dennis Clark. Their remuneration in 2007, which they areentitled to retain, was £36,000 and £30,000 respectively.
a n n u a l r e p o r t & a c c o u n t s t w o t h o u s a n d & s e v e n30
The following is audited:
EmolumentsIn the year to 31 December 2007, the highest paid Director received total emoluments of £708,000 as shown below:
Emoluments received by each Director during the year were as follows:
Salary Annual 2007 2006and fees bonus Benefits Total Total
£000 £000 £000 £000 £000
Executive DirectorsRichard Hunting 168 – 12 180 175Dennis Proctor 300 390 18 708 732Dennis Clark 288 288 15 591 566Terry Gomke 251 251 17 519 511
Non-executive DirectorsGeorge Helland 44 – – 44 35Hector McFadyen 38 – – 38 32Iain Paterson 44 – – 44 35
Total remuneration 1,133 929 62 2,124 2,086
Analysed as:Executive Directors 1,007 929 62 1,998 1,984Non-executive Directors 126 – – 126 102
Total remuneration 1,133 929 62 2,124 2,086
Benefits comprise company car and fuel benefits, subscriptions and life and disability insurance.
The above remuneration of the two non-UK executive Directors was paid in their local currencies as follows:
Salary Annual 2007 2006and fees bonus Benefits Total Total
000 000 000 000 000Dennis Proctor US$ 601 781 36 1,418 1,346Terry Gomke C$ 538 538 36 1,112 1,066
Directors’ share interestsThe interests of Directors in the issued Ordinary shares of the Company, were as follows:
31 December 2007 31 December 2006Ordinary Ordinary
shares of 25p shares of 25p
Executive Directors:Richard Hunting 736,241 756,241
as trustee 1,390,519 1,452,429Dennis Proctor 607,071 422,448Dennis Clark 239,973 239,973Terry Gomke 239,474 239,474Non-executive Directors:George Helland 18,750 18,750Hector McFadyen 25,000 25,000Iain Paterson 2,500 2,500
The Remuneration Committee’s Report continued
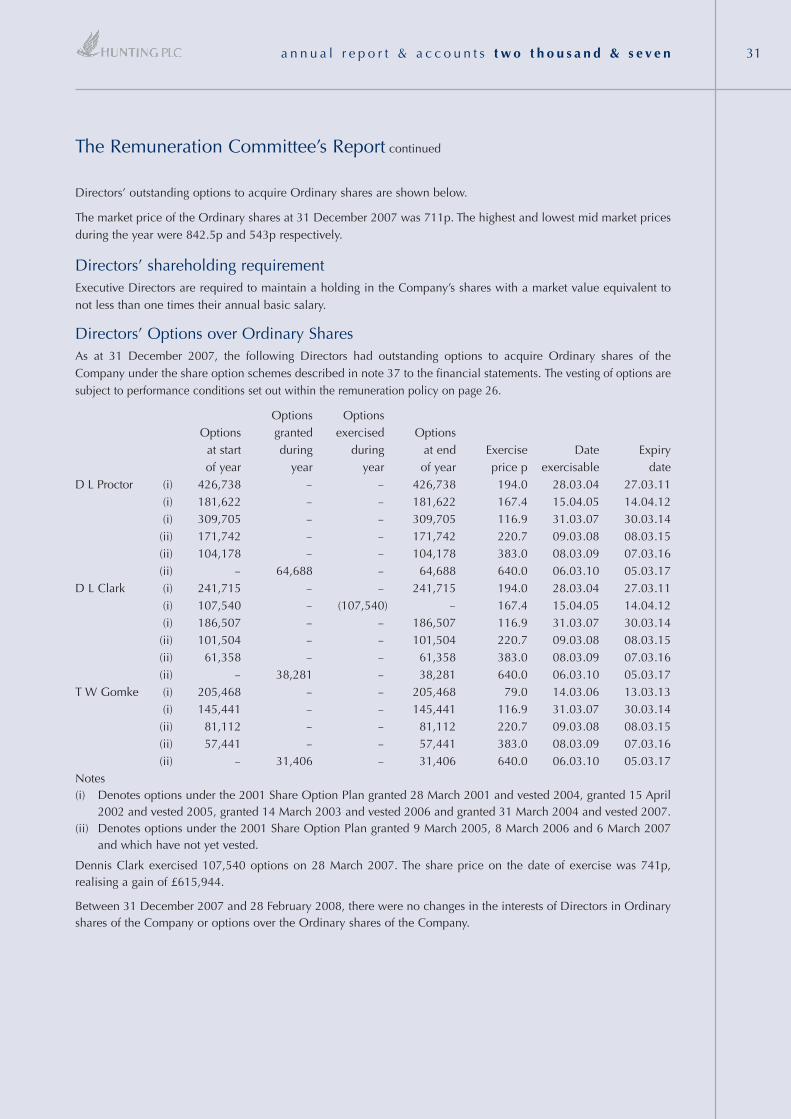
a n n u a l r e p o r t & a c c o u n t s t w o t h o u s a n d & s e v e n 31
The Remuneration Committee’s Report continued
Directors’ outstanding options to acquire Ordinary shares are shown below.
The market price of the Ordinary shares at 31 December 2007 was 711p. The highest and lowest mid market pricesduring the year were 842.5p and 543p respectively.
Directors’ shareholding requirementExecutive Directors are required to maintain a holding in the Company’s shares with a market value equivalent tonot less than one times their annual basic salary.
Directors’ Options over Ordinary SharesAs at 31 December 2007, the following Directors had outstanding options to acquire Ordinary shares of theCompany under the share option schemes described in note 37 to the financial statements. The vesting of options aresubject to performance conditions set out within the remuneration policy on page 26.
Options OptionsOptions granted exercised Options
at start during during at end Exercise Date Expiryof year year year of year price p exercisable date
D L Proctor (i) 426,738 – – 426,738 194.0 28.03.04 27.03.11(i) 181,622 – – 181,622 167.4 15.04.05 14.04.12(i) 309,705 – – 309,705 116.9 31.03.07 30.03.14(ii) 171,742 – – 171,742 220.7 09.03.08 08.03.15(ii) 104,178 – – 104,178 383.0 08.03.09 07.03.16(ii) – 64,688 – 64,688 640.0 06.03.10 05.03.17
D L Clark (i) 241,715 – – 241,715 194.0 28.03.04 27.03.11(i) 107,540 – (107,540) – 167.4 15.04.05 14.04.12(i) 186,507 – – 186,507 116.9 31.03.07 30.03.14(ii) 101,504 – – 101,504 220.7 09.03.08 08.03.15(ii) 61,358 – – 61,358 383.0 08.03.09 07.03.16(ii) – 38,281 – 38,281 640.0 06.03.10 05.03.17
T W Gomke (i) 205,468 – – 205,468 79.0 14.03.06 13.03.13(i) 145,441 – – 145,441 116.9 31.03.07 30.03.14(ii) 81,112 – – 81,112 220.7 09.03.08 08.03.15(ii) 57,441 – – 57,441 383.0 08.03.09 07.03.16(ii) – 31,406 – 31,406 640.0 06.03.10 05.03.17
Notes(i) Denotes options under the 2001 Share Option Plan granted 28 March 2001 and vested 2004, granted 15 April
2002 and vested 2005, granted 14 March 2003 and vested 2006 and granted 31 March 2004 and vested 2007.(ii) Denotes options under the 2001 Share Option Plan granted 9 March 2005, 8 March 2006 and 6 March 2007
and which have not yet vested.
Dennis Clark exercised 107,540 options on 28 March 2007. The share price on the date of exercise was 741p,realising a gain of £615,944.
Between 31 December 2007 and 28 February 2008, there were no changes in the interests of Directors in Ordinaryshares of the Company or options over the Ordinary shares of the Company.
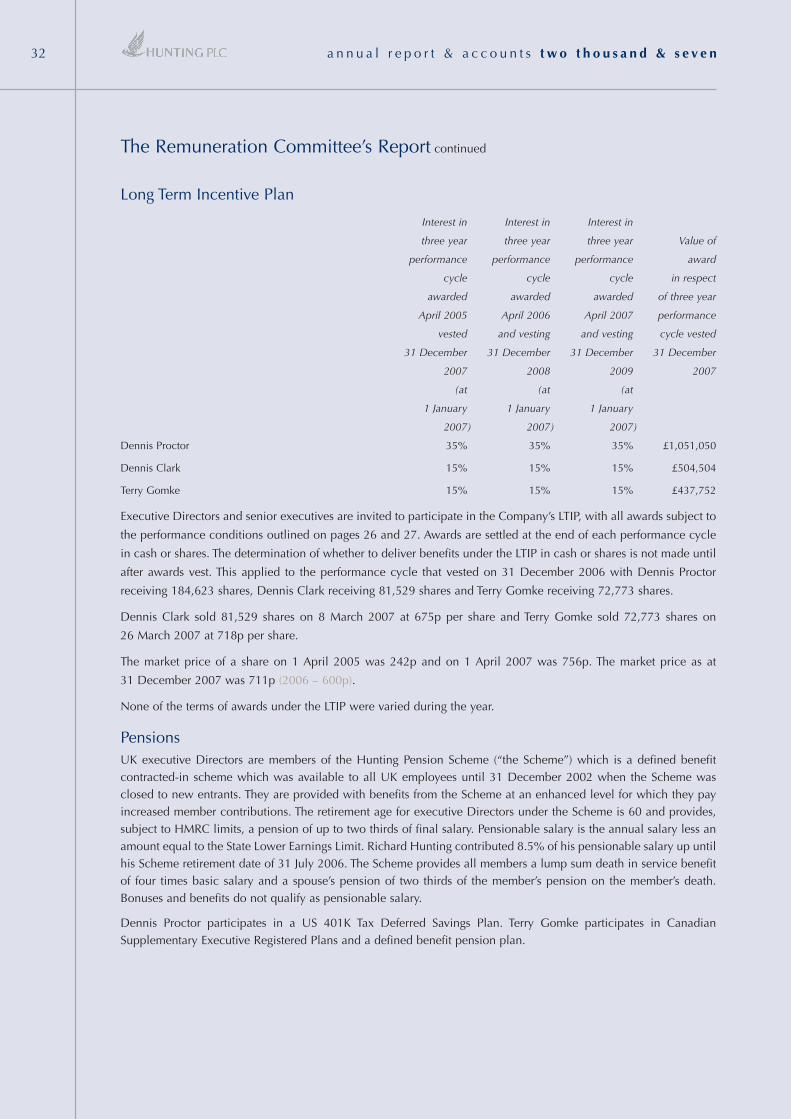
a n n u a l r e p o r t & a c c o u n t s t w o t h o u s a n d & s e v e n32
Long Term Incentive Plan
Interest in Interest in Interest in
three year three year three year Value of
performance performance performance award
cycle cycle cycle in respect
awarded awarded awarded of three year
April 2005 April 2006 April 2007 performance
vested and vesting and vesting cycle vested
31 December 31 December 31 December 31 December
2007 2008 2009 2007
(at (at (at
1 January 1 January 1 January
2007) 2007) 2007)
Dennis Proctor 35% 35% 35% £1,051,050
Dennis Clark 15% 15% 15% £504,504
Terry Gomke 15% 15% 15% £437,752
Executive Directors and senior executives are invited to participate in the Company’s LTIP, with all awards subject to
the performance conditions outlined on pages 26 and 27. Awards are settled at the end of each performance cycle
in cash or shares. The determination of whether to deliver benefits under the LTIP in cash or shares is not made until
after awards vest. This applied to the performance cycle that vested on 31 December 2006 with Dennis Proctor
receiving 184,623 shares, Dennis Clark receiving 81,529 shares and Terry Gomke receiving 72,773 shares.
Dennis Clark sold 81,529 shares on 8 March 2007 at 675p per share and Terry Gomke sold 72,773 shares on
26 March 2007 at 718p per share.
The market price of a share on 1 April 2005 was 242p and on 1 April 2007 was 756p. The market price as at
31 December 2007 was 711p (2006 – 600p).
None of the terms of awards under the LTIP were varied during the year.
PensionsUK executive Directors are members of the Hunting Pension Scheme (“the Scheme”) which is a defined benefitcontracted-in scheme which was available to all UK employees until 31 December 2002 when the Scheme wasclosed to new entrants. They are provided with benefits from the Scheme at an enhanced level for which they payincreased member contributions. The retirement age for executive Directors under the Scheme is 60 and provides,subject to HMRC limits, a pension of up to two thirds of final salary. Pensionable salary is the annual salary less anamount equal to the State Lower Earnings Limit. Richard Hunting contributed 8.5% of his pensionable salary up untilhis Scheme retirement date of 31 July 2006. The Scheme provides all members a lump sum death in service benefitof four times basic salary and a spouse’s pension of two thirds of the member’s pension on the member’s death.Bonuses and benefits do not qualify as pensionable salary.
Dennis Proctor participates in a US 401K Tax Deferred Savings Plan. Terry Gomke participates in CanadianSupplementary Executive Registered Plans and a defined benefit pension plan.
The Remuneration Committee’s Report continued
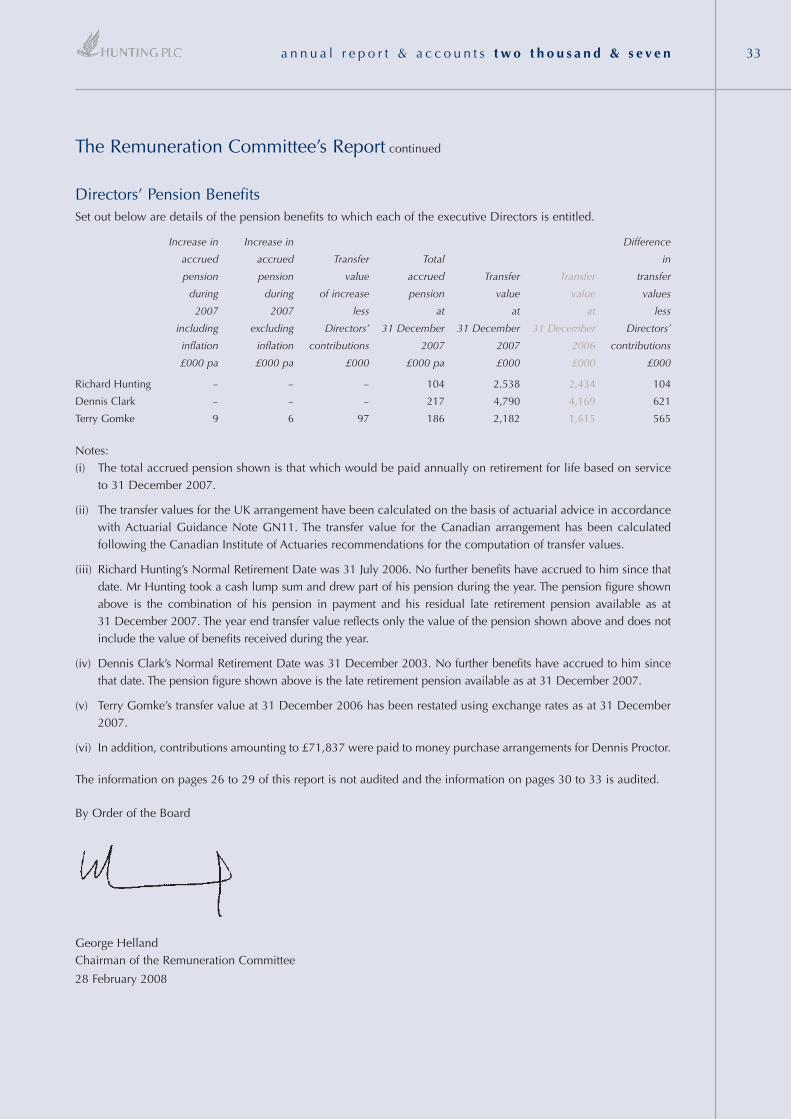
a n n u a l r e p o r t & a c c o u n t s t w o t h o u s a n d & s e v e n 33
The Remuneration Committee’s Report continued
Directors’ Pension BenefitsSet out below are details of the pension benefits to which each of the executive Directors is entitled.
Increase in Increase in Difference
accrued accrued Transfer Total in
pension pension value accrued Transfer Transfer transfer
during during of increase pension value value values
2007 2007 less at at at less
including excluding Directors’ 31 December 31 December 31 December Directors’
inflation inflation contributions 2007 2007 2006 contributions
£000 pa £000 pa £000 £000 pa £000 £000 £000
Richard Hunting – – – 104 2,538 2,434 104
Dennis Clark – – – 217 4,790 4,169 621
Terry Gomke 9 6 97 186 2,182 1,615 565
Notes:(i) The total accrued pension shown is that which would be paid annually on retirement for life based on service
to 31 December 2007.
(ii) The transfer values for the UK arrangement have been calculated on the basis of actuarial advice in accordancewith Actuarial Guidance Note GN11. The transfer value for the Canadian arrangement has been calculatedfollowing the Canadian Institute of Actuaries recommendations for the computation of transfer values.
(iii) Richard Hunting’s Normal Retirement Date was 31 July 2006. No further benefits have accrued to him since thatdate. Mr Hunting took a cash lump sum and drew part of his pension during the year. The pension figure shownabove is the combination of his pension in payment and his residual late retirement pension available as at31 December 2007. The year end transfer value reflects only the value of the pension shown above and does notinclude the value of benefits received during the year.
(iv) Dennis Clark’s Normal Retirement Date was 31 December 2003. No further benefits have accrued to him sincethat date. The pension figure shown above is the late retirement pension available as at 31 December 2007.
(v) Terry Gomke’s transfer value at 31 December 2006 has been restated using exchange rates as at 31 December2007.
(vi) In addition, contributions amounting to £71,837 were paid to money purchase arrangements for Dennis Proctor.
The information on pages 26 to 29 of this report is not audited and the information on pages 30 to 33 is audited.
By Order of the Board
George HellandChairman of the Remuneration Committee
28 February 2008
a n n u a l r e p o r t & a c c o u n t s t w o t h o u s a n d & s e v e n34
Combined CodeThis statement, which has been approved by the Board, reports on the Company’s compliance, other than as reported
below, with the updated Combined Code on Corporate Governance (“the Code”) as issued by the Financial
Reporting Council in June 2006 and how the principles contained within the Code have been applied. Compliance
with the principles relating to Directors’ Remuneration is reflected within the Remuneration Committee’s report on
pages 26 to 33.
The BoardThe Board of Directors currently comprise the Chairman, Chief Executive, two further executive Directors and three
independent non-executive Directors. Iain Paterson is the nominated senior independent non-executive Director.
This composition with a separate Chairman and Chief Executive ensures a balance of responsibilities and authorities.
The Directors together with brief biographical details are identified on page 16. Excluding the Chairman, 50% of the
Board is comprised of independent non-executive directors.
All Directors are subject to re-election by the shareholders at least every three years. The non-executive Directors are
initially appointed for a three year term with subsequent reappointments conditional upon an appraisal and review
process described below. Letters of appointment for each of the non-executive Directors are available from the
Company upon request and their terms of appointment are summarised on page 29. Details of the executive
Directors service contracts are set out on pages 28 and 29. The recommended period in the Code for a Director’s
notice or contract period is one year or less. The Remuneration Committee considers that in one instance a two-year
notice period for an executive Director is appropriate.
All Directors have access to the Company Secretary and to independent professional advice, at the Company’s
expense, in the furtherance of their duties. Directors are encouraged to maintain their skills and knowledge to best
practice standards and where appropriate attend update training courses on relevant topics. The Company Secretary,
through the Chairman, is responsible for keeping the Board informed of Corporate Governance developments and
maintaining corporate awareness of legislative and regulatory changes.
The Board normally meets formally a minimum of five times a year and met five times during 2007, one of which
was held in North America. Meeting dates are set a year in advance. All Directors attended the board meetings held
during the year.
Board papers are always circulated in advance of meetings. These include detailed financial reports on the Group’s
activities in addition to reports on each operating subsidiary. In addition, the meetings held in February and August
focus on the full year and half year results respectively. The meeting in December focuses on the budget and plans
for the following three years.
The duties and responsibilities of the Board and its committees are formally agreed by the Board in writing. In
addition, the division of responsibility between the Chairman and the Chief Executive is set out in writing and agreed
by the Board. Matters specifically reserved for the Board include but are not limited to the following:
• Compliance with UK Company Law and UK Listing Rule requirements.
• Review the Group’s system of internal control and assess its effectiveness.
• Consider Group commercial strategy and approve the annual budget.
• Consider Board appointments, terms of reference for each Director and the Board sub committees.
• Board remuneration as recommended by the Remuneration Committee.
Corporate Governance
a n n u a l r e p o r t & a c c o u n t s t w o t h o u s a n d & s e v e n 35
Corporate Governance continued
The Board, its committees and each individual Director participate in an annual performance evaluation appraisal,
the purpose of which is to confirm the continued effective contribution and performance of the individual or
committee. Evaluation of the Board was undertaken by the non-executive Directors and took account of Directors
attendance and their contribution at meetings, financial performance of the Group against budget, compliance with
corporate governance and best practice guidelines and market perception of the Group. The Nomination,
Remuneration and Audit Committees were evaluated by the executive Directors and took account of communication
with the Board and compliance with terms of reference. The evaluation of the Chairman was undertaken by the non-
executive Directors and included an assessment of his leadership and direction of the Board. The appraisal of the
Chief Executive was completed by the non-executive Directors together with the Chairman. Evaluation of the other
individual Directors took account of their contribution and in the case of executive Directors the performance of
their executive duties.
Prior to the reappointment of a non-executive Director, the Nomination Committee undertake an evaluation of the
Director’s contribution and commitment to the Board together with an evaluation of the Board’s requirements. In the
case of a non-executive Director being reappointed for a third three year term, the Code recommends a particularly
rigorous evaluation with consideration being given to the need to regularly refresh the Board. The Nomination
Committee undertook such an evaluation of George Helland prior to his reappointment for a third three year term
effective from 1 October 2007 concluding that he remained a valuable contributor to the Board. George Helland did
not participate in the evaluation process undertaken by the Committee.
The Board has three main sub committees to which it delegates responsibility and authorities:
Nomination Committee – members of the Committee are Richard Hunting (Chairman), Dennis Proctor and the three
non-executive Directors. The Committee, which convened once during the year with all members attending, except
as noted above, has written terms of reference approved by the Board and which are available from the Company
upon request. The role of the Committee includes leading the process for Board appointments and determining the
terms of new appointments. The Committee also considers succession planning which takes into account the
experience and skills required of Board members.
Remuneration Committee – details of the Remuneration Committee are contained within their report on page 26.
The Committee, which convened four times during the year with all members attending, has written terms of
reference approved by the Board which are available from the Company upon request.
Audit Committee – members of the Committee comprise exclusively the three independent non-executive Directors.
The Code recommends that at least one of the non-executive Directors has recent and relevant financial experience.
None of the non-executive Directors has this experience, however the Board considers that the Audit Committee
receives sufficient support and guidance from the external auditors, the Finance Director and other financial advisors.
The Committee, which met three times during the year, is chaired by Iain Paterson and operates under written terms
of reference approved by the Board which are available from the company upon request. All committee members
attended all meetings held during the year. It normally meets in February and August each year with a third meeting
in April coinciding with the Group’s Annual General Meeting. The Chief Executive, Finance Director and the auditors
are invited to attend all meetings. The auditors present an audit report at each meeting for consideration by the
Committee. Their full year report includes a statement on their independence, their ability to remain objective and
undertake an effective audit. The Committee consider and assess this independence statement on behalf of the Board
taking into account the level of fees paid particularly for non-audit services. During 2007 the Committee have
continued to closely monitor fees paid to the auditors in respect of non-audit services which are analysed within
Corporate Governance continued
note 8 on page 58 and include £0.5m in respect of taxation advice. At the August meeting, scheduled immediately
prior to the announcement of the half year results, the auditors present their interim report to the Committee which
includes audit scope and fee estimates for the annual audit. The Committee normally meets the auditors without
executive Directors present at the end of each formal meeting.
Other responsibilities of the Audit Committee include:
• Review of reports on the Group’s system of internal control.
• Review of reports from the Group’s internal audit process and agreement of internal audit scope.
• Review of the external auditors’ independence and effectiveness of the audit process and assess the level and
quality of service in relation to fees paid.
• Monitor the Group’s financial statements and announcements.
• Monitor and approve engagements of the external auditor to provide non-audit services for the Group.
The Board receives copies of all reports submitted to the Audit Committee.
The senior independent non-executive Director, Iain Paterson, is the primary point of contact for staff of the Company
to raise in confidence concerns they may have over possible improprieties, financial or otherwise. All employees
have been notified of this arrangement through the corporate magazine, company notice boards and the Company
web site.
Institutional ShareholdersThe Company uses a number of processes for communicating with shareholders, including the full and half year
reports and the Annual General Meeting to which all shareholders are invited.
Additionally, the Chief Executive and Finance Director meet on a one to one basis with all principal shareholders at
least twice a year or when requested to update them of Group performance and strategy. The Board is in turn briefed
by the Chief Executive when appropriate on matters raised by shareholders. Non-executive Directors are offered the
opportunity to meet with shareholders and are available to meet if requested by shareholders.
The Code recommends that the Chairman and the senior independent non-executive Director should meet with key
shareholders in order that the Board receives a balanced view of shareholder issues or concerns. The Board has
reviewed its procedures currently in place for ensuring they are fairly and adequately apprised of shareholder issues.
In addition to the foregoing, the Company’s web site www.hunting.plc.uk publishes Company announcements and
other investor information used to communicate with shareholders and interested parties. The maintenance and
integrity of the Company’s web site is the responsibility of the Directors. Legislation in the UK concerning the
preparation and dissemination of financial statements may differ from legislation in other jurisdictions.
a n n u a l r e p o r t & a c c o u n t s t w o t h o u s a n d & s e v e n36
Corporate Governance continued
Internal ControlsThe Board acknowledges its responsibility for the Group’s system of internal control and for reviewing its
effectiveness. The internal control system, which has been in place throughout 2007 and up to the date of approval
of these accounts, is an ongoing process designed to identify, evaluate and manage the significant risks to which the
Company is exposed. Any such system of internal control can however, only provide reasonable, but not absolute
assurance against material misstatement or loss in the financial statements and of meeting internal control objectives.
The Directors have reviewed the effectiveness of the Group’s system of internal control for the period covered by
these financial statements, the key features of which are as follows:
Management structure – within operational parameters set by the Board, management is delegated to the Chief
Executive and the Executive Directors. Subsidiaries operate within clearly defined policies and authorities contained
within a Group Manual under a decentralised management structure. All senior management changes require the
prior approval of the Chief Executive.
Reporting – all subsidiaries submit detailed management information in accordance with a pre-set reporting
timetable. This includes weekly treasury reports, monthly management accounts, annual budgets and three-year
plans together with half and full year statutory reporting. This data is subject to review and assessment by
management through the monitoring of key performance ratios and comparison to targets and budgets. The content
and format of reporting is subject to change to ensure appropriate information is available.
Strategic planning and budgeting – strategic plans and annual budgets containing comprehensive financial
projections are formally presented to the Board for adoption and approval and form the basis for monitoring
performance. Clearly defined procedures exist for capital expenditure proposals and authorisation.
Quality assurance – most of the business sectors within which the Group operate are highly regulated and
subsidiaries are invariably required to be accredited, by the customer or an industry regulator, to national or
international quality organisations. These organisations undertake regular audits and checks on subsidiary operating
procedures and practices ensuring compliance with regulatory requirements.
Monitoring process – in addition to reports from external auditors the Audit Committee receives reports from the
internal auditors as part of the Group’s internal audit and risk assessment programme.
All subsidiaries undertake formal self-assessment reviews a minimum of three times a year on their internal control
environment. These reviews encompass the identification of the key business, financial, compliance and operational
risks facing the business together with an assessment of the controls in place for managing and mitigating these risks.
Additionally, risks are evaluated for their potential impact on the business. The results of these reviews together with
a review of risks facing the Group as a whole are reported to the Board. Risk management is a Board agenda item
at every Board meeting.
a n n u a l r e p o r t & a c c o u n t s t w o t h o u s a n d & s e v e n 37
a n n u a l r e p o r t & a c c o u n t s t w o t h o u s a n d & s e v e n38
Directors’ ResponsibilitiesThe Directors are required by the Companies Act 1985 to prepare financial statements for each financial year which
give a true and fair view of the state of affairs of the Group and the Company as at the end of the financial year and
of the profit and loss for the financial year.
The Directors are responsible for maintaining proper accounting records which disclose with reasonable accuracy
the financial position of the Group and the Company and which enable them to ensure that the financial statements
comply with the Companies Act 1985. They are also responsible for preparing the Remuneration Committee’s Report.
The Directors confirm that the financial statements, using applicable accounting standards, have been prepared on
a going concern basis using suitable accounting policies, consistently applied and supported by reasonable and
prudent judgements and estimates.
The Directors are also responsible for taking such steps as are reasonably open to them to safeguard the assets of the
Group and the Company, and to prevent and detect fraud and other irregularities.
By order of the BoardPeter RoseCompany Secretary
28 February 2008
Corporate Governance continued

a n n u a l r e p o r t & a c c o u n t s t w o t h o u s a n d & s e v e n 39
Report of the Auditors
Independent Auditors’ Report to the Members of Hunting PLCWe have audited the group and parent company financial statements (the “financial statements”) of Hunting PLC for
the year ended 31 December 2007 which comprise the Principal Accounting Policies, the Consolidated Income
Statement, the Consolidated and Company Balance Sheets, the Consolidated and Company Cash Flow Statements,
the Consolidated and Company Statements of Recognised Income and Expense, and the related notes. These
financial statements have been prepared under the accounting policies set out therein. We have also audited the
information in the Remuneration Committee’s Report that is described as having been audited.
Respective Responsibilities of Directors and AuditorsThe Directors’ responsibilities for preparing the Annual Report, the Remuneration Committee’s Report and the
financial statements in accordance with applicable law and International Financial Reporting Standards (IFRSs) as
adopted by the European Union are set out in the Statement of Directors’ Responsibilities.
Our responsibility is to audit the financial statements and the part of the Remuneration Committee’s Report to be
audited in accordance with relevant legal and regulatory requirements and International Standards on Auditing (UK
and Ireland). This report, including the opinion, has been prepared for and only for the Company’s members as a
body in accordance with Section 235 of the Companies Act 1985 and for no other purpose. We do not, in giving
this opinion, accept or assume responsibility for any other purpose or to any other person to whom this report is
shown or into whose hands it may come save where expressly agreed by our prior consent in writing.
We report to you our opinion as to whether the financial statements give a true and fair view and whether the
financial statements and the part of the Remuneration Committee’s Report to be audited have been properly prepared
in accordance with the Companies Act 1985 and, as regards the Group financial statements, article 4 of the IAS
Regulation. We also report to you whether in our opinion the information given in the Report of the Directors is
consistent with the financial statements.
In addition we report to you if, in our opinion, the Company has not kept proper accounting records, if we have not
received all the information and explanations we require for our audit, or if information specified by law regarding
director’s remuneration and other transactions is not disclosed.
We review whether the Corporate Governance Statement reflects the company’s compliance with the nine provisions
of the Combined Code 2003 specified for our review by the Listing Rules of the Financial Services Authority, and we
report if it does not. We are not required to consider whether the board’s statements on internal control cover all risks
and controls, or form an opinion on the effectiveness of the Group’s corporate governance procedures or its risk and
control procedures.
We read other information contained in the Annual Report and consider whether it is consistent with the audited
financial statements. The other information comprises only the Report of the Directors, the unaudited part of the
Remuneration Committee’s Report, the Chairman‘s Statement, the Business Review, the Board of Directors, the
Corporate Social Responsibility Statement, the Corporate Governance Statement, Shareholder information and the
Financial Record. We consider the implications for our report if we become aware of any apparent misstatements or
material inconsistencies with the financial statements. Our responsibilities do not extend to any other information.
a n n u a l r e p o r t & a c c o u n t s t w o t h o u s a n d & s e v e n40
Basis of Audit OpinionWe conducted our audit in accordance with International Standards on Auditing (UK and Ireland) issued by the
Auditing Practices Board. An audit includes examination, on a test basis, of evidence relevant to the amounts and
disclosures in the financial statements and the part of the Remuneration Committee’s Report to be audited. It also
includes an assessment of the significant estimates and judgements made by the Directors in the preparation of the
financial statements, and of whether the accounting policies are appropriate to the Group’s and Company’s
circumstances, consistently applied and adequately disclosed.
We planned and performed our audit so as to obtain all the information and explanations which we considered
necessary in order to provide us with sufficient evidence to give reasonable assurance that the financial statements and
the part of the Remuneration Committee’s Report to be audited are free from material misstatement, whether caused by
fraud or other irregularity or error. In forming our opinion we also evaluated the overall adequacy of the presentation
of information in the financial statements and the part of the Remuneration Committee’s Report to be audited.
OpinionIn our opinion:
• the Group financial statements give a true and fair view, in accordance with IFRSs as adopted by the European
Union, of the state of the Group’s affairs as at 31 December 2007 and of its profit and cash flows for the year
then ended;
• the parent company financial statements give a true and fair view, in accordance with IFRSs as adopted by the
European Union as applied in accordance with the provisions of the Companies Act 1985, of the state of the
parent company’s affairs as at 31 December 2007 and cash flows for the year then ended;
• the financial statements and the part of the Remuneration Committee’s Report to be audited have been properly
prepared in accordance with the Companies Act 1985 and, as regards the Group financial statements, Article 4
of the IAS Regulation; and
• the information given in the Report of the Directors is consistent with the financial statements.
PricewaterhouseCoopers LLP
Chartered Accountants and Registered Auditors
London
28 February 2008
Notes:
(a) The maintenance and integrity of the Hunting PLC website is the responsibility of the Directors; the work carriedout by the auditors does not involve consideration of these matters and, accordingly, the auditors accept noresponsibility for any changes that may have occurred to the financial statements since they were initiallypresented on the website.
(b) Legislation in the United Kingdom governing the preparation and dissemination of financial statements maydiffer from legislation in other jurisdictions.
Report of the Auditors continued
a n n u a l r e p o r t & a c c o u n t s t w o t h o u s a n d & s e v e n 41
Principal Accounting Policies
Basis of AccountingThe financial statements have been prepared under the historical cost convention as modified by the revaluation ofcertain property, plant and equipment, available for sale investments, financial assets and financial liabilities held fortrading.
These financial statements have been prepared in accordance with the Companies Act 1985 and those IFRS standardsas adopted by the European Union and IFRIC interpretations which are effective as at 31 December 2007. Thefollowing Standards, Interpretations and Amendments, which became effective for and were adopted during the yearended 31 December 2007, had no impact on the Group’s results or financial position:
• IFRS 7 Financial Instruments: Disclosures
• Amendment to IAS 1 Presentation of Financial Statements
• IFRIC 7 Applying the Restatement Approach under IAS 29 Financial Reporting in Hyperinflationary Economies
• IFRIC 8 Scope of IFRS 2
• IFRIC 9 Re-assessment of Embedded Derivatives
• IFRIC 10 Interim Financial Reporting and Impairment
The following Standards, Interpretations and Amendments are effective subsequent to the year end and consequentlyhave not been adopted for the year ended 31 December 2007:
• Amendment to IFRS 2 Share-based Payments
• IFRS 3 (revised) Business Combinations
• IFRS 8 Operating Segments
• IAS 1 (revised) Presentation of Financial Statements
• IAS 23 (revised) Borrowing Costs
• IAS 27 (revised) Consolidated and Separate Financial Statements
• IFRIC 11 – IFRS 2 – Group and Treasury Share Transactions
• IFRIC 12 Service Concession Arrangements
• IFRIC 13 Customer Loyalty Programmes Relating to IAS 18 Revenue
• IFRIC 14 The Limit on a Defined Benefits Asset, Minimum Funding Requirements and their Interaction
With the exception of IAS 23 (revised), it is not anticipated that the new requirements will impact the Group’s resultsor financial position. IAS 23 (revised) requires the Group to capitalise those borrowing costs directly associated withqualifying assets but as the Group cannot predict the cost of its qualifying assets in 2009, when IAS 23 (revised) isexpected to be adopted, it is currently not able to estimate the impact.
ConsolidationOn adoption of IFRS, the Company elected not to restate business combinations prior to 1 January 2004. The Groupaccounts include the results of the Company and its subsidiaries, together with its share of associates.
Subsidiaries
Subsidiaries are all entities over which the Group has the power to govern the financial and operating policies.
Subsidiaries are fully consolidated from the date on which control is transferred to the Group. They are de-consolidated from the date control ceases.
Associates
An associate is an entity in which the Group has an effective interest of not less than 20% and over which it has theability to exercise significant influence and that is neither a subsidiary nor a joint venture.
The Group’s share of after tax results of associates is included separately in the income statement.
a n n u a l r e p o r t & a c c o u n t s t w o t h o u s a n d & s e v e n42
GoodwillOn the acquisition of a business, fair values are attributed to the net assets acquired. Goodwill arises where the fairvalue of the consideration given exceeds the fair value of the net assets acquired.
Goodwill is recognised as an asset and is reviewed for impairment at least annually. Impairments are recognisedimmediately in the income statement. Goodwill is allocated to cash generating units for the purpose of impairmenttesting.
On the disposal of a business, goodwill relating to that business remaining on the balance sheet is included in thedetermination of the profit or loss on disposal.
Goodwill written off to reserves prior to 1998 has not been reinstated and will not be included in determining anysubsequent profit or loss on disposal.
RevenueRevenue represents the invoiced amount, excluding sales related taxes, of goods sold and services provided and isrecognised when title passes to the customer or when the service has been rendered.
Revenue on long term contracts is recognised by reference to the value of the work done during the period.
Revenue is not recognised for barter transactions that involve the exchange of goods or services which are of a similarnature and value.
Exceptional ItemsExceptional items are regarded as one-off items of income and expense that do not intentionally recur and, due totheir size and nature, need to be disclosed separately in order to give a true and fair view of the results of the Group.
InterestInterest income and expense is recognised in the income statement using the effective interest method.
Property, Plant and Equipment and DepreciationProperty, plant and equipment are stated at cost or valuation including decommissioning costs and depreciated totheir expected residual values on a straight line basis over their estimated useful lives, at the following rates:
Freehold buildings 2%-10%Leasehold buildings life of leaseOil and gas exploration and equipment unit of productionPipelines, tanks and associated equipment 3%-20%Plant, machinery and motor vehicles 6%-331/3%
Freehold land and expenditure on the exploration for and evaluation of mineral resources are not depreciated.
Freehold land and buildings and terminals are revalued with sufficient regularity, at least every five years, such thatthe carrying amount does not differ materially from the fair value at the balance sheet date.
Computer software integral to an item of machinery is capitalised as part of the hardware.
Property, plant and equipment are impaired if their recoverable amount falls below their carrying value. Impairmentlosses are charged to the income statement immediately unless they arise on previously revalued assets, in whichcase they are recognised in the statement of recognised income and expense up to the amount of the revaluationand thereafter in the income statement.
Principal Accounting Policies continued

a n n u a l r e p o r t & a c c o u n t s t w o t h o u s a n d & s e v e n 43
Principal Accounting Policies continued
Intangible AssetsIntangible assets are stated at cost. Those assets that have a finite life are amortised in accordance with the patternof expected future economic benefits, or when this cannot be reliably estimated, by using the straight-line method.General computer software is capitalised as an intangible asset. Customer relationships are amortised over a periodof between five and ten years, pipeline rights of way over a period of twenty years and other intangibles over a periodof between three and eight years.
Foreign CurrenciesThe financial statements for each of the Group’s subsidiaries and associates are prepared using their functionalcurrency. The functional currency is the currency of the primary economic environment in which an entity operates.The presentation currency of the Group and functional currency of Hunting PLC is sterling.
Assets and liabilities of overseas subsidiaries and associates are translated into sterling at the market rates ruling atthe balance sheet date. Trading results are translated at the average rates for the period. Exchange differences arisingon the consolidation of the net assets of overseas subsidiaries and on foreign currency borrowings used to financeoverseas net equity investments are dealt with through the foreign currency translation reserve, which commencedon 1 January 2004, whilst those arising from trading transactions are dealt with in the income statement. Thecumulative translation differences for all foreign operations that existed on 1 January 2004 were deemed to be zero.
On the disposal of a business, the cumulative exchange differences previously recognised in the foreign currencytranslation reserve relating to that business are transferred to the income statement as part of the gain or loss on disposal.
TaxationThe tax charge on the profit or loss for the year comprises current tax and deferred tax.
Current tax is the expected net tax payable on the current year’s net profits, using tax rates enacted or substantivelyenacted at the balance sheet date, plus adjustments to net tax payable in respect of prior years’ net profits.
Full provision is made for deferred taxation on all taxable temporary differences. Deferred tax assets and liabilitiesare recognised separately on the balance sheet. Deferred tax assets are recognised only to the extent that they areexpected to be recoverable.
Deferred taxation is recognised in the income statement unless it relates to taxable transactions taken directly toequity, in which case the deferred tax is also recognised in equity. The deferred tax is released to the incomestatement at the same time as the taxable transaction is recognised in the income statement.
Deferred taxation on unremitted overseas earnings is provided for to the extent a tax charge is foreseeable.
Inventories and Construction ContractsInventories are stated at the lower of cost and net realisable value. Cost is determined using the first-in-first-outmethod and net realisable value is the estimated selling price less costs of disposal in the ordinary course of business.Construction contracts are stated at the lower of cost and estimated net realisable value less payments received andreceivable on account. Cost includes production overheads and a proportion of administrative overheads in additionto direct labour and material costs.
ProvisionsProvisions are recognised when the Group has a present obligation as a result of a past event, it is probable that anoutflow of resources will be required to settle the obligation and a reliable estimate can be made of the obligation.If the time value of money is material, provisions are discounted to their present value.
a n n u a l r e p o r t & a c c o u n t s t w o t h o u s a n d & s e v e n44
ImpairmentsThe Group assesses whether there is any indication that an asset may be impaired at least once a year. For thepurposes of assessing impairment, assets are grouped at the lowest levels for which there are separately identifiablecash flows. Where an impairment exists, the asset is written down to the lower of value in use and fair value lesscosts to sell.
Segmental ReportingBusiness segments have been established as the primary reporting format as it is the the main determinant of the sourcesand nature of the Group’s risks and returns. Business segments are components of the Group that are engaged inproviding related products. Geographical segments are determined by the country in which the companies operate.
Employee BenefitsPayments to defined contribution retirement schemes are charged to the income statement as they fall due.
For defined benefit retirement schemes, the expected cost of providing benefits is determined using the Projected UnitMethod, with actuarial valuations being carried out by qualified independent actuaries at each balance sheet date.Actuarial gains and losses are recognised in full in the period in which they occur, in the statement of recognised incomeand expense.
Past service cost is recognised immediately to the extent that the benefits are already vested and is otherwiseamortised on a straight line basis over the average period until the benefits become vested.
All cumulative actuarial gains and losses at 1 January 2004 have been recognised in reserves.
The expected cost of post-employment benefit obligations is spread evenly over the period of service of theemployees.
Share-based PaymentsIFRS 2 Share-based Payments has been applied from 1 January 2004 to grants of equity instruments issued after7 November 2002 that had not vested by 1 January 2005. The derived cost of these instruments is spread evenly overthe vesting period.
LeasesA finance lease is a lease that transfers substantially all the risks and rewards of ownership of an asset to the lessee.Assets acquired under finance leases are recorded in the balance sheet as property, plant and equipment at their fairvalue and depreciated over the shorter of their estimated useful lives and their lease terms. All other leases areoperating leases, and the rental of these is charged to the income statement as incurred over the life of the lease. Interestincurred on finance leases is charged to the income statement on an accruals basis. Operating lease income isrecognised in the income statement as it is earned.
Research and DevelopmentResearch costs and development costs ineligible for capitalisation are written off as incurred.
Debt Issue CostsCosts arising on the issue of new loan facilities are capitalised and amortised through interest expense using theeffective interest method.
Treasury SharesTreasury shares are stated at cost and presented as an off-set against reserves.
Principal Accounting Policies continued
a n n u a l r e p o r t & a c c o u n t s t w o t h o u s a n d & s e v e n 45
Principal Accounting Policies continued
Cash and Cash EquivalentsFor cashflow statement purposes, cash and cash equivalents include bank overdrafts and deposits with a maturity ofless than three months.
Financial AssetsThe Group classifies its financial assets into the following categories: financial assets at fair value through profit orloss, loans and receivables, and available for sale financial assets. Management determines the classification of itsinvestments at initial recognition and re-evaluates this designation at every reporting date. Financial assets areinitially recognised at fair value at the trade date, which is normally the consideration paid, plus, in the case offinancial assets that are not measured at fair value through profit or loss, transaction costs. The Group assesses ateach balance sheet date whether a financial asset is impaired by comparing its carrying value with the present valueof the estimated future cash flows discounted at a rate relevant to the nature of the financial asset. If the carryingamount is higher, it is reduced to the appropriate value and the loss is recognised in the income statementimmediately. Financial assets cease to be recognised when the right to receive cash flows has expired or has beentransferred and the Group has transferred substantially all the risks and rewards of ownership.
(a) Financial assets at fair value through profit or lossGains and losses arising from changes in the fair value are included in the income statement in the period in whichthey arise. A financial asset is included in this category if acquired principally for the purpose of selling in the shortterm and also includes derivatives that are not designated in a hedge relationship.
(b) Loans and receivablesLoans and receivables are carried at amortised cost using the effective interest method if the time value of money issignificant.
(c) Available for sale financial assetsUnrealised gains and losses arising from changes in the fair value are recognised in equity. Realised gains and losses,including accumulated fair value adjustments, are included in the income statement.
Financial LiabilitiesFinancial liabilities are initially recognised at fair value at the trade date which is normally the consideration receivedless, in the case of financial liabilities that are not measured at fair value through profit or loss, transaction costs. TheGroup subsequently re-measures all of its non-derivative financial liabilities, including trade payables, at amortisedcost. The amortised cost of long term loans which have been designated as part of a fair value hedge relationship isadjusted by the movement in the fair value of the hedged risk from the date of designation of the hedgingrelationship. The adjustment is recognised as a fair value gain or loss in the income statement immediately.
Interest accrued on loans that are measured at amortised cost using the effective interest method is regarded as anintegral part of the loan balance and therefore included within the carrying amount of those loans. Consequently,interest payable within twelve months on loans due after more than one year is recognised in non-currentborrowings.
Derivatives and Financial InstrumentsDerivatives are initially recognised as net proceeds received or consideration paid at the trade date and are subsequentlyre-measured at their fair value at each balance sheet date. Recognition of the resulting gain or loss depends on whetherthe derivative is designated as a hedging instrument, and if it is, the nature of the item being hedged.
Changes in the fair value of derivatives that have not been designated in a hedge relationship are recognisedimmediately in the income statement.
a n n u a l r e p o r t & a c c o u n t s t w o t h o u s a n d & s e v e n46
Principal Accounting Policies continued
Derivative and primary financial instruments that are designated in a hedge relationship are accounted for under oneof the following methods:
(a) Fair value hedgeHedges of the fair value of recognised assets or liabilities are fair value hedges. Changes in the fair values of thesederivatives are recorded in the income statement, together with changes in the fair values of the hedged items thatare attributable to the hedged risk. Changes in the fair value of the hedging instruments and hedged items and interestarising on the hedging instruments and hedged items are disclosed separately within finance costs.
(b) Cash flow hedgeHedges of highly probable forecast transactions are cash flow hedges. The effective portion of changes in the fairvalue of these derivatives are recognised in equity. The gains and losses relating to the ineffective portion arerecognised immediately in the income statement. Amounts accumulated in equity are dealt with in the incomestatement at the same time as the gains and losses on the hedged items. When a forecast transaction is no longerexpected to occur, the cumulative gains and losses that were reported in equity are immediately transferred to theincome statement.
(c) Net investment hedge in foreign operationsGains and losses on the hedging instrument relating to the effective portion of the hedge are recognised in equity.Gains and losses relating to the ineffective portion are recognised immediately in the income statement. Gains andlosses accumulated in equity are released to the income statement when the foreign operation is sold.
All of the Group’s hedges to which hedge accounting is applied, are tested for effectiveness prospectively andretrospectively and are fully documented as hedges at the point of inception of the hedge relationship.
An embedded derivative is a feature in a sales contract or purchase contract that causes the cash flows of the contractto change whenever there is a change in a specified variable. The Group regularly reviews its sales and purchasecontracts in order to determine the existence of embedded derivatives within them.
The Group’s derivatives that are embedded within a host contract are separated from that contract and measured atfair value unless either (1) the host contract is measured at fair value, in which case the fair value of the derivative issubsumed within the fair value of the entire contract, or (2) the derivative is closely related to the host contract, inwhich case the derivative is measured at cost. An embedded derivative is regarded as not closely related to its hostcontract when the cash flows it modifies are associated with risks that are not inherent in the contract itself.
Critical Accounting Estimates and JudgementsThe preparation of financial statements requires management to make judgements and assumptions about the future,resulting in the use of accounting estimates. These will, by definition, seldom equal the related actual results andadjustments will consequently be necessary. Estimates are continually evaluated, based on experience andreasonable expectations of future events.
Accounting estimates are applied in determining the carrying amounts of the following significant assets andliabilities: employee benefits (as detailed in note 29), property, plant and equipment (useful lives), goodwill(discounted cash flow projections), deferred taxation (timing of liabilities and timing and recoverability of assets),share based payments (as detailed in note 37) and provisions (fair value of obligation and discount rate).
Dividend DistributionsDividend distributions to the Company’s shareholders are recognised as liabilities in the Group’s financial statements
in the period in which the dividends are approved by the Company’s shareholders and remain unpaid at the period
end. Dividend distributions are dealt with in the Statement of Changes in Equity and recognised in the period in
which they are approved by the Company’s shareholders or, if earlier, declared and paid by the Company.
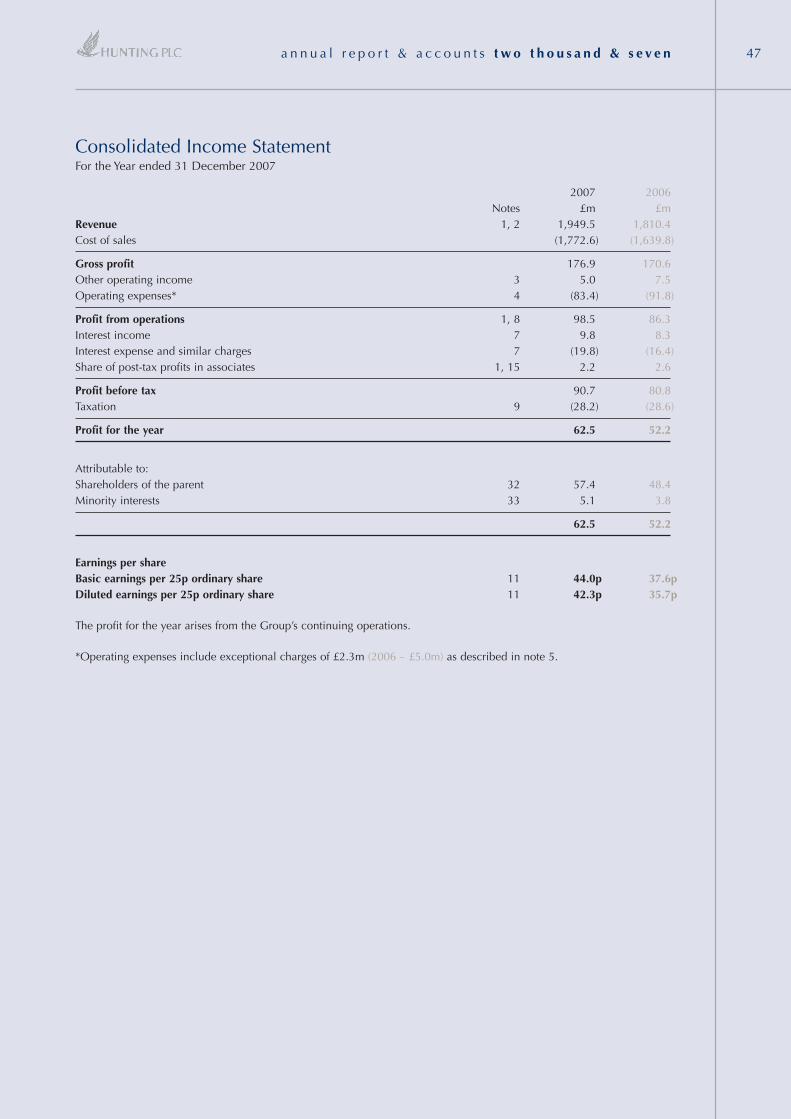
a n n u a l r e p o r t & a c c o u n t s t w o t h o u s a n d & s e v e n 47
Consolidated Income StatementFor the Year ended 31 December 2007
2007 2006Notes £m £m
Revenue 1, 2 1,949.5 1,810.4Cost of sales (1,772.6) (1,639.8)
Gross profit 176.9 170.6Other operating income 3 5.0 7.5Operating expenses* 4 (83.4) (91.8)
Profit from operations 1, 8 98.5 86.3Interest income 7 9.8 8.3Interest expense and similar charges 7 (19.8) (16.4)Share of post-tax profits in associates 1, 15 2.2 2.6
Profit before tax 90.7 80.8Taxation 9 (28.2) (28.6)
Profit for the year 62.5 52.2
Attributable to:Shareholders of the parent 32 57.4 48.4Minority interests 33 5.1 3.8
62.5 52.2
Earnings per shareBasic earnings per 25p ordinary share 11 44.0p 37.6pDiluted earnings per 25p ordinary share 11 42.3p 35.7p
The profit for the year arises from the Group’s continuing operations.
*Operating expenses include exceptional charges of £2.3m (2006 – £5.0m) as described in note 5.
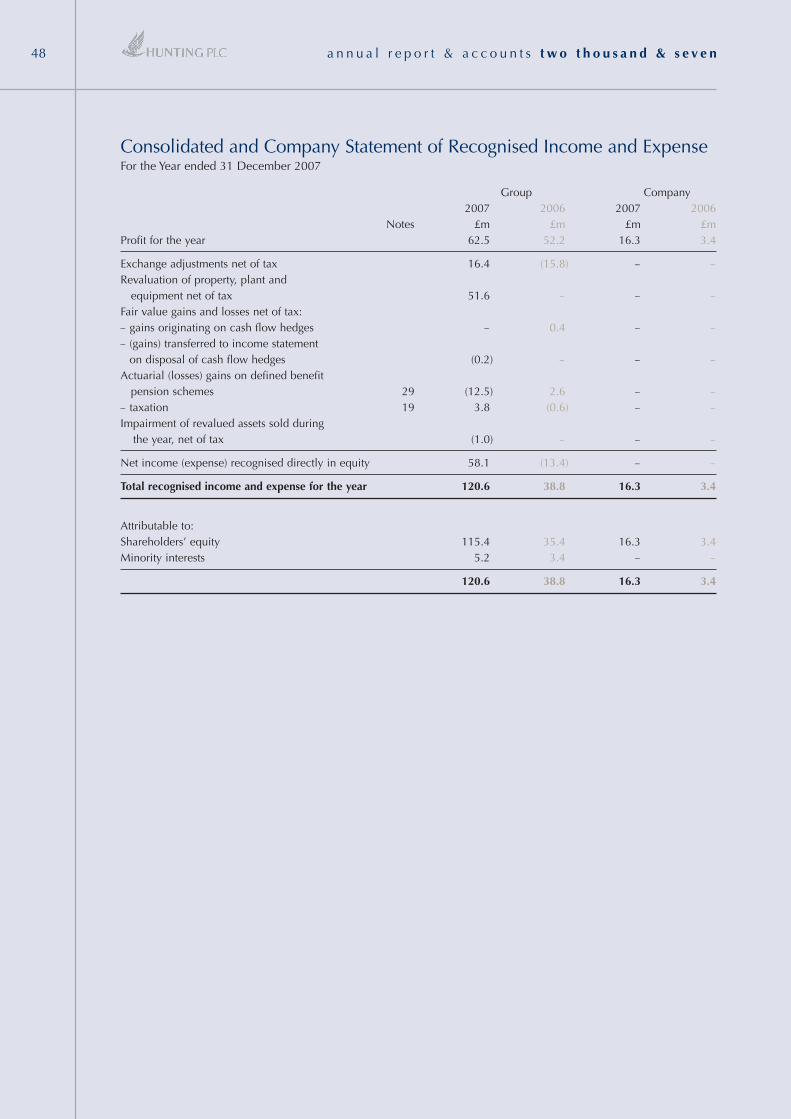
Consolidated and Company Statement of Recognised Income and ExpenseFor the Year ended 31 December 2007
Group Company2007 2006 2007 2006
Notes £m £m £m £mProfit for the year 62.5 52.2 16.3 3.4
Exchange adjustments net of tax 16.4 (15.8) – –Revaluation of property, plant and
equipment net of tax 51.6 – – –Fair value gains and losses net of tax:– gains originating on cash flow hedges – 0.4 – –– (gains) transferred to income statement
on disposal of cash flow hedges (0.2) – – –Actuarial (losses) gains on defined benefit
pension schemes 29 (12.5) 2.6 – –– taxation 19 3.8 (0.6) – –Impairment of revalued assets sold during
the year, net of tax (1.0) – – –
Net income (expense) recognised directly in equity 58.1 (13.4) – –
Total recognised income and expense for the year 120.6 38.8 16.3 3.4
Attributable to:Shareholders’ equity 115.4 35.4 16.3 3.4Minority interests 5.2 3.4 – –
120.6 38.8 16.3 3.4
a n n u a l r e p o r t & a c c o u n t s t w o t h o u s a n d & s e v e n48
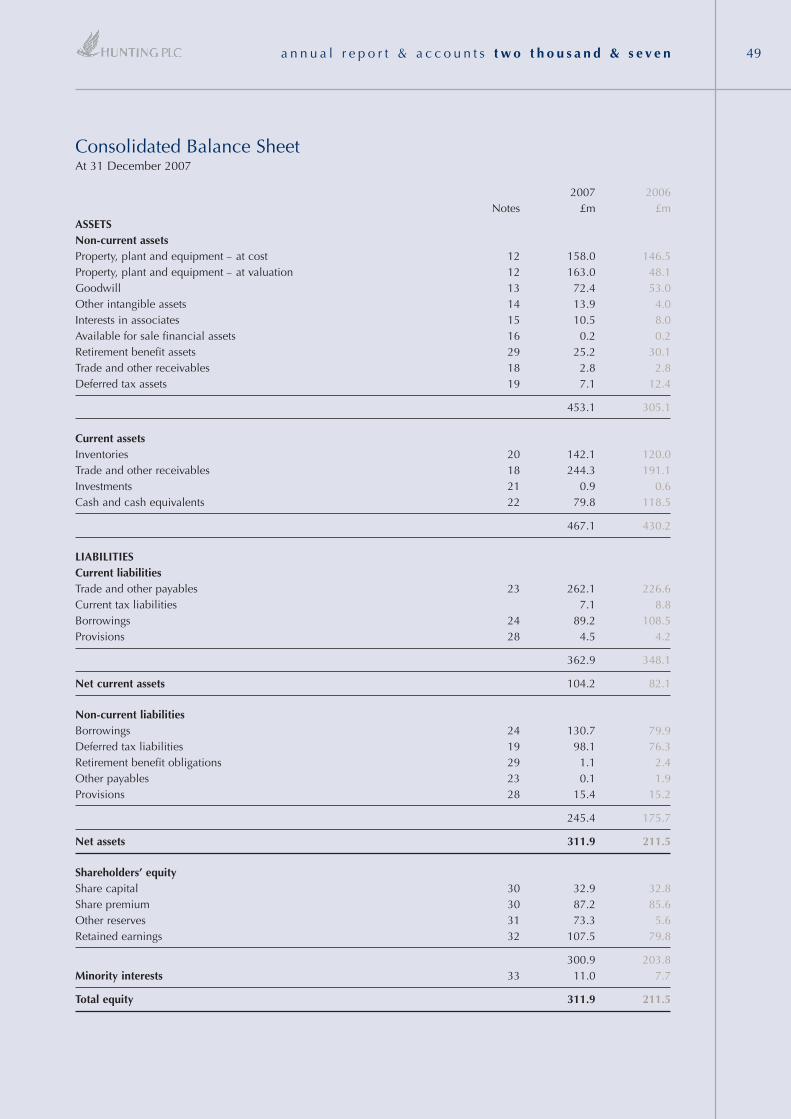
2007 2006Notes £m £m
ASSETSNon-current assetsProperty, plant and equipment – at cost 12 158.0 146.5Property, plant and equipment – at valuation 12 163.0 48.1Goodwill 13 72.4 53.0Other intangible assets 14 13.9 4.0Interests in associates 15 10.5 8.0Available for sale financial assets 16 0.2 0.2Retirement benefit assets 29 25.2 30.1Trade and other receivables 18 2.8 2.8Deferred tax assets 19 7.1 12.4
453.1 305.1
Current assetsInventories 20 142.1 120.0Trade and other receivables 18 244.3 191.1Investments 21 0.9 0.6Cash and cash equivalents 22 79.8 118.5
467.1 430.2
LIABILITIESCurrent liabilitiesTrade and other payables 23 262.1 226.6Current tax liabilities 7.1 8.8Borrowings 24 89.2 108.5Provisions 28 4.5 4.2
362.9 348.1
Net current assets 104.2 82.1
Non-current liabilitiesBorrowings 24 130.7 79.9Deferred tax liabilities 19 98.1 76.3Retirement benefit obligations 29 1.1 2.4Other payables 23 0.1 1.9Provisions 28 15.4 15.2
245.4 175.7
Net assets 311.9 211.5
Shareholders’ equityShare capital 30 32.9 32.8Share premium 30 87.2 85.6Other reserves 31 73.3 5.6Retained earnings 32 107.5 79.8
300.9 203.8Minority interests 33 11.0 7.7
Total equity 311.9 211.5
Consolidated Balance SheetAt 31 December 2007
a n n u a l r e p o r t & a c c o u n t s t w o t h o u s a n d & s e v e n 49
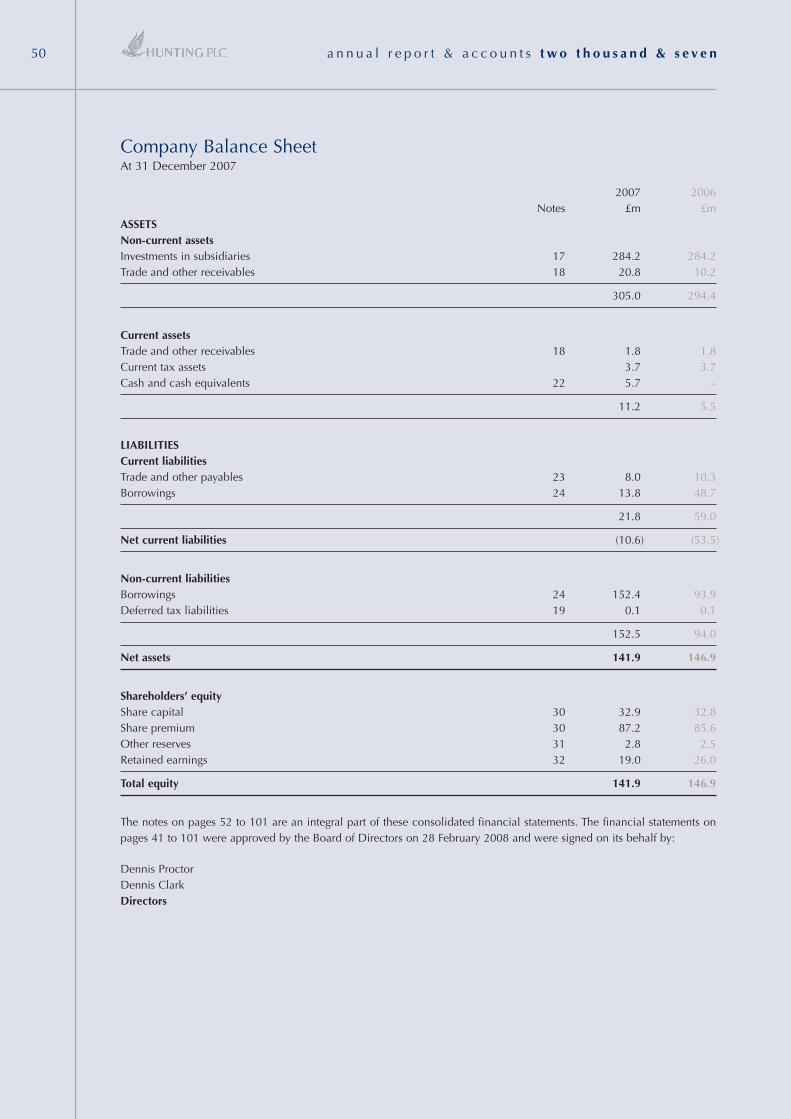
Company Balance SheetAt 31 December 2007
2007 2006Notes £m £m
ASSETSNon-current assetsInvestments in subsidiaries 17 284.2 284.2Trade and other receivables 18 20.8 10.2
305.0 294.4
Current assetsTrade and other receivables 18 1.8 1.8Current tax assets 3.7 3.7Cash and cash equivalents 22 5.7 –
11.2 5.5
LIABILITIESCurrent liabilitiesTrade and other payables 23 8.0 10.3Borrowings 24 13.8 48.7
21.8 59.0
Net current liabilities (10.6) (53.5)
Non-current liabilitiesBorrowings 24 152.4 93.9Deferred tax liabilities 19 0.1 0.1
152.5 94.0
Net assets 141.9 146.9
Shareholders’ equityShare capital 30 32.9 32.8Share premium 30 87.2 85.6Other reserves 31 2.8 2.5Retained earnings 32 19.0 26.0
Total equity 141.9 146.9
The notes on pages 52 to 101 are an integral part of these consolidated financial statements. The financial statements onpages 41 to 101 were approved by the Board of Directors on 28 February 2008 and were signed on its behalf by:
Dennis ProctorDennis ClarkDirectors
a n n u a l r e p o r t & a c c o u n t s t w o t h o u s a n d & s e v e n50
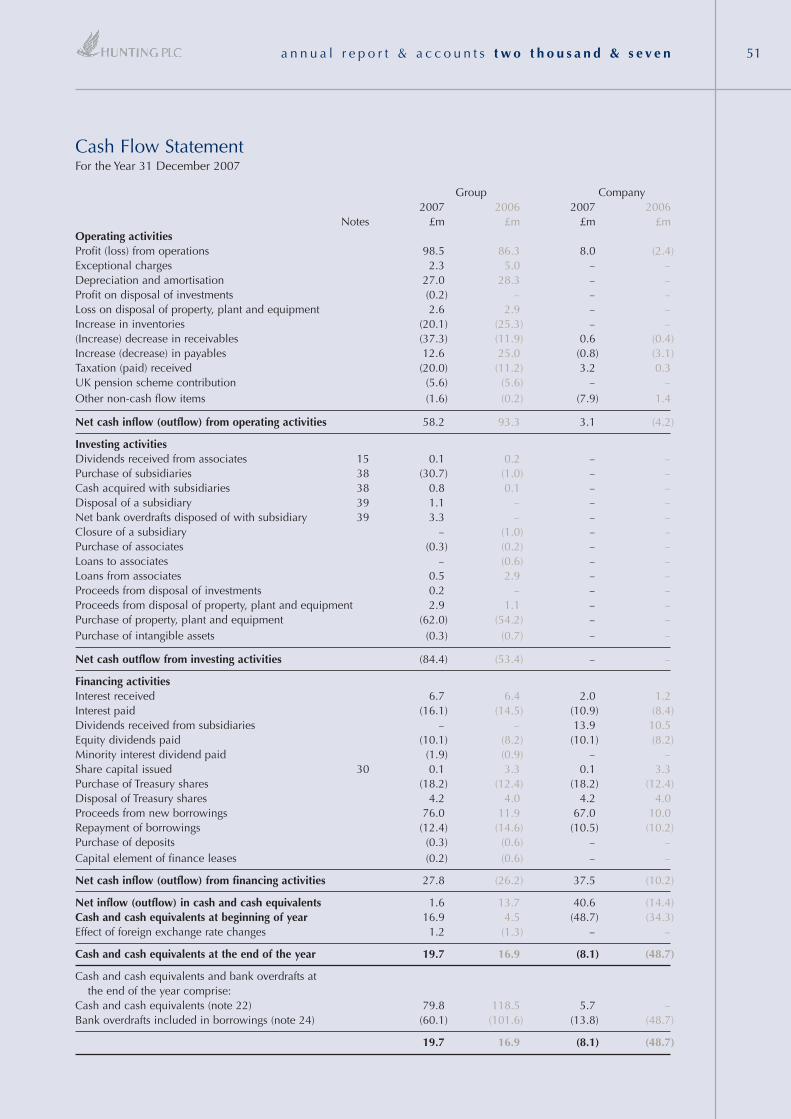
Group Company2007 2006 2007 2006
Notes £m £m £m £mOperating activitiesProfit (loss) from operations 98.5 86.3 8.0 (2.4)Exceptional charges 2.3 5.0 – –Depreciation and amortisation 27.0 28.3 – –Profit on disposal of investments (0.2) – – –Loss on disposal of property, plant and equipment 2.6 2.9 – –Increase in inventories (20.1) (25.3) – –(Increase) decrease in receivables (37.3) (11.9) 0.6 (0.4)Increase (decrease) in payables 12.6 25.0 (0.8) (3.1)Taxation (paid) received (20.0) (11.2) 3.2 0.3UK pension scheme contribution (5.6) (5.6) – –Other non-cash flow items (1.6) (0.2) (7.9) 1.4
Net cash inflow (outflow) from operating activities 58.2 93.3 3.1 (4.2)
Investing activitiesDividends received from associates 15 0.1 0.2 – –Purchase of subsidiaries 38 (30.7) (1.0) – –Cash acquired with subsidiaries 38 0.8 0.1 – –Disposal of a subsidiary 39 1.1 – – –Net bank overdrafts disposed of with subsidiary 39 3.3 – – –Closure of a subsidiary – (1.0) – –Purchase of associates (0.3) (0.2) – –Loans to associates – (0.6) – –Loans from associates 0.5 2.9 – –Proceeds from disposal of investments 0.2 – – –Proceeds from disposal of property, plant and equipment 2.9 1.1 – –Purchase of property, plant and equipment (62.0) (54.2) – –Purchase of intangible assets (0.3) (0.7) – –
Net cash outflow from investing activities (84.4) (53.4) – –
Financing activitiesInterest received 6.7 6.4 2.0 1.2Interest paid (16.1) (14.5) (10.9) (8.4)Dividends received from subsidiaries – – 13.9 10.5Equity dividends paid (10.1) (8.2) (10.1) (8.2)Minority interest dividend paid (1.9) (0.9) – –Share capital issued 30 0.1 3.3 0.1 3.3Purchase of Treasury shares (18.2) (12.4) (18.2) (12.4)Disposal of Treasury shares 4.2 4.0 4.2 4.0Proceeds from new borrowings 76.0 11.9 67.0 10.0Repayment of borrowings (12.4) (14.6) (10.5) (10.2)Purchase of deposits (0.3) (0.6) – –Capital element of finance leases (0.2) (0.6) – –
Net cash inflow (outflow) from financing activities 27.8 (26.2) 37.5 (10.2)
Net inflow (outflow) in cash and cash equivalents 1.6 13.7 40.6 (14.4)Cash and cash equivalents at beginning of year 16.9 4.5 (48.7) (34.3)Effect of foreign exchange rate changes 1.2 (1.3) – –
Cash and cash equivalents at the end of the year 19.7 16.9 (8.1) (48.7)
Cash and cash equivalents and bank overdrafts atthe end of the year comprise:
Cash and cash equivalents (note 22) 79.8 118.5 5.7 –Bank overdrafts included in borrowings (note 24) (60.1) (101.6) (13.8) (48.7)
19.7 16.9 (8.1) (48.7)
Cash Flow StatementFor the Year 31 December 2007
a n n u a l r e p o r t & a c c o u n t s t w o t h o u s a n d & s e v e n 51
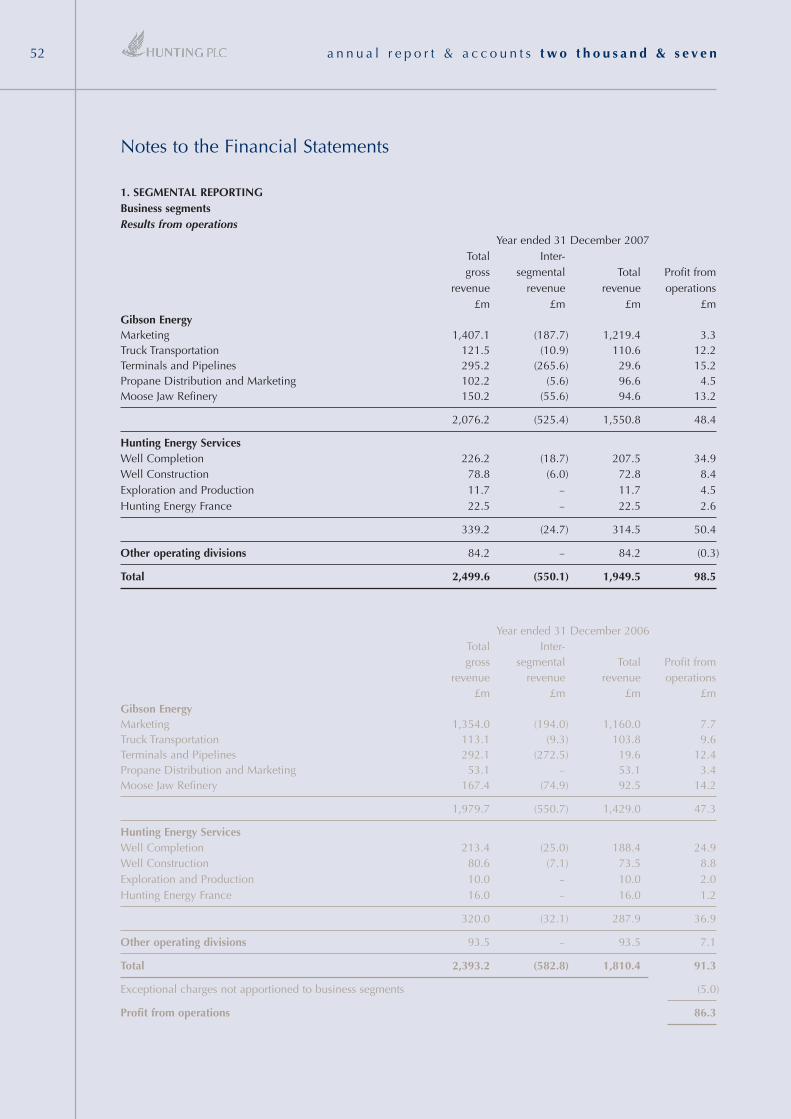
a n n u a l r e p o r t & a c c o u n t s t w o t h o u s a n d & s e v e n52
1. SEGMENTAL REPORTINGBusiness segmentsResults from operations
Year ended 31 December 2007Total Inter-gross segmental Total Profit from
revenue revenue revenue operations£m £m £m £m
Gibson EnergyMarketing 1,407.1 (187.7) 1,219.4 3.3Truck Transportation 121.5 (10.9) 110.6 12.2Terminals and Pipelines 295.2 (265.6) 29.6 15.2Propane Distribution and Marketing 102.2 (5.6) 96.6 4.5Moose Jaw Refinery 150.2 (55.6) 94.6 13.2
2,076.2 (525.4) 1,550.8 48.4
Hunting Energy ServicesWell Completion 226.2 (18.7) 207.5 34.9Well Construction 78.8 (6.0) 72.8 8.4Exploration and Production 11.7 – 11.7 4.5Hunting Energy France 22.5 – 22.5 2.6
339.2 (24.7) 314.5 50.4
Other operating divisions 84.2 – 84.2 (0.3)
Total 2,499.6 (550.1) 1,949.5 98.5
Year ended 31 December 2006Total Inter-gross segmental Total Profit from
revenue revenue revenue operations£m £m £m £m
Gibson EnergyMarketing 1,354.0 (194.0) 1,160.0 7.7Truck Transportation 113.1 (9.3) 103.8 9.6Terminals and Pipelines 292.1 (272.5) 19.6 12.4Propane Distribution and Marketing 53.1 – 53.1 3.4Moose Jaw Refinery 167.4 (74.9) 92.5 14.2
1,979.7 (550.7) 1,429.0 47.3
Hunting Energy ServicesWell Completion 213.4 (25.0) 188.4 24.9Well Construction 80.6 (7.1) 73.5 8.8Exploration and Production 10.0 – 10.0 2.0Hunting Energy France 16.0 – 16.0 1.2
320.0 (32.1) 287.9 36.9
Other operating divisions 93.5 – 93.5 7.1
Total 2,393.2 (582.8) 1,810.4 91.3
Exceptional charges not apportioned to business segments (5.0)
Profit from operations 86.3
Notes to the Financial Statements
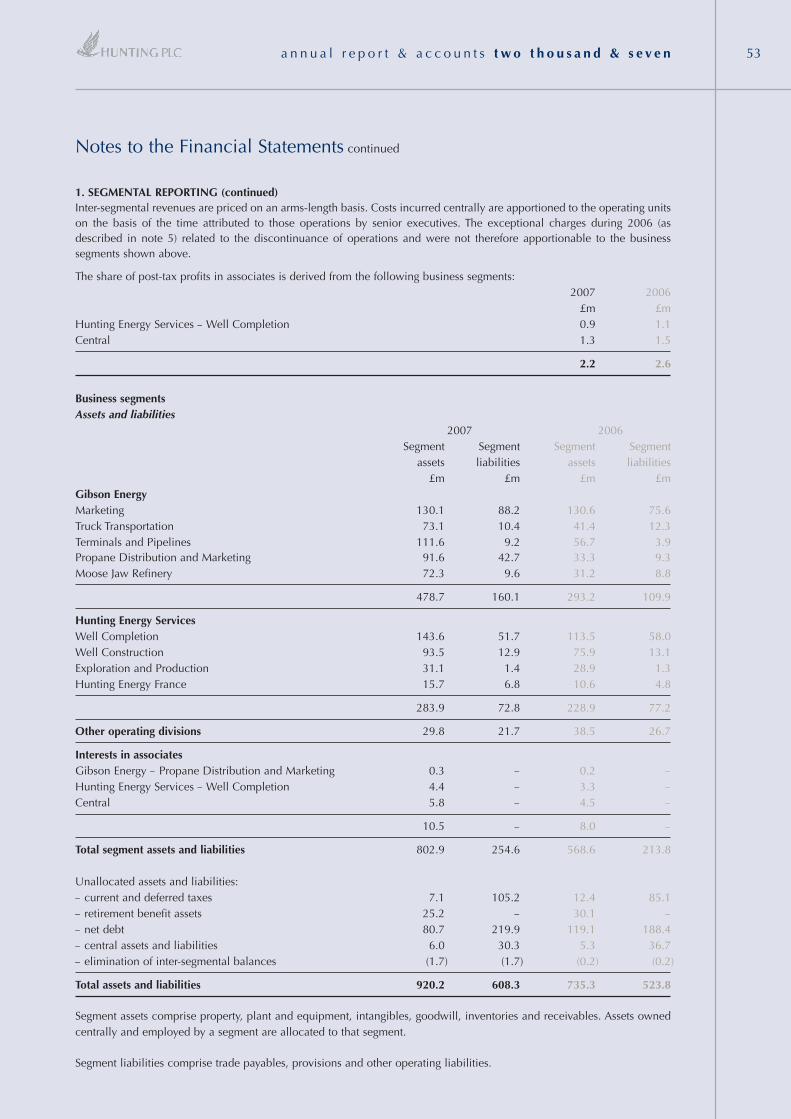
a n n u a l r e p o r t & a c c o u n t s t w o t h o u s a n d & s e v e n 53
Notes to the Financial Statements continued
1. SEGMENTAL REPORTING (continued)Inter-segmental revenues are priced on an arms-length basis. Costs incurred centrally are apportioned to the operating unitson the basis of the time attributed to those operations by senior executives. The exceptional charges during 2006 (asdescribed in note 5) related to the discontinuance of operations and were not therefore apportionable to the businesssegments shown above.
The share of post-tax profits in associates is derived from the following business segments:2007 2006
£m £mHunting Energy Services – Well Completion 0.9 1.1Central 1.3 1.5
2.2 2.6
Business segmentsAssets and liabilities
2007 2006Segment Segment Segment Segment
assets liabilities assets liabilities£m £m £m £m
Gibson EnergyMarketing 130.1 88.2 130.6 75.6Truck Transportation 73.1 10.4 41.4 12.3Terminals and Pipelines 111.6 9.2 56.7 3.9Propane Distribution and Marketing 91.6 42.7 33.3 9.3Moose Jaw Refinery 72.3 9.6 31.2 8.8
478.7 160.1 293.2 109.9
Hunting Energy ServicesWell Completion 143.6 51.7 113.5 58.0Well Construction 93.5 12.9 75.9 13.1Exploration and Production 31.1 1.4 28.9 1.3Hunting Energy France 15.7 6.8 10.6 4.8
283.9 72.8 228.9 77.2
Other operating divisions 29.8 21.7 38.5 26.7
Interests in associatesGibson Energy – Propane Distribution and Marketing 0.3 – 0.2 –Hunting Energy Services – Well Completion 4.4 – 3.3 –Central 5.8 – 4.5 –
10.5 – 8.0 –
Total segment assets and liabilities 802.9 254.6 568.6 213.8
Unallocated assets and liabilities:– current and deferred taxes 7.1 105.2 12.4 85.1– retirement benefit assets 25.2 – 30.1 –– net debt 80.7 219.9 119.1 188.4– central assets and liabilities 6.0 30.3 5.3 36.7– elimination of inter-segmental balances (1.7) (1.7) (0.2) (0.2)
Total assets and liabilities 920.2 608.3 735.3 523.8
Segment assets comprise property, plant and equipment, intangibles, goodwill, inventories and receivables. Assets ownedcentrally and employed by a segment are allocated to that segment.
Segment liabilities comprise trade payables, provisions and other operating liabilities.
a n n u a l r e p o r t & a c c o u n t s t w o t h o u s a n d & s e v e n54
1. SEGMENTAL REPORTING (continued)Business segmentsOther segment items
Year ended 31 December 2007Amortisation
Capital of intangibleexpenditure Depreciation assets
£m £m £mGibson EnergyMarketing 1.4 0.6 0.1Truck Transportation 8.8 3.4 0.2Terminals and Pipelines 7.4 3.9 0.1Propane Distribution and Marketing 3.3 2.0 0.3Moose Jaw Refinery 7.6 1.6 0.3
28.5 11.5 1.0
Hunting Energy ServicesWell Completion 10.2 4.1 0.2Well Construction 17.6 3.7 –Exploration and Production 7.0 5.0 –Hunting Energy France 0.8 0.2 –
35.6 13.0 0.2
Other operating divisions 1.1 1.1 –Central 0.4 0.2 –
Total 65.6 25.8 1.2
Year ended 31 December 2006Amortisation
Capital of intangibleexpenditure Depreciation assets
£m £m £mGibson EnergyMarketing 2.1 0.8 0.3Truck Transportation 3.0 3.4 0.3Terminals and Pipelines 10.4 4.2 0.3Propane Distribution and Marketing 2.7 1.7 0.2Moose Jaw Refinery 2.2 1.3 0.3
20.4 11.4 1.4
Hunting Energy ServicesWell Completion 8.0 4.1 0.2Well Construction 14.0 3.0 –Exploration and Production 10.2 5.8 –Hunting Energy France 0.1 0.2 –
32.3 13.1 0.2
Other operating divisions 1.1 2.0 –Central – 0.2 –
Total 53.8 26.7 1.6
Capital expenditure comprises additions to property, plant and equipment and intangible assets. There were no impairmentsof goodwill charged during the year (2006 – £nil).
Notes to the Financial Statements continued
a n n u a l r e p o r t & a c c o u n t s t w o t h o u s a n d & s e v e n 55
1. SEGMENTAL REPORTING (continued)Geographical segmentsThe Group mainly operates in four geographical areas. The UK is the domicile of Hunting PLC. The main operations are inCanada, USA, UK and Europe.
The analysis in the table below is based on the location of where the order is received and where the assets are principallylocated which is not materially different from the location of the customer.
Revenue Segment assets Capital expenditure2007 2006 2007 2006 2007 2006
£m £m £m £m £m £mUK 111.5 104.8 75.0 52.3 2.9 2.0Rest of Europe 47.6 40.4 23.7 40.5 1.4 0.9Canada 1,631.8 1,520.8 546.8 339.0 30.3 22.1USA 124.7 124.8 137.8 123.3 30.4 28.7Other 33.9 19.6 19.6 13.5 0.6 0.1
1,949.5 1,810.4 802.9 568.6 65.6 53.8
Unallocated assets 117.3 166.7
920.2 735.3
CompanyThe Company’s business is to invest in its subsidiaries and, therefore, it operates in a single segment.
2. REVENUE2007 2006
£m £mSales of goods 1,782.5 1,606.3Revenue from services 167.0 204.1
1,949.5 1,810.4
3. OTHER OPERATING INCOME2007 2006
£m £mRoyalty income 0.8 2.4Operating lease rental income 1.5 1.5Other income 0.7 0.3Gain on disposal of property, plant and equipment 1.8 0.2Net gains on fair value movement of non-hedging derivatives – 3.1Gain on disposal of available for sale investments 0.2 –
5.0 7.5
Notes to the Financial Statements continued
a n n u a l r e p o r t & a c c o u n t s t w o t h o u s a n d & s e v e n56
4. OPERATING EXPENSES2007 2006
£m £mAdministration expenses 79.7 86.0including:Exceptional charges (note 5) 2.3 5.0Net loss on fair value movement of non-hedging derivatives 5.3 0.1Distribution costs 3.7 5.8
83.4 91.8
5. EXCEPTIONAL CHARGES2007 2006
£m £mExceptional charges comprise:Disposal of a subsidiary 2.3 –Closure of a subsidiary – 1.9Onerous leases – 3.1
2.3 5.0
On 12 July 2007, the Group disposed of its former Italian business, Aero Sekur SpA. Further details are provided in note 39.
6. EMPLOYEES2007 2006
£m £mStaff costs during the year comprised:Wages and salaries 102.4 98.9Social security costs 9.6 9.9Share options – value of employee services 1.2 1.4Pension costs – defined contribution schemes (note 29) 2.8 2.8Pension costs – defined benefit schemes (note 29) 0.7 1.8
116.7 114.8
2007 2006No. No.
The average monthly number of employees comprised:UK 417 417Rest of Europe 233 312Canada 1,272 1,104USA 769 665Others 91 74
2,782 2,572
The Company has no employees.
Notes to the Financial Statements continued
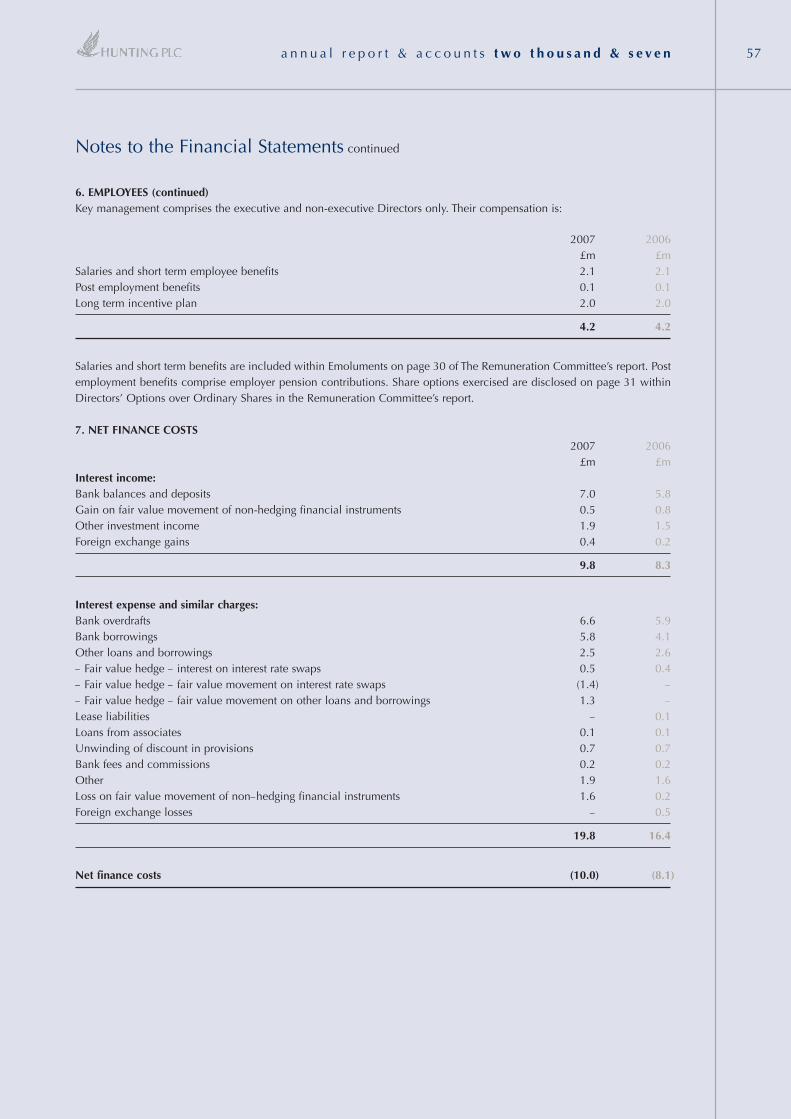
a n n u a l r e p o r t & a c c o u n t s t w o t h o u s a n d & s e v e n 57
6. EMPLOYEES (continued)Key management comprises the executive and non-executive Directors only. Their compensation is:
2007 2006£m £m
Salaries and short term employee benefits 2.1 2.1Post employment benefits 0.1 0.1Long term incentive plan 2.0 2.0
4.2 4.2
Salaries and short term benefits are included within Emoluments on page 30 of The Remuneration Committee’s report. Postemployment benefits comprise employer pension contributions. Share options exercised are disclosed on page 31 withinDirectors’ Options over Ordinary Shares in the Remuneration Committee’s report.
7. NET FINANCE COSTS2007 2006
£m £mInterest income:Bank balances and deposits 7.0 5.8Gain on fair value movement of non-hedging financial instruments 0.5 0.8Other investment income 1.9 1.5Foreign exchange gains 0.4 0.2
9.8 8.3
Interest expense and similar charges:Bank overdrafts 6.6 5.9Bank borrowings 5.8 4.1Other loans and borrowings 2.5 2.6– Fair value hedge – interest on interest rate swaps 0.5 0.4– Fair value hedge – fair value movement on interest rate swaps (1.4) –– Fair value hedge – fair value movement on other loans and borrowings 1.3 –Lease liabilities – 0.1Loans from associates 0.1 0.1Unwinding of discount in provisions 0.7 0.7Bank fees and commissions 0.2 0.2Other 1.9 1.6Loss on fair value movement of non–hedging financial instruments 1.6 0.2Foreign exchange losses – 0.5
19.8 16.4
Net finance costs (10.0) (8.1)
Notes to the Financial Statements continued
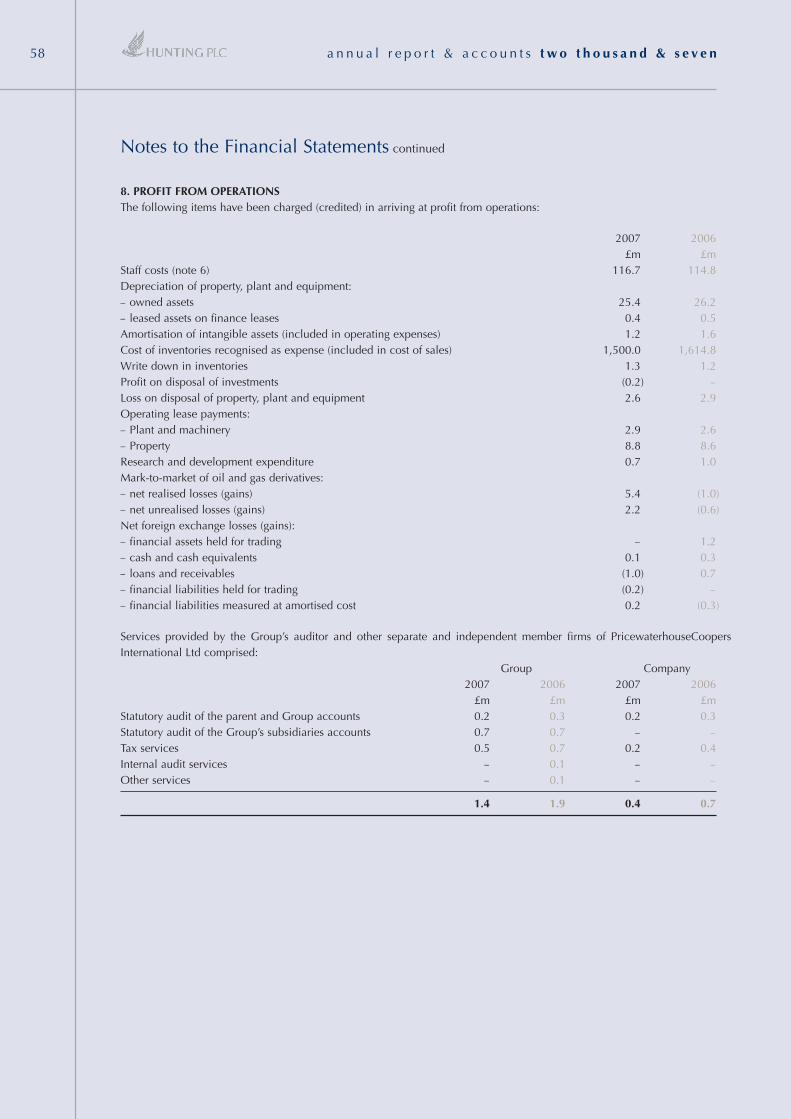
a n n u a l r e p o r t & a c c o u n t s t w o t h o u s a n d & s e v e n58
Notes to the Financial Statements continued
8. PROFIT FROM OPERATIONSThe following items have been charged (credited) in arriving at profit from operations:
2007 2006£m £m
Staff costs (note 6) 116.7 114.8Depreciation of property, plant and equipment:– owned assets 25.4 26.2– leased assets on finance leases 0.4 0.5Amortisation of intangible assets (included in operating expenses) 1.2 1.6Cost of inventories recognised as expense (included in cost of sales) 1,500.0 1,614.8Write down in inventories 1.3 1.2Profit on disposal of investments (0.2) –Loss on disposal of property, plant and equipment 2.6 2.9Operating lease payments:– Plant and machinery 2.9 2.6– Property 8.8 8.6Research and development expenditure 0.7 1.0Mark-to-market of oil and gas derivatives:– net realised losses (gains) 5.4 (1.0)– net unrealised losses (gains) 2.2 (0.6)Net foreign exchange losses (gains):– financial assets held for trading – 1.2– cash and cash equivalents 0.1 0.3– loans and receivables (1.0) 0.7– financial liabilities held for trading (0.2) –– financial liabilities measured at amortised cost 0.2 (0.3)
Services provided by the Group’s auditor and other separate and independent member firms of PricewaterhouseCoopersInternational Ltd comprised:
Group Company2007 2006 2007 2006
£m £m £m £mStatutory audit of the parent and Group accounts 0.2 0.3 0.2 0.3Statutory audit of the Group’s subsidiaries accounts 0.7 0.7 – –Tax services 0.5 0.7 0.2 0.4Internal audit services – 0.1 – –Other services – 0.1 – –
1.4 1.9 0.4 0.7
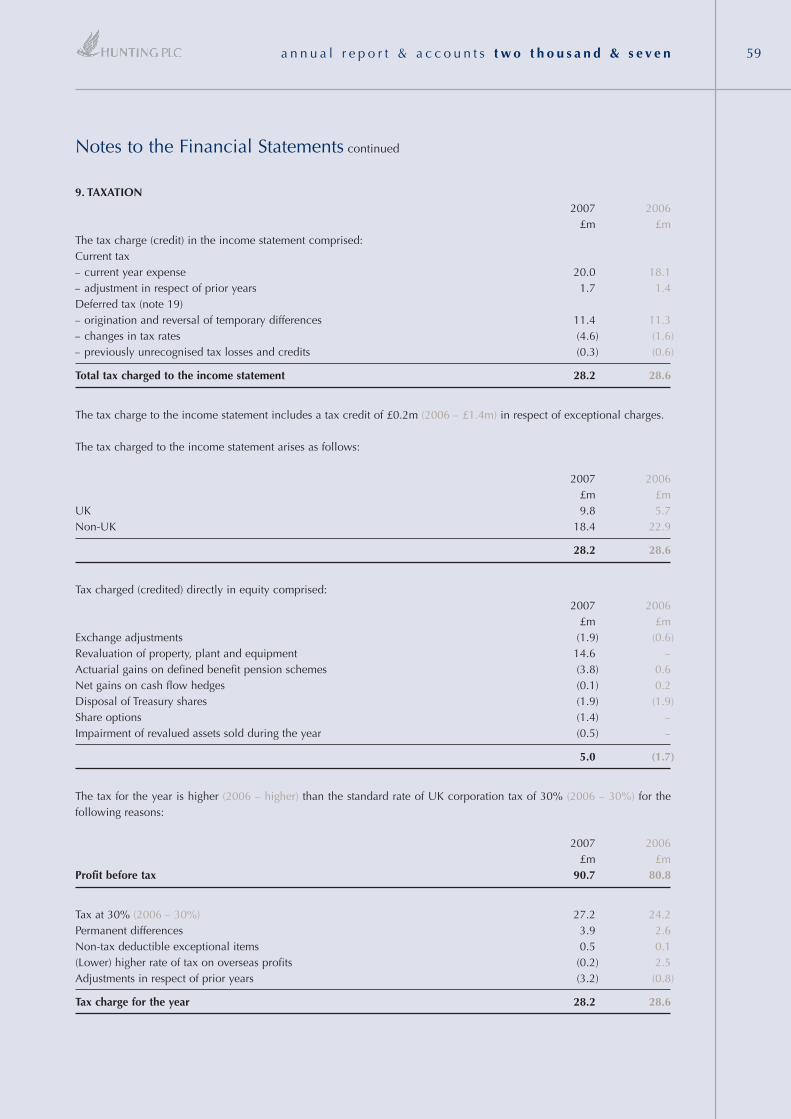
a n n u a l r e p o r t & a c c o u n t s t w o t h o u s a n d & s e v e n 59
9. TAXATION2007 2006
£m £mThe tax charge (credit) in the income statement comprised:Current tax– current year expense 20.0 18.1– adjustment in respect of prior years 1.7 1.4Deferred tax (note 19)– origination and reversal of temporary differences 11.4 11.3– changes in tax rates (4.6) (1.6)– previously unrecognised tax losses and credits (0.3) (0.6)
Total tax charged to the income statement 28.2 28.6
The tax charge to the income statement includes a tax credit of £0.2m (2006 – £1.4m) in respect of exceptional charges.
The tax charged to the income statement arises as follows:
2007 2006£m £m
UK 9.8 5.7Non-UK 18.4 22.9
28.2 28.6
Tax charged (credited) directly in equity comprised:2007 2006
£m £mExchange adjustments (1.9) (0.6)Revaluation of property, plant and equipment 14.6 –Actuarial gains on defined benefit pension schemes (3.8) 0.6Net gains on cash flow hedges (0.1) 0.2Disposal of Treasury shares (1.9) (1.9)Share options (1.4) –Impairment of revalued assets sold during the year (0.5) –
5.0 (1.7)
The tax for the year is higher (2006 – higher) than the standard rate of UK corporation tax of 30% (2006 – 30%) for thefollowing reasons:
2007 2006£m £m
Profit before tax 90.7 80.8
Tax at 30% (2006 – 30%) 27.2 24.2Permanent differences 3.9 2.6Non-tax deductible exceptional items 0.5 0.1(Lower) higher rate of tax on overseas profits (0.2) 2.5Adjustments in respect of prior years (3.2) (0.8)
Tax charge for the year 28.2 28.6
Notes to the Financial Statements continued
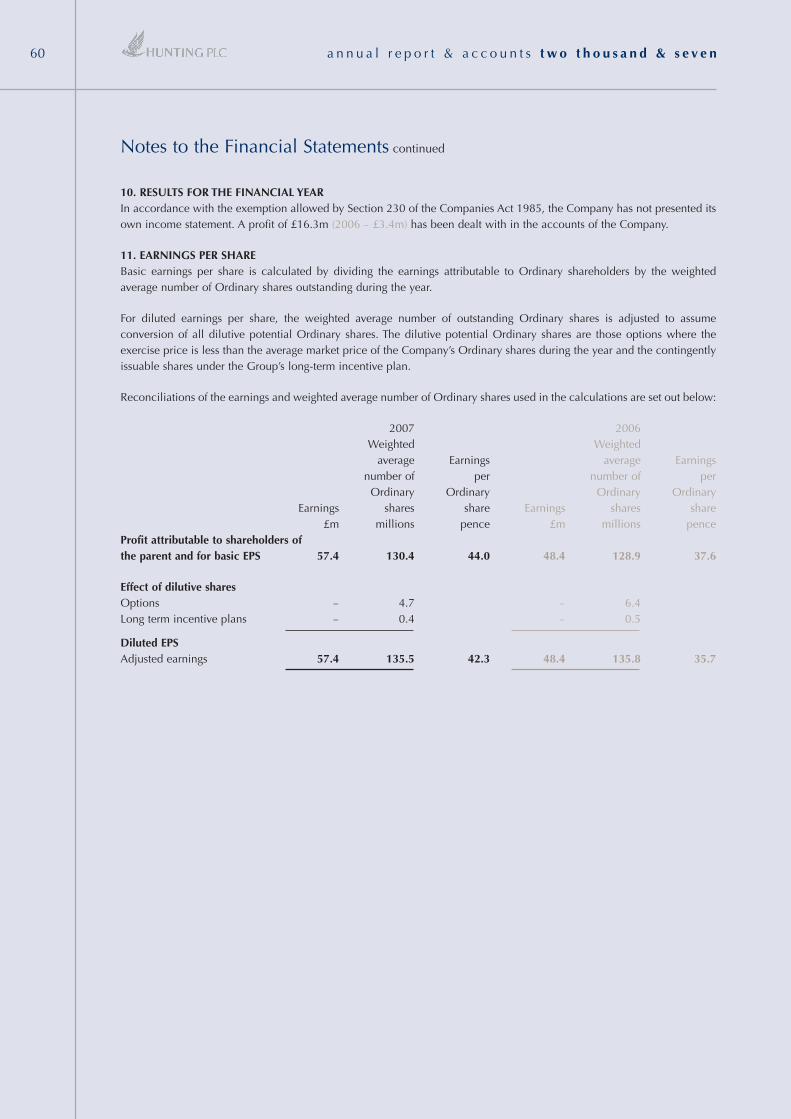
a n n u a l r e p o r t & a c c o u n t s t w o t h o u s a n d & s e v e n60
Notes to the Financial Statements continued
10. RESULTS FOR THE FINANCIAL YEARIn accordance with the exemption allowed by Section 230 of the Companies Act 1985, the Company has not presented itsown income statement. A profit of £16.3m (2006 – £3.4m) has been dealt with in the accounts of the Company.
11. EARNINGS PER SHARE Basic earnings per share is calculated by dividing the earnings attributable to Ordinary shareholders by the weightedaverage number of Ordinary shares outstanding during the year.
For diluted earnings per share, the weighted average number of outstanding Ordinary shares is adjusted to assumeconversion of all dilutive potential Ordinary shares. The dilutive potential Ordinary shares are those options where theexercise price is less than the average market price of the Company’s Ordinary shares during the year and the contingentlyissuable shares under the Group’s long-term incentive plan.
Reconciliations of the earnings and weighted average number of Ordinary shares used in the calculations are set out below:
2007 2006Weighted Weighted
average Earnings average Earningsnumber of per number of per
Ordinary Ordinary Ordinary OrdinaryEarnings shares share Earnings shares share
£m millions pence £m millions penceProfit attributable to shareholders ofthe parent and for basic EPS 57.4 130.4 44.0 48.4 128.9 37.6
Effect of dilutive shares Options – 4.7 – 6.4Long term incentive plans – 0.4 – 0.5
Diluted EPSAdjusted earnings 57.4 135.5 42.3 48.4 135.8 35.7
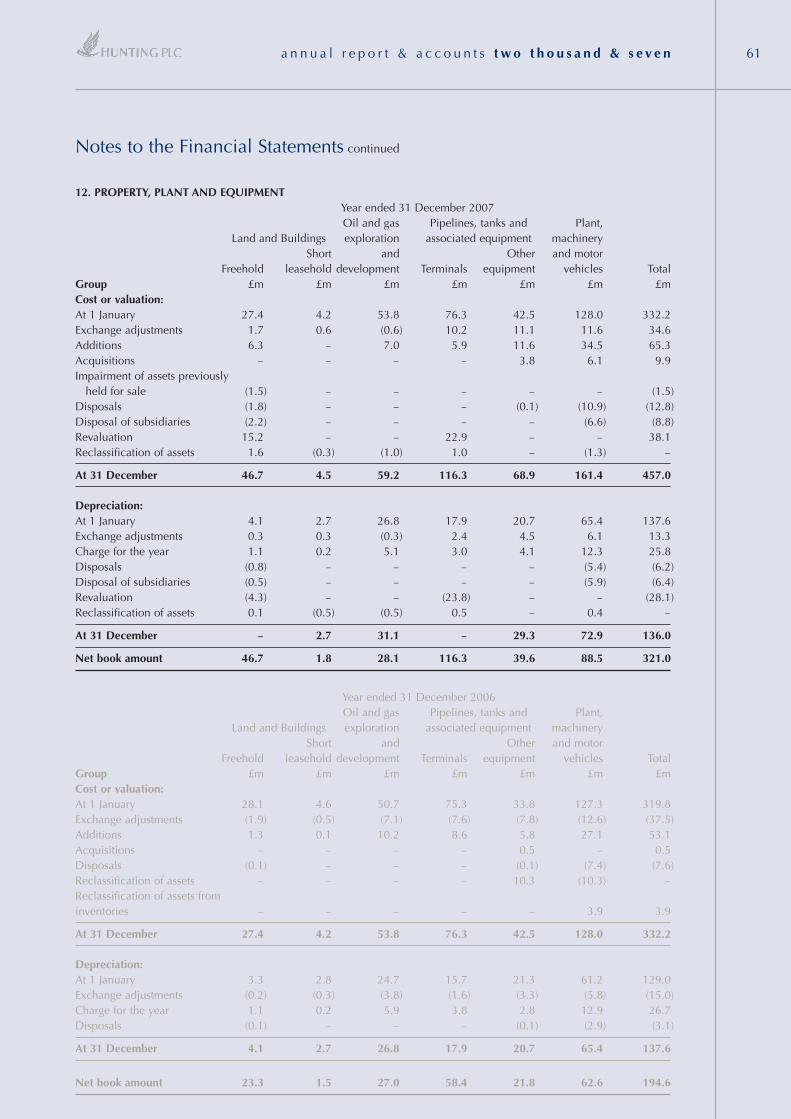
a n n u a l r e p o r t & a c c o u n t s t w o t h o u s a n d & s e v e n 61
12. PROPERTY, PLANT AND EQUIPMENT Year ended 31 December 2007Oil and gas Pipelines, tanks and Plant,
Land and Buildings exploration associated equipment machineryShort and Other and motor
Freehold leasehold development Terminals equipment vehicles TotalGroup £m £m £m £m £m £m £mCost or valuation:At 1 January 27.4 4.2 53.8 76.3 42.5 128.0 332.2Exchange adjustments 1.7 0.6 (0.6) 10.2 11.1 11.6 34.6Additions 6.3 – 7.0 5.9 11.6 34.5 65.3Acquisitions – – – – 3.8 6.1 9.9Impairment of assets previously
held for sale (1.5) – – – – – (1.5)Disposals (1.8) – – – (0.1) (10.9) (12.8)Disposal of subsidiaries (2.2) – – – – (6.6) (8.8)Revaluation 15.2 – – 22.9 – – 38.1Reclassification of assets 1.6 (0.3) (1.0) 1.0 – (1.3) –
At 31 December 46.7 4.5 59.2 116.3 68.9 161.4 457.0
Depreciation: At 1 January 4.1 2.7 26.8 17.9 20.7 65.4 137.6Exchange adjustments 0.3 0.3 (0.3) 2.4 4.5 6.1 13.3Charge for the year 1.1 0.2 5.1 3.0 4.1 12.3 25.8Disposals (0.8) – – – – (5.4) (6.2)Disposal of subsidiaries (0.5) – – – – (5.9) (6.4)Revaluation (4.3) – – (23.8) – – (28.1)Reclassification of assets 0.1 (0.5) (0.5) 0.5 – 0.4 –
At 31 December – 2.7 31.1 – 29.3 72.9 136.0
Net book amount 46.7 1.8 28.1 116.3 39.6 88.5 321.0
Year ended 31 December 2006Oil and gas Pipelines, tanks and Plant,
Land and Buildings exploration associated equipment machineryShort and Other and motor
Freehold leasehold development Terminals equipment vehicles TotalGroup £m £m £m £m £m £m £mCost or valuation:At 1 January 28.1 4.6 50.7 75.3 33.8 127.3 319.8Exchange adjustments (1.9) (0.5) (7.1) (7.6) (7.8) (12.6) (37.5)Additions 1.3 0.1 10.2 8.6 5.8 27.1 53.1Acquisitions – – – – 0.5 – 0.5Disposals (0.1) – – – (0.1) (7.4) (7.6)Reclassification of assets – – – – 10.3 (10.3) –Reclassification of assets frominventories – – – – – 3.9 3.9
At 31 December 27.4 4.2 53.8 76.3 42.5 128.0 332.2
Depreciation: At 1 January 3.3 2.8 24.7 15.7 21.3 61.2 129.0Exchange adjustments (0.2) (0.3) (3.8) (1.6) (3.3) (5.8) (15.0)Charge for the year 1.1 0.2 5.9 3.8 2.8 12.9 26.7Disposals (0.1) – – – (0.1) (2.9) (3.1)
At 31 December 4.1 2.7 26.8 17.9 20.7 65.4 137.6
Net book amount 23.3 1.5 27.0 58.4 21.8 62.6 194.6
Notes to the Financial Statements continued
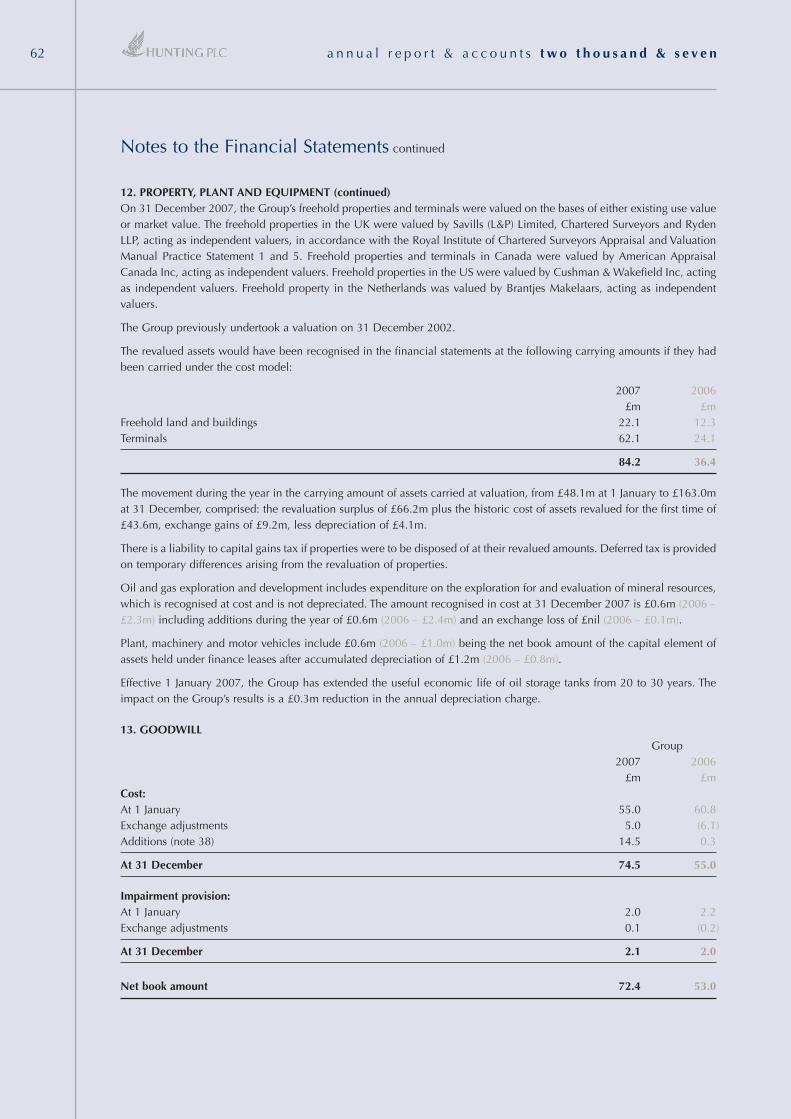
a n n u a l r e p o r t & a c c o u n t s t w o t h o u s a n d & s e v e n62
Notes to the Financial Statements continued
12. PROPERTY, PLANT AND EQUIPMENT (continued)On 31 December 2007, the Group’s freehold properties and terminals were valued on the bases of either existing use valueor market value. The freehold properties in the UK were valued by Savills (L&P) Limited, Chartered Surveyors and RydenLLP, acting as independent valuers, in accordance with the Royal Institute of Chartered Surveyors Appraisal and ValuationManual Practice Statement 1 and 5. Freehold properties and terminals in Canada were valued by American AppraisalCanada Inc, acting as independent valuers. Freehold properties in the US were valued by Cushman & Wakefield Inc, actingas independent valuers. Freehold property in the Netherlands was valued by Brantjes Makelaars, acting as independentvaluers.
The Group previously undertook a valuation on 31 December 2002.
The revalued assets would have been recognised in the financial statements at the following carrying amounts if they hadbeen carried under the cost model:
2007 2006£m £m
Freehold land and buildings 22.1 12.3Terminals 62.1 24.1
84.2 36.4
The movement during the year in the carrying amount of assets carried at valuation, from £48.1m at 1 January to £163.0mat 31 December, comprised: the revaluation surplus of £66.2m plus the historic cost of assets revalued for the first time of£43.6m, exchange gains of £9.2m, less depreciation of £4.1m.
There is a liability to capital gains tax if properties were to be disposed of at their revalued amounts. Deferred tax is providedon temporary differences arising from the revaluation of properties.
Oil and gas exploration and development includes expenditure on the exploration for and evaluation of mineral resources,which is recognised at cost and is not depreciated. The amount recognised in cost at 31 December 2007 is £0.6m (2006 –£2.3m) including additions during the year of £0.6m (2006 – £2.4m) and an exchange loss of £nil (2006 – £0.1m).
Plant, machinery and motor vehicles include £0.6m (2006 – £1.0m) being the net book amount of the capital element ofassets held under finance leases after accumulated depreciation of £1.2m (2006 – £0.8m).
Effective 1 January 2007, the Group has extended the useful economic life of oil storage tanks from 20 to 30 years. Theimpact on the Group’s results is a £0.3m reduction in the annual depreciation charge.
13. GOODWILL Group
2007 2006£m £m
Cost:At 1 January 55.0 60.8Exchange adjustments 5.0 (6.1)Additions (note 38) 14.5 0.3
At 31 December 74.5 55.0
Impairment provision:At 1 January 2.0 2.2Exchange adjustments 0.1 (0.2)
At 31 December 2.1 2.0
Net book amount 72.4 53.0
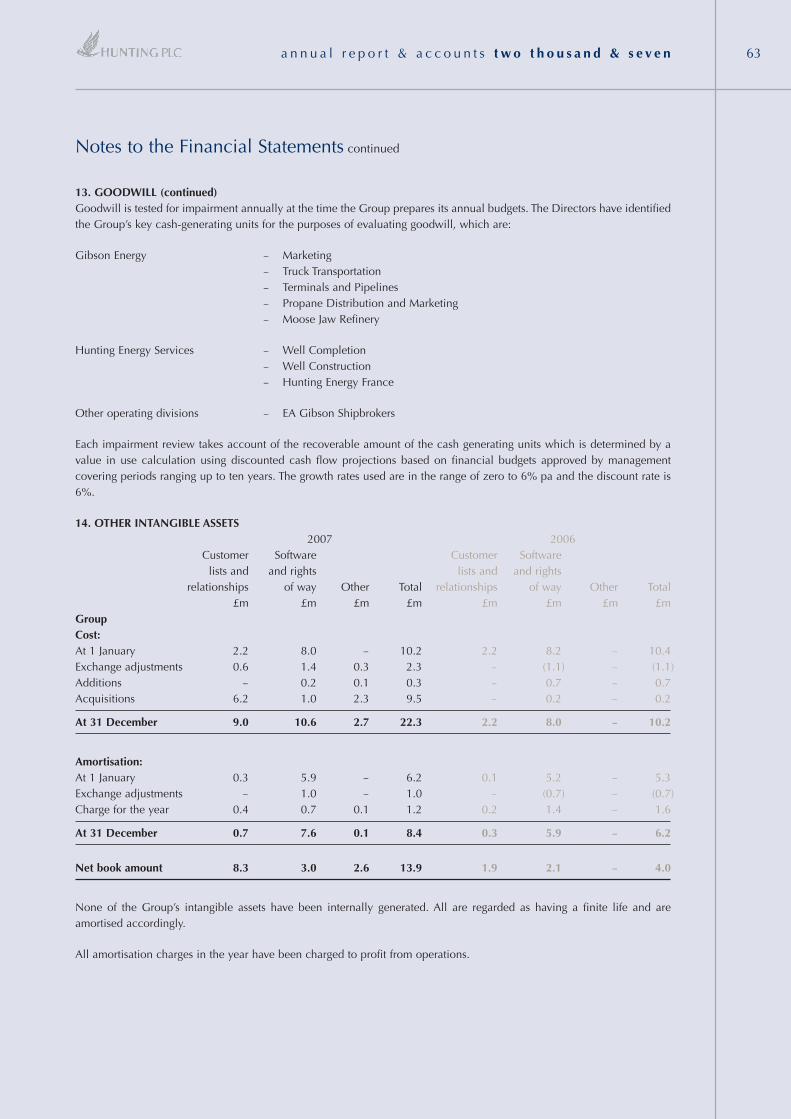
a n n u a l r e p o r t & a c c o u n t s t w o t h o u s a n d & s e v e n 63
13. GOODWILL (continued)Goodwill is tested for impairment annually at the time the Group prepares its annual budgets. The Directors have identifiedthe Group’s key cash-generating units for the purposes of evaluating goodwill, which are:
Gibson Energy – Marketing– Truck Transportation– Terminals and Pipelines– Propane Distribution and Marketing– Moose Jaw Refinery
Hunting Energy Services – Well Completion– Well Construction– Hunting Energy France
Other operating divisions – EA Gibson Shipbrokers
Each impairment review takes account of the recoverable amount of the cash generating units which is determined by avalue in use calculation using discounted cash flow projections based on financial budgets approved by managementcovering periods ranging up to ten years. The growth rates used are in the range of zero to 6% pa and the discount rate is6%.
14. OTHER INTANGIBLE ASSETS 2007 2006
Customer Software Customer Softwarelists and and rights lists and and rights
relationships of way Other Total relationships of way Other Total£m £m £m £m £m £m £m £m
GroupCost:At 1 January 2.2 8.0 – 10.2 2.2 8.2 – 10.4Exchange adjustments 0.6 1.4 0.3 2.3 – (1.1) – (1.1)Additions – 0.2 0.1 0.3 – 0.7 – 0.7Acquisitions 6.2 1.0 2.3 9.5 – 0.2 – 0.2
At 31 December 9.0 10.6 2.7 22.3 2.2 8.0 – 10.2
Amortisation:At 1 January 0.3 5.9 – 6.2 0.1 5.2 – 5.3Exchange adjustments – 1.0 – 1.0 – (0.7) – (0.7)Charge for the year 0.4 0.7 0.1 1.2 0.2 1.4 – 1.6
At 31 December 0.7 7.6 0.1 8.4 0.3 5.9 – 6.2
Net book amount 8.3 3.0 2.6 13.9 1.9 2.1 – 4.0
None of the Group’s intangible assets have been internally generated. All are regarded as having a finite life and areamortised accordingly.
All amortisation charges in the year have been charged to profit from operations.
Notes to the Financial Statements continued
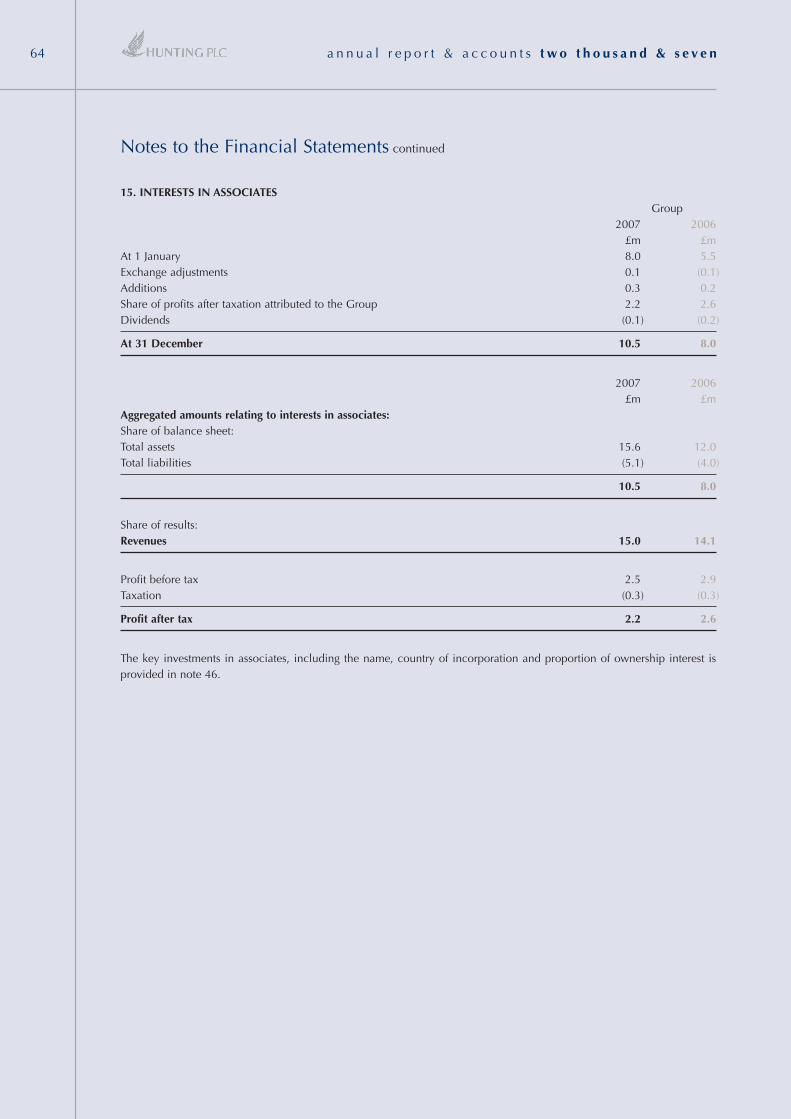
a n n u a l r e p o r t & a c c o u n t s t w o t h o u s a n d & s e v e n64
Notes to the Financial Statements continued
15. INTERESTS IN ASSOCIATES Group
2007 2006£m £m
At 1 January 8.0 5.5Exchange adjustments 0.1 (0.1)Additions 0.3 0.2Share of profits after taxation attributed to the Group 2.2 2.6Dividends (0.1) (0.2)
At 31 December 10.5 8.0
2007 2006£m £m
Aggregated amounts relating to interests in associates:Share of balance sheet:Total assets 15.6 12.0Total liabilities (5.1) (4.0)
10.5 8.0
Share of results:Revenues 15.0 14.1
Profit before tax 2.5 2.9Taxation (0.3) (0.3)
Profit after tax 2.2 2.6
The key investments in associates, including the name, country of incorporation and proportion of ownership interest isprovided in note 46.
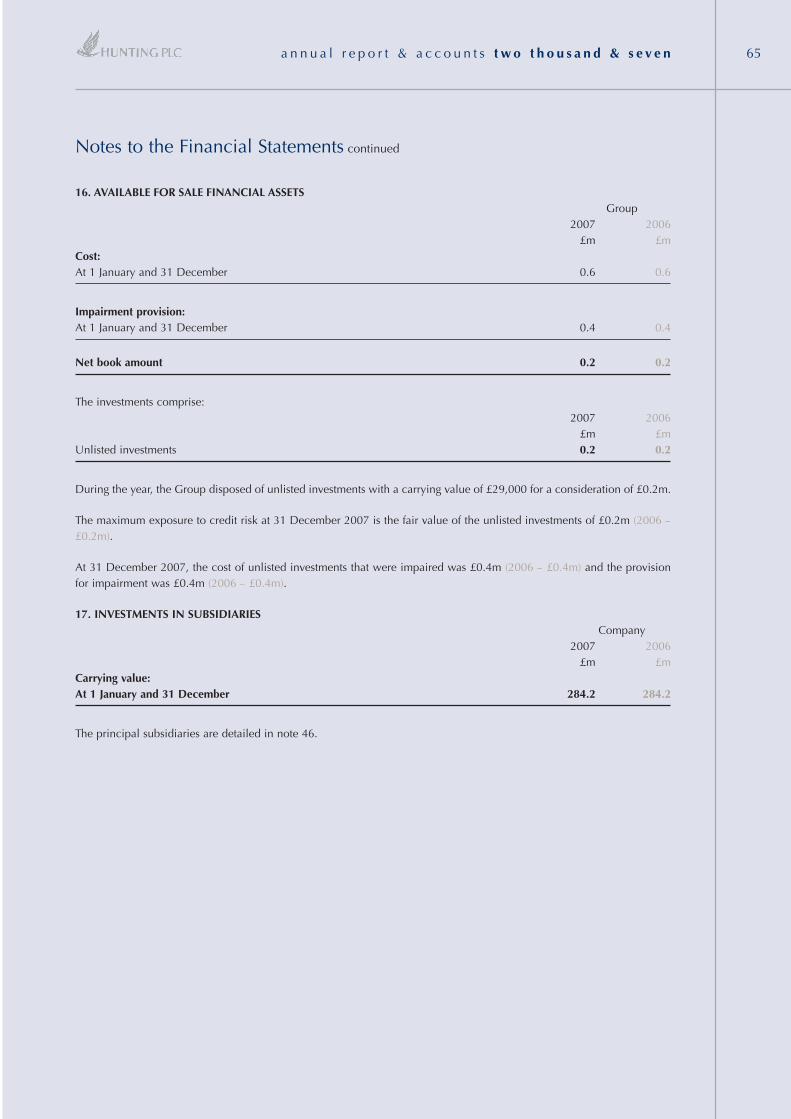
a n n u a l r e p o r t & a c c o u n t s t w o t h o u s a n d & s e v e n 65
16. AVAILABLE FOR SALE FINANCIAL ASSETSGroup
2007 2006£m £m
Cost:At 1 January and 31 December 0.6 0.6
Impairment provision:At 1 January and 31 December 0.4 0.4
Net book amount 0.2 0.2
The investments comprise:2007 2006
£m £mUnlisted investments 0.2 0.2
During the year, the Group disposed of unlisted investments with a carrying value of £29,000 for a consideration of £0.2m.
The maximum exposure to credit risk at 31 December 2007 is the fair value of the unlisted investments of £0.2m (2006 –£0.2m).
At 31 December 2007, the cost of unlisted investments that were impaired was £0.4m (2006 – £0.4m) and the provisionfor impairment was £0.4m (2006 – £0.4m).
17. INVESTMENTS IN SUBSIDIARIESCompany
2007 2006£m £m
Carrying value:At 1 January and 31 December 284.2 284.2
The principal subsidiaries are detailed in note 46.
Notes to the Financial Statements continued
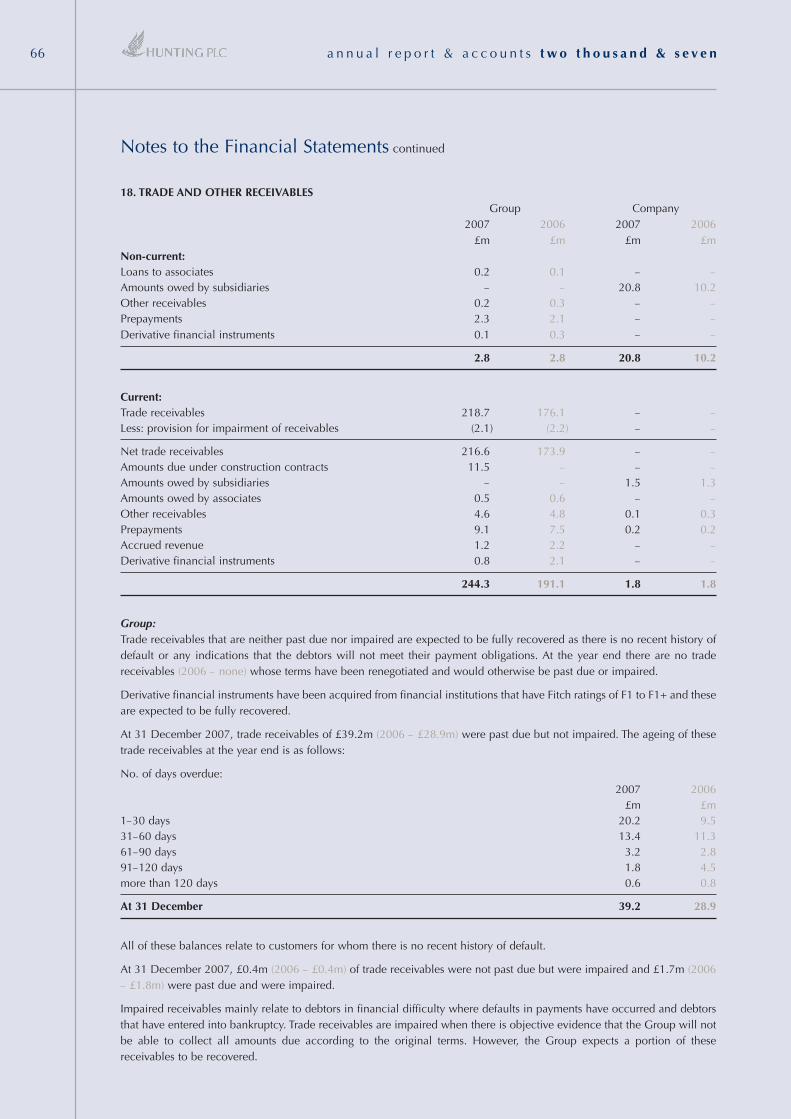
a n n u a l r e p o r t & a c c o u n t s t w o t h o u s a n d & s e v e n66
Notes to the Financial Statements continued
18. TRADE AND OTHER RECEIVABLESGroup Company
2007 2006 2007 2006£m £m £m £m
Non-current: Loans to associates 0.2 0.1 – –Amounts owed by subsidiaries – – 20.8 10.2Other receivables 0.2 0.3 – –Prepayments 2.3 2.1 – –Derivative financial instruments 0.1 0.3 – –
2.8 2.8 20.8 10.2
Current:Trade receivables 218.7 176.1 – –Less: provision for impairment of receivables (2.1) (2.2) – –
Net trade receivables 216.6 173.9 – –Amounts due under construction contracts 11.5 – – –Amounts owed by subsidiaries – – 1.5 1.3Amounts owed by associates 0.5 0.6 – –Other receivables 4.6 4.8 0.1 0.3Prepayments 9.1 7.5 0.2 0.2Accrued revenue 1.2 2.2 – –Derivative financial instruments 0.8 2.1 – –
244.3 191.1 1.8 1.8
Group:Trade receivables that are neither past due nor impaired are expected to be fully recovered as there is no recent history ofdefault or any indications that the debtors will not meet their payment obligations. At the year end there are no tradereceivables (2006 – none) whose terms have been renegotiated and would otherwise be past due or impaired.
Derivative financial instruments have been acquired from financial institutions that have Fitch ratings of F1 to F1+ and theseare expected to be fully recovered.
At 31 December 2007, trade receivables of £39.2m (2006 – £28.9m) were past due but not impaired. The ageing of thesetrade receivables at the year end is as follows:
No. of days overdue:2007 2006
£m £m1–30 days 20.2 9.531–60 days 13.4 11.361–90 days 3.2 2.891–120 days 1.8 4.5more than 120 days 0.6 0.8
At 31 December 39.2 28.9
All of these balances relate to customers for whom there is no recent history of default.
At 31 December 2007, £0.4m (2006 – £0.4m) of trade receivables were not past due but were impaired and £1.7m (2006– £1.8m) were past due and were impaired.
Impaired receivables mainly relate to debtors in financial difficulty where defaults in payments have occurred and debtorsthat have entered into bankruptcy. Trade receivables are impaired when there is objective evidence that the Group will notbe able to collect all amounts due according to the original terms. However, the Group expects a portion of thesereceivables to be recovered.
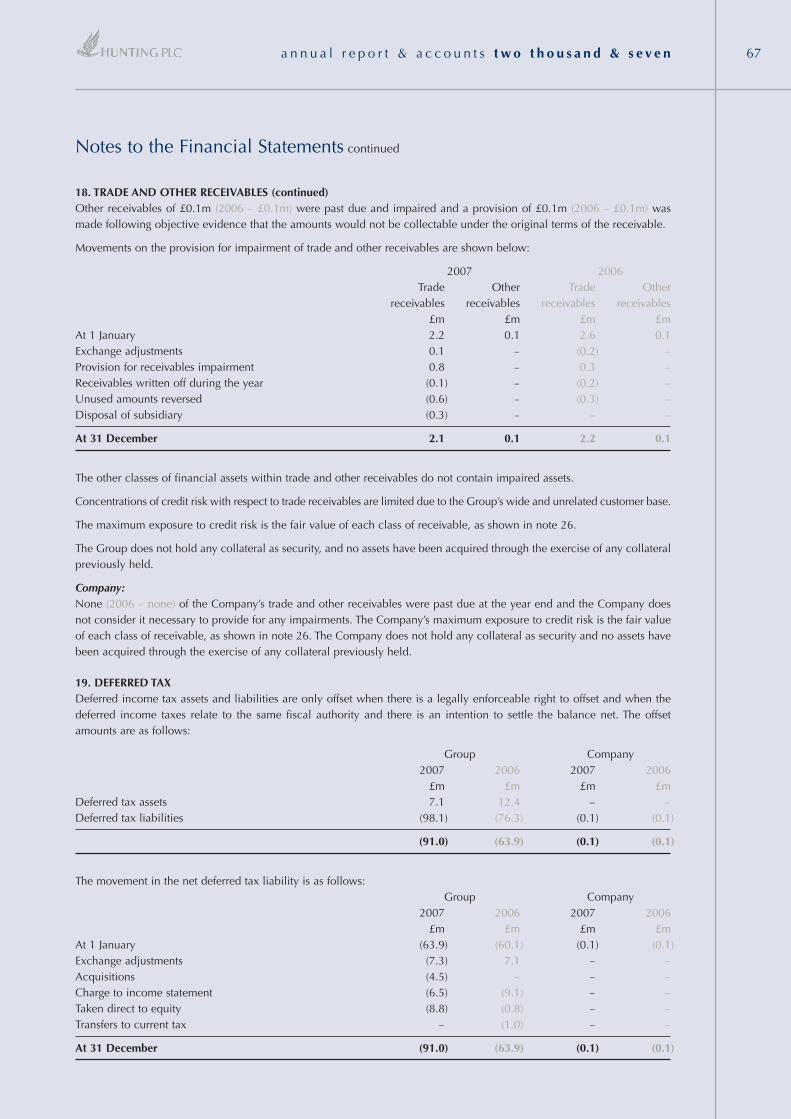
a n n u a l r e p o r t & a c c o u n t s t w o t h o u s a n d & s e v e n 67
18. TRADE AND OTHER RECEIVABLES (continued)Other receivables of £0.1m (2006 – £0.1m) were past due and impaired and a provision of £0.1m (2006 – £0.1m) wasmade following objective evidence that the amounts would not be collectable under the original terms of the receivable.
Movements on the provision for impairment of trade and other receivables are shown below:
2007 2006Trade Other Trade Other
receivables receivables receivables receivables£m £m £m £m
At 1 January 2.2 0.1 2.6 0.1Exchange adjustments 0.1 – (0.2) –Provision for receivables impairment 0.8 – 0.3 –Receivables written off during the year (0.1) – (0.2) –Unused amounts reversed (0.6) – (0.3) –Disposal of subsidiary (0.3) – – –
At 31 December 2.1 0.1 2.2 0.1
The other classes of financial assets within trade and other receivables do not contain impaired assets.
Concentrations of credit risk with respect to trade receivables are limited due to the Group’s wide and unrelated customer base.
The maximum exposure to credit risk is the fair value of each class of receivable, as shown in note 26.
The Group does not hold any collateral as security, and no assets have been acquired through the exercise of any collateralpreviously held.
Company:None (2006 – none) of the Company’s trade and other receivables were past due at the year end and the Company doesnot consider it necessary to provide for any impairments. The Company’s maximum exposure to credit risk is the fair valueof each class of receivable, as shown in note 26. The Company does not hold any collateral as security and no assets havebeen acquired through the exercise of any collateral previously held.
19. DEFERRED TAXDeferred income tax assets and liabilities are only offset when there is a legally enforceable right to offset and when thedeferred income taxes relate to the same fiscal authority and there is an intention to settle the balance net. The offsetamounts are as follows:
Group Company2007 2006 2007 2006
£m £m £m £mDeferred tax assets 7.1 12.4 – –Deferred tax liabilities (98.1) (76.3) (0.1) (0.1)
(91.0) (63.9) (0.1) (0.1)
The movement in the net deferred tax liability is as follows:Group Company
2007 2006 2007 2006£m £m £m £m
At 1 January (63.9) (60.1) (0.1) (0.1)Exchange adjustments (7.3) 7.1 – –Acquisitions (4.5) – – –Charge to income statement (6.5) (9.1) – –Taken direct to equity (8.8) (0.8) – –Transfers to current tax – (1.0) – –
At 31 December (91.0) (63.9) (0.1) (0.1)
Notes to the Financial Statements continued
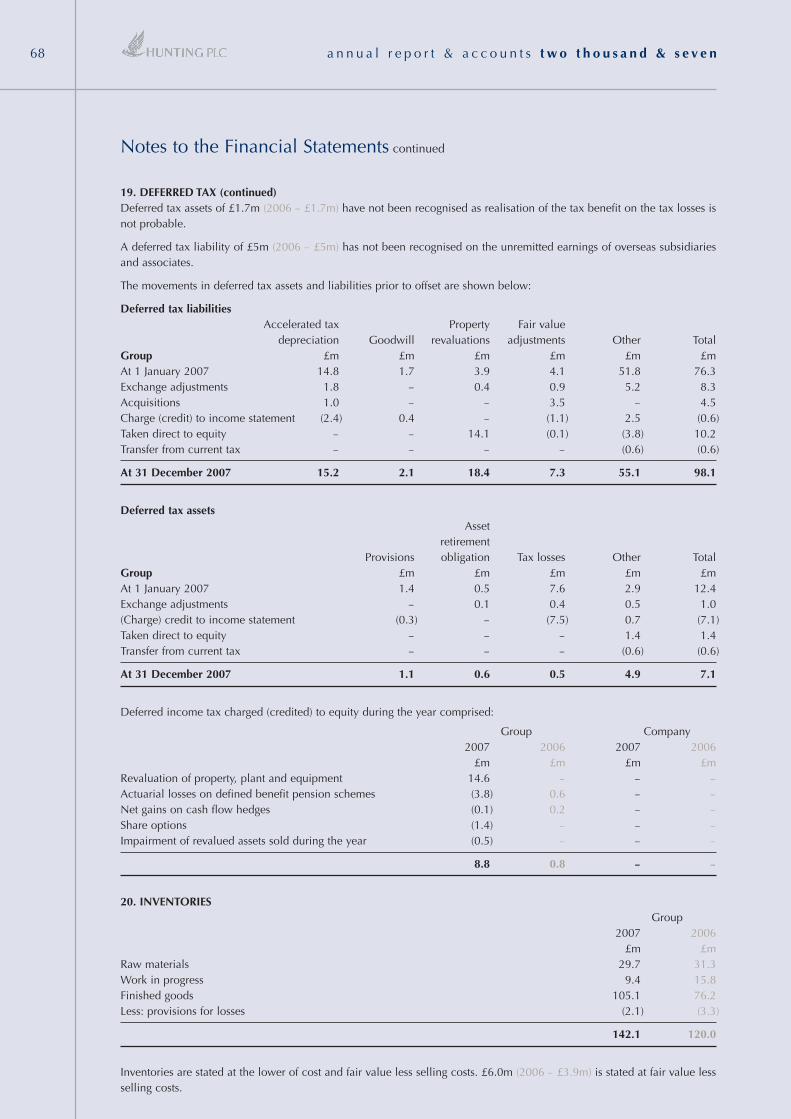
a n n u a l r e p o r t & a c c o u n t s t w o t h o u s a n d & s e v e n68
Notes to the Financial Statements continued
19. DEFERRED TAX (continued)Deferred tax assets of £1.7m (2006 – £1.7m) have not been recognised as realisation of the tax benefit on the tax losses isnot probable.
A deferred tax liability of £5m (2006 – £5m) has not been recognised on the unremitted earnings of overseas subsidiariesand associates.
The movements in deferred tax assets and liabilities prior to offset are shown below:
Deferred tax liabilitiesAccelerated tax Property Fair value
depreciation Goodwill revaluations adjustments Other TotalGroup £m £m £m £m £m £mAt 1 January 2007 14.8 1.7 3.9 4.1 51.8 76.3Exchange adjustments 1.8 – 0.4 0.9 5.2 8.3Acquisitions 1.0 – – 3.5 – 4.5Charge (credit) to income statement (2.4) 0.4 – (1.1) 2.5 (0.6)Taken direct to equity – – 14.1 (0.1) (3.8) 10.2Transfer from current tax – – – – (0.6) (0.6)
At 31 December 2007 15.2 2.1 18.4 7.3 55.1 98.1
Deferred tax assetsAsset
retirementProvisions obligation Tax losses Other Total
Group £m £m £m £m £mAt 1 January 2007 1.4 0.5 7.6 2.9 12.4Exchange adjustments – 0.1 0.4 0.5 1.0(Charge) credit to income statement (0.3) – (7.5) 0.7 (7.1)Taken direct to equity – – – 1.4 1.4Transfer from current tax – – – (0.6) (0.6)
At 31 December 2007 1.1 0.6 0.5 4.9 7.1
Deferred income tax charged (credited) to equity during the year comprised:
Group Company2007 2006 2007 2006
£m £m £m £mRevaluation of property, plant and equipment 14.6 – – –Actuarial losses on defined benefit pension schemes (3.8) 0.6 – –Net gains on cash flow hedges (0.1) 0.2 – –Share options (1.4) – – –Impairment of revalued assets sold during the year (0.5) – – –
8.8 0.8 – –
20. INVENTORIESGroup
2007 2006£m £m
Raw materials 29.7 31.3Work in progress 9.4 15.8Finished goods 105.1 76.2Less: provisions for losses (2.1) (3.3)
142.1 120.0
Inventories are stated at the lower of cost and fair value less selling costs. £6.0m (2006 – £3.9m) is stated at fair value lessselling costs.
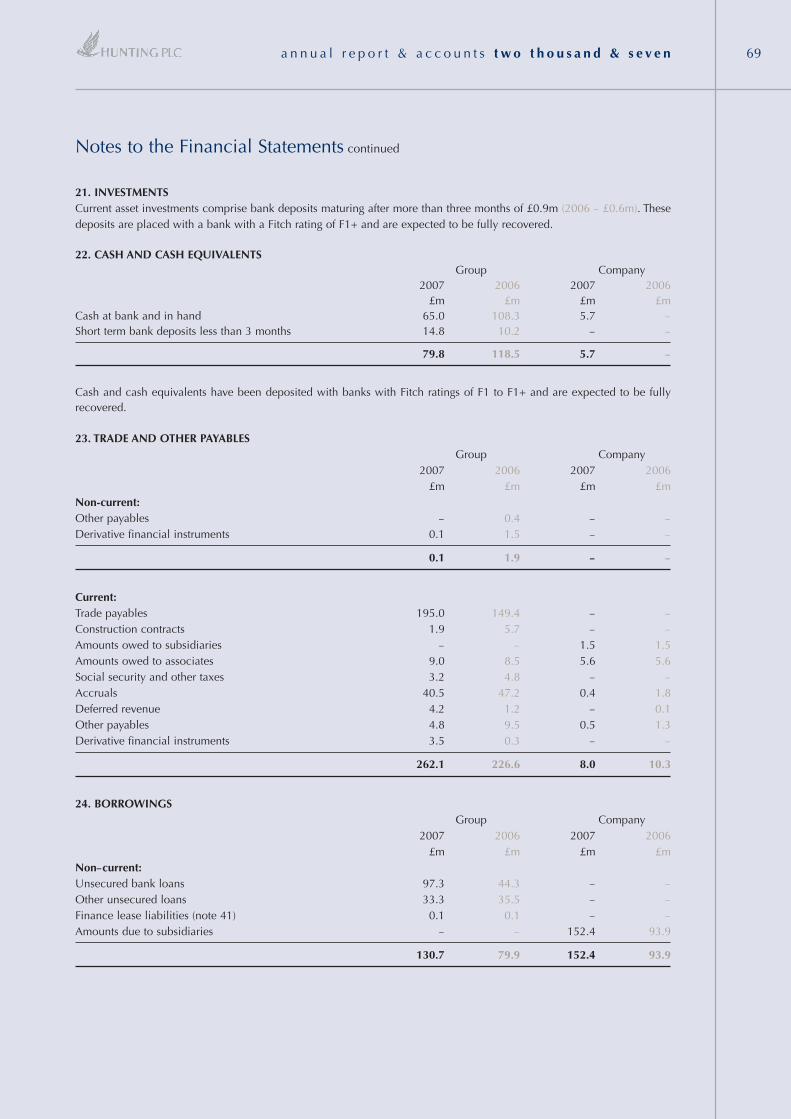
a n n u a l r e p o r t & a c c o u n t s t w o t h o u s a n d & s e v e n 69
21. INVESTMENTSCurrent asset investments comprise bank deposits maturing after more than three months of £0.9m (2006 – £0.6m). Thesedeposits are placed with a bank with a Fitch rating of F1+ and are expected to be fully recovered.
22. CASH AND CASH EQUIVALENTSGroup Company
2007 2006 2007 2006£m £m £m £m
Cash at bank and in hand 65.0 108.3 5.7 –Short term bank deposits less than 3 months 14.8 10.2 – –
79.8 118.5 5.7 –
Cash and cash equivalents have been deposited with banks with Fitch ratings of F1 to F1+ and are expected to be fullyrecovered.
23. TRADE AND OTHER PAYABLESGroup Company
2007 2006 2007 2006£m £m £m £m
Non-current:Other payables – 0.4 – –Derivative financial instruments 0.1 1.5 – –
0.1 1.9 – –
Current:Trade payables 195.0 149.4 – –Construction contracts 1.9 5.7 – –Amounts owed to subsidiaries – – 1.5 1.5Amounts owed to associates 9.0 8.5 5.6 5.6Social security and other taxes 3.2 4.8 – –Accruals 40.5 47.2 0.4 1.8Deferred revenue 4.2 1.2 – 0.1Other payables 4.8 9.5 0.5 1.3Derivative financial instruments 3.5 0.3 – –
262.1 226.6 8.0 10.3
24. BORROWINGSGroup Company
2007 2006 2007 2006£m £m £m £m
Non–current:Unsecured bank loans 97.3 44.3 – –Other unsecured loans 33.3 35.5 – –Finance lease liabilities (note 41) 0.1 0.1 – –Amounts due to subsidiaries – – 152.4 93.9
130.7 79.9 152.4 93.9
Notes to the Financial Statements continued
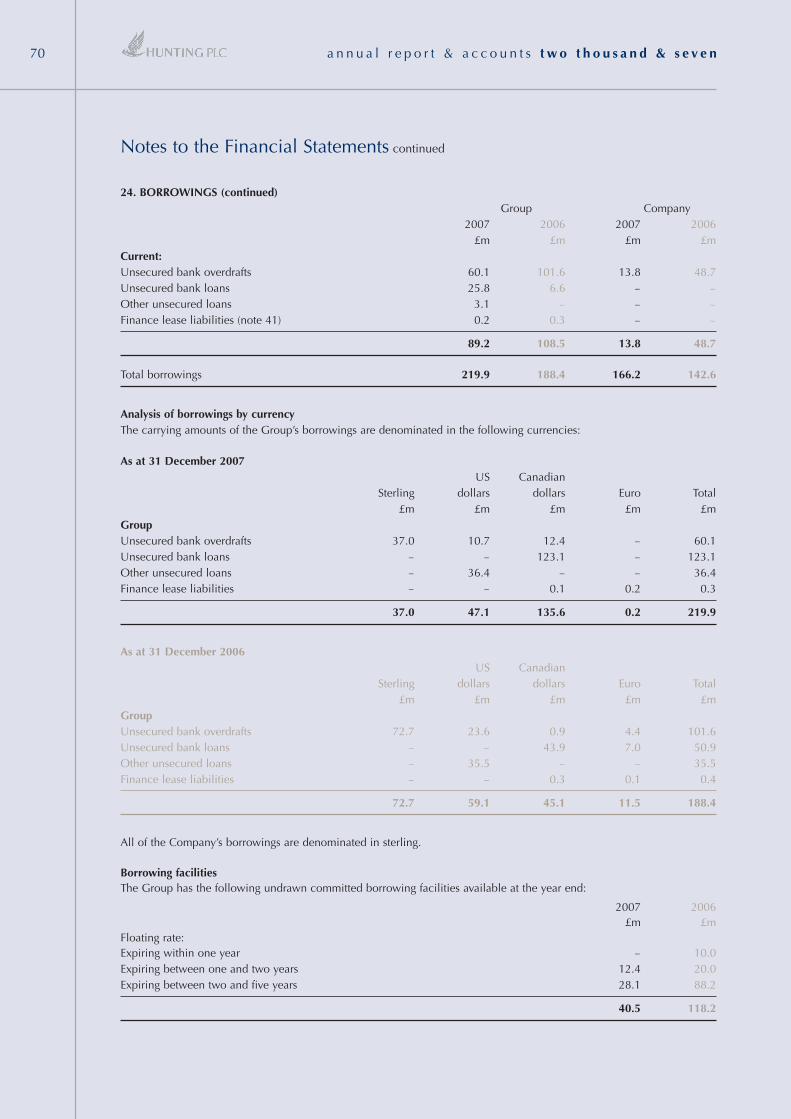
a n n u a l r e p o r t & a c c o u n t s t w o t h o u s a n d & s e v e n70
Notes to the Financial Statements continued
24. BORROWINGS (continued)Group Company
2007 2006 2007 2006£m £m £m £m
Current:Unsecured bank overdrafts 60.1 101.6 13.8 48.7Unsecured bank loans 25.8 6.6 – –Other unsecured loans 3.1 – – –Finance lease liabilities (note 41) 0.2 0.3 – –
89.2 108.5 13.8 48.7
Total borrowings 219.9 188.4 166.2 142.6
Analysis of borrowings by currencyThe carrying amounts of the Group’s borrowings are denominated in the following currencies:
As at 31 December 2007US Canadian
Sterling dollars dollars Euro Total£m £m £m £m £m
GroupUnsecured bank overdrafts 37.0 10.7 12.4 – 60.1Unsecured bank loans – – 123.1 – 123.1Other unsecured loans – 36.4 – – 36.4Finance lease liabilities – – 0.1 0.2 0.3
37.0 47.1 135.6 0.2 219.9
As at 31 December 2006US Canadian
Sterling dollars dollars Euro Total£m £m £m £m £m
GroupUnsecured bank overdrafts 72.7 23.6 0.9 4.4 101.6Unsecured bank loans – – 43.9 7.0 50.9Other unsecured loans – 35.5 – – 35.5Finance lease liabilities – – 0.3 0.1 0.4
72.7 59.1 45.1 11.5 188.4
All of the Company’s borrowings are denominated in sterling.
Borrowing facilitiesThe Group has the following undrawn committed borrowing facilities available at the year end:
2007 2006£m £m
Floating rate:Expiring within one year – 10.0Expiring between one and two years 12.4 20.0Expiring between two and five years 28.1 88.2
40.5 118.2
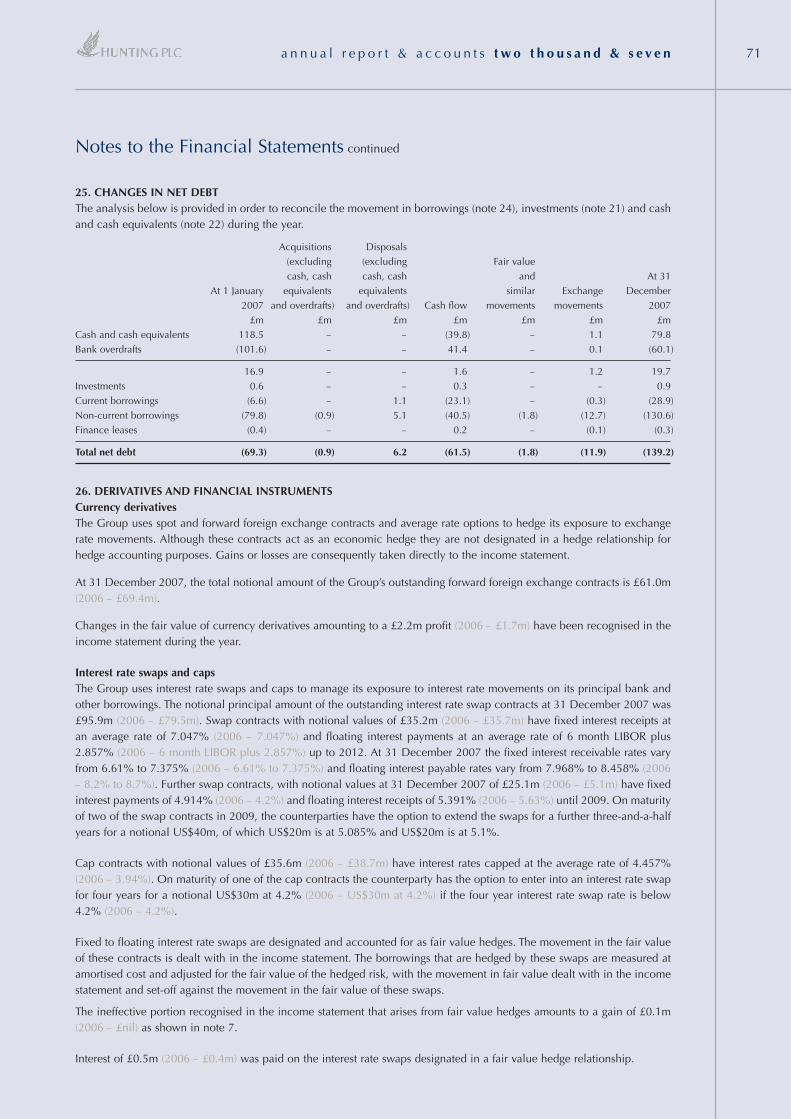
a n n u a l r e p o r t & a c c o u n t s t w o t h o u s a n d & s e v e n 71
25. CHANGES IN NET DEBTThe analysis below is provided in order to reconcile the movement in borrowings (note 24), investments (note 21) and cashand cash equivalents (note 22) during the year.
Acquisitions Disposals(excluding (excluding Fair valuecash, cash cash, cash and At 31
At 1 January equivalents equivalents similar Exchange December2007 and overdrafts) and overdrafts) Cash flow movements movements 2007
£m £m £m £m £m £m £mCash and cash equivalents 118.5 – – (39.8) – 1.1 79.8Bank overdrafts (101.6) – – 41.4 – 0.1 (60.1)
16.9 – – 1.6 – 1.2 19.7Investments 0.6 – – 0.3 – – 0.9Current borrowings (6.6) – 1.1 (23.1) – (0.3) (28.9)Non-current borrowings (79.8) (0.9) 5.1 (40.5) (1.8) (12.7) (130.6)Finance leases (0.4) – – 0.2 – (0.1) (0.3)
Total net debt (69.3) (0.9) 6.2 (61.5) (1.8) (11.9) (139.2)
26. DERIVATIVES AND FINANCIAL INSTRUMENTSCurrency derivativesThe Group uses spot and forward foreign exchange contracts and average rate options to hedge its exposure to exchangerate movements. Although these contracts act as an economic hedge they are not designated in a hedge relationship forhedge accounting purposes. Gains or losses are consequently taken directly to the income statement.
At 31 December 2007, the total notional amount of the Group’s outstanding forward foreign exchange contracts is £61.0m(2006 – £69.4m).
Changes in the fair value of currency derivatives amounting to a £2.2m profit (2006 – £1.7m) have been recognised in theincome statement during the year.
Interest rate swaps and capsThe Group uses interest rate swaps and caps to manage its exposure to interest rate movements on its principal bank andother borrowings. The notional principal amount of the outstanding interest rate swap contracts at 31 December 2007 was£95.9m (2006 – £79.5m). Swap contracts with notional values of £35.2m (2006 – £35.7m) have fixed interest receipts atan average rate of 7.047% (2006 – 7.047%) and floating interest payments at an average rate of 6 month LIBOR plus2.857% (2006 – 6 month LIBOR plus 2.857%) up to 2012. At 31 December 2007 the fixed interest receivable rates varyfrom 6.61% to 7.375% (2006 – 6.61% to 7.375%) and floating interest payable rates vary from 7.968% to 8.458% (2006– 8.2% to 8.7%). Further swap contracts, with notional values at 31 December 2007 of £25.1m (2006 – £5.1m) have fixedinterest payments of 4.914% (2006 – 4.2%) and floating interest receipts of 5.391% (2006 – 5.63%) until 2009. On maturityof two of the swap contracts in 2009, the counterparties have the option to extend the swaps for a further three-and-a-halfyears for a notional US$40m, of which US$20m is at 5.085% and US$20m is at 5.1%.
Cap contracts with notional values of £35.6m (2006 – £38.7m) have interest rates capped at the average rate of 4.457%(2006 – 3.94%). On maturity of one of the cap contracts the counterparty has the option to enter into an interest rate swapfor four years for a notional US$30m at 4.2% (2006 – US$30m at 4.2%) if the four year interest rate swap rate is below4.2% (2006 – 4.2%).
Fixed to floating interest rate swaps are designated and accounted for as fair value hedges. The movement in the fair valueof these contracts is dealt with in the income statement. The borrowings that are hedged by these swaps are measured atamortised cost and adjusted for the fair value of the hedged risk, with the movement in fair value dealt with in the incomestatement and set-off against the movement in the fair value of these swaps.
The ineffective portion recognised in the income statement that arises from fair value hedges amounts to a gain of £0.1m(2006 – £nil) as shown in note 7.
Interest of £0.5m (2006 – £0.4m) was paid on the interest rate swaps designated in a fair value hedge relationship.
Notes to the Financial Statements continued
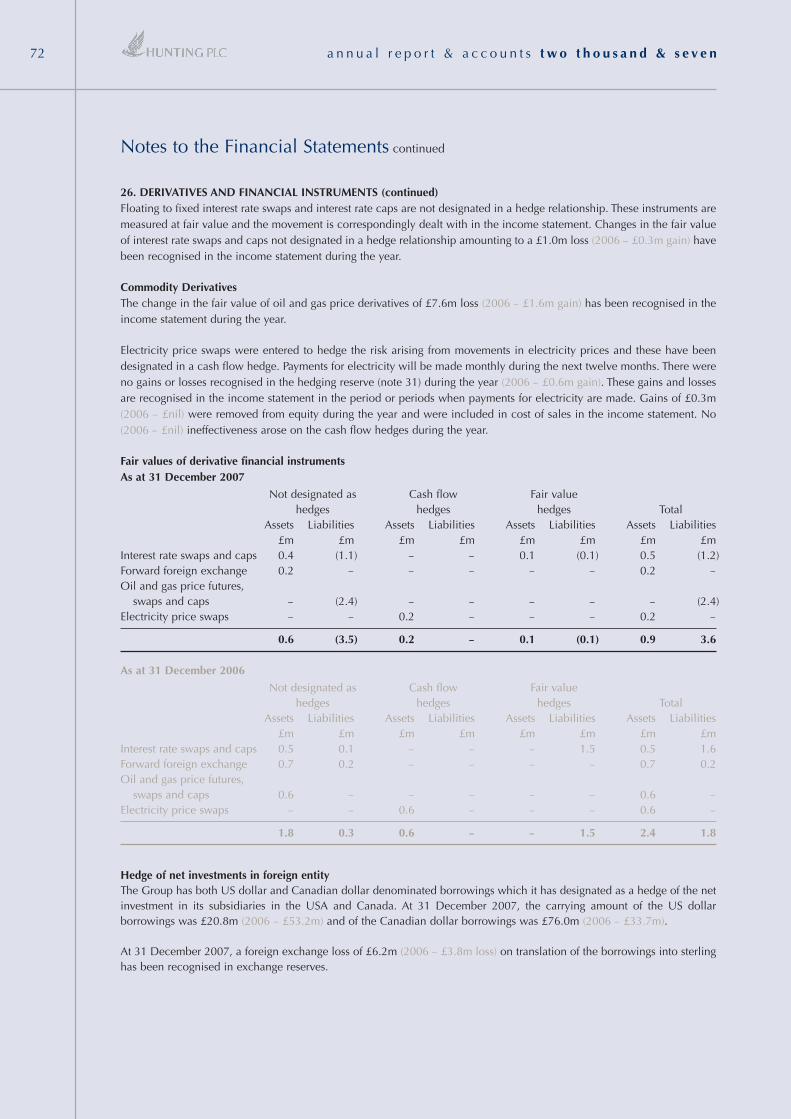
a n n u a l r e p o r t & a c c o u n t s t w o t h o u s a n d & s e v e n72
Notes to the Financial Statements continued
26. DERIVATIVES AND FINANCIAL INSTRUMENTS (continued)Floating to fixed interest rate swaps and interest rate caps are not designated in a hedge relationship. These instruments aremeasured at fair value and the movement is correspondingly dealt with in the income statement. Changes in the fair valueof interest rate swaps and caps not designated in a hedge relationship amounting to a £1.0m loss (2006 – £0.3m gain) havebeen recognised in the income statement during the year.
Commodity DerivativesThe change in the fair value of oil and gas price derivatives of £7.6m loss (2006 – £1.6m gain) has been recognised in theincome statement during the year.
Electricity price swaps were entered to hedge the risk arising from movements in electricity prices and these have beendesignated in a cash flow hedge. Payments for electricity will be made monthly during the next twelve months. There wereno gains or losses recognised in the hedging reserve (note 31) during the year (2006 – £0.6m gain). These gains and lossesare recognised in the income statement in the period or periods when payments for electricity are made. Gains of £0.3m(2006 – £nil) were removed from equity during the year and were included in cost of sales in the income statement. No(2006 – £nil) ineffectiveness arose on the cash flow hedges during the year.
Fair values of derivative financial instrumentsAs at 31 December 2007
Not designated as Cash flow Fair valuehedges hedges hedges Total
Assets Liabilities Assets Liabilities Assets Liabilities Assets Liabilities£m £m £m £m £m £m £m £m
Interest rate swaps and caps 0.4 (1.1) – – 0.1 (0.1) 0.5 (1.2)Forward foreign exchange 0.2 – – – – – 0.2 –Oil and gas price futures,
swaps and caps – (2.4) – – – – – (2.4)Electricity price swaps – – 0.2 – – – 0.2 –
0.6 (3.5) 0.2 – 0.1 (0.1) 0.9 3.6
As at 31 December 2006
Not designated as Cash flow Fair valuehedges hedges hedges Total
Assets Liabilities Assets Liabilities Assets Liabilities Assets Liabilities£m £m £m £m £m £m £m £m
Interest rate swaps and caps 0.5 0.1 – – – 1.5 0.5 1.6Forward foreign exchange 0.7 0.2 – – – – 0.7 0.2Oil and gas price futures,
swaps and caps 0.6 – – – – – 0.6 –Electricity price swaps – – 0.6 – – – 0.6 –
1.8 0.3 0.6 – – 1.5 2.4 1.8
Hedge of net investments in foreign entityThe Group has both US dollar and Canadian dollar denominated borrowings which it has designated as a hedge of the netinvestment in its subsidiaries in the USA and Canada. At 31 December 2007, the carrying amount of the US dollarborrowings was £20.8m (2006 – £53.2m) and of the Canadian dollar borrowings was £76.0m (2006 – £33.7m).
At 31 December 2007, a foreign exchange loss of £6.2m (2006 – £3.8m loss) on translation of the borrowings into sterlinghas been recognised in exchange reserves.
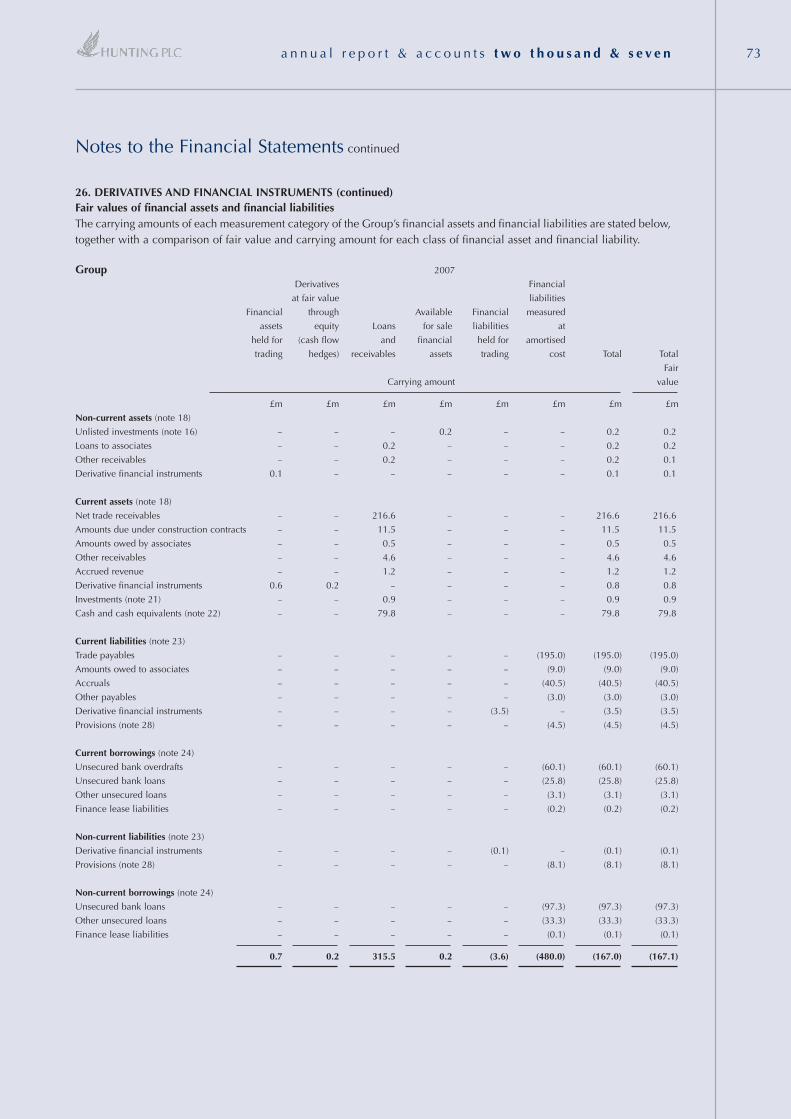
a n n u a l r e p o r t & a c c o u n t s t w o t h o u s a n d & s e v e n 73
26. DERIVATIVES AND FINANCIAL INSTRUMENTS (continued)Fair values of financial assets and financial liabilitiesThe carrying amounts of each measurement category of the Group’s financial assets and financial liabilities are stated below,together with a comparison of fair value and carrying amount for each class of financial asset and financial liability.
Group 2007
Derivatives Financial
at fair value liabilities
Financial through Available Financial measured
assets equity Loans for sale liabilities at
held for (cash flow and financial held for amortised
trading hedges) receivables assets trading cost Total Total
Fair
Carrying amount value
£m £m £m £m £m £m £m £m
Non-current assets (note 18)
Unlisted investments (note 16) – – – 0.2 – – 0.2 0.2
Loans to associates – – 0.2 – – – 0.2 0.2
Other receivables – – 0.2 – – – 0.2 0.1
Derivative financial instruments 0.1 – – – – – 0.1 0.1
Current assets (note 18)
Net trade receivables – – 216.6 – – – 216.6 216.6
Amounts due under construction contracts – – 11.5 – – – 11.5 11.5
Amounts owed by associates – – 0.5 – – – 0.5 0.5
Other receivables – – 4.6 – – – 4.6 4.6
Accrued revenue – – 1.2 – – – 1.2 1.2
Derivative financial instruments 0.6 0.2 – – – – 0.8 0.8
Investments (note 21) – – 0.9 – – – 0.9 0.9
Cash and cash equivalents (note 22) – – 79.8 – – – 79.8 79.8
Current liabilities (note 23)
Trade payables – – – – – (195.0) (195.0) (195.0)
Amounts owed to associates – – – – – (9.0) (9.0) (9.0)
Accruals – – – – – (40.5) (40.5) (40.5)
Other payables – – – – – (3.0) (3.0) (3.0)
Derivative financial instruments – – – – (3.5) – (3.5) (3.5)
Provisions (note 28) – – – – – (4.5) (4.5) (4.5)
Current borrowings (note 24)
Unsecured bank overdrafts – – – – – (60.1) (60.1) (60.1)
Unsecured bank loans – – – – – (25.8) (25.8) (25.8)
Other unsecured loans – – – – – (3.1) (3.1) (3.1)
Finance lease liabilities – – – – – (0.2) (0.2) (0.2)
Non-current liabilities (note 23)
Derivative financial instruments – – – – (0.1) – (0.1) (0.1)
Provisions (note 28) – – – – – (8.1) (8.1) (8.1)
Non-current borrowings (note 24)
Unsecured bank loans – – – – – (97.3) (97.3) (97.3)
Other unsecured loans – – – – – (33.3) (33.3) (33.3)
Finance lease liabilities – – – – – (0.1) (0.1) (0.1)
0.7 0.2 315.5 0.2 (3.6) (480.0) (167.0) (167.1)
Notes to the Financial Statements continued
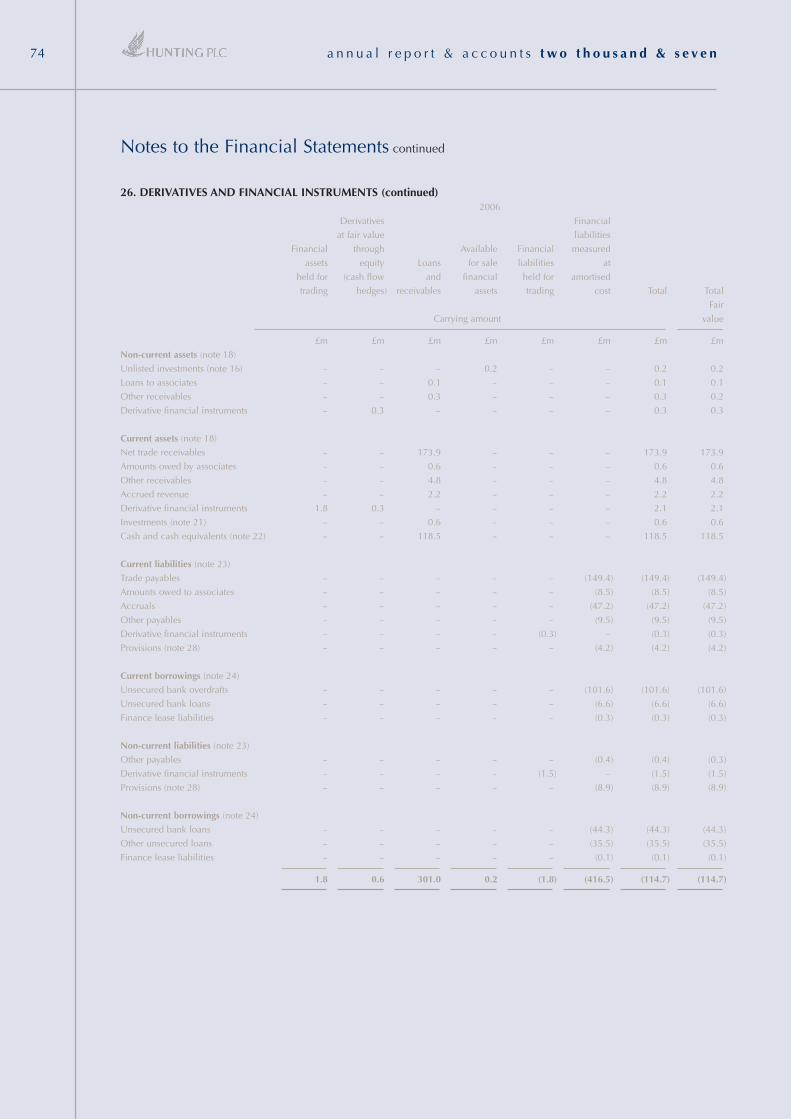
a n n u a l r e p o r t & a c c o u n t s t w o t h o u s a n d & s e v e n74
Notes to the Financial Statements continued
26. DERIVATIVES AND FINANCIAL INSTRUMENTS (continued)2006
Derivatives Financial
at fair value liabilities
Financial through Available Financial measured
assets equity Loans for sale liabilities at
held for (cash flow and financial held for amortised
trading hedges) receivables assets trading cost Total Total
Fair
Carrying amount value
£m £m £m £m £m £m £m £m
Non-current assets (note 18)
Unlisted investments (note 16) – – – 0.2 – – 0.2 0.2
Loans to associates – – 0.1 – – – 0.1 0.1
Other receivables – – 0.3 – – – 0.3 0.2
Derivative financial instruments – 0.3 – – – – 0.3 0.3
Current assets (note 18)
Net trade receivables – – 173.9 – – – 173.9 173.9
Amounts owed by associates – – 0.6 – – – 0.6 0.6
Other receivables – – 4.8 – – – 4.8 4.8
Accrued revenue – – 2.2 – – – 2.2 2.2
Derivative financial instruments 1.8 0.3 – – – – 2.1 2.1
Investments (note 21) – – 0.6 – – – 0.6 0.6
Cash and cash equivalents (note 22) – – 118.5 – – – 118.5 118.5
Current liabilities (note 23)
Trade payables – – – – – (149.4) (149.4) (149.4)
Amounts owed to associates – – – – – (8.5) (8.5) (8.5)
Accruals – – – – – (47.2) (47.2) (47.2)
Other payables – – – – – (9.5) (9.5) (9.5)
Derivative financial instruments – – – – (0.3) – (0.3) (0.3)
Provisions (note 28) – – – – – (4.2) (4.2) (4.2)
Current borrowings (note 24)
Unsecured bank overdrafts – – – – – (101.6) (101.6) (101.6)
Unsecured bank loans – – – – – (6.6) (6.6) (6.6)
Finance lease liabilities – – – – – (0.3) (0.3) (0.3)
Non-current liabilities (note 23)
Other payables – – – – – (0.4) (0.4) (0.3)
Derivative financial instruments – – – – (1.5) – (1.5) (1.5)
Provisions (note 28) – – – – – (8.9) (8.9) (8.9)
Non-current borrowings (note 24)
Unsecured bank loans – – – – – (44.3) (44.3) (44.3)
Other unsecured loans – – – – – (35.5) (35.5) (35.5)
Finance lease liabilities – – – – – (0.1) (0.1) (0.1)
1.8 0.6 301.0 0.2 (1.8) (416.5) (114.7) (114.7)
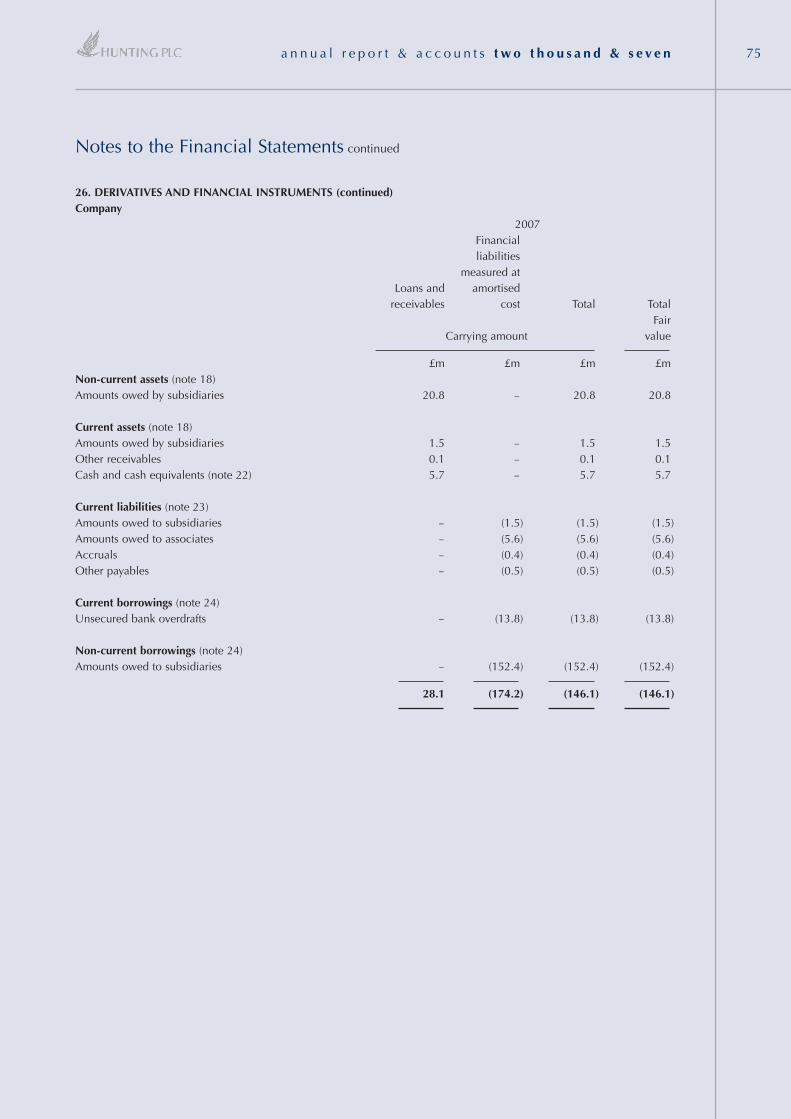
a n n u a l r e p o r t & a c c o u n t s t w o t h o u s a n d & s e v e n 75
26. DERIVATIVES AND FINANCIAL INSTRUMENTS (continued)Company
2007Financialliabilities
measured atLoans and amortised
receivables cost Total TotalFair
Carrying amount value
£m £m £m £mNon-current assets (note 18)Amounts owed by subsidiaries 20.8 – 20.8 20.8
Current assets (note 18)Amounts owed by subsidiaries 1.5 – 1.5 1.5Other receivables 0.1 – 0.1 0.1Cash and cash equivalents (note 22) 5.7 – 5.7 5.7
Current liabilities (note 23)Amounts owed to subsidiaries – (1.5) (1.5) (1.5)Amounts owed to associates – (5.6) (5.6) (5.6)Accruals – (0.4) (0.4) (0.4)Other payables – (0.5) (0.5) (0.5)
Current borrowings (note 24)Unsecured bank overdrafts – (13.8) (13.8) (13.8)
Non-current borrowings (note 24)Amounts owed to subsidiaries – (152.4) (152.4) (152.4)
28.1 (174.2) (146.1) (146.1)
Notes to the Financial Statements continued
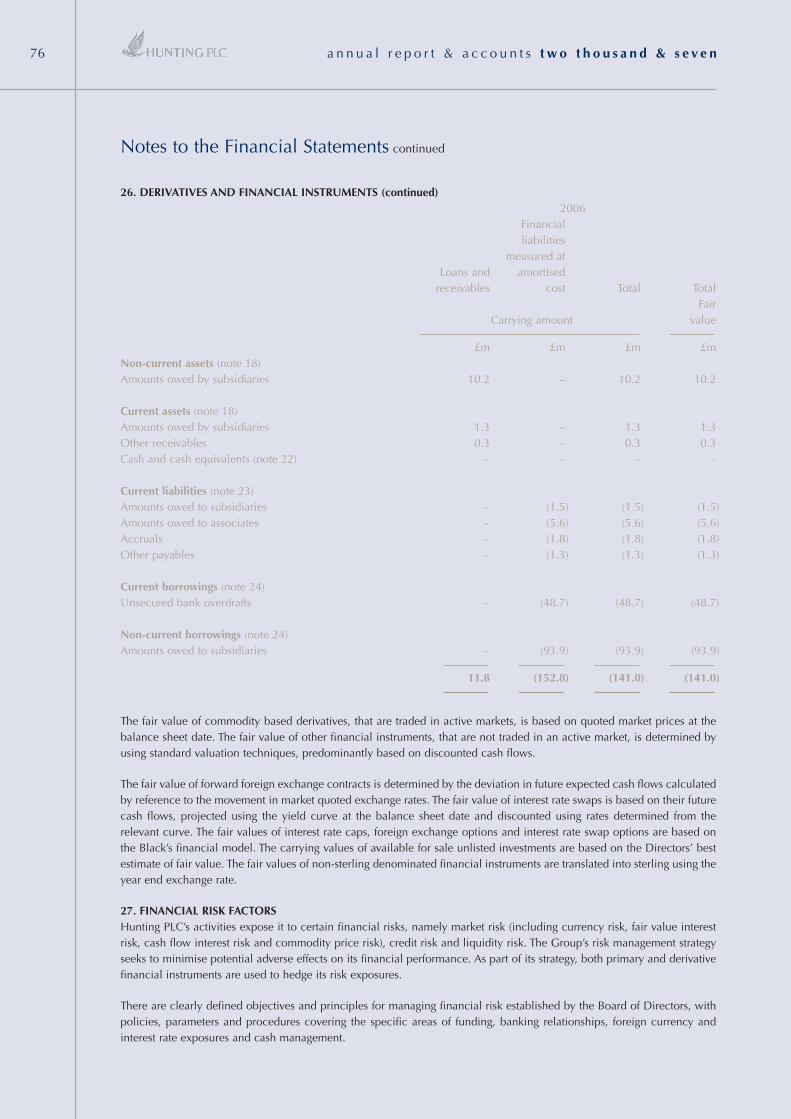
a n n u a l r e p o r t & a c c o u n t s t w o t h o u s a n d & s e v e n76
Notes to the Financial Statements continued
26. DERIVATIVES AND FINANCIAL INSTRUMENTS (continued)2006
Financialliabilities
measured atLoans and amortised
receivables cost Total TotalFair
Carrying amount value
£m £m £m £mNon-current assets (note 18)Amounts owed by subsidiaries 10.2 – 10.2 10.2
Current assets (note 18)Amounts owed by subsidiaries 1.3 – 1.3 1.3Other receivables 0.3 – 0.3 0.3Cash and cash equivalents (note 22) – – – –
Current liabilities (note 23)Amounts owed to subsidiaries – (1.5) (1.5) (1.5)Amounts owed to associates – (5.6) (5.6) (5.6)Accruals – (1.8) (1.8) (1.8)Other payables – (1.3) (1.3) (1.3)
Current borrowings (note 24)Unsecured bank overdrafts – (48.7) (48.7) (48.7)
Non-current borrowings (note 24)Amounts owed to subsidiaries – (93.9) (93.9) (93.9)
11.8 (152.8) (141.0) (141.0)
The fair value of commodity based derivatives, that are traded in active markets, is based on quoted market prices at thebalance sheet date. The fair value of other financial instruments, that are not traded in an active market, is determined byusing standard valuation techniques, predominantly based on discounted cash flows.
The fair value of forward foreign exchange contracts is determined by the deviation in future expected cash flows calculatedby reference to the movement in market quoted exchange rates. The fair value of interest rate swaps is based on their futurecash flows, projected using the yield curve at the balance sheet date and discounted using rates determined from therelevant curve. The fair values of interest rate caps, foreign exchange options and interest rate swap options are based onthe Black’s financial model. The carrying values of available for sale unlisted investments are based on the Directors’ bestestimate of fair value. The fair values of non-sterling denominated financial instruments are translated into sterling using theyear end exchange rate.
27. FINANCIAL RISK FACTORSHunting PLC’s activities expose it to certain financial risks, namely market risk (including currency risk, fair value interestrisk, cash flow interest risk and commodity price risk), credit risk and liquidity risk. The Group’s risk management strategyseeks to minimise potential adverse effects on its financial performance. As part of its strategy, both primary and derivativefinancial instruments are used to hedge its risk exposures.
There are clearly defined objectives and principles for managing financial risk established by the Board of Directors, withpolicies, parameters and procedures covering the specific areas of funding, banking relationships, foreign currency andinterest rate exposures and cash management.
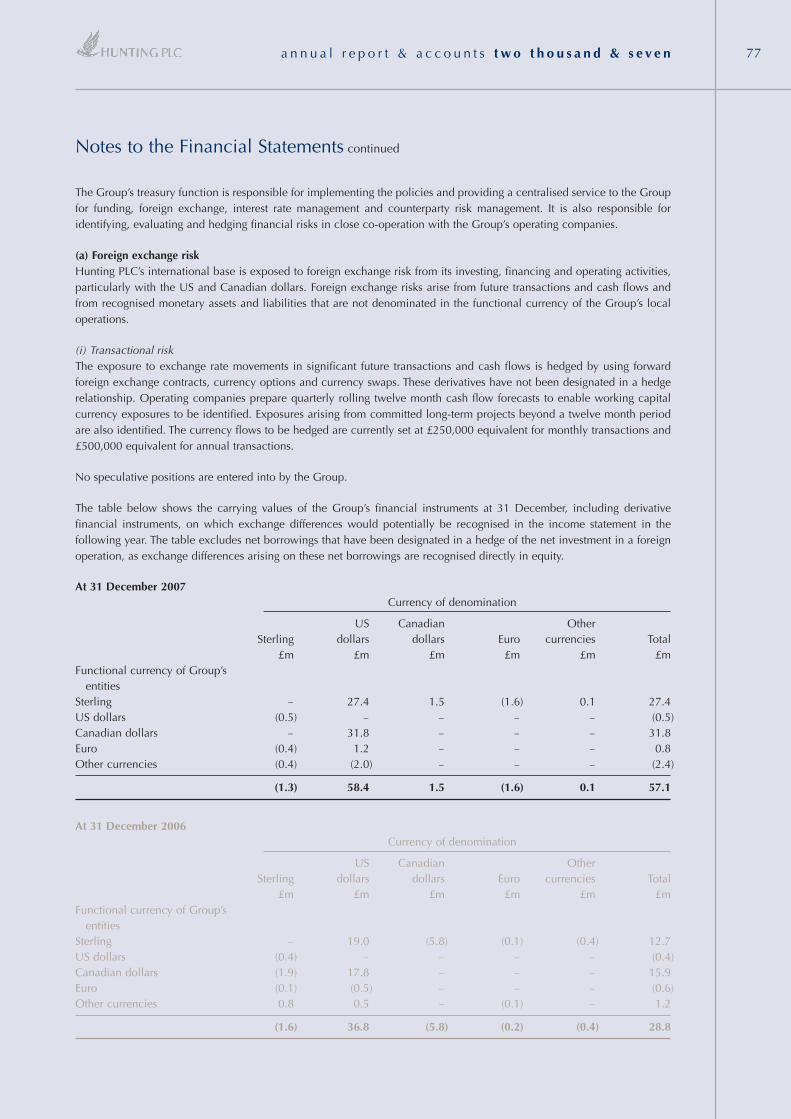
a n n u a l r e p o r t & a c c o u n t s t w o t h o u s a n d & s e v e n 77
The Group’s treasury function is responsible for implementing the policies and providing a centralised service to the Groupfor funding, foreign exchange, interest rate management and counterparty risk management. It is also responsible foridentifying, evaluating and hedging financial risks in close co-operation with the Group’s operating companies.
(a) Foreign exchange riskHunting PLC’s international base is exposed to foreign exchange risk from its investing, financing and operating activities,particularly with the US and Canadian dollars. Foreign exchange risks arise from future transactions and cash flows andfrom recognised monetary assets and liabilities that are not denominated in the functional currency of the Group’s localoperations.
(i) Transactional riskThe exposure to exchange rate movements in significant future transactions and cash flows is hedged by using forwardforeign exchange contracts, currency options and currency swaps. These derivatives have not been designated in a hedgerelationship. Operating companies prepare quarterly rolling twelve month cash flow forecasts to enable working capitalcurrency exposures to be identified. Exposures arising from committed long-term projects beyond a twelve month periodare also identified. The currency flows to be hedged are currently set at £250,000 equivalent for monthly transactions and£500,000 equivalent for annual transactions.
No speculative positions are entered into by the Group.
The table below shows the carrying values of the Group’s financial instruments at 31 December, including derivativefinancial instruments, on which exchange differences would potentially be recognised in the income statement in thefollowing year. The table excludes net borrowings that have been designated in a hedge of the net investment in a foreignoperation, as exchange differences arising on these net borrowings are recognised directly in equity.
At 31 December 2007Currency of denomination
US Canadian OtherSterling dollars dollars Euro currencies Total
£m £m £m £m £m £mFunctional currency of Group’s
entitiesSterling – 27.4 1.5 (1.6) 0.1 27.4US dollars (0.5) – – – – (0.5)Canadian dollars – 31.8 – – – 31.8Euro (0.4) 1.2 – – – 0.8Other currencies (0.4) (2.0) – – – (2.4)
(1.3) 58.4 1.5 (1.6) 0.1 57.1
At 31 December 2006Currency of denomination
US Canadian OtherSterling dollars dollars Euro currencies Total
£m £m £m £m £m £mFunctional currency of Group’s
entitiesSterling – 19.0 (5.8) (0.1) (0.4) 12.7US dollars (0.4) – – – – (0.4)Canadian dollars (1.9) 17.8 – – – 15.9Euro (0.1) (0.5) – – – (0.6)Other currencies 0.8 0.5 – (0.1) – 1.2
(1.6) 36.8 (5.8) (0.2) (0.4) 28.8
Notes to the Financial Statements continued
a n n u a l r e p o r t & a c c o u n t s t w o t h o u s a n d & s e v e n78
Notes to the Financial Statements continued
27. FINANCIAL RISK FACTORS (continued)The US dollar denominated financial instruments consist mainly of trade receivables and inter-group loans. The Canadiandollar denominated financial instruments consist of borrowings in that currency.
(ii) Translational riskForeign exchange risk also arises from Hunting PLC’s investments in foreign operations. Average rate options are used toreduce translation risk on the Group’s consolidated profit before tax by hedging the translation of approximately 50% ofbudgeted Canadian and US dollar earnings into sterling. These derivatives are not designated as a hedge.
The foreign exchange exposure to net investments in foreign operations is managed using borrowings denominated in thesame functional currency as that of the hedged net assets. The foreign exchange exposure primarily arises from US dollarand Canadian dollar denominated net assets. These borrowings are designated as a hedge of the net investment in foreignoperations.
(b) Interest rate riskBorrowings at variable interest rates expose the Group to cash flow risk and borrowings at fixed interest rates expose it tofair value risk. The Group’s policy is to minimise interest costs and changes in the market value of debt. A significantproportion of the budgeted annual interest cost is fixed to ensure some predictability of the interest charge. In order toachieve this, derivative financial instruments, such as interest rate swaps, swaptions and option based products (caps, collarsand floors) are used.
(c) Commodity price riskThe Group is exposed to changes in the price of oil, gas and electricity commodities and these are monitored regularly.
Oil and gas price futures and swaps are used to hedge the exposure to oil and gas price movements. These derivatives arenot designated in a hedge. Electricity price swaps are used to hedge the exposure to electricity prices in Canada and aredesignated in a cash flow hedge.
The character of financial and price risks and the management of these risks has not significantly changed during thefinancial year or since the year end.
(d) Credit riskThe Group’s credit risk arises from its cash and cash equivalents, deposits, derivative financial instruments and outstandingreceivables.
At the year end, the Group had credit risk exposures to a wide range of counterparties. Credit risk exposure is continuallymonitored and no individual exposure is considered to be significant in the context of the ordinary course of the Group’sactivities. Financing transactions are with leading financial institutions, which have Fitch ratings between F1 and F1+, andno losses are expected from non-performance of these counterparties.
Funds are only invested with approved financial institutions. Exposure limits are set for each approved counterparty, as wellas the types of transactions that may be entered into. The exposure limits are determined by the relationship with thecounterparty and other information such as official credit ratings, financial reports and press reports.
The credit risk of foreign exchange contracts and interest rate hedging contracts is calculated before the contract is acquiredand compared to the credit risk limit set for each counterparty. Credit risk is calculated as a fixed percentage of the nominalvalue of the instrument.
Trade and other receivables are continuously monitored. Credit account limits are primarily based on the credit quality ofthe customer and past experience through trading relationships. To reduce credit risk exposure from outstandingreceivables, the Group has taken out credit insurance with an external insurer, subject to certain conditions.
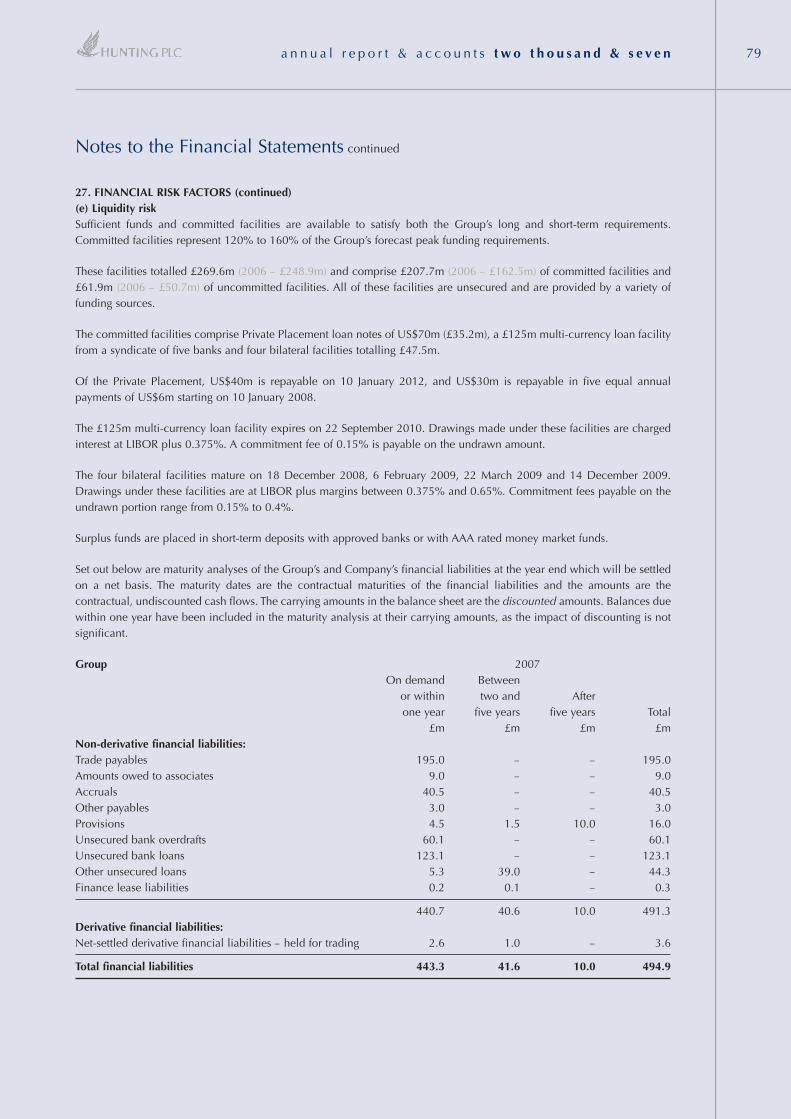
a n n u a l r e p o r t & a c c o u n t s t w o t h o u s a n d & s e v e n 79
27. FINANCIAL RISK FACTORS (continued)(e) Liquidity riskSufficient funds and committed facilities are available to satisfy both the Group’s long and short-term requirements.Committed facilities represent 120% to 160% of the Group’s forecast peak funding requirements.
These facilities totalled £269.6m (2006 – £248.9m) and comprise £207.7m (2006 – £162.5m) of committed facilities and£61.9m (2006 – £50.7m) of uncommitted facilities. All of these facilities are unsecured and are provided by a variety offunding sources.
The committed facilities comprise Private Placement loan notes of US$70m (£35.2m), a £125m multi-currency loan facilityfrom a syndicate of five banks and four bilateral facilities totalling £47.5m.
Of the Private Placement, US$40m is repayable on 10 January 2012, and US$30m is repayable in five equal annualpayments of US$6m starting on 10 January 2008.
The £125m multi-currency loan facility expires on 22 September 2010. Drawings made under these facilities are chargedinterest at LIBOR plus 0.375%. A commitment fee of 0.15% is payable on the undrawn amount.
The four bilateral facilities mature on 18 December 2008, 6 February 2009, 22 March 2009 and 14 December 2009.Drawings under these facilities are at LIBOR plus margins between 0.375% and 0.65%. Commitment fees payable on theundrawn portion range from 0.15% to 0.4%.
Surplus funds are placed in short-term deposits with approved banks or with AAA rated money market funds.
Set out below are maturity analyses of the Group’s and Company’s financial liabilities at the year end which will be settledon a net basis. The maturity dates are the contractual maturities of the financial liabilities and the amounts are thecontractual, undiscounted cash flows. The carrying amounts in the balance sheet are the discounted amounts. Balances duewithin one year have been included in the maturity analysis at their carrying amounts, as the impact of discounting is notsignificant.
Group 2007On demand Between
or within two and Afterone year five years five years Total
£m £m £m £mNon-derivative financial liabilities:Trade payables 195.0 – – 195.0Amounts owed to associates 9.0 – – 9.0Accruals 40.5 – – 40.5Other payables 3.0 – – 3.0Provisions 4.5 1.5 10.0 16.0Unsecured bank overdrafts 60.1 – – 60.1Unsecured bank loans 123.1 – – 123.1Other unsecured loans 5.3 39.0 – 44.3Finance lease liabilities 0.2 0.1 – 0.3
440.7 40.6 10.0 491.3Derivative financial liabilities:Net-settled derivative financial liabilities – held for trading 2.6 1.0 – 3.6
Total financial liabilities 443.3 41.6 10.0 494.9
Notes to the Financial Statements continued

a n n u a l r e p o r t & a c c o u n t s t w o t h o u s a n d & s e v e n80
Notes to the Financial Statements continued
27. FINANCIAL RISK FACTORS (continued)2006
On demand Betweenor within two and Afterone year five years five years Total
£m £m £m £mNon-derivative financial liabilities:Trade payables 149.3 – – 149.3 Amounts owed to associates 8.5 – – 8.5 Accruals 47.2 – – 47.2 Other payables 8.3 0.3 – 8.6 Provisions – onerous leases 4.2 5.3 7.5 17.0 Unsecured bank overdrafts 101.6 – – 101.6 Unsecured bank loans 51.2 – – 51.2 Other unsecured loans 2.5 20.7 24.3 47.5 Finance lease liabilities 0.3 0.2 – 0.5
373.1 26.5 31.8 431.4 Derivative financial liabilities:Net-settled derivative financial liabilities – held for trading 0.8 0.7 – 1.5
Total financial liabilities 373.9 27.2 31.8 432.9
Company 2007On demand Between
or within two andone year five years Total
£m £m £mAmounts owed to subsidiaries 1.5 152.4 153.9Amounts owed to associates 5.6 – 5.6Accruals 0.4 – 0.4Other payables 0.5 – 0.5Unsecured bank overdrafts 13.8 – 13.8
Total financial liabilities 21.8 152.4 174.2
2006On demand Between
or within two andone year five years Total
£m £m £mAmounts owed to subsidiaries 1.5 93.9 95.4Amounts owed to associates 5.6 – 5.6Accruals 1.8 – 1.8Other payables 1.3 – 1.3Unsecured bank overdrafts 48.7 – 48.7
Total financial liabilities 58.9 93.9 152.8
The Company did not have any derivative financial liabilities.
The table below analyses the Group’s derivative financial instruments that will be settled on a gross basis into maturitygroupings based on the period remaining from the balance sheet date to the contractual maturity date. The amountsdisclosed in the table are the contractual, undiscounted cash flows.
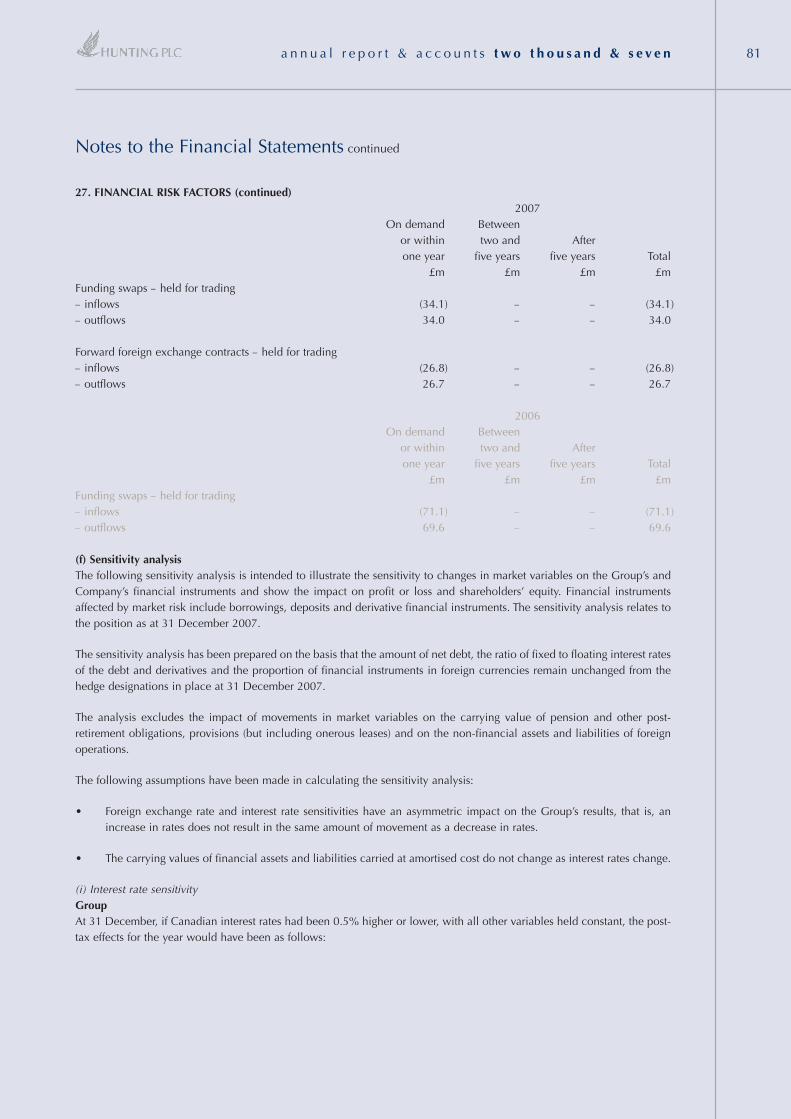
a n n u a l r e p o r t & a c c o u n t s t w o t h o u s a n d & s e v e n 81
Notes to the Financial Statements continued
27. FINANCIAL RISK FACTORS (continued)2007
On demand Betweenor within two and Afterone year five years five years Total
£m £m £m £mFunding swaps – held for trading– inflows (34.1) – – (34.1)– outflows 34.0 – – 34.0
Forward foreign exchange contracts – held for trading– inflows (26.8) – – (26.8)– outflows 26.7 – – 26.7
2006On demand Between
or within two and Afterone year five years five years Total
£m £m £m £mFunding swaps – held for trading– inflows (71.1) – – (71.1)– outflows 69.6 – – 69.6
(f) Sensitivity analysis The following sensitivity analysis is intended to illustrate the sensitivity to changes in market variables on the Group’s andCompany’s financial instruments and show the impact on profit or loss and shareholders’ equity. Financial instrumentsaffected by market risk include borrowings, deposits and derivative financial instruments. The sensitivity analysis relates tothe position as at 31 December 2007.
The sensitivity analysis has been prepared on the basis that the amount of net debt, the ratio of fixed to floating interest ratesof the debt and derivatives and the proportion of financial instruments in foreign currencies remain unchanged from thehedge designations in place at 31 December 2007.
The analysis excludes the impact of movements in market variables on the carrying value of pension and other post-retirement obligations, provisions (but including onerous leases) and on the non-financial assets and liabilities of foreignoperations.
The following assumptions have been made in calculating the sensitivity analysis:
• Foreign exchange rate and interest rate sensitivities have an asymmetric impact on the Group’s results, that is, anincrease in rates does not result in the same amount of movement as a decrease in rates.
• The carrying values of financial assets and liabilities carried at amortised cost do not change as interest rates change.
(i) Interest rate sensitivityGroupAt 31 December, if Canadian interest rates had been 0.5% higher or lower, with all other variables held constant, the post-tax effects for the year would have been as follows:
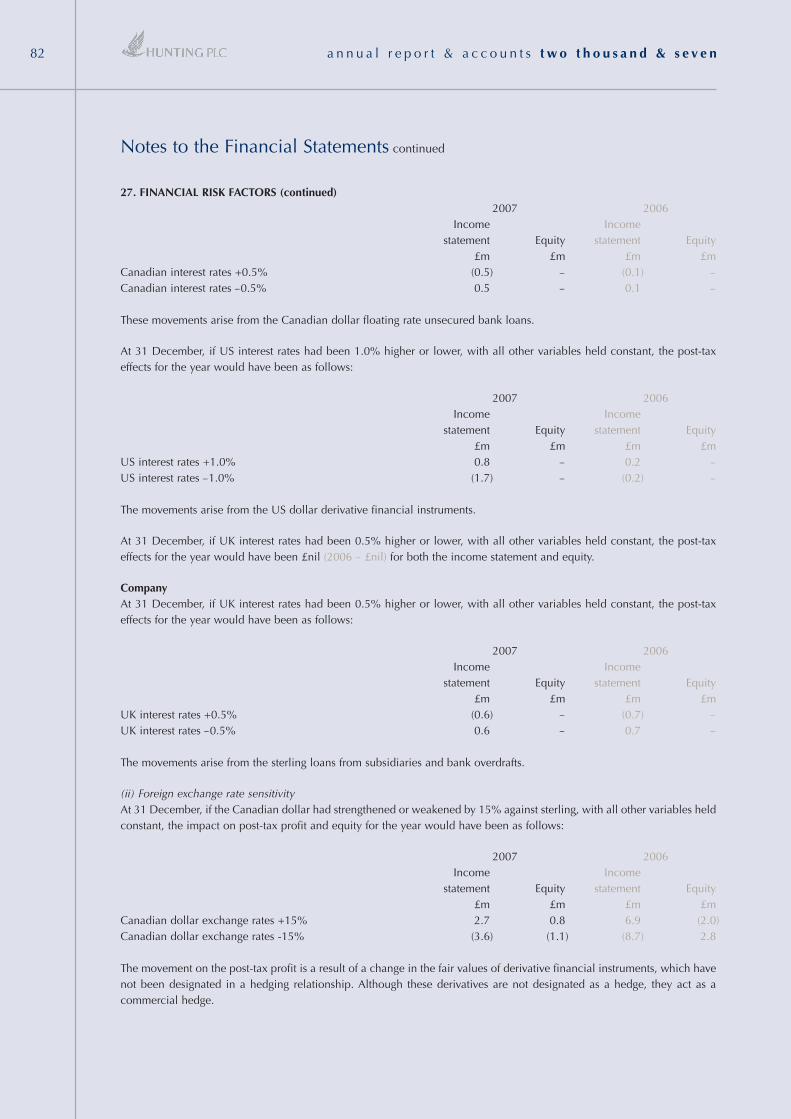
a n n u a l r e p o r t & a c c o u n t s t w o t h o u s a n d & s e v e n82
27. FINANCIAL RISK FACTORS (continued)2007 2006
Income Incomestatement Equity statement Equity
£m £m £m £mCanadian interest rates +0.5% (0.5) – (0.1) –Canadian interest rates –0.5% 0.5 – 0.1 –
These movements arise from the Canadian dollar floating rate unsecured bank loans.
At 31 December, if US interest rates had been 1.0% higher or lower, with all other variables held constant, the post-taxeffects for the year would have been as follows:
2007 2006Income Income
statement Equity statement Equity£m £m £m £m
US interest rates +1.0% 0.8 – 0.2 –US interest rates –1.0% (1.7) – (0.2) –
The movements arise from the US dollar derivative financial instruments.
At 31 December, if UK interest rates had been 0.5% higher or lower, with all other variables held constant, the post-taxeffects for the year would have been £nil (2006 – £nil) for both the income statement and equity.
CompanyAt 31 December, if UK interest rates had been 0.5% higher or lower, with all other variables held constant, the post-taxeffects for the year would have been as follows:
2007 2006Income Income
statement Equity statement Equity£m £m £m £m
UK interest rates +0.5% (0.6) – (0.7) –UK interest rates –0.5% 0.6 – 0.7 –
The movements arise from the sterling loans from subsidiaries and bank overdrafts.
(ii) Foreign exchange rate sensitivityAt 31 December, if the Canadian dollar had strengthened or weakened by 15% against sterling, with all other variables heldconstant, the impact on post-tax profit and equity for the year would have been as follows:
2007 2006Income Income
statement Equity statement Equity£m £m £m £m
Canadian dollar exchange rates +15% 2.7 0.8 6.9 (2.0)Canadian dollar exchange rates -15% (3.6) (1.1) (8.7) 2.8
The movement on the post-tax profit is a result of a change in the fair values of derivative financial instruments, which havenot been designated in a hedging relationship. Although these derivatives are not designated as a hedge, they act as acommercial hedge.
Notes to the Financial Statements continued
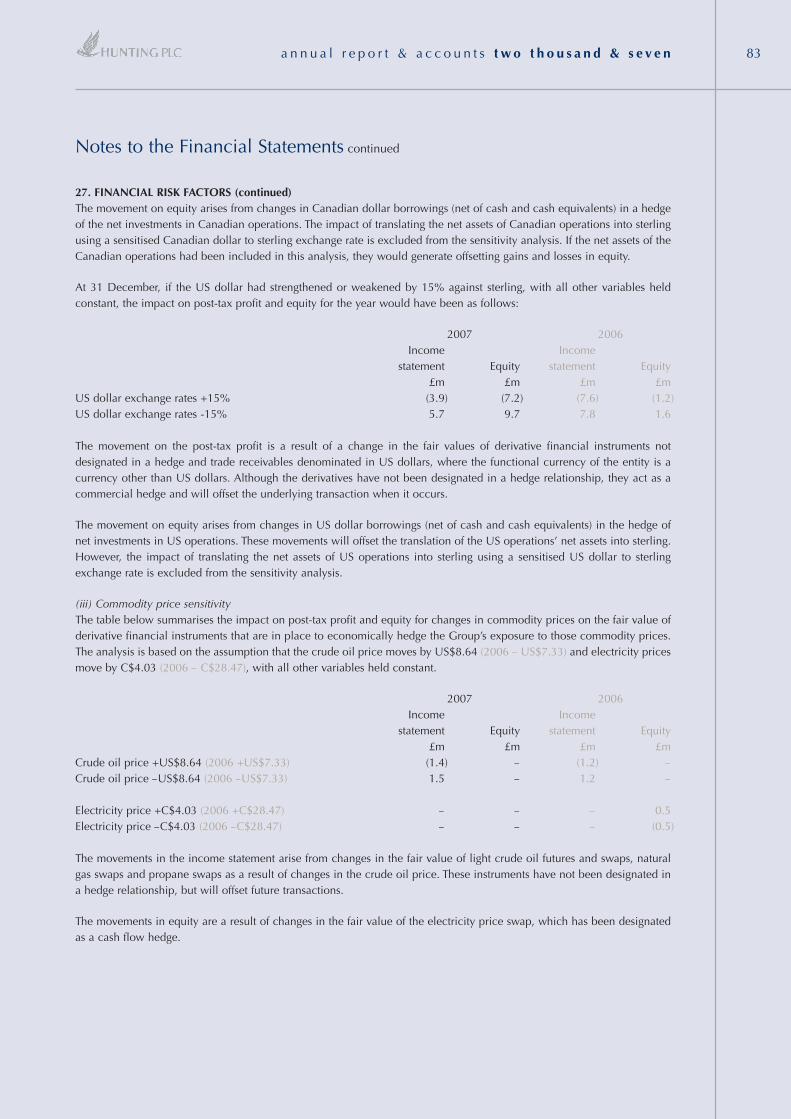
a n n u a l r e p o r t & a c c o u n t s t w o t h o u s a n d & s e v e n 83
Notes to the Financial Statements continued
27. FINANCIAL RISK FACTORS (continued)The movement on equity arises from changes in Canadian dollar borrowings (net of cash and cash equivalents) in a hedgeof the net investments in Canadian operations. The impact of translating the net assets of Canadian operations into sterlingusing a sensitised Canadian dollar to sterling exchange rate is excluded from the sensitivity analysis. If the net assets of theCanadian operations had been included in this analysis, they would generate offsetting gains and losses in equity.
At 31 December, if the US dollar had strengthened or weakened by 15% against sterling, with all other variables heldconstant, the impact on post-tax profit and equity for the year would have been as follows:
2007 2006Income Income
statement Equity statement Equity£m £m £m £m
US dollar exchange rates +15% (3.9) (7.2) (7.6) (1.2)US dollar exchange rates -15% 5.7 9.7 7.8 1.6
The movement on the post-tax profit is a result of a change in the fair values of derivative financial instruments notdesignated in a hedge and trade receivables denominated in US dollars, where the functional currency of the entity is acurrency other than US dollars. Although the derivatives have not been designated in a hedge relationship, they act as acommercial hedge and will offset the underlying transaction when it occurs.
The movement on equity arises from changes in US dollar borrowings (net of cash and cash equivalents) in the hedge ofnet investments in US operations. These movements will offset the translation of the US operations’ net assets into sterling.However, the impact of translating the net assets of US operations into sterling using a sensitised US dollar to sterlingexchange rate is excluded from the sensitivity analysis.
(iii) Commodity price sensitivityThe table below summarises the impact on post-tax profit and equity for changes in commodity prices on the fair value ofderivative financial instruments that are in place to economically hedge the Group’s exposure to those commodity prices.The analysis is based on the assumption that the crude oil price moves by US$8.64 (2006 – US$7.33) and electricity pricesmove by C$4.03 (2006 – C$28.47), with all other variables held constant.
2007 2006Income Income
statement Equity statement Equity£m £m £m £m
Crude oil price +US$8.64 (2006 +US$7.33) (1.4) – (1.2) – Crude oil price –US$8.64 (2006 –US$7.33) 1.5 – 1.2 –
Electricity price +C$4.03 (2006 +C$28.47) – – – 0.5Electricity price –C$4.03 (2006 –C$28.47) – – – (0.5)
The movements in the income statement arise from changes in the fair value of light crude oil futures and swaps, naturalgas swaps and propane swaps as a result of changes in the crude oil price. These instruments have not been designated ina hedge relationship, but will offset future transactions.
The movements in equity are a result of changes in the fair value of the electricity price swap, which has been designatedas a cash flow hedge.

a n n u a l r e p o r t & a c c o u n t s t w o t h o u s a n d & s e v e n84
28. PROVISIONSAsset
decommissioningOnerous & remediationcontracts obligations Other Total
£m £m £m £mGroupAt 1 January 2007 13.2 6.2 – 19.4Exchange adjustments – 0.9 – 0.9Charged to income statement 0.8 0.2 – 1.0Provisions utilised through income statement (2.3) – – (2.3)Reclassification – – 0.9 0.9
At 31 December 2007 11.7 7.3 0.9 19.9
Provisions are due as follows:2007 2006
£m £mCurrent 4.5 4.2Non-current 15.4 15.2
19.9 19.4
The Group has commitments in respect of leasehold properties, some of which are not used for Group trading purposes andare vacant or sub-let to third parties. The provision for onerous contracts reflects the uncertainty of future conditions in thesub-letting market. It is expected that £3.6m of the provision will be utilised in 2008, £1.4m in 2009 and the remainingbalance of £6.7m utilised from 2010 onwards. Provision is made on a discounted basis, at a rate of 6.0% pa, for the netrental deficit on these properties to the end of the lease term.
Asset decommissioning & remediation obligations relate to the Group’s obligation to dismantle, remove and restore itemsof property, plant and equipment. The provisions reflect uncertainty in the timing and amounts of the costs expected to arisein meeting this obligation. The provisions, which have been discounted at rates of between 4% to 7.5%, are expected to beutilised over a period of 12 to 42 years.
The Group expects the other provision of £0.9m to be fully utilised in 2008.
29. POST RETIREMENT BENEFITS
PensionsWithin the UK, the Group operates a funded defined benefit plan and a defined contribution plan. With effect from 31December 2002, the defined benefit plan was closed to new UK employees who are now offered membership of thedefined contribution plan. The majority of UK employees are members of one of these arrangements. Pensions arrangementsare also in place for most overseas employees, principally in the form of money purchase plans.
During the year, the trustees of the UK scheme with support of the Company, purchased annuity policies in relation to thepensioners and deferred pensioners of the scheme. These annuity policies fully insure £141.0m of the UK scheme’sobligations at 31 December 2007. The movement in the value of the asset matches exactly the movement in the liability ateach balance sheet date and thus significantly reduces the risk within the UK pension scheme. The effect of this isrecognised in actuarial losses on plan assets in the Consolidated Statement of Recognised Income and Expense.
Valuations of the defined benefit plans are produced and updated annually to 31 December by independent qualifiedactuaries.
Notes to the Financial Statements continued
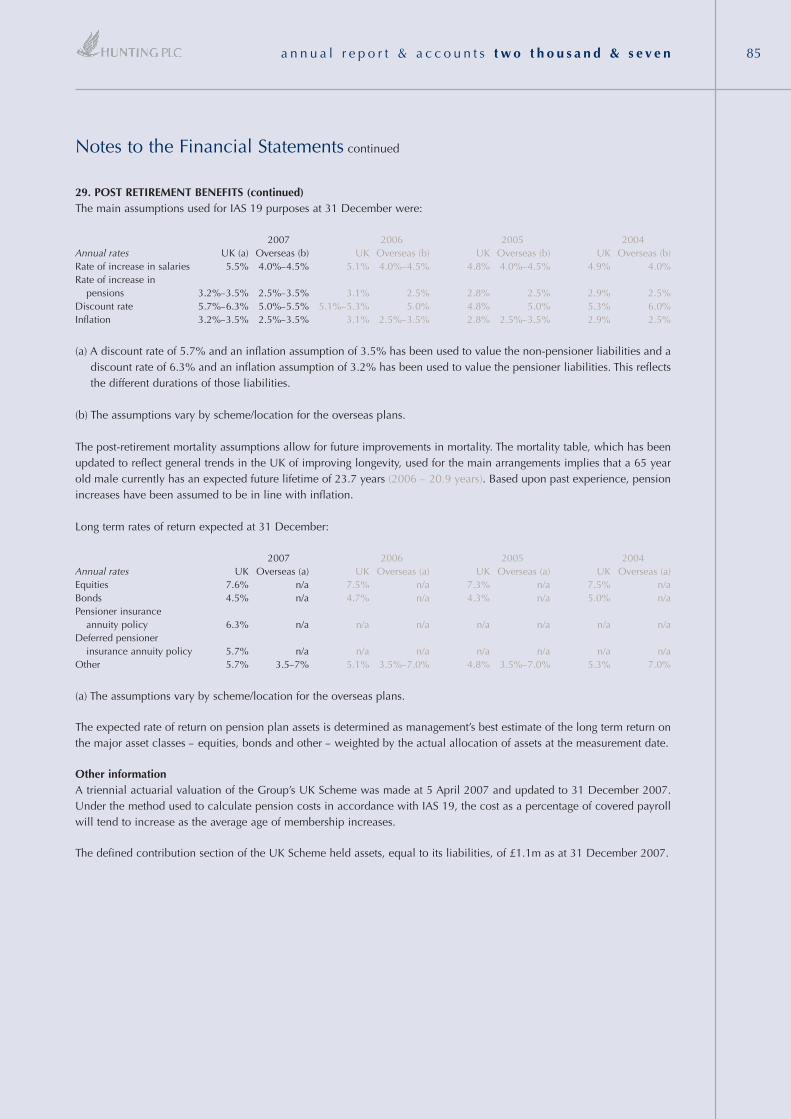
a n n u a l r e p o r t & a c c o u n t s t w o t h o u s a n d & s e v e n 85
Notes to the Financial Statements continued
29. POST RETIREMENT BENEFITS (continued)The main assumptions used for IAS 19 purposes at 31 December were:
2007 2006 2005 2004Annual rates UK (a) Overseas (b) UK Overseas (b) UK Overseas (b) UK Overseas (b)Rate of increase in salaries 5.5% 4.0%–4.5% 5.1% 4.0%–4.5% 4.8% 4.0%–4.5% 4.9% 4.0%Rate of increase in
pensions 3.2%–3.5% 2.5%–3.5% 3.1% 2.5% 2.8% 2.5% 2.9% 2.5%Discount rate 5.7%–6.3% 5.0%–5.5% 5.1%–5.3% 5.0% 4.8% 5.0% 5.3% 6.0%Inflation 3.2%–3.5% 2.5%–3.5% 3.1% 2.5%–3.5% 2.8% 2.5%–3.5% 2.9% 2.5%
(a) A discount rate of 5.7% and an inflation assumption of 3.5% has been used to value the non-pensioner liabilities and adiscount rate of 6.3% and an inflation assumption of 3.2% has been used to value the pensioner liabilities. This reflectsthe different durations of those liabilities.
(b) The assumptions vary by scheme/location for the overseas plans.
The post-retirement mortality assumptions allow for future improvements in mortality. The mortality table, which has beenupdated to reflect general trends in the UK of improving longevity, used for the main arrangements implies that a 65 yearold male currently has an expected future lifetime of 23.7 years (2006 – 20.9 years). Based upon past experience, pensionincreases have been assumed to be in line with inflation.
Long term rates of return expected at 31 December:
2007 2006 2005 2004Annual rates UK Overseas (a) UK Overseas (a) UK Overseas (a) UK Overseas (a)Equities 7.6% n/a 7.5% n/a 7.3% n/a 7.5% n/aBonds 4.5% n/a 4.7% n/a 4.3% n/a 5.0% n/aPensioner insurance
annuity policy 6.3% n/a n/a n/a n/a n/a n/a n/aDeferred pensioner
insurance annuity policy 5.7% n/a n/a n/a n/a n/a n/a n/aOther 5.7% 3.5–7% 5.1% 3.5%–7.0% 4.8% 3.5%–7.0% 5.3% 7.0%
(a) The assumptions vary by scheme/location for the overseas plans.
The expected rate of return on pension plan assets is determined as management’s best estimate of the long term return onthe major asset classes – equities, bonds and other – weighted by the actual allocation of assets at the measurement date.
Other informationA triennial actuarial valuation of the Group’s UK Scheme was made at 5 April 2007 and updated to 31 December 2007.Under the method used to calculate pension costs in accordance with IAS 19, the cost as a percentage of covered payrollwill tend to increase as the average age of membership increases.
The defined contribution section of the UK Scheme held assets, equal to its liabilities, of £1.1m as at 31 December 2007.
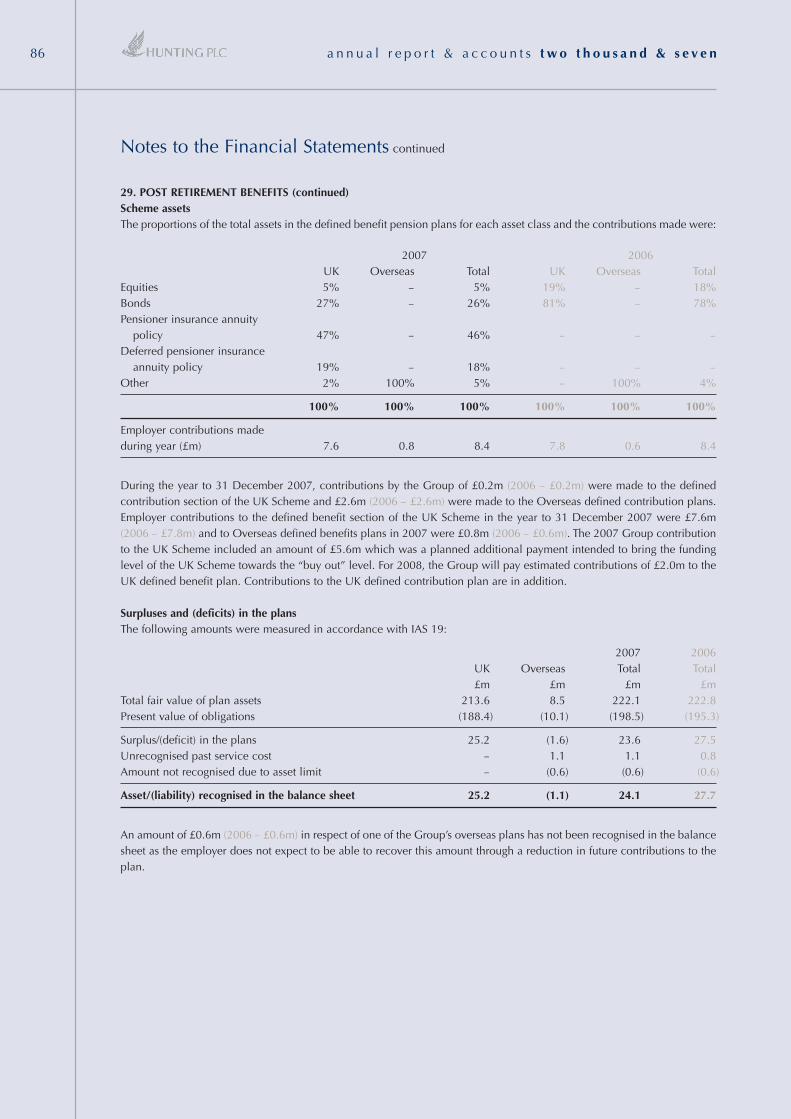
a n n u a l r e p o r t & a c c o u n t s t w o t h o u s a n d & s e v e n86
29. POST RETIREMENT BENEFITS (continued)Scheme assetsThe proportions of the total assets in the defined benefit pension plans for each asset class and the contributions made were:
2007 2006UK Overseas Total UK Overseas Total
Equities 5% – 5% 19% – 18%Bonds 27% – 26% 81% – 78%Pensioner insurance annuity
policy 47% – 46% – – –Deferred pensioner insurance
annuity policy 19% – 18% – – –Other 2% 100% 5% – 100% 4%
100% 100% 100% 100% 100% 100%
Employer contributions madeduring year (£m) 7.6 0.8 8.4 7.8 0.6 8.4
During the year to 31 December 2007, contributions by the Group of £0.2m (2006 – £0.2m) were made to the definedcontribution section of the UK Scheme and £2.6m (2006 – £2.6m) were made to the Overseas defined contribution plans.Employer contributions to the defined benefit section of the UK Scheme in the year to 31 December 2007 were £7.6m(2006 – £7.8m) and to Overseas defined benefits plans in 2007 were £0.8m (2006 – £0.6m). The 2007 Group contributionto the UK Scheme included an amount of £5.6m which was a planned additional payment intended to bring the fundinglevel of the UK Scheme towards the “buy out” level. For 2008, the Group will pay estimated contributions of £2.0m to theUK defined benefit plan. Contributions to the UK defined contribution plan are in addition.
Surpluses and (deficits) in the plansThe following amounts were measured in accordance with IAS 19:
2007 2006UK Overseas Total Total£m £m £m £m
Total fair value of plan assets 213.6 8.5 222.1 222.8Present value of obligations (188.4) (10.1) (198.5) (195.3)
Surplus/(deficit) in the plans 25.2 (1.6) 23.6 27.5Unrecognised past service cost – 1.1 1.1 0.8Amount not recognised due to asset limit – (0.6) (0.6) (0.6)
Asset/(liability) recognised in the balance sheet 25.2 (1.1) 24.1 27.7
An amount of £0.6m (2006 – £0.6m) in respect of one of the Group’s overseas plans has not been recognised in the balancesheet as the employer does not expect to be able to recover this amount through a reduction in future contributions to theplan.
Notes to the Financial Statements continued
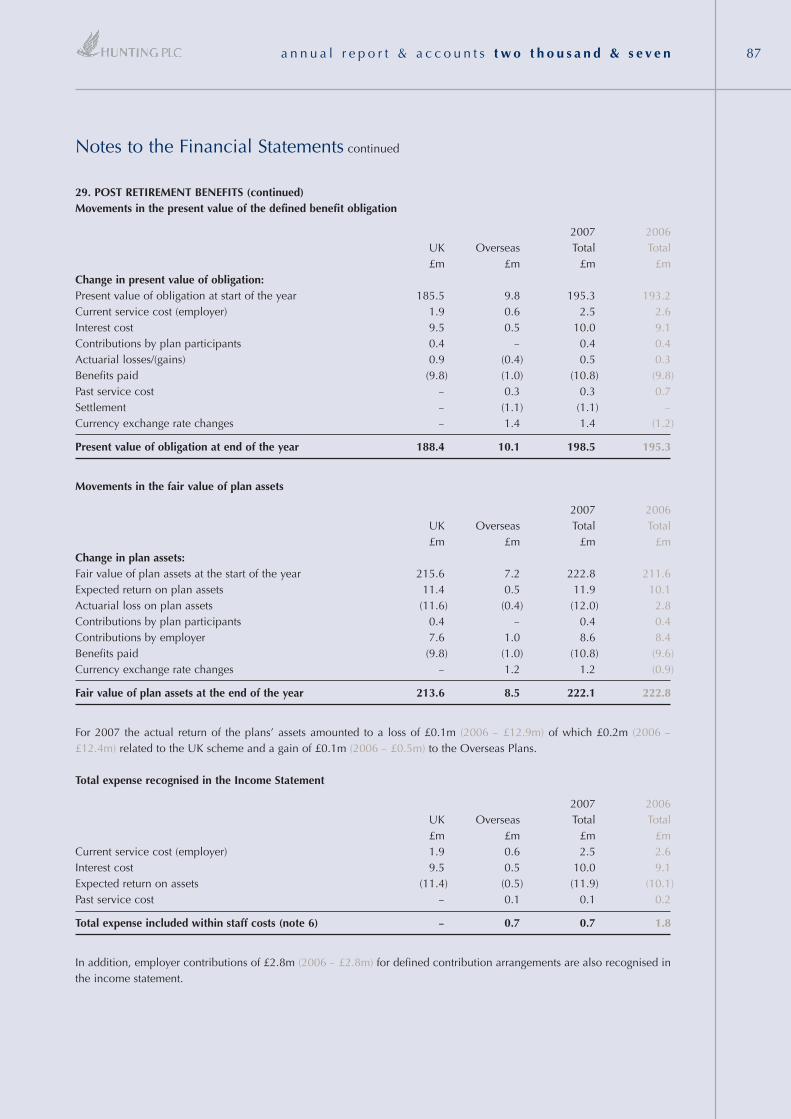
a n n u a l r e p o r t & a c c o u n t s t w o t h o u s a n d & s e v e n 87
Notes to the Financial Statements continued
29. POST RETIREMENT BENEFITS (continued)Movements in the present value of the defined benefit obligation
2007 2006UK Overseas Total Total£m £m £m £m
Change in present value of obligation:Present value of obligation at start of the year 185.5 9.8 195.3 193.2Current service cost (employer) 1.9 0.6 2.5 2.6Interest cost 9.5 0.5 10.0 9.1Contributions by plan participants 0.4 – 0.4 0.4Actuarial losses/(gains) 0.9 (0.4) 0.5 0.3Benefits paid (9.8) (1.0) (10.8) (9.8)Past service cost – 0.3 0.3 0.7Settlement – (1.1) (1.1) –Currency exchange rate changes – 1.4 1.4 (1.2)
Present value of obligation at end of the year 188.4 10.1 198.5 195.3
Movements in the fair value of plan assets
2007 2006UK Overseas Total Total£m £m £m £m
Change in plan assets:Fair value of plan assets at the start of the year 215.6 7.2 222.8 211.6Expected return on plan assets 11.4 0.5 11.9 10.1Actuarial loss on plan assets (11.6) (0.4) (12.0) 2.8Contributions by plan participants 0.4 – 0.4 0.4Contributions by employer 7.6 1.0 8.6 8.4Benefits paid (9.8) (1.0) (10.8) (9.6)Currency exchange rate changes – 1.2 1.2 (0.9)
Fair value of plan assets at the end of the year 213.6 8.5 222.1 222.8
For 2007 the actual return of the plans’ assets amounted to a loss of £0.1m (2006 – £12.9m) of which £0.2m (2006 –£12.4m) related to the UK scheme and a gain of £0.1m (2006 – £0.5m) to the Overseas Plans.
Total expense recognised in the Income Statement
2007 2006UK Overseas Total Total£m £m £m £m
Current service cost (employer) 1.9 0.6 2.5 2.6Interest cost 9.5 0.5 10.0 9.1Expected return on assets (11.4) (0.5) (11.9) (10.1)Past service cost – 0.1 0.1 0.2
Total expense included within staff costs (note 6) – 0.7 0.7 1.8
In addition, employer contributions of £2.8m (2006 – £2.8m) for defined contribution arrangements are also recognised inthe income statement.
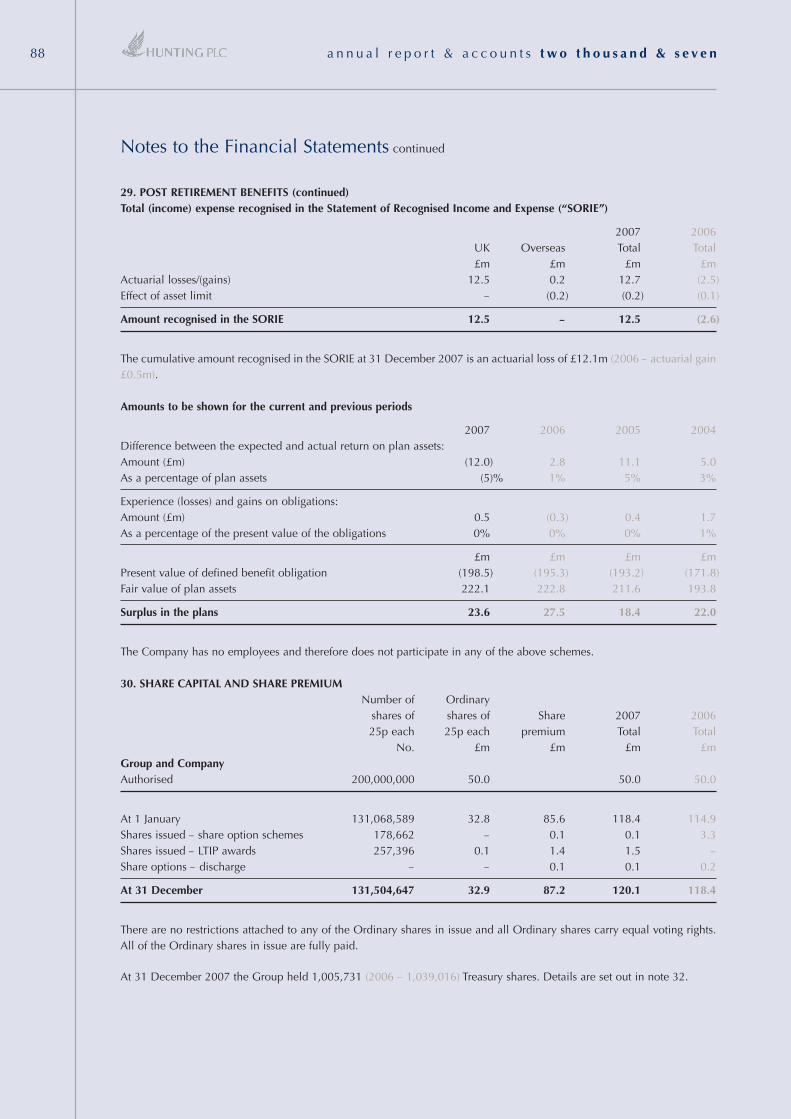
a n n u a l r e p o r t & a c c o u n t s t w o t h o u s a n d & s e v e n88
29. POST RETIREMENT BENEFITS (continued)Total (income) expense recognised in the Statement of Recognised Income and Expense (“SORIE”)
2007 2006UK Overseas Total Total£m £m £m £m
Actuarial losses/(gains) 12.5 0.2 12.7 (2.5)Effect of asset limit – (0.2) (0.2) (0.1)
Amount recognised in the SORIE 12.5 – 12.5 (2.6)
The cumulative amount recognised in the SORIE at 31 December 2007 is an actuarial loss of £12.1m (2006 – actuarial gain£0.5m).
Amounts to be shown for the current and previous periods
2007 2006 2005 2004Difference between the expected and actual return on plan assets:Amount (£m) (12.0) 2.8 11.1 5.0As a percentage of plan assets (5)% 1% 5% 3%
Experience (losses) and gains on obligations:Amount (£m) 0.5 (0.3) 0.4 1.7As a percentage of the present value of the obligations 0% 0% 0% 1%
£m £m £m £mPresent value of defined benefit obligation (198.5) (195.3) (193.2) (171.8)Fair value of plan assets 222.1 222.8 211.6 193.8
Surplus in the plans 23.6 27.5 18.4 22.0
The Company has no employees and therefore does not participate in any of the above schemes.
30. SHARE CAPITAL AND SHARE PREMIUMNumber of Ordinary
shares of shares of Share 2007 200625p each 25p each premium Total Total
No. £m £m £m £mGroup and CompanyAuthorised 200,000,000 50.0 50.0 50.0
At 1 January 131,068,589 32.8 85.6 118.4 114.9Shares issued – share option schemes 178,662 – 0.1 0.1 3.3Shares issued – LTIP awards 257,396 0.1 1.4 1.5 –Share options – discharge – – 0.1 0.1 0.2
At 31 December 131,504,647 32.9 87.2 120.1 118.4
There are no restrictions attached to any of the Ordinary shares in issue and all Ordinary shares carry equal voting rights.All of the Ordinary shares in issue are fully paid.
At 31 December 2007 the Group held 1,005,731 (2006 – 1,039,016) Treasury shares. Details are set out in note 32.
Notes to the Financial Statements continued
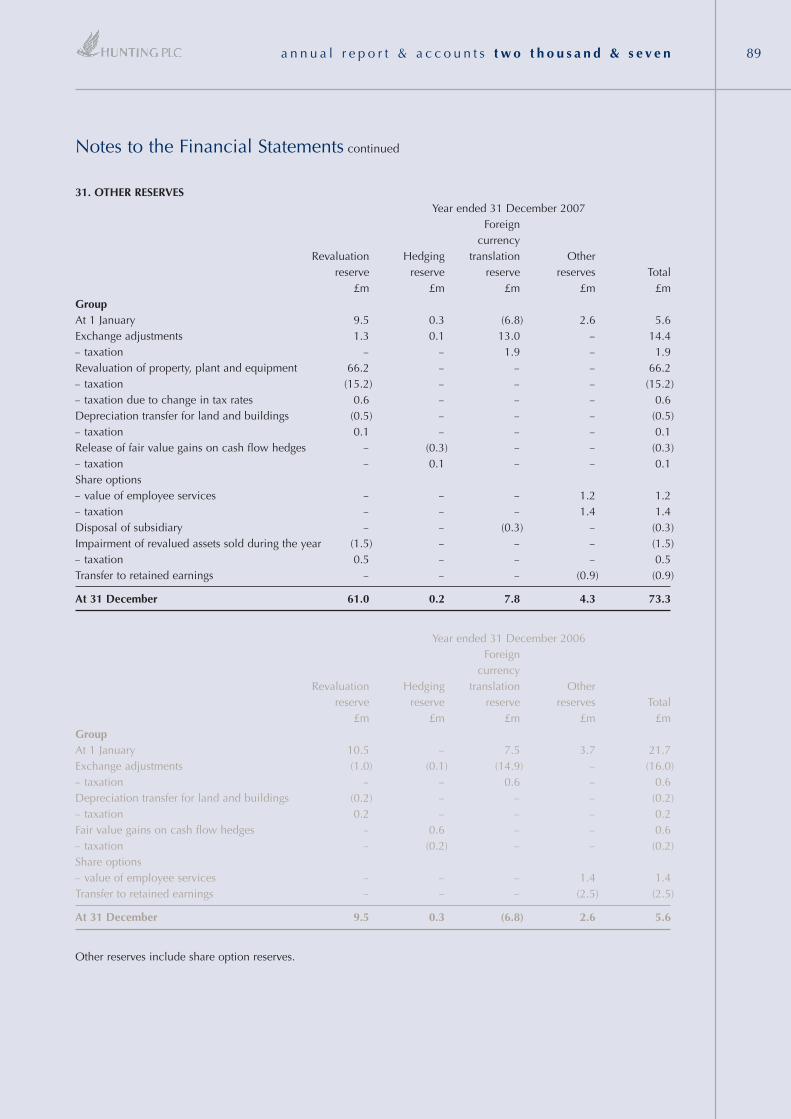
a n n u a l r e p o r t & a c c o u n t s t w o t h o u s a n d & s e v e n 89
Notes to the Financial Statements continued
31. OTHER RESERVESYear ended 31 December 2007
Foreigncurrency
Revaluation Hedging translation Otherreserve reserve reserve reserves Total
£m £m £m £m £mGroupAt 1 January 9.5 0.3 (6.8) 2.6 5.6Exchange adjustments 1.3 0.1 13.0 – 14.4– taxation – – 1.9 – 1.9Revaluation of property, plant and equipment 66.2 – – – 66.2– taxation (15.2) – – – (15.2)– taxation due to change in tax rates 0.6 – – – 0.6Depreciation transfer for land and buildings (0.5) – – – (0.5)– taxation 0.1 – – – 0.1Release of fair value gains on cash flow hedges – (0.3) – – (0.3)– taxation – 0.1 – – 0.1Share options – value of employee services – – – 1.2 1.2– taxation – – – 1.4 1.4Disposal of subsidiary – – (0.3) – (0.3)Impairment of revalued assets sold during the year (1.5) – – – (1.5)– taxation 0.5 – – – 0.5Transfer to retained earnings – – – (0.9) (0.9)
At 31 December 61.0 0.2 7.8 4.3 73.3
Year ended 31 December 2006Foreign
currencyRevaluation Hedging translation Other
reserve reserve reserve reserves Total£m £m £m £m £m
GroupAt 1 January 10.5 – 7.5 3.7 21.7Exchange adjustments (1.0) (0.1) (14.9) – (16.0)– taxation – – 0.6 – 0.6Depreciation transfer for land and buildings (0.2) – – – (0.2)– taxation 0.2 – – – 0.2Fair value gains on cash flow hedges – 0.6 – – 0.6– taxation – (0.2) – – (0.2)Share options – value of employee services – – – 1.4 1.4Transfer to retained earnings – – – (2.5) (2.5)
At 31 December 9.5 0.3 (6.8) 2.6 5.6
Other reserves include share option reserves.
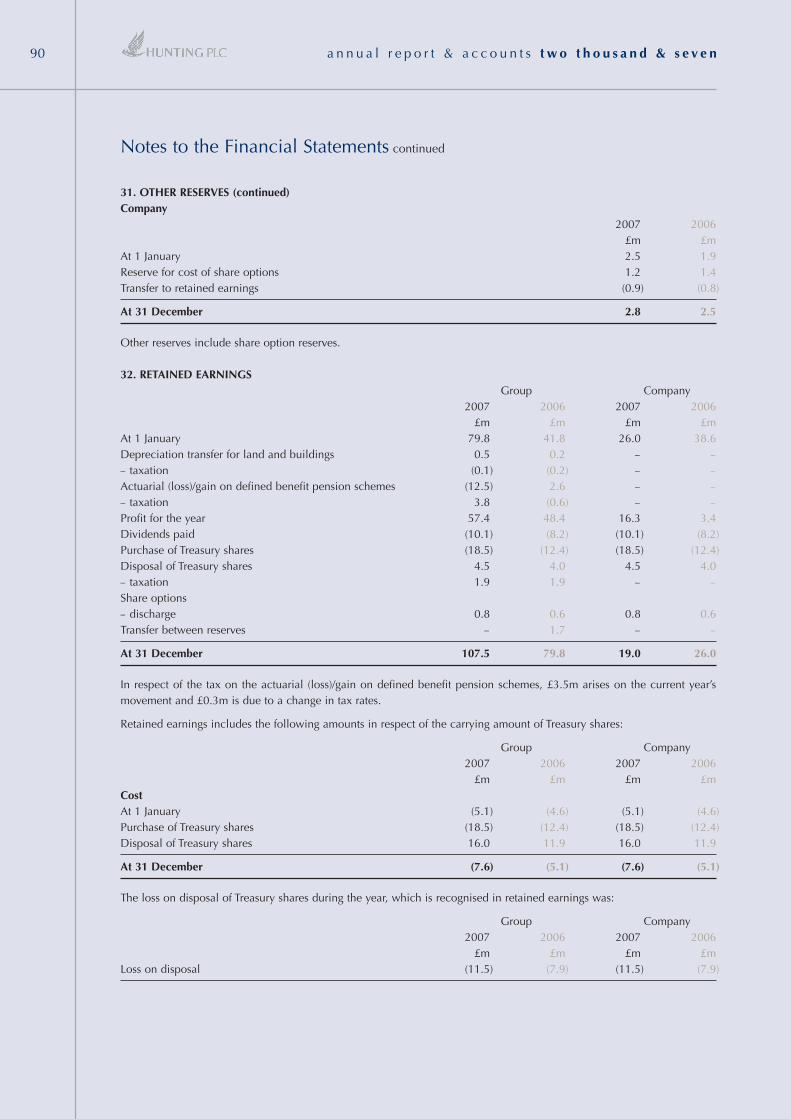
a n n u a l r e p o r t & a c c o u n t s t w o t h o u s a n d & s e v e n90
31. OTHER RESERVES (continued)Company
2007 2006£m £m
At 1 January 2.5 1.9Reserve for cost of share options 1.2 1.4Transfer to retained earnings (0.9) (0.8)
At 31 December 2.8 2.5
Other reserves include share option reserves.
32. RETAINED EARNINGSGroup Company
2007 2006 2007 2006£m £m £m £m
At 1 January 79.8 41.8 26.0 38.6Depreciation transfer for land and buildings 0.5 0.2 – –– taxation (0.1) (0.2) – –Actuarial (loss)/gain on defined benefit pension schemes (12.5) 2.6 – –– taxation 3.8 (0.6) – –Profit for the year 57.4 48.4 16.3 3.4Dividends paid (10.1) (8.2) (10.1) (8.2)Purchase of Treasury shares (18.5) (12.4) (18.5) (12.4)Disposal of Treasury shares 4.5 4.0 4.5 4.0– taxation 1.9 1.9 – –Share options– discharge 0.8 0.6 0.8 0.6Transfer between reserves – 1.7 – –
At 31 December 107.5 79.8 19.0 26.0
In respect of the tax on the actuarial (loss)/gain on defined benefit pension schemes, £3.5m arises on the current year’smovement and £0.3m is due to a change in tax rates.
Retained earnings includes the following amounts in respect of the carrying amount of Treasury shares:
Group Company2007 2006 2007 2006
£m £m £m £mCostAt 1 January (5.1) (4.6) (5.1) (4.6)Purchase of Treasury shares (18.5) (12.4) (18.5) (12.4)Disposal of Treasury shares 16.0 11.9 16.0 11.9
At 31 December (7.6) (5.1) (7.6) (5.1)
The loss on disposal of Treasury shares during the year, which is recognised in retained earnings was:
Group Company2007 2006 2007 2006
£m £m £m £mLoss on disposal (11.5) (7.9) (11.5) (7.9)
Notes to the Financial Statements continued
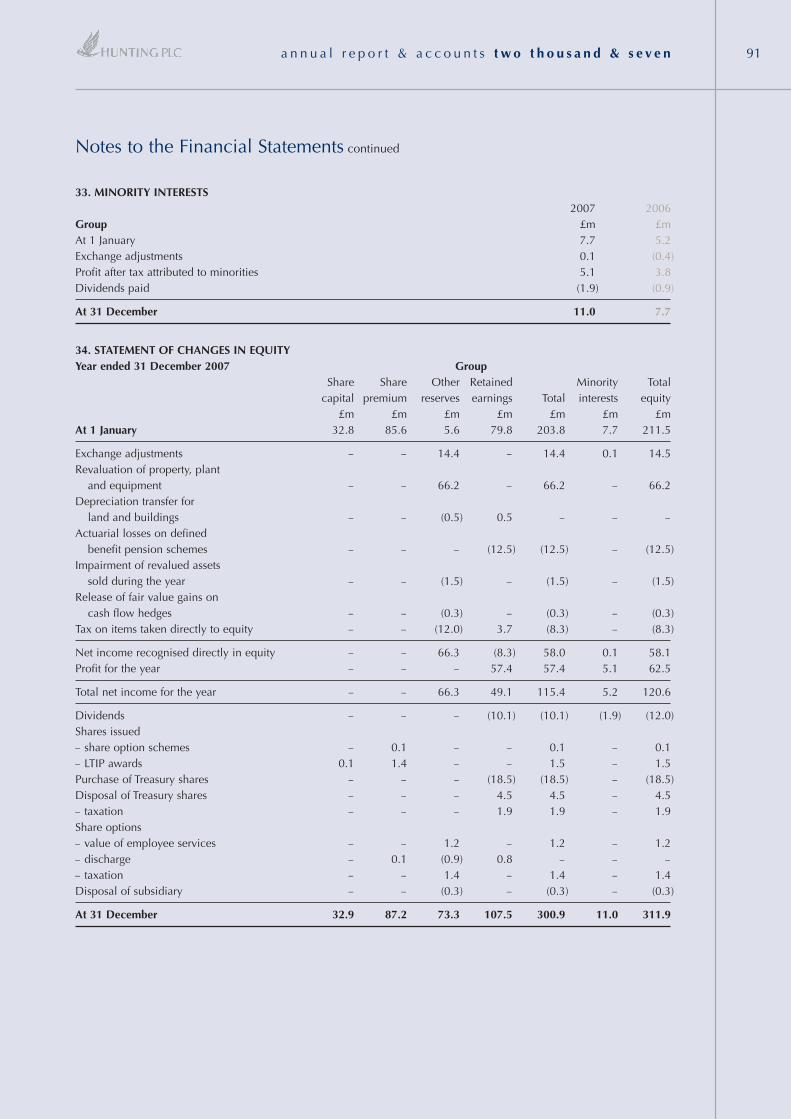
a n n u a l r e p o r t & a c c o u n t s t w o t h o u s a n d & s e v e n 91
Notes to the Financial Statements continued
33. MINORITY INTERESTS2007 2006
Group £m £mAt 1 January 7.7 5.2Exchange adjustments 0.1 (0.4)Profit after tax attributed to minorities 5.1 3.8Dividends paid (1.9) (0.9)
At 31 December 11.0 7.7
34. STATEMENT OF CHANGES IN EQUITYYear ended 31 December 2007 Group
Share Share Other Retained Minority Totalcapital premium reserves earnings Total interests equity
£m £m £m £m £m £m £mAt 1 January 32.8 85.6 5.6 79.8 203.8 7.7 211.5
Exchange adjustments – – 14.4 – 14.4 0.1 14.5Revaluation of property, plant
and equipment – – 66.2 – 66.2 – 66.2Depreciation transfer for
land and buildings – – (0.5) 0.5 – – –Actuarial losses on defined
benefit pension schemes – – – (12.5) (12.5) – (12.5)Impairment of revalued assets
sold during the year – – (1.5) – (1.5) – (1.5)Release of fair value gains on
cash flow hedges – – (0.3) – (0.3) – (0.3)Tax on items taken directly to equity – – (12.0) 3.7 (8.3) – (8.3)
Net income recognised directly in equity – – 66.3 (8.3) 58.0 0.1 58.1Profit for the year – – – 57.4 57.4 5.1 62.5
Total net income for the year – – 66.3 49.1 115.4 5.2 120.6
Dividends – – – (10.1) (10.1) (1.9) (12.0)Shares issued – share option schemes – 0.1 – – 0.1 – 0.1– LTIP awards 0.1 1.4 – – 1.5 – 1.5Purchase of Treasury shares – – – (18.5) (18.5) – (18.5)Disposal of Treasury shares – – – 4.5 4.5 – 4.5– taxation – – – 1.9 1.9 – 1.9Share options– value of employee services – – 1.2 – 1.2 – 1.2– discharge – 0.1 (0.9) 0.8 – – –– taxation – – 1.4 – 1.4 – 1.4Disposal of subsidiary – – (0.3) – (0.3) – (0.3)
At 31 December 32.9 87.2 73.3 107.5 300.9 11.0 311.9
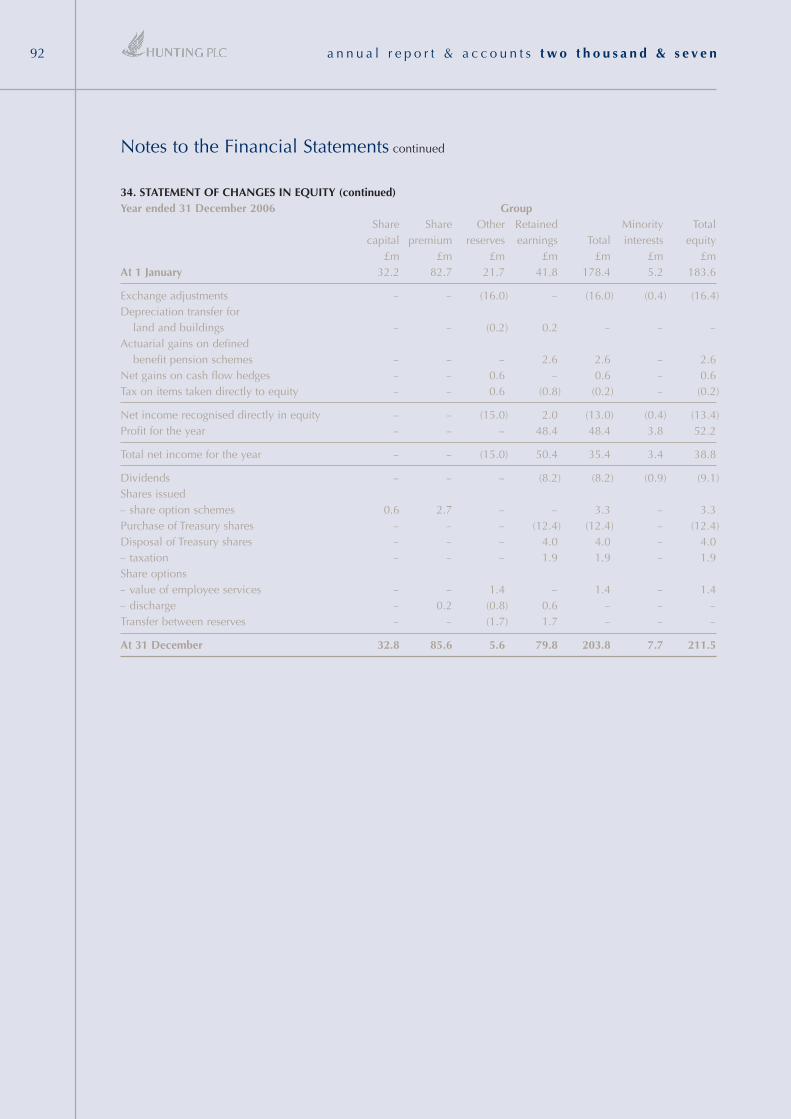
a n n u a l r e p o r t & a c c o u n t s t w o t h o u s a n d & s e v e n92
34. STATEMENT OF CHANGES IN EQUITY (continued)Year ended 31 December 2006 Group
Share Share Other Retained Minority Totalcapital premium reserves earnings Total interests equity
£m £m £m £m £m £m £mAt 1 January 32.2 82.7 21.7 41.8 178.4 5.2 183.6
Exchange adjustments – – (16.0) – (16.0) (0.4) (16.4)Depreciation transfer for
land and buildings – – (0.2) 0.2 – – –Actuarial gains on defined
benefit pension schemes – – – 2.6 2.6 – 2.6Net gains on cash flow hedges – – 0.6 – 0.6 – 0.6Tax on items taken directly to equity – – 0.6 (0.8) (0.2) – (0.2)
Net income recognised directly in equity – – (15.0) 2.0 (13.0) (0.4) (13.4)Profit for the year – – – 48.4 48.4 3.8 52.2
Total net income for the year – – (15.0) 50.4 35.4 3.4 38.8
Dividends – – – (8.2) (8.2) (0.9) (9.1)Shares issued – share option schemes 0.6 2.7 – – 3.3 – 3.3Purchase of Treasury shares – – – (12.4) (12.4) – (12.4)Disposal of Treasury shares – – – 4.0 4.0 – 4.0– taxation – – – 1.9 1.9 – 1.9Share options– value of employee services – – 1.4 – 1.4 – 1.4– discharge – 0.2 (0.8) 0.6 – – –Transfer between reserves – – (1.7) 1.7 – – –
At 31 December 32.8 85.6 5.6 79.8 203.8 7.7 211.5
Notes to the Financial Statements continued
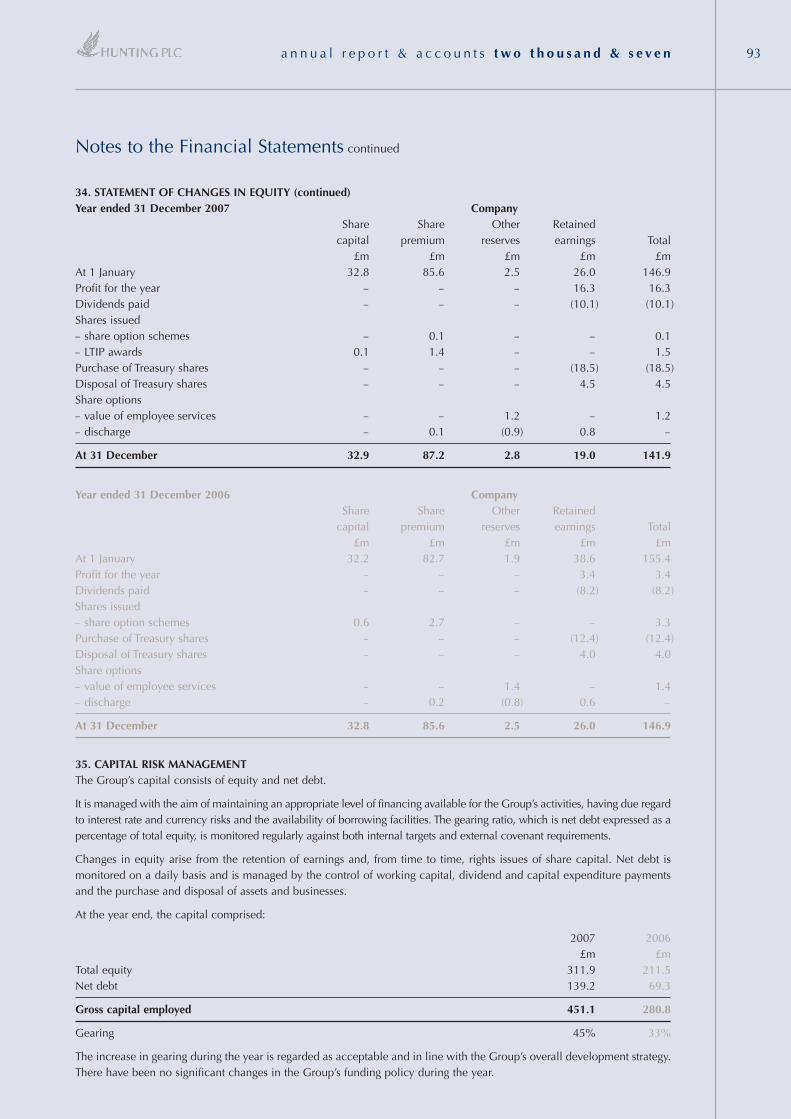
a n n u a l r e p o r t & a c c o u n t s t w o t h o u s a n d & s e v e n 93
Notes to the Financial Statements continued
34. STATEMENT OF CHANGES IN EQUITY (continued)Year ended 31 December 2007 Company
Share Share Other Retainedcapital premium reserves earnings Total
£m £m £m £m £mAt 1 January 32.8 85.6 2.5 26.0 146.9Profit for the year – – – 16.3 16.3Dividends paid – – – (10.1) (10.1)Shares issued– share option schemes – 0.1 – – 0.1– LTIP awards 0.1 1.4 – – 1.5Purchase of Treasury shares – – – (18.5) (18.5)Disposal of Treasury shares – – – 4.5 4.5Share options– value of employee services – – 1.2 – 1.2– discharge – 0.1 (0.9) 0.8 –
At 31 December 32.9 87.2 2.8 19.0 141.9
Year ended 31 December 2006 CompanyShare Share Other Retained
capital premium reserves earnings Total£m £m £m £m £m
At 1 January 32.2 82.7 1.9 38.6 155.4Profit for the year – – – 3.4 3.4Dividends paid – – – (8.2) (8.2)Shares issued– share option schemes 0.6 2.7 – – 3.3Purchase of Treasury shares – – – (12.4) (12.4)Disposal of Treasury shares – – – 4.0 4.0Share options– value of employee services – – 1.4 – 1.4– discharge – 0.2 (0.8) 0.6 –
At 31 December 32.8 85.6 2.5 26.0 146.9
35. CAPITAL RISK MANAGEMENTThe Group’s capital consists of equity and net debt.
It is managed with the aim of maintaining an appropriate level of financing available for the Group’s activities, having due regardto interest rate and currency risks and the availability of borrowing facilities. The gearing ratio, which is net debt expressed as apercentage of total equity, is monitored regularly against both internal targets and external covenant requirements.
Changes in equity arise from the retention of earnings and, from time to time, rights issues of share capital. Net debt ismonitored on a daily basis and is managed by the control of working capital, dividend and capital expenditure paymentsand the purchase and disposal of assets and businesses.
At the year end, the capital comprised:
2007 2006£m £m
Total equity 311.9 211.5Net debt 139.2 69.3
Gross capital employed 451.1 280.8
Gearing 45% 33%
The increase in gearing during the year is regarded as acceptable and in line with the Group’s overall development strategy.There have been no significant changes in the Group’s funding policy during the year.
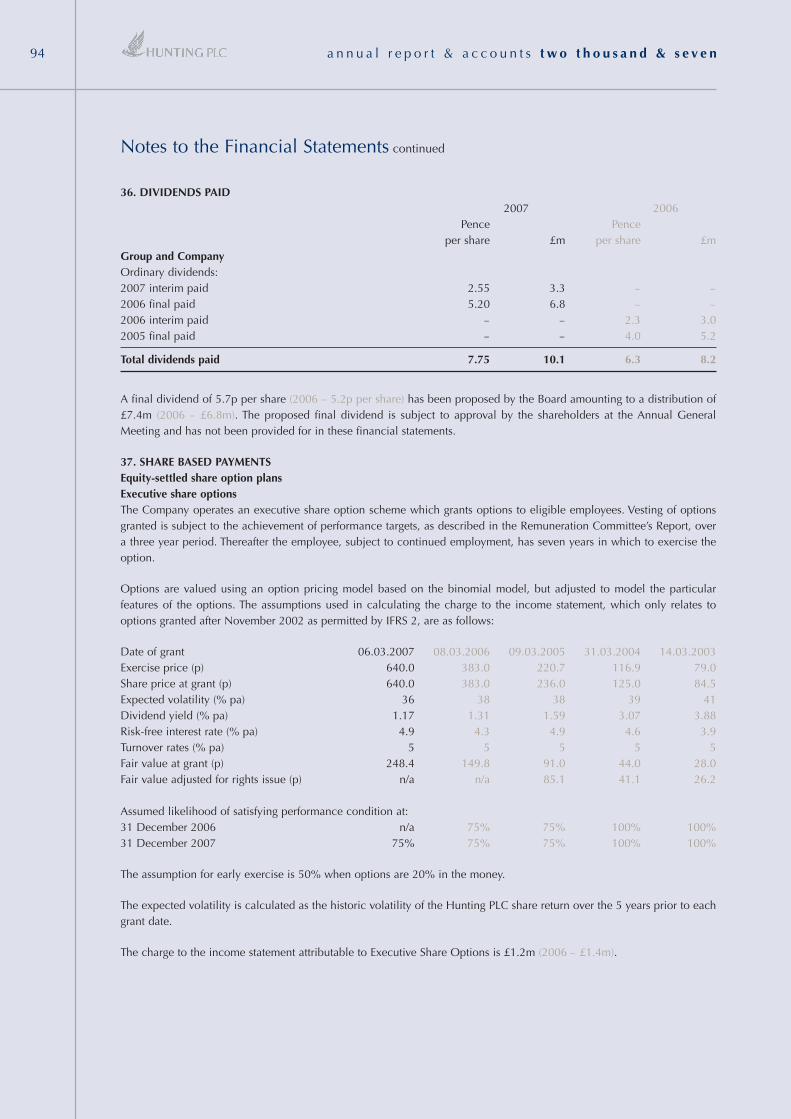
Notes to the Financial Statements continued
36. DIVIDENDS PAID2007 2006
Pence Penceper share £m per share £m
Group and CompanyOrdinary dividends:2007 interim paid 2.55 3.3 – –2006 final paid 5.20 6.8 – –2006 interim paid – – 2.3 3.02005 final paid – – 4.0 5.2
Total dividends paid 7.75 10.1 6.3 8.2
A final dividend of 5.7p per share (2006 – 5.2p per share) has been proposed by the Board amounting to a distribution of£7.4m (2006 – £6.8m). The proposed final dividend is subject to approval by the shareholders at the Annual GeneralMeeting and has not been provided for in these financial statements.
37. SHARE BASED PAYMENTSEquity-settled share option plans Executive share optionsThe Company operates an executive share option scheme which grants options to eligible employees. Vesting of optionsgranted is subject to the achievement of performance targets, as described in the Remuneration Committee’s Report, overa three year period. Thereafter the employee, subject to continued employment, has seven years in which to exercise theoption.
Options are valued using an option pricing model based on the binomial model, but adjusted to model the particularfeatures of the options. The assumptions used in calculating the charge to the income statement, which only relates tooptions granted after November 2002 as permitted by IFRS 2, are as follows:
Date of grant 06.03.2007 08.03.2006 09.03.2005 31.03.2004 14.03.2003Exercise price (p) 640.0 383.0 220.7 116.9 79.0Share price at grant (p) 640.0 383.0 236.0 125.0 84.5Expected volatility (% pa) 36 38 38 39 41Dividend yield (% pa) 1.17 1.31 1.59 3.07 3.88Risk-free interest rate (% pa) 4.9 4.3 4.9 4.6 3.9Turnover rates (% pa) 5 5 5 5 5Fair value at grant (p) 248.4 149.8 91.0 44.0 28.0Fair value adjusted for rights issue (p) n/a n/a 85.1 41.1 26.2
Assumed likelihood of satisfying performance condition at:31 December 2006 n/a 75% 75% 100% 100%31 December 2007 75% 75% 75% 100% 100%
The assumption for early exercise is 50% when options are 20% in the money.
The expected volatility is calculated as the historic volatility of the Hunting PLC share return over the 5 years prior to eachgrant date.
The charge to the income statement attributable to Executive Share Options is £1.2m (2006 – £1.4m).
a n n u a l r e p o r t & a c c o u n t s t w o t h o u s a n d & s e v e n94
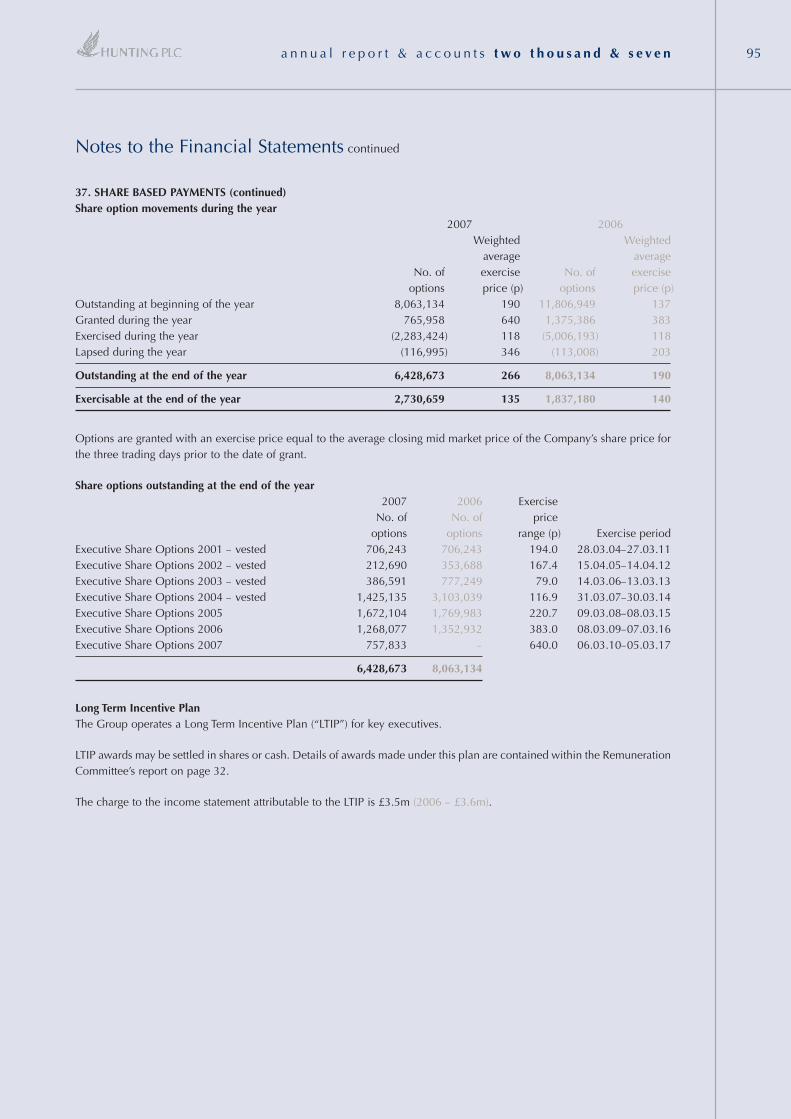
37. SHARE BASED PAYMENTS (continued)Share option movements during the year
2007 2006Weighted Weighted
average averageNo. of exercise No. of exercise
options price (p) options price (p)Outstanding at beginning of the year 8,063,134 190 11,806,949 137Granted during the year 765,958 640 1,375,386 383Exercised during the year (2,283,424) 118 (5,006,193) 118Lapsed during the year (116,995) 346 (113,008) 203
Outstanding at the end of the year 6,428,673 266 8,063,134 190
Exercisable at the end of the year 2,730,659 135 1,837,180 140
Options are granted with an exercise price equal to the average closing mid market price of the Company’s share price forthe three trading days prior to the date of grant.
Share options outstanding at the end of the year2007 2006 Exercise
No. of No. of priceoptions options range (p) Exercise period
Executive Share Options 2001 – vested 706,243 706,243 194.0 28.03.04–27.03.11 Executive Share Options 2002 – vested 212,690 353,688 167.4 15.04.05–14.04.12 Executive Share Options 2003 – vested 386,591 777,249 79.0 14.03.06–13.03.13 Executive Share Options 2004 – vested 1,425,135 3,103,039 116.9 31.03.07–30.03.14 Executive Share Options 2005 1,672,104 1,769,983 220.7 09.03.08–08.03.15 Executive Share Options 2006 1,268,077 1,352,932 383.0 08.03.09–07.03.16Executive Share Options 2007 757,833 – 640.0 06.03.10–05.03.17
6,428,673 8,063,134
Long Term Incentive PlanThe Group operates a Long Term Incentive Plan (“LTIP”) for key executives.
LTIP awards may be settled in shares or cash. Details of awards made under this plan are contained within the RemunerationCommittee’s report on page 32.
The charge to the income statement attributable to the LTIP is £3.5m (2006 – £3.6m).
Notes to the Financial Statements continued
a n n u a l r e p o r t & a c c o u n t s t w o t h o u s a n d & s e v e n 95
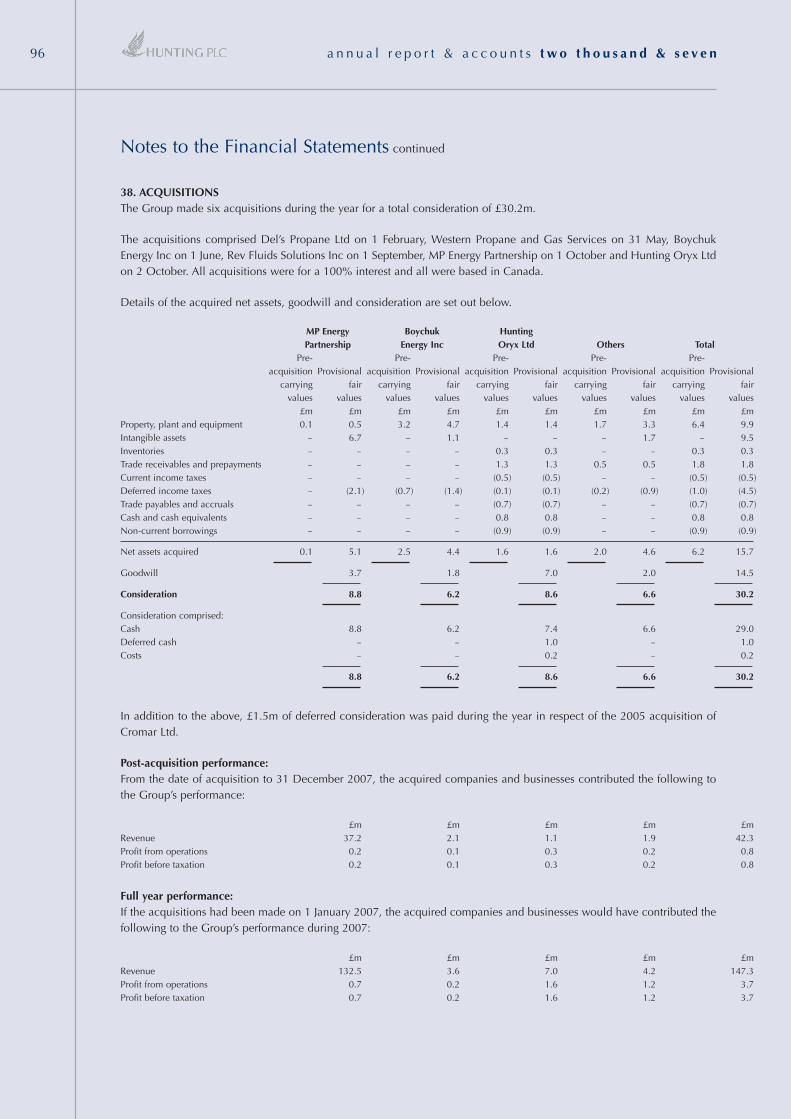
Notes to the Financial Statements continued
38. ACQUISITIONSThe Group made six acquisitions during the year for a total consideration of £30.2m.
The acquisitions comprised Del’s Propane Ltd on 1 February, Western Propane and Gas Services on 31 May, BoychukEnergy Inc on 1 June, Rev Fluids Solutions Inc on 1 September, MP Energy Partnership on 1 October and Hunting Oryx Ltdon 2 October. All acquisitions were for a 100% interest and all were based in Canada.
Details of the acquired net assets, goodwill and consideration are set out below.
MP Energy Boychuk HuntingPartnership Energy Inc Oryx Ltd Others Total
Pre- Pre- Pre- Pre- Pre-acquisition Provisional acquisition Provisional acquisition Provisional acquisition Provisional acquisition Provisional
carrying fair carrying fair carrying fair carrying fair carrying fairvalues values values values values values values values values values
£m £m £m £m £m £m £m £m £m £mProperty, plant and equipment 0.1 0.5 3.2 4.7 1.4 1.4 1.7 3.3 6.4 9.9Intangible assets – 6.7 – 1.1 – – – 1.7 – 9.5Inventories – – – – 0.3 0.3 – – 0.3 0.3Trade receivables and prepayments – – – – 1.3 1.3 0.5 0.5 1.8 1.8Current income taxes – – – – (0.5) (0.5) – – (0.5) (0.5)Deferred income taxes – (2.1) (0.7) (1.4) (0.1) (0.1) (0.2) (0.9) (1.0) (4.5)Trade payables and accruals – – – – (0.7) (0.7) – – (0.7) (0.7)Cash and cash equivalents – – – – 0.8 0.8 – – 0.8 0.8Non-current borrowings – – – – (0.9) (0.9) – – (0.9) (0.9)
Net assets acquired 0.1 5.1 2.5 4.4 1.6 1.6 2.0 4.6 6.2 15.7
Goodwill 3.7 1.8 7.0 2.0 14.5
Consideration 8.8 6.2 8.6 6.6 30.2
Consideration comprised:Cash 8.8 6.2 7.4 6.6 29.0Deferred cash – – 1.0 – 1.0Costs – – 0.2 – 0.2
8.8 6.2 8.6 6.6 30.2
In addition to the above, £1.5m of deferred consideration was paid during the year in respect of the 2005 acquisition ofCromar Ltd.
Post-acquisition performance:From the date of acquisition to 31 December 2007, the acquired companies and businesses contributed the following tothe Group’s performance:
£m £m £m £m £mRevenue 37.2 2.1 1.1 1.9 42.3Profit from operations 0.2 0.1 0.3 0.2 0.8Profit before taxation 0.2 0.1 0.3 0.2 0.8
Full year performance:If the acquisitions had been made on 1 January 2007, the acquired companies and businesses would have contributed thefollowing to the Group’s performance during 2007:
£m £m £m £m £mRevenue 132.5 3.6 7.0 4.2 147.3Profit from operations 0.7 0.2 1.6 1.2 3.7Profit before taxation 0.7 0.2 1.6 1.2 3.7
a n n u a l r e p o r t & a c c o u n t s t w o t h o u s a n d & s e v e n96
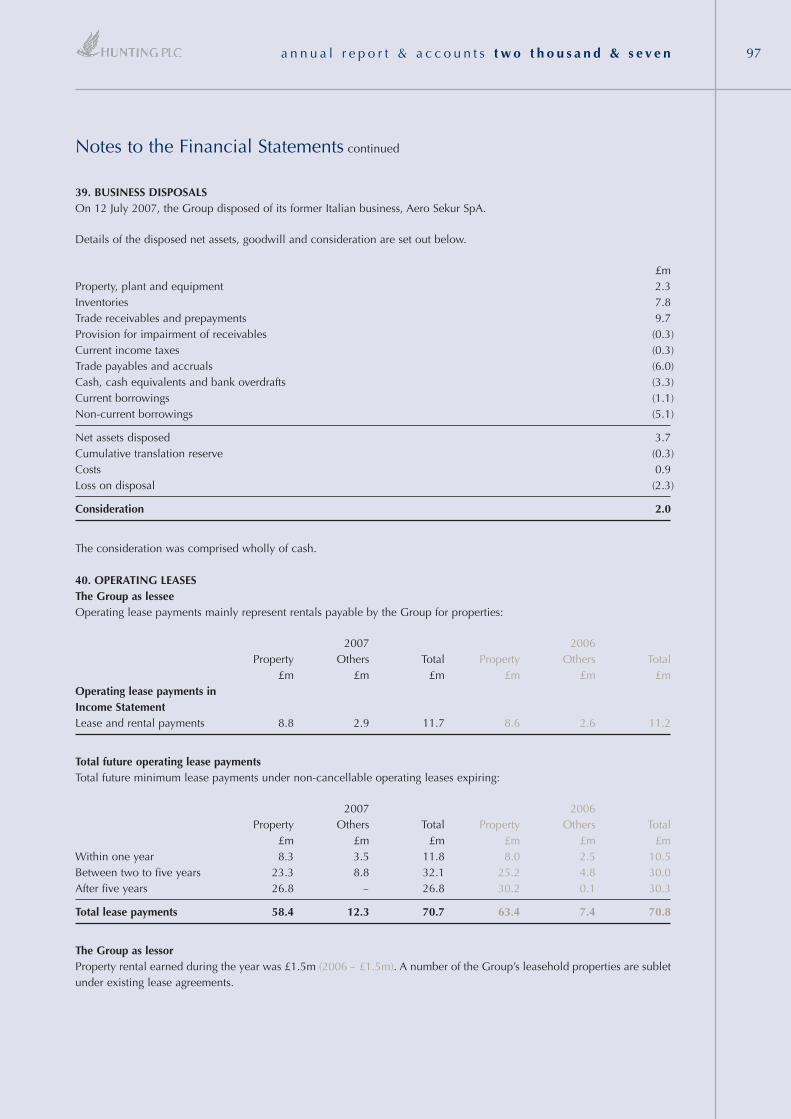
39. BUSINESS DISPOSALSOn 12 July 2007, the Group disposed of its former Italian business, Aero Sekur SpA.
Details of the disposed net assets, goodwill and consideration are set out below.
£mProperty, plant and equipment 2.3Inventories 7.8Trade receivables and prepayments 9.7Provision for impairment of receivables (0.3)Current income taxes (0.3)Trade payables and accruals (6.0)Cash, cash equivalents and bank overdrafts (3.3)Current borrowings (1.1)Non-current borrowings (5.1)
Net assets disposed 3.7Cumulative translation reserve (0.3)Costs 0.9Loss on disposal (2.3)
Consideration 2.0
The consideration was comprised wholly of cash.
40. OPERATING LEASESThe Group as lesseeOperating lease payments mainly represent rentals payable by the Group for properties:
2007 2006Property Others Total Property Others Total
£m £m £m £m £m £mOperating lease payments inIncome StatementLease and rental payments 8.8 2.9 11.7 8.6 2.6 11.2
Total future operating lease paymentsTotal future minimum lease payments under non-cancellable operating leases expiring:
2007 2006Property Others Total Property Others Total
£m £m £m £m £m £m Within one year 8.3 3.5 11.8 8.0 2.5 10.5Between two to five years 23.3 8.8 32.1 25.2 4.8 30.0After five years 26.8 – 26.8 30.2 0.1 30.3
Total lease payments 58.4 12.3 70.7 63.4 7.4 70.8
The Group as lessorProperty rental earned during the year was £1.5m (2006 – £1.5m). A number of the Group’s leasehold properties are subletunder existing lease agreements.
Notes to the Financial Statements continued
a n n u a l r e p o r t & a c c o u n t s t w o t h o u s a n d & s e v e n 97
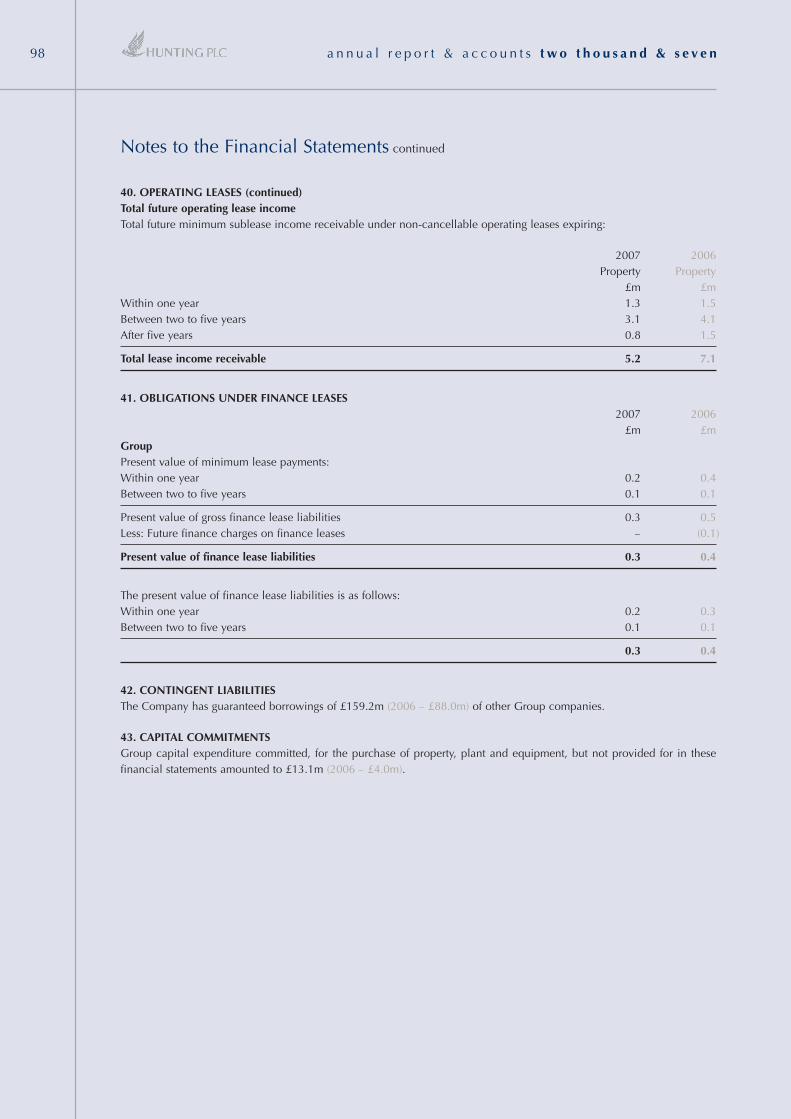
Notes to the Financial Statements continued
40. OPERATING LEASES (continued)Total future operating lease incomeTotal future minimum sublease income receivable under non-cancellable operating leases expiring:
2007 2006Property Property
£m £mWithin one year 1.3 1.5Between two to five years 3.1 4.1After five years 0.8 1.5
Total lease income receivable 5.2 7.1
41. OBLIGATIONS UNDER FINANCE LEASES2007 2006
£m £mGroupPresent value of minimum lease payments:Within one year 0.2 0.4Between two to five years 0.1 0.1
Present value of gross finance lease liabilities 0.3 0.5Less: Future finance charges on finance leases – (0.1)
Present value of finance lease liabilities 0.3 0.4
The present value of finance lease liabilities is as follows: Within one year 0.2 0.3Between two to five years 0.1 0.1
0.3 0.4
42. CONTINGENT LIABILITIESThe Company has guaranteed borrowings of £159.2m (2006 – £88.0m) of other Group companies.
43. CAPITAL COMMITMENTSGroup capital expenditure committed, for the purchase of property, plant and equipment, but not provided for in thesefinancial statements amounted to £13.1m (2006 – £4.0m).
a n n u a l r e p o r t & a c c o u n t s t w o t h o u s a n d & s e v e n98
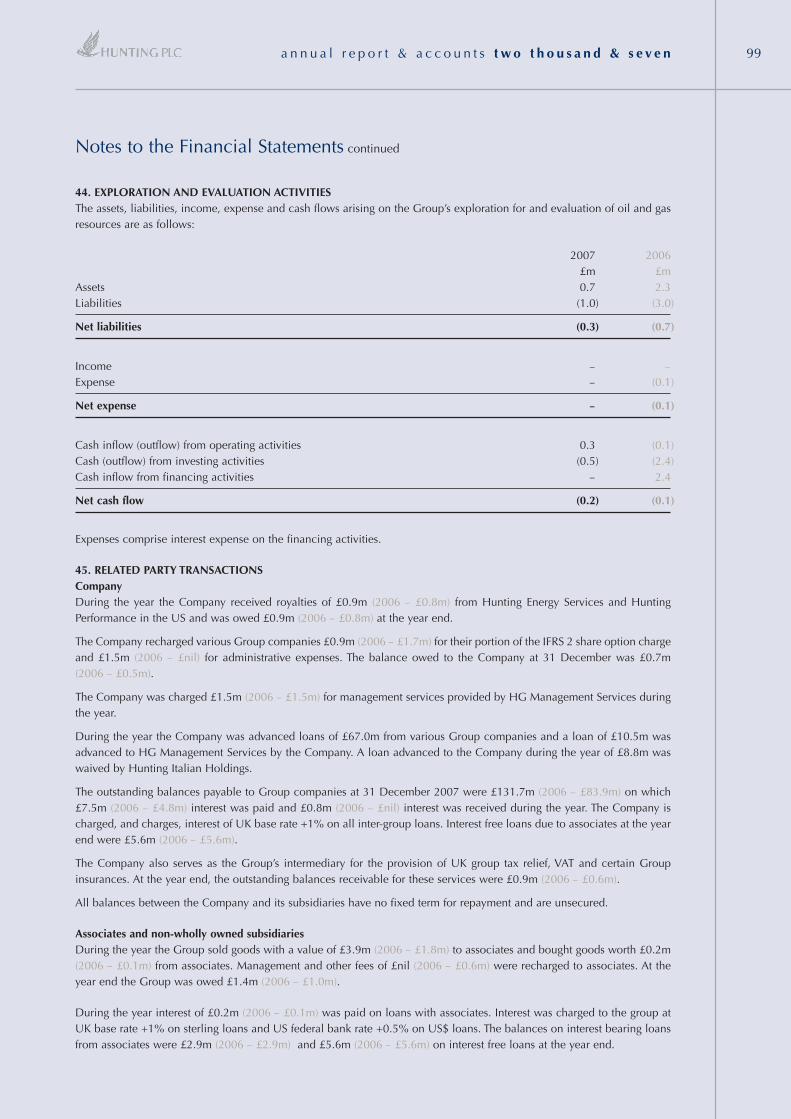
44. EXPLORATION AND EVALUATION ACTIVITIESThe assets, liabilities, income, expense and cash flows arising on the Group’s exploration for and evaluation of oil and gasresources are as follows:
2007 2006£m £m
Assets 0.7 2.3Liabilities (1.0) (3.0)
Net liabilities (0.3) (0.7)
Income – –Expense – (0.1)
Net expense – (0.1)
Cash inflow (outflow) from operating activities 0.3 (0.1)Cash (outflow) from investing activities (0.5) (2.4)Cash inflow from financing activities – 2.4
Net cash flow (0.2) (0.1)
Expenses comprise interest expense on the financing activities.
45. RELATED PARTY TRANSACTIONSCompanyDuring the year the Company received royalties of £0.9m (2006 – £0.8m) from Hunting Energy Services and HuntingPerformance in the US and was owed £0.9m (2006 – £0.8m) at the year end.
The Company recharged various Group companies £0.9m (2006 – £1.7m) for their portion of the IFRS 2 share option chargeand £1.5m (2006 – £nil) for administrative expenses. The balance owed to the Company at 31 December was £0.7m(2006 – £0.5m).
The Company was charged £1.5m (2006 – £1.5m) for management services provided by HG Management Services duringthe year.
During the year the Company was advanced loans of £67.0m from various Group companies and a loan of £10.5m wasadvanced to HG Management Services by the Company. A loan advanced to the Company during the year of £8.8m waswaived by Hunting Italian Holdings.
The outstanding balances payable to Group companies at 31 December 2007 were £131.7m (2006 – £83.9m) on which£7.5m (2006 – £4.8m) interest was paid and £0.8m (2006 – £nil) interest was received during the year. The Company ischarged, and charges, interest of UK base rate +1% on all inter-group loans. Interest free loans due to associates at the yearend were £5.6m (2006 – £5.6m).
The Company also serves as the Group’s intermediary for the provision of UK group tax relief, VAT and certain Groupinsurances. At the year end, the outstanding balances receivable for these services were £0.9m (2006 – £0.6m).
All balances between the Company and its subsidiaries have no fixed term for repayment and are unsecured.
Associates and non-wholly owned subsidiariesDuring the year the Group sold goods with a value of £3.9m (2006 – £1.8m) to associates and bought goods worth £0.2m(2006 – £0.1m) from associates. Management and other fees of £nil (2006 – £0.6m) were recharged to associates. At theyear end the Group was owed £1.4m (2006 – £1.0m).
During the year interest of £0.2m (2006 – £0.1m) was paid on loans with associates. Interest was charged to the group atUK base rate +1% on sterling loans and US federal bank rate +0.5% on US$ loans. The balances on interest bearing loansfrom associates were £2.9m (2006 – £2.9m) and £5.6m (2006 – £5.6m) on interest free loans at the year end.
Notes to the Financial Statements continued
a n n u a l r e p o r t & a c c o u n t s t w o t h o u s a n d & s e v e n 99
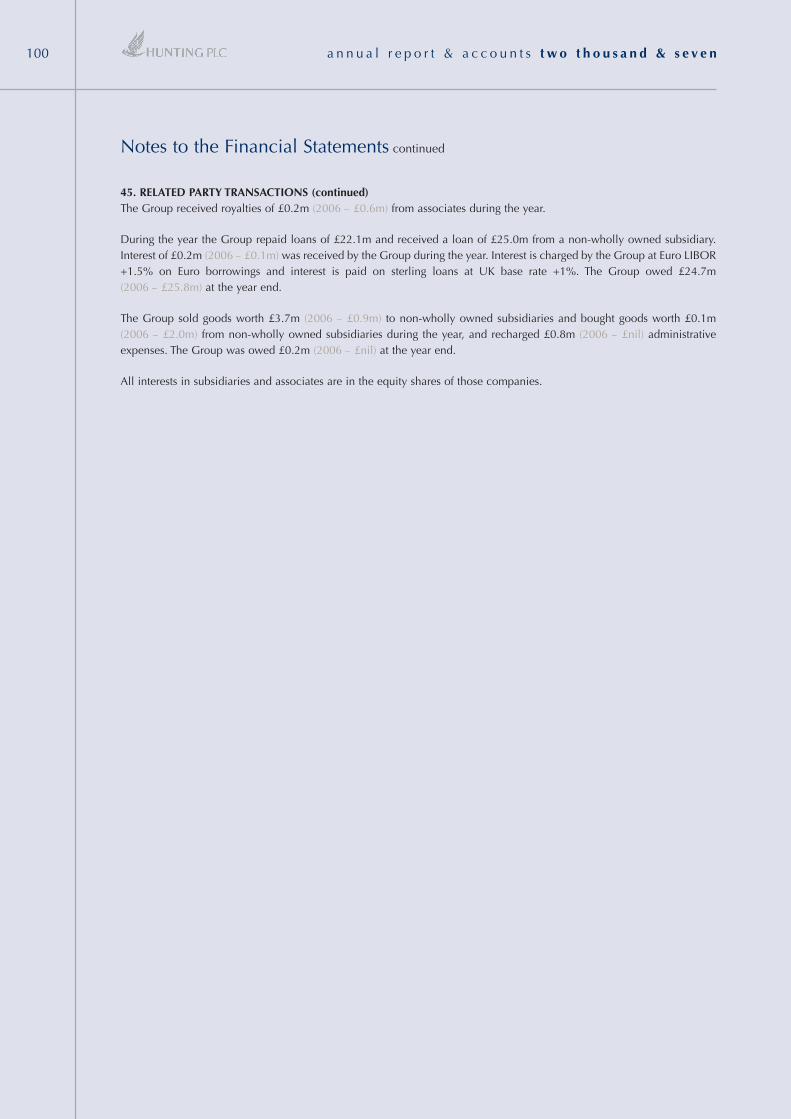
Notes to the Financial Statements continued
45. RELATED PARTY TRANSACTIONS (continued)The Group received royalties of £0.2m (2006 – £0.6m) from associates during the year.
During the year the Group repaid loans of £22.1m and received a loan of £25.0m from a non-wholly owned subsidiary.Interest of £0.2m (2006 – £0.1m) was received by the Group during the year. Interest is charged by the Group at Euro LIBOR+1.5% on Euro borrowings and interest is paid on sterling loans at UK base rate +1%. The Group owed £24.7m(2006 – £25.8m) at the year end.
The Group sold goods worth £3.7m (2006 – £0.9m) to non-wholly owned subsidiaries and bought goods worth £0.1m(2006 – £2.0m) from non-wholly owned subsidiaries during the year, and recharged £0.8m (2006 – £nil) administrativeexpenses. The Group was owed £0.2m (2006 – £nil) at the year end.
All interests in subsidiaries and associates are in the equity shares of those companies.
a n n u a l r e p o r t & a c c o u n t s t w o t h o u s a n d & s e v e n100
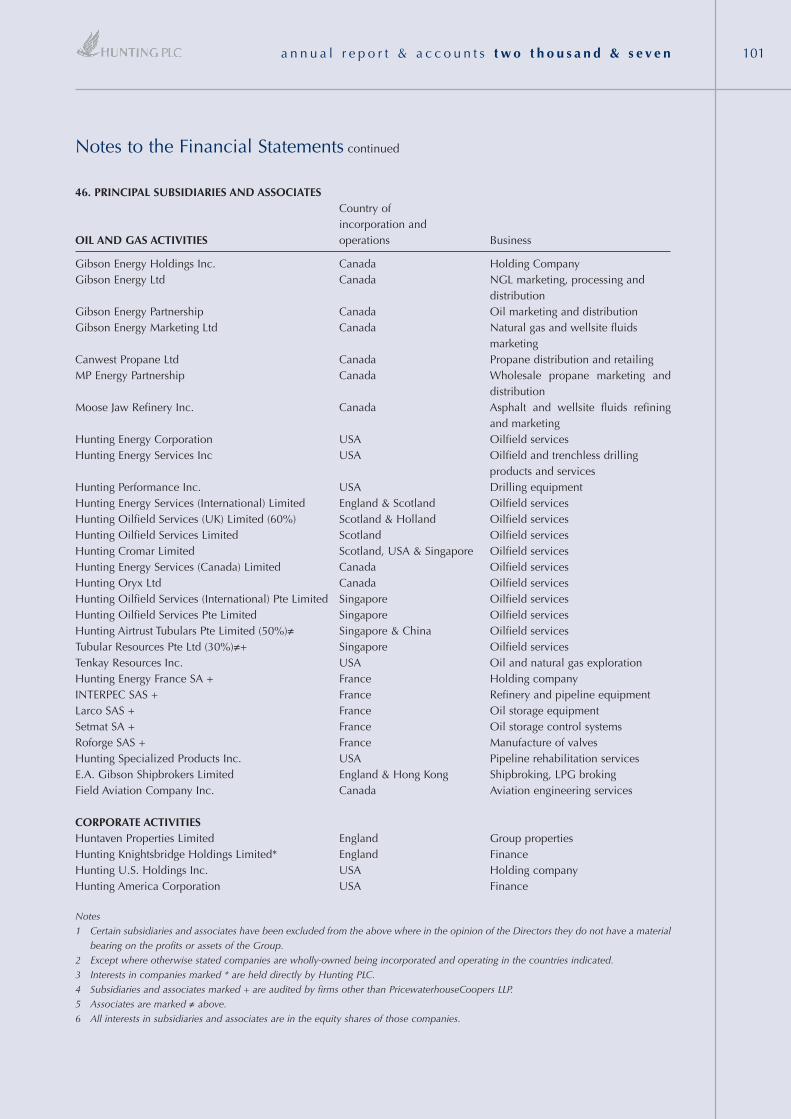
46. PRINCIPAL SUBSIDIARIES AND ASSOCIATESCountry ofincorporation and
OIL AND GAS ACTIVITIES operations Business
Gibson Energy Holdings Inc. Canada Holding CompanyGibson Energy Ltd Canada NGL marketing, processing and
distributionGibson Energy Partnership Canada Oil marketing and distributionGibson Energy Marketing Ltd Canada Natural gas and wellsite fluids
marketingCanwest Propane Ltd Canada Propane distribution and retailingMP Energy Partnership Canada Wholesale propane marketing and
distributionMoose Jaw Refinery Inc. Canada Asphalt and wellsite fluids refining
and marketingHunting Energy Corporation USA Oilfield servicesHunting Energy Services Inc USA Oilfield and trenchless drilling
products and servicesHunting Performance Inc. USA Drilling equipmentHunting Energy Services (International) Limited England & Scotland Oilfield servicesHunting Oilfield Services (UK) Limited (60%) Scotland & Holland Oilfield servicesHunting Oilfield Services Limited Scotland Oilfield servicesHunting Cromar Limited Scotland, USA & Singapore Oilfield servicesHunting Energy Services (Canada) Limited Canada Oilfield servicesHunting Oryx Ltd Canada Oilfield servicesHunting Oilfield Services (International) Pte Limited Singapore Oilfield servicesHunting Oilfield Services Pte Limited Singapore Oilfield servicesHunting Airtrust Tubulars Pte Limited (50%)≠ Singapore & China Oilfield servicesTubular Resources Pte Ltd (30%)≠+ Singapore Oilfield servicesTenkay Resources Inc. USA Oil and natural gas explorationHunting Energy France SA + France Holding companyINTERPEC SAS + France Refinery and pipeline equipment Larco SAS + France Oil storage equipment Setmat SA + France Oil storage control systemsRoforge SAS + France Manufacture of valvesHunting Specialized Products Inc. USA Pipeline rehabilitation services E.A. Gibson Shipbrokers Limited England & Hong Kong Shipbroking, LPG brokingField Aviation Company Inc. Canada Aviation engineering services
CORPORATE ACTIVITIESHuntaven Properties Limited England Group propertiesHunting Knightsbridge Holdings Limited* England FinanceHunting U.S. Holdings Inc. USA Holding companyHunting America Corporation USA Finance
Notes1 Certain subsidiaries and associates have been excluded from the above where in the opinion of the Directors they do not have a material
bearing on the profits or assets of the Group.2 Except where otherwise stated companies are wholly-owned being incorporated and operating in the countries indicated.3 Interests in companies marked * are held directly by Hunting PLC.4 Subsidiaries and associates marked + are audited by firms other than PricewaterhouseCoopers LLP.5 Associates are marked ≠ above.6 All interests in subsidiaries and associates are in the equity shares of those companies.
Notes to the Financial Statements continued
a n n u a l r e p o r t & a c c o u n t s t w o t h o u s a n d & s e v e n 101

Shareholder Information
FINANCIAL CALENDAR 2008April 23 Annual General Meeting
July 1 Final Ordinary Dividend Payment
August Announcement of Interim Results
November Interim Ordinary Dividend Payment
ANALYSIS OF ORDINARY SHAREHOLDERSAt 31 December 2007, the Company had 2,352 Ordinary shareholders (2006 – 2,426) who held 131.5 million (2006 –131.0 million) Ordinary shares analysed as follows:
2007 2006% of total % of total % of total % of total
shareholders shares shareholders sharesSIZE OF HOLDINGS
1 – 4,000 71.47 1.33 70.65 1.514,001 – 20,000 14.37 2.37 16.57 2.76
20,001 – 40,000 3.87 1.91 3.75 1.9640,001 – 200,000 5.82 10.00 5.03 9.00
200,001 – 500,000 2.47 13.96 1.90 11.07500,001 and over 2.00 70.43 2.10 73.70
SHARE INFORMATIONThe Ordinary Shares of the Company are quoted on the London Stock Exchange.
Telephone information on the latest share price is available on 0906 003 2942.
Equiniti, formerly Lloyds TSB Registrars, offers a range of shareholder information and dealing services onwww.shareview.co.uk
a n n u a l r e p o r t & a c c o u n t s t w o t h o u s a n d & s e v e n102
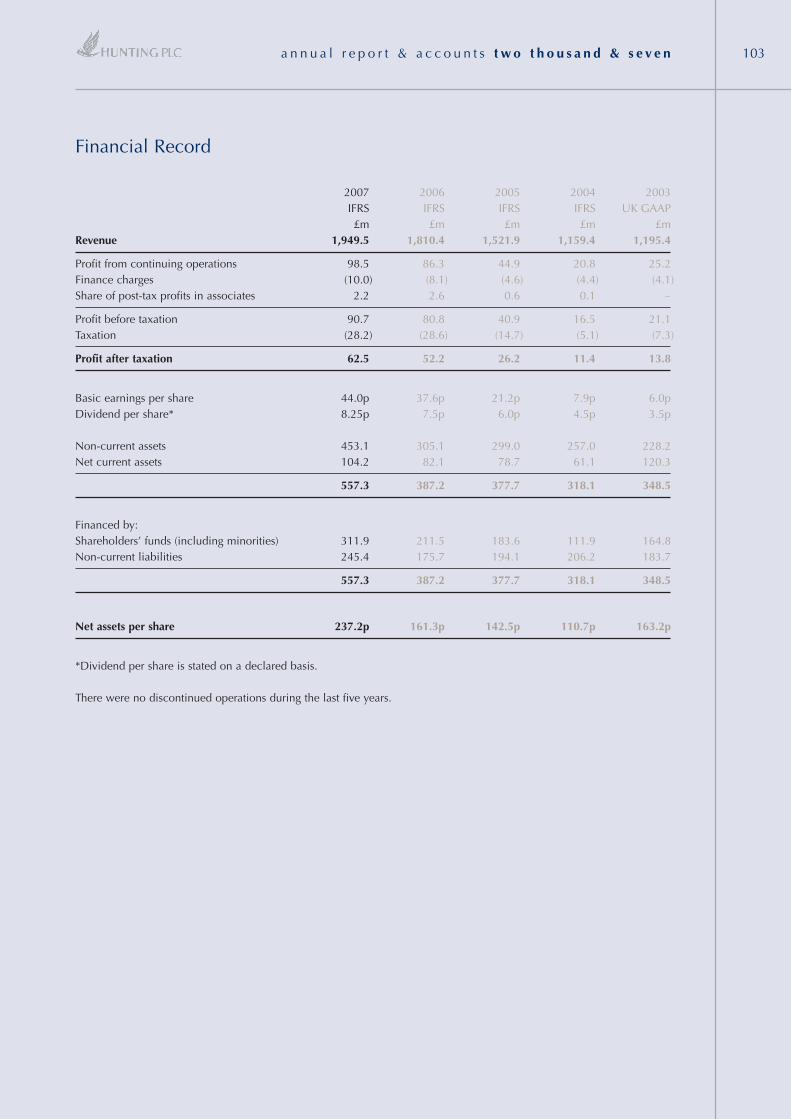
2007 2006 2005 2004 2003IFRS IFRS IFRS IFRS UK GAAP£m £m £m £m £m
Revenue 1,949.5 1,810.4 1,521.9 1,159.4 1,195.4
Profit from continuing operations 98.5 86.3 44.9 20.8 25.2Finance charges (10.0) (8.1) (4.6) (4.4) (4.1)Share of post-tax profits in associates 2.2 2.6 0.6 0.1 –
Profit before taxation 90.7 80.8 40.9 16.5 21.1Taxation (28.2) (28.6) (14.7) (5.1) (7.3)
Profit after taxation 62.5 52.2 26.2 11.4 13.8
Basic earnings per share 44.0p 37.6p 21.2p 7.9p 6.0pDividend per share* 8.25p 7.5p 6.0p 4.5p 3.5p
Non-current assets 453.1 305.1 299.0 257.0 228.2Net current assets 104.2 82.1 78.7 61.1 120.3
557.3 387.2 377.7 318.1 348.5
Financed by:Shareholders’ funds (including minorities) 311.9 211.5 183.6 111.9 164.8Non-current liabilities 245.4 175.7 194.1 206.2 183.7
557.3 387.2 377.7 318.1 348.5
Net assets per share 237.2p 161.3p 142.5p 110.7p 163.2p
*Dividend per share is stated on a declared basis.
There were no discontinued operations during the last five years.
Financial Record
a n n u a l r e p o r t & a c c o u n t s t w o t h o u s a n d & s e v e n 103

a n n u a l r e p o r t & a c c o u n t s t w o t h o u s a n d & s e v e n
Professional Advisers
Solicitors
CMS Cameron McKenna LLP
Auditors
PricewaterhouseCoopers LLP
Brokers
Hoare Govett Limited
Merchant Bankers
Close Brothers Corporate Finance Limited
Insurance Brokers
Willis Limited
Pension Advisers & Actuary
Lane Clark & Peacock LLP
Registrars and Transfer Office
Equiniti Limited
Aspect House
Spencer Road, Lancing
West Sussex BN99 6DA
Telephone 0871 384 2030
Registered Office: 3 Cockspur Street, London SW1Y 5BQ
Registered Number: 974568 (Registered in England and Wales)
Telephone: 020 7321 0123 Facsimile: 020 7839 2072
Internet Web Site: www.hunting.plc.uk
Designed by Marshall Design, Godalming, Surrey.
Printed by Park Communications on paper manufactured from Elemental Chlorine Free (ECF) pulp sourced from sustainable forests.
Park Communications is certified to ISO 14001:2004 Environmental Management System and is a CarbonNeutral® company.
Hunting PLC Global Market www.hunting.plc.uk
a n n u a l r e p o r t & a c c o u n t s t w o t h o u s a n d & s e v e n a n n u a l r e p o r t & a c c o u n t s t w o t h o u s a n d & s e v e n
Excellence in EnergyServices for over onehundred years
Hunting PLC is an international
energy services provider to
the world’s leading oil and gas
companies in the upstream and
midstream sectors. Established in
1874, it is a fully listed public
company traded on the London
Stock Exchange. The company
maintains corporate offices in
Houston and Calgary and is
headquartered in London
As well as the United Kingdom,
the company has principal
operations in
Canada
China
France
Holland
Hong Kong
Singapore
United Arab Emirates
United States of America
Hunting PLC
A global provider of upstream oil
and gas equipment. Sales and
service operations are located in
the major oil centres of the
world including 20 company
owned facilities and a network of
more than 60 licensed partners
Well Construction
OCTG
Premium Connections
Mud Motors
Non-Magnetic Drill Collars
Directional Drill Rods
Well Completion
Accessory Manufacturing
Speciality Threading
Pressure Control Equipment
Wireline Tools
Well Intervention Equipment
Exploration and Production
USA Non-operator
Hunting Energy France
Petrochemical Equipment
Hunting Energy
Marketing
Crude Oil
Diluent
Natural Gas Liquids
Natural Gas
Truck Transportation
Crude Oil
Asphalt
Diluent
Natural Gas Liquids
Liquid Petroleum Gases
Carbon Dioxide
Industrial Chemicals
Terminals and Pipelines
Pipelines
Custom Terminals
Storage
Blending
Canada’s largest independent midstream energy company
playing a significant role in the country’s oil and gas industry
linking upstream producers with downstream refiners
Gibson Energy
Gibson Shipbrokers
Propane Marketing andDistribution
Retail Distribution
Wholesale Supply
Moose Jaw Refinery
Asphalt
Roofing Flux
Well Site Fluids
Light distillates
Crude Oil and Products
Specialised Tankers
LPG and LNG
Dry Cargo
Sale and Purchase
Offshore
Research 07

Excellence in Energy Services. . . for over 100 years
www.hunting.plc.uk
Contents
Chairman’s Statement _________________________________________________________ 2
Business Review _____________________________________________________________ 4
Board of Directors___________________________________________________________ 16
Report of the Directors ________________________________________________________ 18
Corporate Social Responsibility_________________________________________________ 24
The Remuneration Committee’s Report __________________________________________ 26
Corporate Governance ________________________________________________________ 34
Report of the Auditors _________________________________________________________ 39
Principal Accounting Policies __________________________________________________ 41
Consolidated Income Statement ________________________________________________ 47
Consolidated and Company Statement of Recognised Income and Expense ___________ 48
Consolidated Balance Sheet____________________________________________________ 49
Company Balance Sheet_______________________________________________________ 50
Cash Flow Statement__________________________________________________________ 51
Notes to the Financial Statements _______________________________________________ 52
Shareholder Information_______________________________________________________102
Financial Record _____________________________________________________________103
H u n t i n g P L C a n n u a l r e p o r t & a c c o u n t s
t w o t h o u s a n d & s e v e n 07
3 Cockspur Street, London SW1Y 5BQTel: 020 7321 0123 Fax: 020 7839 2072
www.hunting.plc.uk
HU
NT
ING
PLC
AN
NU
AL R
EPO
RT
AN
D A
CC
OU
NT
S 20
07