hunting plc annual report and accounts 2020 resilience
TRANSCRIPT

Hunting PLCAnnual Report and Accounts 2020Resilience Through A Global Crisis

Welcome to Hunting
Hunting is a key supplier to the upstream oil and gas industry.
Our strategy is to manufacture products and deliver services to our customers, wherever in the world they are operating.
Hunting’s product offering extends across the life cycle of an oil and gas well, and this focus allows us to create, distribute and sustain value for our shareholders and stakeholders.
Hunting is a premium-listed Company, quoted on the London Stock Exchange and is a constituent of the FTSE All-Share Index.
Average WTI crude oil price
$39per barrel(2019 – $57 per barrel)
Global average onshore rig count
1,097units(2019 – 1,844 units)
Global onshore drilling and production expenditure
$77.7billion(2019 – $155.5 billion)
Year-end WTI crude oil spot price
$49per barrel(2019 – $61 per barrel)
Global average offshore rig count
182units(2019 – 243 units)
Global offshore drilling and production expenditure
$43.4billion(2019 – $61.1 billion)
Revenue
$626.0million(2019 – $960.0 million)
Underlying (loss) profit from operations*
$(16.4)million(2019 – $94.3 million)
Underlying diluted (loss) earnings per share*
(10.0)cents(2019 – 43.9 cents)
Total cash and bank at year-end*
$101.7million(2019 – $127.0 million)
Reported (loss) profit from operations
$(220.0)million(2019 – $46.8 million)
Reported diluted (loss) earnings per share
(143.2)cents(2019 – 23.5 cents)
Strategic ReportSummary of the Year 01At a Glance 02Chairman’s Statement 04Our Purpose 06Our Culture 08Business Model 10– Our Resources 12– Our Operating Segments 18– Our Products and Services 22– Our Stakeholders 24Case Study – Hunting’s COVID Response 34Chief Executive’s Statement and Outlook 36Market Review 40Our Business Strategy 46Case Study – Hunting’s Revolutionary Technologies 48Risk Management 50Group Review 60Segmental Review 66
Case Study – Organic Oil Recovery 73Key Performance Indicators 74Directors’ Report and Compliance Statements 76
Corporate GovernanceCorporate Governance Overview 80Board of Directors and Company Secretary 82Executive Committee 84Corporate Governance Report 85Remuneration Committee Report 93– Remuneration at a Glance 96– Directors’ Remuneration Policy 98 – Annual Report on Remuneration 107Nomination Committee Report 119Audit Committee Report 121
Financial StatementsIndependent Auditors’ Report 126Consolidated Income Statement 137
Consolidated Statement of Comprehensive Income 138Consolidated Balance Sheet 139Consolidated Statement of Changes in Equity 140 Consolidated Statement of Cash Flows 141Notes to the Consolidated Financial Statements 142Company Balance Sheet 191Company Statement of Changes in Equity 192Company Statement of Cash Flows 193Notes to the Company Financial Statements 194
Other InformationNon-GAAP Measures 203Financial Record 208Shareholder and Statutory Information 209Glossary 213Professional Advisers 216
Market Highlights
Financial Highlights
Contents:* Non-GAAP measure (“NGM”) see pages 203 to 207 and note 26.

Summary of the Year
Operational Highlights
$32.8m acquisition of Enpro Subsea Limited (“Enpro”) completed in February 2020. • Enpro is a leader in subsea production technology, offering low cost, flexible field development solutions including well production and intervention modules to enhance recovery from oil and gas wells. Enpro is now integrated into the Subsea business division.
• Revenue from Subsea products increased 57% to $69.8m (2019 – $44.5m), largely as a result of our Enpro and RTI acquisitions.
Divestment of US Drilling Tools business completed in December 2020. • Hunting transferred key operating assets to Rival Downhole Tools LC, in exchange for a 23.5% equity position within the expanded Rival business.
New business model in Canada implemented in August 2020. • Hunting has closed its manufacturing operation in Calgary, Alberta, and opened a sales office to pursue new business opportunities. Future customer OCTG requirements are to be completed by in-country licensees.
• A field service centre has been retained in Nisku, with Hunting Titan continuing to operate its network of distribution centres across Western Canada.
Investment in Well Data Labs, a well analytics company, completed in February 2021. • Hunting has provided $2.5m in convertible capital financing to support Well Data’s growth ambitions.
• Key investment in the high growth data analytics sub-sector of the drilling market.
New products launched in the year to broaden customer offering. • Completion of detonating cord manufacturing line at Milford, Texas, to increase Hunting Titan’s product offering. The new line has an annual production capacity of c.3.0 million feet.
• New V3.0 ControlFire® switch launched to enable higher level of in-field reliability.
• Additional variants of the E-SUB™, H-1® and H-2™ Perforating Systems launched in the year.
• Rental offering launched for T-Set™ One setting tool.
Non-oil and gas revenue more resilient in the year with good progress in this area within the Advanced Manufacturing group. • Medical and aviation certifications secured at Hunting Electronics to support diversification.
• Hunting Dearborn reports increase in non-oil and gas order book, including aviation and space orders.
• UK business secured new geothermal project win.
Significant restructuring across the Group to align with the prevailing market and to reduce cost base. • Five operating sites and three distribution centres closed or mothballed during the year.
• 35% of workforce released as market conditions declined.
Board changes. • Bruce Ferguson appointed Finance Director in April 2020, following shareholder approval at the AGM.
Strong year-end balance sheet. • Net assets of $976.6m (2019 – $1,223.8m), after impairments and exceptional items.
Total cash and bank of $101.7m at 31 December 2020 (2019 – $127.0m).* • Reflecting strong cash generation through working capital reduction and positive EBITDA generated early in the year.
Revenue of $626.0m (2019 – $960.0m) recorded. • 35% year-on-year decline due to COVID-19 and the resulting impact on the global energy industry and other geopolitical factors.
• Oil and gas revenue declined 36% to $586.2m (2019 – $918.7m). • Non-oil and gas revenue has been more resilient at $39.8m (2019 – $41.3m), increasing to 6% of revenue (2019 – 4%).
EBITDA of $26.1m delivered in the year (2019 – $139.7m).* • Majority of EBITDA result delivered in Q1, followed by break-even result for the balance of the year.
• EBITDA margin of 4% (2019 – 15%). • Year-on-year reduction due to large decline in activity levels and partial under absorption of overheads.
Result from operations. • Underlying loss from operations of $16.4m (2019 – $94.3m profit). • Amortisation of acquired intangible assets and exceptional items totalling $203.6m recorded in the year (2019 – $47.5m).
• “Middle column” items include $177.9m of asset impairments, $17.3m for the amortisation of acquired intangible assets, $10.3m of restructuring costs, $1.4m of acquisition costs and other exceptional credits totalling $3.3m.
• Reported loss from operations of $220.0m (2019 – $46.8m profit).
Total dividends declared in the year of 9.0 cents per share. • Subject to shareholder approval, a Final Dividend of 4.0 cents per share, absorbing $6.5m, to be paid on 14 May 2021 to shareholders on the register on 23 April 2021.
* Non-GAAP measure (“NGM”) see pages 203 to 207 and note 26.
Financial Highlights
Business M
odel and Stakeholders
Business S
trategy P
erformance
Governance
Financial Statem
ents01Hunting PLC Annual Report and Accounts 2020
Purpose and C
ulture

At a Glance
Our OperationsOur operating facilities need to be close to our customers and are therefore based in or near the main oil and gas producing regions.
Conventional oil and gas basins Unconventional oil and gas basins Key operating locations
Our Products and Services
Oil Country Tubular Goods (“OCTG”)The Group owns proprietary connection technology including the SEAL-LOCKTM and WEDGE-LOCKTM premium connections and the TEC-LOCKTM semi-premium connection. The Group manufactures couplings and accessories and applies premium threads to pipe for its customers throughout its global facilities.
Perforating SystemsHunting manufactures perforating guns, energetics charges and instrumentation used in well completion activities. Products are manufactured across our global footprint and sold through distribution points in Canada, China, Indonesia, UAE and US.
Advanced ManufacturingAdvanced Manufacturing includes precision machining and electronics manufacturing, both utilised in MWD/LWD tools. A range of non-oil and gas products are also engineered for the medical, naval, aerospace and space sectors.
SubseaHunting’s Subsea business manufactures hydraulic couplings, valves, stress joints, flow access modules and accessories for application in deep water drilling activities.
Intervention ToolsThe Group manufactures a range of tools and pressure control equipment used for intervention activities.
Drilling ToolsHunting’s Drilling Tools interests are now held through a 23.5% interest in Rival Downhole Tools LC.
02Hunting PLC Annual Report and Accounts 2020

Investment HighlightsGroup Overview
Operating sites
312020(2019 – 36)
Countries of operation
112020(2019 – 11)
Employees (at year-end)
1,923 2020(2019 – 2,956)
Distribution centres
162020(2019 – 19)
Patents granted and pending
7992020(2019 – 691)
Internal manufacturing reject rate
0.24%2020(2019 – 0.30%)
— Solid fundamentals for the oil and gas industry.
— Strategic focus on the wellbore. — Proprietary technologies and diverse product range.
— World-class, flexible manufacturing facilities located close to our customers.
— Proven track record of manufacturing excellence and reliability.
— Experienced management team. — Focused on efficiency, cost control and cash generation.
— Strong reputation within our customer base for delivering quality.
Our Business Relationships
Hunting generates value through the manufacture of products, provision of related services and supply of rental equipment to the upstream energy sector used in the extraction of oil and gas.
Our strategic focus is on the manufacture of products used in the wellbore or those products forming part of the wellbore’s infrastructure.
Oil and gas extraction requires a diverse range of products and services. The nature of the sector results in relationships with business partners including customers, suppliers and competitors at different points in the value chain.
Customers
Hunting
Competitors Suppliers
Oil and gas extraction cycle
Segmental Revenue
Segmental revenue
1. US 43%2. Hunting Titan 25%3. Asia Paci�c 17%4. EMEA 13%5. Canada 2%
1
2
3
4
5
Segmental revenue
1. US 43%2. Hunting Titan 25%3. Asia Paci�c 17%4. EMEA 13%5. Canada 2%
1
2
3
4
5
Split of External Revenue by Segment Year to 31 December 2020
Pu
rpo
se and
Cu
lture
Business M
odel and Stakeholders
Business S
trategy P
erformance
Governance
Financial Statem
ents03Hunting PLC Annual Report and Accounts 2020

Chairman’s Statement
John (Jay) F. GlickChairman
IntroductionOur 2020 Annual Report covers a remarkably difficult year for the world, for the energy sector, and for Hunting. Despite rigorous efforts on the part of companies around the globe to identify enterprise risks and have appropriate mitigation strategies, none imagined at the start of the year that the global economy would be rocked by a pandemic that would disrupt virtually every aspect of commerce. The ability of your Company to adapt to the rapid changes required to operate in the challenging environment seen in the year is testament to our culture, our dynamic leadership and the resilience of our operational support systems.
Even during very dark and uncertain times, heroes emerged to deliver care, ensure food and energy supplies, develop lifesaving technologies in the form of therapeutics and vaccines, and to make certain that our lives and our economies were disrupted to the minimum extent necessary to protect public health. Hunting played an important role in those efforts by delivering products to supply the energy needed to power the global economy. The energy sector was deemed to be a critical sector, which meant that during the shutdown Hunting’s employees reported for work and made certain the energy needs for critical sectors such as transportation, agriculture and utilities were fully supported.
I want to begin this report with a special message of thanks to our employees, whose dedication and hard work were crucial to ensuring the Company supported our customers in the oil and gas, aerospace, medical equipment and the other critical sectors in which our products are used. On behalf of the Board, I would like to thank Jim and his team for their efforts in the year in creating a more resilient business. I also want to recognise and thank the management team for their swift and decisive leadership during a very challenging time. Special thanks also goes to my fellow Directors for whole-heartedly embracing the added governance challenges posed by the pandemic and for their wise and steadfast counsel as we navigated the uncertainties of the past year.
Our preparedness was certainly tested, but the crisis served to validate the effectiveness of many of the information technology investments we have made over the past few years. As a result of the software and communications systems we had put in place, our staff were able to work from home, interface effectively with customers, bankers, auditors, and a host of critical business support teams. Additionally, our Health and Safety teams were able to support our factories and field operations by ensuring safe work practices for our workforce.
As you will note in this year’s Annual Report, the Group took swift action to reduce spending and generate cash. The most painful of these was a sharp, but necessary, reduction in the size of our workforce. Some factories and distribution sites were closed or consolidated to rationalise our operations and improve efficiencies. There was also a significant focus on converting working capital to cash. As a result, inventories and trade receivables were tightly monitored and managed. Our strong balance sheet and conservative capital structure proved beneficial during a time when capital markets were challenging for a number of companies in our sector. These actions ensured the Company remained in a sound financial position with a robust balance sheet and a strong cash and bank position at year-end.
Our strategic focus on innovation and new technologies continued throughout the year enabling the Group to retain a competitive edge in our various markets. It also looks to the energy transition as the world moves towards more sustainable technologies. Hunting’s expertise in design engineering, materials science, precision machining, and electronics have long been at the core of critical downhole technology for the production of oil and gas. These fuels will continue to be required to drive the global economy for the foreseeable future. In addition, we are also seeing other sectors that utilise our expertise, such as aerospace, defence, medical equipment and space.
Resilience The ability of your Company to adapt to the rapid changes required to operate in the challenging environment seen in the year is testament to our culture, our dynamic leadership, and the resilience of our operational support systems.
04Hunting PLC Annual Report and Accounts 2020
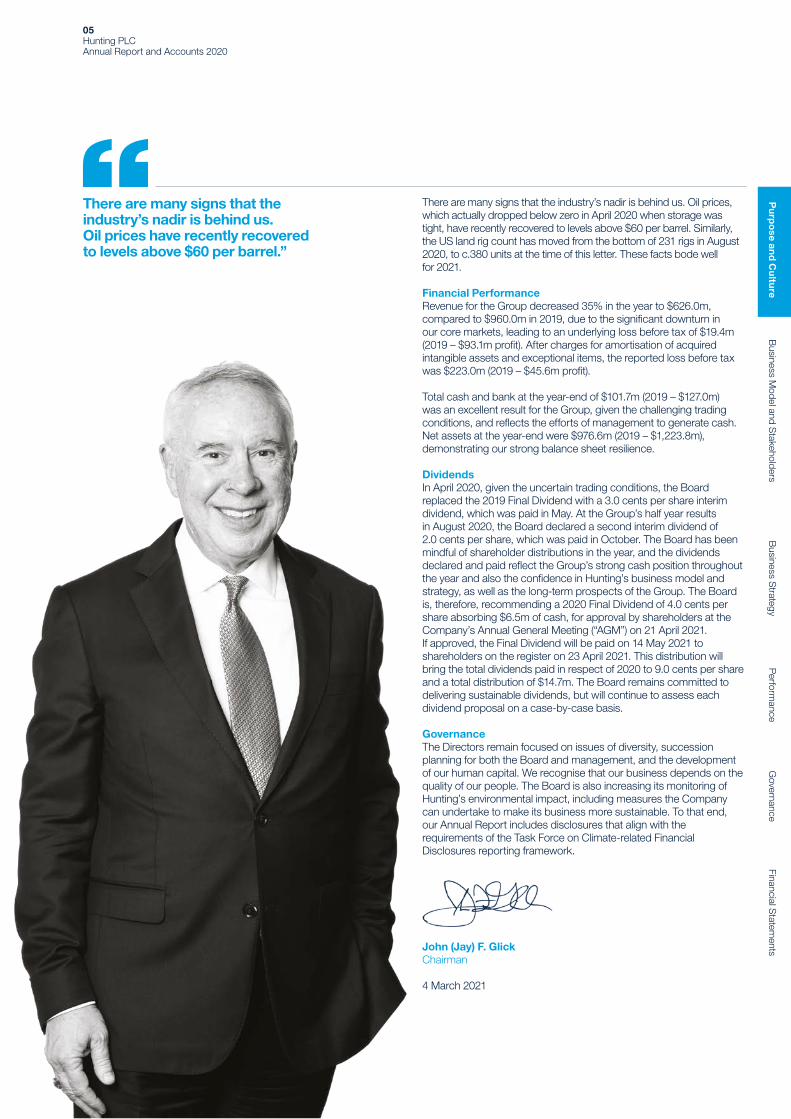
There are many signs that the industry’s nadir is behind us. Oil prices, which actually dropped below zero in April 2020 when storage was tight, have recently recovered to levels above $60 per barrel. Similarly, the US land rig count has moved from the bottom of 231 rigs in August 2020, to c.380 units at the time of this letter. These facts bode well for 2021.
Financial PerformanceRevenue for the Group decreased 35% in the year to $626.0m,compared to $960.0m in 2019, due to the significant downturn in our core markets, leading to an underlying loss before tax of $19.4m (2019 – $93.1m profit). After charges for amortisation of acquired intangible assets and exceptional items, the reported loss before tax was $223.0m (2019 – $45.6m profit).
Total cash and bank at the year-end of $101.7m (2019 – $127.0m) was an excellent result for the Group, given the challenging trading conditions, and reflects the efforts of management to generate cash. Net assets at the year-end were $976.6m (2019 – $1,223.8m), demonstrating our strong balance sheet resilience.
DividendsIn April 2020, given the uncertain trading conditions, the Board replaced the 2019 Final Dividend with a 3.0 cents per share interim dividend, which was paid in May. At the Group’s half year results in August 2020, the Board declared a second interim dividend of 2.0 cents per share, which was paid in October. The Board has been mindful of shareholder distributions in the year, and the dividends declared and paid reflect the Group’s strong cash position throughout the year and also the confidence in Hunting’s business model and strategy, as well as the long-term prospects of the Group. The Board is, therefore, recommending a 2020 Final Dividend of 4.0 cents per share absorbing $6.5m of cash, for approval by shareholders at the Company’s Annual General Meeting (“AGM”) on 21 April 2021. If approved, the Final Dividend will be paid on 14 May 2021 to shareholders on the register on 23 April 2021. This distribution will bring the total dividends paid in respect of 2020 to 9.0 cents per share and a total distribution of $14.7m. The Board remains committed to delivering sustainable dividends, but will continue to assess each dividend proposal on a case-by-case basis.
GovernanceThe Directors remain focused on issues of diversity, succession planning for both the Board and management, and the development of our human capital. We recognise that our business depends on the quality of our people. The Board is also increasing its monitoring of Hunting’s environmental impact, including measures the Company can undertake to make its business more sustainable. To that end, our Annual Report includes disclosures that align with the requirements of the Task Force on Climate-related Financial Disclosures reporting framework.
John (Jay) F. GlickChairman
4 March 2021
There are many signs that the industry’s nadir is behind us. Oil prices have recently recovered to levels above $60 per barrel.”
Pu
rpo
se and
Cu
lture
Business M
odel and Stakeholders
Business S
trategy P
erformance
Governance
Financial Statem
ents05Hunting PLC Annual Report and Accounts 2020
Our Purpose
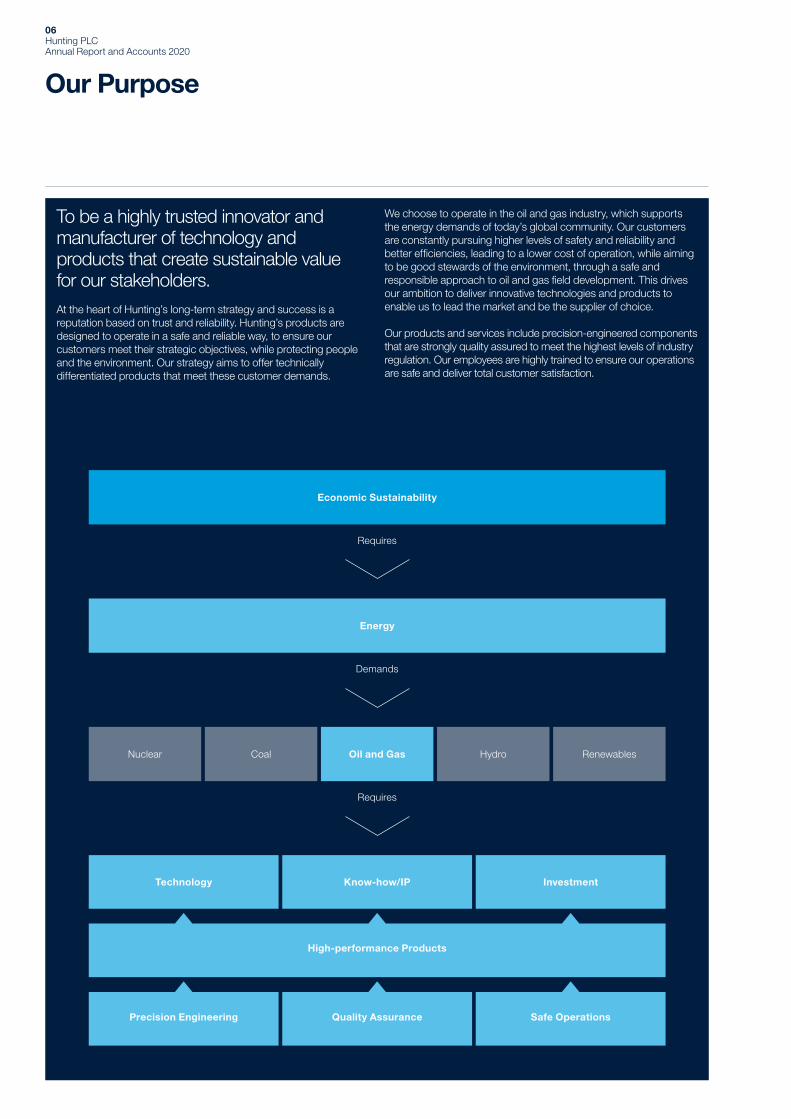
To be a highly trusted innovator and manufacturer of technology and products that create sustainable value for our stakeholders.At the heart of Hunting’s long-term strategy and success is a reputation based on trust and reliability. Hunting’s products are designed to operate in a safe and reliable way, to ensure our customers meet their strategic objectives, while protecting people and the environment. Our strategy aims to offer technically differentiated products that meet these customer demands.
We choose to operate in the oil and gas industry, which supports the energy demands of today’s global community. Our customers are constantly pursuing higher levels of safety and reliability and better efficiencies, leading to a lower cost of operation, while aiming to be good stewards of the environment, through a safe and responsible approach to oil and gas field development. This drives our ambition to deliver innovative technologies and products to enable us to lead the market and be the supplier of choice.
Our products and services include precision-engineered components that are strongly quality assured to meet the highest levels of industry regulation. Our employees are highly trained to ensure our operations are safe and deliver total customer satisfaction.
Know-how/IP InvestmentTechnology
Economic Sustainability
Energy
Oil and Gas HydroNuclear RenewablesCoal
Requires
Requires
Demands
High-performance Products
Precision Engineering Quality Assurance Safe Operations
06Hunting PLC Annual Report and Accounts 2020
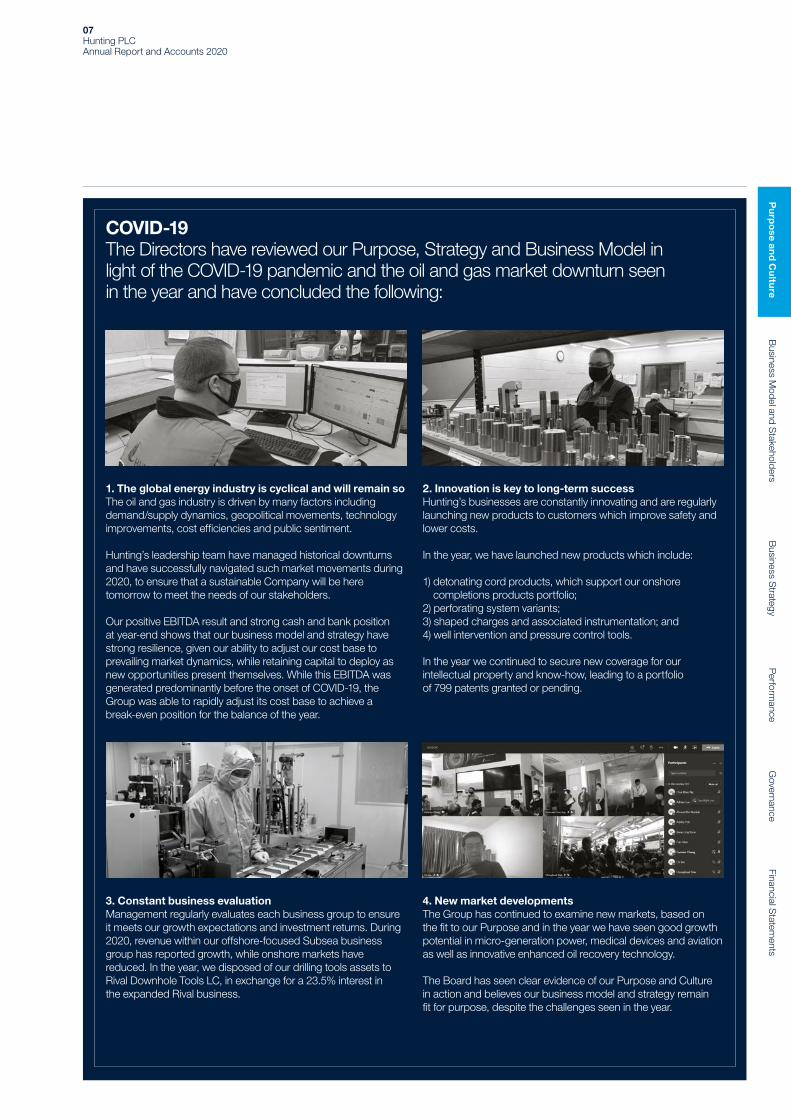
COVID-19The Directors have reviewed our Purpose, Strategy and Business Model in light of the COVID-19 pandemic and the oil and gas market downturn seen in the year and have concluded the following:
1. The global energy industry is cyclical and will remain soThe oil and gas industry is driven by many factors including demand/supply dynamics, geopolitical movements, technology improvements, cost efficiencies and public sentiment.
Hunting’s leadership team have managed historical downturns and have successfully navigated such market movements during 2020, to ensure that a sustainable Company will be here tomorrow to meet the needs of our stakeholders.
Our positive EBITDA result and strong cash and bank position at year-end shows that our business model and strategy have strong resilience, given our ability to adjust our cost base to prevailing market dynamics, while retaining capital to deploy as new opportunities present themselves. While this EBITDA was generated predominantly before the onset of COVID-19, the Group was able to rapidly adjust its cost base to achieve a break-even position for the balance of the year.
3. Constant business evaluationManagement regularly evaluates each business group to ensure it meets our growth expectations and investment returns. During 2020, revenue within our offshore-focused Subsea business group has reported growth, while onshore markets have reduced. In the year, we disposed of our drilling tools assets to Rival Downhole Tools LC, in exchange for a 23.5% interest in the expanded Rival business.
2. Innovation is key to long-term successHunting’s businesses are constantly innovating and are regularly launching new products to customers which improve safety and lower costs.
In the year, we have launched new products which include:
1) detonating cord products, which support our onshore completions products portfolio;
2) perforating system variants; 3) shaped charges and associated instrumentation; and4) well intervention and pressure control tools.
In the year we continued to secure new coverage for our intellectual property and know-how, leading to a portfolio of 799 patents granted or pending.
4. New market developmentsThe Group has continued to examine new markets, based on the fit to our Purpose and in the year we have seen good growth potential in micro-generation power, medical devices and aviation as well as innovative enhanced oil recovery technology.
The Board has seen clear evidence of our Purpose and Culture in action and believes our business model and strategy remain fit for purpose, despite the challenges seen in the year.
Pu
rpo
se and
Cu
lture
Business M
odel and Stakeholders
Business S
trategy P
erformance
Governance
Financial Statem
ents07Hunting PLC Annual Report and Accounts 2020

Our Culture
Strong HSE and
Product Quality Ethic
Group HSE and Quality policies are aimed at ensuring our staff, customers and the environment
are protected, with strong management oversight of
day-to-day operating procedures.
Flat Management
StructureHunting operates short chains of command to allow rapid decision
making aimed at meeting customer deadlines.
Highly Skilled
The majority of our workforce are highly skilled and are
encouraged to develop through additional training programmes.
Speak UpOur culture encourages a ‘speak up’ environment to enable our
processes to be improved, but also to address possible concerns
from all levels of staff.
Fair Remuneration
A skilled workforce is needed to deliver to our customers. Our
workforce is paid competitively, with pension, bonus and long-term incentive arrangements in place
and healthcare provisions available in most
geographical areas.
Our People
At the heart of Hunting’s Culture are our people. To ensure we deliver for our customers, we train and develop our people to make sure we maintain a highly skilled workforce ready to deliver quality assured products and services. To retain our staff, and to address the key demands of the industry, our employees are fairly remunerated, which, in addition to a base salary, can comprise a range of healthcare and pension benefits and can include an annual bonus which reflects performance levels.
The Group’s flat management structure has short chains of command, which allows for rapid, considered, decision making that empowers and enables our employees to be part of the process to take the Group forward. Our employees are encouraged to engage in dialogue with management to raise issues of concern. As part of the Group’s new procedures, new engagement processes within all business units have begun to enhance transparent two-way dialogue to be maintained between the Board and the Group’s employees.
These enhanced engagement procedures are supported by an independent reporting service operated by SafeCall, where confidential matters can be raised with the Board.
08Hunting PLC Annual Report and Accounts 2020

Regular symptoms checking has become a regular feature at all of the Group’s facilities during the year.
09Hunting PLC Annual Report and Accounts 2020
Pu
rpo
se and
Cu
lture
Business M
odel and Stakeholders
Business S
trategy P
erformance
Governance
Financial Statem
ents

Business Model
1Our Resources
2Our Operating Segments
Financial
Shareholders For more information see pages 12 to 14.
Lenders For more information see page 16.
Operational
FacilitiesFor more information see page 17.
Quality AssuranceFor more information see page 17.
Intellectual PropertyFor more information see page 17.
EmployeesFor more information see pages 26 to 28.
Health, Safety and Environment (“HSE”)
Hunting Titan
United States (“US”)
Canada
Europe, Middle East and Africa (“EMEA”)
Asia Pacific
Quality and Operational Excellence
For more information see pages 18 to 20.
Focusing on the oil and gas extraction cycle
New variants of the E-SUB™, H-1® and H-2™ Perforating Systems have been launched in the year.
10Hunting PLC Annual Report and Accounts 2020

3Our Products and Services
4Our Stakeholders
Oil Country Tubular Goods (“OCTG”)
Perforating Systems
Advanced Manufacturing
Subsea
Intervention Tools
Drilling Tools
For more information see pages 22 and 23.
Customers For more information see pages 24 and 25.
Operators c.24%of revenue
Service Companies
c.57%of revenue
Steel Mills and Other Oil and Gas
c.13%of revenue
Non-Oil and Gas
c.6%of revenue
Employees For more information see pages 26 to 28.
1,923At year-end
2020 has seen a 35% reduction in our workforce due to the market downturn. We have enhanced our training programmes as responsibilities were re-assigned to ensure there was no increase in our incident rate.
SuppliersFor more information see page 29.
c.480Received the Code of Conduct
Our suppliers are encouraged to adopt the principles contained in the Group’s Code of Conduct.
EnvironmentFor more information see pages 30 to 32.
50.8kg CO2/$k revenueIntensity Factor
Our environmental-related disclosures have been enhanced to include governance, risk management and monitoring of climate-related issues.
GovernmentsFor more information see page 33.
$3.6mSupport funds received
In the year we received global furlough and employee support monies which were passed directly to our workforce.
CommunitiesFor more information see page 33.
$73kCharitabledonations
The COVID-19 pandemic has led to community contributions of face masks, food and financial support to local charities.
11Hunting PLC Annual Report and Accounts 2020
Purpose and C
ultureB
usin
ess Mo
del an
d S
takeho
lders
Business S
trategy P
erformance
Governance
Financial Statem
ents

Business Modelcontinued
Our Resources
1FinancialOur ShareholdersHunting’s shareholders are important stakeholders, providing a key source of capital to allow growth for the longer term. The Group has one class of Ordinary shares.
At 31 December 2020, the total number of Ordinary shares in issue was 164.9m (2019 – 166.9m), and the number of shareholders on the register was 1,403 (2019 – 1,454).
In March 2020, the Group completed a buy-back programme totalling 2.0m Ordinary shares, at a cost of $5.1m. These shares were subsequently cancelled.
During the year, the Group purchased 2.7m Ordinary shares, which were transferred to Hunting’s Employee Benefit Trust, for a total cost of $9.4m.
Returns achieved by shareholders, by holding the Company’s Ordinary shares, are measured through Total Shareholder Return (“TSR”).
In 2020, Hunting PLC’s Ordinary shares achieved a TSR of -45% on an annualised basis, given the global economic downturn. TSR forms an important part of the longer-term remuneration paid to the executives of the Group, with demanding vesting targets measured against our industry peers.
Total Shareholder Return (Absolute %)
2020
2019
2018
(45.2)
(11.7)
(20.4)
12Hunting PLC Annual Report and Accounts 2020

Dividend PolicyEach dividend proposal considered by the Board is determined on its own merits taking into account the considerations outlined below. This flexible approach is influenced by the cyclical nature of the oil and gas sector which, as recent history demonstrates, can produce significant swings in activity levels and cash generation. Dividends, therefore, reflect business performance over time and will not necessarily be progressive. In assessing the level of dividend that is appropriate, the Board considers not only the results and position of the business for the financial year in question, but reviews mid-term projections and downside sensitivities for a three-year period as used in the Viability Assessment.
A company’s dividend capacity is typically constrained either by distributable reserves or by liquidity. Hunting PLC has in excess of $200m of distributable reserves and Hunting Energy Holdings Limited, a direct UK subsidiary of Hunting PLC, which directly or indirectly controls the operating businesses of the Group, has distributable reserves in excess of $600m. The Board considers that these distributable reserves are capable of servicing dividends for the foreseeable future and that any dividend constraints will be driven by liquidity.
COVID-19During the year, the downturn within the global energy industry caused by the COVID-19 pandemic and other market factors led to a decline in the Group’s trading results.
The Board considered carefully its dividend policy in light of these factors and decided to continue dividend distributions, given the Group’s net cash position, but also to reflect management’s confidence in the strength of our business model and the general outlook for energy in the medium term.
2020 saw a shift in our investor strategy from face-to-face meetings to virtual meetings and teleconferences. Every effort to enhance our engagement with institutional shareholders and analysts has been made, as the Group’s trading results deteriorated from Q2 2020 and as market conditions became increasingly volatile.
Shareholder distributions in the form of dividends are usually paid twice per year. In 2020, two interim dividends were paid – in May and October, totalling 5.0 cents per share. The 3.0 cents per share dividend paid in May replaced the 2019 Final Dividend of 6.0 cents, while a 2.0 cents dividend was paid following the Group’s 2020 half year results. A 2020 Final Dividend of 4.0 cents per share is proposed for approval at the Company’s 2021 AGM.
Dividends Declared (Cents)
2020
2019
2018
9.0
5.0
9.0
Shareholder EngagementRegular shareholder engagement meetings are organised through an annual calendar of work co-ordinated by the Group’s Head of Investor Relations and is summarised below. These meetings allow the Board to understand the views of our key investors. In the year, 159 meetings were held with institutional investors (2019 – 226) and five investment conferences were attended (2019 – five).
Event Roadshows Conferences OtherJanuary Chairman and SID shareholder meetingsFebruary Annual Results EdinburghMarch Paris
LondonApril AGM
Q1 Trading StatementMayJune Pre-Close Trading Statement Credit-Suisse
JP MorganJulyAugust Half Year Results LondonSeptember Paris BernsteinOctober Q3 Trading Statement New York
ChicagoRemuneration Consultation
November JP Morgan Goldman Sachs
Remuneration Consultation
December Pre-Close Trading Statement
The Board has maintained its usual governance practice of engaging shareholders in respect to changes in remuneration policy. In Q4 2020, a process was initiated, which is further detailed in the Remuneration Committee Report on pages 93 to 118.
13Hunting PLC Annual Report and Accounts 2020
Purpose and C
ultureB
usin
ess Mo
del an
d S
takeho
lders
Business S
trategy P
erformance
Governance
Financial Statem
ents

Major ShareholdersThe Company’s major shareholders, as at 31 December 2020, are listed below:
NotesNumber of
Ordinary shares % of ISC
GLG Partners 14,696,609 8.9%M&G Investment Management 11,108,878 6.7%Hunting Investments Limited (1/4/5) 11,003,487 6.7%Schroder Investment Management 9,673,114 5.9%BlackRock 9,544,993 5.8%Slaley Investments Limited (5) 6,411,679 3.9%Janus Henderson Investors 6,353,998 3.9%Franklin Templeton 5,872,005 3.6%Dimensional Fund Advisers 5,845,967 3.5%J Trafford – as trustee (2/5) 5,228,660 3.2%David RL Hunting (1/2/3/4/5) 194,120 0.1%– as trustee 2,549,117 1.5%– other beneficial 2,484,583 1.5%Issued share capital – at 31 December 2020 164,940,082
Notes:1. Included in this holding are 9,437,743 Ordinary shares held by Huntridge Limited, a wholly owned subsidiary of Hunting Investments Limited. Neither of these companies is owned
by Hunting PLC either directly or indirectly.2. After elimination of duplicate holdings, the total Hunting family trustee interests shown above amount to 5,228,660 Ordinary shares.3. Arise because David RL Hunting and his children are or could become beneficiaries under the relevant family trusts of which David RL Hunting is a trustee.4. Richard H Hunting (non-executive Director of Hunting PLC) and David RL Hunting are both directors of Hunting Investments Limited.5. In 2014, Hunting Investments Limited, Slaley Investments Limited, certain Hunting family members, including Richard H Hunting and David RL Hunting and the Hunting family trusts,
to which James Trafford is a trustee (together known as “the Hunting Family Interests”), entered into a voting agreement. The voting agreement has the legal effect of transferring all voting rights of Hunting PLC Ordinary shares held by the Hunting Family Interests to a voting committee. The beneficial ownership of Hunting PLC Ordinary shares remains as per the table shown above. At 4 March 2021, the Hunting Family Interests, party to the agreement, totalled 24,806,621 Ordinary shares in the Company, representing 15.04% of the total voting rights.
Business Modelcontinued
Board Engagement and Decision Making – Shareholders The Directors of Hunting receive a report detailing the Company’s major shareholders at each Board Meeting, with a briefing by the Chief Executive and Finance Director on meetings that have recently occurred with key matters being regularly discussed following this engagement. The Chief Executive and Finance Director meet with major shareholders after the Half Year and Full Year Results and during 2020 followed a plan of investor meetings with shareholders in the UK, Europe and North America. From March 2020 these meetings were held virtually.
The Chairman and Senior Independent Director also met with institutional investors in January 2020 and January 2021 to discuss governance, strategy and remuneration. During H2 2020, the Group commenced a consultation process with institutional investors on a new Directors’ Remuneration Policy, as noted in the Remuneration Committee Report. Following positive feedback, the Directors will table the new Policy for approval by shareholders at the Company’s Annual General Meeting in April 2021.
In line with recommendations from investor groups and UK regulators, the Company has increased its disclosures in the area of Climate Change and reports its information aligned with the Task Force on Climate-related Financial Disclosures. The Group has adopted a risk management framework to monitor climate risk and has maintained its carbon reduction targets, as set in 2019.
The Board also sets the Company’s dividend policy, following a review of the financial performance for the relevant reporting period, and considers proposals by the executive Directors on the level of distribution.
The Group’s Audit Committee reviews these dividend proposals as part of its regular programme of work and makes a recommendation on whether to approve the dividend proposal and recommend it to the Board.
Dividends are declared on the announcement of each set of Group results and are usually paid in May, following shareholder approval at the Company’s Annual General Meeting, and in October.
Given the proportion of UK shareholders on the share register, the Group’s current practice is to pay all dividends in Sterling.
In the year, the Group has reported a strong cash position and, despite its financial results, has continued to declare and pay dividends in recognition of the underlying strength of the Company.
The Directors are proposing a 2020 Final Dividend of 4.0 cents per share, which will be subject to approval by shareholders at the AGM.
14Hunting PLC Annual Report and Accounts 2020

A Dual Pot Sand Filter manufactured by the Well Testing business in the Netherlands.
15Hunting PLC Annual Report and Accounts 2020
Purpose and C
ultureB
usin
ess Mo
del an
d S
takeho
lders
Business S
trategy P
erformance
Governance
Financial Statem
ents

Our LendersThe Group has a multi-currency revolving credit facility, totalling $160.0m, provided by four banks comprising HSBC, Barclays, DBS and Wells Fargo. In the year, the facility was unutilised given the net cash held throughout the year.
Board Engagement and Decision Making – LendersThe Directors are briefed at each Board meeting by the Finance Director on the Group’s financial position and the relationship with members of the bank lending group.
Regular meetings between the Chief Executive, Finance Director and Group Treasurer and members of the lending group were held during the year to brief the banks on the performance and position of the Group.
In 2021, the Group plans to commence discussions with the lending group to agree a new facility, with a view to concluding this process before the current facility expires in 2022.
Business Modelcontinued
COVID-19As noted throughout this report, the COVID-19 pandemic and other market factors led to a significant decline in the Group’s trading performance from March 2020.
The Group has, however, reported positive EBITDA in the year and reports a strong cash and bank position at the year-end.
Regular dialogue was held with the lending group throughout the year, to confirm access to the facility, as well as to confirm the terms of the Material Adverse Change clauses contained within the facility agreement.
Given the positive cash position throughout the reporting period, these discussions remained at high level.
Sophisticated CNC machinery is utilised across all of our operating sites.
16Hunting PLC Annual Report and Accounts 2020

OperationalFacilitiesThe Group has an established global network of operating sites and distribution centres located close to our customers and within the main global oil and gas producing regions. Over the years, we have continued to refine our operating and manufacturing processes, established a highly specialised workforce and built a considerable knowledge base to enable our business to evolve and meet changing customer needs.
Our operating sites are used for the manufacture, rental, trading and distribution of products. The manufacture of goods and the provision of related manufacturing services is, by far, the main source of income for the Group.
A significant portion of our manufacturing occurs in high-end, specialist facilities utilising sophisticated machines. In Hunting’s rental businesses it is critical that an appropriate range of equipment is stored and maintained. Generally, this must be configured to meet specific customer requirements.
In certain product lines, particularly OCTG, Hunting holds inventory to support its customers’ specific requirements and to take advantage of particular market opportunities.
Our distribution centres are primarily used in the Hunting Titan and intervention tools business groups, where close proximity to drilling operations is important.
Operational sites 31
Distribution centres 16
Operating footprint (million square feet) 2.8
Machines 1,190
Net book value of PPE $307.1m
% of ISO 9001:2015 (Quality) accredited facilities 71%
2020 has seen the Group close or mothball five manufacturing sites and three distribution centres to save costs. The Group has retained its global manufacturing presence in areas where sustained activity is anticipated.
Quality AssuranceThe Group’s Quality Assurance programme, for all its products, is a key feature of our business strategy, as it supports our standing within our customer base.
Detailed policies are implemented within all facilities and in the year, the Group reported a manufacturing reject rate of 0.24% (2019 – 0.30%).
Quality Assurance (manufacturing reject rate) (%)
2020
2019
2018
0.24
0.30
0.22
Intellectual PropertyThere continues to be a strong focus in the industry on technological improvement and process innovation, which can help deliver cost efficiencies for customers while maintaining or improving margins for suppliers. The incorporation of technology in our business illustrates the different ways we partner with participants in the supply chain.
Hunting Proprietary TechnologyDeveloping our own proprietary technologies has been a strategic objective for the Group. Through the development of our technologies and proprietary know-how, we are well positioned to secure market share by protecting our intellectual property (“IP”). Our substantial IP portfolio provides us with a competitive advantage and allows us to enjoy better margins and more operational flexibility. In 2020, we filed 115 new patent applications, leading to a total of 799 patents being either granted or pending at year-end.
Third-Party TechnologyIn some cases, we make use of third-party proprietary technologies in our operations. For certain product lines, we are engaged as a specialist manufacturer using our customers’ IP. In other areas, we license technologies from third parties, such as non-Hunting thread forms, for OCTG.
No. of patents granted 544
No. of patents pending 255
No. of new patent applications filed in the year 115
17Hunting PLC Annual Report and Accounts 2020
Purpose and C
ultureB
usin
ess Mo
del an
d S
takeho
lders
Business S
trategy P
erformance
Governance
Financial Statem
ents

Management Principles Our approach to managing the Group’s operations is based on four core principles:
Develop Our PeoplePeople are at the heart of our business. Our broad product portfolio demands experienced machining and production engineers across our many manufacturing disciplines and facilities. Our administration, finance and sales staff are also encouraged to develop their skill sets through training and professional development programmes.
Empower Our Business Units The oil and gas industry is a fast-paced sector where product requirements and customer demands can operate on short lead-times. Our business leaders are empowered to react quickly to local market conditions and opportunities when they arise.
Apply Unified Operating Standards and Procedures Demanding Health, Safety and Quality policies are developed centrally and then applied locally. We continually monitor and raise our operating standards.
Maintain a Strong Governance FrameworkThe Group’s senior managers and their teams operate within a tight framework with short chains of command to the Chief Executive.
Business Modelcontinued
Our Operating Segments
2
18Hunting PLC Annual Report and Accounts 2020

IntroductionHunting reports its performance based on its key geographic operating regions. Hunting Titan is a large, separate business group, which is reported as a stand-alone segment. A description of each segment is noted below.
Hunting TitanHunting Titan manufactures and distributes perforating products and accessories. The segment’s products include smart perforating gun systems and shaped charge technologies. The business has three manufacturing facilities in the US and a facility in Mexico, supported by 14 distribution centres, primarily located in Canada and the US.
USThe US businesses supply OCTG, premium connections, subsea equipment, intervention tools, electronics and complex deep hole drilling and precision machining services for the US and overseas markets. The US segment has 15 operating facilities, mainly located in Texas and Louisiana.
CanadaHunting’s Canadian business manufactured premium connections and accessories for oil and gas operators in-country and also manufactured perforating guns for Hunting Titan. In August 2020, the Group announced that the OCTG manufacturing facility in Calgary was to close with future orders to be completed by in-country licensees. From 1 January 2021, OCTG and accessories manufacturing trading results have been combined with the US operating segment.
Europe, Middle East and Africa (“EMEA”)The segment derives its revenue primarily from the supply of OCTG and intervention tools to operators in the North Sea. The Group has operations in the UK, the Netherlands, Norway, Saudi Arabia and the UAE. Revenue from the Middle East and Africa is generated from the sale and rental of intervention tools across the region, with local operations also acting as sales hubs for other products manufactured globally by the Group, including OCTG and perforating systems.
Asia PacificRevenue from the Asia Pacific segment is primarily from the manufacture of premium connections and accessories and OCTG supply. Manufacturing facilities are located in China, Indonesia and Singapore. The facility in China also manufactures perforating guns for Hunting Titan.
Facility ISO AccreditationsThe Group is committed to enhancing its production and operational quality, with a number of facilities being certified ISO 9001:2015 (quality), ISO 14001 (environment) and ISO 45001 (occupational health and safety management) compliant, indicating that globally recognised standards and systems are in place. More facilities across the Group are working towards these ISO accreditations, continuing the Group’s commitment to monitoring and reducing the environmental impact of its operations and improving Health, Safety and Environmental (“HSE”) standards. Hunting’s seamless Quality Management System (“QMS”) is certified and accredited for all of these ISO standards and all facilities are operated in accordance therewith. Operational and production excellence is a key driver of our engagement and relationship with customers. Quality assurance for each component manufactured is a key differentiator in our drive to be an industry-leading provider of critical components and measurement tools.
Health and Safety training is a regular feature of our workforce procedures (this photograph was taken prior to COVID-19).
19Hunting PLC Annual Report and Accounts 2020
Purpose and C
ultureB
usin
ess Mo
del an
d S
takeho
lders
Business S
trategy P
erformance
Governance
Financial Statem
ents

Operating sites 42020
52019
Distribution centres 142020
172019
Year-end employees 3802020
7022019
Operating sites 02020
12019
Distribution centres 12020
12019
Year-end employees 312020
1202019
Operating sites 42020
42019
Distribution centres 02020
02019
Year-end employees 3642020
4532019
Total year-end employees include 70 (2019 – 72) head office and corporate personnel.
Operating sites 152020
162019
Distribution centres 12020
12019
Year-end employees 8492020
1,3102019
Operating sites 82020
102019
Distribution centres 02020
02019
Year-end employees 2292020
2992019
Operating sites 312020
362019
Distribution centres 162020
192019
Year-end employees 1,9232020
2,9562019
Business Modelcontinued
Hunting Titan
Canada
Asia Pacific
US
EMEA
Total
20Hunting PLC Annual Report and Accounts 2020
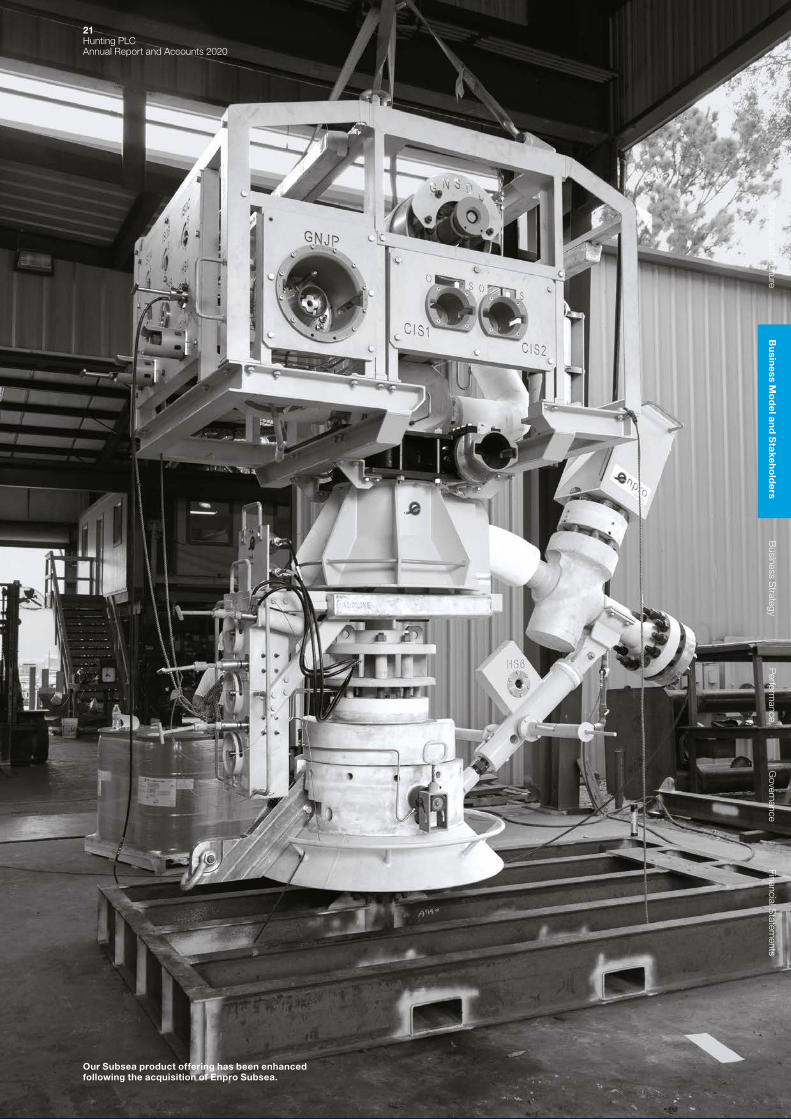
Our Subsea product offering has been enhanced following the acquisition of Enpro Subsea.
21Hunting PLC Annual Report and Accounts 2020
Purpose and C
ultureB
usin
ess Mo
del an
d S
takeho
lders
Business S
trategy P
erformance
Governance
Financial Statem
ents

Oil Country Tubular Goods (“OCTG”)
Perforating Systems
Advanced Manufacturing
Subsea Intervention Tools Drilling Tools
Operating Basis:ManufacturingTrading
Operating Basis:Manufacturing
Operating Basis:Manufacturing
Operating Basis:Manufacturing
Operating Basis:ManufacturingEquipment RentalTrading
Operating Basis:Equipment RentalTrading
OverviewOCTG are steel alloy products and comprise casing and tubing used in the construction and completion of the wellbore. Hunting machines threads to connect OCTG using flush or semi-flush joints and can manufacture premium and semi-premium connections and accessories using our own technologies such as SEAL-LOCK™, WEDGE-LOCK™ and TEC-LOCK™. We are licensed to apply a variety of third-party thread forms and generic API threads. We source OCTG products from a significant number of major global steel producers and have strong, long-term relationships in the US, Canada, Europe and Asia Pacific. Hunting also trades pipe, which is a lower margin activity, to help support customer relationships.
OverviewHunting Titan manufactures perforating systems, energetics, firing systems and logging tools. Products are mainly used in the completion phase of a well. The production, storage and distribution of energetics is highly regulated and there are significant barriers for new entrants to the market. The business mainly “manufactures to stock” and hence uses a wide distribution network. Some manufacturing is done to order, sourced from international telesales.
OverviewAdvanced Manufacturing includes the Hunting Dearborn business, which carries out deep hole drilling and precision machining of complex measurement-while-drilling/logging-while-drilling (“MWD/LWD”) and formation evaluation tool components. The Hunting Electronics business manufactures printed circuit boards capable of operating in extreme conditions. These businesses work collaboratively with customers implementing their designs to their specifications. Hunting Specialty manufactures products used for onshore drilling and completion activities.
OverviewProduces high quality products and solutions for the global subsea industry covering hydraulic couplings, chemical injection systems, valves and weldment services.
Following the acquisition of RTI Energy Systems, titanium and stainless steel stress joints and production risers have been added to the Group’s subsea portfolio.
The addition of Enpro Subsea’s product offering also brings modular production technology and know-how to our offshore capabilities.
OverviewA range of downhole intervention tools including slickline tools, e-line tools, mechanical plant, coiled tubing and pressure control equipment.
This business is capital intensive and results are dependent on asset utilisation and rental rates.
OverviewRental of a large portfolio of downhole tools, including mud motors, non-magnetic drill collars, vibration dampeners, reamers and hole openers. Tools are configured to customers’ specifications.
This business is capital intensive and results are dependent on fleet utilisation and rental rates. In limited instances, rental equipment is sold outright.
DifferentiatorsHunting is one of the largest independent providers of OCTG connection technology, including premium connections.
DifferentiatorsHunting has a market-leading position in the US, supported by a strong portfolio of patented and unpatented technology.
DifferentiatorsHunting Dearborn is a world leader in the deep drilling of high grade, non-magnetic components. As a Group, Hunting has the ability to produce fully integrated advanced downhole tools and equipment, manufactured, assembled and tested to the customer’s specifications using its proprietary know-how.
DifferentiatorsHunting’s expertise ranges from the manufacture of high pressure seals to complex welding of stress joints.
DifferentiatorsHunting offers a comprehensiverange of tools, includinginnovative and proprietarytechnologies.
DifferentiatorsLeaders in progressive cavity,positive displacement mudmotors.
Global Operating PresenceHunting has extensive machiningcapacity in the US, Europe and Asia Pacific.
Global Operating PresenceManufacturing centres in the US, Mexico and China. Distribution centres in the US, Canada and Asia Pacific.
Global Operating PresenceUS.
Global Operating PresenceUS, UK.
Global Operating PresenceUS, EMEA and Asia Pacific.
Global Operating PresenceUS.
Related Strategic Focus AreasIn the year, the Group restructured its global OCTG manufacturing footprint and closed its facility in Calgary, Canada.
Related Strategic Focus AreasHunting Titan commissioned and launched its detonating cord manufacturing line in the year and also launched new variants of its smart perforating systems and charges.
Related Strategic Focus AreasOur expertise has been deployed into Non-Oil and Gas markets in recent years, including medical, aerospace and space applications.
Related Strategic Focus AreasAcquired new products, including flexible production modules following the acquisition of Enpro Subsea Limited which completed in February 2020.
Related Strategic Focus AreasCommenced field trials of enhanced oil recovery technology within the EMEA operating segment.
Related Strategic Focus AreasIn December 2020 the Group sold its assets to Rival Downhole Tools LC, in exchange for a 23.5% equity stake in the enlarged Rival business.
Related Principal Risks • Commodity prices • Shale drilling • Competition • Product quality
Related Principal Risks • Commodity prices • Shale drilling • Competition • Product quality
Related Principal Risks • Commodity prices • Product quality
Related Principal Risks • Commodity prices • Product quality
Related Principal Risks • Commodity prices • Competition
Related Principal Risks • Commodity prices • Shale drilling • Competition
For more information see pages 56 to 59. For more information see pages 56 to 59. For more information see pages 56 to 59. For more information see pages 56 to 59. For more information see pages 56 to 59. For more information see pages 56 to 59.
Business Modelcontinued
Our Products and Services
3
22Hunting PLC Annual Report and Accounts 2020

Oil Country Tubular Goods (“OCTG”)
Perforating Systems
Advanced Manufacturing
Subsea Intervention Tools Drilling Tools
Operating Basis:ManufacturingTrading
Operating Basis:Manufacturing
Operating Basis:Manufacturing
Operating Basis:Manufacturing
Operating Basis:ManufacturingEquipment RentalTrading
Operating Basis:Equipment RentalTrading
OverviewOCTG are steel alloy products and comprise casing and tubing used in the construction and completion of the wellbore. Hunting machines threads to connect OCTG using flush or semi-flush joints and can manufacture premium and semi-premium connections and accessories using our own technologies such as SEAL-LOCK™, WEDGE-LOCK™ and TEC-LOCK™. We are licensed to apply a variety of third-party thread forms and generic API threads. We source OCTG products from a significant number of major global steel producers and have strong, long-term relationships in the US, Canada, Europe and Asia Pacific. Hunting also trades pipe, which is a lower margin activity, to help support customer relationships.
OverviewHunting Titan manufactures perforating systems, energetics, firing systems and logging tools. Products are mainly used in the completion phase of a well. The production, storage and distribution of energetics is highly regulated and there are significant barriers for new entrants to the market. The business mainly “manufactures to stock” and hence uses a wide distribution network. Some manufacturing is done to order, sourced from international telesales.
OverviewAdvanced Manufacturing includes the Hunting Dearborn business, which carries out deep hole drilling and precision machining of complex measurement-while-drilling/logging-while-drilling (“MWD/LWD”) and formation evaluation tool components. The Hunting Electronics business manufactures printed circuit boards capable of operating in extreme conditions. These businesses work collaboratively with customers implementing their designs to their specifications. Hunting Specialty manufactures products used for onshore drilling and completion activities.
OverviewProduces high quality products and solutions for the global subsea industry covering hydraulic couplings, chemical injection systems, valves and weldment services.
Following the acquisition of RTI Energy Systems, titanium and stainless steel stress joints and production risers have been added to the Group’s subsea portfolio.
The addition of Enpro Subsea’s product offering also brings modular production technology and know-how to our offshore capabilities.
OverviewA range of downhole intervention tools including slickline tools, e-line tools, mechanical plant, coiled tubing and pressure control equipment.
This business is capital intensive and results are dependent on asset utilisation and rental rates.
OverviewRental of a large portfolio of downhole tools, including mud motors, non-magnetic drill collars, vibration dampeners, reamers and hole openers. Tools are configured to customers’ specifications.
This business is capital intensive and results are dependent on fleet utilisation and rental rates. In limited instances, rental equipment is sold outright.
DifferentiatorsHunting is one of the largest independent providers of OCTG connection technology, including premium connections.
DifferentiatorsHunting has a market-leading position in the US, supported by a strong portfolio of patented and unpatented technology.
DifferentiatorsHunting Dearborn is a world leader in the deep drilling of high grade, non-magnetic components. As a Group, Hunting has the ability to produce fully integrated advanced downhole tools and equipment, manufactured, assembled and tested to the customer’s specifications using its proprietary know-how.
DifferentiatorsHunting’s expertise ranges from the manufacture of high pressure seals to complex welding of stress joints.
DifferentiatorsHunting offers a comprehensiverange of tools, includinginnovative and proprietarytechnologies.
DifferentiatorsLeaders in progressive cavity,positive displacement mudmotors.
Global Operating PresenceHunting has extensive machiningcapacity in the US, Europe and Asia Pacific.
Global Operating PresenceManufacturing centres in the US, Mexico and China. Distribution centres in the US, Canada and Asia Pacific.
Global Operating PresenceUS.
Global Operating PresenceUS, UK.
Global Operating PresenceUS, EMEA and Asia Pacific.
Global Operating PresenceUS.
Related Strategic Focus AreasIn the year, the Group restructured its global OCTG manufacturing footprint and closed its facility in Calgary, Canada.
Related Strategic Focus AreasHunting Titan commissioned and launched its detonating cord manufacturing line in the year and also launched new variants of its smart perforating systems and charges.
Related Strategic Focus AreasOur expertise has been deployed into Non-Oil and Gas markets in recent years, including medical, aerospace and space applications.
Related Strategic Focus AreasAcquired new products, including flexible production modules following the acquisition of Enpro Subsea Limited which completed in February 2020.
Related Strategic Focus AreasCommenced field trials of enhanced oil recovery technology within the EMEA operating segment.
Related Strategic Focus AreasIn December 2020 the Group sold its assets to Rival Downhole Tools LC, in exchange for a 23.5% equity stake in the enlarged Rival business.
Related Principal Risks • Commodity prices • Shale drilling • Competition • Product quality
Related Principal Risks • Commodity prices • Shale drilling • Competition • Product quality
Related Principal Risks • Commodity prices • Product quality
Related Principal Risks • Commodity prices • Product quality
Related Principal Risks • Commodity prices • Competition
Related Principal Risks • Commodity prices • Shale drilling • Competition
For more information see pages 56 to 59. For more information see pages 56 to 59. For more information see pages 56 to 59. For more information see pages 56 to 59. For more information see pages 56 to 59. For more information see pages 56 to 59.
23Hunting PLC Annual Report and Accounts 2020
Purpose and C
ultureB
usiness Strategy
Perform
anceG
overnanceFinancial S
tatements
Bu
siness M
od
el and
Stakeh
old
ers

COVID-19The COVID-19 pandemic and hydrocarbon demand changes in the year have created havoc across all levels of the oil and gas supply chain. The major theme of the Group’s customer discussions in the year has been navigating the lower oil price, which manifested itself in reductions in industry capital expenditures to levels not seen in many decades, and which included order deferment and cancellations. Despite these trading conditions, Hunting has continued to engage its customer base proactively to continue to assist our clients in meeting their strategic objectives and continues to assist customers with technology developments to lower production costs or increasing in-field safety.
Business Modelcontinued
Our Stakeholders
4Our CustomersAs a member of the oil and gas equipment supply chain, Hunting’s broad portfolio of products and services enables the Group to cover a large proportion of the needs of the global energy industry, including onshore and offshore drilling projects and conventional and unconventional resource development, supported by selected high value services to help our customers achieve their strategic objectives.
A common theme across all our businesses is our ability to add value for our customers, which is achieved by providing high technology products that lower the cost of operation, resolve technical problems, or simply enable a job to be completed more quickly or safely, without comprising quality.
24Hunting PLC Annual Report and Accounts 2020

Our Customer Channels to Market
OperatorsOperators are the end consumers of our products and related services. These include national oil companies, international oil companies and independents. Approximately 24% of our sales are made directly to operators.
Split of Group revenue
c.24%
Service CompaniesOur primary route to market is via other service providers, which generate c.57% of our revenue. These include “1st tier” service companies who can provide project management services to operators. Key customers include Halliburton, Baker Hughes, Schlumberger and Weatherford.
Split of Group revenue
c.57%
Steel Mills and Other Oil and GasSteel mills are key suppliers to our business; however, in some circumstances we can perform threading services for them or supply OCTG products.
Split of Group revenue
c.13%
Non-Oil and GasNon-oil and gas sales are led by our Trenchless, Dearborn and Electronics operations, which have developed new customers within the aviation, medical, space and telecommunications sectors.
Split of Group revenue
c.6%
Customer EngagementClient engagement is key to the Group’s understanding of the short- to medium-term needs of our various clients. This daily dialogue helps us shape our strategy and focus our product research and development programmes. In the year, the Group launched and acquired new products that directly addressed customer needs, some of which resulted from close customer collaboration in response to in-field technical challenges.
As part of our active dialogue and engagement with our customer base, key clients are usually invited to our facilities to review our production capabilities and processes, review new technology and brainstorm on future projects. Customer contact reports are a regular feature of our sales function, which often include issues or concerns, in-field performance feedback and overall customer satisfaction.
Hunting’s customer-facing sales teams are directly supported by the Group’s Engineering, Quality Assurance and Health, Safety and Environment teams, which all assist in the provision of key operational performance information that supports global tenders and the overall sales function. Further, to embed the Group into our customer base, Hunting is a member of a number of industry and trade association bodies including:
• American Petroleum Institute; • Society of Petroleum Engineers; and • International Association of Drilling Contractors.
The Group also attends various industry conferences annually to profile the Group’s products and services.
Ethics and GovernanceHunting’s close relationship with its customers is also enhanced by our ethical policies and transparent ways of doing business. All of our major customers receive our Code of Conduct, which includes a commitment to a transparent way of doing business. Regular due diligence on new customers is also undertaken to ensure the Group complies with international trading and sanctions legislation. In many cases, we ask our clients to complete “end user” declarations to confirm that Hunting’s products do not conflict or breach trading restrictions or sanctions legislation. The Group also has strong entertainment and hospitality policies, which support our commitment to anti-bribery and corruption.
Board Engagement and Decision Making – CustomersIn parallel with the commercial dialogue and engagement undertaken by our leadership teams with our customers, the Board of Hunting, in support of its statutory stakeholder duty, has approved the development of the Group’s strategy by reviewing and approving capital investment projects that directly support future customer needs. Board approvals are also required for contracts over a certain monetary value. In the year, the Group invested $14.7m in production capacity and equipment and $32.8m was spent on the acquisition of Enpro Subsea, which completed in February 2020.
The Board approved these capital investments, either as part of the approval of the Strategic Plan or Annual Budget process. In each case, the Board was satisfied that there was good alignment between the final capital allocation and the Board’s consideration of customer matters.
Capital Investment
1. US 58%2. Hunting Titan 26%3. Asia Pacific 7%4. EMEA 7%5. Canada 1%6. Central 1%
1
2
3
465
25Hunting PLC Annual Report and Accounts 2020
Purpose and C
ultureB
usin
ess Mo
del an
d S
takeho
lders
Business S
trategy P
erformance
Governance
Financial Statem
ents

Our EmployeesHunting’s reputation, which has been built over many years, is underpinned by its highly skilled workforce, who are key to fulfilling the Group’s strategic objectives. At 31 December 2020, the Group had 1,923 employees (2019 – 2,956) across its global operations.
COVID-19While the Group has made every effort to retain as many employees as possible, which included participating in global furlough or employee support programmes, the Group has had to undertake a reduction in headcount in the year to reduce its cost base commensurate with the decline in revenue. As a consequence, our headcount was reduced by 35% during 2020. In the year, our HR functions have been dedicated to supporting our employees through this process. The COVID-19 pandemic has, without question, presented a significant Health and Safety challenge to the Group, as management put in place procedures to keep our employees safe and well, while endeavouring to keep our facilities open. All global operations implemented working-from-home arrangements where this was appropriate. Within our manufacturing facilities, social distancing protocols were introduced and employee monitoring, on entering and exiting our facilities, was implemented, in addition to a broad range of protective equipment being issued.
Employees
1. US 44%2. Hunting Titan 20%3. Asia Pacific 19%4. EMEA 12%5. Central 4%6. Canada 1%
1
2
3
4
65
While the Board monitors procedures to comply with our published Code of Conduct, responsibility for our employees lies for the most part with local management, to enable local cultural matters to be addressed, with all businesses complying with the Group’s ethical employment and human rights policies as published in the Hunting PLC Code of Conduct (located at www.huntingplc.com).
Employees are offered benefits on joining the Group, including healthcare cover, post-retirement benefits and, in certain instances, when Group outperformance in terms of operational or financial targets has been delivered, participation in annual bonus arrangements.
The Group is committed to training and developing all employees which includes Health and Safety training, professional development and general career development initiatives.
The Group has a strong reputation for being a responsible employer, which is reflected in the average tenure and voluntary workforce turnover rate noted below. This demonstrates Hunting’s commitment to its employees and its drive to nurture a mutually beneficial relationship between the Company and its employees.
Average employee tenure 10.1 years
Group employee voluntary turnover rate 9%
Hunting targets full compliance with all relevant regional laws covering employment and minimum wage legislation. As a responsible employer, full and fair consideration is given to applications for positions from disabled persons. The Group’s ethics policies support equal employment opportunities across all of Hunting’s operations. The Group’s gender diversity profile for 2020 is detailed below.
TrainingIn light of the reduction in workforce programmes completed across the Group in the year, additional training of employees was initiated as responsibilities were re-assigned. The work of the Group’s HSE function has led these programmes.
As an embedded programme for new employees, the Group provides ethics training through a Code of Conduct training course, to ensure awareness of our published policies. The programme incorporates anti-bribery and corruption, modern slavery, fraud and tax modules to ensure our employees understand their responsibilities on joining the Group.
Employee EngagementIn 2019, Hunting commissioned its first all-employee survey, to enhance its global workforce engagement initiatives. This initiative is likely to be repeated in the coming year.
Human RightsWe are committed to upholding the Human Rights of all our employees, which include:
• Providing a safe and comfortable working environment for all employees and contractors;
• Respecting the rights of each individual with a zero tolerance approach to any form of discrimination, harassment or bullying;
• Providing training and development programmes to our global workforce;
• Not employing child labour; and • Acting with honesty, transparency and integrity in all of our dealings with our workforce.
DiversityThe Group’s diversity policy can be found at www.huntingplc.com. Hunting’s policies promote prejudice-free decision making, ensuring all stakeholder interests are taken into consideration and commit Hunting to building a working environment in which all individuals are able to make best use of their skills, free from unfair discrimination, victimisation, harassment and/or bullying, and in which all appointments are based on merit.
Furthermore, the policy focuses on recruitment, training and development, conditions of work and disciplinary procedures.
Business Modelcontinued
26Hunting PLC Annual Report and Accounts 2020

GenderGender diversity data of Hunting’s Board, senior management and workforce is noted below.
Gender and ethnicity suggestions made in the Hampton-Alexander and Parker reviews have been noted by the Board and will be taken into consideration as the Board is refreshed over the coming years.
Board
1. Male 5 – 71%2. Female 2 – 29%
1
2
Senior Management*
1. Male 57 – 88%2. Female 8 – 12%
* Defined as members of the Executive Committee and their direct reports.
1
2
Workforce
1. Male 1,499 – 78% 2. Female 424 – 22%
1
2
EthnicityHunting is committed to an ethnically diverse workforce and extends its global operating footprint to 11 countries. The Group remains North American focused, with over 65% of employees from that region at 31 December 2020.
Group Employee Profile(%)
North America Europe Asia Rest of World
2020
2019
2018
WhistleblowingThe Board of Hunting has established procedures in place whereby employees can raise concerns in confidence, by contacting the Chairman or Senior Independent Director. The Group also uses an independent whistleblowing service operated by SafeCall. Contact information for both these lines of reporting is usually published on staff noticeboards across the Group’s facilities and within the Group’s magazine published twice yearly, the “Hunting Review”, and is available to all employees.
Health and SafetyAcross all of its global operations, the Group is committed to achieving and maintaining the highest standards of safety for its employees and other stakeholders.
Hunting has a culture of aiming for best practice and employs rigorous health and safety practices. Health and safety policies include:
• Regular audit and maintenance reviews of facilities; • Appropriate training and education of all staff; • Regular reporting to Board level; • Seeking accreditation and aligning long-standing internal programmes with internationally recognised standards; and
• Publication of the Group’s policy on health, safety and environmental matters on the Company’s website at www.huntingplc.com.
The Group’s target is to achieve zero recordable incidents. Each local business is required to develop tailored health and safety policies to suit their environment. These incorporate the Group’s approach to putting safety first and, at a minimum, complying with local regulatory requirements.
Additional personal protective equipment has formed part of our HSE approach in 2020.
27Hunting PLC Annual Report and Accounts 2020
Purpose and C
ultureB
usin
ess Mo
del an
d S
takeho
lders
Business S
trategy P
erformance
Governance
Financial Statem
ents

During the year, there were no fatalities across the Group’s operations (2019 – nil), with 16 recordable incidents (2019 – 39).
The incident rate, as calculated from guidance issued by the Occupational Safety and Health Administration (“OSHA”) in the US, was 0.67 compared to 1.17 in 2019. This incident rate reflects a 43% year-on-year decrease compared to the prior year. The industry average incident rate in 2020 was 4.0 (2019 – 4.0).
In the year, the number of hours worked decreased by 27% to 4.8m hours (2019 – 6.6m hours) as trading declined.
Incident Rate (OSHA method)
2020
2019
2018
0.67
1.17
1.49
Business Modelcontinued
Board Engagement and Decision Making – EmployeesThe Board has received reports from the Chief Executive and Executive Committee in respect of the reduction-in-force programmes completed in the year to address the downturn in the Group’s core markets. All employees have been treated fairly in respect to this process and the Directors are satisfied with the conduct and engagement of management with Hunting’s employees throughout this unfortunate process. Further, the Board noted that employee support funding was received from various governments to retain its employees, for as long as possible, from Q2 2020 and as market conditions deteriorated. All funds received were passed directly to employees.
As part of its statutory duty, and in line with the provisions of the 2018 UK Corporate Governance Code, Annell Bay is the designated non-executive Director for employee engagement issues.
In the year, the Board received employee reports from the Chief HR Officer, which included ongoing engagement efforts.
In the year, the Board noted the workforce reduction and salary freezes in place across the Group, as Hunting managed the market downturn.
The Board, through the work of the Remuneration Committee, monitored executive Directors’ remuneration, and the remuneration framework of the Executive Committee in the context of prevailing market conditions.
Further, the Board received reports from Keith Lough, the Company’s Senior Independent Director, on the whistleblowing reports received. In the year, the Group received two reports from SafeCall (2019 – nine reports). The Board noted the actions recommended in respect to each report and were satisfied that each report was resolved appropriately.
Hunting’s Director of Health, Safety and Environment (“HSE”) reports directly to the Chief Executive and the Directors review a HSE report at each Board meeting. The Directors noted the lower number of incidents in the year, which for the most part relates to lower numbers of new employees hired during 2020.
Hunting has made every effort to protect its employees, whether on the shop floor or in the office.
Manufacturing and production safety equipment is also issued to employees (this photograph was taken prior to COVID-19).
28Hunting PLC Annual Report and Accounts 2020

Our SuppliersHunting’s supplier base assists the Group in achieving its purpose of providing high quality products which our customers can rely on and trust.
The Group has a strategy of ensuring that critical materials are not sourced from a single supplier which provides assurance to our customers that we will always be in a position to deliver. Long lead-time material supplies are regularly reviewed to ensure market pricing remains competitive.
Hunting’s strategic sourcing includes working with a wide range of suppliers with a regular two-way dialogue on quality expectations. Often, supply chain managers visit the facilities of our suppliers to review procedures, including Quality Assurance, Health and Safety performance and employment practices.
In the case of new suppliers, including those who provide key components, first article inspection procedures are in place prior to issuing the order, to ensure quality and delivery expectationsare met.
Ethics and GovernanceLike the Group’s customer base, Hunting completes due diligence on its supplier base and communicates its ethics policies to its major suppliers. The Group’s Code of Conduct is issued to its suppliers and specifically our Modern Slavery policy, which highlights the Group’s ethical trading and fair labour policies.
Board Engagement and Decision Making – SuppliersThe Board, through the work of the Audit Committee, reviews the Group’s supply chain risk profile and reviews engagement reports on the Group’s dialogue with customers and suppliers. This leads to discussion and challenge by the Directors.
Every effort has been made to keep our facilities open to deliver critical equipment to our customers (this photograph was taken prior to COVID-19).
29Hunting PLC Annual Report and Accounts 2020
Purpose and C
ultureB
usin
ess Mo
del an
d S
takeho
lders
Business S
trategy P
erformance
Governance
Financial Statem
ents

Our EnvironmentHunting is committed to addressing environmental issues and embedding a low carbon culture within our operating facilities and our employees. New facilities take into account environmental impact considerations, including protection from extreme weather events, such as windstorms and flooding.
The Group’s Quality Management System (“QMS”) is compliant with the globally recognised ISO 14001 (Environmental) standard and most of our facilities are operated in compliance with this standard as well as ISO 50001 (Energy Management), as we demonstrate our commitment to operating in an environmentally responsible manner with the aim of reducing the environmental impact of our global footprint.
Environmentally responsible initiatives implemented across the Group include (1) energy efficiency solutions including more efficient lighting; (2) water capture and recycling; and (3) waste recycling. These initiatives are continuously enhanced to incrementally reduce the Group’s overall carbon footprint and environmental impact.
Carbon-based EmissionsTo monitor the impact of Hunting’s operations on the environment, and in compliance with UK Company Law, the Group collates greenhouse gas (“GHG”) data in accordance with the principles of the Kyoto Protocol. Hunting’s 2020 Scope 1 and 2 emissions, as defined by reporting guidelines published by DEFRA in the UK and the International Energy Agency, are reported below. The Group’s carbon footprint is derived primarily from our operating facilities, where 78% of our total Scope 1 and 2 emissions comprise electricity usage, as noted in the accompanying chart. In 2020, the Group’s total Scope 1 and 2 emissions were 31,826 tonnes of carbon dioxide equivalent compared to 35,874 tonnes in 2019. The decrease is predominantly related to the lower activity levels across the Group reported throughout the year. In the UK, total Scope 1 and 2 emissions were 1,347 tonnes of carbon dioxide equivalent compared to 1,779 tonnes in 2019.
The Group’s intensity factor is based on total carbon dioxide equivalent emissions divided by the Group’s revenue in 2020, and was 50.8kg/$k of revenue, compared to 37.4 kg/$k of revenue in 2019.
Given our presence in 11 countries, electricity consumption is still primarily derived from coal and gas-fired generation. However, all businesses within the Group are encouraged to appoint suppliers who can provide renewable energy sourced power generation. In the year, the Group submitted data to the Carbon Disclosure Project, to increase its transparency of its carbon reporting practices. The Group also participates in a number of other initiatives, including the Energy Saving Opportunity Scheme, which requires Hunting’s UK facilities to be audited for energy efficiency, with recommendations provided to reduce energy usage.
The Group collects information on the sources of its electricity and in 2020 5.8 GWh (2019 – 2.1 GWh) was sourced from renewable energy equating to 12% (2019 – 4%) of the Group’s global electricity consumption. In the UK, 0.4 GWh or 31% of the Group’s UK electricity was sourced from hydro or renewable sources (2019 – 0.5 GWh, 27%), with the electricity at Hunting’s London Headquarters being 100% sourced from renewable energy.
Water usage in the year was 257k cubic metres compared to 319k cubic metres in 2019.
GHG Emissions(Tonnes CO2(e))
Scope 1 Scope 2 Total
2020
2019
2018
31,826
35,874
35,171
24,963
28,774
28,084
6,863
7,100
7,087
Intensity Factor(Number)
2020
2019
2018
50.8
37.4
38.6
Hunting’s global and UK electricity consumption is also detailed in the charts below.
Global Electricity Consumption (GWh)
2020
2019
2018
48.6
55.7
54.7
UK Electricity Consumption(GWh)
2020
2019
2018
1.4
1.6
1.9
SustainabilityAt Hunting we are committed to making the broader development goals of the United Nations, particularly the Sustainable Development Goals, part of our culture, strategy and day-to-day operations of the Company. We are also aligning ourselves with the principles of the UN Global Compact and are taking the necessary steps to formally subscribe to this framework.
Waste Management and RecyclingDuring the year, the majority of the Group’s facilities had at least one recycling programme in place.
In 2019, the Group initiated a new process to quantitatively collect recycling information on metal, paper/wood and plastics. The following table shows the data collected in the year.
Metal recycling 3,267 tonnes
Wood/paper recycling 700 tonnes
Plastics recycling 311 tonnes
Business Modelcontinued
30Hunting PLC Annual Report and Accounts 2020

Climate ChangeThe Directors of Hunting have continued to consider climate-related issues and during 2020 reviewed the recommended reporting framework published by the Task Force on Climate-related Financial Disclosures (“TCFD”). It is anticipated that the Group will fully align its compliance with this reporting framework in the coming years. The information following is provided to highlight the Company’s commitment to measuring and managing its climate-related profile and to provide relevant disclosures which allow our various stakeholders to understand our business model and strategy in respect to climate.
In December 2020, the Directors approved our Climate Policy (located at www.huntingplc.com), which commits the Board to Group-level monitoring of climate-related opportunities and risks. This Policy acknowledges the global goal to limit global warming to between 1.5°C to 2.0°C, in line with the Paris accords, and commits the Group to assisting in the delivery of this global ambition through a reduction in its global carbon footprint. The Group acknowledges it is at the beginning of a journey and will endeavour to reach these targets in the coming years as low-carbon initiatives are extended throughout the Company and are made more widely available in each geographic region of operation.
Carbon and Climate Change GovernanceWhile there is Board-level oversight of this key issue, the day-to-day management of this area will be through the Hunting Executive Committee from 2021, with ultimate responsibility vested in the Chief Executive.
Climate Change StrategyThe Group’s strategy in respect to climate change comprises a number of features:
1. Sustainability and StabilityThe Group’s current market focus is the global energy industry and, as such, is supported by the projected increase in primary energy demand forecast by many reputable sources for the next few decades. The Board believes that the Company’s investment case, business model and strategy can be amended in a proportionate and careful manner to ensure shareholder funds and returns are protected over the long term.
2. A Well-managed Energy TransitionThe transition of primary energy sources to non-hydrocarbon sources will take decades and the Group’s focus remains on the oil and gas sector, and will continue to do so for the short- to medium-term. A key theme of our investment case will be to adapt our core expertise of precision engineering and high-end manufacturing into other markets. The opportunities and risks presented to Hunting will be based on utilising our core competencies in delivering high quality products, which are strongly assured, to our end-users in whichever market sectors we operate.
3. Reducing our Carbon FootprintHunting’s carbon footprint is monitored and managed carefully, with an overarching strategy in place to contain and reduce our carbon footprint over time. This reduction will be achieved by a drive for more energy efficient operations and the use of renewable energy to power our facilities. Our published targets are realistic and achievable and are reviewed regularly by the Board.
Carbon and Climate TargetsHunting has committed to sourcing 10% of its total energy needs from renewable sources by 2029 and is aiming for an Intensity Factor of less than 30.0.
The primary strategy to achieve this ambition will be through securing energy contracts which supply higher proportions of green energy, which will reduce the Group’s total Scope 2 emissions.
Climate OpportunitiesThe Group’s business model and strategy currently focus on the supply of products and services to the global oil and gas industry.
As demonstrated in recent years, our business model is applicable to other industries including aviation, naval, space and telecommunications where good progress has been made in establishing our presence in these sectors.
While our oil and gas-related revenue was $586.2m (94%) in 2020 all our businesses have been tasked with identifying complementary markets and products which leverage our manufacturing expertise and reputation for quality.
Climate RisksTransition RiskWhile the energy transition away from hydrocarbons is a risk, particularly given the proportion of the Group’s oil and gas-related revenue in 2020, the Directors believe that the Group’s core geographic markets will be reliant on these primary energy sources for a number of decades to come, and therefore a well-managed business transition is achievable.
As detailed in the Market Review, the International Energy Agency has published forecasts which suggest that oil and gas demand for the next decade is likely to remain materially unchanged. Longer range scenarios for the transition to a lower carbon economy project a wide range of possibilities in respect to the speed of this transition. The Board have noted these projections and believe Transition Risk to a lower carbon economy remains an Emerging Risk, as detailed in the Risk Management section of this report.
Operational Risk The Group has an operational risk assessment framework in place, which, among other risks, assesses its ability to operate should a weather event impact a location. The Group has a concentration of its facilities close to the Gulf of Mexico coast in Texas and Louisiana, which periodically suffer from windstorms.
The following charts present a detailed risk analysis of the Group’s operational locations which are covered by our global insurance programmes. Each location is assessed independently for a wide range of weather-related risks, including storm and flood risks which provide a probability of any one particular location being impacted by adverse weather conditions. This probability is then plotted against both the revenue generated from the location or the insured values of the location, including property, plant and equipment. This enables the Board to understand the concentration of risk for any particular location on a revenue or insured asset basis.
Given the geographic spread of its operations across the US and globally, the Board is satisfied that Hunting’s risk in this area is sufficiently mitigated.
31Hunting PLC Annual Report and Accounts 2020
Purpose and C
ultureB
usin
ess Mo
del an
d S
takeho
lders
Business S
trategy P
erformance
Governance
Financial Statem
ents

The following charts note the Group’s risk profile of its facilities, with respect to windstorm and flood risk.
The Directors therefore believe that weather-related risk is mitigated to a satisfactory level. The Directors have considered the potential impact that climate change could have on the financial statements of the Group. The Directors’ view is that climate remains an emerging risk that the Group is cognisant of, and will react appropriately to. Long-term forecasts used by the Directors, support the view that there will be robust demand for the Group’s oil and gas products for a significant time span and that this does not cause concerns regarding the carrying values or expected lives of non-current assets. The Directors also believe there is significant operational adaptability to move into other non–oil and gas product lines. Further information on climate change can be found on page 53 within Risk Management.
Business Modelcontinued
100
Windstorm Risk Factor vs Revenue2020
2Properties
16Properties
2 Properties
46Properties
0 $60m $120m
Ris
k P
rob
abili
ty
Low risk Medium risk High risk
100
Windstorm Risk Factor vs Total Insured Value2020
5 Properties
18Properties
2 Properties
41Properties
0 £50m £100m
Ris
k P
rob
abili
ty
Low risk Medium risk High risk
0
100
$60m $120m
Flood Risk Factor vs Revenue2020
0 Properties
1 Properties
4 Properties
61Properties
Ris
k P
rob
abili
ty
Low risk Medium risk High risk
100
Flood Risk Factor vs Total Insured Value2020
0 Properties
1 Properties
7 Properties
58Properties
0 £50m £100m
Ris
k P
rob
abili
ty
Low risk Medium risk High risk
32Hunting PLC Annual Report and Accounts 2020

GovernmentsHunting’s global operating footprint extends across 11 countries. As a consequence of this, the Group interacts with a number of global regulators, governments and tax authorities to ensure that Hunting retains a high reputation and business standing within each region of operation and seeks to comply with all applicable and relevant local laws and regulations.
As a UK premium-listed public company, the Financial Conduct Authority (“FCA”) is the Group’s primary regulator; however, each operating segment retains a close relationship with the relevant local tax and legal authority. With the assistance of the Group’s brokers and legal advisers, the relationship with the FCA is closely managed as and when relevant matters arise.
Given the sensitivity of interacting with government officials, with respect to the risk of bribery, the Group’s internal procedures include analysis of which customers and suppliers are government owned, with all externally-facing employees trained in the Group’s anti-bribery and corruption policies.
COVID-19The Group has received furlough and employee support funding totalling $3.6m during 2020. This was predominantly received in the early days of the pandemic and enabled employees to be retained longer, despite the protracted impact of COVID-19. As market conditions deteriorated further, a proportion of these employees were released as cost reduction measures were put in place to align with the trading environment. The majority of the monies were received in Canada, with smaller proportions received in Singapore and the UK. Further, all monies were passed to the employees with no funds being retained by the Group for other purposes.
Tax StrategyHunting is committed to acting with integrity and transparency in all tax matters relating to the countries in which we operate. Simply put, our tax strategy is to comply with local tax regulation, and pay taxes when due.
The tax contributions from Hunting’s global activities includes the following sources:
• Corporate income taxes; • Employment taxes; • Social security taxes; • Property taxes; • State taxes; • Consumption taxes (Value Added Taxes, Goods and Services Taxes and Insurance Premium Taxes);
• Carbon taxes; and • Fuel duties.
When evaluating how we should organise our business affairs, a wide variety of factors are considered, including operational efficiency, risk management and taxation. If the tax regulation allows us to organise our commercial business affairs in a manner which reduces tax costs, while meeting our overall objectives, we will do so but we will not carry out tax evasion or create artificial structures. If necessary, we engage professional tax or legal advisers to ensure that we have interpreted tax law correctly. We will not enter into transactions that have a main purpose of interpreting tax law that is opposed to its original intention or spirit.
Board Engagement and Decision Making – GovernmentsThe Group’s tax governance is managed as follows:
• The Board reviews the Group’s tax strategy and policies on an ongoing basis with regular updates on the tax position provided at each Board Meeting;
• Day-to-day matters are delegated to the Group’s Head of Taxation and a small team of in-house tax professionals who hold a combination of accounting and tax qualifications;
• Annual review of tax policies as part of our internal Group Manual updates;
• Monitor and discuss changes to tax legislation that will have an impact on us and discuss with advisers as required; and
• Engage specialist advisers when appropriate.
Governments are a key stakeholder of the Group which includes local and federal authorities.
Our CommunitiesThe Board delegates community initiatives to the Executive Committee, which allows for local cultural practices to be integrated into community focused activities and projects. Local community sponsorships or charitable donations are encouraged, following approval by a member of the Board or Executive Committee.
Most businesses within the Group normally host “Open House” days at facilities to allow customers, suppliers, employees’ families and other members of the local community to see our operations. These activities were suspended from Q2 2020 due to COVID-19.
Community initiatives are regularly reported in the Group’s magazine, the “Hunting Review”, which profiles the Group’s operations, employees and community work.
In the year, as COVID-19 impacted many of our communities, our Asia Pacific segment purchased machinery and commenced the manufacture of face masks for distribution to our global workforce and to local communities.
Purpose and C
ultureB
usin
ess Mo
del an
d S
takeho
lders
Business S
trategy P
erformance
Governance
Financial Statem
ents33Hunting PLC Annual Report and Accounts 2020

Keeping safe, keeping operational
Hunting’s HSE team has taken swift and decisive action in response to the pandemic and completed 33 facility decontaminations in the year without shutting down facilities for longer than the eight hours required for this exercise, thereby ensuring operational continuity and commitment to our customers.
Case Study Hunting’s COVID Response
Hunting’s global management team has been proactive in mitigating the risks to its workforce and operations through risk assessed working practices and localised initiatives. During the year, Hunting spent in excess of $1.3m on personal protective equipment and decontamination costs across the Group. This epitomises the Company’s deeply held culture of adaptability and encouraging individual responsibility and resourcefulness.
As the COVID-19 pandemic caused the temporary closure of facilities around the world, an example of Hunting’s response at its plant in Wuxi, China, is instructive. With a sterile manufacturing area set aside to service the electronics business in normal times, this was quickly repurposed to manufacture disposable face masks. Within days, our highly automated lines were producing the equivalent of c.1.0 million masks per month. Not only were the masks shipped to all other Hunting sites throughout the world but also distributed into the Company’s wider communities.
Social distancing measures have been implemented across all manufacturing facilities, amongst other safe practices, to enable our sites to keep operating. Symptom monitoring and reporting are now standard throughout the Group. Dedicated shift patterns were also initially adopted across the Group but normal shifts have now resumed. The need to maintain workstation spacing led to the reconfiguration of plant specific workshop footprints and extended into best safe practice in all personal interactions.
Significantly, in spite of the pandemic, Hunting has achieved our global reportable incident rate goal and objective for 2020 (global goal of 2.0). The Group achieved a global rate of 0.67 compared to 1.17 for the year ending 2019.
Safety masks were distributed to all of the Group’s operations.
In Asia Pacific a programme of community distribution of face masks was initiated.
Social distancing and virtual meetings quickly became the norm.
The safety of our employees has been a top priority for the Group in 2020. I am proud of our record, in what has been a challenging year.”Jim Johnson, Chief Executive
34Hunting PLC Annual Report and Accounts 2020
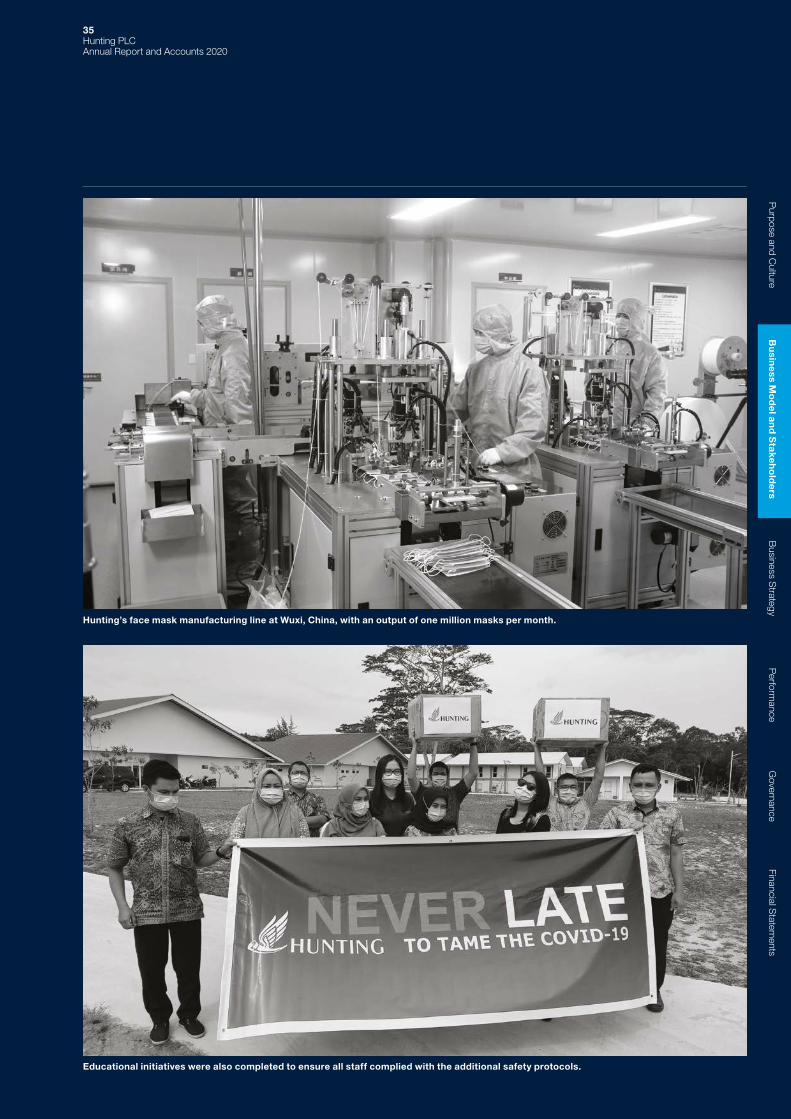
Hunting’s face mask manufacturing line at Wuxi, China, with an output of one million masks per month.
Educational initiatives were also completed to ensure all staff complied with the additional safety protocols.
35Hunting PLC Annual Report and Accounts 2020
Purpose and C
ultureB
usin
ess Mo
del an
d S
takeho
lders
Business S
trategy P
erformance
Governance
Financial Statem
ents
Chief Executive’s Statement and Outlook
Returning to Growth Our business model has been shown to be resilient despite the severe downturn in our core markets. Hunting is now a leaner organisation, focused on an industry that is slowly returning to growth.
Jim JohnsonChief Executive
36Hunting PLC Annual Report and Accounts 2020
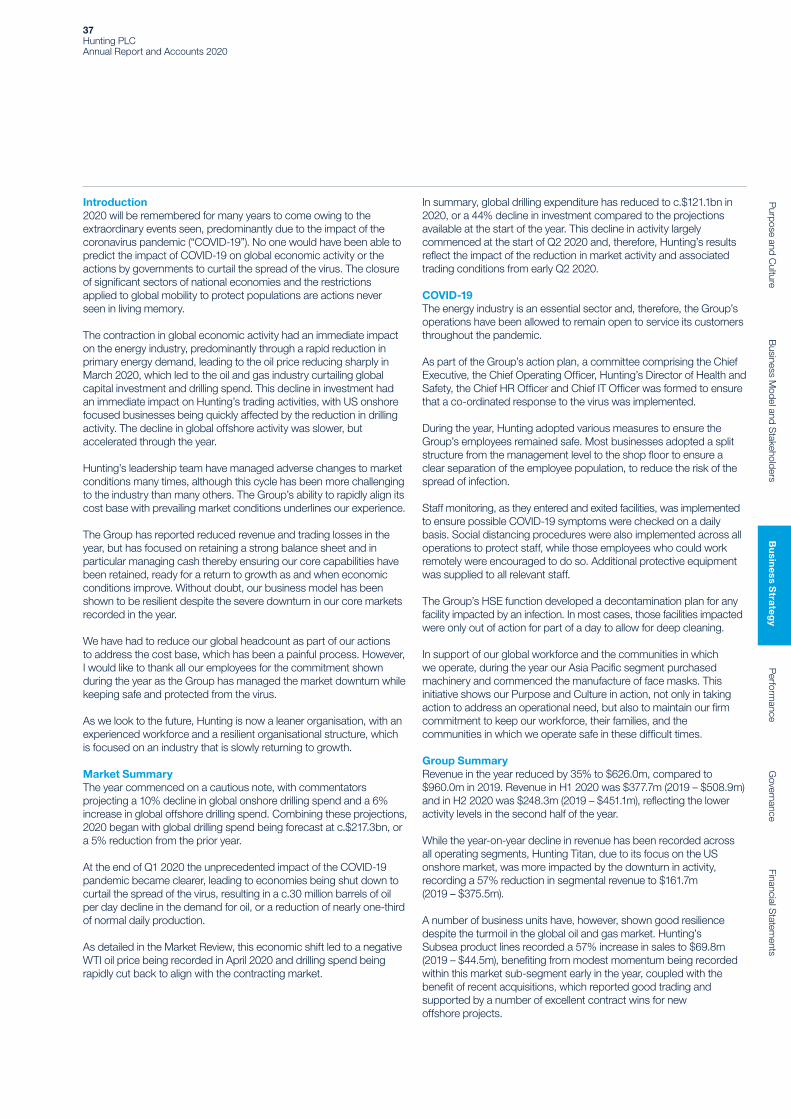
Introduction2020 will be remembered for many years to come owing to the extraordinary events seen, predominantly due to the impact of the coronavirus pandemic (“COVID-19”). No one would have been able to predict the impact of COVID-19 on global economic activity or the actions by governments to curtail the spread of the virus. The closure of significant sectors of national economies and the restrictions applied to global mobility to protect populations are actions never seen in living memory.
The contraction in global economic activity had an immediate impact on the energy industry, predominantly through a rapid reduction in primary energy demand, leading to the oil price reducing sharply in March 2020, which led to the oil and gas industry curtailing global capital investment and drilling spend. This decline in investment had an immediate impact on Hunting’s trading activities, with US onshore focused businesses being quickly affected by the reduction in drilling activity. The decline in global offshore activity was slower, but accelerated through the year.
Hunting’s leadership team have managed adverse changes to market conditions many times, although this cycle has been more challenging to the industry than many others. The Group’s ability to rapidly align its cost base with prevailing market conditions underlines our experience.
The Group has reported reduced revenue and trading losses in the year, but has focused on retaining a strong balance sheet and in particular managing cash thereby ensuring our core capabilities have been retained, ready for a return to growth as and when economic conditions improve. Without doubt, our business model has been shown to be resilient despite the severe downturn in our core markets recorded in the year.
We have had to reduce our global headcount as part of our actions to address the cost base, which has been a painful process. However, I would like to thank all our employees for the commitment shown during the year as the Group has managed the market downturn while keeping safe and protected from the virus.
As we look to the future, Hunting is now a leaner organisation, with an experienced workforce and a resilient organisational structure, which is focused on an industry that is slowly returning to growth.
Market SummaryThe year commenced on a cautious note, with commentators projecting a 10% decline in global onshore drilling spend and a 6% increase in global offshore drilling spend. Combining these projections, 2020 began with global drilling spend being forecast at c.$217.3bn, or a 5% reduction from the prior year.
At the end of Q1 2020 the unprecedented impact of the COVID-19 pandemic became clearer, leading to economies being shut down to curtail the spread of the virus, resulting in a c.30 million barrels of oil per day decline in the demand for oil, or a reduction of nearly one-third of normal daily production.
As detailed in the Market Review, this economic shift led to a negative WTI oil price being recorded in April 2020 and drilling spend being rapidly cut back to align with the contracting market.
In summary, global drilling expenditure has reduced to c.$121.1bn in 2020, or a 44% decline in investment compared to the projections available at the start of the year. This decline in activity largely commenced at the start of Q2 2020 and, therefore, Hunting’s results reflect the impact of the reduction in market activity and associated trading conditions from early Q2 2020.
COVID-19The energy industry is an essential sector and, therefore, the Group’s operations have been allowed to remain open to service its customers throughout the pandemic.
As part of the Group’s action plan, a committee comprising the Chief Executive, the Chief Operating Officer, Hunting’s Director of Health and Safety, the Chief HR Officer and Chief IT Officer was formed to ensure that a co-ordinated response to the virus was implemented.
During the year, Hunting adopted various measures to ensure the Group’s employees remained safe. Most businesses adopted a split structure from the management level to the shop floor to ensure a clear separation of the employee population, to reduce the risk of the spread of infection.
Staff monitoring, as they entered and exited facilities, was implemented to ensure possible COVID-19 symptoms were checked on a daily basis. Social distancing procedures were also implemented across all operations to protect staff, while those employees who could work remotely were encouraged to do so. Additional protective equipment was supplied to all relevant staff.
The Group’s HSE function developed a decontamination plan for any facility impacted by an infection. In most cases, those facilities impacted were only out of action for part of a day to allow for deep cleaning.
In support of our global workforce and the communities in which we operate, during the year our Asia Pacific segment purchased machinery and commenced the manufacture of face masks. This initiative shows our Purpose and Culture in action, not only in taking action to address an operational need, but also to maintain our firm commitment to keep our workforce, their families, and the communities in which we operate safe in these difficult times.
Group SummaryRevenue in the year reduced by 35% to $626.0m, compared to $960.0m in 2019. Revenue in H1 2020 was $377.7m (2019 – $508.9m) and in H2 2020 was $248.3m (2019 – $451.1m), reflecting the lower activity levels in the second half of the year.
While the year-on-year decline in revenue has been recorded across all operating segments, Hunting Titan, due to its focus on the US onshore market, was more impacted by the downturn in activity, recording a 57% reduction in segmental revenue to $161.7m (2019 – $375.5m).
A number of business units have, however, shown good resilience despite the turmoil in the global oil and gas market. Hunting’s Subsea product lines recorded a 57% increase in sales to $69.8m (2019 – $44.5m), benefiting from modest momentum being recorded within this market sub-segment early in the year, coupled with the benefit of recent acquisitions, which reported good trading and supported by a number of excellent contract wins for new offshore projects.
37Hunting PLC Annual Report and Accounts 2020
Purpose and C
ultureB
usiness Model and S
takeholdersB
usin
ess Strateg
y P
erformance
Governance
Financial Statem
ents
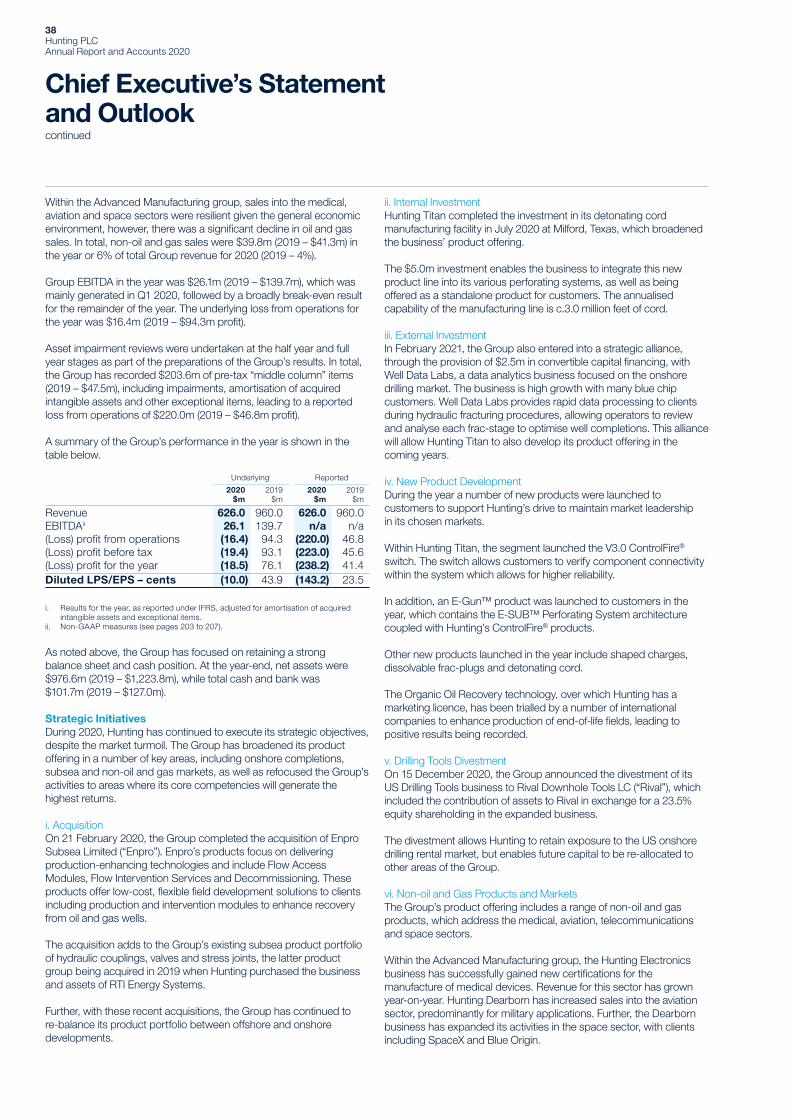
ii. Internal InvestmentHunting Titan completed the investment in its detonating cord manufacturing facility in July 2020 at Milford, Texas, which broadened the business’ product offering.
The $5.0m investment enables the business to integrate this new product line into its various perforating systems, as well as being offered as a standalone product for customers. The annualised capability of the manufacturing line is c.3.0 million feet of cord.
iii. External InvestmentIn February 2021, the Group also entered into a strategic alliance, through the provision of $2.5m in convertible capital financing, with Well Data Labs, a data analytics business focused on the onshore drilling market. The business is high growth with many blue chip customers. Well Data Labs provides rapid data processing to clients during hydraulic fracturing procedures, allowing operators to review and analyse each frac-stage to optimise well completions. This alliance will allow Hunting Titan to also develop its product offering in the coming years.
iv. New Product DevelopmentDuring the year a number of new products were launched to customers to support Hunting’s drive to maintain market leadership in its chosen markets.
Within Hunting Titan, the segment launched the V3.0 ControlFire® switch. The switch allows customers to verify component connectivity within the system which allows for higher reliability.
In addition, an E-Gun™ product was launched to customers in the year, which contains the E-SUB™ Perforating System architecture coupled with Hunting’s ControlFire® products.
Other new products launched in the year include shaped charges, dissolvable frac-plugs and detonating cord.
The Organic Oil Recovery technology, over which Hunting has a marketing licence, has been trialled by a number of international companies to enhance production of end-of-life fields, leading to positive results being recorded.
v. Drilling Tools DivestmentOn 15 December 2020, the Group announced the divestment of its US Drilling Tools business to Rival Downhole Tools LC (“Rival”), which included the contribution of assets to Rival in exchange for a 23.5% equity shareholding in the expanded business.
The divestment allows Hunting to retain exposure to the US onshore drilling rental market, but enables future capital to be re-allocated to other areas of the Group.
vi. Non-oil and Gas Products and MarketsThe Group’s product offering includes a range of non-oil and gas products, which address the medical, aviation, telecommunications and space sectors.
Within the Advanced Manufacturing group, the Hunting Electronics business has successfully gained new certifications for the manufacture of medical devices. Revenue for this sector has grown year-on-year. Hunting Dearborn has increased sales into the aviation sector, predominantly for military applications. Further, the Dearborn business has expanded its activities in the space sector, with clients including SpaceX and Blue Origin.
Within the Advanced Manufacturing group, sales into the medical, aviation and space sectors were resilient given the general economic environment, however, there was a significant decline in oil and gas sales. In total, non-oil and gas sales were $39.8m (2019 – $41.3m) in the year or 6% of total Group revenue for 2020 (2019 – 4%).
Group EBITDA in the year was $26.1m (2019 – $139.7m), which was mainly generated in Q1 2020, followed by a broadly break-even result for the remainder of the year. The underlying loss from operations for the year was $16.4m (2019 – $94.3m profit).
Asset impairment reviews were undertaken at the half year and full year stages as part of the preparations of the Group’s results. In total, the Group has recorded $203.6m of pre-tax “middle column” items (2019 – $47.5m), including impairments, amortisation of acquired intangible assets and other exceptional items, leading to a reported loss from operations of $220.0m (2019 – $46.8m profit).
A summary of the Group’s performance in the year is shown in the table below.
Underlyingi Reported
2020$m
2019$m
2020$m
2019$m
Revenue 626.0 960.0 626.0 960.0EBITDAii 26.1 139.7 n/a n/a(Loss) profit from operations (16.4) 94.3 (220.0) 46.8(Loss) profit before tax (19.4) 93.1 (223.0) 45.6(Loss) profit for the year (18.5) 76.1 (238.2) 41.4Diluted LPS/EPS – cents (10.0) 43.9 (143.2) 23.5
i. Results for the year, as reported under IFRS, adjusted for amortisation of acquired intangible assets and exceptional items.
ii. Non-GAAP measures (see pages 203 to 207).
As noted above, the Group has focused on retaining a strong balance sheet and cash position. At the year-end, net assets were $976.6m (2019 – $1,223.8m), while total cash and bank was $101.7m (2019 – $127.0m).
Strategic InitiativesDuring 2020, Hunting has continued to execute its strategic objectives, despite the market turmoil. The Group has broadened its product offering in a number of key areas, including onshore completions, subsea and non-oil and gas markets, as well as refocused the Group’s activities to areas where its core competencies will generate the highest returns.
i. AcquisitionOn 21 February 2020, the Group completed the acquisition of Enpro Subsea Limited (“Enpro”). Enpro’s products focus on delivering production-enhancing technologies and include Flow Access Modules, Flow Intervention Services and Decommissioning. These products offer low-cost, flexible field development solutions to clients including production and intervention modules to enhance recovery from oil and gas wells.
The acquisition adds to the Group’s existing subsea product portfolio of hydraulic couplings, valves and stress joints, the latter product group being acquired in 2019 when Hunting purchased the business and assets of RTI Energy Systems.
Further, with these recent acquisitions, the Group has continued to re-balance its product portfolio between offshore and onshore developments.
Chief Executive’s Statement and Outlookcontinued
38Hunting PLC Annual Report and Accounts 2020

The Trenchless business, which forms part of the Group’s US operating segment, also secured orders in the year as 5G broadband was rolled out, particularly in the US.
Hunting’s EMEA operating segment has made inroads into the geothermal market arena, with a contract win in the UK. This market is highly complementary to the Group’s existing OCTG and Premium Connections business.
Further, the Group’s Asia Pacific operating segment has manufactured and tested a micro hydro power generation unit.
vii. Operational FootprintThroughout the year, the Group has undertaken a restructuring and re-organisation of its operating footprint, to align itself with the prevailing market conditions reported in the year.
In August 2020, the Group announced the closure of its manufacturing facility in Calgary, Canada, given the long-term market outlook. Hunting has adopted a licensing model for OCTG in Canada, whereby connections and accessories will be manufactured by local partners under licence or completed by the Group’s US operating segment. Hunting will retain a sales and administration office in Calgary, while Hunting Titan will continue to operate a number of distribution centres across Western Canada.
Elsewhere across the Group, Hunting’s regional well intervention activities were relocated to a smaller facility in Singapore. Within Hunting Titan the facility in Oklahoma City was mothballed and in the US segment, the US Manufacturing business commenced the closure of its OCTG threading facility at Ramsey Road, Texas. In the year, three distribution centres were also closed to align with activity in the US onshore market.
At 31 December 2020, the Group retained 31 operating sites (2019 – 36) and 16 distribution centres (2019 – 19) following the Group’s strategic initiatives completed during the year.
OutlookThe early weeks of 2021 have seen a steady increase in a number of key market indicators, including a rising WTI oil price and improving rig count. This positive sentiment, if sustained, bodes well for the global energy industry for the coming months as operators seek stability across the sector to enable them to confirm new drilling programmes and capital investments. Supporting this sentiment is the availability of COVID-19 vaccines and the rollout of immunisation programmes across the world.
Within the US market, our Hunting Titan segment has seen a steadily improving revenue profile in recent months as onshore activity levels have increased. The business has reopened a distribution centre to meet this demand and has made selective additions to headcount. Hunting Titan’s technology offering continues to be industry-leading, which will support new sales opportunities both in the US and internationally as onshore drilling programmes recommence.
The Group’s US operating segment, which provides equipment to both onshore and offshore projects, anticipates accelerating activity in H2 2021 following the slowing of offshore projects in the second half of 2020.
In Canada, our new business model is seeing good customer acceptance as we work with our new licence partners.
Hunting’s European operations report optimism for the year ahead as deferred drilling programmes recommence. In the UK, a number of clients have already indicated that drilling will take place in 2021, while in the Netherlands international orders received since the start of the year will ensure our OCTG facility will remain busy for the short term.
In the Middle East and Asia Pacific, new opportunities are emerging following the increase in the oil price and the beginning of vaccination programmes, with growth now projected from the middle of the year.
The Group has made strong inroads into new sectors in the year. Our presence in the medical devices, aviation and space sectors has increased and our various operating segments have all progressed initiatives, which utilise our core competencies as well as diversify our revenue streams.
The Board of Hunting believes that the Group has been decisive in its actions during 2020 to manage the market downturn. The Group enters 2021 a leaner organisation, with its global capabilities intact and poised to capitalise on any new opportunities presented.
Jim JohnsonChief Executive
4 March 2021
39Hunting PLC Annual Report and Accounts 2020
Purpose and C
ultureB
usiness Model and S
takeholdersB
usin
ess Strateg
y P
erformance
Governance
Financial Statem
ents

Macro Overview2020 has been a volatile year for the global oil and gas industry. The year commenced with market commentators anticipating a 10% decline in drilling spending for global onshore projects, given the average WTI oil price for 2019. Global offshore projects were, however, forecasting a 6% increase in drilling spending, which was projected to partially offset the decline anticipated in onshore activity. Trading for the Group, therefore, started the year on a cautious note, with a restructuring of Hunting’s onshore focused businesses commencing, including Hunting Titan, to reduce headcount to align with this shift in the market landscape. The acceleration of the spread of COVID-19 throughout the first quarter of the year led to a significant revision to projected activity and drilling investment as many major economies were put into a “lockdown” basis in March 2020, leading to global mobility coming to a near standstill in early Q2 2020, as over 180 countries implemented measures to curtail the spread of COVID-19.
The impact of these actions on the WTI oil price, global rig counts and capital spending was dramatic. The International Energy Agency estimated that in April 2020, global daily oil demand declined by c.30 million barrels of oil per day.
WTI Crude Oil Price ($/barrel)
25
75
-25
-50
0
50
Jan Feb Mar Apr May Jun Jul Aug Sep Oct Nov Dec
Source: FT.com.
Reflecting this decline in demand, commodity traders liquidated positions as storage capacity tightened leading to a negative WTI oil price being recorded in Q2, an event never seen before in the history of the industry. This position quickly corrected, with the oil price trending upwards throughout the remainder of the year, and closing at $49 per barrel at year-end. The impact of this oil price shock is shown in the chart above.
Onshore operators were quick to shut down activity, leading to a year-on-year decline in drilling spend of $77.8bn or a reduction of 50% compared to 2019. Offshore operators slowed activity from March 2020 onwards, leading to a year-on-year decline of $17.7bn or 29% compared to the prior year.
Global Industry Spend (2019 to 2023f)($bn)
Onshore Offshore f Forecast
2023f
2022f
2021f
46.0
42.0
40.5
89.8
71.4
62.5
2020
2019
43.4
61.1
77.7
155.5
Source: Spears and Associates.
The decline in active onshore drilling rigs was more rapid than offshore activities, with a year-on-year decline of 41% being recorded compared to the prior year, to average 1,097 onshore units.
The decline in offshore drilling units was 25% in the year, but the reduction did accelerate from Q2 2020 onwards.
Average Global Rig Counts (2019 to 2023f) (Number)
Onshore Offshore f Forecast
2023f
2022f
2021f
187
174
166
1,154
1,023
942
2020
2019
182
243
1,097
1,844
Source: Baker Hughes/Spears and Associates.
The average global rig count reported in 2019 was 2,087 active units, which dropped by 39% in 2020 to record an average of 1,279 units.
Short-term OutlookGiven the ongoing impact of COVID-19, industry commentators have adopted a cautious approach to forecasting the industry recovery.
Industry data for 2021 projects overall activity levels and drilling spend being lower than 2020, due to the higher levels of activity recorded in Q1 2020, however, total drilling investment is expected to grow from Q2 2021 onwards, with further growth then into 2022 and 2023.
While these projections will change over the coming months with the usual industry supply/demand fluctuations impacting the industry, along with global economies continuing to respond to the impact of COVID-19, longer-range forecasts for capital expenditures and industry investment are yet to be accurately determined as the industry recovers to pre-pandemic levels, coupled with the longer-term impact of the energy transition.
Medium-term OutlookThe International Energy Agency published its annual outlook in October 2020, which projected that oil demand would return to pre-COVID levels by 2023 and then remain materially unchanged from this position to 2030.
Longer range projections, including those published by BP plc, anticipate a wide range of scenarios that project demand changes as the energy transition accelerates.
While some longer range oil demand projection scenarios show a rapid transition to a lower carbon economy and declines in demand for hydrocarbons, oil and gas is still anticipated to be a major part of the primary energy mix for at least the next 20 years.
Market Review
40Hunting PLC Annual Report and Accounts 2020

US MarketUS Capital Expenditure (2019 to 2023f) ($bn)
Onshore Offshore f Forecast
150
120
90
30
0
60
2019 Q12020
Q22020
Q32020
Q42020
2020 2021f 2022f 2023f
Source: Spears and Associates.
The US drilling market continues to be dominated by onshore operations, which in turn are driven by the prevailing oil price.
Between Q1 and Q2, US onshore drilling spend declined 58% from $24.8bn to $10.3bn, which underlines the speed at which the industry responded to COVID-19 and the shutting of economies. US offshore drilling spend declined 40% from $1.0bn in Q1 2020 to $0.6bn in Q2.
Further declines in drilling investment for both onshore and offshore projects were recorded during Q3 2020.
In Q4 2020, as the global oil price stabilised, drilling expenditure started to increase from its low point, with a 20% increase in onshore drilling spend being recorded, to $7.8bn compared to $6.5bn during Q3 2020. US offshore expenditure was flat.
Overall, during 2020, the US onshore market has recorded a 56% decline in spending from $113.4bn to $49.4bn, a ten-year low in investment within the US onshore industry.
The US offshore market has recorded a 40% decline from $4.5bn to $2.7bn, again another decade low.
OutlookThe projections for industry spend for 2021 show quarterly increases in drilling spend throughout the year ahead, with overall drilling expenditure expected to be $40.2bn, when combining both offshore and onshore activity.
Past 2021, current projections are recording steady year-on-year improvements with US expenditure to reach $62.5bn by 2023.
Average US Rig Counts (2019 to 2023f) (Number)
Onshore Offshore f Forecast
1,000
800
600
200
0
400
2019 Q12020
Q22020
Q32020
Q42020
2020 2021f 2022f 2023f
Source: Baker Hughes/Spears and Associates.
The US rig count continues to provide a good bellwether for drilling activity. In line with drilling spending data, the speed of the decline in industry activity is seen in the reduction in the number of active rigs working throughout 2020.
Between Q1 and Q2, the average onshore rig count declined 51% from 763 active units to 377 units. This is compared to a 2019 onshore average of 920 units. Offshore drilling rigs declined from 21 active units to 15 between Q1 and Q2 2020.
The low point for the US average onshore rig count was reached during Q3, with a 22% increase being recorded in Q4 2020 for onshore rigs to 294 units.
Overall, during 2020, the average US rig count declined 54% to 435 units compared to 943 in 2019.
The medium-term outlook projects a steady increase in activity through 2022 to 2023 to average c.500 units.
US Frac Jobs (2019 to 2023f) (Number)f Forecast
20,000
16,000
12,000
4,000
0
8,000
2019 Q12020
Q22020
Q32020
Q42020
2020 2021f 2022f 2023f
Source: Spears and Associates.
Onshore hydraulic fracturing operations also provide a useful metric for the Group, as Hunting Titan’s business continues to be linked to these operations.
In 2020, the total number of “frac jobs” declined by 53% year-on-year. However it did reach a low point in Q2 2020 and recorded steady increases throughout the remainder of the year.
41Hunting PLC Annual Report and Accounts 2020
Purpose and C
ultureB
usiness Model and S
takeholdersB
usin
ess Strateg
y P
erformance
Governance
Financial Statem
ents
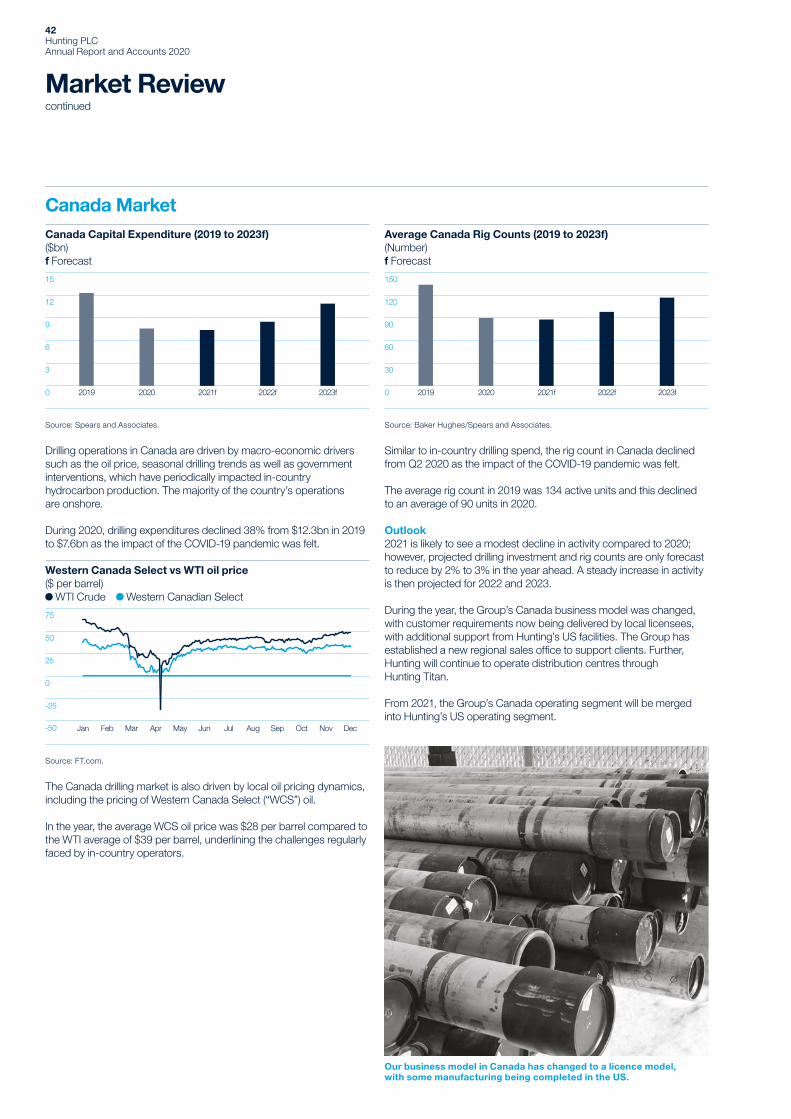
Canada MarketCanada Capital Expenditure (2019 to 2023f) ($bn)f Forecast
2019 2020 2021f 2022f 2023f
15
12
9
3
0
6
Source: Spears and Associates.
Drilling operations in Canada are driven by macro-economic drivers such as the oil price, seasonal drilling trends as well as government interventions, which have periodically impacted in-country hydrocarbon production. The majority of the country’s operations are onshore.
During 2020, drilling expenditures declined 38% from $12.3bn in 2019 to $7.6bn as the impact of the COVID-19 pandemic was felt.
Western Canada Select vs WTI oil price ($ per barrel)
WTI Crude Western Canadian Select
25
75
-25
-50
0
50
Jan Feb Mar Apr May Jun Jul Aug Sep Oct Nov Dec
Source: FT.com.
The Canada drilling market is also driven by local oil pricing dynamics, including the pricing of Western Canada Select (“WCS”) oil.
In the year, the average WCS oil price was $28 per barrel compared to the WTI average of $39 per barrel, underlining the challenges regularly faced by in-country operators.
Average Canada Rig Counts (2019 to 2023f) (Number)f Forecast
2019 2020 2021f 2022f 2023f
150
120
90
30
0
60
Source: Baker Hughes/Spears and Associates.
Similar to in-country drilling spend, the rig count in Canada declined from Q2 2020 as the impact of the COVID-19 pandemic was felt.
The average rig count in 2019 was 134 active units and this declined to an average of 90 units in 2020.
Outlook2021 is likely to see a modest decline in activity compared to 2020; however, projected drilling investment and rig counts are only forecast to reduce by 2% to 3% in the year ahead. A steady increase in activity is then projected for 2022 and 2023.
During the year, the Group’s Canada business model was changed, with customer requirements now being delivered by local licensees, with additional support from Hunting’s US facilities. The Group has established a new regional sales office to support clients. Further, Hunting will continue to operate distribution centres through Hunting Titan.
From 2021, the Group’s Canada operating segment will be merged into Hunting’s US operating segment.
Market Reviewcontinued
Our business model in Canada has changed to a licence model, with some manufacturing being completed in the US.
42Hunting PLC Annual Report and Accounts 2020

EMEA MarketEMEA Capital Expenditure (2019 to 2023f)* ($bn)
Europe Middle East f Forecast
2019 2020 2021f 2022f 2023f
50
40
30
10
0
20
Source: Spears and Associates.
Hunting’s EMEA businesses are primarily driven by offshore drilling activity and spend in the UK Continental Shelf (“UKCS”) region of the North Sea, followed by Middle East activity.
Hunting’s EMEA and Asia Pacific businesses also support operators in Africa, although this is a small proportion of Group revenue.
Drilling spend within the Europe region declined by 35% in 2020 to $11.7bn compared to $17.9bn in 2019. In the Middle East the year-on-year decline was 22% to $20.4bn.
During the year, the quarterly spend within the Europe region was c.$3.0bn leading to the total recorded, while in the Middle East quarterly drilling spend declined sequentially throughout the year as the lower global price of oil impacted onshore orientated projects.
OutlookLooking ahead, 2021 drilling spend is projected to record an overall 11% decline across the Group’s EMEA geographic regions. In Europe, projected growth in spend is forecast to be 6% as activity is anticipated to recover on the UKCS in 2021, being offset by a projected decline in the Middle East of 20%. From 2022 onwards, EMEA markets return to modest growth.
Average UKCS Rig Count (2019 to 2021f)(Number)
UK Netherlands Norway
2019 2020 2021f
50
40
30
10
0
20
Source: Spears and Associates.
Average EMEA Rig Counts (2019 to 2023f)* (Number)
Europe Middle East f Forecast
2019 2020 2021f 2022f 2023f
500
400
300
100
0
200
Source: Baker Hughes/Spears and Associates.
During 2020, the rig count in Europe declined by 27% as drilling activity was either delayed or cancelled due to the COVID-19 pandemic.
In the Middle East, the decline in the rig count was 17% year-on-year as Saudi Arabia limited its reductions in activity.
OutlookLooking ahead to 2021, the Middle East is projecting a decline in the rig count of 23%, while the Europe region is projecting an increase of 3%.
Further increases in the rig count are currently projected in 2022 and 2023.
* Combining projections for Europe and the Middle East, as published by Spears and Associates.
43Hunting PLC Annual Report and Accounts 2020
Purpose and C
ultureB
usiness Model and S
takeholdersB
usin
ess Strateg
y P
erformance
Governance
Financial Statem
ents

Asia Pacific MarketAsia Pacific Capital Expenditure (2019 to 2023f)**($bn)
Asia Pacific China f Forecast
2019 2020 2021f 2022f 2023f
75
60
45
15
0
30
Source: Spears and Associates.
Drilling spend across Asia Pacific, including China, declined by 12% in 2020 to $51.6bn compared to $58.4bn in 2019. This reflects the impact of the COVID-19 pandemic.
The decline in drilling spend in Asia Pacific totalled $4.7bn in the year, while the overall decline in China was $2.1bn. In general, the pace of reduction in activity was slower than in other regions.
Outlook2021 is likely to see a further decline in drilling spend as the COVID-19 pandemic persists, with a further 4% decline being projected to $49.5bn. Asia Pacific is projected to reduce spend by 7%, while China is projecting a decline of 3%.
2022 and 2023 will see a return to growth for the whole region, with drilling spend projected to increase 5% and 8% respectively.
Average Asia Pacific Rig Counts (2019 to 2023f)** (Number)
Asia Pacific China f Forecast
2019 2020 2021f 2022f 2023f
1,250
1,000
750
250
0
500
Source: Baker Hughes/Spears and Associates.
Average rig counts across Asia Pacific and China declined by 4% from an average of 1,043 in 2019 to 1,003 in 2020.
In China, the rig count was broadly flat, recording an average of 832 active rigs throughout the year.
Outlook2021 is likely to see an unchanged position compared to the 2020 average, with c.1,000 active rigs operating.
For 2022 and 2023 the average growth in the rig count is projected to be 5% per year.
** Combining projections for Asia Pacific and China, as published by Spears and Associates.
f Indicates the projections and estimates published by Spears and Associates. This data is updated quarterly.
Market Reviewcontinued
Hunting face masks have been distributed throughout the Group and into local communities.
44Hunting PLC Annual Report and Accounts 2020

New products launched in the year included a second generation of Shear Valves for offshore pressure control and a range of other Well Intervention tools.
45Hunting PLC Annual Report and Accounts 2020
Purpose and C
ultureB
usiness Model and S
takeholdersB
usin
ess Strateg
y P
erformance
Governance
Financial Statem
ents

Our aim is to continue to develop our global presence and supply a comprehensive range of products for use in the wellbore. We will grow through capital investment in existing businesses and through acquisition.
Strategic Focus Areas
• Extend global presence • Acquire complementary businesses • Enhance existing capacity • Develop new products
2020 Progress
• In February 2020 we acquired Enpro Subsea, an offshore focused business with innovative technology used in deep-water applications. Enpro has increased the Group’s exposure to the energy markets in West Africa.
• In July 2020 we commissioned a detonating cord manufacturing facility at Milford, Texas.
• In the year, the Subsea Spring business (formerly RTI Energy Systems) won a number of significant orders for offshore customers, assisting in a strong growth in revenue for this business.
Related KPIs
Revenue $626.0m2020
$960.0m2019
Underlying (loss) profit from operations*
$(16.4)m2020
$94.3m2019
Operational footprint (sq ft)
2.8m2020
3.0m2019
Related Risks
• Geopolitics • Investment • Competition
* Non-GAAP measure.
• Product quality • Commodity prices • Shale drilling
We operate in a highly competitive and cyclical sector, which is high profile and strongly regulated. To be successful we must deliver reliable products which are quality assured to the highest industry standards and which offer better cost efficiencies.
Strategic Focus Areas
• Leverage strong brand • Maintain and enhance quality control • Maintain operational flexibility • Leverage lean manufacturing • Strengthen relationships with customers and suppliers
2020 Progress
• Hunting has continued to market an Organic Oil Recovery product, leveraging Hunting’s global presence and strong brand.
• The Group has implemented new ERP systems within the Hunting Titan and US Manufacturing businesses in the year to improve the efficiency and robustness of internal processes.
• Lean manufacturing initiatives continued throughout the year, which generated efficiencies.
Related KPIs
ISO 9001:2015 (Quality) accredited operating sites
71%2020
72%2019
Quality assurance – manufacturing reject rate
0.24%2020
0.30%2019
Countries in which we operate
112020
112019
Related Risks
• Product quality • Key executives • Competition
Strategic Priority Strategic Priority
Our Business Strategy Hunting’s strategic priorities are based on a business model designed to deliver sustainable long-term shareholder value while recognising our corporate responsibilities.
Growth Operational Excellence
46Hunting PLC Annual Report and Accounts 2020

In normal phases of the oil and gas cycle, our business has the capability to produce high levels of profitability, strong cash generation and good returns on capital leading to growing dividends to shareholders.
Strategic Focus Areas
• Extend global presence • Acquire complementary businesses • Enhance existing capacity • Develop new products
2020 Progress
• The Group reviewed its operational footprint in the year and closed its Calgary facility, mothballed its facility at Oklahoma City, commenced the closure of the Ramsey Road, Texas, facility and shut three distribution centres.
• In December we divested our US Drilling Tools business to Rival Downhole Tools LC, in exchange for a 23.5% equity position in the expanded Rival business.
• The Group’s cost reduction programme implemented in the year led to annualised savings of c.$86.0m.
Related KPIs
Underlying gross margin* 20%2020
28%2019
Free cash flow* $47.8m2020
$138.8m2019
Return on average capital employed*
(2)%2020
8%2019
Related Risks
• Commodity prices • Competition
* Non-GAAP measure, see pages 203 to 207.
We are committed to acting with high standards of integrity and creating positive, long-lasting relationships with our customers, suppliers, employees and the wider communities in which we operate.
Strategic Focus Areas
• Retain experienced senior management team • Skilled workforce • Safe operations • Protect the environment • Compliance
2020 Progress
• The impact of COVID-19 led to enhanced HSE measures being put in place to protect our workforce. The issuing of personal protective equipment and regular employee monitoring is now a feature at all facilities.
• As our workforce numbers decreased in the year, extra training occurred as responsibilities were re-assigned.
• The Group has reviewed its carbon footprint in the year and assessed its climate risks in accordance with the recommendations published by the Task Force for Climate-related Financial Disclosures.
Related KPIs
Incident rate(OSHA method)
0.672020
1.172019
CO2 emissions intensity factor (kg/$k of revenue)
50.82020
37.42019
CO2 tonnes equivalent emitted
31,8262020
35,8742019
Related Risks
• Key executives • Health, safety and environment
Strategic Priority Strategic Priority
Strong Returns Corporate Responsibility
47Hunting PLC Annual Report and Accounts 2020
Purpose and C
ultureB
usiness Model and S
takeholdersB
usin
ess Strateg
y P
erformance
Governance
Financial Statem
ents

Case Study Hunting’s Revolutionary Technologies
Delivering solutions and maintaining competitive advantage
Hunting continues to support our reputation as a pioneering provider of innovative technologies to the oil and gas industry. Furthermore, Hunting has demonstrated the transferability of our precision engineering and manufacturing capabilities to areas outside of the oil and gas sector.
ControlFire® Exploded Foil Initiator Cartridge (EFI Cartridge)
Hunting’s EFI Cartridge is an inherently safe, addressable plug-and-play detonator that has the highest possible safety designation in the industry. The cartridge is compatible with Hunting’s H-1 Perforating System®. It is the safest detonator ever introduced into the oilfield industry – no primary explosive is used and the integration of the industry leading Controlfire® technology renders the detonator radio frequency and electrostatic safe as well as safe from stray voltage.
PowerSet® Solo and PowerSet® Recon
Power charges generate explosive gas to activate setting tools that plug zones in the well to isolate fluid flow. Hunting’s PowerSet® Solo power charge includes a built-in initiation device rendering it the only power charge on the market that operates without an igniter and, therefore, cost effective and efficient.
PowerSet® Recon completes the first and only fully addressable plug-and-perf tool string. It is the only addressable charge on the market and includes a built-in initiation device. The charge incorporates ControlFire Recon® technology, making it the first addressable charge that can be interrogated downhole, allowing the operator to read the resistance at any time, assuring all components are in place and in working order downhole. The integrated initiator also provides cost saving and operational efficiency benefits to the customer.
Hunting Titan Products:
48Hunting PLC Annual Report and Accounts 2020

Advanced Manufacturing Group (“AMG”):
Hunting’s Dearborn business, based in Fryeburg, Maine, provides state-of-the-art precision engineering capabilities.
Around 50% of Dearborn’s business is non-oil and gas related and represents a growth opportunity for diversification.
In many cases, Hunting is the only manufacturer that has the engineering and machining capabilities required for certain products.
Examples of current projects include: L-3 KEO: Hunting manufactures the photonics masts for Columbia and Virginia class navy submarines.
A photonics mast is a sensor on a submarine that functions like a periscope but without requiring a periscope tube, thus limiting the possibility of water leakage.
Pratt & Whitney: Hunting manufactures shafts for the F135 engine used in the Lockheed Martin F-35 joint strike fighter.
The F135 is the world’s most advanced fighter engine, delivering more than 40,000 lbs of thrust and unrivalled safety, design, performance and reliability.
Hunting Dearborn manufactures photonic masts for submarines.
AMG has entered new markets including aviation and space.
49Hunting PLC Annual Report and Accounts 2020
Purpose and C
ultureB
usiness Model and S
takeholdersB
usin
ess Strateg
y P
erformance
Governance
Financial Statem
ents

Risk Management
Segment and Local Management • Ensures Group policies and procedures are applied; and • Manages business unit controlled risks.
Board • Determines the Group’s risk appetite and culture; • Sets the risk management framework; and • Ensures the management processes and internal controls are effective in identifying the Group’s principal risks and emerging risks.
Audit Committee • Controls the Group’s risk management processes; • Reviews business risks and considers emerging risks; and • Gains assurance that the risk management processes and controls are effective.
Group Management • Establishes detailed Group policies and procedures; • Manages centrally-controlled risks; and • Reviews segment and business unit risks.
Assurance – Internal AuditHunting’s internal audit department reviews internal controls and risk management processes for their existence, relevance and effectiveness. Actions are recommended and graded in terms of importance and timeliness for change.
Roles and ResponsibilitiesThe Board has set risk management roles and responsibilities as illustrated below.
50Hunting PLC Annual Report and Accounts 2020

IntroductionThe oil and gas industry is highly regulated and demands high specification products that meet stringent quality criteria, given the challenging environments in which these products are used. Hunting’s risk management and internal control processes are, therefore, designed to appropriately mitigate the operating risks inherent in this sector, whilst allowing the Group to achieve its strategic objectives and deliver value to shareholders.
External RisksThe Board recognises that a number of risks are not within the direct control of management, including energy market factors such as commodity pricing and daily supply/demand dynamics driven by economic and geopolitical movements. These factors are regularly assessed by the Board and are considered alongside the risk management framework operated by the Group.
As highlighted elsewhere in this report, the COVID-19 pandemic has had a materially adverse impact on global economic activity, which in turn directly impacted the demand for oil and gas leading to lower revenue in the year.
The BoardThe Board of Hunting has responsibility for developing and maintaining a robust risk management framework and for monitoring the Group’s system of internal control to ensure it remains effective and fit for purpose.
The Board is also responsible for developing the Group’s strategic objectives. The balance between the Board’s desire to meet these strategic objectives and its appetite for risk creates the risk culture within the Group, which impacts capital investment decision making, consideration to new acquisitions and other growth opportunities.
The Board’s appetite for risk is key to establishing effective systems of internal control and risk management processes.
The Board’s review and debate of risk follows detailed discussions by the Chief Executive and Finance Director with members of the Executive Committee. By reviewing and debating the relevant evidence, the Board then develops an appreciation for the contributory factors that generate a particular risk.
Subsequently, through delegation, the Board establishes the extent to which the risk should be mitigated relative to its impact and the cost to the Group. The Board, for example, has little appetite for high levels of exposure to geopolitical risk and, consequently, the Group’s expansion strategy has avoided countries that are considered to be significantly unstable or too high risk to maintain a physical presence, notwithstanding the potential benefits that may be generated. Advice on risk management is sought by the Board from both internal and external sources.
The risk management processes are further supported by:
• understanding the current and evolving market environment; • challenging executive management on new growth opportunities; • reviewing proposed new product developments and capital investment projects; and
• consideration and discussion over emerging risks.
Audit CommitteeSegment and business unit management establish and undertake risk management processes that are relevant to the risk profile of each business unit.
The key risks and emerging risks are identified and reported to Group management three times a year, from which a Group Risk Register is maintained covering the key risks to the Group, including all financial, operational and compliance matters.
On behalf of the Board, the Audit Committee seeks to ensure that risk management processes are established within the framework set out by the Board and, as part of this assessment, conducts a formal review of the Group’s Risk Register three times a year.
The Group’s Principal Risks are disclosed on pages 56 to 59. In addition, once a year, the Audit Committee seeks assurance with regard to the effectiveness of the internal financial controls based on a self-assessment exercise carried out by local management. The appropriateness of these self assessments is checked by Internal Audit, on a sample basis, as part of its routine programme of work. The Internal Audit department reports directly to the Audit Committee. The relationship with the external auditor is monitored by the Audit Committee which is responsible for completing the review of the effectiveness of the external auditors.
Group ManagementAll Group business units operate in accordance with the Hunting Group Manual which sets out Group policies and procedures, together with related authority levels, and identifies matters requiring approval or notification to central management or to the Board.
Included within the Group Manual are policies covering general finance requirements, taxation responsibilities, information on Hunting’s internal control and risk management framework, legal compliance and governance. Compliance is also monitored and subject to check by the Internal Audit department. The Group Manual also incorporates and mandates the Group’s accounting policies. This is periodically supported by documents that are prepared centrally and circulated throughout the Group in order to advise local management of and establish major accounting and policy changes on a timely basis. Group management is responsible for ensuring the risk management processes approved by the Audit Committee are implemented across the Group. Group management is also responsible for identifying treasury-related risks, such as currency exposures, that are subsequently managed by Group Treasury, in accordance with the treasury risk management policies contained in the Group Manual. Group management is also responsible for managing the global insurance programme.
51Hunting PLC Annual Report and Accounts 2020
Purpose and C
ultureB
usiness Model and S
takeholdersB
usin
ess Strateg
y P
erformance
Governance
Financial Statem
ents
Risk Managementcontinued
Segment and Business Unit ManagementThe management of each business unit has responsibility for establishing an effective system of controls and processes for its business, which, at a minimum, meets the requirements set out in the Group Manual and complies with any additional local requirements. Local management is empowered under Hunting’s decentralised philosophy to manage the risks in their respective markets.
AssuranceThe Board uses a number of functions and reporting procedures to provide assurance that the risks identified by management are appropriate for the Group as a whole.
Hunting’s Internal Audit department reviews the Group’s businesses covering operational areas including:
• inventory management; • purchasing supply chain; • large project risk; • IT controls; • customer credit risk; and • ethics compliance, including bribery and corruption.
From Q2 2020, the work of the Internal Audit function was curtailed due to the COVID-19 pandemic, with the work of the function shifting to internal control consulting work in respect to the implementation of a new enterprise resource planning system within a number of key businesses.
The Group’s risk management processes are further supported by an internal Quality Assurance department that is headed by the HSE and Quality Assurance Director, who reports directly to the Chief Executive. This department also undertakes periodic audits that monitor quality control and safety within the Group’s product lines and provides regular reports to the Board.
Hunting also receives guidance from a number of external advisers. In particular, guidance from the Group’s insurance broker, who arranges, among other policies, the annual renewal of a worldwide credit insurance policy for the Group. Compliance with the policy requires each business unit to undertake certain procedures, including vetting new customers and maintaining appropriate creditworthiness data that further strengthens the Group’s credit management processes.
Insurance brokers also ensure gaps in cover are identified and in recent years have advised on cyber risk and ongoing weather-related risks.
Hunting’s external auditor provides assurance to the Board regarding the accuracy and probity of Hunting’s consolidated financial statements. The auditor also reviews all of Hunting’s non-financial statements, including governance disclosures included in the Annual Report, and provides observations on the financial controls in operation across the Group based on the external audit.
Hunting’s legal advisers assist the Board in ensuring that Hunting is compliant with the Financial Conduct Authority’s Listing Rules, Disclosure Guidance and Transparency Rules sourcebook and UK Company Law, and that there is an understanding across the Group of its obligations under current sanctions legislation.
Additionally, Hunting relies on market and investor advice from its corporate brokers and financial advisers. The Board is satisfied that the above sources of assurance have sufficient authority, independence and expertise to enable them to provide objective advice and information to the Board and also takes this into account when assessing the robustness of the risk management and control process.
52Hunting PLC Annual Report and Accounts 2020
The Board has reviewed its risk management, principal risks and internal control processes and confirms that the procedures in place are robust and proportionate to Hunting’s global operations and position in its chosen market.
Hunting’s internal control system, which has been in place throughout 2020 and up to the date of approval of these accounts, is designed to identify, evaluate and manage the principal risks to which the Group is exposed, as well as identify and consider emerging risks to which the Group may be exposed in the future. Internal controls are regularly assessed to ensure they remain appropriate and effective.
This system of internal control is designed to manage rather than eliminate risks, therefore it can only provide reasonable but not absolute assurance against material misstatement or loss in the consolidated financial statements and of meeting internal control objectives.
The Directors have reviewed the effectiveness of the Group’s system of internal control and have taken into account feedback from the Audit Committee for the period covered by the consolidated financial statements. No significant failings or weaknesses were identified in the review process.
The key elements to understanding, establishing and assessing Hunting’s internal control system are as follows:
Business Risk ReportingThree times a year, local management formally reviews the specific risks faced by their businesses, based on current trading, future prospects and the local market environment. The review is a qualitative assessment of the likelihood of a risk materialising and the probable financial impact if such an event were to arise. All assessments are performed on a pre- and post-controls basis, which allows management to continually assess the effectiveness of its internal controls with separate regard to mitigating the likelihood of occurrence and the probable financial impact. The risks are reported to Group management.
The local risks that have the greatest potential impact on the Group are identified from these assessments and incorporated into the Group Risk Register, which is also reviewed by the Audit Committee three times a year, and is scrutinised and challenged by the Board. An appropriate executive Director, together with local management, is allocated responsibility for managing each separate risk identified in the Group Risk Register.
Emerging RisksAlongside the process of identifying the Group’s current risks, management is challenged three times a year to identify and consider emerging risks that may impact the Group at some point in the future. As a result, management and the Board have identified climate change as an emerging risk facing the Group.
Climate change is a wide-ranging and complex topic that potentially brings with it a number of interlinked risks that could impact the Group’s activities. The principal driver of revenue for the Group is the global demand for energy drawn from hydrocarbons, the exploration for and production of which generates demand for the majority of the Group’s products. Market observers expect this demand to continue its underlying trend of growth during the medium and long term despite intermittent disruptions such as the COVID-19 pandemic. Climate change has the potential to decelerate the rate of growth in, and eventually reduce, demand for hydrocarbons as governments put more pressure on companies to reduce their emissions and as technology for alternative sources of energy advances. Government targets are set for the medium and long term and alternative energy technology remains a relatively young competitor to hydrocarbons; consequently the Board views climate change as an emerging risk in as far as it has the potential to impact the Group directly.
Climate change also has the potential to impact the Group indirectly. For example, banks and other financial institutions are coming under increasing pressure to implement environmental measures when considering a potential borrower of funds, and more individuals are establishing their own personal targets when considering a potential new employer. The Board does not view these circumstances as a risk in terms of their potential to adversely impact the Group within the next one or two years, but continues to monitor them as situations that are emerging over the medium term.
Management monitors emerging risks through observing press comment including industry-specific journals, discussions with shareholders, advisors, customers and suppliers, attendance at structured forums, review of comments published by other companies, review of insurance company risk assessments, and internal debate by senior executive committees. In December 2020, the Board established a formal Climate Policy. As described in detail on page 31, among other targets the Board has committed to reducing the Group’s carbon dioxide emissions by 10% by 2029 and to reducing the Group’s carbon intensity factor from 37.4 in 2019 to 30 during the same period.
Risk Management Procedures
53Hunting PLC Annual Report and Accounts 2020
Purpose and C
ultureB
usiness Model and S
takeholdersB
usin
ess Strateg
y P
erformance
Governance
Financial Statem
ents

Risk Managementcontinued
Financial Controls Self-assessmentBusiness unit management completes an annual self-assessment of the financial controls in place at their business unit. The assessment is qualitative and is undertaken in context with the recommended controls identified within the Group Manual. Gaps between the recommended controls and those in place are assessed and improvements are actioned within a targeted timeframe when these are identified as a necessary requirement. Results of the assessments are summarised and presented to the Audit Committee annually.
Reporting and ConsolidationAll subsidiaries submit detailed financial information in accordance with a pre-set reporting timetable. This includes weekly, bi-monthly and quarterly treasury reports, annual budgets, monthly management accounts, periodic short-term and mid-term forecasts, together with half year and annual statutory reporting. The Group’s financial accounting consolidation process is maintained and regularly updated, including distribution of the Group Manual to all reporting units. All data is subject to review and assessment by management through the monitoring of key performance indicators and comparison with targets and budgets. The Group monitors and reviews new UK Listing Rules, the Disclosure Guidance and Transparency Rules sourcebook, accounting standards, interpretations and amendments, legislation and other statutory requirements.
Strategic Planning and BudgetingStrategic plans, annual budgets and long-term viability financial projections are formally presented to the Board for adoption and approval and form the basis for monitoring performance.
Quality AssuranceMost of the business sectors in which the Group operates are highly regulated and subsidiaries are invariably required to be accredited by the customer or an industry regulator, to national or international quality organisations. These organisations undertake regular audits and checks on subsidiary procedures and practices, ensuring compliance with regulatory requirements. The Board monitors compliance by receiving Quality Assurance reports at each meeting from the Director of Quality Assurance. The Group has received accreditations from many organisations including the American Petroleum Institute (for example API Spec 5CT and API Spec Q1 certifications), the International Organization for Standardization (for example ISO 9001:2015 and ISO 14001 certifications) and the Occupational Health and Safety Assessment Series (for example OHSAS 18001 certification).
Health, Safety and Environment (“HSE”)All facilities have designated and qualified HSE personnel appointed to ensure the Group’s policies and procedures are adopted and adhered to. All local HSE personnel report to the Group’s HSE and Quality Assurance Director. All facilities arrange regular training and review sessions to ensure day-to-day risks are managed and shared with the wider workforce.
Expenditure Assessment and Approval LimitsAll significant capital investment (business acquisitions and asset purchases) and capital divestment require approval by the Chief Executive up to certain thresholds. Major capital investment or divestment require approval by the Board. Detailed compliance and assurance procedures are completed during a capital investment programme and project reviews and appraisals are completed to compare actual returns achieved with those projected within capital investment proposals.
Updates to the Group’s policies and procedures are communicated to the relevant personnel by way of periodic revisions to the Group Manual, which is issued to all business units.
54Hunting PLC Annual Report and Accounts 2020
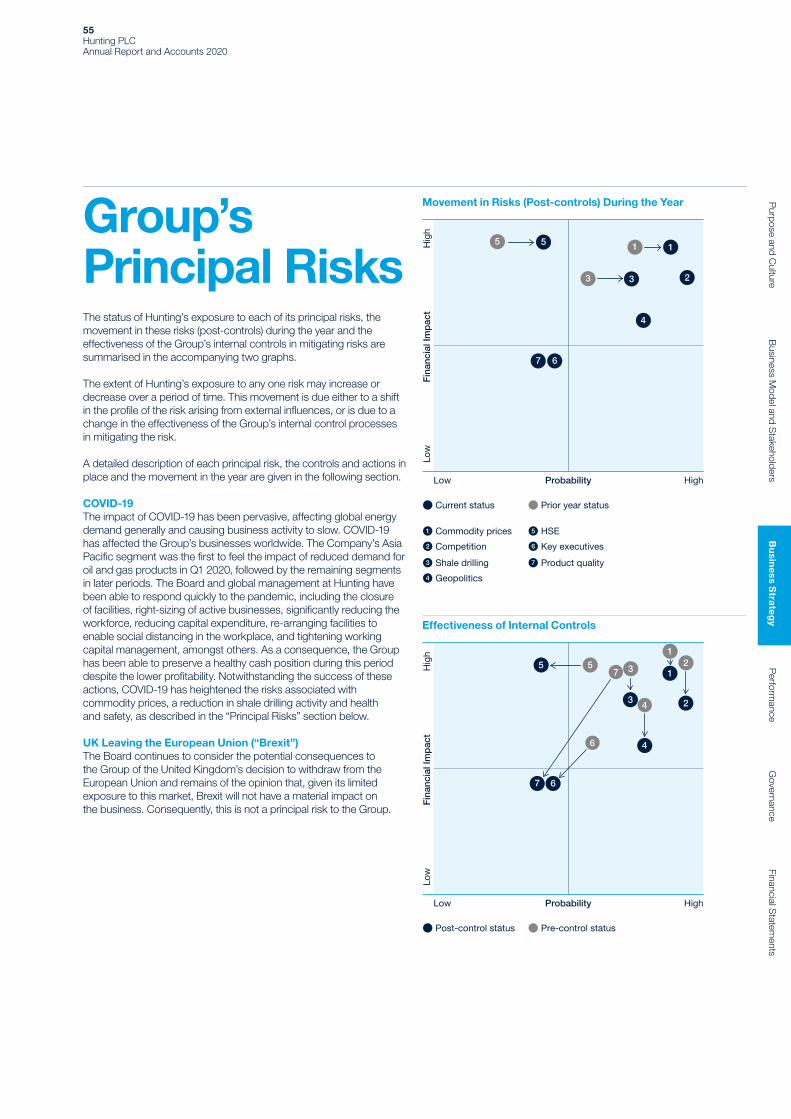
The status of Hunting’s exposure to each of its principal risks, the movement in these risks (post-controls) during the year and the effectiveness of the Group’s internal controls in mitigating risks are summarised in the accompanying two graphs.
The extent of Hunting’s exposure to any one risk may increase or decrease over a period of time. This movement is due either to a shift in the profile of the risk arising from external influences, or is due to a change in the effectiveness of the Group’s internal control processes in mitigating the risk.
A detailed description of each principal risk, the controls and actions in place and the movement in the year are given in the following section.
COVID-19The impact of COVID-19 has been pervasive, affecting global energy demand generally and causing business activity to slow. COVID-19 has affected the Group’s businesses worldwide. The Company’s Asia Pacific segment was the first to feel the impact of reduced demand for oil and gas products in Q1 2020, followed by the remaining segments in later periods. The Board and global management at Hunting have been able to respond quickly to the pandemic, including the closure of facilities, right-sizing of active businesses, significantly reducing the workforce, reducing capital expenditure, re-arranging facilities to enable social distancing in the workplace, and tightening working capital management, amongst others. As a consequence, the Group has been able to preserve a healthy cash position during this period despite the lower profitability. Notwithstanding the success of these actions, COVID-19 has heightened the risks associated with commodity prices, a reduction in shale drilling activity and health and safety, as described in the “Principal Risks” section below.
UK Leaving the European Union (“Brexit”)The Board continues to consider the potential consequences to the Group of the United Kingdom’s decision to withdraw from the European Union and remains of the opinion that, given its limited exposure to this market, Brexit will not have a material impact on the business. Consequently, this is not a principal risk to the Group.
Movement in Risks (Post-controls) During the Year
5
67
3
5 1
3 2
4
1
Low Probability High
Current status
Low
Fin
anci
al Im
pac
t H
igh
Prior year status
Commodity prices1 HSE5
Competition2 Key executives6
Shale drilling3 Product quality7
Geopolitics4
Effectiveness of Internal Controls
4
75 5 3
67
3 2
4
21
1
6
Low Probability High
Low
Fin
anci
al Im
pac
t H
igh
Post-control status Pre-control status
Group’s Principal Risks
55Hunting PLC Annual Report and Accounts 2020
Purpose and C
ultureB
usiness Model and S
takeholdersB
usin
ess Strateg
y P
erformance
Governance
Financial Statem
ents
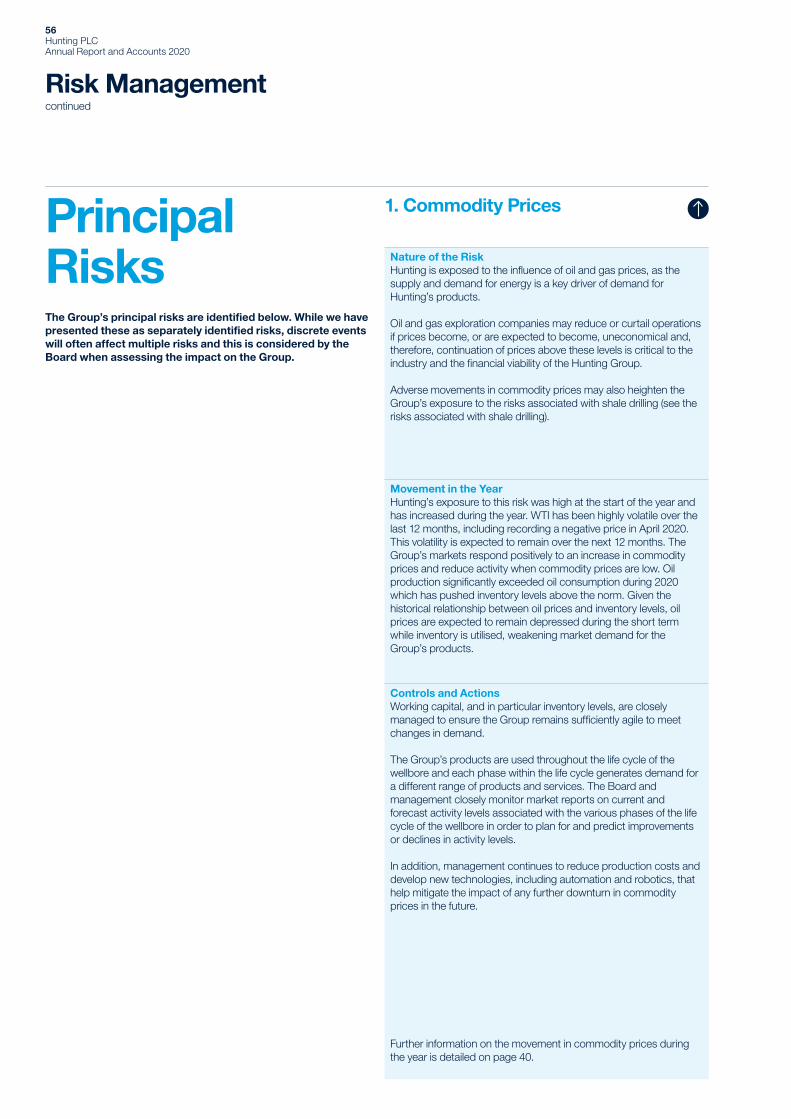
Risk Managementcontinued
1. Commodity Prices
Nature of the RiskHunting is exposed to the influence of oil and gas prices, as the supply and demand for energy is a key driver of demand for Hunting’s products.
Oil and gas exploration companies may reduce or curtail operations if prices become, or are expected to become, uneconomical and, therefore, continuation of prices above these levels is critical to the industry and the financial viability of the Hunting Group.
Adverse movements in commodity prices may also heighten the Group’s exposure to the risks associated with shale drilling (see the risks associated with shale drilling).
Movement in the YearHunting’s exposure to this risk was high at the start of the year and has increased during the year. WTI has been highly volatile over the last 12 months, including recording a negative price in April 2020. This volatility is expected to remain over the next 12 months. The Group’s markets respond positively to an increase in commodity prices and reduce activity when commodity prices are low. Oil production significantly exceeded oil consumption during 2020 which has pushed inventory levels above the norm. Given the historical relationship between oil prices and inventory levels, oil prices are expected to remain depressed during the short term while inventory is utilised, weakening market demand for the Group’s products.
Controls and ActionsWorking capital, and in particular inventory levels, are closely managed to ensure the Group remains sufficiently agile to meet changes in demand.
The Group’s products are used throughout the life cycle of the wellbore and each phase within the life cycle generates demand for a different range of products and services. The Board and management closely monitor market reports on current and forecast activity levels associated with the various phases of the life cycle of the wellbore in order to plan for and predict improvements or declines in activity levels.
In addition, management continues to reduce production costs and develop new technologies, including automation and robotics, that help mitigate the impact of any further downturn in commodity prices in the future.
Further information on the movement in commodity prices during the year is detailed on page 40.
Principal RisksThe Group’s principal risks are identified below. While we have presented these as separately identified risks, discrete events will often affect multiple risks and this is considered by the Board when assessing the impact on the Group.
56Hunting PLC Annual Report and Accounts 2020

2. Competition
Nature of the RiskThe provision of goods and services to oil and gas drilling companies is highly competitive. In current market conditions, pricing pressures remain a feature of the trading environment. Competitors may also be customers and/or suppliers, which can increase the risk of any potential impact.
Technological advancements in the oil and gas industry continue at pace and failure to keep ahead will result in lost revenues and market share.
Looking further ahead, advancements in alternative energy sources are considered a risk to the oil and gas market in the long term.
Movement in the YearDuring the year, the competitive environment within the markets that Hunting serves remained strong and, therefore, Hunting’s exposure to this risk is unchanged since last year.
Controls and ActionsHunting has a number of high specification proprietary products that offer operational advantages to its customers. The Group continually invests in research and development that enables it to provide technological advancement and a strong, ever-widening, product offering. Hunting continues to maintain its standards of delivering high quality products, which has gone some way in sheltering the pricing pressure impact on margins.
Hunting’s operations are established close to their markets, which enables the Group to offer reduced lead-times and a focused product range appropriate to each region. Local management maintains an awareness of competitor pricing and product offering. In addition, senior management maintains close dialogue with key customers and seeks to maintain the highest level of service to preserve Hunting’s reputation for quality. The Group has a wide customer base that includes many of the major oil and gas service providers and no one customer represents an overly significant portion of Group revenue. In addition, the Group is widening its product offering beyond the oil and gas market, as detailed within the Chief Executive’s Report on pages 36 to 39.
The Group’s operating activities are described in detail on pages 10 to 33.
3. US Shale Drilling
Nature of the RiskThe Group provides products to the oil and gas shale drilling industry. Oil and gas produced from US onshore shale remains a relatively expensive source of hydrocarbons, despite advances in technology that have reduced these costs.
Consequently, shale drilling is more sensitive to a decline in commodity prices compared with conventional sources, so it is more likely to be curtailed and therefore negatively impact what has become a steadily increasing revenue stream for the Group (see the risks associated with commodity prices).
Movement in the YearShale drilling activity significantly slowed during 2020 due to the low oil price and the impact of the COVID-19 pandemic, leading to management implementing actions to align the Group’s cost base with prevailing market conditions. Although some market observers have stated that they believe the market has bottomed out, there remains uncertainty over the timing and rate of recovery of the oil and gas industry. Consequently the potential for a protracted reduction in shale drilling activity has heightened the Group’s exposure to an adverse impact on future results and cash flows.
Controls and ActionsThe Board monitors rig count and general completion activities within the US shale industry. In addition, local management maintains an ongoing dialogue with key customers operating within the US market.
The Group maintains a diverse portfolio of products that extends beyond supplying the shale drilling industry, including products for conventional drilling and the manufacture of high-precision and advanced technology components for both the onshore and offshore markets.
Many of the Group’s facilities have the flexibility to reconfigure their manufacturing processes to meet a change in the pattern of demand. Please refer to the “COVID-19” section above.
The Group’s operating activities are described in detail on pages10 to 33.
No movement in risk
Increase in risk
Decrease in risk
57Hunting PLC Annual Report and Accounts 2020
Purpose and C
ultureB
usiness Model and S
takeholdersB
usin
ess Strateg
y P
erformance
Governance
Financial Statem
ents

Risk Managementcontinued
4. Geopolitics
Nature of the RiskThe location of the Group’s markets are determined by the location of Hunting’s customers’ drill sites – Hunting’s products must go where the drilling companies choose to operate. To compete effectively, Hunting often establishes a local operation in those regions; however, significantly volatile environments are avoided.
The Board has a strategy to develop its global presence and diversify geographically.
Operations have been established in key geographic regions around the world, recognising the high growth potential these territories offer. The Group carefully selects from which countries to operate, taking into account the differing economic and geopolitical risks associated with each geographic territory.
Movement in the YearGeopolitical issues remain a feature of the modern world in which the Hunting Group operates. The Board monitors geopolitical events around the world through media channels and industry contacts and assesses these relative to Hunting’s operations. The scale and nature of these geopolitical issues, in how they have the potential to impact the Company’s operations and markets, have not significantly changed over the past year.
Furthermore, the Group has very little exposure to exports between the UK and European markets and consequently the Board believes that the economic uncertainties associated with Brexit will not have a material adverse impact on the Group’s trading activities.
Controls and ActionsAreas exposed to high political risk are noted by the Board and are strategically avoided. Global sanctions are also closely monitored with compliance procedures in place to ensure Hunting avoids high risk countries or partners. The Board and Management closely monitor projected economic trends in order to match capacity to regional demand.
The Group’s exposure to different geographic regions is described on page 19.
5. Health, Safety and the Environment (“HSE”)Nature of the RiskDue to the wide nature of the Group’s activities, it is subject to a relatively high number of HSE risks and the laws and regulations issued by each of the jurisdictions in which the Group operates.
The Group’s exposure to risk therefore includes the potential for the occurrence of a reportable incident, the financial risk of a breach of HSE regulations, and the risk of unexpected compliance expenditure whenever a law or regulation is renewed or enhanced.
HSE risk escalated during the year due to COVID-19 which started to impact operations at the start of 2020. The Group, its customers and its suppliers are dependent on personal interaction which has the potential to disrupt, or even close, business operations if personnel become unavailable due to the pandemic.
Movement in the YearThe Group experienced a number of minor HSE incidents in the year, which is significantly below the industry average and is similar to the Group’s record in prior years. This particular risk therefore continues to be low.
However, the incidence of COVID-19 has heightened the overall risk to HSE.
Controls and ActionsThe Board targets achieving a record of nil incidents and full compliance with the laws and regulations in each jurisdiction in which the Group operates.
Every Group facility is overseen by a Health and Safety officer with the responsibility for ensuring compliance with current and newly issued HSE standards.
The Board receives a Group HSE compliance report at every Board meeting.
The Group’s facilities have rescheduled work patterns and reconfigured unit layouts to enable appropriate social distancing measures. Staff have been encouraged to work from home where this is possible.
The Group’s HSE performance is detailed on pages 27 and 28.
58Hunting PLC Annual Report and Accounts 2020

No movement in risk
Increase in risk
Decrease in risk
6. Key Executives
Nature of the RiskThe Group is highly reliant on the continued service of its key executives and senior management who possess commercial, engineering, technical and financial skills that are critical to the success of the Group.
Movement in the YearThe risk is unchanged from last year. The Group has fair and balanced remuneration schemes in place which attract and retain executive management.
Controls and ActionsRemuneration packages are regularly reviewed to ensure that key executives are remunerated in line with market rates. External consultants are engaged to provide guidance on best practice.
Senior management regularly reviews the availability of the necessary skills within the Group and seeks to engage suitable staff where they feel there is vulnerability.
Details of executive Director remuneration are provided in the Remuneration Committee Report on pages 93 to 118.
7. Product Quality
Nature of the RiskThe Group has an established reputation for producing high quality products capable of withstanding the hostile and corrosive environments encountered in the wellbore.
A failure of any one of these products could adversely impact the Group’s reputation and demand for the Group’s entire range of products and services.
Movement in the YearThe risk of poor product quality or reliability has remained unchanged during the year, with no significant issues raised by the Group’s customers or during the Board’s internal monitoring process.
Controls and ActionsQuality assurance standards are monitored, measured and regulated within the Group under the authority of a Quality Assurance Director who reports directly to the Chief Executive.
The Group’s commitment to product quality is detailed on page 17.
59Hunting PLC Annual Report and Accounts 2020
Purpose and C
ultureB
usiness Model and S
takeholdersB
usin
ess Strateg
y P
erformance
Governance
Financial Statem
ents
Group Review
Management has had a clear strategy of retaining a strong cash position in recent years, which provided a resilient buffer against this market decline.”
Bruce FergusonFinance Director
Jim JohnsonChief Executive
60Hunting PLC Annual Report and Accounts 2020

IntroductionThe COVID-19 pandemic led to global mobility being brought to a near standstill in early Q2 2020, with daily crude oil demand declining by c.30 million barrels of oil per day as over 180 countries introduced containment measures to slow the spread of the virus. Almost overnight onshore drilling operations in North America came to a near-halt in response to the drop in daily oil demand, which impacted the Group’s Hunting Titan, Drilling Tools and Specialty businesses immediately. Following this, offshore and international drilling activity reduced throughout the balance of the year, which led to activity declining in our businesses outside of North America.
Market SummaryAs detailed in the Market Review, the US onshore rig count declined from an average of 920 active units in 2019 to a low point of 241 units recorded in Q3 2020. The average US offshore rig count, for the year as a whole, was 16 units, or a year-on-year decline of 30%. While the low point in US onshore activity was reached around the middle of the year, US offshore and international drilling activity slowed from Q2 2020 which impacted our non-US businesses. The international rig count averaged 754 units in 2020 which was a year-on-year decline of 25%.
These key performance indicators underline the market shock seen in 2020, which adversely impacted Hunting’s 2020 Full Year Results. The trading losses reported, coupled with the impairments recorded against the carrying values of our assets, have been significant; however, management has had a clear strategy of retaining a strong cash position in recent years, which provided a resilient buffer against this market decline. Efforts to reduce working capital, specifically inventory, have been successful, which has supported good cash generation in the year leading to a closing total cash and bank position of $101.7m (2019 – $127.0m) (note 26).
As Hunting enters a new year, it does so with a leaner operating structure, poised to capitalise on any growth opportunities presented.
Results from OperationsThe Group reports a 35% decrease in revenue to $626.0m (2019 – $960.0m) given the prevailing market conditions since the start of Q2 2020.
Group Segment Summary
Business unit
2020 2019
Segmentrevenue
$m
Underlyingi result from operations
$m
Reportedi result from operations
$m
Segmentrevenue
$m
Underlyingi result from operations
$m
Reportedi result from operations
$m
Hunting Titan 161.7 (5.6) (126.0) 375.5 68.6 42.1US 292.2 (1.0) (47.3) 363.2 26.9 5.9Canada 20.0 (2.5) (14.7) 35.7 (4.3) (4.3)Europe, Middle East and Africa 78.8 (12.0) (33.9) 123.0 (1.3) (1.3)Asia Pacific 109.3 4.7 1.9 146.3 4.4 4.4Inter-segment elimination (36.0) – – (83.7) – –Group segment total 626.0 (16.4) (220.0) 960.0 94.3 46.8
i. Results for the year, as reported under IFRS, adjusted for amortisation of acquired intangible assets and exceptional items.
Revenue within the Hunting Titan segment declined 57% from $375.5m to $161.7m as onshore activity levels in the US and Canada slowed in Q2 2020. As the year progressed, the segment reported steadily improving revenue, leading to a broadly break-even trading result by the close of the year.
The US segment, which contains the Group’s widest product offering, and which services both offshore and onshore drilling markets, recorded a 20% decline in segment revenue in the year. Offsetting the overall decline, our Subsea businesses have reported good year-on-year revenue growth, supported by our recent acquisitions, which includes Enpro Subsea that was acquired in February 2020.
In the year, management decided to close its manufacturing operations in Canada, given the historical losses reported and the long-term outlook for the region. While the Group still has a presence in Canada through Hunting Titan, our OCTG business interests will be managed from the US going forward, with local requirements being supported by a number of partners who have been provided with threading licenses for Hunting’s proprietary connection technologies.
The Group’s EMEA segment started the year with a broadly positive outlook. However, from Q2 2020 the speed of project deferrals and cancellations accelerated leading to losses being reported in the year.
The Group’s Asia Pacific segment was the first area of the Group’s operations to be impacted by the COVID-19 pandemic. The segment did, however, recover leading to an underlying profit in the year. As the year progressed, more project deferrals and cancellations were recorded, as continuing market uncertainty led to increased caution with client capital expenditures.
The impact of the market downturn and the revenue decline seen across most businesses led to a reduction in the Group’s gross margin from 28% to 20%, largely due to reduced volumes leading to the under absorption of a proportion of costs, and some challenges on pricing. Underlying gross profit declined 53% from $266.4m in 2019 to $124.8m in 2020.
As a consequence of this performance, the Group reports an underlying loss from operations of $16.4m (2019 – $94.3m profit), despite c.$86.0m of annualised cost savings being realised in the year. The underlying operating margin decreased from 10% in 2019 to -3% in 2020.
61Hunting PLC Annual Report and Accounts 2020
Purpose and C
ultureB
usiness Model and S
takeholdersB
usiness Strategy
Perfo
rman
ceG
overnanceFinancial S
tatements

Group Review continued
The declines recorded in the Group’s core markets led to a detailed review of the carrying values of the Group’s current and non-current assets. During the year, the Group recorded the following exceptional impairments to assets at the half and full year:
Exceptional Impairments
H1 2020
$m
H2 2020
$m
Full year 2020
$m
Property, plant and equipment1,2 19.3 0.1 19.4Right-of-use assets2 2.1 2.0 4.1Goodwill2 79.8 – 79.8Other intangible assets2 39.2 – 39.2Inventories1 33.3 0.9 34.2Receivables2 1.2 – 1.2Total 174.9 3.0 177.9
Notes: 1. Charged to cost of sales. 2. Charged to operating expenses.
In the Group’s 2020 Half Year Results, the Group recorded $174.9m of impairments to inventory, property, plant and equipment, goodwill, other intangible assets, right-of-use assets and receivables. The charges reflect a significant reduction to the medium-term trading outlook for most of the Group’s businesses, driven by market projections published at the low point in global industry activity in Q2/Q3 2020.
Given the more stable trading environment seen in the second half of the year, albeit at significantly reduced levels from the start of 2020, a further $3.0m of net impairments were charged to inventory, property, plant and equipment and right-of-use assets, the latter charge being the most significant, and reflects a further revision to the carrying value of the lease held in Calgary, Canada, given the decision to close down operations.
These impairment charges have been recorded as “middle-column” items. Amortisation of acquired intangible assets and other exceptional items recorded in the year are also summarised in the table below.
Amortisation and Other Exceptional Items
H1 2020
$m
H2 2020
$m
Full year 2020
$m
Amortisation of acquired intangible assets 12.3 5.0 17.3Impairments 174.9 3.0 177.9Restructuring costs 3.4 6.9 10.3Acquisition costs 1.2 0.2 1.4Reversal of contingent consideration (2.5) – (2.5)Profit on disposal of Canadian assets – (0.8) (0.8)Total 189.3 14.3 203.6
The charges for the amortisation of acquired intangible assets and exceptional items recorded within the Group’s 2020 Half Year Results totalled $189.3m. In H2 2020, the Group recorded further net impairment charges of $3.0m, restructuring costs of $6.9m, amortisation of acquired intangible assets of $5.0m and acquisition costs of $0.2m. These charges have been offset by the $0.8m profit on the disposal of assets held in Canada, and which relate to the winding down of operations in Calgary.
The total charge for amortisation of acquired intangible assets and exceptional items was therefore $203.6m in 2020.
In 2019, the charge in the year for the amortisation of intangible assets totalled $28.5m, and impairment charges totalled $19.0m, which was wholly related to the Group’s US Drilling Tools business unit.
The reported loss from operations in 2020 was, therefore, $220.0m (2019 – $46.8m profit).
The net finance expense during the year was $3.0m (2019 – $1.2m), the increase predominantly due to foreign exchange movements, leading to an underlying loss before tax of $19.4m (2019 – $93.1m profit). After the “middle column” charges noted above, which totalled $203.6m (2019 – $47.5m), the reported loss before tax was $223.0m (2019 – $45.6m profit).
The Group’s underlying effective tax rate (“ETR”) for 2020 was 5% and the reported ETR was -7%, following the “middle-column” items charged, which included the reversal of the recognition of deferred tax assets held in the US. The 2019 underlying tax rate was 18%, while the reported tax rate was 9%. The Group’s ETR is significantly different to that which might be expected from prevailing jurisdictional rates as it is impacted by a mix of profits and losses in different businesses and is distorted when deferred tax is not fully recognised in loss making jurisdictions.
The underlying loss after tax was therefore $18.5m (2019 – $76.1m profit) and the reported loss after tax was $238.2m (2019 – $41.4m profit).
Underlying diluted loss per share in the year was 10.0 cents (2019 – 43.9 cents earnings per share). Reported diluted loss per share was 143.2 cents (2019 – 23.5 cents earnings per share).
Cash Flow
Summary Group Cash Flow2020
$m2019
$m
Underlying EBITDA (NGM A) 26.1 139.7Add: share-based payments 9.0 9.1
35.1 148.8Working capital movements (NGM H) 38.8 7.6Net tax paid (5.0) (7.7)Proceeds from business and asset disposals 3.9 8.9Gains on business and asset disposals (2.4) (5.8)Lease payments (10.4) (10.6)Restructuring costs (10.7) –Other (NGM J) (1.5) (2.4)Free cash flow (NGM K) 47.8 138.8Capital investment (NGM I) (14.7) (36.0)Intangible asset investments (4.3) (10.2)Acquisition of business (34.2) (12.5)Dividends paid to Hunting PLC shareholders and NCI (9.1) (16.6)Net purchase of treasury shares (9.2) (4.7)Share buyback (5.1) –Share capital issued – 0.6Net cash flow (28.8) 59.4Foreign exchange 3.5 2.4Movement in total cash and bank (note 26) (25.3) 61.8
62Hunting PLC Annual Report and Accounts 2020

Hunting reported an underlying EBITDA of $26.1m (2019 – $139.7m) that, when adjusted for non-cash share-based payment charges, resulted in a cash inflow of $35.1m. This was substantially lower than the $148.8m generated in 2019 reflecting the significantly worse trading conditions described above. During the year, there was an inflow of working capital totalling $38.8m (2019 – $7.6m). In this weaker trading environment, receivables reduced by $67.5m despite an increase in receivable days to 92 days from 79 days at December 2019 (NGM E), as some customers extended terms and COVID-19 impacted collection activity. Inventory, after adjusting for increased provisions in the year, has impacted cash flow favourably by $30.2m. In the first half of the year, Hunting honoured material purchase commitments made prior to the downturn, but in the second half we were able to adjust to the lower activity levels and achieve good reductions. Inventory levels are still comparatively high with inventory days at 270 days (2019 – 214 days) (NGM D). These benefits were offset by the reduction in trade and other payables of $58.9m. Although there is an element of seasonality in the Group’s operations, the overall impact of this on working capital and liquidity is not considered significant.
Net tax paid in the period was $5.0m, compared to $7.7m in 2019.
Proceeds from the disposal of assets and businesses totalled $3.9m (2019 – $8.9m). 2019 included the disposal of the Middle East Thru Tubing business, which totalled $2.4m, and also the sale of the Clear-Run technology for $2.3m.
During the year, $10.4m (2019 – $10.6m) was paid in relation to the Group’s lease arrangements.
Restructuring costs paid totalled $10.7m in the year, reflecting the facility closures noted above and reductions in headcount.
As a result of the above, free cash flow recorded a net inflow of $47.8m (2019 – $138.8m).
Capital investment totalled $14.7m in the year (2019 – $36.0m), reflecting the curtailing of expenditure to conserve cash. Investments completed in the year were limited to committed projects and included Hunting Titan’s detonating cord manufacturing facility at Milford, Texas, and investments in property, plant and equipment principally in the US, in Asia Pacific and in the Middle East.
Intangible asset investment was $4.3m (2019 – $10.2m), with $2.3m relating to software development and the balance on research and development costs of new products and technology. During 2019, intangible asset spend largely related to technology and software development.
On 21 February 2020, the Group purchased Enpro Subsea Limited (“Enpro”) for a cash consideration of $32.8m, excluding cash acquired of $5.5m. Acquisition costs paid in the year were $1.4m.
Dividends paid to Hunting PLC shareholders in the year totalled 5.0 cents per share (2019 – 10.0 cents), which absorbed $8.2m (2019 – $16.6m). A dividend of $0.9m (2019 – $nil) was also paid to non-controlling interests in the year. A 2020 Final Dividend totalling 4.0 cents per share has been proposed by the Board, which will be paid on 14 May 2021, subject to approval by shareholders at the Company’s Annual General Meeting.
In 2020, the Company purchased 2.0m Ordinary shares through its corporate broker, for a total consideration of $5.1m as part of a share buyback programme. These Ordinary shares were subsequently cancelled, thus reducing the Company’s issued share capital.
A further 2.7m Ordinary shares were purchased in the year as treasury shares through Hunting’s Employee Benefit Trust for a total consideration of $9.4m. These shares will be used to satisfy future awards under the Group’s share award programme.
Overall, in the year, the Group recorded a net cash outflow of $28.8m (2019 – $59.4m inflow).
As a consequence of the above cash flows and $3.5m (2019 – $2.4m) foreign exchange movements, total cash and bank (note 26) was $101.7m at the year-end (31 December 2019 – $127.0m).
Balance Sheet
Summary Group Balance Sheet2020
$m2019
$m
Property, plant and equipment 307.1 354.7Right-of-use assets 29.8 36.7Goodwill 164.2 230.2Other intangible assets 42.9 78.5Working capital (NGM C) 358.3 433.3Taxation (current and deferred) 6.0 19.8Provisions (8.9) (8.4)Other net assets (NGM F) 19.7 1.1Capital employed (NGM G) 919.1 1,145.9 Total cash and bank 101.7 127.0 Lease liabilities (40.3) (45.2) Shareholder loan from NCI (3.9) (3.9)Net cash (note 26) 57.5 77.9Net assets 976.6 1,223.8Equity shareholders’ funds 964.4 1,207.9Non-controlling interests 12.2 15.9Total equity 976.6 1,223.8
Property, plant and equipment was $307.1m at 31 December 2020. Additions of $20.6m, which included assets purchased as part of the Enpro acquisition of $5.8m, were offset by depreciation of $32.1m, impairment charges of $19.4m, disposals of businesses of $14.7m and other items of $2.0m. The majority of the impairment occurred in our UK Well Intervention and US Drilling Tools businesses, which were recorded within the Group’s 2020 Half Year Results. On 15 December 2020, the Group announced the divestment of the business and assets of its US Drilling Tools business to Rival Downhole Tools LC, leading to a reduction of $14.7m to PPE.
Right-of-use assets totalled $29.8m at 31 December 2020 compared to $36.7m at 31 December 2019. The movement during the year included additions of $1.9m as new lease arrangements were entered into, a further addition of $0.3m as part of the Enpro acquisition, modifications of $1.4m and foreign exchange movements of $0.5m, offset by depreciation of $7.5m and net impairment of $3.5m, leading to an overall decline of $6.9m being recorded. The impairment and modification both largely relate to the proposed closure of the Group’s Canada manufacturing facility.
63Hunting PLC Annual Report and Accounts 2020
Purpose and C
ultureB
usiness Model and S
takeholdersB
usiness Strategy
Perfo
rman
ceG
overnanceFinancial S
tatements
Group Review continued
Goodwill reduced by $66.0m to $164.2m at the balance sheet date compared to the 2019 year-end position of $230.2m. Additional goodwill of $13.4m was recognised following the acquisition of Enpro. As part of the accounts preparation at the half year, an asset impairment review was completed, with the carrying value of goodwill being written down by $79.8m, comprising $65.6m in respect of Hunting Titan and $14.2m in respect of other business units. A similar exercise was completed as part of the preparation of the 2020 year-end accounts, with no further impairments to goodwill being recorded. $114.9m of goodwill in respect of Hunting Titan remains following the impairment exercise.
Other intangible assets (“OIA”) have reduced by $35.6m to $42.9m at 31 December 2020. The amortisation charge for intangible assets totalled $20.8m (2019 – $32.3m) and the impairment charge totalled $39.2m (2019 – $nil). The impairment charge recorded in the year mainly comprises the write-off of customer relationships related to the Hunting Titan acquisition, following declines in revenue and profitability, and some smaller impairments for internally developed technology across the Group’s perforating, OCTG and well intervention production lines. The total reduction to OIA was offset by additions of $19.2m that were recognised following the acquisition of Enpro, $4.3m on internal development of new products and software systems and $0.9m foreign exchange movements.
Working capital (NGM C) reduced by $75.0m, with the balance at 31 December 2020 being $358.3m (2019 – $433.3m). Reflecting the more challenging market conditions, trade and other receivables declined by $65.3m, reducing working capital, despite a worsening of receivable days from 79 at December 2019 to 92 at the year-end (NGM E). Net inventory also reduced by $62.4m mainly due to impairments of $36.4m and stock being worked off generating cash inflows of $30.2m. Purchases of stock in the year were lower due to lower activity levels. Trade and other payables also reduced, with the balance falling by $52.7m to $68.0m, thereby increasing working capital.
Current and deferred taxation recorded a net asset of $6.0m compared to 2019, which recorded a $19.8m net asset. The reduction was mainly due to the de-recognition of US deferred tax assets of $21.5m.
Provisions increased to $8.9m (2019 – $8.4m) in the year. Other net assets increased by $18.6m to $19.7m (2019 – $1.1m) mainly due to the $17.4m associate investment in Rival.
As a result of the above changes, capital employed in the Group decreased by $226.8m to $919.1m. The underlying return on average capital employed was -2% in 2020 compared to 8% in 2019 (NGM N).
Net cash (note 26) at 31 December 2020 was $57.5m (2019 – $77.9m). Total cash and bank balances reduced by $25.3m, as described above, to $101.7m. Net cash includes $40.3m of lease liabilities, which have decreased by $4.9m during the year.
Total equity at 31 December 2020 was $976.6m, which, after non-controlling interests of $12.2m, resulted in equity shareholders’ funds of $964.4m (2019 – $1,207.9m). This is a decrease of $243.5m over 31 December 2019 and reflects the reported loss for the year attributable to equity shareholders of $234.7m; dividends paid of $8.2m; the share buyback of $5.3m; and the net purchase of treasury shares of $9.2m being offset by a net $8.3m credit in relation to share awards and foreign exchange gains and other credits of $5.6m.
Financial Capital ManagementHunting ended 2020 with a robust balance sheet and a total cash and bank balance of $101.7m (2019 – $127.0m). There has been no material movement in the Group’s liquidity position from the year-end to the date of signing these accounts.
While the Group maintained a healthy total cash and bank balance throughout the year, the Group retained its $160m multi-currency revolving credit facility, with the bank covenants and terms remaining unchanged. These terms, which exclude the impact of IFRS 16 adoption for covenant testing purposes, include:
• The ratio of net debt to consolidated EBITDA permitted under the revolving credit facility must not exceed a multiple of three times; and
• Consolidated EBITDA must also cover relevant finance charges by a minimum of four times.
There were no drawdowns on the revolving credit facility in the year.
For covenant testing purposes, the Group’s definition of EBITDA is adjusted to exclude exceptional items, include the share of associates’ post-tax results and exclude the fair value charge for share awards. Similarly, net cash/debt and finance expenses are adjusted to accord with the definition within the facility agreement and accordingly exclude the lease liabilities recognised following the adoption of IFRS 16. EBITDA, for covenant test purposes, is based on the previous 12-month period, measured twice yearly at 30 June and 31 December. At 31 December 2020, both these covenants were met.
The Group’s $160m committed revolving credit facility has a maturity date of 2022. The facility includes an accordion feature that allows for the facility to be increased to $235m, subject to the approval of its lending group. The facility also includes a provision to extend the maturity date to 2023. The Group’s funding position remains robust, with total borrowing facilities of $164.2m in place (2019 – $164.2m), of which $160.0m (2019 – $160.0m) is committed.
Further details of the facility, including the terms and conditions, are in note 30.
Capital employed is managed in order to ensure an appropriate level of financing is available for the Group’s day-to-day operations. The balance of debt and equity is managed having due regard to the respective cost of funds and their availability.
The Group operates a centralised treasury function, with policies and procedures approved by the Board. These cover funding, banking relationships, foreign currency, interest rate exposures and cash management, together with the investment of surplus cash.
64Hunting PLC Annual Report and Accounts 2020
The Group operates in a number of geographic territories and results are generated in a number of different currencies. The US dollar is the most significant functional currency; however, where this is not the case, the Group is subject to the effects of foreign exchange rate fluctuations with respect to currency conversions. Individual entities are generally required to borrow from the central treasury function in their functional currency. The treasury function’s strategy is to manage its own currency exposure by using foreign exchange swaps to convert US dollars into the different currencies required by the entities. Spot and forward foreign exchange contracts are also used to mitigate the exposure caused by purchases and sales in non-functional currencies. The Group’s liquidity is monitored by the central treasury function on a daily basis and a variety of cash forecasts, looking at different time horizons, are prepared on a periodic basis. Management’s judgement is that the level of headroom available under the Group’s total credit facilities provides ongoing flexibility and continues to support the business as outlined in this Strategic Report. Further detail on financial risks is provided within note 30.
On behalf of the Board
Jim JohnsonChief Executive
Bruce FergusonFinance Director
4 March 2021
65Hunting PLC Annual Report and Accounts 2020
Purpose and C
ultureB
usiness Model and S
takeholdersB
usiness Strategy
Perfo
rman
ceG
overnanceFinancial S
tatements

Segmental Review
IntroductionHunting Titan’s business focuses predominantly on the US and Canadian onshore drilling and completion markets. The segment normally manufactures from five main operating sites, four in the US and one in Mexico. In the year, the operating site at Oklahoma City was mothballed, due to the downturn in the global oil and gas market, with orders being transferred to other sites.
Hunting Titan has a network of distribution centres throughout the US and Canada, from which the majority of the business’ sales are derived. As the year progressed, a number of centres were closed to align with prevailing market conditions, caused by the COVID-19 pandemic.
In more stable market conditions, Hunting Titan utilises the global manufacturing footprint of the wider Group to assist in meeting customer demand. In the year, this practice was reduced as market conditions deteriorated.
Market OverviewAs detailed in the Market Review, 2020 commenced with management anticipating a slowdown in the North American onshore drilling market.
As the impact of COVID-19 was felt across the Group’s operations from Q2 2020 this decline in activity accelerated rapidly, leading to a significant slowing of onshore drilling operations. Average US onshore rig counts reduced from 920 in 2019 to a low point average of 241 active units in Q3 2020, reflecting the speed of contraction across the industry. The average rig count did, however, rise to 294 during Q4 as the market stabilised.
In Canada, the average rig count declined by 33% to 90 units from 134 units in 2019.
Drilling and completion expenditure also declined during the year as operators rapidly aligned with the lower oil price, with US onshore capital expenditures reducing 56% to $49.4bn, and Canadian drilling expenditure reducing 38% to $7.6bn.
These market conditions, which predominantly occurred from Q2 2020, led to a material decline in the performance of the business during the year. However, management noted that the US onshore market reached the low point around mid-year and subsequently recorded increases in activity levels through the balance of the year, as rig counts stabilised and the number of active frac units returned to growth.
Segment Performance Segment revenue decreased 57% to $161.7m (2019 – $375.5m). Given this material decline, the business reports an underlying operating loss of $5.6m compared to an underlying profit of $68.6m in 2019.
During the year, Hunting Titan’s international sales were $22.2m (2019 – $23.6m) reflecting a more resilient performance compared to the US market. This performance is due in part to the increase in customer interest in the Group’s various product lines in the Middle East, Asia Pacific, and in particular, China.
As noted in the Chief Executive’s Report and Group Review, as part of the preparation of the half year and year-end accounts, a review of the carrying values of the current and non-current assets was completed in the year, leading to a “middle column” charge of $120.4m (2019 – $26.5m) being recorded, which includes the amortisation of acquired intangible assets. The reported loss from operations was therefore $126.0m (2019 – $42.1m profit).
2020 2019
Market Indicators*US onshore – average rig count # 419 920Canada – average rig count # 90 134
RevenuePerforating guns and hardware $m 48.8 116.6Energetics $m 41.6 102.2Instruments $m 60.6 140.4Perforating Systems $m 151.0 359.2Other product lines $m 6.0 12.0External revenue $m 157.0 371.2Inter-segment revenue $m 4.7 4.3Segment revenue $m 161.7 375.5
Profitability Reported operating (loss) profit $m (126.0) 42.1Acquisition amortisation and exceptional items $m 120.4 26.5Underlying operating (loss) profit $m (5.6) 68.6Underlying operating margin % (3) 18
Other Financial MeasuresCapital investment $m 3.9 14.3Property, plant and equipment $m 57.6 60.4Inventory $m 105.9 123.2
Operational Headcount (year-end) # 380 702Headcount (average) # 481 684Operating sites # 4 5Service and distribution centres # 14 17Operational footage Kft2 613 696
* Source – Spears and Associates.
Hunting Titan
66Hunting PLC Annual Report and Accounts 2020
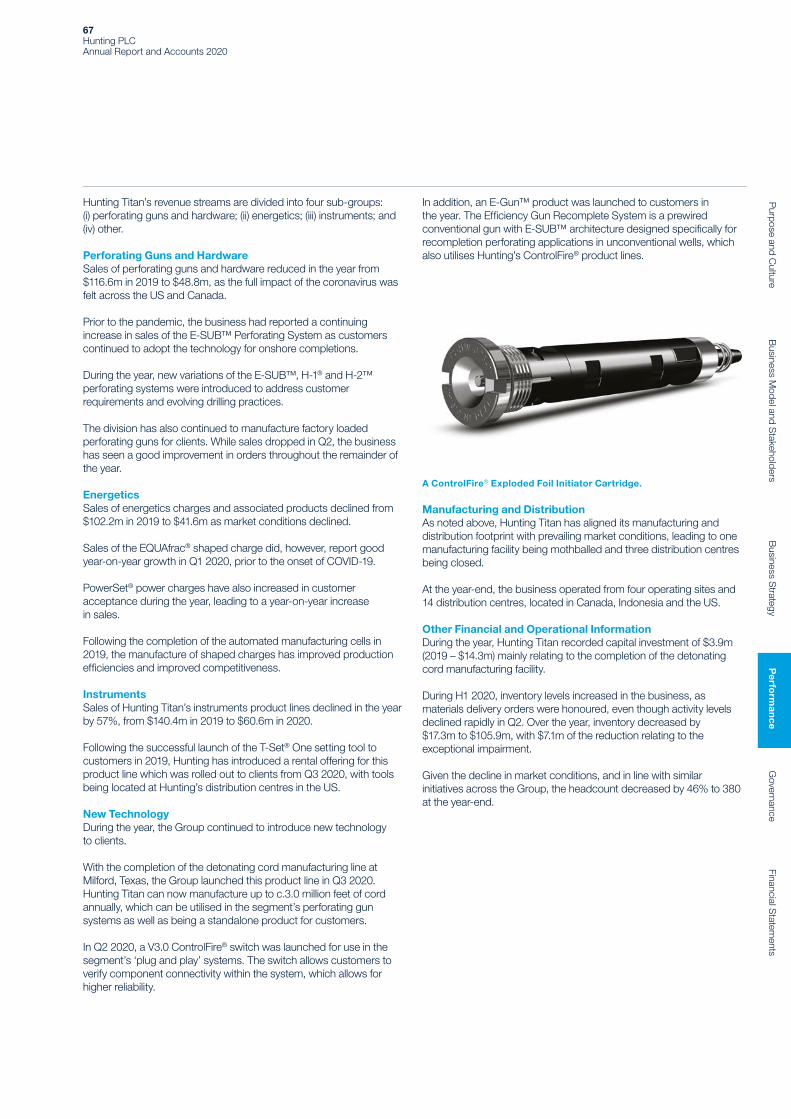
Hunting Titan’s revenue streams are divided into four sub-groups: (i) perforating guns and hardware; (ii) energetics; (iii) instruments; and (iv) other.
Perforating Guns and HardwareSales of perforating guns and hardware reduced in the year from $116.6m in 2019 to $48.8m, as the full impact of the coronavirus was felt across the US and Canada.
Prior to the pandemic, the business had reported a continuing increase in sales of the E-SUB™ Perforating System as customers continued to adopt the technology for onshore completions.
During the year, new variations of the E-SUB™, H-1® and H-2™ perforating systems were introduced to address customer requirements and evolving drilling practices.
The division has also continued to manufacture factory loaded perforating guns for clients. While sales dropped in Q2, the business has seen a good improvement in orders throughout the remainder of the year.
EnergeticsSales of energetics charges and associated products declined from $102.2m in 2019 to $41.6m as market conditions declined.
Sales of the EQUAfrac® shaped charge did, however, report good year-on-year growth in Q1 2020, prior to the onset of COVID-19.
PowerSet® power charges have also increased in customer acceptance during the year, leading to a year-on-year increase in sales.
Following the completion of the automated manufacturing cells in 2019, the manufacture of shaped charges has improved production efficiencies and improved competitiveness.
InstrumentsSales of Hunting Titan’s instruments product lines declined in the year by 57%, from $140.4m in 2019 to $60.6m in 2020.
Following the successful launch of the T-Set® One setting tool to customers in 2019, Hunting has introduced a rental offering for this product line which was rolled out to clients from Q3 2020, with tools being located at Hunting’s distribution centres in the US.
New TechnologyDuring the year, the Group continued to introduce new technology to clients.
With the completion of the detonating cord manufacturing line at Milford, Texas, the Group launched this product line in Q3 2020. Hunting Titan can now manufacture up to c.3.0 million feet of cord annually, which can be utilised in the segment’s perforating gun systems as well as being a standalone product for customers.
In Q2 2020, a V3.0 ControlFire® switch was launched for use in the segment’s ‘plug and play’ systems. The switch allows customers to verify component connectivity within the system, which allows for higher reliability.
In addition, an E-Gun™ product was launched to customers in the year. The Efficiency Gun Recomplete System is a prewired conventional gun with E-SUB™ architecture designed specifically for recompletion perforating applications in unconventional wells, which also utilises Hunting’s ControlFire® product lines.
A ControlFire® Exploded Foil Initiator Cartridge.
Manufacturing and Distribution As noted above, Hunting Titan has aligned its manufacturing and distribution footprint with prevailing market conditions, leading to one manufacturing facility being mothballed and three distribution centres being closed.
At the year-end, the business operated from four operating sites and 14 distribution centres, located in Canada, Indonesia and the US.
Other Financial and Operational Information During the year, Hunting Titan recorded capital investment of $3.9m (2019 – $14.3m) mainly relating to the completion of the detonating cord manufacturing facility.
During H1 2020, inventory levels increased in the business, as materials delivery orders were honoured, even though activity levels declined rapidly in Q2. Over the year, inventory decreased by $17.3m to $105.9m, with $7.1m of the reduction relating to the exceptional impairment.
Given the decline in market conditions, and in line with similar initiatives across the Group, the headcount decreased by 46% to 380 at the year-end.
67Hunting PLC Annual Report and Accounts 2020
Purpose and C
ultureB
usiness Model and S
takeholdersB
usiness Strategy
Perfo
rman
ceG
overnanceFinancial S
tatements
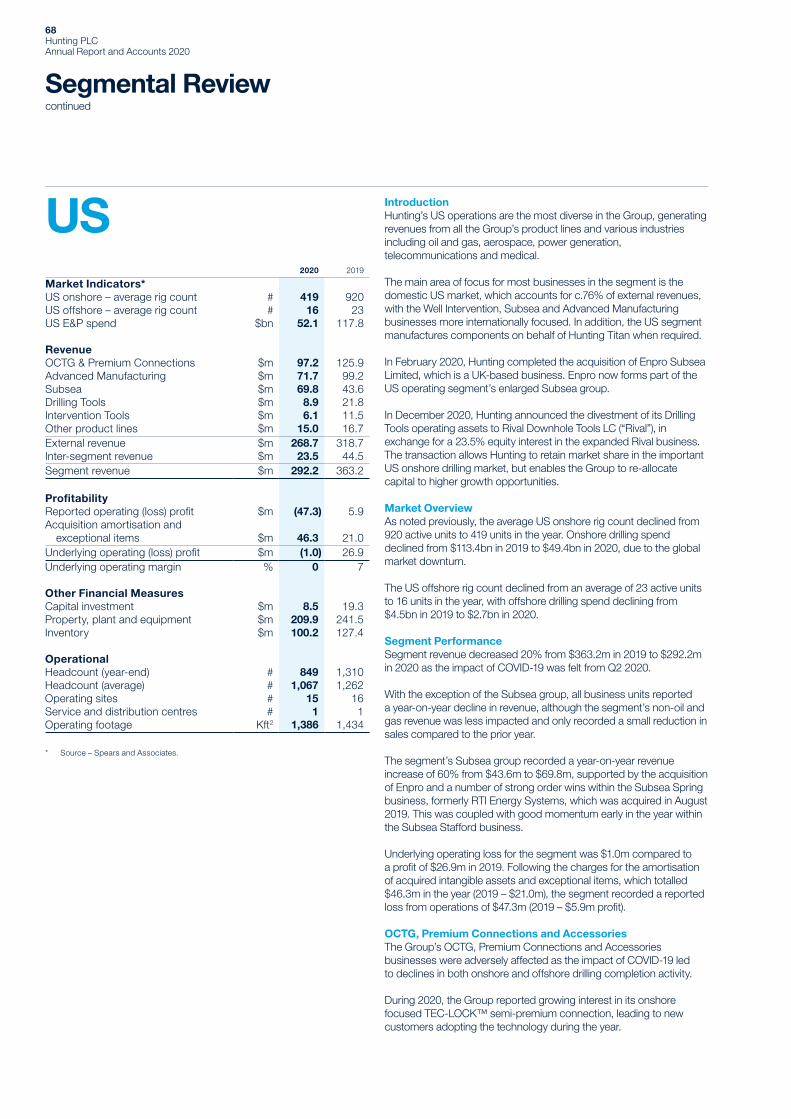
Segmental Review continued
IntroductionHunting’s US operations are the most diverse in the Group, generating revenues from all the Group’s product lines and various industries including oil and gas, aerospace, power generation, telecommunications and medical.
The main area of focus for most businesses in the segment is the domestic US market, which accounts for c.76% of external revenues, with the Well Intervention, Subsea and Advanced Manufacturing businesses more internationally focused. In addition, the US segment manufactures components on behalf of Hunting Titan when required.
In February 2020, Hunting completed the acquisition of Enpro Subsea Limited, which is a UK-based business. Enpro now forms part of the US operating segment’s enlarged Subsea group.
In December 2020, Hunting announced the divestment of its Drilling Tools operating assets to Rival Downhole Tools LC (“Rival”), in exchange for a 23.5% equity interest in the expanded Rival business. The transaction allows Hunting to retain market share in the important US onshore drilling market, but enables the Group to re-allocate capital to higher growth opportunities.
Market OverviewAs noted previously, the average US onshore rig count declined from 920 active units to 419 units in the year. Onshore drilling spend declined from $113.4bn in 2019 to $49.4bn in 2020, due to the global market downturn.
The US offshore rig count declined from an average of 23 active units to 16 units in the year, with offshore drilling spend declining from $4.5bn in 2019 to $2.7bn in 2020.
Segment Performance Segment revenue decreased 20% from $363.2m in 2019 to $292.2m in 2020 as the impact of COVID-19 was felt from Q2 2020.
With the exception of the Subsea group, all business units reported a year-on-year decline in revenue, although the segment’s non-oil and gas revenue was less impacted and only recorded a small reduction in sales compared to the prior year.
The segment’s Subsea group recorded a year-on-year revenue increase of 60% from $43.6m to $69.8m, supported by the acquisition of Enpro and a number of strong order wins within the Subsea Spring business, formerly RTI Energy Systems, which was acquired in August 2019. This was coupled with good momentum early in the year within the Subsea Stafford business.
Underlying operating loss for the segment was $1.0m compared to a profit of $26.9m in 2019. Following the charges for the amortisation of acquired intangible assets and exceptional items, which totalled $46.3m in the year (2019 – $21.0m), the segment recorded a reported loss from operations of $47.3m (2019 – $5.9m profit).
OCTG, Premium Connections and AccessoriesThe Group’s OCTG, Premium Connections and Accessories businesses were adversely affected as the impact of COVID-19 led to declines in both onshore and offshore drilling completion activity.
During 2020, the Group reported growing interest in its onshore focused TEC-LOCK™ semi-premium connection, leading to new customers adopting the technology during the year.
2020 2019
Market Indicators*US onshore – average rig count # 419 920US offshore – average rig count # 16 23US E&P spend $bn 52.1 117.8
RevenueOCTG & Premium Connections $m 97.2 125.9Advanced Manufacturing $m 71.7 99.2Subsea $m 69.8 43.6Drilling Tools $m 8.9 21.8Intervention Tools $m 6.1 11.5Other product lines $m 15.0 16.7External revenue $m 268.7 318.7Inter-segment revenue $m 23.5 44.5Segment revenue $m 292.2 363.2
ProfitabilityReported operating (loss) profit $m (47.3) 5.9Acquisition amortisation and exceptional items $m 46.3 21.0Underlying operating (loss) profit $m (1.0) 26.9Underlying operating margin % 0 7
Other Financial MeasuresCapital investment $m 8.5 19.3Property, plant and equipment $m 209.9 241.5Inventory $m 100.2 127.4
Operational Headcount (year-end) # 849 1,310Headcount (average) # 1,067 1,262Operating sites # 15 16Service and distribution centres # 1 1Operating footage Kft2 1,386 1,434
* Source – Spears and Associates.
US
68Hunting PLC Annual Report and Accounts 2020

The Group’s SEAL-LOCK™ and WEDGE-LOCK™ premium connections, for use in the deep water segment of the Gulf of Mexico, reported only modest reductions in demand in the year, as certain clients continued their drilling programmes.
The Group’s accessories manufacturing business responded to the market decline in activity by commencing the closure of the Ramsey Road operating site in the year and relocating production to other facilities.
Pipe sales also declined significantly as a result of market conditions, leading to a restructuring of the business in Q4 2020.
Advanced ManufacturingHunting’s Advanced Manufacturing group comprises the Dearborn, Electronics and Specialty business units.
In the year, the Dearborn and Electronics businesses were adversely impacted by the downturn in the global oil and gas market, which included lower inter-company sales at Electronics to Hunting Titan for switch components.
The Electronics business has, however, pursued a strategy of offering full turnkey assemblies to its clients, which is seeing interest within the Group’s traditional oil and gas customer base.
Further, the Electronics business successfully secured the ISO13485 medical certification early in the year and has further developed sales into the medical devices sector. The business also received the AS9100 aerospace certification allowing it to pursue sales into this sector.
The Dearborn business also reports positive momentum in developing new sales opportunities outside of its traditional markets, and in the year continued to grow aviation-related sales and space revenue, including clients such as SpaceX and Blue Origin.
The Specialty business tracks US onshore activity and therefore saw a significant reduction in activity as the rig count and drilling spend declined in the year.
SubseaThe segment’s Subsea group saw a strong year-on-year increase in revenue as the business benefited from good momentum early in the year from ongoing US domestic and international offshore projects.
The Stafford business has reported strong interest in its hydraulic valves and couplings for clients in Asia Pacific, the Middle East, South America and the US.
The Subsea Spring business has won a number of significant orders for its titanium stress joints and associated products with clients including Chevron.
Following the acquisition of Enpro, the business has won new orders in Egypt and West Africa.
Drilling ToolsIn line with the decline in onshore activity during the year, revenue within the Drilling Tools business reduced significantly compared to the prior year.
As noted above, the business and assets of the Drilling Tools unit were divested to Rival Downhole Tools LC, which completed on 15 December 2020. Hunting now holds a 23.5% equity interest in Rival.
Intervention Tools Well intervention tools sales were impacted by the market downturn across the year as capital intensive budgets were curtailed.
TrenchlessThe Trenchless business reported reduced revenue in the year, as the global energy industry contracted, however, this decline was partially offset by revenue generated from the roll out of 5G fibre networks in the US.
A Subsea Chemical Injection Metering Valve.
Other Financial and Operational Information During the year, the US recorded capital investment of $8.5m (2019 – $19.3m), primarily due to critical replacement needs.
Inventory decreased to $100.2m, partly through the $15.2m of exceptional impairment charged, but also through efforts to reduce stock and generate cash were increased.
The year-end headcount decreased to 849 (2019 – 1,310), as cost reduction measures were implemented within most business units and as a result of the separation of the Drilling Tools employees that transitioned to Rival.
69Hunting PLC Annual Report and Accounts 2020
Purpose and C
ultureB
usiness Model and S
takeholdersB
usiness Strategy
Perfo
rman
ceG
overnanceFinancial S
tatements

Segmental Review continued
IntroductionThe Group’s Canadian business has historically comprised an OCTG threading and accessories manufacturing facility in Calgary, Alberta, and a service facility in Nisku, Alberta.
In August 2020, it was announced that the Calgary facility was to close, with OCTG and Premium Connection manufacturing in the country to be completed by a number of partners under licence. Operations ceased in Calgary in December. Going forward other customer manufacturing requirements will be completed by the Group’s US operating segment.
Hunting has therefore retained a sales and administration presence in Calgary to enable customer engagement and enquiries to be handled.
From 1 January 2021, continuing business activities were incorporated into the US operating segment.
Market OverviewThe Canadian oil and gas market saw a contraction during 2020, as the COVID-19 pandemic accelerated, leading to a 33% decline in the average rig count and a 38% decline in drilling expenditure from $12.3bn to $7.6bn.
Segment Performance As a consequence of the Canadian market environment and the announcement to close the Calgary operating site, segment revenue declined 44% from $35.7m in 2019 to $20.0m in 2020, leading to an underlying operating loss of $2.5m compared to $4.3m in 2019.
Following the charges for amortisation of acquired intangible assets and exceptional items, which totalled $12.2m (2019 – $nil), the reported operating loss was $14.7m compared to a loss of $4.3m in 2019.
Other Operational InformationFurther, the year-end headcount declined in the year to 31 from 120 in 2019 as operations were wound down.
2020 2019
Market Indicators*Canada – average rig count # 90 134Canada E&P spend $bn 7.6 12.3
Revenue OCTG & Premium Connections $m 14.9 27.1External revenue $m 14.9 27.1Inter-segment revenue $m 5.1 8.6Segment revenue $m 20.0 35.7
ProfitabilityReported operating loss $m (14.7) (4.3)Acquisition amortisation and exceptional items $m 12.2 –Underlying operating loss $m (2.5) (4.3)Underlying operating margin % (13) (12)
Other Financial MeasuresCapital investment $m 0.1 1.0Property, plant and equipment $m 1.7 2.8Inventory $m 4.8 14.3
Operational Headcount (year-end) # 31 120Headcount (average) # 83 127Operating sites # 0 1Service and distribution centres # 1 1Operating footage Kft2 17 113
* Source – Spears and Associates.
Canada
70Hunting PLC Annual Report and Accounts 2020

In the Middle East drilling spend also decreased from $26.2bn in 2019 to $20.4bn in 2020, with the average rig count reducing from 384 to 317 units.
Segment PerformanceThe EMEA operating segment reported segment revenue of $78.8m in the year compared to $123.0m in the prior year, as activity levels declined leading to an underlying operating loss of $12.0m compared to a loss of $1.3m in 2019. Following the charges for the amortisation of acquired intangible assets and exceptional items, which totalled $21.9m (2019 – $nil), the reported operating loss was $33.9m compared to a loss of $1.3m in 2019.
OCTGPrior to the full impact of COVID-19 being felt, the Group’s North Sea OCTG business reported stable activity, a good order book and positive demand forecasts from customers. From April 2020, clients began to defer and cancel drilling operations, leading to a significant decline in order flow. While the impact of this was felt, particularly in H2 2020, management believes that drilling activity will recommence in 2021, reflected in the market outlook for the North Sea. In Saudi Arabia, business momentum increased in the year, with new orders being completed, leading to an additional facility being opened to support customer demand.
During the year, the business has started to develop a new market in the geothermal drilling arena. This market is similar to the oil and gas market, requiring tubulars and pipe connections, therefore the Group is well placed to service these projects. In the year, the business won its first order for a geothermal development in the UK.
Well Intervention and Well TestingThe segment’s well intervention business also started the year strongly, with orders completed in Qatar and the North Sea, but as the year progressed, project deferrals across most regions led to a weak H2 2020.
In Norway, the Group reported a strong increase in revenue as Hunting’s presence in the country continued to grow, leading to higher demand for intervention and perforating products.
Hunting’s well testing business, which is reported under other product lines, operates from the Netherlands, and reported stable revenue throughout 2020, with the year starting strongly, offset by a decline in momentum in H2.
TEK-HUB™The Group’s TEK-HUB™ initiative has made progress in 2020 with new technologies being evaluated and developed. In the year, the Organic Oil Recovery technology, for which Hunting has an exclusive marketing rights in 27 countries, has been trialled by a number of international companies to increase production of end-of-life fields, leading to positive results being recorded. While COVID-19 led to a number of field trials being deferred, a pilot test was completed on the Scott field in the North Sea in the year, leading to a material uplift in production. The technology is now seeing interest in Bahrain, Kazakhstan, Saudi Arabia and the UK, with laboratory and field trials likely to accelerate significantly in 2021. To support this initiative a sales office has been established in the Middle East to support enquiries.
Other Financial and Operational InformationDuring the year, there was limited investment in property, plant and equipment, which totalled $1.0m. Inventory remained fairly static, increasing by $1.8m in the year to $59.7m. To reduce costs, the segment’s headcount was reduced by 23% to 229 by the year-end and two small operating sites were closed.
2020 2019
Market Indicators*North Sea – average rig count # 22 33North Sea – spend $bn 10.2 15.5Total Europe – well count # 583 787Middle East – spend $bn 20.4 26.2
Revenue OCTG & Premium Connections $m 42.2 72.6Intervention Tools $m 24.4 30.8Perforating Systems $m 3.5 3.4Other product lines $m 8.0 9.0External revenue $m 78.1 115.8Inter-segment revenue $m 0.7 7.2Segment revenue $m 78.8 123.0
Profitability Reported operating loss $m (33.9) (1.3)Acquisition amortisation and exceptional items $m 21.9 –Underlying operating loss $m (12.0) (1.3)Underlying operating margin % (15) (1)
Other Financial MeasuresCapital investment $m 1.0 0.6Property, plant and equipment $m 11.6 21.8Inventory $m 59.7 57.9
Operational Headcount (year-end) # 229 299Headcount (average) # 279 292Operating sites # 8 10Operating footage Kft2 236 264
* Source – Spears and Associates.
IntroductionHunting’s European operations comprise businesses in the UK, Netherlands and Norway. These operations provide OCTG (including threading, pipe storage and accessories manufacturing) and well intervention products in the UK; OCTG and well testing equipment manufacture in the Netherlands; and well intervention services and distribution in Norway. Hunting’s Middle East manufacturing operations are located in Dubai, UAE and Dammam, Saudi Arabia. The Group’s operations in Saudi Arabia are through a 65% joint venture arrangement with Saja Energy. During the year, the Group closed its sales presence in South Africa.
Market OverviewThe Group’s EMEA markets declined in 2020, in line with the global downturn due to COVID-19. During 2020, the UK portion of the North Sea reported a decrease in activity levels as market conditions deteriorated, with the average rig count reducing from 15 units in 2019 to average six units in the reporting period. Across the European region, the average rig count declined from 79 to 58 units, although in Norway the rig count remained materially unchanged. Drilling spend across the region declined from $17.9bn in 2019 to $11.7bn in 2020.
EMEA (Europe, Middle East and Africa)
71Hunting PLC Annual Report and Accounts 2020
Purpose and C
ultureB
usiness Model and S
takeholdersB
usiness Strategy
Perfo
rman
ceG
overnanceFinancial S
tatements

Segmental Review continued
Market OverviewAcross the Asia Pacific Region the average rig count declined by 19% from 211 active units to 171 units as the impact of COVID-19 accelerated. Drilling spend declined 28% from $16.9bn to $12.2bn.
In China, the average rig count was flat at 832 active units, while drilling spend declined 5% from $41.5bn to $39.4bn.
As noted previously, in the Middle East drilling spend decreased from $26.2bn in 2019 to $20.4bn in 2020, with the average rig count reducing from 384 to 317 units.
Segment Performance Segment revenue in the year decreased by 25% to $109.3m, compared to $146.3m in the prior year. However, due to a number of the countries in the region recovering quickly from the impact of government lockdown measures, including Australia, China, Malaysia, New Zealand, Thailand and Vietnam, orders continued to be completed, leading to an underlying operating profit of $4.7m being recorded compared to $4.4m in 2019.
Due to the slowing Middle East market for OCTG and the US onshore market for perforating guns, inter-segment sales reduced 90% from $19.1m in 2019 to $2.0m in 2020.
Following the charges for the amortisation of acquired intangible assets and exceptional items, which totalled $2.8m (2019 – $nil), the reported operating profit was $1.9m compared to $4.4m in 2019.
OCTGDuring Q1 2020 operators cancelled or deferred tenders for OCTG supply and Premium Connections, as the impact of COVID-19 took hold across Asia Pacific and the Middle East. However, as Q2 progressed, clients began to reinstate drilling programmes, leading to an increase in orders for customers in Australia, India, Malaysia and Thailand.
Hunting’s access to the Indian oil and gas market has been greatly enhanced following the strategic alliance agreed with JindalSAW in 2019, which provides the in-country content requirements for many tenders. In the year, the Group assisted with a number of orders for operators in India, including ONGC and Reliance, supplying OCTG and other accessories including Hunting’s proprietary APRS product line.
The Asia Pacific segment also completed work for clients across the Middle East.
New TechnologyThe Asia Pacific segment has continued to assist in the development of a micro-power generation system. Prototypes have been tested in Italy and the US during the year, although progress was hampered by COVID-19 leading to delays in the testing of the product prototype. Further trials are anticipated in 2021.
Other Financial and Operational InformationInventory decreased by $10.9m during the year to $22.1m, with $2.6m related to exceptional impairment charges and the remainder reflecting lower activity levels.
Additions to property, plant and equipment in the year were $1.0m.
The headcount reduced from 453 to 364 in the year, as cost reduction measures were implemented.
2020 2019
Market Indicators*Far East – average rig count # 171 211Far East – spend $bn 12.2 16.9Middle East – spend $bn 20.4 26.2
Revenue OCTG & Premium Connections $m 107.2 126.8Other product lines $m 0.1 0.4External revenue $m 107.3 127.2Inter-segment revenue $m 2.0 19.1Segment revenue $m 109.3 146.3
Profitability Reported operating profit $m 1.9 4.4Acquisition amortisation and exceptional items $m 2.8 –Underlying operating profit $m 4.7 4.4Underlying operating margin % 4 3
Other Financial MeasuresCapital investment $m 1.0 0.7Property, plant and equipment $m 7.9 9.6Inventory $m 22.1 33.0
Operational Headcount (year-end) # 364 453Headcount (average) # 426 443Operating sites # 4 4Operating footage Kft2 545 533
* Source – Spears and Associates.
IntroductionHunting’s Asia Pacific business covers four operating facilities across China, Indonesia and Singapore. In China, the Group operates from a facility in Wuxi, which has OCTG threading and perforating gun manufacturing capabilities. In Indonesia and Singapore, Hunting manufactures OCTG premium connections and accessories.
The COVID-19 pandemic impacted the Group’s Asia Pacific operations in Q1 2020, leading to the Wuxi operating site closing for a few days early in the year. Local government regulations were implemented as the pandemic accelerated, leading to a number of facilities being limited to c.25% attendance of the workforce.
Despite these measures, the Group’s Asia Pacific operating segment maintained profitability in the year, as activity levels were sustained from Q2 onwards.
As noted in the Chief Executive’s Report, the segment also purchased a machine to enable face mask production for distribution throughout Hunting’s global businesses and into local communities.
Asia Pacific
72Hunting PLC Annual Report and Accounts 2020

Case Study Organic Oil Recovery
Progressive technology for enhancing oil production and reducing ecological footprint
Hunting has an exclusive partnership with US-based Titan Oil Recovery Inc in the development of game changing, cost-effective technology to enhance oil recovery from mature fields. Traditionally, enhanced recovery processes are expensive and require significant investment.
Organic Oil Recovery (“OOR”) involves mobilising existing microbes present in reservoirs to increase oil production. Hunting’s OOR teams in Aberdeen and the Middle East are planning to export the technology across 27 countries.
The team is working closely with several major operators in order to extend reservoir production. More than ten projects and around 30 pilot operations in 24 oil fields are underway, with combined production capacity of 140,000 bopd. These projects demonstrate scalability to full-field applications in a cost efficient manner, reducing operator overheads and simultaneously increasing recoverable reserves.
The process involves injecting supplemental nutrients in batches in order to increase microbial populations. The microbes move to the oil/water interface, reducing surface tension and releasing significant quantities of trapped residual oil. The process has a dual result of improving the mobility of oil in tight pore spaces, enhancing recovery and addressing the cause of H2S formation by targeting specific species of microbes to outcompete Sulphate Reducing Bacteria.
In June 2020, the OOR process was piloted in the mature Scott Field located in the UK North Sea and operated by CNOOC. The project yielded impressive results:
• 1,000%+ return on investment from incremental revenue over pilot cost;
• 25,000+ barrels increase in recoverable oil; • 4% drop in water cut; and • One week payback.
Promising results from an elegant enhanced oil recovery technology that can be implemented without a large offshore footprint.”Andy Bostock, CNOOC
The OOR well treatment releases trapped oil leading to an increase in production after the procedure.
73Hunting PLC Annual Report and Accounts 2020
Purpose and C
ultureB
usiness Model and S
takeholdersB
usiness Strategy
Perfo
rman
ceG
overnanceFinancial S
tatements
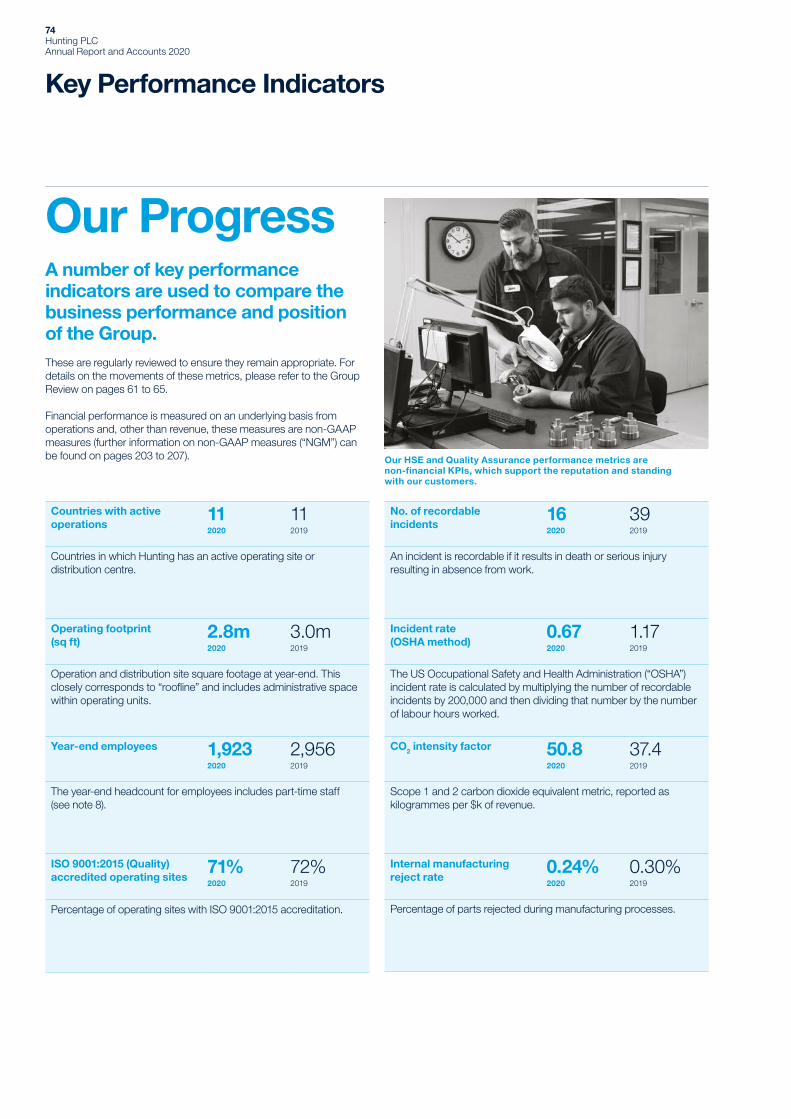
Key Performance Indicators
Countries with active operations
112020
112019
Countries in which Hunting has an active operating site or distribution centre.
Operating footprint (sq ft)
2.8m2020
3.0m2019
Operation and distribution site square footage at year-end. This closely corresponds to “roofline” and includes administrative space within operating units.
Year-end employees 1,9232020
2,9562019
The year-end headcount for employees includes part-time staff (see note 8).
ISO 9001:2015 (Quality) accredited operating sites
71%2020
72%2019
Percentage of operating sites with ISO 9001:2015 accreditation.
No. of recordable incidents
162020
392019
An incident is recordable if it results in death or serious injury resulting in absence from work.
Incident rate (OSHA method)
0.672020
1.172019
The US Occupational Safety and Health Administration (“OSHA”) incident rate is calculated by multiplying the number of recordable incidents by 200,000 and then dividing that number by the number of labour hours worked.
CO2 intensity factor 50.82020
37.42019
Scope 1 and 2 carbon dioxide equivalent metric, reported as kilogrammes per $k of revenue.
Internal manufacturing reject rate
0.24%2020
0.30%2019
Percentage of parts rejected during manufacturing processes.
Our Progress A number of key performance indicators are used to compare the business performance and position of the Group. These are regularly reviewed to ensure they remain appropriate. For details on the movements of these metrics, please refer to the Group Review on pages 61 to 65.
Financial performance is measured on an underlying basis from operations and, other than revenue, these measures are non-GAAP measures (further information on non-GAAP measures (“NGM”) can be found on pages 203 to 207). Our HSE and Quality Assurance performance metrics are
non-financial KPIs, which support the reputation and standing with our customers.
74Hunting PLC Annual Report and Accounts 2020

Revenue($m)
2020
2019
2018
626.0
960.0
911.4
Revenue is earned from products and services sold to customers from the Group’s principal activities (see notes 2 and 3).
Underlying EBITDA*($m)
2020
2019
2018
26.1
139.7
142.3
Underlying results before share of associates’ post-tax results, interest, tax, depreciation, impairment and amortisation (see NGM A).
Underlying (Loss) Profit from Operations($m)
2020
2019
2018
(16.4)
94.3
104.7
Underlying (loss) profit from operations before net finance costs and tax (see consolidated income statement and note 2).
Underlying Operating Margin(%)
2020
2019
2018
(3)
10
11
Underlying (loss) profit from operations as a percentage of revenue.
Underlying Diluted (Loss) Earnings Per Share*(Cents)
2020
2019
2018
(10.0)
43.9
49.6
Underlying (loss) earnings attributable to Ordinary shareholders, divided by the weighted average number of Ordinary shares in issue during the year adjusted for all potentially dilutive Ordinary shares (see note 11).
* Non-GAAP measure (“NGM”) (see pages 203 to 207).
Capital Investment*($m)
2020
2019
2018
14.7
36.0
30.1
Cash spend on tangible non-current assets (see NGM I).
Inventory Days*
2020
2019
2018
270
214
185
Inventory at the year-end divided by underlying cost of sales for the last three months of the year multiplied by 92 days (see NGM D).
Return on Average Capital Employed*(%)
2020
2019
2018
(2)
8
9
Underlying (loss) profit before interest and tax, adjusted to include the share of associates’ post-tax results, as a percentage of average gross capital employed (see NGM N).
Free Cash Flow*($m)
2020
2019
2018
47.8
138.8
80.7
All cash flows before transactions with shareholders and tangible and intangible capital investment (see NGM K).
Total Cash and Bank*($m)
2020
2019
2018
101.7
127.0
65.2
Total cash and bank comprises cash at bank and in hand, short-term deposits and money market funds less bank overdrafts (see note 26).
75Hunting PLC Annual Report and Accounts 2020
Purpose and C
ultureB
usiness Model and S
takeholdersB
usiness Strategy
Perfo
rman
ceG
overnanceFinancial S
tatements

Directors’ Report and Compliance Statements
Statement of Directors’ ResponsibilitiesThe Directors are responsible for preparing the Annual Report and the financial statements in accordance with applicable law and regulations.
Company law requires the Directors to prepare financial statements for each financial year. Under that law the Directors are required to prepare the Group financial statements in accordance with International Financial Reporting Standards (IFRSs) as adopted by the European Union (“EU”) and have also chosen to prepare the parent Company financial statements under IFRSs as adopted by the EU. Under company law the Directors must not approve the accounts unless they are satisfied that they give a true and fair view of the state of affairs of the Company and of the profit or loss of the Company for that period. In preparing these financial statements, International Accounting Standard 1 requires that Directors:
• properly select and apply accounting policies; • present information, including accounting policies, in a manner that provides relevant, reliable, comparable and understandable information;
• provide additional disclosures when compliance with the specific requirements in IFRSs are insufficient to enable users to understand the impact of particular transactions, other events and conditions on the entity’s financial position and financial performance; and
• make an assessment of the Company’s ability to continue as a going concern.
The Directors are responsible for keeping adequate accounting records that are sufficient to show and explain the Company’s transactions and disclose with reasonable accuracy at any time the financial position of the Company and enable them to ensure that the financial statements comply with the Companies Act 2006. They are also responsible for safeguarding the assets of the Company and hence for taking reasonable steps for the prevention and detection of fraud and other irregularities.
The Directors are responsible for the maintenance and integrity of the corporate and financial information included on the Company’s website. Legislation in the United Kingdom governing the preparation and dissemination of financial statements may differ from legislation in other jurisdictions.
Responsibility StatementThe Directors consider that the Annual Report and Accounts, taken as a whole, is fair, balanced and understandable and provides the information necessary for shareholders to assess the Group’s and parent Company’s position and performance, business model and strategy. Each of the Directors, whose names and functions are listed on pages 82 and 83 confirm that, to the best of their knowledge:
• the financial statements, prepared in accordance with International Financial Reporting Standards as adopted by the EU, give a true and fair view of the assets, liabilities, financial position and profit or loss of the Company and the undertakings included in the consolidation taken as a whole;
• the Strategic Report includes a fair and balanced review of the development and performance of the business and the position of the Company and the undertakings included in the consolidation taken as a whole, together with a description of the principal risks and uncertainties that they face; and
• the Annual Report and financial statements, taken as a whole, are fair, balanced and understandable and provide the information necessary for shareholders to assess the Company’s position and performance, business model and strategy.
In the case of each Director in office at the date the Directors’ Report is approved:
• so far as the Director is aware, there is no relevant audit information of which the Group’s and parent Company’s auditor are unaware; and
• they have taken all the steps that they ought to have taken as a Director in order to make themselves aware of any relevant audit information and to establish that the Group’s and parent Company’s auditor are aware of that information.
This responsibility statement was approved by the Board of Directors at their meeting on 1 March 2021.
Companies Act 2006Section 415In compliance with section 415 of the Companies Act 2006, the Directors present their report and the audited financial statements of Hunting PLC for the year ended 31 December 2020.
The Strategic Report incorporates the Chairman’s Statement, Chief Executive’s Statement and Outlook, Market Review, Key Performance Indicators, Group Review, Segmental Review, Stakeholder Engagement disclosures, Business Model and Strategy and Risk Management and is located on pages 4 to 79. As permitted by legislation, the Board has chosen to set out, within the Strategic Report and Corporate Governance Report, some of the matters required to be disclosed in the Directors’ Report, which it considers to be complementary to communicating Hunting’s performance and position, as follows:
• changes in the Group and its interests (pages 38 and 39); • future developments (pages 38 and 39); • risk management, objectives and policies (pages 50 to 54); • bribery and corruption (pages 25 to 27 and 125); • ethnicity and diversity (pages 26 and 27); and • greenhouse gas emissions and environmental matters (pages 30 to 32).
On 21 February 2020, the Group announced the completion of the acquisition of Enpro Subsea Limited for a cash consideration of $32.8m, excluding cash acquired of $5.5m. Further details on this transaction can found in note 39.
Furthermore, the Group’s US Drilling Tools business was divested on 15 December 2020 to Rival Downhole Tools LC, in exchange for a 23.5% equity interest in the enlarged Rival group. Further details on this transaction can found in note 40.
On 4 February 2021, the Group also invested $2.5m in convertible financing in Well Data Labs, a well analytics company.
From 1 January 2021, up to the date of signing these accounts, the Company has purchased 1,590,281 treasury shares for a total consideration of $4.7m.
In addition, information relating to the Directors’ indemnity provisions and dividend waivers, Annual General Meeting, dividends, Directors’ powers and interests, share capital, political donations, research and development and significant agreements, can be found within the Shareholder and Statutory Information section located on pages 209 to 212.
76Hunting PLC Annual Report and Accounts 2020
The Companies (Miscellaneous Reporting) Regulations 2018 As required by The Companies (Miscellaneous Reporting) Regulations 2018 (the “Regulations”), the Board of Hunting PLC has prepared a section 172(1) statement, which can also be found on the Group’s website www.huntingplc.com. The Directors’ Stakeholder Engagement and decision making disclosures are summarised within the Strategic Report on pages 12 to 33, and include cross references to the various engagement activities across the Group’s operations. Additional disclosures in respect of customers, suppliers and other key business relationships can also be found within the Strategic Report.
Section 172(1) StatementThis statement has been prepared in compliance with the Companies (Miscellaneous Reporting) Regulations 2018.
The Board of Hunting PLC considers that, in complying with its statutory duty during 2020 and under section 172 of the Companies Act 2006 (the “Act”), the Directors have acted in good faith and in a manner which they believe is likely to promote the continued success of the Company, for the benefit of its members and stakeholders as a whole. The Board also engages with its stakeholders when considering major strategic decisions, in the following ways:
• each year the Board reviews its short- and long-term strategy. In recent years these have remained consistent, with a focus on maintaining a firm financial foundation, improving facilities and investing in the development of new technology and in our workforce;
• the Board aims to ensure that our employees work in a safe environment, that they receive appropriate training and are sufficiently rewarded for their efforts;
• over the years we have fostered long-standing relationships with our customers, suppliers and our external advisers. We base our philosophy on sharing our core values with our key stakeholders throughout the supply chain and by keeping in regular contact with suppliers and customers advising them of our market strategy and product innovation;
• as a company operating in the oil industry, we regularly monitor the impact of our activities on the environment and on the communities in which we operate and, in particular, where we maintain active manufacturing facilities; and
• as a Board, we endeavour to operate responsibly and to make carefully considered decisions. We encourage high standards of business conduct from our employees and try to lead by example.
The impact of COVID-19 has been reported to the Board on a regular basis by senior management. The Board reacted quickly to implement procedures in response to COVID-19, and to the general market downturn, to position the Group for a return to growth in its core markets. The action plan included:
• engaging closely with employees; • following appropriate consultation, the Group released 35% of its workforce and the Board has been very sensitive to this process;
• global Human Resources functions have proactively engaged with staff to reassign responsibilities, especially concerning Health and Safety and Quality Assurance. Close monitoring of employee wellbeing also occurred;
• providing protective equipment to employees, implementing social distancing protocols and facilitating home working arrangements where possible;
• increased deep cleaning of facilities; • assessment of how we can protect our key assets;
• communicating closely with our suppliers, to ensure that they are dealing effectively with COVID-19 and that our supply chain is as secure as possible;
• interacting and communicating closely with our customers, keeping them informed of our COVID-19 arrangements in order to maintain confidence in our ability to continue to provide market leading products and our commitment towards maintaining high standards of service; and
• closely monitoring developments and any feedback from customers, especially in regard to new products and potential new market opportunities.
The following sections and cross references provide a summary of where details of key stakeholder and associated engagement and decision making is located within the 2020 Annual Report and Accounts and also some of the considerations taken by the Board in fulfilling their duty under section 172(1) of the Act:
• shareholders (pages 12 to 14); • lenders (page 16); • customers (pages 24 and 25); • employees (pages 26 to 28); • suppliers (page 29); • environment (pages 30 to 32); • governments (page 33); and • communities (page 33).
Non-Financial Information StatementIn accordance with section 414CA of the Companies Act 2006, the Company is required to provide a non-financial information statement. The Company has chosen to present this information throughout the Strategic Report as follows:
• business model (pages 10 to 33); • environmental matters, including impact of the Company’s business on the environment (pages 30 to 32);
• employees (pages 26 to 28); • respect for human rights (page 26); and • anti-corruption and anti-bribery matters (pages 25 to 27 and 125).
Included within these disclosures are details of policies, outcomes, risk factors and related key performance indicators.
Viability StatementIntroductionHunting has a diverse global customer base underpinned by strong, long-term relationships. The Group provides a large range of products and services through its manufacturing and distribution facilities, which are located in a number of countries across the globe.
In considering the Group’s long-term viability, the Board regularly assesses the risks to its business model, strategy, future performance, solvency and liquidity. These assessments are supported by the risk management processes described on pages 53 and 54 and include a review of the Group’s exposure to the oil and gas industry, competitor action, customer plans and the robustness of the supply chain.
77Hunting PLC Annual Report and Accounts 2020
Purpose and C
ultureB
usiness Model and S
takeholdersB
usiness Strategy
Perfo
rman
ceG
overnanceFinancial S
tatements

Directors’ Report and Compliance Statements continued
Assessment PeriodThe Group’s customers are principally involved in the exploration for and production of oil and gas. Given the nature of the industry and the planning cycles involved, these activities can cover periods of no more than several weeks and up to several years from start to end. Hunting’s management works closely with its customers, discussing their operational plans and related capital expenditure programmes, with a natural focus on the earlier years in which projects will be in progress, or committed to, and for which requirements for goods or services from Hunting will be more certain. The outlook for the Group beyond this period is generated from management’s assessment of industrial data and projections published by industry commentators and analysts, including statistics on exploration and production expenditure, footage drilled and rig activity. These macro, longer-term forecasts are more subject to significant volatility.
Taking these factors into consideration, the Board believes that a three-year forward-looking period, commencing on the date the annual accounts are approved by the Board, is the appropriate length of time to reasonably assess the Group’s viability.
Consideration of Principal RisksThe nature of the Group’s operations exposes the business to a variety of risks, which are noted on pages 56 to 59. The Board regularly reviews the principal risks and assesses the appropriate controls and further actions as described on pages 53 and 54, given the Board’s appetite for risk as described on pages 51 and 52. The Board has further considered their potential impact within the context of the Group’s viability.
The Group has a $160m committed revolving credit facility that is due to expire in December 2022. The facility includes conditional options to be extended by one year and to be increased by $75m, by mutual agreement. Despite Group expectations of maintaining a strong cash-positive position throughout the viability assessment period, management has commenced a dialogue with the lenders with a view to refinancing in the near term. Initial responses have been positive towards the Group.
AssumptionsIn assessing the long-term viability of the Group, the Board made the following assumptions:
• global exploration and production spend in 2021 is expected to be down 15% compared with 2020, followed by a sharp recovery in 2022 to 2025;
• demand for energy service products improves in the medium to long term, given the global outlook for oil and gas demand, which is driven by growth within emerging markets and sustained demand from developed markets. These are the fundamental drivers of Hunting’s core business of manufacturing, supplying and distributing products and services which in turn enable the extraction of oil and gas;
• the Group’s reduced cost base enables the business to remain competitive within the weaker sectors of the global energy markets, particularly within the offshore and international markets; and
• the Group will continue to have a medium to low exposure to higher risk countries given the proportion of its current revenues and profits derived from politically stable regions such as North America, Europe and South East Asia.
In addition, a downside case of the financial projections was produced to model a meaningful deterioration in market conditions and this revealed no concerns regarding viability.
A stress test case was performed, as noted in the going concern statement on page 79, to identify the financial conditions required to cause a possible breach of the Group’s banking covenants within the following twelve month period. As stated in that statement, the Board concluded that the likelihood of this occurrence is remote.
COVID-19 Related FactorsThe Group’s 2020 financial statements illustrate the adverse impact of the COVID-19 pandemic on its financial performance. Revenue, results from operations, loss/profit for the year and loss/earnings per share all declined in the year. The impact on cash reserves was less material, as the Group’s business model enabled Group and local management to respond quickly to the turn of events. The principal singular factor in the fall in total cash and bank during 2020, by $25.3m from $127.0m to $101.7m, was the business acquisition of Enpro Subsea Limited, for which $34.2m was paid, including acquisition costs, in February/April 2020.
The actions taken by Group and local management, that enabled the preservation of cash and the continued resilience of operations, include the following:
• the closure/mothballing of facilities, including the OCTG operation in Canada, and relocation of plant and machinery;
• business disposal; • reductions in force; • right-sizing of active business units; • reduced capital investment; • wider limitations on other types of spending; • tightening working capital management; • reduced dividends to shareholders; • closer monitoring of markets and of selected customers’ financial condition;
• widening of markets; • adjusting work schedules and business layouts to enable workplace social distancing;
• working from home if possible; • applications made for government financial assistance; and • purchase of mask-making equipment and distribution of disposable masks to the Hunting sites and to the Company’s wider communities.
ConclusionThe Board believes that the Group’s strategy for growth, its diverse customer and product base, the resilience of its business model and the positive outlook for the oil and gas industry after 2021, in the medium term provide Hunting with a strong platform on which to continue its business. The Directors therefore have a reasonable expectation that Hunting will be able to continue in operation and meet its liabilities as they fall due over the three-year period of their assessment.
78Hunting PLC Annual Report and Accounts 2020

Going Concern StatementIntroductionThe Group’s principal cash outflows include capital investment, labour costs, inventory purchases and dividends. The timing and extent of these cash flows is controlled by local management and the Board. The Group’s principal cash inflows are generated from the sale of its products and services, the level of which is dependent on overall market conditions, the variety of its products and its ability to retain strong customer relationships. Cash inflows are further supported by the Group’s credit insurance cover against customer default that, at 31 December 2020, covered the majority of its trade receivables, subject to certain limits.
Current and forecast cash/debt balances are reported on a weekly basis by each of the business units to a centralised treasury function that uses the information to manage the Group’s day-to-day liquidity and longer-term funding needs.
The Group has access to sufficient financial resources, including $160m of secured committed credit facilities (“RCF”), which were undrawn throughout the whole of 2020. The Group’s internal financial projections indicate that the Group will retain sufficient liquidity to meet its funding requirements over the next twelve months.
ReviewIn conducting its review of the Group’s ability to remain as a going concern, the Board assessed the Group’s recent trading performance and its latest forecasts and took account of reasonably predictable changes in future trading performance. The Board also considered the potential financial impact of the estimates, judgements and assumptions that were used to prepare these financial statements. Management sensitised these forecasts to reflect plausible downside scenarios as a result of the COVID-19 impact on global economies. These demonstrated that the Group is able to maintain sufficient cash resources to meet its liabilities as they fall due over the next twelve months.
Management also prepared further stress-test forecasts to identify the conditions required to fully consume the Group’s cash reserves by December 2022 and cause a breach of the banking covenants, thus restricting access to the Group’s currently undrawn RCF in the going concern assessment period. The Group modelled a drop in monthly revenue from May 2021 to December 2022 reflecting the lowest levels experienced during 2020, and consequent modest negative EBITDA margins. Working capital days were broadly maintained at the high levels occurring at the end of 2020. Even with these factors reflected, a further 5.5% decline in EBITDA margin was required to cause a breach. To advance the possible breach to June 2022 would require a further 2.4% decline in the stressed monthly EBITDA margin. The Board assessed the severity of these forecasts and concluded that the likelihood of such a combined occurrence over the next twelve months is remote. The Board is also satisfied that no material uncertainties have been identified.
ConclusionThe Board is satisfied that it has conducted a robust review of the Group’s going concern and has a high level of confidence that the Group has the necessary liquid resources to meet its liabilities as they fall due. Consequently the Board considered it appropriate to adopt the going concern basis of accounting in preparing these consolidated financial statements.
By order of the Board
Ben WilleyCompany Secretary
4 March 2021
79Hunting PLC Annual Report and Accounts 2020
Purpose and C
ultureB
usiness Model and S
takeholdersB
usiness Strategy
Perfo
rman
ceG
overnanceFinancial S
tatements

Corporate Governance Overview
Letter from ChairmanThe challenges presented during 2020 will be remembered for many years to come, given the impact of COVID-19 on global economies and the actions by governments to curtail the spread of the virus, but also the significant impact the virus has had on the global oil and gas industry and the Group’s operations in the year.
The Board’s work in the year changed in response to COVID-19. In Q2/Q3 2020 the Directors increased the frequency of their meetings and met fortnightly to receive market, trading and health and safety updates, in addition to scrutinising the Group’s finances including cash levels and overall liquidity as the downturn impacted our businesses. While we have reported losses in the year, which includes significant impairments to assets, our year-end net cash and healthy balance sheet position us strongly as the global market slowly returns to growth.
The work of the Remuneration, Nomination and Audit Committees is described in detail throughout the following section of the Annual Report. I would like to thank my fellow Directors and the Group’s employees for their support and commitment which has helped us navigate these extraordinary and challenging times.
IntroductionThe Group’s governance framework remained unchanged from the prior year, following the introduction of the 2018 UK Corporate Governance Code on 1 January 2019. Most areas of Hunting’s governance procedures have been reviewed during the year, with the Board confirming that the Purpose and Culture remains robust, despite the downturn in the global energy market and the unfortunate reductions in the Group’s headcount which were implemented as industry activity levels reduced.
COVID-19The focus of the Group during the year has been to keep our employees safe and healthy, given the challenges presented by the pandemic.
As an essential industry, Hunting’s facilities were allowed to remain open, albeit with social distancing and other safety measures being put in place.
The work of the Group’s Health and Safety and Human Resources teams in the year have been outstanding as they supported senior management, as well as providing advice to employees through the year.
DividendsThe Group has continued to declare dividends during the year, which totalled 9.0 cents per share (2019 – 5.0 cents), given the strong cash and bank position throughout the year and the healthy balance sheet which has been maintained throughout the market downturn.
The Board considered this area carefully and believes that the policy adopted in the year reflects the Board’s confidence in the prospects of the Group over the long term and the importance of shareholder distributions as part of our long-term investment case.
Workforce and Executive RemunerationWhile base salaries have been frozen across the Group in the year, certain businesses within Hunting have achieved their budgetary targets set for 2020 and will receive bonuses to reflect this excellent performance.
The Board and Remuneration Committee considered carefully its approach to its compensation framework and concluded that, given the strongly cyclical nature of the oil and gas industry, no changes to the operation of the Group’s remuneration framework would be made.
In the year, the Group has accepted furlough monies across its various regions of operation, which totalled $3.6m. These monies were passed directly to employees to support them through the challenges in the year, with no funds being retained by Group businesses for other purposes.
In light of the quantum of the monies received, compared to other capital allocations and with the intention of retaining a consistent and fair approach to remuneration, the executive Directors will be paid a small annual bonus which reflects the normal operation of the executive annual bonus plan and which reflects the full delivery of certain strategic goals which were set at the beginning of the year.
80Hunting PLC Annual Report and Accounts 2020

Directors’ Remuneration PolicyIn line with the requirements of UK legislation, the Board is proposing a new Directors’ Remuneration Policy for approval by shareholders. During the year, the Remuneration Committee met to discuss its approach to this requirement, given the recommendations by UK regulators and the impact of the COVID-19 pandemic.
The Remuneration Committee and Board concluded that the current remuneration framework and Policy remains fit for purpose, due to a demonstrable track record of alignment between performance and executive pay.
Therefore, the Remuneration Committee recommended that the amendments to the current Policy should be limited to those areas which better align with the 2018 UK Corporate Governance Code as compared to a full review of the remuneration framework.
The Board is recommending changes to the pensions arrangements for future executive Director appointments; reducing the maximum grant limit under the Hunting Performance Share Plan and introducing an executive Director post-employment shareholding policy.
The new Policy is to be tabled at the Company’s Annual General Meeting in April 2021.
Subject to approval, the Company will be fully compliant with the 2018 Code, with the exception of one remuneration provision, which is noted on page 85. Further details of these proposals can be found within the Remuneration Committee Report.
Going Concern and ViabilityThe Group’s results reflect an unprecedented contraction of the oil and gas industry, with the Company reporting losses in the year and impairments to the carrying values of assets held on the consolidated balance sheet.
The Board has closely monitored trading projections, projected cash generation and liquidity throughout the year, with rigorous review and challenge being undertaken by Deloitte, the Group’s external auditor, to confirm our disclosures on going concern and viability.
The work of management to reduce working capital and increase net cash balances has been commendable and supports these statements.
Retirement and Appointment of Finance DirectorAs noted in last year’s Annual Report, Peter Rose gave notice to the Company of his intention to retire at the end of 2020, and he stepped down from the Board on 15 April 2020 following conclusion of the Company’s Annual General Meeting. The Nomination Committee met in December 2019 and January 2020, and following discussion recommended the appointment of Bruce Ferguson as Hunting’s new Finance Director. Bruce was duly appointed by shareholders at the AGM, with his base salary set at £275,000.
John (Jay) F. GlickChairman
4 March 2021
81Hunting PLC Annual Report and Accounts 2020
Purpose and C
ultureB
usiness Model and S
takeholdersB
usiness Strategy
Perform
anceG
overn
ance
Financial Statem
ents

Board of Directors and Company Secretary
John (Jay) F. GlickNon-executive Chairman
Nationality American.
Length of Service6 years; appointed to the Board as a non-executive Director in 2015 and is viewed as independent. In 2017, Jay was appointed non-executive Chairman. In September 2020, Jay was re-appointed for a further three-year term. Age 68.
Skills and ExperienceJay was formerly the president and chief executive officer of Lufkin Industries Inc and, prior to that, held several senior management roles within Cameron International Corporation.
External AppointmentsJay is currently a non-executive director of TETRA Technologies Inc.
Committee MembershipNomination Committee (Chair) and by invitation.
Bruce FergusonFinance Director
Nationality British.
Length of Service27 years; appointed to the Board as a Director and Finance Director in 2020. Age 49.
Skills and ExperienceBruce is a Chartered Management Accountant and has held senior financial and operational positions within the Group since 1994. From 2003 to 2011 Bruce was the financial controller of the Group’s European operations. From 2011, Bruce held the position of managing director of Hunting’s EMEA operating segment and has been a member of the Executive Committee since its formation in 2018.
External Appointments None.
Committee Membership By invitation.
Arthur James (Jim) JohnsonChief Executive
Nationality American.
Length of Service29 years; appointed to the Board as a Director and Chief Executive in 2017. Age 60.
Skills and ExperienceJim held senior management positions within Hunting from 1992 up to his appointment as Chief Operating Officer of the Group in 2011. In this role, he was responsible for all day-to-day operational activities of the Company. Jim is a member of, and chairs, the Executive Committee.
External Appointments None.
Committee Membership By invitation.
Annell BayNon-executive Director
Nationality American.
Length of Service6 years; appointed to the Board as a non-executive Director in 2015 and is viewed as independent. In February 2021, Annell was re-appointed for a final three-year term. Annell is Chair of the Remuneration Committee and is also the Company’s designated non-executive Director for employee engagement. Age 65.
Skills and ExperienceAnnell was formerly a vice-president of global exploration at Marathon Oil Corporation and, prior to that, vice-president of Americas Exploration at Shell Exploration and Production Company.
External AppointmentsAnnell is currently a non-executive director of Apache Corporation and Verisk Analytics Inc.
Committee Membership Nomination Committee. Remuneration Committee (Chair).Audit Committee.
82Hunting PLC Annual Report and Accounts 2020

Carol ChesneyNon-executive Director
Nationality American and British.
Length of Service3 years; appointed to the Board as a non-executive Director in 2018 and is viewed as independent. Carol is Chair of the Audit Committee. Age 58.
Skills and ExperienceCarol is a Fellow of the Institute of Chartered Accountants in England and Wales. Carol was formerly the Group Financial Controller and, latterly, the Company Secretary of Halma plc.
External AppointmentsCarol is currently a non-executive director of Renishaw plc, IQE plc and Biffa plc.
Committee Membership Nomination Committee. Remuneration Committee. Audit Committee (Chair).
Keith LoughSenior Independent Non-executive Director
Nationality British.
Length of Service3 years; appointed to the Board as a non-executive Director in April 2018 and appointed Senior Independent Director in August 2018. Age 62.
Skills and ExperienceKeith was formerly the non-executive Chairman of Gulf Keystone Petroleum plc and previously held a number of executive positions within other energy-related companies, including British Energy plc and LASMO plc.
External AppointmentsKeith is currently the non-executive Chairman of Rockhopper Exploration plc and Southern Water and a non-executive director of Cairn Energy plc.
Committee Membership Nomination Committee. Remuneration Committee.Audit Committee.
Richard Hunting, CBENon-executive Director
Nationality British.
Length of Service48 years; elected an executive Director in 1989 and was Chairman from 1991 to 2017. Richard remains on the Board as a non-independent, non-executive Director and was re-appointed for a further three-year term in September 2020. Age 74.
Skills and ExperienceRichard has previously held a variety of management positions around the Hunting Group.
External Appointments None.
Committee Membership By invitation.
Ben WilleyCompany Secretary
Nationality British.
Length of Service11 years; joined Hunting in 2010 and was appointed Company Secretary in 2013. Age 47.
Skills and ExperienceBen is a Fellow of the Institute of Chartered Secretaries and Administrators. He was formerly a partner at Buchanan, a WPP company, and, prior to that, worked in investment banking.
External Appointments None.
Committee Membership Audit Committee (Secretary).Nomination Committee (Secretary). Remuneration Committee (Secretary).
83Hunting PLC Annual Report and Accounts 2020
Purpose and C
ultureB
usiness Model and S
takeholdersB
usiness Strategy
Perform
anceG
overn
ance
Financial Statem
ents

Executive Committee
Rick BradleyChief Operating Officer
Nationality American.
Length of Service10 years; joined Hunting in 2011 and was appointed Chief Operating Officer in 2017. Age 61.
Jason MaiManaging Director – Hunting Titan
Nationality American.
Length of Service6 years; joined Hunting in 2015 and was appointed Managing Director in 2017. Age 52.
Scott GeorgeManaging Director – US Operations
Nationality American.
Length of Service11 years; joined Hunting in 2010 and was appointed Managing Director in 2011. Age 47.
Stewart Barrie Managing Director – Europe, Middle East and Africa Operations
Nationality British.
Length of Service9 years; joined Hunting in 2012 and was appointed Managing Director in 2020. Age 52.
Daniel TanManaging Director – Asia Pacific Operations
Nationality Singaporean.
Length of Service13 years; joined Hunting in 2008 and was appointed Managing Director in 2011. Age 58.
84Hunting PLC Annual Report and Accounts 2020

Corporate Governance Report
ComplianceThe Board of Hunting PLC has adopted governance principles aligned with the 2018 UK Corporate Governance Code (the “Code”), which can be found at www.frc.org.uk. The Company is reporting its Corporate Governance compliance against this Code.
The Board has assessed its compliance with the Code and notes the following provisions to which it is not compliant:
The pension contribution rates of the Chief Executive currently do not align with the workforce as required by provision 38 of the Code. Mr Johnson was appointed prior to the implementation of the 2018 Code. However, in the year, shareholders elected Bruce Ferguson as Hunting’s new Finance Director at the Company’s Annual General Meeting on 15 April 2020. Mr Ferguson’s cash sum in lieu of a Company contribution aligns with the UK workforce, as required by the Code, with a contribution rate of 12% of base salary. The Board anticipates further alignment with the new Code over time as and when new executive Director appointments are made.
Governance FrameworkSubject to the Company’s Articles of Association, UK legislation and any directions prescribed by resolution at a general meeting, the business of the Company is managed by the Hunting PLC Board (“the Board”).
The Board is responsible for the management and strategic direction of the Company and to ensure its long-term success by generating value for its shareholders, while giving due consideration to other stakeholders, as prescribed by UK law.
Hunting’s governance framework is driven by its Purpose, Culture and Values, which are noted on pages 6 and 8, and are derived from engagement with its shareholders and principal stakeholders.
Hunting Governance Framework
Our purpose
Stakeholder engagement
Market environment and
other external factors
Non-executive Directors
Executive Directors
1Strategic intent
2Challenge and
decision making
3Short/long-term plan
Remuneration Committee
Execution and value creation
(Business Model)
Risk management
Strategic and financial
performanceKPIsBusiness
strategy
Audit Committee
Nomination Committee
85Hunting PLC Annual Report and Accounts 2020
Purpose and C
ultureB
usiness Model and S
takeholdersB
usiness Strategy
Perform
anceG
overn
ance
Financial Statem
ents

Corporate Governance Reportcontinued
IntroductionThe Board discusses strategic planning and long-term growth objectives. A detailed Strategic Plan is prepared biennially, with updates to the Plan presented in intervening years. Strategic plans consider the future direction of the Group, taking into account Environmental, Social and Governance (“ESG”) matters. Once the Board has agreed on the strategic plans, these are rolled out across the Group’s operations and relayed to key stakeholders more generally. Embedded within strategic planning is the Group’s appetite for risk. The Group’s Risk Management framework (see pages 50 to 59), and supporting procedures, help the Board refine its decision making, as the opportunities and risks for long-term success and growth are evaluated against their risk appetite and the risk culture of the Group. Following this, the Group’s Business Strategy and Model are put into action.
The Board has three subcommittees to which it delegates governance and compliance procedures: the Remuneration Committee, whose report can be found on pages 93 to 118; the Nomination Committee, whose report can be found on pages 119 and 120; and the Audit Committee, whose report can be found on pages 121 to 125.
The Board Committees support the Directors in their decision making. The Audit Committee’s responsibilities include reviewing the Group’s financial results and challenging management, internal audit and external audit functions. The Remuneration Committee ensures the executive Directors remain motivated and incentivised, as the senior leadership team executes the approved strategy on a day-to-day basis. The Remuneration Committee ensures that executive pay remains aligned with Company performance and the broader shareholder experience. The work of the Nomination Committee supports the Board’s responsibility for ensuring that a framework of recruitment and retention of talent is in place to run the Company and that succession is well planned and executed in a timely manner.
The Board and its Committees are further supported by an Executive Committee, comprising of executive Directors and managing directors of each operating segment of the Group. The Executive Committee oversees the implementation of the Group’s growth objectives and ensures the risks and opportunities presented are actively managed.
Responsibilities of the BoardThe Board of Hunting PLC has clearly defined areas of responsibility, which are separate to those of the Chairman, executive Directors and the Committees of the Board. The non-executive Directors approve the strategic goals and objectives of the Company, as proposed by the executive Directors. The Board approves all major acquisitions, divestments, dividends, capital investments, annual budgets and strategic plans.
The Board has overall leadership of the Company, setting the values of the Hunting Group and providing a strong tone from the top, which all businesses within the Group and its employees are encouraged to adopt. Governance principles of the Company are set by the Board and key Group-level policies are reviewed and approved by the Directors.
The Directors monitor Hunting’s trading performance, including progress against the Annual Budget, reviewing monthly management accounts and forecasts, comparing forecasts to market expectations and reviewing other financial matters. They review and approve all public announcements, including financial results, trading statements and set the dividend policy of the Group.
The internal control and risk management framework and associated procedures are reviewed by the Board; however, key monitoring procedures are delegated to the Audit Committee. Remuneration of the executive Directors is set by the Remuneration Committee, who also review and monitor the remuneration of the Executive Committee, as well as monitoring the remuneration structure of the wider workforce.
The Board approves all key recommendations from the Remuneration, Nomination and Audit Committees and approves all appointments to these Committees.
Board ActivitiesBoard and Committee materials are circulated in a timely manner ahead of each meeting.
At each meeting, the Chief Executive updates the Board on key operational developments, provides an overview of the market, reports on Health and Safety, and highlights important milestones reached towards the delivery of Hunting’s strategic objectives.
The Finance Director provides an update on the Group’s financial performance, position, outlook, banking arrangements, legal issues, analyst discussions and statutory reporting developments relevant to Hunting. These topics lead to discussion, debate and challenge among the Directors.
The Group’s governance framework includes the Board and the Executive Committee. Medium-term planning initiatives are formalised within the Executive Committee, which are then reviewed regularly by the Board and are supported by periodic presentations by members of the Executive Committee.
In Q2/Q3 2020, the Board met an additional five times as the impact of the COVID-19 pandemic and consequent energy market downturn significantly reduced trading levels. At these additional meetings, reports from the Chief Executive were received, which included the short-term market outlook, current trading levels for each major business unit and Health and Safety measures being implemented to keep our workforce safe and to enable the Group’s facilities to remain operational. The Finance Director also presented reports which highlighted cash generation and liquidity projections. In addition to these meetings, the Board fulfilled its regular calendar where the normal items of business were presented.
86Hunting PLC Annual Report and Accounts 2020

The Board met 11 times in 2020 (2019 – six times), with a 100% attendance record as noted in the table below.
Number of meetings held 11Number of meetings attended (actual/possible):Annell Bay 11/11Carol Chesney 11/11Bruce Ferguson (from 15 April 2020) 8/8John (Jay) Glick 11/11Richard Hunting 11/11Jim Johnson 11/11Keith Lough 11/11Peter Rose (to 15 April 2020) 4/4
From March 2020, all Board and Committee meetings were held via teleconference or video conference, given the travel and social distancing restrictions in place in the UK and US.
Board Leadership and Company Purpose (Section 1 of the Code)Culture and PurposeThe Group has been operating since 1874 and, as such, has a long history, with a strong culture, including support for employees across all of its global operations. The Culture of the Group extends to maintaining high business standards and creating value for investors by building strong and lasting relationships with its core stakeholders. More information on engagement with, and support to, the Group’s key stakeholders can be found on pages 12 to 33.
Our Purpose is to be a deeply trusted innovator and manufacturer of technology and products that create sustainable value for our stakeholders. Hunting’s core businesses are focused on the manufacture of products which deliver oil and gas. The Directors have approved Hunting’s continued focus on energy-related markets.
The Group’s disclosures on Purpose and Culture can be found on pages 6 to 8 within the Strategic Report. As noted in the disclosures, the Culture of the Group is based on:
• a flat organisational structure; • strong HSE and Quality Assurance policies; • a highly skilled workforce; • providing fair remuneration; and • engagement and dialogue with all key stakeholders.
In the year, the Directors reviewed the organisational structure of the Group, noting its simplicity, with short chains of command to allow for rapid business decision making. It was noted that this also allowed all levels of the workforce to communicate with the senior management team directly. As part of its regular Board meeting schedule, the Directors review HSE and Quality Assurance reports from the Group’s global operations.
The Board also monitored the work of the Remuneration Committee in respect to decisions on executive remuneration, the Executive Committee and the workforce and in the year approved the revised Directors’ Remuneration Policy, which is being submitted to shareholders at the Company’s AGM on 21 April 2021.
In line with the recommendations of the Code, the Board has established procedures to monitor Culture and to ensure the views of the workforce are understood by the Directors. In 2019, the Group launched a global, all-employee engagement survey. The results of the survey were reviewed by the Directors, with appropriate actions being undertaken, following a number of areas of feedback that were received. It is anticipated that the survey will be repeated in 2021. Supporting this initiative has been a process of formalising other employee engagement initiatives including management briefings and introducing roundtable employee discussion forums.
Shareholder ViewsThe Chairman and Senior Independent Director met with shareholders in January 2020 and January 2021 to discuss governance, strategy and other matters.
During the year, the Chief Executive and Finance Director also regularly met shareholders to discuss performance and strategy. Investor meeting feedback reports are also prepared by the Group’s advisers and are circulated to the Directors.
2020 Board Meetings and Agenda Items25
Feb16
Mar1
Apr15
Apr30
Apr12
May5
Jun13 Jul
24 Aug
6 Oct
1 Dec
Standing ItemsChief Executive’s Report • • • • • • • • • • •Finance Director’s Report • • • • • • • • • • •Operational Reports • • • • • • • • • • •Quality Assurance, Health, Safety and Environmental Reports • • • • • • • • • • •Shareholder Report • • • • • •Other ItemsAnnual/Interim Report and Accounts • •Board Evaluation •Risk Review •AGM Preparation • •Trading Statement • • •Strategy • •Organisation and Personnel Review, Development and Succession • •Annual Budget •Chairman/Senior Independent Director Investor Feedback •
87Hunting PLC Annual Report and Accounts 2020
Purpose and C
ultureB
usiness Model and S
takeholdersB
usiness Strategy
Perform
anceG
overn
ance
Financial Statem
ents

Corporate Governance Reportcontinued
Annual General MeetingThe Annual General Meeting (“AGM”) of the Company is the normal mechanism for all shareholders to meet the Directors and to ask questions about the strategy and performance of the Group.
The formal business of the AGM includes receiving the Annual Report and Accounts, approving remuneration policies and outcomes, re-electing Directors, appointing the auditor and providing the Directors with powers to transact company business on behalf of its members. The Chief Executive normally provides a presentation of the Group’s performance and answers questions from shareholders.
At the Company’s Annual General Meeting in April 2020, and in line with UK government guidance in respect of public meetings, attendance to the meeting was limited to the quorum of two shareholders. All resolutions were passed at the meeting with strong majorities, with no resolutions receiving less than 80% of votes in favour. Details of the resolutions put to shareholders at the meeting can be found within the Notice of Meeting located within the “General Meetings” section of the Company’s website www.huntingplc.com.
The Company’s 2021 Annual General Meeting is being planned as a closed meeting, given the ongoing risks of COVID-19. The meeting will be accessible to shareholders via a webcast, where questions submitted ahead of the meeting will be answered by the Board. At the meeting, a new Directors’ Remuneration Policy will be submitted for shareholder approval, following a consultation process with major institutional investors which completed in Q1 2021.
Stakeholder EngagementDetails of engagement activities with all our key stakeholders and the Board can be found, within the Strategic Report, on pages 12 to 33.
Speak Up/Whistleblowing ServiceAn independent and anonymous whistleblowing reporting service has been in place for many years, allowing any employee access to the Board to raise matters of concern. During the year, there were two reports received through the SafeCall service (2019 – nine reports), all of which were reviewed by Keith Lough, the Group’s Senior Independent Director, who also receives and approves all investigation reports and corrective actions. Mr Lough verbally reports these activities to the Board during the year.
Conflicts of InterestEach Director is required to declare any potential conflict of interest that exists, or which may arise. These are formally recorded by the Company Secretary.
Appropriate decision making, in light of this declaration, is undertaken which could include a Director not participating in a Board decision or vote. Each Director is required to complete a declaration of known conflicts of interest annually.
Division of Responsibilities (Section 2 of the Code)The Hunting Board comprises the non-executive Chairman, Chief Executive, Finance Director, three independent non-executive Directors, one of whom is the Senior Independent Director and one non-independent, non-executive Director.
The profiles and experience of each Director are found on pages 82 and 83. In line with the Code’s recommendations, the Notice of Annual General Meeting incorporates details of the contribution in the year and the Board’s reasons for proposing the re-election of each Director.
There is a clear division of responsibilities between the Chairman and Chief Executive, with the Chairman required to lead the Board, while the Chief Executive runs the Group’s businesses as shown below:
Responsibilities of the Chairman • lead and build an effective and balanced Board; • chair meetings of the Board, ensuring the agenda and materials are fit for purpose;
• ensure the Directors are provided with accurate, timely and relevant information;
• encourage good dialogue between all Directors, with strong contributions encouraged from all Board members;
• meet the non-executive Directors without the executive Directors present;
• discuss training and development with the non-executive Directors;
• arrange Director induction programmes; • arrange an annual Board evaluation and act on its findings; and • ensure shareholders and other stakeholders are communicated with effectively.
Responsibilities of the Chief Executive • manage the day-to-day activities of the Group; • make strategic plan recommendations to the Board and implement the agreed Board strategy;
• identify and execute new business opportunities, acquisitions and disposals;
• ensure appropriate internal controls are in place; • report to the Board regularly on the Group’s performance and position; and
• present to the Board an annual budget and operating plan.
Responsibilities of the Non-executive Directors • provide independent challenge to executive management on the proposed strategy;
• monitor the execution of the approved strategy and of the financial performance of the Company on an ongoing basis;
• ensure executive management remain motivated and incentivised through a responsible remuneration policy; and
• ensure the integrity of financial information and internal control and risk management processes are effective and defensible.
88Hunting PLC Annual Report and Accounts 2020

To ensure an effective relationship between the Chairman and the Chief Executive and other members of the Board, the responsibilities of the Senior Independent Director are shown below:
Responsibilities of the Senior Independent Director • provide a sounding board for the Chairman and serve as an intermediary to other Directors when required;
• be available to shareholders, should the normal channels through the Chairman and Chief Executive not be appropriate;
• chair meetings of the Board, in the absence of the Chairman; • lead an annual performance evaluation of the Chairman, supported by the other non-executive Directors; and
• attend meetings with shareholders, to develop a balanced understanding of any issues or concerns.
Responsibilities of the Company SecretaryThe Company Secretary is appointed by the Board and supports the Chairman in providing all materials and information flows between the executive and non-executive Directors, specifically on matters of governance and regulatory compliance. The Company Secretary is also available to the Board and all its Committees for advice and ensures that all procedures are followed.
Directors’ and Officers’ Liability InsuranceHunting maintains insurance against certain liabilities, which could arise from a negligent act or a breach of duty by the Directors and Officers in the discharge of their duties. This is a qualifying third-party indemnity provision that was in force throughout the year.
Board IndependenceAs at 31 December 2020, excluding the Chairman, the Board comprised 50% independent non-executive Directors. Including the Chairman, 57% of the Board comprised independent Directors.
The Board, including the Chairman, has access to professional advisers, at the Company’s expense, to fulfil their various Board and Committee duties.
Board Independence (including Chairman)
1. Independent 57%2. Non-Independent 43%
1
2
Board Independence (excluding Chairman)
1. Independent 50%2. Non-Independent 50%
1
2
External AppointmentsThe Group has procedures in place that permit the executive Directors to join one other company board. In the year, neither the Chief Executive nor the Finance Director held any external board appointments.
Executive CommitteeThe Group has an Executive Committee (“ExCo”) comprising the regional managing directors of the Group and the executive Directors.
As part of the actions to address the COVID-19 pandemic the ExCo met fortnightly during Q2/Q3 2020 with the executive Directors to enable updates to be presented.
In addition, the ExCo met formally four times, to discuss the quarterly performance of each operating segment, strategic initiatives, including the progress of capital investment programmes, quality assurance and HSE performance, in addition to Human Resources and Risk Management reports.
The Company Secretary and Head of Investor Relations are also invited to meetings of the ExCo.
Composition, Succession and Evaluation (Section 3 of the Code)Board AppointmentsAll appointments to the Board are in accordance with the Company’s Articles of Association and the Code and are made on the recommendation of the Nomination Committee. Recruitment of new Directors follows Group policy, including the formulation of a detailed description of the role that gives consideration to the required skills, experience and diversity requirements for the process. The Directors usually review a list of candidates, prior to a shortlist being recommended by the Nomination Committee, ahead of face-to-face interviews with each Director.
Bruce Ferguson was appointed as a Director by shareholders at the Company’s Annual General Meeting on 15 April 2020. Peter Rose retired as an executive Director on the same date.
Further, in the year, the Nomination Committee completed an evaluation and re-appointment process for Jay Glick, Richard Hunting and Annell Bay, who were all re-appointed for a further three-year term.
The activities of the Nomination Committee are reported on pages 119 and 120.
89Hunting PLC Annual Report and Accounts 2020
Purpose and C
ultureB
usiness Model and S
takeholdersB
usiness Strategy
Perform
anceG
overn
ance
Financial Statem
ents

Corporate Governance Reportcontinued
Board Skills and ExperienceThe expertise and competencies of the non-executive Directors are noted in the table below, and underpin the balance of skills and knowledge of the Board:
Director Expertise
Annell Bay Upstream oil and gas, US energy market development and US quoted companies.
Carol Chesney Accounting, UK corporate governance, ethics compliance and UK quoted companies.
Jay Glick Oilfield services and manufacturing, US energy market development and US quoted companies.
Richard Hunting UK corporate governance, investor relations.
Keith Lough Accounting, upstream oil and gas, UK energy regulation and market development and UK quoted companies.
The tenure of the Board of Directors, as at 4 March 2021, is noted in the chart below.
Board Tenure
1. < 3 years 43%2. 3 to 9 years 43%3. > 9 years 14%
1
2
3
None of the independent non-executive Directors have been in the role for greater than nine years. Jay Glick was appointed to the Board in 2015 and appointed Chairman in 2017.
For the appointment of executive Directors, the Company enters into a Service Contract with the Director, which reflects the terms of employment, remuneration and termination, taking into account country of residence and local employment laws applicable at the time of appointment. For more information on the Service Contracts of the current executive Directors, please see the Remuneration Committee Report on page 105.
On appointment, each non-executive Director is provided with a letter of appointment, outlining the time commitments, responsibilities and fiduciary duties required under Company Law and, following Company policy, appointed for a three-year term. All appointment letters are available for inspection at the Company’s AGM or at Hunting’s registered office. Due to the small size of the Hunting Board, non-executive Directors are paid fees that are above the UK market median, reflecting a high level of time commitment required for Company matters.
Senior management appointments are reported to the Board by the executive Directors. Further, when the succession of the Company Chairman is being considered, the Senior Independent Director chairs the Nomination Committee.
Annual Re-electionAt the 2020 AGM, all Directors proposed were appointed or re-elected by shareholders, with Peter Rose retiring as planned. All Directors will retire and submit themselves for annual re-election at the 2021 AGM.
Board SuccessionSuccession planning has become an area of increased focus for the Company, in line with best practice.
The Group’s Chief HR Officer oversees the succession planning and talent development processes of the Executive Committee and senior management and presented an update to the Board at its meeting in December 2020.
Board EvaluationThe Directors undertake an internal effectiveness evaluation of the Board and its Committees annually, which includes completion of a detailed questionnaire on the operation and responsibilities in relation to the Company’s governance framework. Both the executive and non-executive Directors are appraised collectively and individually, with the results of the process reported to the Board through the Chairman.
The Board evaluation process was enhanced following the publication of the 2018 UK Corporate Governance Code and Guidance on Board Effectiveness. Following completion of the process and further Board discussion, the Chairman and the Board concluded that all Directors, all Committees and the Board itself remained effective.
In addition to the internal evaluation, the non-executive Directors, led by the Senior Independent Director Keith Lough, completed a Chairman’s performance evaluation in December 2020 and concluded that Mr Glick was an effective and capable Chair of the Company.
The Board organises an externally facilitated Board effectiveness evaluation every three years, the last being completed in 2018 by Clare Chalmers Limited. Areas of improvement were identified, with the process scheduled to be repeated externally in 2021.
Board Induction and TrainingFollowing new Board appointments, internal briefings are usually organised to introduce key finance and operational personnel and to present the structure and operation of each major business within the Group. Facility visits to the Group’s operations are usually organised and key members of the Group’s leadership team give presentations on each operating segment. In the year, the Chairman met with the non-executive Directors to discuss and agree, among other matters, training and development.
90Hunting PLC Annual Report and Accounts 2020

Diversity – Gender and Ethnicity The Group has enhanced its gender and ethnicity profile in recent years, with the Board of Directors now comprising 29% females.
Further, it is noted that 50% of the Board’s independent non-executive Directors comprise females.
Within the Executive Committee, there is also an ethnic balance which reflects the Hunting global workforce.
For further information on these areas please refer to the Strategic Report on pages 26 and 27.
Audit, Risk and Internal Control (Section 4 of the Code)The Group’s policies, procedures and approach to audit, risk and internal control is described within the Risk Management (pages 51 to 54) and Audit Committee Report (pages 121 to 125) sections of the Annual Report and Accounts.
The Risk Management section includes information on the Group’s principal and emerging risks, as required by the Code.
Remuneration (Section 5 of the Code)The Group’s remuneration principles align with the Code and are clearly linked to the long-term success of the Company.
Clarity and Simplicity
The Directors’ Remuneration Policy is based on fixed and variable emoluments. Fixed emoluments are benchmarked against other global energy services companies and the UK listed environment, to ensure the Company can attract and retain talent. Variable emoluments are based on two structures, an annual bonus and long-term incentive plan. Both variable structures are based on the Group’s disclosed key performance indicators, including both financial and non-financial measures, and only pay out when performance has been achieved. The Chief Executive’s remuneration is benchmarked against global peers, who are mostly headquartered in the US, while the Finance Director is benchmarked against UK listed companies of similar size and complexity.
Non-executive Director fees are set at levels that take into account the time commitment and responsibilities of each role. The non-executive Directors do not receive cash bonuses or other variable emoluments. The fees are benchmarked against other companies of a similar size, profile and profitability and are reviewed annually by the executive Directors. The Chairman’s fee is set by the Remuneration Committee.
The pay structures of the senior management team and wider workforce are generally based on the Company’s shareholder approved Directors’ Remuneration Policy, and can include pension and healthcare benefits as well as an annual bonus and long-term incentives.
Shareholder engagement is a key theme of the Directors’ Remuneration Policy, with proactive engagement occurring whenever major changes to Policy or Committee decision making are contemplated. The Committee is satisfied that, over time, shareholder feedback has been reflected in the Directors’ Remuneration Policy.
Risk, Predictability and Proportionality
The Committee believes that the Directors’ Remuneration Policy aligns with the risk profile of the Company, encouraging growth in the long term and discouraging excessive risk taking. The Policy is weighted towards variable pay on the delivery of long-term growth.
As noted on page 92 of the Corporate Governance Report, the remuneration paid over time has aligned well with the Group’s performance, with annual bonus and long-term incentives only vesting on outperformance.
Alignment The Board and the Remuneration Committee have reviewed the Company’s Purpose, Values and Culture and believes that the remuneration framework operated by the Company encourages strong performance, based on a culture of honesty and integrity and putting stakeholder needs at the forefront of our strategic priorities.
Fair, Balanced and Understandable AssessmentThe Board has delegated the responsibility of reviewing the Fair, Balanced and Understandable Assessment to the Audit Committee, which reviewed assessments of the half and full year results and made recommendations to the Directors in March and August.
Going Concern Basis and Viability StatementThe Audit Committee and Board review the Going Concern Basis twice a year and the Group’s Viability Statement annually, in parallel with supporting reports from the executive Directors and the Group’s central finance function. On 1 March 2021, the Board approved the Going Concern Basis and Viability Statement for the 2020 year-end, which is detailed on pages 77 to 79.
Risk Management ProceduresThe Board acknowledges its responsibility for monitoring the Group’s principal and emerging risks and the system of internal control and for reviewing its effectiveness as required by the Code, with key authorities being delegated to the Audit Committee.
At the Board’s March 2021 meeting, the Directors completed a robust assessment and review of the Group’s risk management framework and the principal risks facing the Company.
91Hunting PLC Annual Report and Accounts 2020
Purpose and C
ultureB
usiness Model and S
takeholdersB
usiness Strategy
Perform
anceG
overn
ance
Financial Statem
ents

Corporate Governance Reportcontinued
The current Directors’ Remuneration Policy was approved by shareholders on 18 April 2018, with a revised policy due to be tabled at the Company’s Annual General Meeting on 21 April 2021. The new Policy further aligns Hunting’s remuneration practices with the 2018 UK Corporate Governance Code, including:
• Increasing the alignment of the pension arrangements of the executive Directors with the workforce; and
• Introducing a post-employment shareholding policy for the executive Directors.
More information on compliance with the provisions of the Code and the emoluments paid to the Directors can be found in the Remuneration Committee Report on pages 93 to 118.
In respect of the current Directors’ Remuneration Policy and the new Code, the Committee notes the following:
• The Company’s long-term incentive arrangements extend to a five-year timeframe, with a three-year vesting period and two-year post-vesting holding period;
• Malus and clawback provisions are in place for all variable remuneration, with the triggers amended in the year in line with the recommendations of the Code;
• The Committee has flexibility within the Directors’ Remuneration Policy to exercise appropriate discretion; and
• Pension provisions for new executive Director appointments will align with the workforce in the future.
The chart below summarises the components of executive remuneration and the key performance indicators that are inputs to the remuneration outcomes.
Summary of Remuneration Structure and KPIs
Base Salary
Benefits PensionProvision
Annual Bonus
Long-TermIncentive
KPIs
Profit before taxROCE
Personal Objectives
KPIs
ROCETSREPS
SafetyQuality Assurance
Fixed Variable
The Board believes that the remuneration framework aligns with the Purpose, Values and Culture of the Group, which is based on fair remuneration and reflects performance in the long term. This framework is also in place for the senior management of the Group with participation in annual bonuses and inclusion in the long-term incentive scheme operated by the Company also featuring in emolument structures in many levels of the workforce. The Remuneration Committee sets executive Director remuneration and reviews policies for the senior management and the wider workforce.
John (Jay) F. GlickChairman
4 March 2021
Group Profit before Tax ($m) vs Chief Executive Remuneration ($k) PBT CEO Pay
150
100
50
-50
-100
0
6,000
4,000
2,000
0
-4,000
-2,000
2016 2017 2018 20202019
92Hunting PLC Annual Report and Accounts 2020

Letter from the Chair of the Remuneration CommitteeHunting’s results for 2020 were significantly impacted by the global energy market downturn and the COVID-19 pandemic, which gripped global economies from Q1 2020 and continued throughout the balance of the year. The resultant economic decline, coupled with a price war by key oil producers, contributed to a material reduction in industry activity. This impacted the Group’s onshore focused businesses in Q2, and then weakened Hunting’s offshore businesses as industry activity and capital investments were deferred or cancelled. The lower revenue and trading losses reported for the full year reveal the scale of the industry downturn, and are reflected in the reduction to executive remuneration paid during the year.
The focus of the Remuneration Committee in the year has been to monitor Group and personal performance, taking into account the regulatory announcements made throughout the COVID-19 crisis and to make decisions on executive remuneration which endeavour to reflect the shareholder experience while also recognising the work undertaken by the Group’s leadership team as they navigated through highly volatile trading conditions.
Base salaries for the executive Directors were frozen in 2020. The annual bonuses for executive Directors include financial and strategic/personal targets, the latter portion being achieved in full in the year, following strong performance and reflecting key strategic initiatives completed, despite the unprecedented decline in industry activity. This portion of the bonus was reduced by 50%, given the nil vesting of the financial portion of the bonus leading to an overall vesting of 10% of the maximum bonus opportunity. The measurement of performance targets, in respect of share awards granted in 2018 under the rules of the Hunting Performance Share Plan, resulted in a partial vesting of the TSR and Strategic Scorecard elements, demonstrating an Above Median performance against our peers, in addition to delivery of strong operational safety and quality performance throughout the vesting period. This performance will lead to a 15.75% pay-out in April 2021.
Overall, the Chief Executive’s and Finance Director’s total remuneration declined 50% and 53% respectively during 2020 compared to the prior period, reflecting good alignment between the operation and outcomes of the Remuneration Policy and the shareholder experience for the period under review.
The Committee has spent the second half of 2020 preparing a revised Directors’ Remuneration Policy for shareholder approval at the Company’s Annual General Meeting in April 2021. The proposed amendments better align the Policy with the 2018 UK Corporate Governance Code and were subject to a shareholder consultation process undertaken in the last few months of the year. We trust that they will receive your support.
Annell BayChair of the Remuneration Committee
IntroductionOn behalf of the Board, I am pleased to present the Remuneration Committee Report to shareholders for the year ended 31 December 2020. This letter provides a summary of the work completed by the Remuneration Committee (the “Committee”) in the year, including the major decisions taken and details of how the approved Directors’ Remuneration Policy was implemented during the year.
The Committee met three times in the year, compared to four times in 2019. However, all usual matters for consideration were covered in the year.
Major Decisions Made by the CommitteeCOVID-19 As noted above, the impact of COVID-19 and the significant market downturn seen across the global oil and gas industry affected the Group’s trading results for the year. The Committee discussed the impact of the pandemic on the Group’s remuneration framework and concluded that no changes to the implementation or recorded outcomes of the shareholder approved Directors’ Remuneration Policy would be made for the year, given the strongly cyclical nature of the oil and gas industry. This has led to small payments of annual bonuses and long-term incentives being recorded in the year. The Committee strongly believes that the design of the Policy aligns closely with the shareholders’ overall experience and only pays out when performance has been delivered. The Group’s trading results and executive remuneration both declined materially in 2020, demonstrating the close alignment between the two.
As part of its decision making, the Committee considered the Board’s consistent approach to capital allocations made in the year, including dividend distributions and capital expenditure that have aligned with the general market environment. Our leadership teams have performed admirably during the year and given that a number of businesses in the US and Asia Pacific met or exceeded their budgetary targets set at the start of the year, selected workforce and management bonuses have been paid to reflect this strong performance. This consistent approach to remuneration has been reflected at all levels of the Group and supports the bonuses paid to the executive Directors, as noted below.
The Committee noted that the Group had received $3.6m in furlough and employee support funds, which for the most part was received in Canada, and decided not to adjust the pay framework in operation at all levels of the Group given the relative levels of allocations made.
Further, the Committee considered the decline in the Company’s share price compared to the prior year in their decision making when reviewing the remuneration of the executive Directors during the year and reduced the quantum of the 2020 award under the HPSP to an appropriate level which reflect the shareholder experience in the year.
Base Salary and Fee Review The Committee met in August 2020 to consider adjustments to the base salaries of the executive Directors. The Committee noted the Group-wide salary freezes in place as a result of the market downturn and, following discussion, agreed to leave the base salaries of the Chief Executive and Finance Director unchanged. As noted in the Corporate Governance Report, shareholders elected Bruce Ferguson as Finance Director at the Company’s Annual General Meeting in April 2020. Mr Ferguson’s base salary was set at £275,000 per annum, 19% below that of his predecessor and with a reduced pension allowance rate of 12% in line with the UK workforce, reflecting the recent practice of setting lower salaries for new executive Directors.
Remuneration Committee ReportFor the year ended 31 December 2020
93Hunting PLC Annual Report and Accounts 2020
Purpose and C
ultureB
usiness Model and S
takeholdersB
usiness Strategy
Perform
anceG
overn
ance
Financial Statem
ents

Remuneration Committee Reportcontinued
Annual Bonus The Group did not meet its budgetary targets for 2020, given the decline in market conditions, resulting in a nil vesting of the financial components of the bonus.
The Committee met in January 2021 to review the delivery of the personal/strategic performance objectives by the executive Directors. The Committee noted the bonus payments being made within the Group for those businesses which performed well in the year as well as the evolution of the Group’s agreed Strategic Plan, despite market conditions, and following discussion, agreed to award 10% of the maximum bonus opportunity to each executive Director. This reflects the full delivery of personal targets, but was halved following the nil vesting of the financial targets which is in line with the operation of the annual bonus plan. The Committee did not apply discretion to the annual bonus outcome.
Further, the Committee noted the Group’s current policy of conserving cash and will satisfy the post-tax value of the bonus by delivering Ordinary shares in the Company to each executive Director. 100% of these shares are to be held for a minimum of one year with 25% of the balance to be held for a minimum of two years.
On this basis, Mr Johnson will receive a bonus of $147k, while Mr Ferguson will receive a bonus of $37k and Mr Rose will receive a bonus of $65k.
HPSP Awards GrantedThe Committee implemented a 20% reduction to the level of HPSP awards granted in March 2020 compared to awards granted in 2019. In January 2021, the Committee met to discuss the basis of the 2021 award under the HPSP and have agreed to implement a 22% reduction to the award levels across the Group.
HPSP Awards Vesting The 2018 awards under the HPSP are due to vest on 19 April 2021 and incorporate four performance conditions, being ROCE (35%), EPS (25%), TSR (25%) and a Strategic Scorecard (15%). The ROCE and EPS performance conditions are based on performance targets to be delivered for the financial year ending 31 December 2020. The Strategic Scorecard comprises two non-financial sub-measures, being the Group’s Safety and Quality performance across the performance period.
Following measurement of the financial elements of the award, the ROCE and EPS performance conditions recorded a nil vesting. The TSR condition, which is measured independently by Mercer/Kepler, vested at 8.25% and the Strategic Scorecard recorded a 7.5% vesting, leading to a total vesting of 15.75%. The Committee did not apply overriding discretion to adjust the vesting of the 2018 HPSP.
On this basis, Mr Johnson will be entitled to receive 45,143 Ordinary shares on the vesting date. Mr Rose’s 2018 award was pro-rated to his leaving date of 31 December 2020, and he will be entitled to receive 12,352 Ordinary shares.
Reflecting his prior role below the Board, Mr Ferguson’s 2018 award under the HPSP included both performance- and time-based share awards, with the latter vesting in full on the basis of his continued service to the Group across the performance period. In total Mr Ferguson will be entitled to receive 15,788 Ordinary shares on the vesting date.
Dividend equivalents accrued during the period totalling 19.0 cents per share will be added to the vesting amount. All vested shares will be held for a minimum period of two years from the vesting date.
New Directors’ Remuneration PolicyThe Committee met in August 2020 to consider amendments to the Directors’ Remuneration Policy, which are to be tabled for shareholder approval at the AGM of the Company in April 2021.
In line with the recommendations published by UK regulators, the Committee decided to limit these changes to align better with the 2018 UK Corporate Governance Code.
On this basis, the new Policy includes amendments to the pension arrangements for new executive Directors appointed to the Board. Further, the Committee has agreed to reduce the maximum grant levels under the HPSP to 450% (from 550%) for the Chief Executive and 210% (from 450%) for the Finance Director.
In line with the Code, the Committee is also implementing a post-employment shareholding Policy for executive Directors. The Committee believes these amendments are appropriate for the size and profile of the Group.
The Committee consulted with major shareholders on the proposed changes to the Policy in Q4 2020 and Q1 2021, with most shareholders indicating their support for the changes.
Retirement of Finance DirectorPeter Rose gave notice to the Company of his retirement on 22 January 2020. Mr Rose retired as Finance Director on 15 April 2020 but continued as a full-time employee until 31 December 2020, in order to assist in a smooth transition of his role to Mr Ferguson. In accordance with the terms of his service contract Mr Rose was paid all elements of his fixed and variable remuneration which totalled $670k in the year. The Committee noted that during the year, Mr Rose had provided advice in respect to the liquidity and cash generation initiatives underway as the market declined, in addition to providing input to the asset impairment review work undertaken at the half year. Mr Rose therefore will receive an annual bonus in line with his service contract and his outstanding awards under the HPSP, which will be subject to performance measurement over the next three years, have been pro-rated to 31 December 2020.
2020 AGM ResultAt the Company’s AGM held on 15 April 2020, the Company received 93.69% votes in favour of the resolution to approve the 2019 Annual Report on Remuneration.
Context of Remuneration Awarded in 2020The Group’s performance in the year, as noted above, has led to a 10% vesting of the maximum annual bonus opportunity and a 15.75% vesting of the 2018 HPSP award. Both elements of variable remuneration are “Below Target” given the industry downturn noted above.
The single figure remuneration paid to Jim Johnson was $1.1m in 2020 and the remuneration paid to Bruce Ferguson, following his appointment to the Board on 15 April 2020, was $344k.
In 2019, the remuneration paid to the executive Directors reflected an “Above Threshold” annual bonus award and an “Above Target” vesting of the HPSP.
The Committee is satisfied that total pay outcomes are appropriate in the context of Group performance across the periods covered by these short- and long-term incentives.
94Hunting PLC Annual Report and Accounts 2020

Activities Undertaken by the Remuneration Committee During 2020
Feb Aug Dec
Overall RemunerationAnnual base salary review •Review senior management annual emoluments paid •Review total remuneration against benchmarked data •Items Specific to Annual BonusApprove annual bonus including delivery of personal/strategic performance targets •Review Annual Bonus Plan rules •Agree personal/strategic performance targets for year ahead •Items Specific to Long-term IncentivesApprove HPSP vesting and new annual grant •Review HPSP performance conditions •Review HPSP grant performance targets •Governance and Other MattersApprove Annual Report on Remuneration •Review and approve Remuneration Policy (if required) •Review governance voting reports •Review AGM proxy votes received for Annual Statement of Remuneration and Policy •Review Committee effectiveness •Terms of reference •
Annell BayChair of the Remuneration Committee
4 March 2021
95Hunting PLC Annual Report and Accounts 2020
Purpose and C
ultureB
usiness Model and S
takeholdersB
usiness Strategy
Perform
anceG
overn
ance
Financial Statem
ents

Remuneration at a Glance
Remuneration Policy and 2020 AGM ResultThe remuneration framework adopted in the year aligned with the Policy approved by shareholders on 18 April 2018. The details of this Policy can be found within the 2017 Annual Report and Accounts at www.huntingplc.com.
At the Annual General Meeting of the Company on 15 April 2020, the resolution to approve the Annual Report on Remuneration was supported by a 93.69% vote in favour.
Company Performance SummaryAs noted in the Letter from the Chair of the Remuneration Committee, the Group reported lower revenues in the year and an underlying loss before tax of $19.4m and ROCE of -1.5%.
The PBT and ROCE portions of the annual bonus did not reach the required threshold targets and therefore 80% of the maximum bonus opportunity did not vest. Following a review of the delivery of the personal/strategic performance objectives for the executive Directors in relation to the remaining 20% of annual bonus, a partial vesting was recorded and this was further capped to 10% of the maximum bonus opportunity, in line with the operation of the plan. Performance measurement of the 2018 awards under the HPSP recorded a combined 15.75% vesting, resulting from an Above Median performance of the TSR, a capped vesting of the Strategic Scorecard component and a nil vesting of the EPS and ROCE performance elements.
Link to Strategy and KPIsThe Group’s Key Performance Indicators are noted on pages 74 and 75, and include financial measures including profit before tax, return on capital employed and net earnings growth. Non-financial measures are incorporated into HPSP awards and include the Group’s Quality and Safety performance. Both these metrics underpin Hunting’s standing and reputation in the global energy industry which, in turn, support the Group’s long-term strategy.
The Company’s chosen financial and non-financial KPIs are therefore central to measuring Hunting’s long-term success and are fully integrated into the remuneration framework approved by shareholders. The Committee also believes that these KPIs help align executive remuneration with the shareholder experience.
2020 Annual Bonus Targets and OutcomeThe annual bonus for executive Directors is based on profit before tax, return on capital employed and personal/strategic performance targets.
Target underlying profit before tax $64.4mTarget underlying ROCE 6.9%Actual underlying (loss) before tax $(19.4)mActual underlying ROCE (1.5)%
Base Salaries and PensionGiven the base salary freezes implemented across the Group in the year, Jim Johnson’s base salary remained unchanged. Bruce Ferguson’s appointment was approved by shareholders at the AGM of the Company on 15 April 2020. Mr Ferguson’s base salary was set at £275,000, which is 19% below that of his predecessor. Benefits paid in 2020 aligned with the current Directors’ Remuneration Policy. Mr Ferguson’s pension allowance was set at 12% of base salary, in line with the UK workforce, compared to that of his predecessor who received a contribution of 25% of base salary.
Chief Executive $735,000Unchanged
Finance Director(appointed 15 April 2020)
£275,000-19% vs predecessor
Annual BonusGiven that the financial targets of the annual bonus were not achieved, the Committee reviewed the delivery of the personal/strategic performance objectives by the executive Directors. Following discussion, it was agreed that the objectives had been met in full, leading to a full vesting of this component of the bonus award. Under the rules of the plan, this component of the bonus is capped at half of the maximum if the financial targets have not been met. On this basis, Jim Johnson will receive a bonus of $147k; Bruce Ferguson will receive a bonus of $37k and Peter Rose will receive a bonus of $65k. In line with the Group’s current policy of conserving cash, the whole bonus amount will be delivered in shares, with 25% of the post-tax value to be held for two years in line with the normal operation of the bonus, while the balance of 75% will be delivered in shares to be held for one year.
Chief Executive $147k
Finance Director – Bruce Ferguson (appointed 15 April 2020)
$37k
Finance Director – Peter Rose (retired 15 April 2020)
$65k
96Hunting PLC Annual Report and Accounts 2020
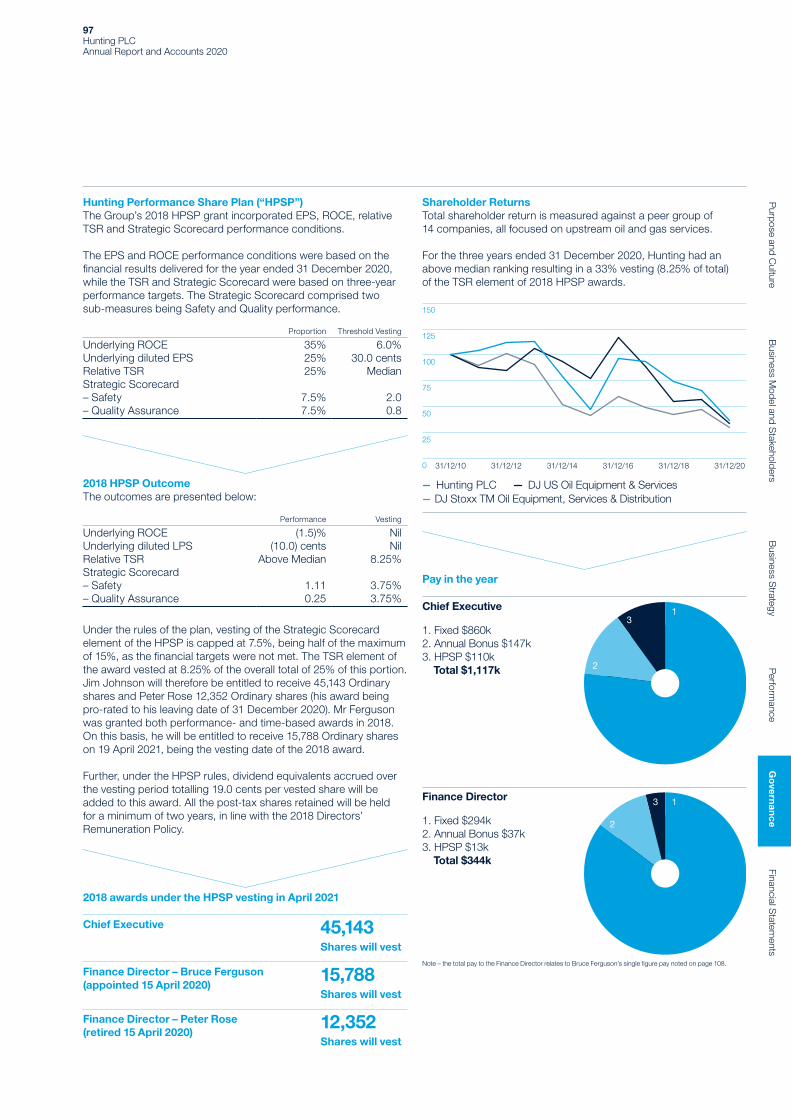
Hunting Performance Share Plan (“HPSP”)The Group’s 2018 HPSP grant incorporated EPS, ROCE, relative TSR and Strategic Scorecard performance conditions.
The EPS and ROCE performance conditions were based on the financial results delivered for the year ended 31 December 2020, while the TSR and Strategic Scorecard were based on three-year performance targets. The Strategic Scorecard comprised two sub-measures being Safety and Quality performance.
Proportion Threshold Vesting
Underlying ROCE 35% 6.0%Underlying diluted EPS 25% 30.0 centsRelative TSR 25% MedianStrategic Scorecard– Safety 7.5% 2.0– Quality Assurance 7.5% 0.8
2018 HPSP OutcomeThe outcomes are presented below:
Performance Vesting
Underlying ROCE (1.5)% NilUnderlying diluted LPS (10.0) cents NilRelative TSR Above Median 8.25%Strategic Scorecard– Safety 1.11 3.75%– Quality Assurance 0.25 3.75%
Under the rules of the plan, vesting of the Strategic Scorecard element of the HPSP is capped at 7.5%, being half of the maximum of 15%, as the financial targets were not met. The TSR element of the award vested at 8.25% of the overall total of 25% of this portion. Jim Johnson will therefore be entitled to receive 45,143 Ordinary shares and Peter Rose 12,352 Ordinary shares (his award being pro-rated to his leaving date of 31 December 2020). Mr Ferguson was granted both performance- and time-based awards in 2018. On this basis, he will be entitled to receive 15,788 Ordinary shares on 19 April 2021, being the vesting date of the 2018 award.
Further, under the HPSP rules, dividend equivalents accrued over the vesting period totalling 19.0 cents per vested share will be added to this award. All the post-tax shares retained will be held for a minimum of two years, in line with the 2018 Directors’ Remuneration Policy.
2018 awards under the HPSP vesting in April 2021
Chief Executive 45,143Shares will vest
Finance Director – Bruce Ferguson (appointed 15 April 2020)
15,788Shares will vest
Finance Director – Peter Rose (retired 15 April 2020)
12,352Shares will vest
Shareholder ReturnsTotal shareholder return is measured against a peer group of 14 companies, all focused on upstream oil and gas services.
For the three years ended 31 December 2020, Hunting had an above median ranking resulting in a 33% vesting (8.25% of total) of the TSR element of 2018 HPSP awards.
Hunting PLC DJ US Oil Equipment & ServicesDJ Stoxx TM Oil Equipment, Services & Distribution
31/12/10 31/12/12 31/12/14 31/12/16 31/12/18 31/12/20
150
125
100
75
50
25
0
Pay in the year
Chief Executive
1. Fixed $860k2. Annual Bonus $147k3. HPSP $110k Total $1,117k
1
2
3
Note – the total pay to the Finance Director relates to Bruce Ferguson’s single figure pay noted on page 108.
Finance Director
1. Fixed $294k2. Annual Bonus $37k3. HPSP $13k Total $344k
1
2
3
97Hunting PLC Annual Report and Accounts 2020
Purpose and C
ultureB
usiness Model and S
takeholdersB
usiness Strategy
Perform
anceG
overn
ance
Financial Statem
ents

Directors’ Remuneration Policy
Policy OverviewThis report outlines the Directors’ Remuneration Policy (the “Policy”), which will be applied by the Hunting Board for the executive and non-executive Directors of the Company from the date of the 2021 AGM, subject to shareholder approval. The revised Policy includes a small number of changes, all of which are aimed at reflecting the evolution in investor thinking on best practice since the Policy was last approved. The Committee will keep under consideration whether a further review of the Policy is warranted ahead of the normal triennial review cycle, once there is greater visibility on Hunting’s chosen trading markets. Revisions to the Policy will be tabled for approval by shareholders at the Company’s Annual General Meeting on 21 April 2021. Subject to approval, the new Policy will be published on the Company’s website at www.huntingplc.com.
Policy ChangesThe Committee is proposing three changes to the former Policy which better align with the 2018 UK Corporate Governance Code and evolving remuneration practices in the UK.
1) Reducing the Maximum Award Limits under the Hunting Performance Share Plan (“HPSP”)The Committee is reducing the maximum award limits under the HPSP for the Chief Executive from 550% of base salary to 450%; and for the Finance Director from 450% of base salary to 210%. The new levels reflect the current award levels to the executive Directors which have been used since inception of the HPSP in 2014.
2) Introducing a Post-Employment Shareholding PolicyThe Committee is introducing a policy in line with the recommendations of the 2018 UK Corporate Governance Code. The policy requires executive Directors to hold shares equivalent to the lesser of their actual ownership at the date of stepping down as an executive Director, or 200% of salary for a minimum of 12 months.
3) Revised Pension Arrangement for New Executive DirectorsNew executive Directors appointed to the Board will be given a pension contribution of 12% of base salary, in line with the UK workforce. In 2020, the Group appointed a new Finance Director in line with this policy.
The current Chief Executive’s pension arrangements have been left unchanged given that his arrangements reflect his long tenure with the Group and legacy policies in place for many years.
The Policy is designed to comply with the principles of the UK Corporate Governance Code and the Companies Act 2006 regarding remuneration and to ensure that the Company can attract, retain and motivate talented executive Directors to promote and deliver long-term success for the Group. The package comprises fixed and variable incentives and is structured to link total reward for both corporate and individual performance.
The remuneration opportunities of the Chief Executive and Finance Director are based on externally benchmarked data aimed at providing them with competitive levels of remuneration in the relevant market. The Chief Executive’s remuneration is benchmarked to global peers who are mostly headquartered, or publicly listed in the US, and who are of a similar profile and size to Hunting, while also being reputable peers in the oil and gas equipment and services sector. The Finance Director is benchmarked to UK listed companies of similar size.
Non-executive Director fees are set at levels that take into account the time commitment and responsibilities of each role. Given the small size of the Hunting Board, each non-executive Director is required to give an above average time commitment to Group matters. The non-executive Directors do not receive bonuses or other variable emoluments. The fees are benchmarked to other companies of a similar size, profile and profitability and are reviewed annually by the executive Directors. The Chairman’s fee is set by the Remuneration Committee. The Remuneration Policy tables which follow provide an overview of each element of the Directors’ Remuneration Policy.
The 2018 UK Corporate Governance Code sets out principles against which the Committee should determine the Policy for executives. A summary of the principles and how the revised Hunting Remuneration Policy reflects these is set out earlier in the Corporate Governance Report on pages 91 and 92.
98Hunting PLC Annual Report and Accounts 2020

Purpose and link to strategy Operation Maximum opportunity Performance metricsProposed changes to policy from 2021
Base Salary • To attract, retain and reward executives with the necessary skills to effectively deliver the Company strategy.
• Base salaries are set at competitive rates, which take into account the individual’s country of residence and primary operating location as well as pay for similar roles in comparable companies.
• Aimed at the market mid-point.
• Annual increases take into account company performance, inflation in the UK, US and increases across the wider workforce.
• Relocation and tax equalisation agreements are also in place for employees working across multiple geographic jurisdictions.
• There is no prescribed maximum annual increase. Increases will normally be guided by the general increase for the broader employee population, but on occasions may need to recognise, for example, development in role, change in responsibility, and/or specific retention issues.
• Individual and Group performance are taken into account when determining appropriate salaries.
• None.
Pension • To provide normal pension schemes appropriate to the country of residence.
• The Group currently contributes on behalf of the Chief Executive to a US 401K deferred savings plan and an additional deferred compensation scheme.
• The Finance Director receives an annual cash sum in lieu of contributions to a company pension scheme.
• Pension contributions vary based on individual circumstances and local market practice. Further details are set out on page 104.
• Any future executive Director appointees in the UK will receive a 12% of salary pension contribution in line with the majority of employees. Any future executive Director appointees in the US will have a cap of 12% of salary contribution, through qualified and non-qualified savings plans.
• None. • Aligned pension contributions (as % of salary) for new executive Director appointees with a maximum of 12% of base salary.
Benefits • To provide normal benefits appropriate to the country of residence.
• Each executive Director is provided with healthcare insurance and a company car with fuel benefits.
• Additional benefits may be provided to ensure the Group remains competitive within the relevant local market.
• There is no maximum value set on benefits. They are set at a level that is comparable to market practice.
• None. • None.
Executive Director Remuneration Policy TableFixed Emoluments
99Hunting PLC Annual Report and Accounts 2020
Purpose and C
ultureB
usiness Model and S
takeholdersB
usiness Strategy
Perform
anceG
overn
ance
Financial Statem
ents

Directors’ Remuneration Policycontinued
Purpose and link to strategy Operation Maximum opportunity Performance metricsProposed changes to policy from 2021
Annual Bonus • To incentivise annual delivery of financial and operational targets.
• To provide a high reward potential for exceeding demanding targets.
• Awards are subject to the Annual Bonus Plan rules adopted by the Board in 2010.
• Bonus begins to accrue when 80% of the Annual Budget targets are achieved and increases on a straight-line basis to a maximum when 120% of Budget is achieved.
• For an on-target performance, defined as actual results equal to the Budget, the Chief Executive is paid 100% of base salary and the Finance Director is paid 75% of base salary.
• 25% of any Annual Bonus is normally payable in Hunting shares. These shares are required to be held for two years from the vesting date.
• Malus and clawback provisions are incorporated and allow the Committee to reduce the bonus, potentially down to zero, in cases of material financial misstatement, calculation error, gross misconduct or actions which cause reputational damage to the Company.
• The Chief Executive and Finance Director have a maximum opportunity of 200% and 150% of salary, respectively.
• 80% of the Annual Bonus will be based on financial measures, with the remainder based on strategic/personal performance measures, selected annually by the Remuneration Committee to reflect key performance indicators for the year ahead.
• The vesting of the strategic/personal component is normally subject to a financial underpin. Should the financial targets not be met, a 50% vesting cap of the personal/strategic component would normally be implemented.
• Introduction of an additional trigger for malus and clawback linked to protecting the Company’s reputation.
Executive Director Remuneration Policy TableVariable Emoluments
100Hunting PLC Annual Report and Accounts 2020

Purpose and link to strategy Operation Maximum opportunity Performance metricsProposed changes to policy from 2021
Hunting Performance Share Plan (“HPSP”) • To align the interests of executives with shareholders in growing the value of the business over the long term.
• The HPSP provides for annual awards of performance shares or nil cost options to eligible participants.
• Vesting is based on a three-year performance period.
• On vesting, awards are subject to an additional two-year holding period (subject to settlement of any tax charges on vesting).
• Awards are subject to malus and clawback provisions which cover cases of material financial misstatement, calculation error, gross misconduct or actions which cause reputational damage to the Company.
• The Committee has the ability to exercise discretion to override the HPSP outcome in circumstances where strict application of the performance conditions would produce a result inconsistent with the Company’s remuneration principles. Any upward discretion would be subject to prior shareholder consultation.
• In respect of vested shares, participants are eligible to receive an amount equivalent to dividends paid by the Company during the vesting period once the final vesting levels have been determined, either in cash or shares.
• Chief Executive: 450% of base salary.
• Finance Director: 210% of base salary.
• Achievement of a threshold performance target results in a 25% vesting for any portion of the award.
• Awards will vest on achievement of financial and strategic performance measures, measured over a three-year performance period.
• Financial measures will include EPS, ROCE and TSR and will receive an aggregate weighting of 85% of each award. A fourth measure, in the form of a Strategic Scorecard, which will comprise a number of submeasures, will have an aggregate weighting of 15% of each award.
• Removal of higher exceptional HPSP limits of 550% of salary for the Chief Executive and 450% of salary for the Finance Director.
• Introduction of an additional trigger for malus and clawback linked to protecting the Company’s reputation.
Minimum Stock Ownership Requirement • To encourage the retention of shares under award to the executive Directors.
• To align the long-term interests of the executive with shareholders.
• Directors have five years to achieve the required holding level from the date of their appointment to the Board.
• The Board has discretion to extend this time period if warranted by individual circumstances.
• The target holding of the Chief Executive is equal to the market value of 500% of base salary and for the Finance Director 200% of base salary.
• None. • None.
101Hunting PLC Annual Report and Accounts 2020
Purpose and C
ultureB
usiness Model and S
takeholdersB
usiness Strategy
Perform
anceG
overn
ance
Financial Statem
ents
Directors’ Remuneration Policycontinued
Purpose and link to strategy Operation Maximum opportunity Performance metricsProposed changes to policy from 2021
Post-Employment Shareholding Requirement • To continue to align the long-term interests of the executive with shareholders for a period after they have left the Group.
• To incentivise good succession planning.
• Directors are required to retain a holding in Hunting shares for a period after stepping down as an executive Director.
• The Committee will have discretion to reduce/waive the requirement in exceptional circumstances.
• Executive Directors must continue to hold shares equivalent to the lesser of their actual ownership at the date of stepping down as an executive Director and 200% of base salary, for a minimum of 12 months.
• This requirement will apply to shares acquired under the deferred Annual Bonus and HPSP granted after the 2021 AGM.
• None. • New requirement under the proposed Policy.
Non-executive Director Remuneration Policy TableThe remuneration of the non-executive Directors is designed to reflect the time and commitment of each to their respective roles.
Purpose and link to strategy Operation Maximum opportunity Performance metricsProposed changes to policy from 2021
Chairman and Non-executive Director Fees • To attract and retain high-calibre non-executive Directors by offering a market competitive fee.
• Fees for the Chairman and non-executive Directors are determined by the Board as a whole, following receipt of external fee information and an assessment of the time commitment and responsibilities involved.
• The Chairman is paid a single consolidated fee for his responsibilities including chairing the Nomination Committee.
• The non-executive Directors are paid a basic fee.
• Directors may be paid an additional fee to reflect their responsibilities, for example Directors who chair the Board’s Audit and Remuneration Committees and the Senior Independent Director.
• The non-executive Directors and Chairman do not participate in the Group’s share plans and do not receive a cash bonus or any other benefits.
• Fees paid to the non-executive Directors are benchmarked to other UK companies of a similar size and profile to the Group.
• Given the small size of the Board, each non-executive Director is expected to give an above average time commitment to Group matters and fees are based on this increased commitment.
• The aggregate maximum fees for all non-executive Directors within the Company’s Articles of Association are £750,000.
• None. • None.
Executive Director Remuneration Policy TableVariable Emoluments continued
102Hunting PLC Annual Report and Accounts 2020

Purpose and link to strategy Operation Maximum opportunity Performance metricsProposed changes to policy from 2021
Minimum Stock Ownership Requirements • To align the non-executive Directors’ interests with the long-term interests of shareholders.
• Non-executive Directors are required to build up a holding of shares in the Company and have five years to achieve the required holding level from the date of their appointment to the Board.
• The target holding for the Chairman and non-executive Directors is equal to 100% of the annual fee.
• None. • None.
Amendments to the PolicyThe oil and gas industry remains a competitive marketplace, therefore recruiting and retaining the right individuals to deliver long-term shareholder growth is a key focus of management and the Remuneration Committee. It is anticipated that recruitment and retention will remain a challenge for the sector and, therefore, the Committee will continue to keep the approved Policy under review, and will make any necessary revisions after appropriate consultation and approval from shareholders has been received.
Relevance to Employee PayThe Policy tables summarise the remuneration structure that operates for executive Directors within Hunting and which also applies to senior executives of the Group. While bonus and pension arrangements are in place for most of the Group’s employees, lower aggregate remuneration operates at below the executive Director and senior manager level, with total remuneration driven by market comparatives and the individual responsibilities of each role.
Choice of Performance MetricsThe corporate strategy includes promoting the long-term success of the Group by investing in its existing products and services portfolio through capital investment or by acquisition and growing the business in a way that is aligned with the evolving global energy industry.
The performance of the executive Directors in executing this strategy is evaluated by the following key performance indicators (“KPIs”), which drive the variable components of the executive Directors’ emoluments.
Performance condition Variable incentive Rationale
Underlying Profit before Taxation
Annual Bonus • PBT is a management KPI used to measure the underlying performance of the Group.
• PBT reflects the achievements of the Group in a given financial year and recognises sustained profitability measured against an agreed Annual Budget.
Underlying Return on Capital Employed
Annual Bonus HPSP
• ROCE is a management KPI used to measure the longer-term performance of the Group.
• ROCE reflects the value created on funds invested in the short and medium term.
Total Shareholder Return HPSP • Reflects the Group’s long-term goal to achieve superior levels of shareholder return.
Underlying Earnings Per Share
HPSP • To encourage sustained levels of earnings growth over the long term.
Strategic/Personal Objectives
Annual Bonus HPSP
• To capture and incentivise delivery of key strategic milestones that contribute to long-term success.
The HPSP performance conditions and growth targets can be amended by the Remuneration Committee, with the targets set annually when each award is granted, following an assessment of the growth prospects of the Group.
Taken together, the Committee believes that the executive Directors are appropriately incentivised to deliver both short- and long-term performance based on these metrics.
103Hunting PLC Annual Report and Accounts 2020
Purpose and C
ultureB
usiness Model and S
takeholdersB
usiness Strategy
Perform
anceG
overn
ance
Financial Statem
ents

Directors’ Remuneration Policycontinued
Remuneration Committee DiscretionThe Committee has defined areas of discretion within the Directors’ Policy framework. Where discretion is applied, the Committee will disclose the rationale for the application of discretion. The Committee will operate the Annual Bonus plan and HPSP in accordance with the relevant plan rules and this Policy. The Committee retains discretion as to the operation and administration of these plans as follows:
Annual Bonus • Discretion to adjust the amount of any bonus to reflect any fact or circumstance that the Committee considers to be relevant, and to ensure that the outcome is a fair reflection of performance.
• The assessment of part-year performance in the event of the exit of a Director, including but not limited to, reviewing forecast financial performance of the Group and the outlook of the business in the context of wider market conditions. Bonus awards for good leavers will generally be pro-rated for the proportion of the performance period completed.
• The Committee may apply discretion to vary the percentage of an award settled in cash or shares.
HPSP • Selection of the TSR comparator group for the HPSP. The Committee reviews the comparator group annually ahead of each grant made to the executive Directors under the HPSP. The Committee also retains the discretion to make adjustments to the comparator group for subsisting awards if it believes that a constituent of the comparator group has distorted the vesting outcome if, for example, a constituent company has been subject to a material corporate action.
• The Committee may amend the performance conditions applying to an award in exceptional circumstances if the new performance conditions are considered fair and reasonable, and are neither materially more nor materially less challenging than the original performance conditions when set. The oil and gas industry is a highly cyclical industry, where sentiment is driven by oil and gas commodity prices and activity levels across the industry. Given that these market conditions are outside management’s control, the Committee retains the discretion to partially adjust the performance targets of the performance conditions adopted for the HPSP, to align with the general market outlook, while continuing to be a demanding and stretching incentive. Any upward discretion would be subject to prior shareholder consultation.
OtherThe Committee reserves the right to make any remuneration payments and payments for loss of office (including exercising any discretions available to it in connection with such payments) that are not in line with the Policy outlined above where the terms of the payment were agreed either:
• before the Policy came into effect; or • at a time when the relevant individual was not a Director of the Company and, in the opinion of the Committee, the payment was not in consideration for the individual becoming a Director of the Company.
Detailed PolicyBase Salaries and FeesBase salaries and fees are reviewed annually. In considering appropriate salary levels for the executive Directors, the Committee takes into account their experience and personal performance, the remuneration paid by comparable companies in terms of asset size, revenues, profits, number of employees, market capitalisation and the complexity and international spread of Group operations, as well as Group-wide salary increases and applicable rates of inflation. Other relocation and taxation agreements are also in place for key executives.
Base fee increases for the non-executive Directors are based on external benchmarking of market data for fees paid by comparable companies.
BenefitsOther benefits provided to the executive Directors as part of their remuneration package include the provision of appropriate healthcare insurance, life and disability insurance, car and fuel benefits.
PensionThe Group contributes to the pension arrangements of both the Chief Executive and Finance Director.
Jim Johnson currently participates in the Group’s US 401K deferred savings plan. In addition, and consistent with similarly long-tenured US employees, the Group contributes to a deferred compensation scheme. In practice, this compensation scheme is operated on a money purchase basis. Annual contributions to Jim Johnson are up to an equivalent of 18% of salary.
As a recent appointee, and consistent with both the intention set out in last year’s report and the Policy table above, Bruce Ferguson receives an annual cash sum equivalent to 12% of salary which is aligned with the contribution rate offered to the majority of UK employees. A similar approach will be followed for any future executive Director appointments.
Annual BonusAn Annual Bonus plan is in place for the executive Directors, which was adopted by the Board in 2010. The plan is designed to provide an incentive/reward for performance and reflects the competitive markets in which the Group conducts its business.
80% of the Annual Bonus is based on financial measures, with the remainder based on personal/strategic performance objectives which are set annually by the Remuneration Committee to reflect key priorities for the year ahead.
75% of any Annual Bonus award is paid in cash with the remaining 25% paid in Hunting shares which are required to be held by the executive Director for a period of two years, from the end of the relevant financial period. For the 2020 Annual Bonus, the Remuneration Committee exercised discretion to award 100% in Hunting shares, to be held for a minimum of one year.
HPSPThe HPSP was approved by shareholders in April 2014. Share awards granted to the executive Directors under the HPSP in recent years have been based on a blend of Total Shareholder Return, Earnings per Share, Return on Capital Employed and a Strategic Scorecard.
104Hunting PLC Annual Report and Accounts 2020
All performance conditions are measured at the end of the relevant three-year performance period and awards to the executive Directors will be proportional to the total vesting level achieved. Subject to the achievement of performance conditions, awards will typically vest on the third anniversary of the grant. For awards made in 2018 and onwards, vested shares are subject to an additional two-year holding period (subject to settlement of any tax charges on vesting).
The maximum face value of the grant to the Chief Executive is 450% of base salary and 210% of base salary for the Finance Director. Actual award levels are reviewed ahead of each grant to ensure they are appropriate, taking into account factors such as share price performance and the underlying performance of the Group. An amount equivalent to dividends paid by the Company during the vesting period is added to the awards once the final vesting levels have been determined.
Stock Ownership PolicyThe Company operates a stock ownership policy whereby the Directors and senior managers are required to build and maintain a minimum shareholding in the Company’s Ordinary shares. For executive Directors, the primary mechanism of building the required shareholding is retaining vested shares received from the deferred element of the Annual Bonus and from long-term incentive schemes operated by Hunting. Those subject to this requirement have a period of five years from the date of employment by Hunting to comply.
The Chief Executive is required to maintain a minimum holding of shares equal to a market value of 500% of base salary, the Finance Director a minimum holding of 200% of base salary and the non-executive Directors a minimum holding of 100% of annual fees. Certain executives of the Group are required to build and maintain a minimum holding of shares in the Company equal to a market value of between 100% and 200% of base salary.
The value of holdings in shares reported in the Annual Report on Remuneration includes Ordinary shares held by the individual and also the post-tax value of vested, but unexercised, share awards and options.
From 2021, the Company is adopting a post-employment shareholding policy requiring executive Directors to maintain a level of share ownership after stepping down from the Board. Both the Chief Executive and the Finance Director will be required to continue to hold the lesser of their actual ownership at the date of stepping down and 200% of salary for a minimum of 12 months. This policy will apply to shares acquired under the deferred Annual Bonus and HPSP granted after the 2021 AGM, and will be subject to the discretion of the Committee in exceptional circumstances.
Executive Director Service ContractsAll existing executive Directors’ Service Contracts are rolling one-year agreements and contain standard provisions allowing the Company to terminate summarily for cause, such as gross misconduct. The Service Contracts can be reviewed at the Company’s Registered Office, on request by a shareholder.
Jim Johnson and Bruce Ferguson entered into Service Agreements with the Company on 7 December 2017 and 2 June 2020 respectively. Under the terms of these Service Agreements, both the Company and the Directors are required to give one year’s notice of termination. Messrs Johnson and Ferguson are entitled to receive a Performance Bonus on an annual basis, the quantum being determined by the Remuneration Committee. Messrs Johnson and Ferguson are also entitled to participate in the Hunting Performance Share Plan and any other long-term incentive schemes operated by the Company. Under the terms of their Service Agreements, benefits may include the provision of a company car with fuel, long-term disability and healthcare benefits offered by the Company, as well as participation in pension schemes operated by the Company. Following a change of control, in line with standard UK practice, all stock options and stock-based awards granted will be tested for performance and pro-rated for time unless the Committee, acting fairly, decides otherwise.
Non-executive Director Letters of AppointmentOn appointment, each non-executive Director is provided with a letter of appointment that sets out the responsibilities and time commitments for the role. Additional duties, as requested by the Nomination Committee, including chairing a Board subcommittee, are also incorporated into the letters of appointment and fees paid. Non-executive Director appointments are usually for a fixed three-year term, which can be terminated by either party at any time.
External Board AppointmentsThe Company may authorise an executive Director to undertake a non-executive directorship outside of the Group provided it does not interfere with their primary duties. During the year neither executive Director held any external positions.
Payment for Loss of OfficeThe Committee has considered the Company’s policy on remuneration for executive Directors leaving the Company and is committed to applying an approach consistent with best practice to ensure that the Company pays no more than is necessary.
In line with normal market practice, the policy distinguishes between “Good Leavers” and “Bad Leavers”. A “Good Leaver” is defined as an employee who has ceased to be employed by the Group due to death, ill-health, injury, disability, redundancy, retirement, the employee’s company ceasing to be a Group member or for any other reason if the Committee so decides.
In the case of a Good Leaver, taking account of local conditions, the Policy normally allows:
• payment in lieu of notice equal to 12 months’ base salary, pension contributions, contractual benefits and any other legal entitlements;
• payment of a bonus for the period worked subject to the achievement of the relevant performance conditions; and
• any unvested long-term incentives vest at the normal time subject to the achievement of the relevant performance conditions, and pro-rated based on the period of service as a proportion of the vesting period.
If an employee departs the Group for any other reason than those specified in the Good Leaver definition above then he/she is treated as a bad leaver and unvested long-term incentives lapse immediately on cessation of employment.
105Hunting PLC Annual Report and Accounts 2020
Purpose and C
ultureB
usiness Model and S
takeholdersB
usiness Strategy
Perform
anceG
overn
ance
Financial Statem
ents

Directors’ Remuneration Policycontinued
New Director PoliciesAs the Board of Hunting is refreshed with new executive and non-executive Director appointments, the policy for remuneration for the new Board members will align with those detailed above.
Hunting needs to be able to attract and retain the best executive and non-executive Directors in the market place. The Remuneration Committee believes that the proposed policy will enable the Company to achieve its recruitment aims.
For executive Director appointments, the fixed component of total emoluments will target the market mid-point, subject to geographic considerations of the candidate and the specific labour market conditions. Where new appointees have initial base salaries set below market, any shortfall may be managed with phased increases over a period of two to three years, subject to the individual’s development and performance in the role. The Service Contracts will be rolling one-year agreements with standard provisions. The fixed component of the emoluments will comprise base salary, including any appropriate relocation or tax equalisation agreements, benefits including healthcare insurance, pension contributions, car benefits and any other components deemed necessary to secure an appointment. The variable component to the emoluments will be implemented in line with the policies above, subject to any future amendments to these arrangements being approved by shareholders. Annual performance-linked cash bonus arrangements will include awards up to 150% and 200% of base salary for a new Finance Director and Chief Executive respectively. The maximum awards under the HPSP will be up to 210% and 450% of base salary for a new Finance Director and Chief Executive respectively. The Committee anticipates applying UK market standard change of control provisions within new Service Contracts.
In addition, for new appointees, the Committee may offer additional cash and/or share-based elements when it considers these to be in the best interests of the Company and shareholders. Any such payments would take account of remuneration relinquished when leaving the former employer and would be structured to reflect the nature, time horizons and performance requirements attaching to that remuneration. Shareholders will be informed of any such payments at the time of appointment.
For non-executive Director appointments, the benchmarked fees to companies of similar size and profile to Hunting will be applied.
Consideration of Employment Conditions Elsewhere in the GroupThe Committee considers the general basic salary increases for the broader employee population when determining the annual salary increases for the executive Directors. Employees have not been consulted in respect of the design of the Company’s senior executive remuneration policy.
Shareholder Consultation and FeedbackWhen determining remuneration, the Committee takes into account views of leading shareholders and best practice guidelines issued by institutional shareholder bodies.
The revised Policy includes only a small number of changes to reflect developments in best practice and the consultation with shareholders in Q4 2020. The Committee will keep under consideration whether a further review of the Policy is warranted ahead of the normal triennial review cycle, once there is greater clarity on the future market environment.
The Committee is always available for feedback from shareholders on remuneration policy and arrangements, and will undertake a further consultation with our largest shareholders in advance of any significant future changes to remuneration policy. The Committee will continue to monitor trends and developments in corporate governance and market practice to ensure the structure of executive remuneration remains appropriate.
Remuneration Scenarios for Executive DirectorsThe remuneration scenarios of the executive Directors for a fixed, target and maximum performance are presented in the charts below. Potential reward opportunities are based on Hunting’s Remuneration Policy, applied to annualised 2020 remuneration data.
Chief Executive Fixed Annual Bonus HPSP
Maximum
Target
Fixed
$7,371k
$5,718k
$3,285k
$852k
Maximum Stretch
100%
26%
15%
12%
23%
26%
20%
51%
59%
68%
Finance Director Fixed Annual Bonus HPSP
$2,050k
$1,680k
$1,045k
$410k
Maximum
Target
Fixed
Maximum Stretch
1 100%
1 39%
1 24%
1 20%
1
1
1
1
2
2
2
3
3
3
2 25%
2 32%
2 26%
3 36%
3 44%
3 54%
Note: These charts are indicative as share price movement and dividend accruals have been excluded.
Assumptions made for each scenario are as follows:
• Fixed: latest salary, benefits and normal pension contributions or payments in lieu of pension contributions.
• Target: fixed remuneration plus half of maximum annual cash bonus opportunity plus 50% vesting of awards under the HPSP.
• Maximum: fixed remuneration plus maximum annual cash bonus opportunity plus 100% vesting of all long-term incentives.
• Maximum Stretch: including the impact of a hypothetical 50% increase in share price on the value of the HPSP in accordance with the reporting regulations.
• The Finance Director is paid in Sterling and the equivalent total remuneration scenarios are as follows – fixed £320k; target £815k, maximum £1,310k and maximum stretch of £1,599k.
Annell BayChair of the Remuneration Committee
4 March 2021
106Hunting PLC Annual Report and Accounts 2020
IntroductionThe principles set out in the Directors’ Remuneration Policy (the “Policy”), approved by shareholders in April 2018, have been applied throughout the year. The Company has submitted a revised Policy for approval by shareholders at the Company’s Annual General Meeting in April 2021, which better aligns the overall remuneration framework operated by Hunting PLC with the 2018 UK Corporate Governance Code.
RoleThe Committee is responsible for developing and implementing the remuneration policy for the Company and has direct oversight of the remuneration of the executive Directors, Company Chair and Company Secretary. The Chair and Chief Executive are consulted on proposals relating to the remuneration of the Finance Director and designated senior management. Where appropriate, the Chair and other Directors are invited by the Committee to attend meetings, but are not present when their own remuneration is considered. The Committee also reviews and monitors the remuneration framework of the Company’s Executive Committee and also monitors base salary increases across the Company’s workforce.
The remuneration of the non-executive Directors is agreed by the Board as a whole and follows the Articles of Association of the Company which were last approved by shareholders on 18 April 2018.
The full scope of the role of the Committee is set out in its Terms of Reference, which are reviewed annually, and can be found on the Group’s website at www.huntingplc.com.
Membership and AttendanceThe Committee consists entirely of independent non-executive Directors. Ms Bay and Mr Lough have relevant sector expertise, while Mrs Chesney has relevant financial expertise. Ms Bay was appointed to the Committee on her appointment to the Board on 2 February 2015 and was appointed Chair on 30 August 2018. The Committee met three times during the year and attendance details are shown in the table below. Normally the Committee meets four times in the year; however, due to the COVID-19 pandemic, one meeting was cancelled. All items of business have been completed in the year, in line with the Committee’s Terms of Reference and its annual schedule of work.
Member Invitation
Number of meetings held 3Number of meetings attended (actual/possible):Annell Bay (Committee Chair) 3/3 –Carol Chesney 3/3 –Bruce Ferguson (from 15 April 2020) – 2/2John (Jay) Glick – 3/3Richard Hunting – 3/3Jim Johnson – 3/3Keith Lough 3/3 –Peter Rose (to 15 April 2020) – 1/1
At 31 December 2020 and up to the date of signature of the accounts, the members of the Committee and their unexpired terms of office were:
Director Latest appointment dateUnexpired term as at
4 March 2021
Annell Bay 2 February 2021 35 monthsCarol Chesney 23 April 2018 2 monthsKeith Lough 23 April 2018 2 months
External AdvisersDuring the year, Mercer | Kepler (“Kepler”) was engaged by the Committee to provide remuneration consultancy services. Kepler’s appointment was subject to a formal tender and is regarded as independent, having been appointed by and acting under direction of the Committee.
The total cost of advice to the Committee during the year to 31 December 2020 was $58,721 (2019 – $58,877) and includes fees paid in respect of review work in relation to new Directors’ Remuneration Policy, share plans and remuneration reporting disclosure requirements. Fees are charged on a time basis for consultancy services received. Kepler has no other connection to the Company or any Director.
Annual Report on Remuneration
107Hunting PLC Annual Report and Accounts 2020
Purpose and C
ultureB
usiness Model and S
takeholdersB
usiness Strategy
Perform
anceG
overn
ance
Financial Statem
ents
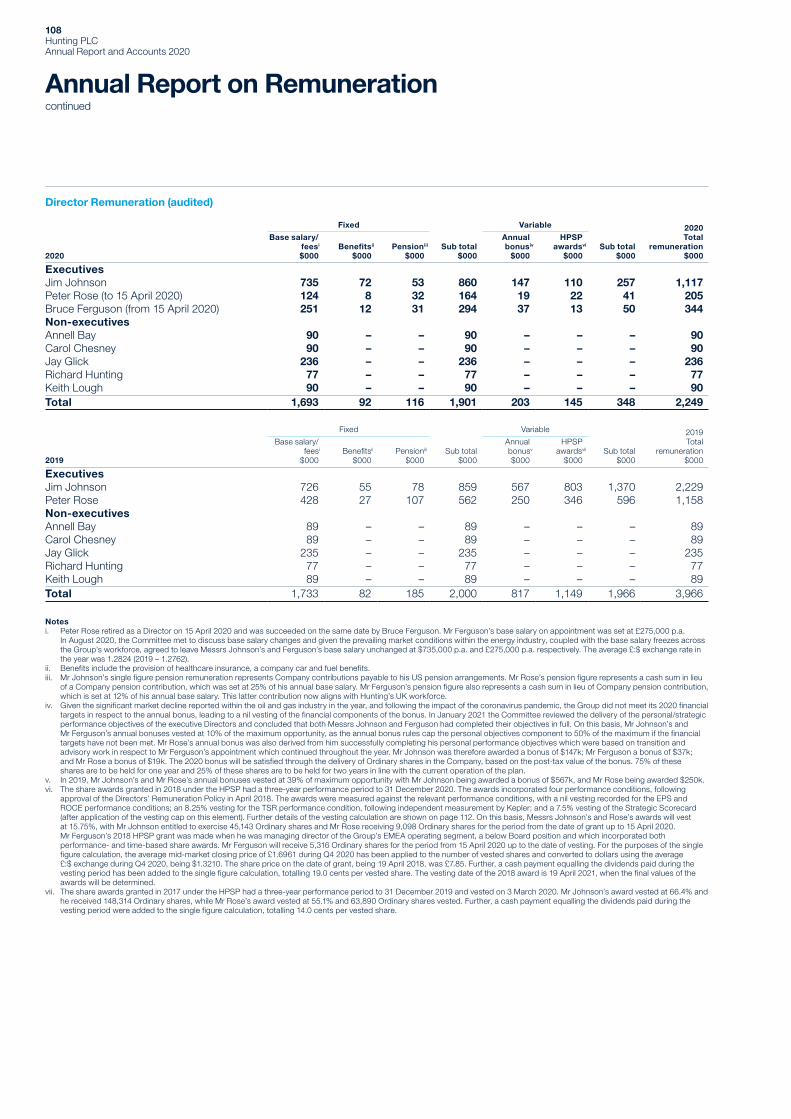
Director Remuneration (audited)
2020
Fixed Variable
Sub total$000
2020Total
remuneration$000
Base salary/feesi
$000Benefitsii
$000Pensioniii
$000Sub total
$000
Annual bonusiv
$000
HPSPawardsvi
$000
ExecutivesJim Johnson 735 72 53 860 147 110 257 1,117Peter Rose (to 15 April 2020) 124 8 32 164 19 22 41 205Bruce Ferguson (from 15 April 2020) 251 12 31 294 37 13 50 344Non-executivesAnnell Bay 90 – – 90 – – – 90Carol Chesney 90 – – 90 – – – 90Jay Glick 236 – – 236 – – – 236Richard Hunting 77 – – 77 – – – 77Keith Lough 90 – – 90 – – – 90Total 1,693 92 116 1,901 203 145 348 2,249
2019
Fixed Variable
Sub total$000
2019Total
remuneration$000
Base salary/feesi
$000Benefitsii
$000Pensioniii
$000Sub total
$000
Annual bonusv $000
HPSPawardsvii
$000
ExecutivesJim Johnson 726 55 78 859 567 803 1,370 2,229Peter Rose 428 27 107 562 250 346 596 1,158Non-executivesAnnell Bay 89 – – 89 – – – 89Carol Chesney 89 – – 89 – – – 89Jay Glick 235 – – 235 – – – 235Richard Hunting 77 – – 77 – – – 77Keith Lough 89 – – 89 – – – 89Total 1,733 82 185 2,000 817 1,149 1,966 3,966
Notesi. Peter Rose retired as a Director on 15 April 2020 and was succeeded on the same date by Bruce Ferguson. Mr Ferguson’s base salary on appointment was set at £275,000 p.a.
In August 2020, the Committee met to discuss base salary changes and given the prevailing market conditions within the energy industry, coupled with the base salary freezes across the Group’s workforce, agreed to leave Messrs Johnson’s and Ferguson’s base salary unchanged at $735,000 p.a. and £275,000 p.a. respectively. The average £:$ exchange rate in the year was 1.2824 (2019 – 1.2762).
ii. Benefits include the provision of healthcare insurance, a company car and fuel benefits.iii. Mr Johnson’s single figure pension remuneration represents Company contributions payable to his US pension arrangements. Mr Rose’s pension figure represents a cash sum in lieu
of a Company pension contribution, which was set at 25% of his annual base salary. Mr Ferguson’s pension figure also represents a cash sum in lieu of Company pension contribution, which is set at 12% of his annual base salary. This latter contribution now aligns with Hunting’s UK workforce.
iv. Given the significant market decline reported within the oil and gas industry in the year, and following the impact of the coronavirus pandemic, the Group did not meet its 2020 financial targets in respect to the annual bonus, leading to a nil vesting of the financial components of the bonus. In January 2021 the Committee reviewed the delivery of the personal/strategic performance objectives of the executive Directors and concluded that both Messrs Johnson and Ferguson had completed their objectives in full. On this basis, Mr Johnson’s and Mr Ferguson’s annual bonuses vested at 10% of the maximum opportunity, as the annual bonus rules cap the personal objectives component to 50% of the maximum if the financial targets have not been met. Mr Rose’s annual bonus was also derived from him successfully completing his personal performance objectives which were based on transition and advisory work in respect to Mr Ferguson’s appointment which continued throughout the year. Mr Johnson was therefore awarded a bonus of $147k; Mr Ferguson a bonus of $37k; and Mr Rose a bonus of $19k. The 2020 bonus will be satisfied through the delivery of Ordinary shares in the Company, based on the post-tax value of the bonus. 75% of these shares are to be held for one year and 25% of these shares are to be held for two years in line with the current operation of the plan.
v. In 2019, Mr Johnson’s and Mr Rose’s annual bonuses vested at 39% of maximum opportunity with Mr Johnson being awarded a bonus of $567k, and Mr Rose being awarded $250k.vi. The share awards granted in 2018 under the HPSP had a three-year performance period to 31 December 2020. The awards incorporated four performance conditions, following
approval of the Directors’ Remuneration Policy in April 2018. The awards were measured against the relevant performance conditions, with a nil vesting recorded for the EPS and ROCE performance conditions; an 8.25% vesting for the TSR performance condition, following independent measurement by Kepler; and a 7.5% vesting of the Strategic Scorecard (after application of the vesting cap on this element). Further details of the vesting calculation are shown on page 112. On this basis, Messrs Johnson’s and Rose’s awards will vest at 15.75%, with Mr Johnson entitled to exercise 45,143 Ordinary shares and Mr Rose receiving 9,098 Ordinary shares for the period from the date of grant up to 15 April 2020. Mr Ferguson’s 2018 HPSP grant was made when he was managing director of the Group’s EMEA operating segment, a below Board position and which incorporated both performance- and time-based share awards. Mr Ferguson will receive 5,316 Ordinary shares for the period from 15 April 2020 up to the date of vesting. For the purposes of the single figure calculation, the average mid-market closing price of £1.6961 during Q4 2020 has been applied to the number of vested shares and converted to dollars using the average £:$ exchange during Q4 2020, being $1.3210. The share price on the date of grant, being 19 April 2018, was £7.85. Further, a cash payment equalling the dividends paid during the vesting period has been added to the single figure calculation, totalling 19.0 cents per vested share. The vesting date of the 2018 award is 19 April 2021, when the final values of the awards will be determined.
vii. The share awards granted in 2017 under the HPSP had a three-year performance period to 31 December 2019 and vested on 3 March 2020. Mr Johnson’s award vested at 66.4% and he received 148,314 Ordinary shares, while Mr Rose’s award vested at 55.1% and 63,890 Ordinary shares vested. Further, a cash payment equalling the dividends paid during the
vesting period were added to the single figure calculation, totalling 14.0 cents per vested share.
Annual Report on Remunerationcontinued
108Hunting PLC Annual Report and Accounts 2020
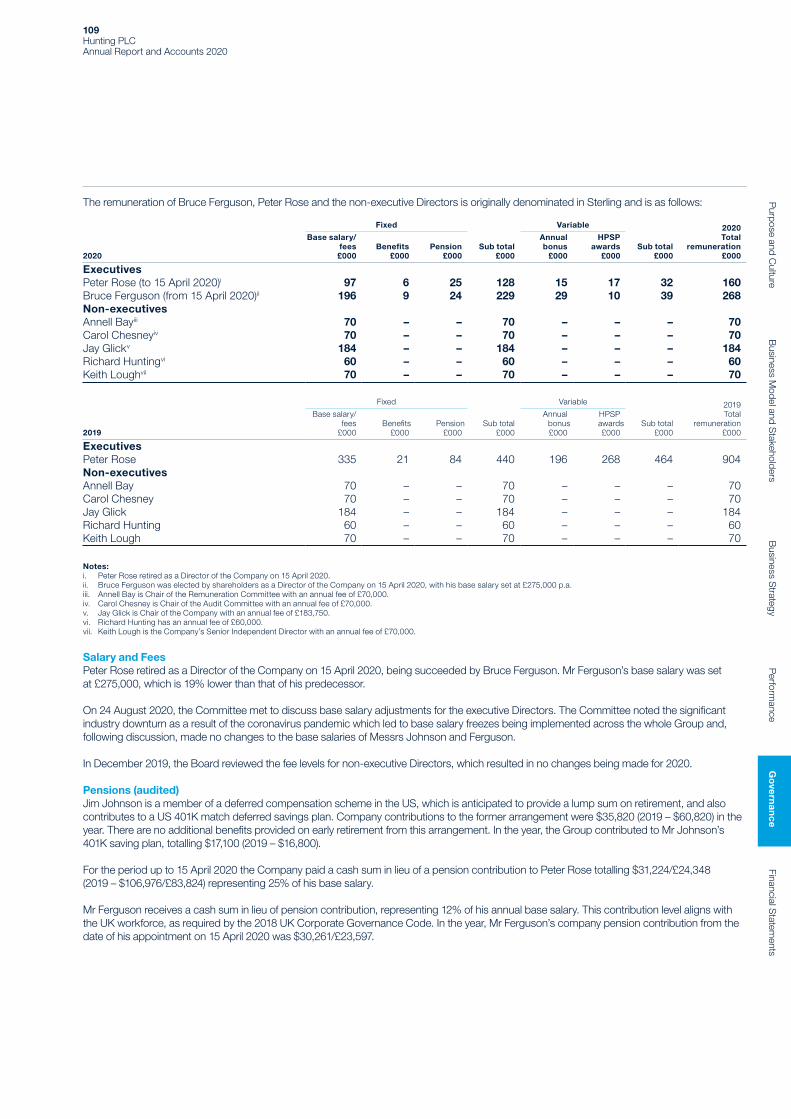
The remuneration of Bruce Ferguson, Peter Rose and the non-executive Directors is originally denominated in Sterling and is as follows:
2020
Fixed Variable
Sub total£000
2020Total
remuneration£000
Base salary/fees£000
Benefits£000
Pension£000
Sub total£000
Annual bonus
£000
HPSPawards
£000
ExecutivesPeter Rose (to 15 April 2020)i 97 6 25 128 15 17 32 160Bruce Ferguson (from 15 April 2020)ii 196 9 24 229 29 10 39 268Non-executivesAnnell Bayiii 70 – – 70 – – – 70Carol Chesneyiv 70 – – 70 – – – 70Jay Glickv 184 – – 184 – – – 184Richard Huntingvi 60 – – 60 – – – 60Keith Loughvii 70 – – 70 – – – 70
2019
Fixed Variable
Sub total£000
2019Total
remuneration£000
Base salary/fees
£000Benefits
£000Pension
£000Sub total
£000
Annual bonus £000
HPSPawards£000
ExecutivesPeter Rose 335 21 84 440 196 268 464 904Non-executivesAnnell Bay 70 – – 70 – – – 70Carol Chesney 70 – – 70 – – – 70Jay Glick 184 – – 184 – – – 184Richard Hunting 60 – – 60 – – – 60Keith Lough 70 – – 70 – – – 70
Notes:i. Peter Rose retired as a Director of the Company on 15 April 2020.ii. Bruce Ferguson was elected by shareholders as a Director of the Company on 15 April 2020, with his base salary set at £275,000 p.a.iii. Annell Bay is Chair of the Remuneration Committee with an annual fee of £70,000.iv. Carol Chesney is Chair of the Audit Committee with an annual fee of £70,000.v. Jay Glick is Chair of the Company with an annual fee of £183,750.vi. Richard Hunting has an annual fee of £60,000.vii. Keith Lough is the Company’s Senior Independent Director with an annual fee of £70,000.
Salary and FeesPeter Rose retired as a Director of the Company on 15 April 2020, being succeeded by Bruce Ferguson. Mr Ferguson’s base salary was set at £275,000, which is 19% lower than that of his predecessor.
On 24 August 2020, the Committee met to discuss base salary adjustments for the executive Directors. The Committee noted the significant industry downturn as a result of the coronavirus pandemic which led to base salary freezes being implemented across the whole Group and, following discussion, made no changes to the base salaries of Messrs Johnson and Ferguson.
In December 2019, the Board reviewed the fee levels for non-executive Directors, which resulted in no changes being made for 2020.
Pensions (audited)Jim Johnson is a member of a deferred compensation scheme in the US, which is anticipated to provide a lump sum on retirement, and also contributes to a US 401K match deferred savings plan. Company contributions to the former arrangement were $35,820 (2019 – $60,820) in the year. There are no additional benefits provided on early retirement from this arrangement. In the year, the Group contributed to Mr Johnson’s 401K saving plan, totalling $17,100 (2019 – $16,800).
For the period up to 15 April 2020 the Company paid a cash sum in lieu of a pension contribution to Peter Rose totalling $31,224/£24,348 (2019 – $106,976/£83,824) representing 25% of his base salary.
Mr Ferguson receives a cash sum in lieu of pension contribution, representing 12% of his annual base salary. This contribution level aligns with the UK workforce, as required by the 2018 UK Corporate Governance Code. In the year, Mr Ferguson’s company pension contribution from the date of his appointment on 15 April 2020 was $30,261/£23,597.
109Hunting PLC Annual Report and Accounts 2020
Purpose and C
ultureB
usiness Model and S
takeholdersB
usiness Strategy
Perform
anceG
overn
ance
Financial Statem
ents

Annual Report on Remunerationcontinued
Annual Performance-Linked Bonus Plan (audited)Following the Company’s Annual General Meeting in April 2018, the executive Director annual performance-linked bonus plan was amended. The revised operation of the bonus plan is therefore:
Proportion of award Performance metric
60% Underlying Profit before Tax20% Underlying Return on Capital Employed20% Strategic/Personal Performance Objectives
Delivery of Financial ObjectivesThe financial performance targets for the 2020 annual bonus were as follows:
Threshold vesting Target vesting Maximum vesting Actual result % vesting
Underlying profit (loss) before tax $51.5m $64.4m $77.3m $(19.4)m NilUnderlying return on capital employed 5.5% 6.9% 8.2% (1.5)% Nil
The financial objectives within the annual bonus start to accrue when 80% of the Annual Budget targets are met, increasing on a straight-line basis up to 120% of the budget target. The annual bonus targets are normally based on the Annual Budget agreed by the Board in December of the prior financial year. The 2020 Annual Budget agreed by the Board contained financial targets of an underlying profit before tax of $64.4m and an underlying ROCE of 5.5%, reflecting an anticipated decline in trading given the market outlook at the start of 2020. In February 2020, the Committee reviewed the ROCE vesting range in respect of the basis of the 2020 annual bonus calculations and increased the vesting range, with a threshold vesting of 5.5%, increasing to 8.2% for a maximum vesting, the latter approximating the Group’s weighted average cost of capital. Given the impact of the coronavirus pandemic and the significant decline in market activity, the Group did not meet its financial targets in respect of the approved 2020 Annual Budget and therefore the financial components of the annual bonus have recorded a nil vesting.
Delivery of Strategic/Personal Performance ObjectivesThe strategic/personal performance objectives agreed by the Committee with the executive Directors with effect from January 2020 are summarised in the table below. Detailed analyses of these outcomes follow this table.
Jim Johnson (Chief Executive)
Bruce Ferguson/Peter Rose (Finance Director)
Strategic Development of the Group (50%) • Develop a detailed and robust framework to enable implementation of Board approved Strategic Plan.
• Lead strategy sessions with internal and external stakeholders to understand technologies and synergies required for future growth.
• Review and enhance collaboration practices and information flows within the Group’s businesses.
Strategic Development of the Group (50%) • Develop a detailed and robust framework to enable implementation of Board approved Strategic Plan.
• Review and enhance collaboration practices and information flows within the Group’s businesses.
Leadership and Organisational Effectiveness (50%) • Improvement of HSE and Quality Assurance performance. • Enhancement and broadening of HR functions across North America.
• Successful strategic planning and talent management, including further development of senior leadership team.
• Execution of an effective IT strategic plan, including further software roll-out and cyber security targets.
• Lead the business through economic uncertainties caused by sector specific factors, and the pandemic, through effective crisis management and strategic decision making.
Leadership and Organisational Effectiveness (35%) • Enhancement of global Finance and Compliance functions. • Successful strategic planning and talent management, including further development of senior leadership team.
• Execution of an effective IT strategic plan, including further software roll-out and cyber security targets.
• Improved IR programme, which includes new institutional investors.
Financial Effectiveness (15%) • Improvements to financial controls and governance framework. • Lead quarterly reporting on operational and financial controls and effectiveness by region.
During the year, the Committee was updated on the progress of the objectives noted above – and for the year ended 31 December 2020 noted the following outcomes:
Strategic Development of the GroupDespite the material decline in the Group’s core energy markets, the executive Directors have continued to execute the Group’s Strategic Plan to (1) invest in higher growth sub-sectors of the global oil and gas industry; (2) refocus the Group’s business and product portfolio on those areas which deliver the highest returns; and (3) leverage the Group’s expertise into new markets.
110Hunting PLC Annual Report and Accounts 2020

As detailed in the Strategic Report the executive Directors completed the acquisition of Enpro Subsea Limited in February 2020, which aligns with the evolution of the global oil and gas industry, and which provides lower capital cost, flexible deep water products for offshore energy developments. In December 2020, the Group disposed of its US Drilling Tools business, which will free up capital and allow the Group to focus on higher return product lines and businesses. In February 2021, the Group also completed an investment in the high growth well data analytics market sub-sector. Hunting has also increased its efforts to diversify into new market areas, leveraging its expertise in precision engineering. The Group’s Advanced Manufacturing business group has increased its presence in the medical devices, aviation and space sectors in the year, gaining new certifications for these industries. The Chief Executive also introduced technology brainstorming and knowledge sharing sessions for the key engineers and leaders of the Group to identify revenue diversification opportunities beyond oil and gas using Hunting’s core strengths in precision engineering. These sessions were predominantly held prior to the market downturn in Q2 2020.
The Committee reviewed these initiatives and concluded that this portion of the bonus had been completed in full, while at the same time navigating a significant market decline.
Leadership and Organisation EffectivenessThe Group has been restructured significantly in the year, to drive higher efficiencies and focus activities on long-term growth areas. This has required close oversight of Hunting’s HSE and Quality functions to ensure KPIs were maintained with additional training provided as roles were reassigned. The Committee noted the strong improvement in the Safety and Quality performance delivered in the year. Hunting has refocused its operating model in Canada to align with the medium- to long-term outlook in the country. The Group’s network of distribution centres in the US have also been aligned with the short- to medium-term demand outlook. The Group’s Chief HR Officer enhanced the visibility of HR services and the effectiveness of functions, by initiating unified alignment of practices and policies globally. The function has also developed its succession planning framework and implemented training and talent development programmes for high potential members of the Group’s leadership team. In the year the Group has also implemented a new enterprise resource planning system within its Hunting Titan and US Manufacturing business units. The Group has also increased its cyber security systems and commenced a programme of rationalisation of its IT infrastructure to increase efficiencies and reduce costs. The performance of the Group’s leadership team, including the Safety, Quality, HR and IT functions were also noted as the Group addressed the issues surrounding COVID-19 and the performance of the executive Directors through the crisis. In addition, the strong Quality and Safety levels, which had been maintained in the year, was noted, in spite of the disruption created by the pandemic and had also shown a year-on-year improvement. Further, it was noted that c.$4.0m in annual cost savings had been achieved through the Group’s lean manufacturing programme.
The Committee reviewed these initiatives and concluded that this portion of the bonus had been completed in full.
Financial EffectivenessUnder the leadership of the Group’s new Finance Director, a review of the financial reporting and internal controls framework was undertaken. Improved information flows to the Board and across the Group were implemented. Improvements to the structure of the finance function were also noted, including enhanced compliance and governance responsibilities being put in place in the year. The Group has also increased its alignment with the 2018 UK Corporate Governance Code, and has introduced new climate reporting initiatives, which are detailed in the Strategic Report. Hunting has also engaged closely with new and existing investors in the year, leading to new institutional shareholders entering the register. In support of the transition of the Finance Director role, and due to the rapid onset of the pandemic, Mr Rose advised on a number of key work processes following his retirement as a Director including the implementation of stringent working capital reduction measures, curtailing of capital investments and asset review procedures in preparation for the Group’s results.
The Committee reviewed these initiatives and concluded that this portion of the bonus had been completed in full.
Accordingly, the Committee concluded that all strategic/personal performance objectives had been met in full during the year. In line with the Remuneration Policy, vesting of the strategic/personal performance component of the annual bonus is subject to an underpin whereby a 50% vesting cap on this element is applied in cases where the financial targets for the year are not met. Based on this outcome, and reflecting this cap, the following bonus awards were made to the executive Directors:
Proportion of annual bonus allocated Performance metric Percentage of annual bonus awarded
60% Underlying profit before tax Nil20% Underlying return on capital employed Nil20% Strategic/personal performance objectives 10%
As detailed in the Letter from the Chair of the Remuneration Committee, the post-tax value of the bonus will be delivered in Ordinary shares in the Company. 75% of these shares are to be held for one year, with the balance of 25% to be held for two years, in line with the normal operation of the annual bonus plan.
Mr Johnson was therefore awarded a bonus for the year of $147k (20% of base salary), and Mr Rose a bonus of $65k (15% of base salary) of which $19k is included in the single figure table. Mr Ferguson was awarded a bonus of $38k (15% of base salary) for the period from 15 April to 31 December 2020. The Committee reviewed and challenged the input of Mr Rose, following his retirement as a Director, and noted that significant dialogue and advice had been given to the executive Directors, as Mr Ferguson transitioned to his new role as Finance Director and as the Group navigated the significant market decline from Q2 2020.
In 2019 the annual bonus awards to the executive Directors were as follows: Mr Johnson – $567k and Mr Rose – $250k. On 26 February 2020, Mr Johnson received 22,800 Ordinary shares and Mr Rose 8,882 Ordinary shares, representing 25% of the post-tax value of the bonus, to be held for two years from 27 February 2020.
111Hunting PLC Annual Report and Accounts 2020
Purpose and C
ultureB
usiness Model and S
takeholdersB
usiness Strategy
Perform
anceG
overn
ance
Financial Statem
ents
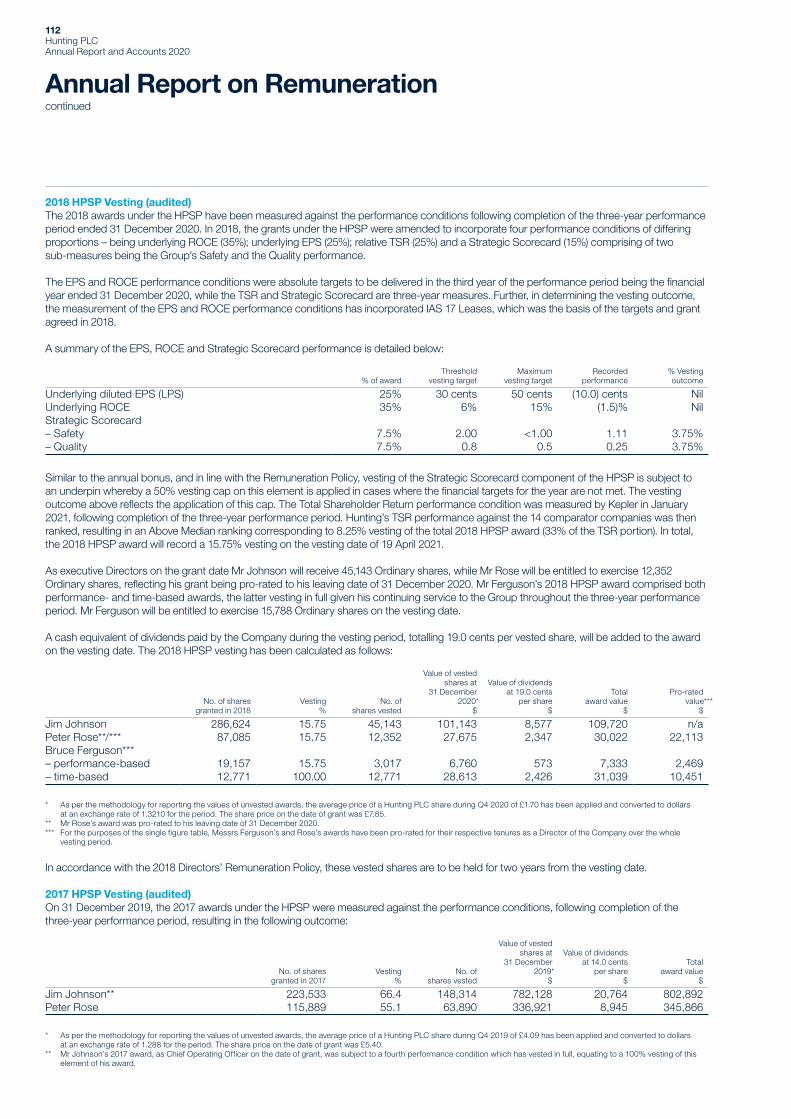
Annual Report on Remunerationcontinued
2018 HPSP Vesting (audited)The 2018 awards under the HPSP have been measured against the performance conditions following completion of the three-year performance period ended 31 December 2020. In 2018, the grants under the HPSP were amended to incorporate four performance conditions of differing proportions – being underlying ROCE (35%); underlying EPS (25%); relative TSR (25%) and a Strategic Scorecard (15%) comprising of two sub-measures being the Group’s Safety and the Quality performance.
The EPS and ROCE performance conditions were absolute targets to be delivered in the third year of the performance period being the financial year ended 31 December 2020, while the TSR and Strategic Scorecard are three-year measures. Further, in determining the vesting outcome, the measurement of the EPS and ROCE performance conditions has incorporated IAS 17 Leases, which was the basis of the targets and grant agreed in 2018.
A summary of the EPS, ROCE and Strategic Scorecard performance is detailed below:
% of awardThreshold
vesting targetMaximum
vesting targetRecorded
performance% Vesting outcome
Underlying diluted EPS (LPS) 25% 30 cents 50 cents (10.0) cents NilUnderlying ROCE 35% 6% 15% (1.5)% NilStrategic Scorecard– Safety 7.5% 2.00 <1.00 1.11 3.75%– Quality 7.5% 0.8 0.5 0.25 3.75%
Similar to the annual bonus, and in line with the Remuneration Policy, vesting of the Strategic Scorecard component of the HPSP is subject to an underpin whereby a 50% vesting cap on this element is applied in cases where the financial targets for the year are not met. The vesting outcome above reflects the application of this cap. The Total Shareholder Return performance condition was measured by Kepler in January 2021, following completion of the three-year performance period. Hunting’s TSR performance against the 14 comparator companies was then ranked, resulting in an Above Median ranking corresponding to 8.25% vesting of the total 2018 HPSP award (33% of the TSR portion). In total, the 2018 HPSP award will record a 15.75% vesting on the vesting date of 19 April 2021.
As executive Directors on the grant date Mr Johnson will receive 45,143 Ordinary shares, while Mr Rose will be entitled to exercise 12,352 Ordinary shares, reflecting his grant being pro-rated to his leaving date of 31 December 2020. Mr Ferguson’s 2018 HPSP award comprised both performance- and time-based awards, the latter vesting in full given his continuing service to the Group throughout the three-year performance period. Mr Ferguson will be entitled to exercise 15,788 Ordinary shares on the vesting date.
A cash equivalent of dividends paid by the Company during the vesting period, totalling 19.0 cents per vested share, will be added to the award on the vesting date. The 2018 HPSP vesting has been calculated as follows:
No. of shares granted in 2018
Vesting %
No. of shares vested
Value of vested shares at
31 December 2020*
$
Value of dividends at 19.0 cents
per share $
Total award value
$
Pro-rated value***
$
Jim Johnson 286,624 15.75 45,143 101,143 8,577 109,720 n/aPeter Rose**/*** 87,085 15.75 12,352 27,675 2,347 30,022 22,113Bruce Ferguson***– performance-based 19,157 15.75 3,017 6,760 573 7,333 2,469– time-based 12,771 100.00 12,771 28,613 2,426 31,039 10,451
* As per the methodology for reporting the values of unvested awards, the average price of a Hunting PLC share during Q4 2020 of £1.70 has been applied and converted to dollars at an exchange rate of 1.3210 for the period. The share price on the date of grant was £7.85.
** Mr Rose’s award was pro-rated to his leaving date of 31 December 2020.*** For the purposes of the single figure table, Messrs Ferguson’s and Rose’s awards have been pro-rated for their respective tenures as a Director of the Company over the whole
vesting period.
In accordance with the 2018 Directors’ Remuneration Policy, these vested shares are to be held for two years from the vesting date.
2017 HPSP Vesting (audited)On 31 December 2019, the 2017 awards under the HPSP were measured against the performance conditions, following completion of the three-year performance period, resulting in the following outcome:
No. of shares granted in 2017
Vesting %
No. of shares vested
Value of vested shares at
31 December 2019*
$
Value of dividends at 14.0 cents
per share $
Total award value
$
Jim Johnson** 223,533 66.4 148,314 782,128 20,764 802,892Peter Rose 115,889 55.1 63,890 336,921 8,945 345,866
* As per the methodology for reporting the values of unvested awards, the average price of a Hunting PLC share during Q4 2019 of £4.09 has been applied and converted to dollars at an exchange rate of 1.288 for the period. The share price on the date of grant was £5.40.
** Mr Johnson’s 2017 award, as Chief Operating Officer on the date of grant, was subject to a fourth performance condition which has vested in full, equating to a 100% vesting of this element of his award.
112Hunting PLC Annual Report and Accounts 2020
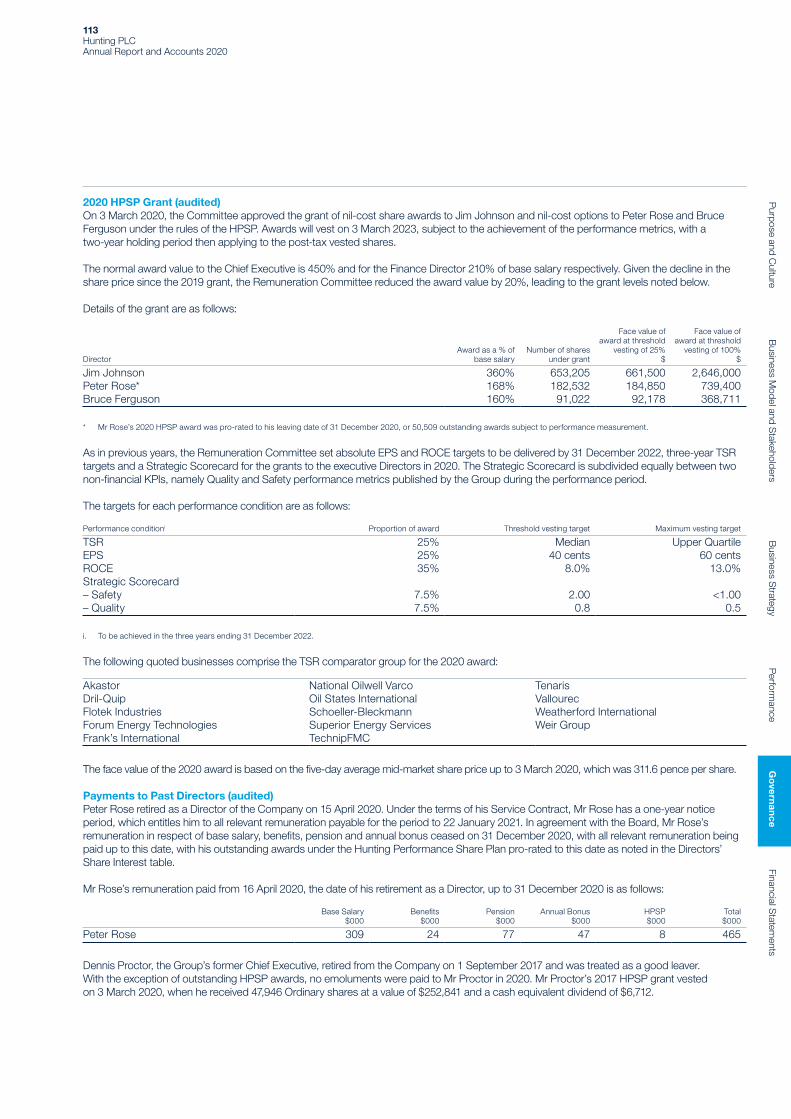
2020 HPSP Grant (audited)On 3 March 2020, the Committee approved the grant of nil-cost share awards to Jim Johnson and nil-cost options to Peter Rose and Bruce Ferguson under the rules of the HPSP. Awards will vest on 3 March 2023, subject to the achievement of the performance metrics, with a two-year holding period then applying to the post-tax vested shares.
The normal award value to the Chief Executive is 450% and for the Finance Director 210% of base salary respectively. Given the decline in the share price since the 2019 grant, the Remuneration Committee reduced the award value by 20%, leading to the grant levels noted below.
Details of the grant are as follows:
DirectorAward as a % of
base salaryNumber of shares
under grant
Face value of award at threshold
vesting of 25%$
Face value of award at threshold
vesting of 100%$
Jim Johnson 360% 653,205 661,500 2,646,000Peter Rose* 168% 182,532 184,850 739,400Bruce Ferguson 160% 91,022 92,178 368,711
* Mr Rose’s 2020 HPSP award was pro-rated to his leaving date of 31 December 2020, or 50,509 outstanding awards subject to performance measurement.
As in previous years, the Remuneration Committee set absolute EPS and ROCE targets to be delivered by 31 December 2022, three-year TSR targets and a Strategic Scorecard for the grants to the executive Directors in 2020. The Strategic Scorecard is subdivided equally between two non-financial KPIs, namely Quality and Safety performance metrics published by the Group during the performance period.
The targets for each performance condition are as follows:
Performance conditioni Proportion of award Threshold vesting target Maximum vesting target
TSR 25% Median Upper QuartileEPS 25% 40 cents 60 centsROCE 35% 8.0% 13.0%Strategic Scorecard– Safety 7.5% 2.00 <1.00– Quality 7.5% 0.8 0.5
i. To be achieved in the three years ending 31 December 2022.
The following quoted businesses comprise the TSR comparator group for the 2020 award:
Akastor National Oilwell Varco TenarisDril-Quip Oil States International VallourecFlotek Industries Schoeller-Bleckmann Weatherford InternationalForum Energy Technologies Superior Energy Services Weir GroupFrank’s International TechnipFMC
The face value of the 2020 award is based on the five-day average mid-market share price up to 3 March 2020, which was 311.6 pence per share.
Payments to Past Directors (audited)Peter Rose retired as a Director of the Company on 15 April 2020. Under the terms of his Service Contract, Mr Rose has a one-year notice period, which entitles him to all relevant remuneration payable for the period to 22 January 2021. In agreement with the Board, Mr Rose’s remuneration in respect of base salary, benefits, pension and annual bonus ceased on 31 December 2020, with all relevant remuneration being paid up to this date, with his outstanding awards under the Hunting Performance Share Plan pro-rated to this date as noted in the Directors’ Share Interest table.
Mr Rose’s remuneration paid from 16 April 2020, the date of his retirement as a Director, up to 31 December 2020 is as follows:
Base Salary$000
Benefits$000
Pension$000
Annual Bonus$000
HPSP$000
Total$000
Peter Rose 309 24 77 47 8 465
Dennis Proctor, the Group’s former Chief Executive, retired from the Company on 1 September 2017 and was treated as a good leaver.With the exception of outstanding HPSP awards, no emoluments were paid to Mr Proctor in 2020. Mr Proctor’s 2017 HPSP grant vestedon 3 March 2020, when he received 47,946 Ordinary shares at a value of $252,841 and a cash equivalent dividend of $6,712.
113Hunting PLC Annual Report and Accounts 2020
Purpose and C
ultureB
usiness Model and S
takeholdersB
usiness Strategy
Perform
anceG
overn
ance
Financial Statem
ents

Annual Report on Remunerationcontinued
Directors’ Shareholdings, Ownership Policy and Share Interests (audited)The beneficial interests of the Directors in the issued Ordinary shares of the Company are as follows:
Directori
At 31 December
2020ii
At 31 December
2019ii
ExecutivesJim Johnsoniii 367,629 205,042Bruce Ferguson 101,835 65,424Peter Roseiii 176,594 167,712Non-executivesAnnell Bay 13,440 11,840Carol Chesney 9,000 5,000Jay Glick 75,923 41,373Richard Hunting 468,133 468,133– as trustee 194,960 905,783– as Director of Hunting Investments Limited 11,003,487 11,003,487Keith Lough 19,000 9,000
i. Beneficial share interests are those Ordinary shares owned by the Director or spouse, which the Director is free to dispose of.ii. Or cessation date.iii. Jim Johnson’s total shareholding includes 52,032 Ordinary shares which were awarded under the Group’s Annual Bonus plan and which are restricted from being sold for
up to a period of two years. Peter Rose’s total shareholding includes 20,699 Ordinary shares which are subject to the same restriction.
There have been no further changes to the Directors’ share interests in the period 31 December 2020 to 4 March 2021.
The Group operates a share ownership policy that requires Directors and certain senior executives within the Group to build up a holding in shares equal in value to a certain multiple of their base salary or annual fee. The multiple takes into account the post-tax value of vested but unexercised share awards or options. The Committee noted the decline in the Company’s share price in the year, which had impacted the compliance levels of the Directors. The required shareholding of each Director and the current shareholding as a multiple of base salary as at 31 December 2020 is presented below:
DirectorRequired holding expressed as a
multiple of base salary or fee Requirement met*
Jim Johnson 5 NBruce Ferguson 2 NAnnell Bay 1 NCarol Chesney 1 NJay Glick 1 YRichard Hunting 1 YKeith Lough 1 Y
* The value of the holding of the Directors has been determined using the value on purchase of Ordinary shares or the share price at 31 December 2020 of £2.23.
114Hunting PLC Annual Report and Accounts 2020

The interests of the executive Directors over Ordinary shares of the Group under the HPSP are set out below. The vesting of options and awards are subject to performance conditions set out within the Policy.
Director
Interests at 1 January
2020
Options/awards
granted in year
Options/awards
exercised in year
Options/awards
lapsed in year
Interests at 31 December
2020
Exercise price
p Grant dateDate
exercisable Expiry date Scheme
Jim Johnson 223,533 – (148,314) (75,219) – Nil 03.03.17 03.03.20 – HPSP^
286,624 – – – 286,624 Nil 19.04.18 19.04.21 – HPSP^
422,507 – – – 422,507 Nil 21.03.19 21.03.22 – HPSP^
– 653,205 – – 653,205 Nil 03.03.20 03.03.23 – HPSP^
Total 932,664 653,205 (148,314) (75,219) 1,362,336
Peter Rose 115,889 – – (52,000) 63,889 Nil 03.03.17 03.03.20 03.03.27 HPSP~
87,085 – – (8,661) 78,424 Nil 19.04.18 19.04.21 19.04.28 HPSP~
119,201 – – (48,398) 70,803 Nil 21.03.19 21.03.22 21.04.29 HPSP~
– 182,532 – (132,023) 50,509 Nil 03.03.20 03.03.23 03.03.30 HPSP~
Total 322,175 182,532 – (241,082) 263,625
Bruce Ferguson 23,870 – (15,837) (8,033) – Nil 03.03.17 03.03.20 03.03.27 HPSP~
19,157 – – – 19,157 Nil 19.04.18 19.04.21 19.04.28 HPSP~
27,008 – – – 27,008 Nil 21.03.19 21.03.22 21.04.29 HPSP~
– 91,022 – – 91,022 Nil 03.03.20 03.03.23 03.03.30 HPSP~
Total 70,035 91,022 (15,837) (8,033) 137,187
Bruce Ferguson 24,214 – (24,214) – – Nil 03.03.17 03.03.20 03.03.27 HRSP*12,771 – – – 12,771 Nil 19.04.18 19.04.21 19.04.28 HRSP*18,005 – – – 18,005 Nil 21.03.19 21.03.22 21.04.29 HRSP*
Total 54,990 – (24,214) – 30,776
^ Nil-cost share awards that are not yet vested or exercisable and still subject to the performance conditions being measured in accordance with the HPSP rules.~ Nil-cost share options that are not yet vested or exercisable and still subject to the performance conditions being measured in accordance with the HPSP rules.* The Group operates a time-based share award programme as part of the shareholder approved Hunting Performance Share Plan for certain non-Board employees, which vest based
on continued service to the Company throughout the performance period. The HRSP awards to Mr Ferguson noted above reflect historical awards made to him under this programme.
Shareholder Voting at the 2020 AGMAt the Company’s AGM held in April 2020, the resolution to approve the Annual Report on Remuneration received the following votes from shareholders:
Number of votes cast % of votes cast
For 125,480,115 93.69Against 8,449,794 6.31Votes withheldi 331,831 –Total votes cast 134,261,740 100.00
i A vote withheld is not a vote in law and is not included in the calculation for votes cast.
The Directors’ Remuneration Policy was last approved by shareholders at the Company’s Annual General Meeting on 18 April 2018, with 98.92% voting in favour of the resolution. The new Directors’ Remuneration Policy will next be tabled for shareholder approval at the Company’s Annual General Meeting on 21 April 2021.
Relative Importance of Spend on PayThe table below shows the relative importance of spend on employee remuneration in relation to corporate taxation, dividends and capital investment. The choice of performance metrics represents certain operating costs of the Group and the use of operating cash flows in delivering long-term shareholder value.
2020$m
2019$m Change
Employee remunerationi 205.9 260.0 -21%Net tax paidii 5.0 7.7 -35%Dividends paid to Hunting PLC shareholdersii 8.2 16.6 -51%Capital investmentii 14.7 36.0 -59%
i. Includes staff costs for the year (note 8) plus benefits in kind of $33.1m (2019 – $37.1m), which primarily comprises US medical insurance costs.ii. Please refer to page 141.
115Hunting PLC Annual Report and Accounts 2020
Purpose and C
ultureB
usiness Model and S
takeholdersB
usiness Strategy
Perform
anceG
overn
ance
Financial Statem
ents

Annual Report on Remunerationcontinued
Executive Director Remuneration and the Wider WorkforceThe changes to the remuneration of the Chief Executive in 2020 compared to 2019 and those of the total workforce are as follows:
Chief Executive Average employee
Base salary +1% -2%Bonus -74% -81%Benefits -6% +6%
The average salary increase for employees in 2020 was nil%.
Changes to Director and Employee PayThe table below is presented in compliance with the Shareholder Rights Directive II. The changes to the pay of the executive Directors exclude pension contributions and share awards. If a Director has not served for the entire year, they are shown as not applicable. The percentage change to the emoluments of the global employees in 2020 reflects the movement in their average base salary, cash bonus and benefits in kind.
2018 to 2019 2019 to 2020
Jim Johnson -37% -29%Bruce Ferguson n/a n/aAnnell Bay +11% NilCarol Chesney +46% NilJay Glick +5% NilRichard Hunting Nil NilKeith Lough +56% NilPeter Rose -34% n/aGlobal employees Nil -7%
Chief Executive and Workforce Pay Ratio
Year Method25th percentile
pay ratio50th percentile
pay ratio75th percentile
pay ratio
2019 Option A 49:1 38:1 22:1Workforce Pay Quartiles $45,663 $58,603 $99,521
2020 Option A 22:1 18:1 10:1Workforce Pay Quartiles $51,239 $61,329 $107,314
The Company has elected to disclose voluntarily the pay ratio of the Group’s Chief Executive and Workforce, in line with The Companies (Miscellaneous Reporting) Regulations 2018 and has adopted Option A from the regulations as the basis of presenting the pay ratio. Option A has been selected by the Committee as it believes this methodology aligns closely with the Chief Executive’s single figure remuneration calculation.
The Remuneration Committee believes that the compensation framework in operation across the Group is appropriate, and in addition to a base salary and benefits appropriate to the relevant jurisdiction of operation, can include annual bonuses and participation in long-incentive programmes. External benchmarking is a regular feature of the Group’s overall pay framework, to ensure Hunting remains competitive in its chosen markets.
Hunting’s UK employees averaged 196 in the year (2019 – 207), which represents 8% (2019 – 7%) of the Group’s total average workforce in 2020. The basis of the workforce calculation is aligned with the basis of preparation of the single figure table on page 108, comprising of fixed and variable emoluments and is calculated on a full-time equivalent basis, in line with the requirements of the regulations. Further, the above disclosure assumes a maximum company pension contribution of 12% of base salary. However, it is noted that not all UK employees elect to receive this level of contribution. This data has been collated for the 12 months ended 31 December 2020.
In the year, base salary freezes were implemented given the market downturn. As a consequence of the downturn, workforce reductions were implemented to align with prevailing market conditions. Therefore, the movements in the workforce pay quartiles during 2020 reflects the impact of the reduction in force programmes implemented in the year and the reduction in the pay ratios in the year reflects the lower vesting of variable pay, including annual bonuses and long-term incentives.
116Hunting PLC Annual Report and Accounts 2020

Executive Director Remuneration and Shareholder ReturnsThe following chart compares the TSR of Hunting PLC between 2010 and 2020 to the DJ Stoxx TM Oil Equipment, Services and Distribution and DJ US Oil Equipment and Services indices. In the opinion of the Directors, these indices are the most appropriate indices against which the shareholder return of the Company’s shares should be compared because they comprise other companies in the oil and gas services sector.
Total Shareholder Return(Rebased to 100 at 31 December 2010)
Hunting PLC DJ US Oil Equipment & Services DJ Stoxx TM Oil Equipment, Services & Distribution
0 31/12/10 31/12/11 31/12/12 31/12/13 31/12/14 31/12/15 31/12/16 31/12/17 31/12/18 31/12/19 31/12/20
180
160
140
120
100
80
60
40
20
Summary Table of Chief Executive’s RemunerationThe accompanying table details remuneration of the Chief Executive:
Single figureremunerationi
$000
Annual cash bonusii
%
ESOP/PSP/HPSPiii
% vestingLTIPiv
% award
2020 – Jim Johnson 1,117 10 16 n/a2019 – Jim Johnson 2,229 39 66 n/a2018 – Jim Johnson 3,715 100 75 n/a2017 – Jim Johnson (from 1 September) 819 33 4 n/a2017 – Dennis Proctor (to 1 September) 3,974 67 13 n/a2016 – Dennis Proctor 941 Nil Nil n/a2015 – Dennis Proctor 1,031 Nil Nil Nil2014 – Dennis Proctor 4,808 57 Nil 1002013 – Dennis Proctor 4,442 42 Nil 1002012 – Dennis Proctor 5,497 75 66 1002011 – Dennis Proctor 3,261 100 Nil 31
i. Single figure remuneration reflects the aggregate remuneration paid to the Chief Executive as defined within the Directors’ Remuneration Policy.ii. Annual cash bonus percentages reflect the bonus received by the Chief Executive each year expressed as a percentage of maximum bonus opportunity.iii. Percentage vesting reflects the percentage of the ESOP that vested in the financial year and the percentage of the PSP and HPSP where a substantial portion of the performance
period was completed at the financial year-end. Messrs Johnson’s and Proctor’s awards have been pro-rated for their period of service as Chief Executive.iv. LTIP award percentage reflects the award value expressed as a percentage of maximum award opportunity received each year measured at 31 December. The LTIP expired in 2015
with no further awards outstanding.
117Hunting PLC Annual Report and Accounts 2020
Purpose and C
ultureB
usiness Model and S
takeholdersB
usiness Strategy
Perform
anceG
overn
ance
Financial Statem
ents

Annual Report on Remunerationcontinued
Implementation of Policies in 2021The remuneration policies for 2021 will be applied in line with those detailed on pages 98 to 106, subject to shareholder approval at the Company’s Annual General Meeting on 21 April 2021.
Salary and FeesIn December 2020, the Board concluded that there would be no changes made to fees payable to the non-executive Directors for 2021.
The Remuneration Committee will meet in April 2021 to consider base salary changes for the executive Directors. Any changes are likely to align with any Group-wide base salary increases.
Pension and BenefitsJim Johnson will continue to receive contributions towards a US deferred compensation scheme and a US 401K match deferred savings plan, in line with previous years. Bruce Ferguson will continue to receive a cash sum in lieu of a pension contribution which will be fixed at 12% of his base salary.
No changes are anticipated to the provision of benefits which will continue to include healthcare insurance, a company car and fuel benefits.
Annual BonusThe annual performance-linked bonus for 2021 will operate in line with the 2021 Directors’ Remuneration Policy. The Committee will disclose details of the retrospective performance against the pre-set financial targets and personal/strategic performance objectives, as the Board believes that forward disclosure of the financial targets is commercially sensitive. The annual bonus weightings will remain unchanged from 2020, being 60% PBT, 20% ROCE and 20% personal/strategic performance.
HPSPThe grants to the executive Directors for 2021 will be made in March 2021. The performance conditions, weightings and targets for the HPSP award will generally align with the 2020 HPSP grant. The performance targets will be included in the Stock Exchange announcement to be issued on award of the 2021 HPSP grant. It is anticipated that given the share price decline since the last grant under the HPSP, the Remuneration Committee will apply a 22% reduction to the normal award levels.
Compliance StatementThe Directors’ Remuneration Policy and 2020 Annual Report on Remuneration reflect the Remuneration Committee’s reporting requirements under the amended Companies Act 2006 and the Large and Medium-sized Companies and Groups (Accounts and Reports) (Amendment) Regulations 2013, the Shareholder Rights Directive II, as enacted on 10 June 2019 and also the 2018 UK Corporate Governance Code which became effective for the Company from 1 January 2019.
The 2020 Annual Report on Remuneration, which includes the Letter from the Chair of the Remuneration Committee, details how the approved Directors’ Remuneration Policy was applied during 2020. This report was approved by the Remuneration Committee at its meeting on Monday 1 March 2021.
Annell BayChair of the Remuneration Committee
4 March 2021
118Hunting PLC Annual Report and Accounts 2020
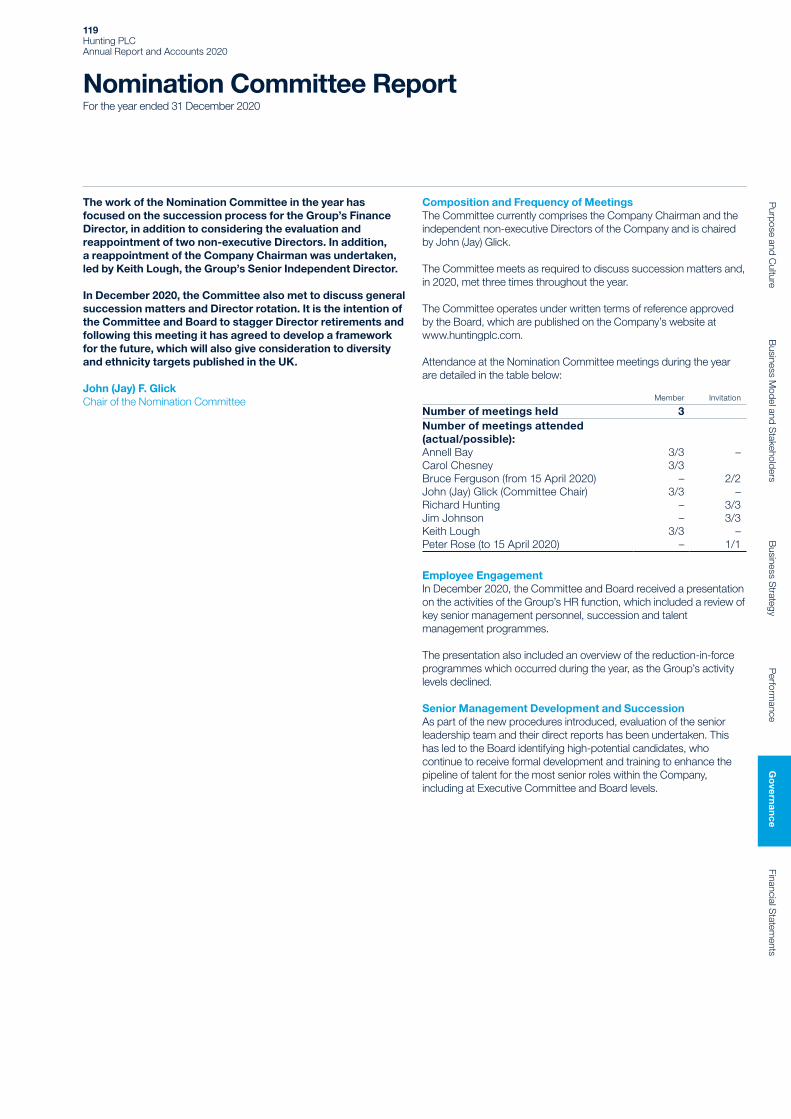
Nomination Committee ReportFor the year ended 31 December 2020
The work of the Nomination Committee in the year has focused on the succession process for the Group’s Finance Director, in addition to considering the evaluation and reappointment of two non-executive Directors. In addition, a reappointment of the Company Chairman was undertaken, led by Keith Lough, the Group’s Senior Independent Director.
In December 2020, the Committee also met to discuss general succession matters and Director rotation. It is the intention of the Committee and Board to stagger Director retirements and following this meeting it has agreed to develop a framework for the future, which will also give consideration to diversity and ethnicity targets published in the UK.
John (Jay) F. GlickChair of the Nomination Committee
Composition and Frequency of MeetingsThe Committee currently comprises the Company Chairman and the independent non-executive Directors of the Company and is chaired by John (Jay) Glick.
The Committee meets as required to discuss succession matters and, in 2020, met three times throughout the year.
The Committee operates under written terms of reference approved by the Board, which are published on the Company’s website at www.huntingplc.com.
Attendance at the Nomination Committee meetings during the year are detailed in the table below:
Member Invitation
Number of meetings held 3Number of meetings attended (actual/possible):Annell Bay 3/3 –Carol Chesney 3/3Bruce Ferguson (from 15 April 2020) – 2/2John (Jay) Glick (Committee Chair) 3/3 –Richard Hunting – 3/3Jim Johnson – 3/3Keith Lough 3/3 –Peter Rose (to 15 April 2020) – 1/1
Employee EngagementIn December 2020, the Committee and Board received a presentation on the activities of the Group’s HR function, which included a review of key senior management personnel, succession and talent management programmes.
The presentation also included an overview of the reduction-in-force programmes which occurred during the year, as the Group’s activity levels declined.
Senior Management Development and SuccessionAs part of the new procedures introduced, evaluation of the senior leadership team and their direct reports has been undertaken. This has led to the Board identifying high-potential candidates, who continue to receive formal development and training to enhance the pipeline of talent for the most senior roles within the Company, including at Executive Committee and Board levels.
119Hunting PLC Annual Report and Accounts 2020
Purpose and C
ultureB
usiness Model and S
takeholdersB
usiness Strategy
Perform
anceG
overn
ance
Financial Statem
ents
Change of Finance DirectorThe Company announced on 23 January 2020 the retirement of Peter Rose as Hunting’s Finance Director and he subsequently stepped down from the Board at the conclusion of the Company’s Annual General Meeting (“AGM”) on 15 April 2020.
A formal succession plan for all members of Hunting’s leadership team has been in place for a number of years. Following discussion at the meeting held on 22 January 2020, and the unanimous agreement of its members, the Committee were delighted to recommend the appointment of Bruce Ferguson as Finance Director, which was submitted to shareholders for approval at the AGM.
As part of the succession and appointment process, Heidrick & Struggles assisted the Committee in the interview and benchmarking process. Apart from this brief, Heidrick and Struggles do not have any other connection to the Company. Further, Kepler Associates provided benchmarked remuneration data which was reviewed by the Remuneration Committee.
Bruce is a qualified Chartered Management Accountant. He joined Hunting in 1994 and has held a number of senior finance and operational roles within the Group’s European businesses and, until April 2020, was managing director of the Group’s EMEA segment.
Board ReappointmentsIn August 2020, the Committee met to consider the reappointment of Richard Hunting as non-independent, non-executive Director and also Jay Glick as non-executive Chair of the Company. Following a discussion, the Committee unanimously reappointed both Messrs Hunting and Glick for a further three-year term, the latter process being led by Keith Lough the Group’s Senor Independent Director.
In December 2020, the Committee also met to consider the reappointment of Annell Bay for a final three-year term. Following a discussion, the Committee unanimously reappointed Ms Bay from 2 February 2021.
Mr Glick and Ms Bay will reach their nine-year limit for non-executive Directors in 2024, and the Committee anticipates an orderly succession given the general discussions held in the year. The Board continues to consider Mr Glick and Ms Bay as independent given their current tenure.
Director RotationAt its meeting in December 2020, the Committee met to discuss general succession matters. Following debate, the Committee agreed a framework for succession and Director Rotation for the non-executive Directors to ensure an enhanced framework was in place.
As part of these discussions, gender and ethnicity targets published by regulators in the UK are also being given consideration in this planning process, with support to be provided by the Group’s Chief HR Officer.
Board EvaluationAs noted in the Corporate Governance Report on page 90, the Board undertook an internally facilitated Board evaluation in 2020. The process concluded that the skills and experience of the Directors were strong and appropriate for the size and profile of the Group.
Committee EffectivenessAt its August meeting, the Committee reviewed its terms of reference and in December considered its effectiveness, concluding that its performance had been satisfactory during the year.
Gender DiversityHunting’s gender diversity policy commits the Group to:
• an embedded culture of equal opportunities for all employees, regardless of gender;
• require external recruitment consultants to submit their diversity policies to the Group prior to appointment;
• ensure that external consultants appointed by Hunting provide candidate shortlists comprising of an appropriate gender balance for consideration by the Nomination Committee; and
• a periodic review by the Nomination Committee of its progress in complying with best practice recommendations.
Following the appointment of Annell Bay in 2015 and Carol Chesney in 2018, Hunting’s Board comprises 29% female Directors, which is close to the recommended UK gender target of 33%.
John (Jay) F. GlickChair of the Nomination Committee
4 March 2021
Nomination Committee Reportcontinued
120Hunting PLC Annual Report and Accounts 2020
Audit Committee ReportFor the year ended 31 December 2020
Hunting’s core oil and gas markets suffered a major downturn during 2020, as a consequence of reduced economic activity due to the COVID-19 pandemic, but also prior to this as the US onshore drilling market slowed as the year commenced. The result of this market environment led to a significant decline in revenue for the Group compared to 2019 and operating losses being reported during 2020.
The work of the Audit Committee and Board in the year therefore focused on the review of the Group’s monthly trading results as management aligned the Group’s cost base with this lower level of activity, with close monitoring of its cash balances and overall liquidity given the challenging trading conditions. The healthy year-end cash position demonstrates the ability of the Group’s business to successfully manage the rapidly changing market environment.
The Committee also reviewed detailed reports on the Group’s Going Concern assumption ahead of its half year and full year results and in the year received reports on various trading scenarios to support the Going Concern and Viability Statements which are included within the 2020 Annual Report and Accounts. The Audit Committee remains comfortable that the disclosures are appropriate and that the Group has the necessary resources to continue trading for the periods under assessment.
The market downturn necessitated a comprehensive balance sheet review to be completed at the half and full year, with detailed impairment testing completed on the Group’s non-current and current assets.
The Group’s auditor has also performed well, with good levels of support and challenge provided to management during the half and full year audit processes, again providing comfort to the Committee of the Group’s performance and position being reported.
Carol ChesneyChair of the Audit Committee
Composition and Frequency of MeetingsThe Committee currently comprises three independent non-executive Directors and is chaired by Carol Chesney. Mrs Chesney is a qualified Chartered Accountant and is considered to have recent and relevant financial experience. Mr Lough and Ms Bay (Chair of the Remuneration Committee) have experience of the global energy industry, with particular expertise in the UK and US oil and gas markets. Further details of the Committee’s experience can be found in the biographical summaries set out on pages 82 and 83.
During the year, there were no changes to the composition of the Committee.
The Committee usually meets four times a year and operates under written terms of reference approved by the Board, which are published on the Company’s website at www.huntingplc.com.
In 2020, the Committee met four times, in February, July, August and December, and the attendance record of Committee members and Board invitees during the year is noted below:
Member Invitation
Number of meetings held 4Number of meetings attended (actual/possible):Annell Bay 4/4Carol Chesney (Committee Chair) 4/4Bruce Ferguson (from 15 April 2020) 3/3John (Jay) Glick 4/4Richard Hunting 4/4Jim Johnson 4/4Keith Lough 4/4Peter Rose (to 15 April 2020) 1/1
All Directors, internal and external auditors are normally invited to attend meetings.
ResponsibilitiesThe principal responsibilities of the Audit Committee are to:
• monitor and review reports from the executive Directors, including the Group’s financial statements and Stock Exchange announcements;
• provide the Board with a recommendation regarding the Half Year and Annual Report and Accounts, including whether they are fair, balanced and understandable;
• review the Company’s and Group’s Going Concern and Viability Statements;
• monitor, review and assess the Group’s systems of risk management and internal control;
• review reports from the Group’s external and internal auditors, including details of the audit programmes and scope;
• consider and recommend to the Board the appointment or reappointment of the external auditor as applicable;
• agree the scope and fees of the external audit; • monitor and approve engagement of the external auditor for the provision of non-audit services to the Group;
• review the external auditor’s independence and effectiveness of the audit process;
• monitor corporate governance and accounting developments; • monitor the Group’s Bribery Act compliance procedures; • review the procedures to comply with the UK Modern Slavery Act; and
• monitor whistleblowing procedures.
121Hunting PLC Annual Report and Accounts 2020
Purpose and C
ultureB
usiness Model and S
takeholdersB
usiness Strategy
Perform
anceG
overn
ance
Financial Statem
ents

Work Undertaken by the Committee During 2020The Committee discussed, reviewed and made a number of decisions on key areas throughout 2020, which are set out below:
Feb Jul Aug Dec
Financial ReportAnnual Report and Full Year Results announcement •Going Concern basis • •Viability Statement •Interim Report and Interim Results announcement •Review accounting policies •Internal control and risk managementRisk management and internal control report • • •Key risks and mitigating controls •Effectiveness of internal controls and internal audit function •Internal audit report • • •Internal audit programme and resourcing •Procedures for preventing bribery and corruption • •Procedures for complying with the Modern Slavery Act • •Sanctions compliance • •Whistleblowing summary reports • •External auditorAuditor’s objectives, independence and appointment •Full Year and Half Year report to the Audit Committee • •Final Management Letter on internal controls •Auditor’s performance and effectiveness •Proposed Year-End audit plan including scope, fees and engagement letter • •Risk of auditor leaving the market •Other businessWhistleblowing and Bribery Policy Review •Committee effectiveness and terms of reference •
COVID-19The Committee’s annual schedule of work was disrupted by the COVID-19 pandemic, with the normal meeting in April being delayed until early July. All items of normal business have been completed by the Committee during the year.
As noted elsewhere in the Annual Report, the Board met fortnightly between March and June 2020, where regular management reports were received on the current market environment, trading performance, mitigating actions and health and safety updates. In addition to these operational reports, cash and liquidity reports were presented by the Finance Director, which contained three-month forward cash projections and bank facility arrangements. Throughout this period, the reports showed that the Group’s net cash balances would remain healthy and, with the efforts to reduce working capital underway from Q2 2020, showed a steady increase throughout the balance of year, giving the Committee and the Board confidence of the financial stability of the Group and its liquidity.
Management has updated its projected trading expectations twice in 2020 and has prepared medium-range financial forecasts that extend to 2025. Projections were reviewed by the Committee in draft at its July 2020 meeting prior to Board approval in August 2020; these also supported the impairments recorded with the Group’s half year results. The projections were subsequently updated as part of the year-end preparations and did not result in any further impairments being recorded. The projections were also used in determining the Going Concern and Viability Statements.
Acquisition of Enpro SubseaIn February 2020, the Group announced the acquisition of Enpro Subsea Limited (“Enpro”) for a cash consideration of $32.8m, excluding cash acquired of $5.5m. Enpro provides subsea equipment to global exploration and production companies. The main assets recognised on the acquisition were property, plant and equipment of $5.8m, other intangible assets of $19.2m and goodwill of $13.4m. These balances have not been impaired in the year. As part of the acquisition agreement, a maximum $3.0m earn-out was agreed, subject to achieving a required threshold for an adjusted EBITDA measure in the 2020 financial year. The fair value of the earn out was determined to be $2.5m at the acquisition date and, given the reduction in trading activity in H1 2020, the earn out consideration was fully released within the Group’s half year results, as the financial target was not expected to be met. At the year-end, the required threshold was not met. The business has, however, made good progress since acquisition and management considers its results to be excellent, given the industry challenges widely reported in the year.
Disposal of Drilling Tools BusinessIn December 2020, the Group announced the disposal of the US segment’s Drilling Tools business unit to Rival Downhole Tools LC (“Rival”), in exchange for a 23.5% equity interest in the enlarged Rival business. The disposal was achieved through the transfer of the key operating assets, such as the rental fleet, and the majority of employees to Rival, who also agreed to lease from the Group certain facilities occupied by the Drilling Tools business. The accounting for the transaction, including the valuation of Hunting’s share of the enlarged Rival business, was reviewed by the Committee as part of the year-end accounts preparation.
Review of the 2020 Financial StatementsThe Committee reviews final drafts of the Group’s Report and Accounts for both the half and full year. As part of this process, the performance of the Group’s major segments is considered, with key judgements, estimates and accounting policies being approved by the Committee ahead of a recommendation to the Board. In addition to briefings and supporting reports from the central finance team on significant issues, the Committee engages in discussion with Deloitte, the Group’s external auditor. Significant matters reviewed by the Committee in connection with the 2020 Annual Report and Accounts were as follows:
Impairment ReviewsAs noted in the letter from the Chair of the Committee, the Group’s trading results in 2020 were adversely impacted by the significant market downturn, leading to reduced revenue and operating losses being reported in the year.
As a consequence of this lower trading environment, impairment reviews in respect to the Group’s current and non-current assets were completed, leading to impairment charges being recorded during the year.
Audit Committee Reportcontinued
122Hunting PLC Annual Report and Accounts 2020

Independent market projections providing an indication of drilling investment and activity levels over the medium term are published by Spears and Associates, which form a reference for the Group’s forecasts. These projections support the impairment modelling completed by management. Management can make adjustments to these market projections to take into account its expectations for specific product lines or other geographic considerations relevant to Hunting’s operational footprint. The impairments recorded in the year in respect of the Group’s current and non-current assets are therefore:
As at 31 December
2019$m
Exceptional impairments
$m
Other movements
$m
As at 31 December
2020$m
Property, plant and equipment 354.7 (19.4) (28.2) 307.1Right-of-use assets 36.7 (4.1) (2.8) 29.8Goodwill 230.2 (79.8) 13.8 164.2Other intangible assets 78.5 (39.2) 3.6 42.9Inventories 350.8 (34.2) (28.2) 288.4Net trade receivables 155.5 (1.2) (47.4) 106.9Total 1,206.4 (177.9) (89.2) 939.3
$174.9m of impairments were charged to exceptional items in the Group’s Half Year Results issued in August 2020, with additional net charges of $3.0m being recognised as part of the year-end review and audit process.
Property, Plant and Equipment (“PPE”)The year-end balance sheet includes $307.1m (2019 – $354.7m) for PPE. This represents approximately 31% of the Group’s net assets (2019 – 29%). The movement in PPE reflects $14.8m of additions and $5.8m recognised as part of the acquisition of Enpro, offset by impairments of $19.4m, the derecognition of the Drilling Tools assets of $14.7m, and $34.1m of other movements, including depreciation. The majority of the impairments, which were recorded in the half-year accounts, were in respect of the Group’s US Drilling Tools and UK well intervention businesses, where the future utilisation of these assets was expected to be lower, given the medium-term outlook for these businesses. The Committee reviewed the PPE impairment tests and subsequent charge and, following discussion, was satisfied that the assumptions and the disclosures in the year-end accounts were appropriate.
Right-of-use AssetsThe year-end balance sheet includes right-of-use assets of $29.8m (2019 – $36.7m). This represents approximately 3% of the Group’s net assets (2019 – 3%). Following the decision in August 2020 to close the Group’s Calgary manufacturing in Canada, the Group recorded an impairment of $3.9m given the impact of the closure on the terms of the lease held. An impairment of $0.2m was also recognised in Hunting Titan. The Committee considered and confirmed the appropriateness of the assumptions and factors used in the review process and were comfortable with the charges, as recorded.
GoodwillThe year-end balance sheet includes $164.2m (2019 – $230.2m) of goodwill. This represents approximately 17% of the Group’s net assets (2019 – 19%). Given the material decline in global markets, as noted in the Market Review section on pages 40 to 44, the carrying values for goodwill for each relevant cash generating unit were tested for impairment, resulting in a charge of $79.8m being recorded.
Of this figure, $65.6m is in relation to the Hunting Titan operating segment, in addition to impairments within the Dearborn, Specialty and European Well Intervention businesses. The Hunting Titan cash generating unit retains $114.9m of goodwill following this exercise. The Committee considered and challenged the discount rates and the factors used in the review process. After discussion, it was satisfied that the charges recorded and the disclosures in the year-end accounts were appropriate.
Other Intangible AssetsThe year-end balance sheet includes other intangible assets of $42.9m (2019 – $78.5m). This represents approximately 4% of the Group’s net assets (2019 – 6%). The amortisation charge recorded in the consolidated income statement was $20.8m (2019 – $32.3m), of which $17.3m arose on acquired intangible assets. The impairment review work assessed the carrying values held in respect of customer relationships held within the Hunting Titan operating segment, in addition to the future values of internally generated technology, and, given the market decline, recorded impairments of $39.2m. The Committee considered and confirmed the appropriateness of the assumptions and factors used in the review process and were comfortable with the charges, as recorded.
InventoriesAt the year-end, the Group held $288.4m (2019 – $350.8m) of inventory. This represents approximately 30% of the Group’s net assets (2019 – 29%). Inventory levels are lower at the year-end due to reduced activity levels and reviews of carrying values carried out during the year that led to net impairments of $36.4m being recorded (2019 – $5.9m), with $34.2m recognised as exceptional. Given this outcome, the Committee concluded that inventory carrying values were fairly stated.
ReceivablesGiven the market decline, the Group reviewed and impaired its outstanding receivables by a net $1.8m (2019 – $1.1m) during the year, with $1.2m shown as exceptional. As part of the review of the Group’s half and full year results, the Committee noted that this work aligned with the review of other assets.
Pre-Tax Exceptional Items Charged to the Consolidated Income Statement The Committee considered the accounting policy definition of exceptional items and the items included within the financial statements to ensure consistency of treatment and adherence to policy. The Group has recorded $177.9m of impairments as exceptional, as noted above. In addition to the impairments, amortisation of acquired intangible assets and other exceptional items have been recognised as follows:
2020$m
2019$m
Impairments 177.9 19.0Amortisation of acquired intangible assets 17.3 28.5Restructuring charges 10.3 –Acquisition costs 1.4 –Reversal of contingent consideration (2.5) –Profit on disposal of Canadian assets (0.8) –Total amortisation and exceptional items 203.6 47.5
In 2019, the impairment recorded in respect of the Group’s operations for the full year totalled $19.0m and was wholly related to the impairment of PPE within the Group’s US Drilling Tools business.
123Hunting PLC Annual Report and Accounts 2020
Purpose and C
ultureB
usiness Model and S
takeholdersB
usiness Strategy
Perform
anceG
overn
ance
Financial Statem
ents

Audit Committee Reportcontinued
TaxationIn view of the international spread of operations, the Committee monitors tax risk, tax audits and provisions held for taxation. The Finance Director briefed the Committee on developments throughout the year. In the year, management reviewed the trading outlook for the Group’s US operations, and, given the decline in market activity, decided to derecognise $21.5m of deferred tax assets, as realisation of the tax benefit is not probable within a reasonable time frame. The Committee noted this critical judgement and confirmed the appropriateness of this item.
Going Concern Basis and Viability StatementGiven the trading losses recorded at the half and full year, the Committee considered the Going Concern assumption to be disclosed within the 2020 Half Year and Annual Reports.
Detailed modelling of the Group’s trading expectations were completed, including the review of base, downside and “breaking point” trading scenarios. Key to the Group’s Going Concern assumption is its ability to retain a positive total cash and bank position and minimise trading losses until wider market conditions improve.
The Committee monitored these assumptions and the disclosures around Going Concern at the half and full year, as well as those around the Group’s Viability Statement for the full year.
The Committee concluded that, given the flexibility of the Group’s business model, in particular its ability to reduce its cost base to align with market conditions, good support for Hunting’s longer-term viability exists. Further, the assessment is supported by the year-end total cash and bank position of $101.7m (2019 – $127.0m).
These factors supported the Committee’s assessment of the Going Concern Statement and the Viability Statement, as detailed on pages 77 to 79. The statements considered by the Committee were supported by reviews of the regular forecast updates provided by management and the bank covenant compliance reports.
In the year, Hunting remained fully compliant with its bank covenants. The Group’s $160m revolving credit facility expires in December 2022, and the Company can increase the facility by a further $75m to $235m subject to approval of the lending group and also extend the facility’s maturity date to December 2023, based on mutual agreement between all parties.
On 1 March 2021, the Audit Committee approved the Viability Statement, detailed on pages 77 and 78 of the Strategic Report, noting that it presented a reasonable outlook for the Group for the next three years.
Fair, Balanced and Understandable AssessmentThe Committee has reviewed the financial statements, together with the narrative contained within the Strategic Report set out on pages 61 to 72, and believes that the 2020 Annual Report and Accounts, taken as a whole, is fair, balanced and understandable.
In arriving at this conclusion the Committee undertook the following:
• review and dialogue in respect of the monthly management accounts and supporting narrative circulated to the Board;
• review of early drafts of the Annual Report and Accounts, providing relevant feedback to the executive Directors;
• regular review and discussion of the financial results during the year, including briefings by Group finance and operational management; and
• receipt and review of reports from the external and internal auditors.
The Committee advised the Board of its conclusion that the 2020 Annual Report and Accounts, taken as a whole, was fair, balanced and understandable at a Meeting of Directors on 1 March 2021.
Internal AuditThe Committee receives reports from the Internal Audit function. The Chair of the Committee also has regular dialogue with the function throughout the year. During the year, the activities of the function were curtailed by the COVID-19 pandemic in Q2 2020, however, activities did resume in H2 2020. In 2020, the Group has implemented a new ERP system within a number of businesses. To support this initiative, the Head of Internal Audit provided consulting services to the Chief IT Officer in respect of best practice control procedures and segregation of duties.
The Committee reviews the internal audit process and effectiveness as part of the Group’s internal control and risk assessment programme. An annual programme of internal audit assignments is reviewed and approved by the Committee. For 2020, the Committee noted that the internal audit focus altered due to the inability to travel to all of the planned audit locations. As a result, resources were leveraged towards ongoing software implementation programmes ensuring that sufficient controls were embedded in these systems and those planned for the future. The Committee met with the Head of Internal Audit, without the presence of the executive Directors, on three occasions during the year. The effectiveness of the Internal Audit function was also considered by the Committee at its February/March meeting, which concluded that the function remained effective.
External AuditDeloitte LLP was appointed by the Group’s shareholders as external auditor in April 2019 and therefore no tenders have been undertaken in the year due to their current tenure. This position also applies to the engagement partner attached to the Group’s account.
The external auditor presented reports at the February, July, August and December meetings of the Audit Committee during 2020. Further, the Chair of the Committee also has had regular dialogue with the audit partner throughout the year.
In March 2021, a full year report by Deloitte was considered ahead of publication of the Group’s 2020 Annual Report and Accounts. In July 2020, Deloitte presented its Management Controls Report, which highlighted control improvements that could be made by the Group.
The Committee meets with the external auditor, without executive Directors present, at the end of each formal meeting.
During the year, the Company complied with the provisions of the Statutory Audit Services for Large Companies Market Investigation (Mandatory Use of Competitive Tender Process and Audit Committee Responsibilities) Order 2014.
Audit ScopeThe Audit Committee considered the audit scope and materiality threshold. The audit scope addressed Group-wide risks and local statutory reporting, enhanced by desk-top reviews for smaller, low risk entities. Approximately 81% of the Group’s reported revenue and over 81% of absolute loss after tax and 89% of the Group’s net assets were audited, covering 21 reporting units, including a number of investment holding companies, across seven countries.
124Hunting PLC Annual Report and Accounts 2020

MaterialityThe Committee discussed materiality with the auditor regarding both accounting errors that will be brought to the Audit Committee’s attention and amounts that would need to be adjusted so that the financial statements give a true and fair view. Overall, audit materiality was set at $3.5m (2019 – $3.8m). This equates to approximately 0.4% of the Group’s net assets for 2020. Furthermore, the auditor agreed to draw to the Audit Committee’s attention all identified, uncorrected misstatements greater than $175,000.
Audit Effectiveness and IndependenceThe external auditor’s full year report includes a statement on their independence, their ability to remain objective and their ability to undertake an effective audit. The Committee considers and assesses this independence statement on behalf of the Board, taking into account the level of fees paid, particularly for non-audit services. The effectiveness of the audit process is considered throughout the year, with a formal review undertaken at the April meeting of the Committee. The assessment considers the various matters including:
• the auditor’s understanding of the Group’s business and industry sector;
• the planning and execution of the audit plan approved by the Committee;
• the communication between the Group and audit engagement team;
• the auditor’s response to questions from the Committee, including during private meetings without management present;
• the independence, objectivity and scepticism of the auditors; • a report from the Finance Director and the Group Financial Controller; and
• finalisation of the audit work ahead of completion and announcement of the Annual Report and Accounts.
In addition, the Committee reviewed and took account of the reports from the Financial Reporting Council on Deloitte LLP, and reviewed a transparency report prepared by Deloitte LLP. After considering these matters, the Committee was satisfied with the effectiveness of the year-end audit process.
Non-Audit ServicesThe Committee closely monitors fees paid to the auditor in respect of non-audit services. With the exception of audit-related assurance services, which totalled $0.1m (2019 – $0.1m), there were no non-audit services fees paid during the year (2019 – $nil). The scope and extent of non-audit work undertaken by the external auditor is monitored by, and requires prior approval from, the Committee to ensure that the provision of such services does not impair their independence or objectivity.
Auditor ReappointmentFollowing discussion in March 2021, the Committee approved of the recommendation to propose the reappointment of Deloitte LLP at the Company’s 2021 Annual General Meeting.
Internal ControlsThe Group has an established risk management framework and internal control environment, which was in operation throughout the year. The Committee monitors these arrangements on behalf of the Board and these are detailed in the Risk Management section of the Strategic Report on pages 51 to 54.
Bribery ActIn compliance with the UK Bribery Act, Hunting has procedures in place, including the publication of Anti-Bribery and Corruption policies and detailed guidelines on interacting with customers, suppliers and agents, including specific policies for gifts, entertainment and hospitality. Senior managers across the Group are required to report their compliance activities, including an evaluation of risk areas. The Group has completed a screening exercise to identify relevant employees who face a heightened risk of bribery, with all relevant personnel completing a formal training and compliance course, in line with the Group’s procedures. The Committee reviews the compliance procedures relating to the Bribery Act at its April and December meetings, which incorporates risk assessments completed by each business unit and gifts and entertainment disclosures made during the reporting period. The Group’s internal audit function reviews local compliance with the Bribery Act and reports control improvements and recommendations to the Committee, where appropriate.
Modern Slavery ActThe Modern Slavery Act 2015 was enacted in 2016 and requires companies to evaluate internal and external risks related to human trafficking and modern slavery. Procedures were introduced during 2016 and continued in 2020, whereby each business unit across the Group completed due diligence on its workforce to highlight employment risks in relation to trafficking and slavery. All businesses within the Group also completed a risk-mapping exercise of their known supply chain to evaluate those customers and suppliers to the Group who operate in those jurisdictions where trafficking and slavery is more prevalent. Hunting published its Modern Slavery Act report in March 2020, located at www.huntingplc.com. Since 2018 the Group’s “Code of Conduct” training course has been rolled out to all employees of the Group, which incorporates information on modern slavery and trafficking.
Code of ConductThe Group’s Code of Conduct contains policies and procedures covering how the Group conducts business and maintains its relationships with business partners. The Code of Conduct is available on the Group’s website and is sent to most customers and suppliers.
WhistleblowingThe Company’s Senior Independent Director, Keith Lough, is the primary point of contact for staff or other key partners of the Group to raise, in confidence, concerns they may have over possible improprieties, financial or otherwise. In addition, the Group engages the services of Safecall Limited to provide an independent and anonymous whistleblowing service available to staff across all of Hunting’s operations. All employees have been notified of these arrangements through the corporate magazine, Group notice boards and the Group’s website.
Review of Committee EffectivenessDuring the year, the Committee reviewed its effectiveness and the Committee Chairman reported these findings to the Board. No issues were identified in this review process.
Carol ChesneyChair of the Audit Committee
4 March 2021
125Hunting PLC Annual Report and Accounts 2020
Purpose and C
ultureB
usiness Model and S
takeholdersB
usiness Strategy
Perform
anceG
overn
ance
Financial Statem
ents

Independent Auditor’s Report to the Members of Hunting PLCFor the year ended 31 December 2020
Report on the Audit of the Financial Statements1. OpinionIn our opinion:
• the financial statements of Hunting PLC (the “parent Company”) and its subsidiaries (the “Group”) give a true and fair view of the state of the Group’s and of the parent Company’s affairs as at 31 December 2020 and of the Group’s loss for the year then ended;
• the Group financial statements have been properly prepared in accordance with international accounting standards in conformity with the requirements of the Companies Act 2006 and International Financial Reporting Standards (IFRSs) as adopted by the European Union;
• the parent Company financial statements have been properly prepared in accordance with international accounting standards in conformity with the requirements of the Companies Act 2006; and
• the financial statements have been prepared in accordance with the requirements of the Companies Act 2006.
We have audited the financial statements which comprise:
• the consolidated income statement; • the consolidated statement of comprehensive income; • the consolidated and parent company balance sheets; • the consolidated and parent company statements of changes in equity; • the consolidated and parent company statement of cash flows; and • the related notes 1 to 42 for the consolidated financial statements, and notes C1 to C21 for the parent company financial statements.
The financial reporting framework that has been applied in the preparation of the group financial statements is applicable law and international accounting standards in conformity with the requirements of the Companies Act 2006 and IFRSs as adopted by the European Union and as issued by the IASB. The financial reporting framework that has been applied in the preparation of the parent company financial statements is applicable law and international accounting standards in conformity with the requirements of the Companies Act 2006.
2. Basis for OpinionWe conducted our audit in accordance with International Standards on Auditing (UK) (ISAs (UK)) and applicable law. Our responsibilities under those standards are further described in the auditor’s responsibilities for the audit of the financial statements section of our report.
We are independent of the Group and the parent Company in accordance with the ethical requirements that are relevant to our audit of the financial statements in the UK, including the Financial Reporting Council’s (the ‘FRC’s’) Ethical Standard as applied to listed public interest entities, and we have fulfilled our other ethical responsibilities in accordance with these requirements. We confirm that the non-audit services prohibited by the FRC’s Ethical Standard were not provided to the group or the parent company.
We believe that the audit evidence we have obtained is sufficient and appropriate to provide a basis for our opinion.
126Hunting PLC Annual Report and Accounts 2020

3. Summary of our Audit Approach
Key audit matters The key audit matters that we identified in the current year were:
• inventory valuation;• goodwill and non-current asset impairment;• revenue recognition; and• going concern.
Within this report, key audit matters are identified as follows:
Newly identified
Increased level of risk
Similar level of risk
Materiality The materiality that we used for the Group financial statements was $3.5 million (2019: $3.8 million), which was determined on the basis of net assets.
Scoping The scope of our Group audit includes a number of reporting units across the Group, whose results taken together account for 81% of the Group’s revenue, 81% of the Group’s absolute loss after tax and 89% of the Group’s net assets. Our audit work covered Group operations in seven countries, covering 21 reporting units, including a number of investment holding companies.
Significant changes in our approach
The benchmark used to determine our materiality threshold has changed from profit before tax in 2019 to a net asset metric in 2020, given the relative stability of the Group’s balance sheet despite a significant decline in revenue and loss before tax incurred in the year. We consider an asset-based benchmark to be a more relevant metric in the current economic environment.
In light of the uncertain market conditions, we elevated our risk over the appropriateness of the going concern assumption and the associated disclosures. This has been identified as a key audit matter for 2020.
Other than those changes identified above, there have been no other significant changes to our approach.
4. Conclusions Relating to Going ConcernIn auditing the financial statements, we have concluded that the Directors’ use of the going concern basis of accounting in the preparation of the financial statements is appropriate.
Our evaluation of the Directors’ assessment of the Group’s and parent Company’s ability to continue to adopt the going concern basis of accounting is discussed in section 5.4.
Based on the work we have performed, we have not identified any material uncertainties relating to events or conditions that, individually or collectively, may cast significant doubt on the Group’s and parent Company’s ability to continue as a going concern for a period of at least twelve months from when the financial statements are authorised for issue.
In relation to the reporting on how the Group has applied the UK Corporate Governance Code, we have nothing material to add or draw attention to in relation to the Directors’ statement in the financial statements about whether the Directors considered it appropriate to adopt the going concern basis of accounting.
Our responsibilities and the responsibilities of the Directors with respect to going concern are described in the relevant sections of this report.
127Hunting PLC Annual Report and Accounts 2020
Purpose and C
ultureB
usiness Model and S
takeholdersB
usiness Strategy
Perform
anceG
overnanceFin
ancial Statem
ents

Independent Auditor’s Report to the Members of Hunting PLCcontinued
5. Key Audit MattersKey audit matters are those matters that, in our professional judgement, were of most significance in our audit of the financial statements of the current period and include the most significant assessed risks of material misstatement (whether or not due to fraud) that we identified. These matters included those which had the greatest effect on: the overall audit strategy, the allocation of resources in the audit; and directing the efforts of the engagement team.
These matters were addressed in the context of our audit of the financial statements as a whole, and in forming our opinion thereon, and we do not provide a separate opinion on these matters.
5.1. Inventory Valuation
Key audit matter description
The Group holds inventory of $288.4 million (2019: $350.8 million), net of a provision of $37.2 million (2019: $26.5 million). The cyclical and often challenging trading environment and market conditions continue to expose the Group to the risk of inventory being carried at an amount greater than its net realisable value, with trading conditions becoming significantly more challenging in the current year. In addition, future market demand for both existing and new products will impact future sales, especially given the longevity of some of the Group’s products. These factors, together with the level of significant inventory levels carried, could lead to a risk of over-valuation of inventories.
Management’s judgement in assessing the valuation of inventory is primarily based on expectations of future sales and inventory utilisation plans, combined with their assessment of the continued technological relevance of the Group’s products.
Refer to page 123 of the Audit Committee report and notes 1, 20 and 41 to the financial statements.How the scope of our audit responded to the key audit matter
We understood the process for recording inventory and assessed the nature of the Group’s inventory through enquiries with management, attending a number of the Group’s sites to perform a physical count and review of the utilisation of aged inventory products. Across all components in the Group with a material inventory balance, as part of our risk assessment process, we reviewed the basis for the provision recorded across all categories of inventory, analysing the consistency of this approach in line with comparable businesses elsewhere in the Group.
Specifically, we have:
• obtained an understanding of the relevant controls over the inventory valuation process, including how management estimate their inventory reserves;
• obtained and reviewed the inventory provisioning models used and determined if they remain appropriate methodologies with reference to the level of write-offs and evidence of sale of slow-moving stock in the period to 31 December 2020 and that they appropriately reflect the current market conditions following the recently depressed oil price and lower levels of product demand throughout the Group’s key markets;
• for components that determine inventory reserves based on the date the inventory was last used, performed an analysis of movements between ageing categories during the year and tested a sample of items to assess whether the inventory categories had been appropriately reserved;
• based on samples of items selected at a sample size correlated to the level of risk associated with inventory (which we assessed separately at each component with material inventory), considered the available support, including current sales transactions, used to determine an appropriate net realisable value to confirm that inventory is being held at an appropriate amount. Where deemed necessary, we also made direct enquiries of sales and operational personnel;
• where inventory consists of recently produced and newer products, we independently researched the addressable market to assess whether there was contradictory evidence indicating that this inventory will not be sold; and
• where appropriate, compared forecast sales against relevant third-party market forecasts as an ultimate stand back assessment on the future utilisation of current inventory levels.
Key observations We are satisfied that the judgements taken by management are appropriate in light of the current market conditions and expected gradual recovery from 2021 onwards.
128Hunting PLC Annual Report and Accounts 2020

5.2. Goodwill and Non-current Asset Impairment
Key audit matter description
The Group balance sheet has a significant level of goodwill and non-current assets. This includes goodwill of $164.2 million (2019: $230.2 million), which is tested annually for impairment. Intangible assets of $42.9 million (2019: $78.5 million) include customer relationships, unpatented technology and patents and trademarks. The property, plant and equipment balance is $307.1 million (2019: $354.7 million) and the right-of-use assets amounted to $29.8 million (2019: $36.7 million).
An impairment of $142.5 million was recorded in the period given the worsened market conditions and the decline in business activity levels due to the global impact of COVID-19, with the majority of this representing impairment of goodwill booked at the half year balance sheet date, which cannot be reversed under IAS 36 Impairment of Assets.
Testing a cash-generating unit (“CGU”) for impairment requires determination of its recoverable amount, which is a judgemental assessment that depends on the forecast future financial performance of the CGU and future market performance. The oil and gas market in 2020 has seen a significant decline with oil prices falling to as low as a negative during the second quarter of the year. Although there have been recent signs of improvement in the market, the Group continues to operate in challenging market conditions.
We focused our efforts on the Hunting Titan and Enpro CGUs and related disclosures in the financial statements given the sensitivity of the forecast revenue assumption in both CGUs, and subsequent ability to generate the forecast level of EBITDA margin required to support their carrying value.
Refer to pages 122 and 123 of the Audit Committee report and notes 1, 16 and 41 to the financial statements.How the scope of our audit responded to the key audit matter
Across each of the Group’s CGUs we:
• sensitised each key driver of the cash flow forecasts, by determining what we considered to be a reasonably possible change in the assumptions, based on current market data and historical and current business performance; and
• calculated the degree to which the key assumptions would need to change before an impairment would be triggered.
In respect of the Hunting Titan and Enpro CGUs, we challenged the following:
• the forecast revenue and margin growth rate assumptions and how management have incorporated the impact of expected changes in levels of product demand, and the reasonableness of the timing and phasing of market recovery following depressed conditions principally caused by the COVID-19 pandemic, by comparing them to short- and medium-term growth rates with reference to independent specialist third party published reports whilst considering the impact already observed within the market and actual trading in the second half of 2020;
• the terminal growth rates by comparing them to economic and industry forecast; and • the discount rates by comparing the cost of capital assumption for each CGU against comparable organisations and independently calculated discount rates with involvement from valuations specialists.
Where an impairment was identified and booked during the period, we assessed the methodology applied, and tested the underlying source data.
We also reviewed the sensitivity disclosures included in the financial statements (note 16) to assess the assumptions selected to sensitise, and the associated range, was reasonable in light of our understanding of the risks associated with the future performance of these assets.
Key observations We are satisfied that the impairment of goodwill recorded during the period is appropriate, in light of the conditions that existed at the required testing dates. The sensitivity disclosures in the financial statements appropriately present the CGUs (Hunting Titan and Enpro) that are most sensitive to potential future changes in key assumptions.
129Hunting PLC Annual Report and Accounts 2020
Purpose and C
ultureB
usiness Model and S
takeholdersB
usiness Strategy
Perform
anceG
overnanceFin
ancial Statem
ents

Independent Auditor’s Report to the Members of Hunting PLCcontinued
5.3. Revenue Recognition
Key audit matter description
The revenue recognised by the Group in 2020 is $626.0 million (2019: $960.0 million).
The Group’s revenue recognition policy does not generally require a high level of judgement, however due to the quantum of revenue, contractual terms agreed with customers and the volume of sales that occur close to period end, there is a cut off risk associated with certain components which has guided the focus of our audit effort. We have also placed due consideration on components who recognise revenue over time.
The key risks in respect of revenue recognition are:
• the cut-off of sales made close to the period end for point in time revenue recognition, with specific consideration of whether control has passed to the customer; and
• the appropriateness of revenue recognition criteria for revenue that is recognised over time.
Refer to notes 3 and 41 to the financial statements.How the scope of our audit responded to the key audit matter
We obtained an understanding of the relevant controls over the revenue process.
For point in time revenue recognition, we evaluated the key contractual terms in place with customers and determined an appropriate period for testing sales close to the period end based on the date of invoicing versus the latest date control may pass. We evaluated whether the sales had been appropriately recognised based on the contractual terms and underlying evidence of when control has passed.
For over time revenue recognition, we identified significant contracts and assessed the appropriateness of the revenue recognition model in place, with due consideration of the underlying contractual agreement, challenging how these terms have been interpreted under the requirements of IFRS 15 Revenue from Contracts with Customers, and ensured that the revenue recorded was correctly calculated.
Key observations Based on the procedures performed, we obtained evidence that the revenue was recognised appropriately and in accordance with IFRS 15 Revenue from Contracts with Customers.
130Hunting PLC Annual Report and Accounts 2020

5.4. Going Concern
Key audit matter description
As at 31 December 2020 the Group had $102.9 million of cash at bank and in hand and $1.2 million of bank overdrafts. The Group’s $160 million revolving credit facility (“RCF”) due to expire in December 2022, with the associated covenants being in respect of the ratio of net debt to EBITDA and the ratio of finance charges to EBITDA. The facility remains undrawn at 31 December 2020.
Due to the COVID-19 pandemic and the adverse impact this has had on the Group’s trading results through significant reductions in demand for the Group’s products, we identified an increased risk around the Group’s ability to continue as a going concern. We have however observed that in the second half of the year, trading declines generally flattened and there were signs of gradual recovery in a number of the Group’s businesses towards the end of 2020.
Should the Group generate negative EBITDA over a 12 month rolling covenant test period, and require to draw down on the RCF, then this could result in a technical covenant breach, which would be considered an event of default in the absence of obtaining any covenant waiver. We have therefore focused our work on challenging the ability of the Group to operate within its current cash reserves throughout the going concern period.
Management has assessed the Group’s recent trading performance and its latest forecasts and took account of reasonably predictable changes in future trading performance. Management sensitised these forecasts to reflect plausible downside scenarios as a result of the Covid-19 impact on global economies. These forecasts demonstrated that the Group is able to maintain sufficient cash reserves, without utilising the RCF, within the going concern period.
Management also prepared further stress-test forecasts to identify the conditions that are required to fully consume the Group’s cash reserves by December 2022 (which is beyond the required period over which to assess going concern), causing a breach of banking covenants and restricting access to the Group’s currently undrawn RCF in the going concern assessment period. Further details of the extent of sensitivity performed are included on page 79. Management, and the Board of Directors, concluded that the likelihood of such severe forecasts occurring in combination was remote and, therefore, no material uncertainties were identified in relation to the Group’s ability to continue as a going concern in the next twelve months.
How the scope of our audit responded to the key audit matter
In assessing the risk associated with going concern, we performed the following procedures:
• obtained management’s assessment of going concern and viability for the Group, understanding how this assessment factors in current market conditions including the expected timing and phasing of recovery as the worldwide economy starts to recover. We also considered Hunting’s business model and how this was factored into the assessment, including the impact of COVID-19 on the business and financing such as the availability of credit facilities and the impact on borrowing facilities;
• made enquiries as to the process followed by management and obtained an understanding of the respective key controls, including the budgets and forecasts covering the foreseeable future, the process for monitoring compliance with covenants, the assumptions on which the assessment is based and management’s plans for future action;
• with respect to the cash flow forecasts that drive the going concern assessment, evaluated the reliability of the underlying data and challenged management on the assumptions applied;
• compared management’s assumptions to external industry data where relevant; • challenged the stress test prepared and assessed whether the forecasts have been sufficiently stretched to a reasonably unlikely scenario;
• performed a stand-back assessment and considered all relevant audit evidence obtained, whether corroborative or contradictory, for any indicators of possible management bias; and
• assessed whether management’s use of the going concern basis of accounting for the year end accounts is appropriate, and that the disclosures in the financial statements are adequate and sufficiently detailed.
Key observations We are satisfied that the Director’s conclusion that there are no material uncertainties over the Group and parent Company’s ability to continue as a going concern is appropriate.
131Hunting PLC Annual Report and Accounts 2020
Purpose and C
ultureB
usiness Model and S
takeholdersB
usiness Strategy
Perform
anceG
overnanceFin
ancial Statem
ents
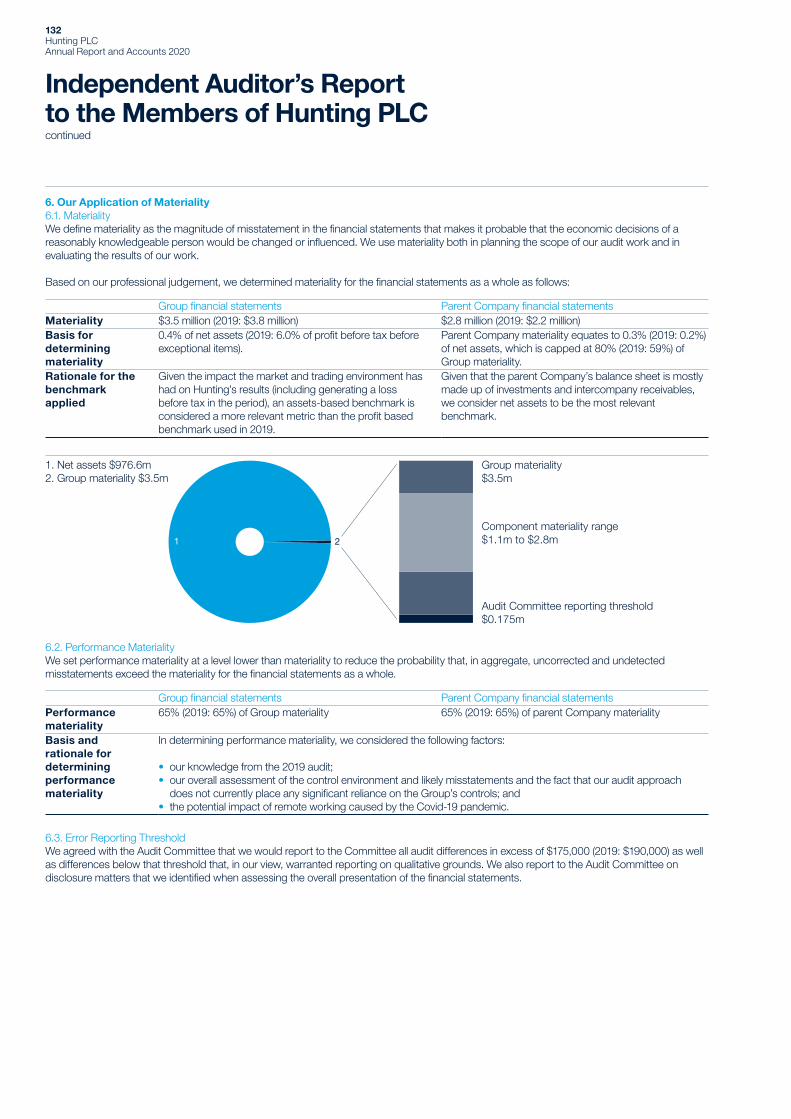
Independent Auditor’s Report to the Members of Hunting PLCcontinued
6. Our Application of Materiality6.1. MaterialityWe define materiality as the magnitude of misstatement in the financial statements that makes it probable that the economic decisions of a reasonably knowledgeable person would be changed or influenced. We use materiality both in planning the scope of our audit work and in evaluating the results of our work.
Based on our professional judgement, we determined materiality for the financial statements as a whole as follows:
Group financial statements Parent Company financial statementsMateriality $3.5 million (2019: $3.8 million) $2.8 million (2019: $2.2 million)Basis for determining materiality
0.4% of net assets (2019: 6.0% of profit before tax before exceptional items).
Parent Company materiality equates to 0.3% (2019: 0.2%) of net assets, which is capped at 80% (2019: 59%) of Group materiality.
Rationale for the benchmark applied
Given the impact the market and trading environment has had on Hunting’s results (including generating a loss before tax in the period), an assets-based benchmark is considered a more relevant metric than the profit based benchmark used in 2019.
Given that the parent Company’s balance sheet is mostly made up of investments and intercompany receivables, we consider net assets to be the most relevant benchmark.
21
1. Net assets $976.6m2. Group materiality $3.5m
Group materiality$3.5m
Component materiality range $1.1m to $2.8m
Audit Committee reporting threshold $0.175m
6.2. Performance MaterialityWe set performance materiality at a level lower than materiality to reduce the probability that, in aggregate, uncorrected and undetected misstatements exceed the materiality for the financial statements as a whole.
Group financial statements Parent Company financial statementsPerformance materiality
65% (2019: 65%) of Group materiality 65% (2019: 65%) of parent Company materiality
Basis and rationale for determining performance materiality
In determining performance materiality, we considered the following factors:
• our knowledge from the 2019 audit; • our overall assessment of the control environment and likely misstatements and the fact that our audit approach does not currently place any significant reliance on the Group’s controls; and
• the potential impact of remote working caused by the Covid-19 pandemic.
6.3. Error Reporting ThresholdWe agreed with the Audit Committee that we would report to the Committee all audit differences in excess of $175,000 (2019: $190,000) as well as differences below that threshold that, in our view, warranted reporting on qualitative grounds. We also report to the Audit Committee on disclosure matters that we identified when assessing the overall presentation of the financial statements.
132Hunting PLC Annual Report and Accounts 2020

7. An Overview of the Scope of our Audit7.1. Identification and Scoping of ComponentsThe Group has 58 (2019: 55) reporting units and the financial statements reflect a consolidation of entities covering centralised functions, operating units and non-trading legal entities. The systems, processes and controls in place vary across the Group and therefore our audit scoping procedures considered each operating unit individually.
Our scoping consisted of three levels, with audit effort split across each scoping level. We identified 12 (2019: 12) operating units across the Group that were subject to full scope reporting on their complete financial information, which included four holding company reporting units. Specific audit procedures over certain balances were performed at a further 9 (2019: 10) operating units, including two holding company reporting units, to give appropriate coverage on all material balances at the Group level. The remaining operating units and balances not included above were subject to analytical review procedures. Together, the reporting units subject to audit procedures accounted for 81% of the Group’s revenue, 81% of the Group’s absolute loss after tax and 89% of the Group’s net assets. The range of component materiality levels is $1.1 million to $2.8 million.
Revenue
1. Full audit scope 70%2. Specified audit procedures 11%3. Review at group level 19%
2
3
1
Absolute loss after tax
1. Full audit scope 67%2. Specified audit procedures 14%3. Review at group level 19%
2
3
1
Net assets
1. Full audit scope 81%2. Specified audit procedures 8%3. Review at group level 11%
2
31
We have engaged local, component audit teams to conduct the procedures over the overseas business units in scope. This includes a team in the US for the US business (including Titan US), China, Singapore and the UK. We have exercised our oversight of these component teams remotely.
7.2. Our Consideration of the Control Environment Consistent with our 2019 audit and our 2020 audit plan, we did not adopt a controls reliance approach across any of the key business processes. We obtained an understanding of key manual controls within the financial reporting processes, and of those key controls relating to our significant risks. In addition, we have obtained an understanding of those key general IT controls (“GITCs”) within Cognos, management’s reporting and consolidation software.
A new ERP system (“D365”) has been implemented in the Group’s Titan US and US Manufacturing operating units. We have engaged our IT specialists to obtain an understanding of the associated GITCs, in areas such as information security, user access and change management. Further, we assessed the data conversion and migration, with focus on inventory compilation such as count and cost at date of migration.
7.3. Working with Other AuditorsIn doing our scoping procedures as described above, our audit work covered Group operations in seven countries, covering 21 reporting units, including a number of head office entities.
We directed and supervised our component audit teams through regular discussions and interactions during the planning phase of our audit, and throughout the year end procedures. We performed a detailed review of their work over areas such as key judgements and significant risks, with the use of technology and remote file access. We also requested a number of reporting documents to be completed by each team for our review.
Further, specific audit procedures over the central functions and areas of significant judgement including taxation, treasury and impairment were performed by the Group audit team centrally.
133Hunting PLC Annual Report and Accounts 2020
Purpose and C
ultureB
usiness Model and S
takeholdersB
usiness Strategy
Perform
anceG
overnanceFin
ancial Statem
ents

Independent Auditor’s Report to the Members of Hunting PLCcontinued
8. Other InformationThe other information comprises the information included in the annual report, other than the financial statements and our Auditor’s Report thereon. The Directors are responsible for the other information contained within the annual report.
Our opinion on the financial statements does not cover the other information and, except to the extent otherwise explicitly stated in our report, we do not express any form of assurance conclusion thereon.
Our responsibility is to read the other information and, in doing so, consider whether the other information is materially inconsistent with the financial statements or our knowledge obtained in the course of the audit, or otherwise appears to be materially misstated.
If we identify such material inconsistencies or apparent material misstatements, we are required to determine whether this gives rise to a material misstatement in the financial statements themselves. If, based on the work we have performed, we conclude that there is a material misstatement of this other information, we are required to report that fact.
We have nothing to report in this regard.
9. Responsibilities of DirectorsAs explained more fully in the Statement of Directors’ Responsibilities, the Directors are responsible for the preparation of the financial statements and for being satisfied that they give a true and fair view, and for such internal control as the Directors determine is necessary to enable the preparation of financial statements that are free from material misstatement, whether due to fraud or error.
In preparing the financial statements, the Directors are responsible for assessing the Group’s and the parent Company’s ability to continue as a going concern, disclosing as applicable, matters related to going concern and using the going concern basis of accounting unless the Directors either intend to liquidate the Group or the parent Company or to cease operations, or have no realistic alternative but to do so.
10. Auditor’s Responsibilities for the Audit of the Financial StatementsOur objectives are to obtain reasonable assurance about whether the financial statements as a whole are free from material misstatement, whether due to fraud or error, and to issue an auditor’s report that includes our opinion. Reasonable assurance is a high level of assurance, but is not a guarantee that an audit conducted in accordance with ISAs (UK) will always detect a material misstatement when it exists. Misstatements can arise from fraud or error and are considered material if, individually or in the aggregate, they could reasonably be expected to influence the economic decisions of users taken on the basis of these financial statements.
A further description of our responsibilities for the audit of the financial statements is located on the FRC’s website at: www.frc.org.uk/auditorsresponsibilities. This description forms part of our Auditor’s Report.
11. Extent to Which the Audit was Considered Capable of Detecting Irregularities, Including FraudIrregularities, including fraud, are instances of non-compliance with laws and regulations. We design procedures in line with our responsibilities, outlined above, to detect material misstatements in respect of irregularities, including fraud. The extent to which our procedures are capable of detecting irregularities, including fraud is detailed below.
11.1. Identifying and Assessing Potential Risks Related to IrregularitiesIn identifying and assessing risks of material misstatement in respect of irregularities, including fraud and non-compliance with laws and regulations, we considered the following:
• the nature of the industry and sector, control environment and business performance including the design of the Group’s remuneration policies, key drivers for directors’ remuneration, bonus levels and performance targets;
• results of our enquiries of management and the audit committee about their own identification and assessment of the risks of irregularities; • any matters we identified having obtained and reviewed the Group’s documentation of their policies and procedures relating to:
– identifying, evaluating and complying with laws and regulations and whether they were aware of any instances of non-compliance; – detecting and responding to the risks of fraud and whether they have knowledge of any actual, suspected or alleged fraud; – the internal controls established to mitigate risks of fraud or non-compliance with laws and;
• the matters discussed among the audit engagement team including significant component audit teams and relevant internal specialists, including tax, valuations, IT and financial instruments specialists regarding how and where fraud might occur in the financial statements and any potential indicators of fraud.
As a result of these procedures, we considered the opportunities and incentives that may exist within the organisation for fraud and identified the greatest potential for fraud in revenue recognition. In common with all audits under ISAs (UK), we are also required to perform specific procedures to respond to the risk of management override of controls.
We also obtained an understanding of the legal and regulatory frameworks that the Group operates in, focusing on provisions of those laws and regulations that had a direct effect on the determination of material amounts and disclosures in the financial statements. The key laws and regulations we considered in this context included the UK Companies Act, Listing Rules, patent law, tax legislation and pensions legislation.
In addition, we considered provisions of other laws and regulations that do not have a direct effect on the financial statements but compliance with which may be fundamental to the Group’s ability to operate or to avoid a material penalty. These included employment and minimum wage legislation, health, safety and the environment (“HSE”), international trading laws and environmental regulations.
134Hunting PLC Annual Report and Accounts 2020

11.2. Audit Response to Risks IdentifiedAs a result of performing the above, we identified revenue recognition as a key audit matter related to the potential risk of fraud. The key audit matters section of our report explains the matter in more detail and also describes the specific procedures we performed in response to that key audit matter.
In addition to the above, our procedures to respond to risks identified included the following:
• reviewing the financial statement disclosures and testing to supporting documentation to assess compliance with provisions of relevant laws and regulations described as having a direct effect on the financial statements;
• enquiring of management, the audit committee and external legal counsel concerning actual and potential litigation and claims; • performing analytical procedures to identify any unusual or unexpected relationships that may indicate risks of material misstatement due to fraud;
• reading minutes of meetings of those charged with governance, reviewing internal audit reports and reviewing correspondence with HMRC; and
• in addressing the risk of fraud through management override of controls, testing the appropriateness of journal entries and other adjustments; assessing whether the judgements made in making accounting estimates are indicative of a potential bias; and evaluating the business rationale of any significant transactions that are unusual or outside the normal course of business.
We also communicated relevant identified laws and regulations and potential fraud risks to all engagement team members including internal specialists and significant component audit teams, and remained alert to any indications of fraud or non-compliance with laws and regulations throughout the audit.
Report on Other Legal and Regulatory Requirements
12. Opinions on Other Matters Prescribed by the Companies Act 2006In our opinion the part of the Directors’ Annual Report on Remuneration to be audited has been properly prepared in accordance with the Companies Act 2006.
In our opinion, based on the work undertaken in the course of the audit:
• the information given in the Strategic Report and the Directors’ Report for the financial year for which the financial statements are prepared is consistent with the financial statements; and
• the Strategic Report and the Directors’ Report have been prepared in accordance with applicable legal requirements.
In the light of the knowledge and understanding of the Group and the parent Company and their environment obtained in the course of the audit, we have not identified any material misstatements in the Strategic Report or the Directors’ Report.
13. Corporate Governance StatementThe Listing Rules require us to review the Directors’ statement in relation to going concern, longer-term viability and that part of the Corporate Governance Statement relating to the Group’s compliance with the provisions of the UK Corporate Governance Code specified for our review.Based on the work undertaken as part of our audit, we have concluded that each of the following elements of the Corporate Governance Statement is materially consistent with the financial statements and our knowledge obtained during the audit:
• the Directors’ statement with regards to the appropriateness of adopting the going concern basis of accounting and any material uncertainties identified set out on page 79;
• the Directors’ explanation as to its assessment of the Group’s prospects, the period this assessment covers and why the period is appropriate set out on pages 77 and 78;
• the Directors’ statement on fair, balanced and understandable set out on page 76; • the Board’s confirmation that it has carried out a robust assessment of the emerging and principal risks set out on page 53; • the section of the annual report that describes the review of effectiveness of risk management and internal control systems set out on pages 53 and 54; and
• the section describing the work of the audit committee set out on page 122.
135Hunting PLC Annual Report and Accounts 2020
Purpose and C
ultureB
usiness Model and S
takeholdersB
usiness Strategy
Perform
anceG
overnanceFin
ancial Statem
ents
Independent Auditor’s Report to the Members of Hunting PLCcontinued
14. Matters on Which we are Required to Report by Exception14.1. Adequacy of Explanations Received and Accounting RecordsUnder the Companies Act 2006 we are required to report to you if, in our opinion:
• we have not received all the information and explanations we require for our audit; or • adequate accounting records have not been kept by the parent Company, or returns adequate for our audit have not been received from branches not visited by us; or
• the parent Company financial statements are not in agreement with the accounting records and returns.
We have nothing to report in respect of these matters.
14.2. Directors’ RemunerationUnder the Companies Act 2006 we are also required to report if in our opinion certain disclosures of Directors’ remuneration have not been made or the part of the Directors’ Remuneration Report to be audited is not in agreement with the accounting records and returns.
We have nothing to report in respect of these matters.
15. Other Matters Which we are Required to Address15.1. Auditor TenureFollowing the recommendation of the audit committee, we were appointed by the Directors on 17 April 2019 to audit the financial statements for the year ended 31 December 2019 and subsequent financial periods. The period of total uninterrupted engagement including previous renewals and reappointments of the firm is two years, covering the years ending 31 December 2019 and 31 December 2020.
15.2. Consistency of the Audit Report with the Additional Report to the Audit CommitteeOur audit opinion is consistent with the additional report to the audit committee we are required to provide in accordance with ISAs (UK).
16. Use of our ReportThis report is made solely to the Company’s members, as a body, in accordance with Chapter 3 of Part 16 of the Companies Act 2006. Our audit work has been undertaken so that we might state to the Company’s members those matters we are required to state to them in an Auditor’s Report and for no other purpose. To the fullest extent permitted by law, we do not accept or assume responsibility to anyone other than the Company and the Company’s members as a body for our audit work, for this report, or for the opinions we have formed.
William Smith(Senior statutory auditor)For and on behalf of Deloitte LLPStatutory AuditorLondon, UK4 March 2021
136Hunting PLC Annual Report and Accounts 2020
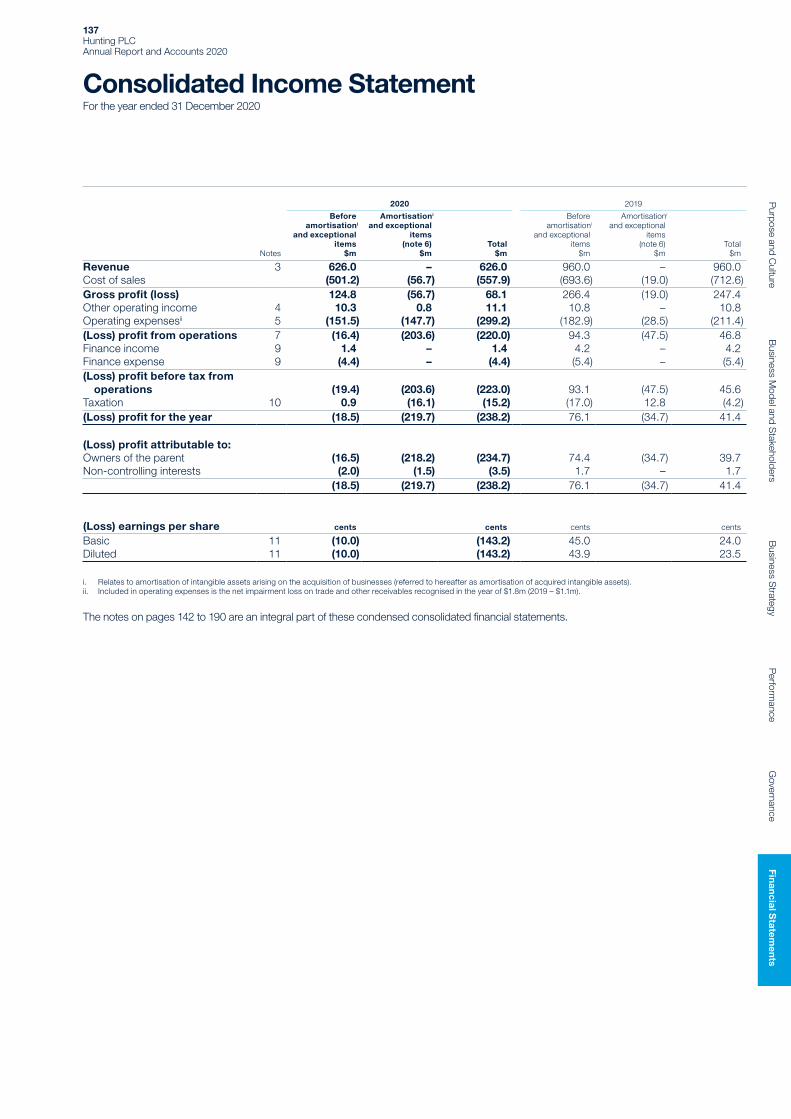
Consolidated Income StatementFor the year ended 31 December 2020
Notes
2020 2019
Before amortisationi
and exceptional items
$m
Amortisationi
and exceptional items
(note 6)$m
Total$m
Before amortisationi
and exceptional items
$m
Amortisationi
and exceptional items
(note 6)$m
Total$m
Revenue 3 626.0 – 626.0 960.0 – 960.0Cost of sales (501.2) (56.7) (557.9) (693.6) (19.0) (712.6)Gross profit (loss) 124.8 (56.7) 68.1 266.4 (19.0) 247.4Other operating income 4 10.3 0.8 11.1 10.8 – 10.8Operating expensesii 5 (151.5) (147.7) (299.2) (182.9) (28.5) (211.4)(Loss) profit from operations 7 (16.4) (203.6) (220.0) 94.3 (47.5) 46.8Finance income 9 1.4 – 1.4 4.2 – 4.2Finance expense 9 (4.4) – (4.4) (5.4) – (5.4)(Loss) profit before tax from operations (19.4) (203.6) (223.0) 93.1 (47.5) 45.6Taxation 10 0.9 (16.1) (15.2) (17.0) 12.8 (4.2)(Loss) profit for the year (18.5) (219.7) (238.2) 76.1 (34.7) 41.4
(Loss) profit attributable to:Owners of the parent (16.5) (218.2) (234.7) 74.4 (34.7) 39.7Non-controlling interests (2.0) (1.5) (3.5) 1.7 – 1.7
(18.5) (219.7) (238.2) 76.1 (34.7) 41.4
(Loss) earnings per share cents cents cents cents
Basic 11 (10.0) (143.2) 45.0 24.0Diluted 11 (10.0) (143.2) 43.9 23.5
i. Relates to amortisation of intangible assets arising on the acquisition of businesses (referred to hereafter as amortisation of acquired intangible assets).ii. Included in operating expenses is the net impairment loss on trade and other receivables recognised in the year of $1.8m (2019 – $1.1m).
The notes on pages 142 to 190 are an integral part of these condensed consolidated financial statements.
137Hunting PLC Annual Report and Accounts 2020
Purpose and C
ultureB
usiness Model and S
takeholdersB
usiness Strategy
Perform
anceG
overnanceFin
ancial Statem
ents

Consolidated Statement of Comprehensive IncomeFor the year ended 31 December 2020
Notes2020
$m2019
$m
Comprehensive income:(Loss) profit for the year (238.2) 41.4
Components of other comprehensive income (expense) after tax:Items that may be reclassified subsequently to profit or loss:Exchange adjustments 5.9 5.4Fair value gains and losses:– gains (losses) originating on net investment hedges arising during the year 34 0.4 (0.7)
6.3 4.7Items that have been reclassified to profit or loss:Release of foreign exchange on liquidation of subsidiaries 34 – (0.2)
Items that will not be reclassified to profit or loss:Remeasurement of defined benefit pension schemes 35 – (0.3)Other comprehensive income after tax 6.3 4.2Total comprehensive (expense) income for the year (231.9) 45.6
Total comprehensive (expense) income attributable to:Owners of the parent (228.9) 43.5Non-controlling interests (3.0) 2.1
(231.9) 45.6
Total comprehensive (expense) income attributable to owners of the parent arises from the Group’s continuing operations.
138Hunting PLC Annual Report and Accounts 2020

Consolidated Balance SheetAt 31 December 2020
Notes2020
$m2019
$m
ASSETSNon-current assetsProperty, plant and equipment 12 307.1 354.7 Right-of-use assets 13 29.8 36.7 Goodwill 14 164.2 230.2 Other intangible assets 15 42.9 78.5 Investments 17 19.8 2.3 Trade and other receivables 18 2.0 2.7 Deferred tax assets 19 15.3 29.9
581.1 735.0
Current assetsInventories 20 288.4 350.8 Trade and other receivables 18 136.3 202.0 Cash and cash equivalents 21 102.9 128.6Current tax assets 3.0 0.2Held-for-sale assets 1.8 –Investments 17 – 0.5
532.4 682.1
LIABILITIESCurrent liabilitiesTrade and other payables 22 67.9 121.2 Lease liabilities 24 10.2 9.8 Borrowings 25 1.2 1.6 Provisions 27 2.9 3.2Current tax liabilities 2.5 9.5
84.7 145.3Net current assets 447.7 536.8
Non-current liabilitiesTrade and other payables 22 2.4 2.7 Lease liabilities 24 30.1 35.4 Borrowings 25 3.9 3.9 Provisions 27 6.0 5.2 Deferred tax liabilities 19 9.8 0.8
52.2 48.0Net assets 976.6 1,223.8
Equity attributable to owners of the parentShare capital 33 66.5 67.3Share premium 33 153.0 153.0Other components of equity 34 52.3 56.5Retained earnings 35 692.6 931.1
964.4 1,207.9Non-controlling interests 12.2 15.9Total equity 976.6 1,223.8
The notes on pages 142 to 190 are an integral part of these consolidated financial statements. The financial statements on pages 137 to 190 were approved by the Board of Directors on 4 March 2021 and were signed on its behalf by:
Jim Johnson Bruce FergusonDirector Director Registered number: 0974568
139Hunting PLC Annual Report and Accounts 2020
Purpose and C
ultureB
usiness Model and S
takeholdersB
usiness Strategy
Perform
anceG
overnanceFin
ancial Statem
ents
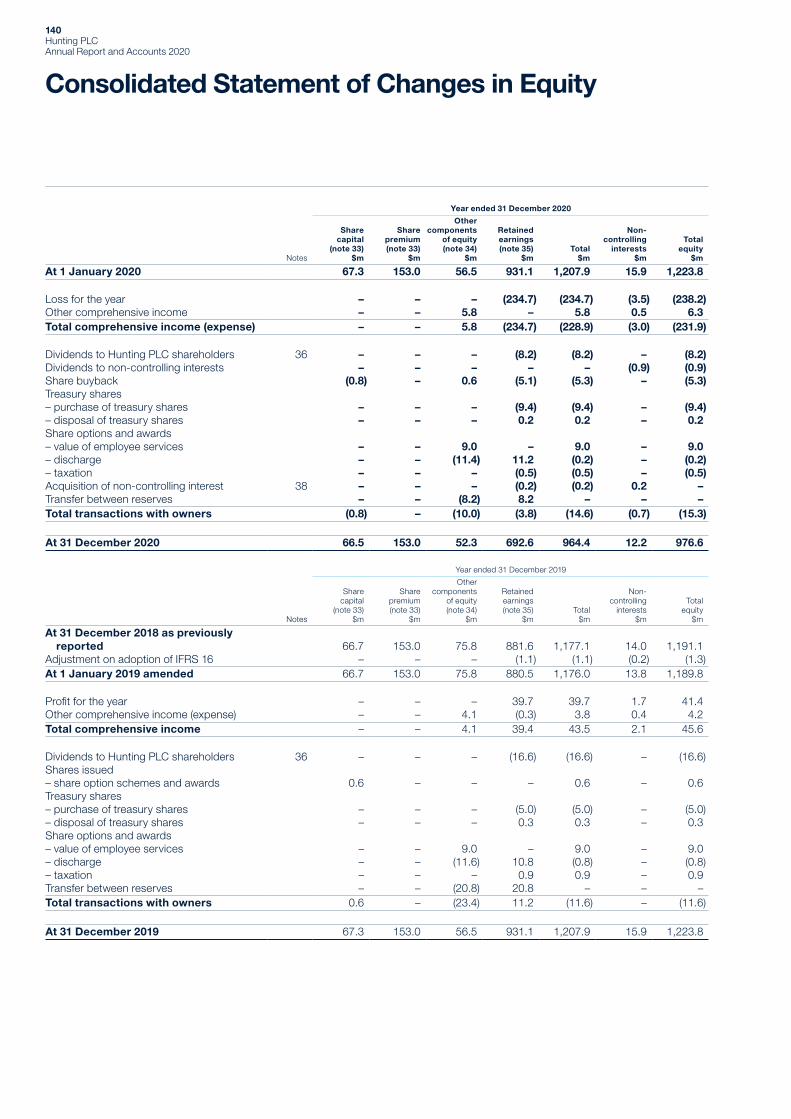
Consolidated Statement of Changes in Equity
Notes
Year ended 31 December 2020
Sharecapital
(note 33)$m
Sharepremium(note 33)
$m
Other components
of equity(note 34)
$m
Retained earnings(note 35)
$mTotal
$m
Non-controlling
interests$m
Totalequity
$m
At 1 January 2020 67.3 153.0 56.5 931.1 1,207.9 15.9 1,223.8
Loss for the year – – – (234.7) (234.7) (3.5) (238.2)Other comprehensive income – – 5.8 – 5.8 0.5 6.3Total comprehensive income (expense) – – 5.8 (234.7) (228.9) (3.0) (231.9)
Dividends to Hunting PLC shareholders 36 – – – (8.2) (8.2) – (8.2)Dividends to non-controlling interests – – – – – (0.9) (0.9)Share buyback (0.8) – 0.6 (5.1) (5.3) – (5.3)Treasury shares– purchase of treasury shares – – – (9.4) (9.4) – (9.4)– disposal of treasury shares – – – 0.2 0.2 – 0.2Share options and awards– value of employee services – – 9.0 – 9.0 – 9.0– discharge – – (11.4) 11.2 (0.2) – (0.2)– taxation – – – (0.5) (0.5) – (0.5)Acquisition of non-controlling interest 38 – – – (0.2) (0.2) 0.2 –Transfer between reserves – – (8.2) 8.2 – – –Total transactions with owners (0.8) – (10.0) (3.8) (14.6) (0.7) (15.3)
At 31 December 2020 66.5 153.0 52.3 692.6 964.4 12.2 976.6
Notes
Year ended 31 December 2019
Sharecapital
(note 33)$m
Sharepremium(note 33)
$m
Other components
of equity(note 34)
$m
Retained earnings(note 35)
$mTotal
$m
Non-controlling
interests$m
Totalequity
$m
At 31 December 2018 as previously reported 66.7 153.0 75.8 881.6 1,177.1 14.0 1,191.1Adjustment on adoption of IFRS 16 – – – (1.1) (1.1) (0.2) (1.3)At 1 January 2019 amended 66.7 153.0 75.8 880.5 1,176.0 13.8 1,189.8
Profit for the year – – – 39.7 39.7 1.7 41.4Other comprehensive income (expense) – – 4.1 (0.3) 3.8 0.4 4.2Total comprehensive income – – 4.1 39.4 43.5 2.1 45.6
Dividends to Hunting PLC shareholders 36 – – – (16.6) (16.6) – (16.6)Shares issued– share option schemes and awards 0.6 – – – 0.6 – 0.6Treasury shares– purchase of treasury shares – – – (5.0) (5.0) – (5.0)– disposal of treasury shares – – – 0.3 0.3 – 0.3Share options and awards– value of employee services – – 9.0 – 9.0 – 9.0– discharge – – (11.6) 10.8 (0.8) – (0.8)– taxation – – – 0.9 0.9 – 0.9Transfer between reserves – – (20.8) 20.8 – – –Total transactions with owners 0.6 – (23.4) 11.2 (11.6) – (11.6)
At 31 December 2019 67.3 153.0 56.5 931.1 1,207.9 15.9 1,223.8
140Hunting PLC Annual Report and Accounts 2020
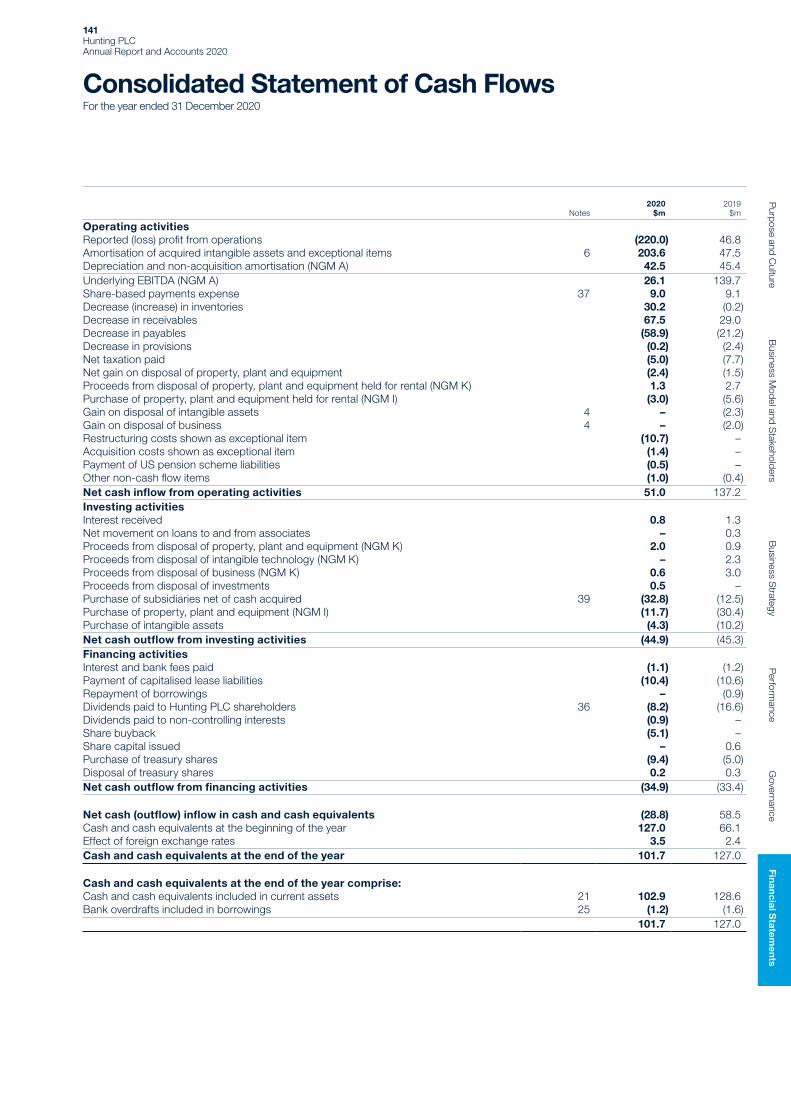
Consolidated Statement of Cash FlowsFor the year ended 31 December 2020
Notes2020
$m2019
$m
Operating activitiesReported (loss) profit from operations (220.0) 46.8Amortisation of acquired intangible assets and exceptional items 6 203.6 47.5Depreciation and non-acquisition amortisation (NGM A) 42.5 45.4Underlying EBITDA (NGM A) 26.1 139.7Share-based payments expense 37 9.0 9.1Decrease (increase) in inventories 30.2 (0.2)Decrease in receivables 67.5 29.0Decrease in payables (58.9) (21.2)Decrease in provisions (0.2) (2.4)Net taxation paid (5.0) (7.7)Net gain on disposal of property, plant and equipment (2.4) (1.5)Proceeds from disposal of property, plant and equipment held for rental (NGM K) 1.3 2.7Purchase of property, plant and equipment held for rental (NGM I) (3.0) (5.6)Gain on disposal of intangible assets 4 – (2.3)Gain on disposal of business 4 – (2.0)Restructuring costs shown as exceptional item (10.7) –Acquisition costs shown as exceptional item (1.4) –Payment of US pension scheme liabilities (0.5) –Other non-cash flow items (1.0) (0.4)Net cash inflow from operating activities 51.0 137.2Investing activitiesInterest received 0.8 1.3Net movement on loans to and from associates – 0.3Proceeds from disposal of property, plant and equipment (NGM K) 2.0 0.9Proceeds from disposal of intangible technology (NGM K) – 2.3Proceeds from disposal of business (NGM K) 0.6 3.0Proceeds from disposal of investments 0.5 –Purchase of subsidiaries net of cash acquired 39 (32.8) (12.5)Purchase of property, plant and equipment (NGM I) (11.7) (30.4)Purchase of intangible assets (4.3) (10.2)Net cash outflow from investing activities (44.9) (45.3)Financing activitiesInterest and bank fees paid (1.1) (1.2)Payment of capitalised lease liabilities (10.4) (10.6)Repayment of borrowings – (0.9)Dividends paid to Hunting PLC shareholders 36 (8.2) (16.6)Dividends paid to non-controlling interests (0.9) –Share buyback (5.1) –Share capital issued – 0.6Purchase of treasury shares (9.4) (5.0)Disposal of treasury shares 0.2 0.3Net cash outflow from financing activities (34.9) (33.4)
Net cash (outflow) inflow in cash and cash equivalents (28.8) 58.5Cash and cash equivalents at the beginning of the year 127.0 66.1Effect of foreign exchange rates 3.5 2.4Cash and cash equivalents at the end of the year 101.7 127.0
Cash and cash equivalents at the end of the year comprise:Cash and cash equivalents included in current assets 21 102.9 128.6Bank overdrafts included in borrowings 25 (1.2) (1.6)
101.7 127.0
141Hunting PLC Annual Report and Accounts 2020
Purpose and C
ultureB
usiness Model and S
takeholdersB
usiness Strategy
Perform
anceG
overnanceFin
ancial Statem
ents

Notes to the Consolidated Financial Statements
1. Basis of Preparation
Hunting PLC is a premium-listed public company limited by shares, with its Ordinary shares quoted on the London Stock Exchange. Hunting PLC was incorporated in the United Kingdom under the Companies Act and is registered in England and Wales. The address of the Company’s registered office is shown on page 209. The principal activities of the Group and the nature of the Group’s operations are set out in note 2 and in the Strategic Report on pages 4 to 79. The financial statements consolidate those of Hunting PLC (the “Company”) and its subsidiaries (together referred to as the “Group”), include the Group’s interests in associates and are presented in US dollars, the currency of the primary economic environment in which the Group operates.
The consolidated financial statements have been prepared in accordance with the Companies Act 2006 as applicable to companies using IFRS and those International Financial Reporting Standards (“IFRS”) and interpretations issued by the IFRS Interpretations Committee (“IFRS IC”) as adopted by the European Union. The financial statements have been prepared on a going concern basis under the historical cost convention as modified by the revaluation of the US deferred compensation plan and those financial assets and financial liabilities held at fair value. The Board’s consideration of the applicability of the going concern basis is detailed further in the Strategic Report on page 79.
The principal accounting policies applied in the preparation of these financial statements are set out in note 41. These policies have been consistently applied to all the years presented.
Change in Functional Currency of a SubsidiaryHaving considered the aggregate effect of all relevant factors, the functional currency of Hunting Energy Services (UK) Limited changed from Sterling to US dollars on 1 January 2020. The change in functional currency follows a review of the main indicators of functional currency for the company and the balance of these led to the change from Sterling to US dollars.
Critical Judgements and Key Estimates Critical judgements are those that the Directors have made in the process of applying the Group’s accounting policies and that have the most significant effect on the amounts recognised in the Group’s financial statements. Key assumptions are assumptions concerning future expectations, together with other key sources of estimation uncertainty at the end of the reporting period, that may have a significant risk of causing a material adjustment to the carrying amounts of assets and liabilities within the next financial year. Judgements were made regarding the recognition of impairment of non-financial assets that impacted the carrying values of: goodwill; other intangible assets; property, plant and equipment; right-of-use assets and inventory (see note 16) and estimates were made regarding future cash flows for the purposes of CGU impairment testing (see note 16). The Directors also applied their judgement in determining that there are no disclosable material uncertainties in relation to the Group’s ability to continue as a going concern as described in the Strategic Report on page 79.
The Group is subject to income taxes in numerous jurisdictions and significant judgement is required in determining the worldwide provision for those taxes, as tax legislation can be complex and open to different interpretation. Deferred tax assets are only recognised to the extent that it is probable that future taxable profits will be available against which the temporary differences can be utilised. This is considered by jurisdiction, or by entity, dependent on the tax laws of the jurisdiction. At each balance sheet date, the Directors will consider the medium-term forecasts of the business and determine whether the generation of taxable income within a reasonable time frame is probable. If actual results differ from the forecasts then the impact of not being able to utilise the expected amount of deferred tax assets can have a material impact on the Group’s tax charge for the year. The key decision regarding the recognition of deferred tax as at 31 December 2020 related to the recognition of deferred taxes in the US. The Directors concluded that the medium-term taxable profit forecasts for the US no longer support the full recognition of the US deferred tax asset position going forward. To the extent that the US deferred tax asset is not offset against the deferred tax liability recognised relating to goodwill in the US, it has been removed from the consolidated balance sheet and charged to the consolidated income statement in the year.
The Directors have considered the potential impact that climate change could have on the financial statements of the Group. The Directors’ view is that climate change is an emerging risk that the Group is cognisant of, and will react appropriately to. External long-term forecasts used by the Directors, that recognise and incorporate climate change developments, support the view that there will be robust demand for the Group’s oil and gas based products for a significant time span and these do not currently identify any concerns regarding the carrying values or expected lives of longer-lived assets, including goodwill. The Directors also believe there is significant operational adaptability in the Group’s asset base to move into other non–hydrocarbon product lines if required.
The Directors believe that there are no other critical judgements or estimates applied in the preparation of the consolidated financial statements.
Adoption of New Standards, Amendments and InterpretationsA number of amendments to IFRS became effective for the financial year beginning on 1 January 2020, however the Group did not have to change its accounting policies or make retrospective adjustments as a result of adopting these amendments:
• Amendment to IFRS 3 Business Combinationsi
• Interest Rate Benchmark Reform – Phase 1 (Amendments to IFRS 9, IAS 39 and IFRS 7) • Amendment to IAS 1 and IAS 8: Definition of Material
142Hunting PLC Annual Report and Accounts 2020

1. Basis of Preparation continued
Adoption of New Standards, Amendments and Interpretations continued The following standards, amendments and interpretations are effective subsequent to the year-end, which have not been early adopted, and are being assessed to determine whether there is a significant impact on the Group’s results or financial position:
• Interest Rate Benchmark Reform – Phase 2 (Amendments to IFRS 9, IAS 39 and IFRS 7)ii
• Amendment to IFRS 3 Business Combinations – Reference to the Conceptual Frameworki/iii
• Amendments to IAS 16 – Property, Plant and Equipment: Proceeds before Intended Usei/iii
• Amendment to IAS 37 – Onerous Contracts: Cost of Fulfilling a Contracti/iii
• Annual Improvements to IFRS Standards 2018-2020 Cyclei/iii
• IFRS 17 Insurance Contractsi/iv
• Amendment to IAS 1: Classification of Current and Non-current Liabilitiesi/iv
i. Not yet endorsed by the European Union.ii. Mandatory adoption date and effective date for the Company is 1 January 2021.iii. Mandatory adoption date and effective date for the Company is 1 January 2022.iv. Mandatory adoption date and effective date for the Company is 1 January 2023.
Interest Rate Benchmark Reform The impact of the reform and replacement of benchmark interest rates such as GBP LIBOR and other interbank offered rates (“IBORs”) is being assessed and is ongoing. A preliminary assessment indicates that none of the Group’s hedge accounting will be impacted by the reform regarding LIBOR, as none of the Group’s hedging relationships have any exposure to interest rate benchmarks that are subject to the proposed regulatory reform. However, the Group’s RCF and other bilateral funding arrangements will be impacted by the move away from LIBOR, as LIBOR is currently used as the benchmark for the interest rate applied. The Group’s cash at bank of $102.9m and overdrafts of $1.2m at the year-end have variable interest rates that are referenced to Central Bank base rates and these will not be affected by the IBOR reforms. The RCF commitment fee is calculated as a percentage of the prevailing credit margin that is then applied to the undrawn amount of the facility. The commitment fee is not linked to LIBOR and will be unaffected by the proposed regulatory reform.
There is currently uncertainty around the timing and precise nature of these changes. To transition existing contracts and agreements that reference LIBOR to SONIA (in respect of GBP denominated contracts) or SOFR (in respect of USD denominated contracts), adjustments for term differences and credit differences might need to be applied to SONIA and/or SOFR, to enable the benchmark rates to be economically equivalent on transition. The Group’s treasury department is responsible for managing the Group’s LIBOR transition plan.
2. Segmental Reporting
For the year ended 31 December 2020, the Group has been reporting on five operating segments in its internal management reports, which are used to make strategic decisions by the Hunting PLC Board, the Group’s Chief Operating Decision Maker (“CODM”).
The Group’s operating segments are strategic business units that offer different products and services primarily to international oil and gas companies and who undertake exploration and production activities. The Board assesses the performance of the operating segments based on revenue and underlying operating results. Underlying operating result is a profit-based measure and excludes the effects of amortisation of acquired intangible assets and exceptional items (see note 6). The Directors believe that using the underlying operating result provides a more consistent and comparable measure of the operating segment’s performance.
Interest income and expenditure are not allocated to segments, as this type of activity is overseen by the Group’s central treasury function, which manages the funding position of the Group.
Inter-segment sales are priced in line with the Group’s transfer pricing policy on an arm’s-length basis. Costs and overheads are apportioned to the operating segments on the basis of time attributed to those operations by senior executives.
Further, the Board is also provided revenue information by product group, in order to help with an understanding of the drivers of Group performance trends.
Hunting Titan: Hunting Titan manufactures and distributes a broad range of well completion products and accessories. The segment’s products include both integrated and conventional gun systems and hardware, a complete portfolio of shaped charges and other energetics products, addressable and analogue switch technology and electronic instrumentation for certain measurements required in the oil and gas industry. Key products include H-1™ gun systems, ControlFire™ switches, EQUAfrac™ shaped charges, the T-Set™ line of setting tools and the PowerSet family of power charges. The business has manufacturing facilities in the US and Mexico, and is supported by strategically-located distribution centres across North America.
US: The US businesses supply premium connections, oil country tubular goods (“OCTG”), drilling tools, subsea equipment, intervention tools, electronics and complex deep hole drilling and precision machining services for the US and overseas markets. The segment also manufactures perforating system products for Hunting Titan. Although located in the UK, Enpro has been classified as part of this segment, as it falls under the management of the Subsea business in the US, as it participates in global offshore projects. The segment also includes the Group’s legacy exploration and production activities in the Southern US and offshore Gulf of Mexico.
143Hunting PLC Annual Report and Accounts 2020
Purpose and C
ultureB
usiness Model and S
takeholdersB
usiness Strategy
Perform
anceG
overnanceFin
ancial Statem
ents
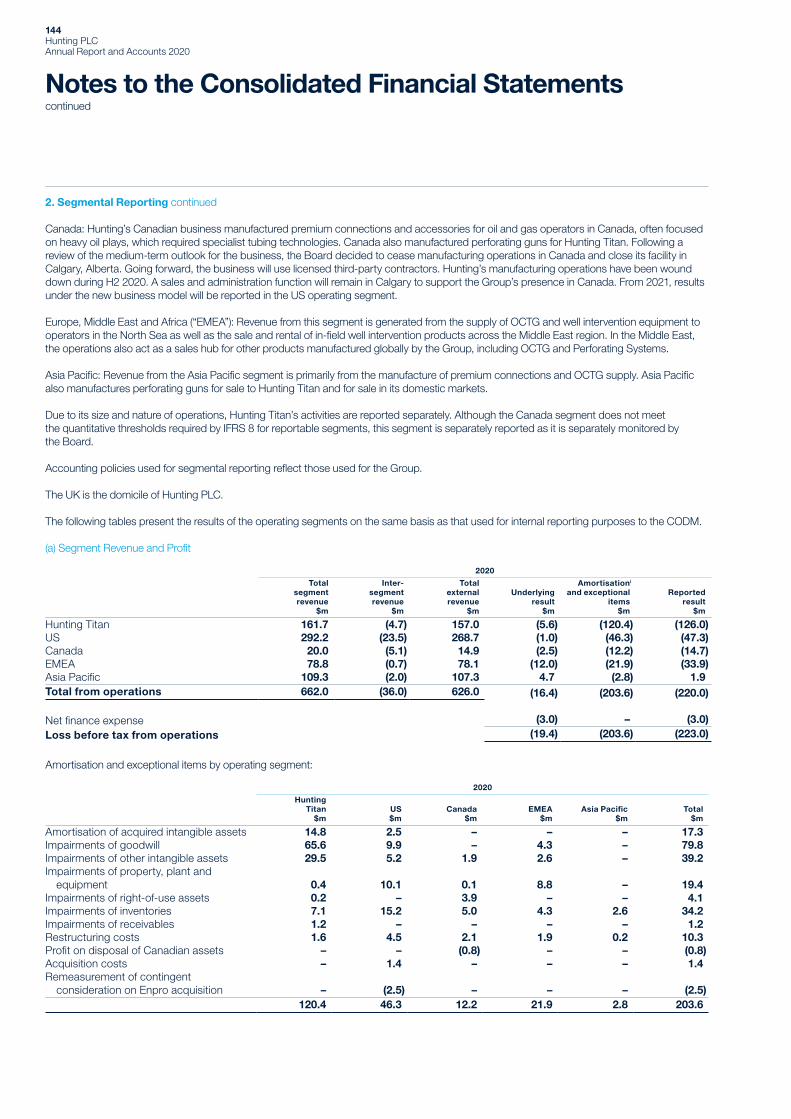
2. Segmental Reporting continued
Canada: Hunting’s Canadian business manufactured premium connections and accessories for oil and gas operators in Canada, often focused on heavy oil plays, which required specialist tubing technologies. Canada also manufactured perforating guns for Hunting Titan. Following a review of the medium-term outlook for the business, the Board decided to cease manufacturing operations in Canada and close its facility in Calgary, Alberta. Going forward, the business will use licensed third-party contractors. Hunting’s manufacturing operations have been wound down during H2 2020. A sales and administration function will remain in Calgary to support the Group’s presence in Canada. From 2021, results under the new business model will be reported in the US operating segment.
Europe, Middle East and Africa (“EMEA”): Revenue from this segment is generated from the supply of OCTG and well intervention equipment to operators in the North Sea as well as the sale and rental of in-field well intervention products across the Middle East region. In the Middle East, the operations also act as a sales hub for other products manufactured globally by the Group, including OCTG and Perforating Systems.
Asia Pacific: Revenue from the Asia Pacific segment is primarily from the manufacture of premium connections and OCTG supply. Asia Pacific also manufactures perforating guns for sale to Hunting Titan and for sale in its domestic markets.
Due to its size and nature of operations, Hunting Titan’s activities are reported separately. Although the Canada segment does not meet the quantitative thresholds required by IFRS 8 for reportable segments, this segment is separately reported as it is separately monitored by the Board.
Accounting policies used for segmental reporting reflect those used for the Group.
The UK is the domicile of Hunting PLC.
The following tables present the results of the operating segments on the same basis as that used for internal reporting purposes to the CODM.
(a) Segment Revenue and Profit
2020
Total segment revenue
$m
Inter-segment revenue
$m
Total external revenue
$m
Underlying result
$m
Amortisationi
and exceptional items
$m
Reportedresult
$m
Hunting Titan 161.7 (4.7) 157.0 (5.6) (120.4) (126.0)US 292.2 (23.5) 268.7 (1.0) (46.3) (47.3)Canada 20.0 (5.1) 14.9 (2.5) (12.2) (14.7)EMEA 78.8 (0.7) 78.1 (12.0) (21.9) (33.9)Asia Pacific 109.3 (2.0) 107.3 4.7 (2.8) 1.9 Total from operations 662.0 (36.0) 626.0 (16.4) (203.6) (220.0)
Net finance expense (3.0) – (3.0)Loss before tax from operations (19.4) (203.6) (223.0)
Amortisation and exceptional items by operating segment:
2020
Hunting Titan
$mUS$m
Canada$m
EMEA$m
Asia Pacific$m
Total$m
Amortisation of acquired intangible assets 14.8 2.5 – – – 17.3Impairments of goodwill 65.6 9.9 – 4.3 – 79.8Impairments of other intangible assets 29.5 5.2 1.9 2.6 – 39.2Impairments of property, plant and equipment 0.4 10.1 0.1 8.8 – 19.4Impairments of right-of-use assets 0.2 – 3.9 – – 4.1Impairments of inventories 7.1 15.2 5.0 4.3 2.6 34.2Impairments of receivables 1.2 – – – – 1.2Restructuring costs 1.6 4.5 2.1 1.9 0.2 10.3Profit on disposal of Canadian assets – – (0.8) – – (0.8)Acquisition costs – 1.4 – – – 1.4Remeasurement of contingent consideration on Enpro acquisition – (2.5) – – – (2.5)
120.4 46.3 12.2 21.9 2.8 203.6
Notes to the Consolidated Financial Statementscontinued
144Hunting PLC Annual Report and Accounts 2020

2. Segmental Reporting continued
(a) Segment Revenue and Profit continued
2019
Total segment revenue
$m
Inter-segment revenue
$m
Total external revenue
$m
Underlying result
$m
Amortisationi
and exceptional items
$m
Reportedresult
$m
Hunting Titan 375.5 (4.3) 371.2 68.6 (26.5) 42.1 US 363.2 (44.5) 318.7 26.9 (21.0) 5.9 Canada 35.7 (8.6) 27.1 (4.3) – (4.3)EMEA 123.0 (7.2) 115.8 (1.3) – (1.3)Asia Pacific 146.3 (19.1) 127.2 4.4 – 4.4 Total from operations 1,043.7 (83.7) 960.0 94.3 (47.5) 46.8
Net finance expense (1.2) – (1.2)Profit (loss) before tax from operations 93.1 (47.5) 45.6
i. Relates to amortisation of acquired intangible assets.
Amortisation of acquired intangible assets of $26.5m arose in the Hunting Titan segment and $2.0m arose in the US operating segment in 2019. The impairment of property, plant and equipment in 2019 of $19.0m arose in the US operating segment.
Revenue from external customers attributable to the UK, the Group’s country of domicile, is $51.0m (2019 – $64.7m).
A breakdown of external revenue by products and services is presented below:
2020$m
Restatedi
2019$m
Perforating Systems 154.5 363.0 OCTG 264.7 357.0 Advanced Manufacturing 74.3 104.5Intervention Toolsi 30.7 44.3 Subsea 69.8 44.5Drilling Tools 9.9 22.3 Otheri 22.1 24.4Total 626.0 960.0
Revenue from products is further analysed between: Oil and gas 586.2 918.7 Non-oil and gas 39.8 41.3Total 626.0 960.0
i. The 2019 numbers have been restated to show $7.4m in relation to well testing products in Other rather than Intervention Tools as this better represents the product groupings.
(b) Other Segment Items
2020 2019
Depreciationi
$mAmortisation
$mImpairmentii
$mDepreciationi
$mAmortisation
$mImpairmentii
$m
Hunting Titan 7.9 16.0 104.4 7.7 27.3 1.4 US 21.7 4.3 42.2 22.8 4.1 21.5 Canada 1.2 0.1 11.0 1.7 0.1 1.0 EMEA 4.9 0.3 20.5 5.0 0.7 1.0 Asia Pacific 3.9 0.1 2.0 4.4 0.1 1.1 Total 39.6 20.8 180.1 41.6 32.3 26.0
i. Depreciation in 2020 comprises depreciation of property, plant and equipment $32.1m (2019 – $33.7m) and depreciation of right-of-use assets $7.5m (2019 – $7.9m).ii. Impairment comprises impairment of goodwill $79.8m (2019 – $nil), other intangible assets $39.2m (2019 – $nil), property, plant and equipment $19.4m (2019 – $19.0m), right-of-use
assets $3.5m net (2019 – $nil), trade and other receivables $1.8m net (2019 – $1.1m) and inventories $36.4m net (2019 – $5.9m).
145Hunting PLC Annual Report and Accounts 2020
Purpose and C
ultureB
usiness Model and S
takeholdersB
usiness Strategy
Perform
anceG
overnanceFin
ancial Statem
ents

Notes to the Consolidated Financial Statementscontinued
2. Segmental Reporting continued
(c) Geographical Non-current AssetsInformation on the physical location of non-current assets is presented below. The allocated non-current assets below exclude deferred tax assets.
2020$m
2019$m
Hunting Titan – US 186.3 298.9 Hunting Titan – Canada 2.2 2.5 Hunting Titan – Other 0.9 0.8 Hunting Titan 189.4 302.2 US – US 309.0 314.9 US – Europei 11.3 –US 320.3 314.9Canada 3.3 12.2 Europei 40.1 61.1 Middle East 2.4 2.3 Asia Pacific 10.3 12.4Unallocated assets:Deferred tax assets 15.3 29.9Total non-current assets 581.1 735.0
i. The value of non-current assets located in the UK, the Group’s country of domicile, is $42.1m (2019 – $45.7m).
(d) Major CustomerThe Group received revenue of $64.1m (2019 – $112.6m) from the Halliburton Company Group, which is 10% (2019 – 12%) of the Group’s revenue from external customers. All of Hunting’s operating segments have benefited from trading with Halliburton.
3. Revenue
In the following tables, a breakdown of the Group’s different revenue streams by segment has been given, including the disaggregation of revenue from contracts with customers.
2020
Revenuefrom
contracts with
customers$m
Rental revenue
$m
Otherrevenue
$m
Total external revenue
$m
Hunting Titan 157.0 – – 157.0 US 255.7 11.1 1.9 268.7 Canada 14.9 – – 14.9 EMEA 75.0 3.1 – 78.1 Asia Pacific 107.3 – – 107.3 Total 609.9 14.2 1.9 626.0
2019
Revenuefrom
contracts with
customers$m
Rental revenue
$m
Otherrevenue
$m
Total external revenue
$m
Hunting Titan 371.2 – – 371.2 US 292.0 24.6 2.1 318.7 Canada 27.0 0.1 – 27.1 EMEA 109.1 6.7 – 115.8 Asia Pacific 127.2 – – 127.2 Total 926.5 31.4 2.1 960.0
There is no material difference in the timing of revenue recognition between contracts with customers at a point in time and contracts with customers over time, as the majority of Hunting’s performance obligations are relatively short. Revenue is typically recognised for products when the product is shipped or made available to customers for collection and for services either on completion of the service or, at a minimum, monthly for services covering more than one month. The amount of consideration is not adjusted for the effects of a significant financing component as, at contract inception, the period between when the entity transfers a promised good or service to a customer and when the customer pays for that good or service will be one year or less.
146Hunting PLC Annual Report and Accounts 2020

4. Other Operating Income2020
$m2019
$m
Operating lease rental income 1.8 1.4 Gain on disposal of property, plant and equipment 2.8 2.0 Gain on disposal of intangible technology – 2.3Gain on disposal of businesses – 2.0 Government grants 3.8 –Foreign exchange gains 1.4 0.5 Other incomei 0.5 2.6 Other operating income before amortisationii and exceptional items 10.3 10.8 Other operating income included in amortisation and exceptional items (note 6) 0.8 –
11.1 10.8
i. Includes fair value gains on derivatives not designated in a hedge of $0.1m (2019 – $0.6m).ii. Relates to amortisation of acquired intangible assets.
In 2019, the Clear-Run™ intangible technology was sold for $2.3m, with a gain on disposal of $2.3m. Consideration from the sale of the Thru-Tubing business in Dubai was $2.4m, with a gain on disposal of $1.7m, which has been recognised in the gain on disposal of businesses of $2.0m.
Government FundingHunting PLC has benefited from a number of government schemes to support companies as a result of the COVID-19 pandemic. These schemes include the COVID-19 Job Support Scheme and property tax rebate in Singapore, the Coronavirus Job Retention Scheme (“CJRS”) in the UK, and the Canada Emergency Wage Subsidy in Canada. The Group received $3.6m relating to COVID-19 support during the year. Other types of government assistance were also received during the year, including a Scottish Enterprise grant of $0.1m for Enpro. There are no repayment conditions attached to any government grants or assistance.
5. Operating Expenses2020
$m2019
$m
Administration expensesi before amortisationii and exceptional items 107.4 121.3 Distribution and selling costs 43.7 61.1 Loss on disposal of property, plant and equipment 0.4 0.5 Operating expenses before amortisationii and exceptional items 151.5 182.9 Operating expenses included in amortisation and exceptional items (note 6) 147.7 28.5
299.2 211.4
i. Includes foreign exchange losses of $0.8m (2019 – $2.7m) and a fair value loss on derivatives not designated in a hedge of $0.1m (2019 – $0.2m).ii. Relates to amortisation of acquired intangible assets.
147Hunting PLC Annual Report and Accounts 2020
Purpose and C
ultureB
usiness Model and S
takeholdersB
usiness Strategy
Perform
anceG
overnanceFin
ancial Statem
ents

Notes to the Consolidated Financial Statementscontinued
6. Amortisation and Exceptional Items
Due to their size and nature, the following items have been disclosed as “middle column” items in the financial statements.
2020$m
2019$m
Impairments of property, plant and equipment 14.8 19.0 Impairments of inventories 34.2 – Restructuring costs 7.7 –Charged to cost of sales 56.7 19.0Profit on disposal of Canadian assets – credited to other income (0.8) – Amortisation of acquired intangible assets 17.3 28.5 Impairments of goodwill 79.8 – Impairments of other intangible assets 39.2 – Impairments of property, plant and equipment 4.6 – Impairments of right-of-use assets 4.1 – Impairments of receivables 1.2 – Acquisition costs 1.4 – Remeasurement of contingent consideration on Enpro acquisition (2.5) – Restructuring costs 2.6 –Charged to operating expenses 147.7 28.5Total amortisation and exceptional items charged to (loss) profit from operations 203.6 47.5Taxation on amortisation and exceptional items (note 10) 16.1 (12.8)
219.7 34.7
Following a carrying value review, given current trading conditions and future expectations, impairments of goodwill, property, plant and equipment, right-of-use assets, other intangible assets, inventories and receivables were recognised during the year. Further details are provided in note 16 for non-financial assets and note 18 for receivables.
Acquisition-related costs of $1.4m were charged to operating expenses and paid in the year. These costs arose on the acquisition of Enpro.
The contingent consideration recognised on the acquisition of Enpro has a fair value of $nil at 31 December 2020 and so the amount recognised at the date of the acquisition (see note 39) has been reversed.
Management continues to implement cost-base reduction measures at all levels across the Group, resulting in restructuring costs of $10.3m being incurred, with $10.7m paid during the year. Restructuring costs have benefited from the release of unused restructuring provisions recognised in prior years.
148Hunting PLC Annual Report and Accounts 2020
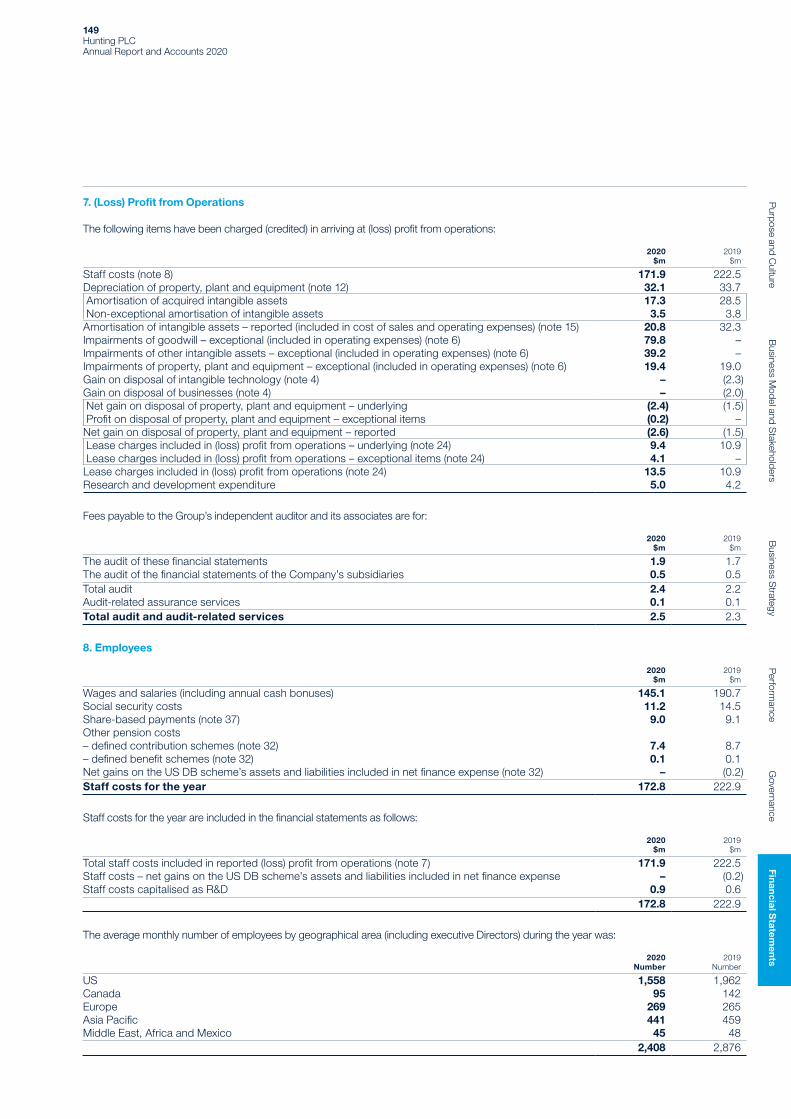
7. (Loss) Profit from Operations
The following items have been charged (credited) in arriving at (loss) profit from operations:
2020$m
2019$m
Staff costs (note 8) 171.9 222.5Depreciation of property, plant and equipment (note 12) 32.1 33.7 Amortisation of acquired intangible assets 17.3 28.5 Non-exceptional amortisation of intangible assets 3.5 3.8Amortisation of intangible assets – reported (included in cost of sales and operating expenses) (note 15) 20.8 32.3Impairments of goodwill – exceptional (included in operating expenses) (note 6) 79.8 –Impairments of other intangible assets – exceptional (included in operating expenses) (note 6) 39.2 –Impairments of property, plant and equipment – exceptional (included in operating expenses) (note 6) 19.4 19.0Gain on disposal of intangible technology (note 4) – (2.3)Gain on disposal of businesses (note 4) – (2.0) Net gain on disposal of property, plant and equipment – underlying (2.4) (1.5) Profit on disposal of property, plant and equipment – exceptional items (0.2) –Net gain on disposal of property, plant and equipment – reported (2.6) (1.5) Lease charges included in (loss) profit from operations – underlying (note 24) 9.4 10.9 Lease charges included in (loss) profit from operations – exceptional items (note 24) 4.1 –Lease charges included in (loss) profit from operations (note 24) 13.5 10.9Research and development expenditure 5.0 4.2
Fees payable to the Group’s independent auditor and its associates are for:
2020$m
2019$m
The audit of these financial statements 1.9 1.7The audit of the financial statements of the Company’s subsidiaries 0.5 0.5Total audit 2.4 2.2Audit-related assurance services 0.1 0.1Total audit and audit-related services 2.5 2.3
8. Employees
2020$m
2019$m
Wages and salaries (including annual cash bonuses) 145.1 190.7Social security costs 11.2 14.5Share-based payments (note 37) 9.0 9.1Other pension costs– defined contribution schemes (note 32) 7.4 8.7– defined benefit schemes (note 32) 0.1 0.1Net gains on the US DB scheme’s assets and liabilities included in net finance expense (note 32) – (0.2)Staff costs for the year 172.8 222.9
Staff costs for the year are included in the financial statements as follows:
2020$m
2019$m
Total staff costs included in reported (loss) profit from operations (note 7) 171.9 222.5Staff costs – net gains on the US DB scheme’s assets and liabilities included in net finance expense – (0.2)Staff costs capitalised as R&D 0.9 0.6
172.8 222.9
The average monthly number of employees by geographical area (including executive Directors) during the year was:
2020Number
2019Number
US 1,558 1,962Canada 95 142Europe 269 265Asia Pacific 441 459Middle East, Africa and Mexico 45 48 2,408 2,876
149Hunting PLC Annual Report and Accounts 2020
Purpose and C
ultureB
usiness Model and S
takeholdersB
usiness Strategy
Perform
anceG
overnanceFin
ancial Statem
ents
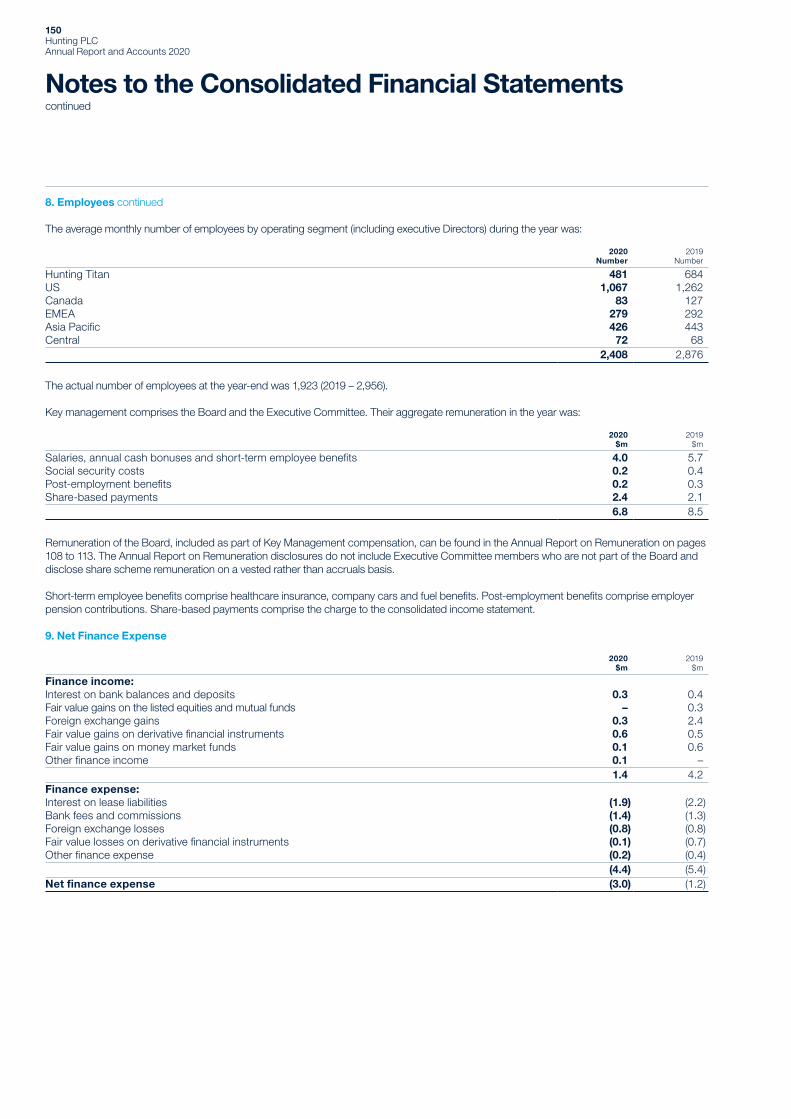
8. Employees continued
The average monthly number of employees by operating segment (including executive Directors) during the year was:
2020Number
2019Number
Hunting Titan 481 684US 1,067 1,262Canada 83 127EMEA 279 292Asia Pacific 426 443Central 72 68 2,408 2,876
The actual number of employees at the year-end was 1,923 (2019 – 2,956).
Key management comprises the Board and the Executive Committee. Their aggregate remuneration in the year was:
2020$m
2019$m
Salaries, annual cash bonuses and short-term employee benefits 4.0 5.7Social security costs 0.2 0.4Post-employment benefits 0.2 0.3Share-based payments 2.4 2.1
6.8 8.5
Remuneration of the Board, included as part of Key Management compensation, can be found in the Annual Report on Remuneration on pages 108 to 113. The Annual Report on Remuneration disclosures do not include Executive Committee members who are not part of the Board and disclose share scheme remuneration on a vested rather than accruals basis.
Short-term employee benefits comprise healthcare insurance, company cars and fuel benefits. Post-employment benefits comprise employer pension contributions. Share-based payments comprise the charge to the consolidated income statement.
9. Net Finance Expense
2020$m
2019$m
Finance income:Interest on bank balances and deposits 0.3 0.4Fair value gains on the listed equities and mutual funds – 0.3Foreign exchange gains 0.3 2.4Fair value gains on derivative financial instruments 0.6 0.5Fair value gains on money market funds 0.1 0.6Other finance income 0.1 – 1.4 4.2Finance expense:Interest on lease liabilities (1.9) (2.2)Bank fees and commissions (1.4) (1.3)Foreign exchange losses (0.8) (0.8)Fair value losses on derivative financial instruments (0.1) (0.7)Other finance expense (0.2) (0.4)
(4.4) (5.4)Net finance expense (3.0) (1.2)
Notes to the Consolidated Financial Statementscontinued
150Hunting PLC Annual Report and Accounts 2020

10. Taxation
2020 2019
Before amortisationi
and exceptional items
$m
Amortisationi and exceptional
items$m
Total$m
Before amortisationi
and exceptional items
$m
Amortisationi and exceptional
items$m
Total$m
Current tax – current year charge 5.2 (2.0) 3.2 10.2 – 10.2 – adjustments in respect of prior years (3.0) – (3.0) (3.5) – (3.5)
2.2 (2.0) 0.2 6.7 – 6.7 Deferred tax– origination and reversal of temporary
differences (4.3) (3.4) (7.7) 14.1 (12.8) 1.3 – derecognition of US deferred tax assets – 21.5 21.5 – – – – change in tax rate 0.8 – 0.8 – – –– adjustments in respect of prior years 0.4 – 0.4 (3.8) – (3.8)
(3.1) 18.1 15.0 10.3 (12.8) (2.5) Taxation (credit) charge (0.9) 16.1 15.2 17.0 (12.8) 4.2
i. Relates to amortisation of acquired intangible assets.
The effective tax rate applicable to operations before amortisation and exceptional items is 5% (2019 – 18%).
The adjustment in respect of prior years of $3.0m (2019 – $3.5m) for current tax includes the release of provisions for uncertain tax positions that are no longer required and normal true-ups.
A tax charge of $16.1m has been included in the consolidated income statement in respect of amortisation of acquired intangible assets and exceptional items (2019 – $12.8m credit). This charge largely reflects the reversal of net deferred tax assets of $21.5m no longer recognised for the US businesses as realisation of the tax benefit is not probable within a reasonable time frame. This charge has been offset by tax credits associated with the amortisation of acquired intangible assets and exceptional items.
The reported tax charge for the year is $15.2m (2019 – $4.2m) and the reported effective tax rate is -7% (2019 – 9%).
The table below reconciles the tax on the Group’s reported profit before tax to a weighted average tax rate for the Group based on the tax rates applicable to each entity in the Group. A weighted average applicable rate for the year has been used, as this reflects the applicable rates for the countries in which the Group has earned profits. The total tax charge (2019 – charge) for the year is different to the weighted average rate of tax of 23% (2019 – 19%) for the following reasons:
2020$m
2019$m
Reported (loss) profit before tax (223.0) 45.6Tax at 23% (2019 – 19%) (51.3) 8.5Permanent differences including tax credits 3.4 3.6Current year losses not recognised 48.7 2.7Derecognition of prior year deferred tax in relation to the US businesses 21.5 –Recognition of previously unrecognised deferred taxes (5.3) (3.3)Change in tax rates 0.8 –Adjustments in respect of prior years (2.6) (7.3)Taxation 15.2 4.2
151Hunting PLC Annual Report and Accounts 2020
Purpose and C
ultureB
usiness Model and S
takeholdersB
usiness Strategy
Perform
anceG
overnanceFin
ancial Statem
ents

Notes to the Consolidated Financial Statementscontinued
10. Taxation continued
Tax effects relating to each component of other comprehensive income were as follows:
2020 2019
Before tax$m
Tax (charged) credited
$mAfter tax
$mBefore tax
$m
Tax (charged) credited
$mAfter tax
$m
Exchange adjustments 5.8 0.1 5.9 5.5 (0.1) 5.4 Release of foreign exchange on liquidation
of subsidiaries – – – (0.3) 0.1 (0.2)Fair value gains (losses) originating on
net investment hedge arising during the year 0.5 (0.1) 0.4 (0.8) 0.1 (0.7)
Remeasurement of defined benefit pension schemes – – – (0.2) (0.1) (0.3)
6.3 – 6.3 4.2 – 4.2
The tax relating to the components of other comprehensive income comprises $nil current tax (2019 – $0.1m credit) and $nil deferred tax (2019 – $0.1m charge).
11. (Loss) Earnings per Share
Basic (loss) earnings per share (“EPS”) is calculated by dividing the (loss) earnings attributable to Ordinary shareholders by the weighted average number of Ordinary shares outstanding during the year. For diluted (loss) earnings per share, the weighted average number of outstanding Ordinary shares is adjusted to assume conversion of all dilutive potential Ordinary shares. Dilution arises through the possible issue of shares to satisfy awards made under the Group’s long-term incentive plans.
Reconciliations of the (loss) earnings and weighted average number of Ordinary shares used in the calculations are set out below:
2020$m
2019$m
Reported (loss) earnings attributable to Ordinary shareholders (234.7) 39.7Add: amortisationi and exceptional items after taxation 218.2 34.7Underlying (loss) earnings attributable to Ordinary shareholders (16.5) 74.4
millions millions
Basic weighted average number of Ordinary shares 163.9 165.2Long-term incentive plans 4.8 3.9Adjusted weighted average number of Ordinary shares 168.7 169.1
cents cents
Reported (loss) earnings per shareBasic EPS (143.2) 24.0Diluted EPSii (143.2) 23.5
Underlying (loss) earnings per shareBasic EPS (10.0) 45.0Diluted EPSii (10.0) 43.9
i. Relates to amortisation of acquired intangible assets.ii. For the year ended 31 December 2020, the effect of dilutive long-term incentive plans was anti-dilutive and, therefore, they have not been used to calculate diluted earnings per share.
152Hunting PLC Annual Report and Accounts 2020

12. Property, Plant and Equipment
Year ended 31 December 2020
Land and buildings
$m
Plant, machinery and motor
vehicles$m
Rental tools$m
Oil and gas exploration and
developmenti $m
Total$m
Cost:At 1 January 2020 267.0 360.2 80.1 128.2 835.5 Exchange adjustments 1.6 3.0 0.6 – 5.2Additions 4.2 7.4 3.0 0.2 14.8Acquisition of subsidiary (note 39) – 2.6 3.2 – 5.8Disposals (3.2) (8.0) (43.9) (17.5) (72.6)Disposal of business – (9.0) (19.6) – (28.6)Reclassification to held-for-sale assets (3.1) – – – (3.1)Reclassification from inventories – – 0.6 – 0.6Reclassification 1.2 (1.2) – – –At 31 December 2020 267.7 355.0 24.0 110.9 757.6
Accumulated depreciation and impairment:At 1 January 2020 52.1 247.9 54.6 126.2 480.8 Exchange adjustments 1.2 2.4 0.2 – 3.8Charge for the year 6.3 23.4 2.0 0.4 32.1Impairment of assets (note 16(c)) 9.1 1.2 9.1 – 19.4Disposals (1.0) (7.2) (44.7) (17.5) (70.4)Disposal of business – (8.5) (5.4) – (13.9)Reclassification to held-for-sale assets (1.3) – – – (1.3)Reclassification 0.5 (0.5) – – –At 31 December 2020 66.9 258.7 15.8 109.1 450.5
Net book amount 200.8 96.3 8.2 1.8 307.1
i. The accumulated cost, depreciation and impairment of those oil and gas exploration and development assets whose licences have expired were disposed of during the year.
Details of the impairment review can be found in note 16(c).
In the first half of 2020, a property in the US operating segment, with a net book value of $1.8m, was reclassified as held-for-sale as it was expected to be sold within 12 months of the classification. At 30 June 2020, a $0.5m write-down to the carrying value was recognised as an exceptional item in restructuring costs to reflect its expected recoverable amount given the market conditions prevailing at the time. The impairment was reversed in the second half of the year following receipt of new information about its market value. The property, which has a carrying value of $1.8m, continues to be classified as held-for-sale at the year-end. The property has been sold in early 2021.
Included in the net book amount is expenditure relating to assets in the course of construction of $nil (2019 – $2.6m) for buildings, $4.9m for rental tools (2019 – $nil) and $0.5m (2019 – $5.5m) for plant and machinery.
Group capital expenditure committed for the purchase of property, plant and equipment, but not provided for in these financial statements, amounted to $0.6m as at 31 December 2020 (2019 – $2.2m).
The net book amount of land and buildings of $200.8m (2019 – $214.9m) comprises freehold land and buildings of $199.1m (2019 – $213.2m) and capitalised leasehold improvements of $1.7m (2019 – $1.7m).
The Group sub-lets certain items of property, plant and equipment under operating leases. The net book value of items that are sub-let included in the table above is $10.3m at 31 December 2020 for land and buildings.
In accordance with the requirements of the Group’s committed bank facility, security has been granted over specific properties, plant and equipment in the UK and US, which have a carrying value of $200.6m (2019 – $217.2m).
153Hunting PLC Annual Report and Accounts 2020
Purpose and C
ultureB
usiness Model and S
takeholdersB
usiness Strategy
Perform
anceG
overnanceFin
ancial Statem
ents

12. Property, Plant and Equipment continued
Year ended 31 December 2019
Land and buildings
$m
Plant, machinery and motor
vehicles$m
Rental tools$m
Oil and gas exploration and
developmenti
$mTotal
$m
Cost:At 1 January 2019 250.0 341.3 80.9 182.3 854.5 Exchange adjustments 1.5 1.6 0.5 – 3.6 Additions 7.2 23.2 5.5 – 35.9 Acquisition of subsidiary 8.3 4.0 – – 12.3 Disposals – (8.2) (3.3) (54.1) (65.6)Disposal of business – (0.3) (3.4) – (3.7)Reclassification to other intangible assets – (1.4) – – (1.4)Reclassification to inventories – – (0.1) – (0.1)At 31 December 2019 267.0 360.2 80.1 128.2 835.5
Accumulated depreciation and impairment:At 1 January 2019 45.5 231.6 37.6 179.6 494.3 Exchange adjustments 0.4 1.5 0.4 – 2.3 Charge for the year 6.2 23.7 3.1 0.7 33.7 Impairment of assets (note 16(c)) – – 19.0 – 19.0 Disposals – (7.7) (2.1) (54.1) (63.9)Disposal of business – (0.3) (3.2) – (3.5)Reclassification to other intangible assets – (0.9) – – (0.9)Reclassification to inventories – – (0.2) – (0.2)At 31 December 2019 52.1 247.9 54.6 126.2 480.8
Net book amount 214.9 112.3 25.5 2.0 354.7
i. The accumulated cost, depreciation and impairment of those oil and gas exploration and development assets whose licences have expired were disposed of during the year.
The net book amount of property, plant and equipment at 1 January 2019 was $360.2m. The net book value of items that are sub-let included in the table above is $3.9m at 31 December 2019 for land and buildings.
13. Right-of-use Assets
Year ended 31 December 2020
Land and buildings
$m
Plant, machineryand motor
vehicles$m
Total$m
Cost:At 1 January 2020 88.4 1.1 89.5 Exchange adjustments 2.1 (0.1) 2.0 New leases 0.6 1.3 1.9 Acquisition of subsidiary (note 39) 0.3 – 0.3 Lease cessations (4.2) (0.3) (4.5)Modifications 1.4 – 1.4 Disposal of business – (0.1) (0.1)At 31 December 2020 88.6 1.9 90.5
Accumulated depreciation and impairment:At 1 January 2020 52.2 0.6 52.8 Exchange adjustments 1.6 (0.1) 1.5 Depreciation charge for the year 7.1 0.4 7.5 Impairment charge for the year (note 16(d)) 4.0 0.1 4.1 Reversal of impairment (0.6) – (0.6)Lease cessations (4.2) (0.3) (4.5)Disposal of business – (0.1) (0.1)At 31 December 2020 60.1 0.6 60.7
Net book amount 28.5 1.3 29.8
The Group sub-lets certain right-of-use assets under operating leases. The net book value of items that are sub-let included in the table above is $2.6m for land and buildings.
Notes to the Consolidated Financial Statementscontinued
154Hunting PLC Annual Report and Accounts 2020

13. Right-of-use Assets continued
Year ended 31 December 2019
Land and buildings
$m
Plant, machineryand motor vehicles
$mTotal
$m
Cost:Adoption of IFRS 16 on 1 January 2019 84.3 1.0 85.3 Exchange adjustments 1.9 – 1.9 New leases 3.3 0.1 3.4 Lease cessations (1.9) (0.1) (2.0)Modifications 0.8 0.1 0.9 At 31 December 2019 88.4 1.1 89.5
Accumulated depreciation and impairment:Adoption of IFRS 16 on 1 January 2019 45.1 0.5 45.6 Exchange adjustments 1.3 – 1.3 Depreciation charge for the year 7.7 0.2 7.9 Lease cessations (1.9) (0.1) (2.0)At 31 December 2019 52.2 0.6 52.8
Net book amount 36.2 0.5 36.7
The net book amount of right-of-use assets at 1 January 2019 was $39.7m. The net book value of items that are sub-let included in the table above is $2.7m at 31 December 2019 for land and buildings.
14. Goodwill
2020$m
2019$m
Cost:At 1 January 516.9 515.1Exchange adjustments 1.7 1.8Additions (note 39) 13.4 –At 31 December 532.0 516.9
Accumulated impairment:At 1 January 286.7 285.2Exchange adjustments 1.3 1.5Impairment charge for the year (note 16(b)) 79.8 –At 31 December 367.8 286.7
Net book amount 164.2 230.2
The net book amount of goodwill at 1 January 2019 was $229.9m.
Details of the allocation of goodwill by cash-generating unit (“CGU”), identification of the material CGU and impairment sensitivity disclosures are given in note 16.
155Hunting PLC Annual Report and Accounts 2020
Purpose and C
ultureB
usiness Model and S
takeholdersB
usiness Strategy
Perform
anceG
overnanceFin
ancial Statem
ents
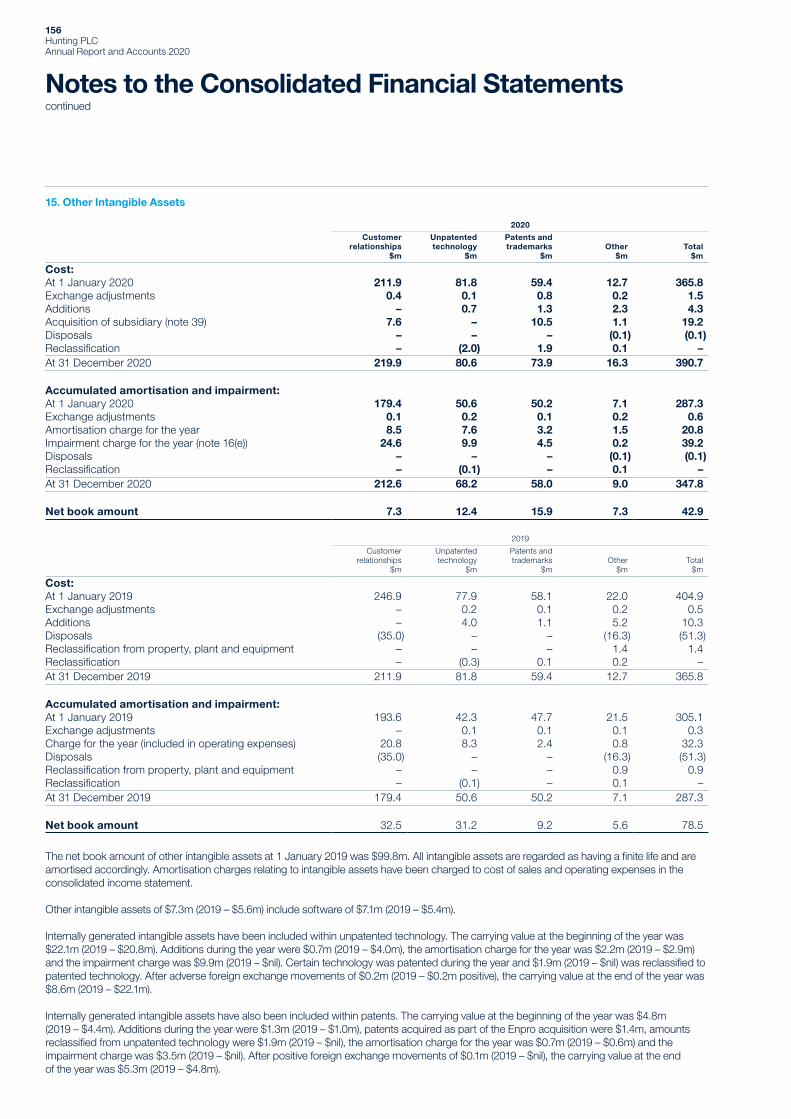
Notes to the Consolidated Financial Statementscontinued
15. Other Intangible Assets
2020
Customer relationships
$m
Unpatented technology
$m
Patents and trademarks
$mOther
$mTotal
$m
Cost:At 1 January 2020 211.9 81.8 59.4 12.7 365.8 Exchange adjustments 0.4 0.1 0.8 0.2 1.5 Additions – 0.7 1.3 2.3 4.3 Acquisition of subsidiary (note 39) 7.6 – 10.5 1.1 19.2 Disposals – – – (0.1) (0.1)Reclassification – (2.0) 1.9 0.1 – At 31 December 2020 219.9 80.6 73.9 16.3 390.7
Accumulated amortisation and impairment:At 1 January 2020 179.4 50.6 50.2 7.1 287.3 Exchange adjustments 0.1 0.2 0.1 0.2 0.6 Amortisation charge for the year 8.5 7.6 3.2 1.5 20.8 Impairment charge for the year (note 16(e)) 24.6 9.9 4.5 0.2 39.2 Disposals – – – (0.1) (0.1)Reclassification – (0.1) – 0.1 – At 31 December 2020 212.6 68.2 58.0 9.0 347.8
Net book amount 7.3 12.4 15.9 7.3 42.9
2019
Customer relationships
$m
Unpatented technology
$m
Patents and trademarks
$mOther
$mTotal
$m
Cost:At 1 January 2019 246.9 77.9 58.1 22.0 404.9 Exchange adjustments – 0.2 0.1 0.2 0.5 Additions – 4.0 1.1 5.2 10.3 Disposals (35.0) – – (16.3) (51.3)Reclassification from property, plant and equipment – – – 1.4 1.4 Reclassification – (0.3) 0.1 0.2 – At 31 December 2019 211.9 81.8 59.4 12.7 365.8
Accumulated amortisation and impairment:At 1 January 2019 193.6 42.3 47.7 21.5 305.1 Exchange adjustments – 0.1 0.1 0.1 0.3 Charge for the year (included in operating expenses) 20.8 8.3 2.4 0.8 32.3 Disposals (35.0) – – (16.3) (51.3)Reclassification from property, plant and equipment – – – 0.9 0.9 Reclassification – (0.1) – 0.1 – At 31 December 2019 179.4 50.6 50.2 7.1 287.3
Net book amount 32.5 31.2 9.2 5.6 78.5
The net book amount of other intangible assets at 1 January 2019 was $99.8m. All intangible assets are regarded as having a finite life and are amortised accordingly. Amortisation charges relating to intangible assets have been charged to cost of sales and operating expenses in the consolidated income statement.
Other intangible assets of $7.3m (2019 – $5.6m) include software of $7.1m (2019 – $5.4m).
Internally generated intangible assets have been included within unpatented technology. The carrying value at the beginning of the year was $22.1m (2019 – $20.8m). Additions during the year were $0.7m (2019 – $4.0m), the amortisation charge for the year was $2.2m (2019 – $2.9m) and the impairment charge was $9.9m (2019 – $nil). Certain technology was patented during the year and $1.9m (2019 – $nil) was reclassified to patented technology. After adverse foreign exchange movements of $0.2m (2019 – $0.2m positive), the carrying value at the end of the year was $8.6m (2019 – $22.1m).
Internally generated intangible assets have also been included within patents. The carrying value at the beginning of the year was $4.8m (2019 – $4.4m). Additions during the year were $1.3m (2019 – $1.0m), patents acquired as part of the Enpro acquisition were $1.4m, amounts reclassified from unpatented technology were $1.9m (2019 – $nil), the amortisation charge for the year was $0.7m (2019 – $0.6m) and the impairment charge was $3.5m (2019 – $nil). After positive foreign exchange movements of $0.1m (2019 – $nil), the carrying value at the end of the year was $5.3m (2019 – $4.8m).
156Hunting PLC Annual Report and Accounts 2020

16. Impairment of Non-financial Assets
(a) Impairment Testing Process(i) Cash-generating Units (“CGUs”)As at 31 December 2019, a limited number of cases of an unknown virus had been reported to the World Health Organisation (the “WHO”). Following the subsequent spread of the virus, on 11 March 2020, the WHO declared the coronavirus (“COVID-19”) outbreak to be a pandemic. As a result of COVID-19, we have seen macroeconomic uncertainty with regards to prices and demand for oil and gas, with the largest one-day fall in the oil price since 1991 being recorded in March 2020. The effect on the Group of the downturn in the global economy due to COVID-19 and the impact that this has had on the oil and gas sector began in late Q1 2020.
In preparing the 2019 year-end Group financial statements, a goodwill impairment review was conducted but did not result in any impairment. However, for our European Well Intervention CGU a downside sensitivity was disclosed. During 2020, market conditions were significantly worse, business activity levels declined very quickly and more severely than was expected at the 2019 year-end due to the global impact of COVID-19. The scale and duration of the adverse impact remains uncertain, and furthermore, the recovery is expected to be a gradual process. Therefore, during 2020 management tested goodwill for impairment across all CGUs in preparing the financial statements. Management reacted to the downturn, implementing restructuring actions, and revised projections, including projected cost savings, which were used in the calculation of recoverable amounts.
The recoverable amount for each CGU was determined using a fair value less costs of disposal (“FVLCD”) method, which represents the value of the CGU in a sales transaction on an arm’s-length basis. As there is no active market for the Group’s CGUs, the FVLCD is determined using discounted cash flow techniques based on the estimated future cash flows that are expected to be generated by the CGU and discounted at a rate that is determined for each CGU in isolation by consideration of their business risk profile. This method allows approved capital projects that are in progress to be included. The recoverable amount calculations use discounted pre-tax nominal cash flow projections. The key assumptions for the recoverable amount calculations are revenue growth rates, taking into account the impact these have on margins, terminal growth rates and the discount rates applied. The FVLCD is a Level 3 measurement as per the fair value hierarchy as defined within IFRS 13 due to unobservable inputs used in the valuation.
For 2021, cash flows are based on the latest detailed forecast, as approved by the Board. For 2022 to 2025, management made revenue projections using Spears & Associates “Drilling and Production Outlook” independent reports as a default basis, selecting the most appropriate geographic markets and drivers (rig count, footage drilled or E&P spend) for each CGU. Management then applied judgemental changes to revenue growth expectations, if appropriate, to reflect circumstances specific to the CGU. Having determined the projected revenues, management then modelled the expected impact on margins and cash flow from the resulting revenue projections. This process can give a diverse range of outcomes depending on market or business specific conditions. Compound annual growth rates (“CAGR”) for revenue for the CGUs from 2020 to 2025 vary between 8% and 30% (2019 – CAGR from 2019 to 2024 between 3% and 12%). After 2025, a terminal value was calculated assuming growth of 50 basis points above assumed inflation (2019 – 25 basis points), giving nominal growth rates between 0% and 1% (2019 – between 1% and 2%).
Cash flows were discounted using nominal pre-tax rates between 11% and 13% (2019 – 9% and 10%). The discount rates reflect current market assessments of the equity market risk premiums, the volatility of returns, the risks associated with the cash flows, the likely external borrowing rate of the CGU and expected levels of leverage. As a result of the significant reduction in the Company’s share price, the “small-cap premium” applied in determining discount rates has increased markedly and is the main contributor to the higher rates applied in 2020. Consideration was also given to other factors such as currency risk, operational risk and country risk.
(ii) Individual AssetsFor individual assets, an impairment test is conducted if there are indicators of impairment. Impairment arises when the carrying value of the asset is greater than the higher of its fair value less costs of disposal or its value-in-use. The FVLCD or the value-in-use is a Level 3 measurement as per the fair value hierarchy as defined within IFRS 13 due to unobservable inputs used in the valuation. If the cash flows of an asset cannot be assessed individually, then the asset or a group of assets are aggregated into a CGU and tested as described above.
(b) Impairment Tests for GoodwillGoodwill is allocated to the Group’s cash-generating units (“CGUs”) as follows:
CGUOperating segment
2020$m
2019$m
Hunting Titan Titan 114.9 180.5Hunting Stafford “Subsea” US 15.0 15.0Enpro US 14.2 –Dearborn US 7.6 12.5US Manufacturing US 12.5 12.5Hunting Specialty US – 5.0European Well Intervention (Welltonic acquisition) EMEA – 4.7At 31 December 164.2 230.2
Goodwill is tested at least annually for impairment. Impairment charges of $79.8m (2019 – $nil) were recorded as a result of the goodwill impairment reviews carried out in the year. In all CGUs, the impairment arose as a result of reduced mid-term economic expectations following the current downturn and increased discount rates as discussed above.
157Hunting PLC Annual Report and Accounts 2020
Purpose and C
ultureB
usiness Model and S
takeholdersB
usiness Strategy
Perform
anceG
overnanceFin
ancial Statem
ents

16. Impairment of Non-financial Assets continued
(b) Impairment Tests for Goodwill continued(i) Hunting TitanHunting Titan is the only CGU which is significant in relation to the Group’s total carrying amount of goodwill, representing 70% (2019 – 78%) of the balance. The Hunting Titan CGU was considerably impacted by the significant and rapid decline in US onshore activity levels in the first half of the year and an impairment of $65.6m (2019 – $nil) was charged in the interim accounts. There has been a steady improvement in performance during the second half of the year, and a more positive future outlook for US onshore has emerged since the last impairment test was performed. This has resulted in a headroom over carrying value of $64.7m in the year-end test in which cash flows were discounted using a nominal pre-tax rate of 11%. A decrease in the expected CAGR between 2020 and 2025 of 5% from the 8% expected would eliminate this headroom.
(ii) EnproGoodwill of $13.4m was recognised on the acquisition of Enpro (see note 39). After foreign exchange movements of $0.8m, Enpro’s goodwill balance at the year-end is $14.2m. Cash flows were discounted using a nominal pre-tax rate of 13%, with no impairment being recognised following the impairment review. Should the forecast revenue CAGR deteriorate between 2020 and 2025 by 7% in actual results or future forecasts, this could result in a material impairment charge in the next financial year. Enpro is part of the US operating segment.
(iii) DearbornIn the first half of 2020 an impairment charge of $4.9m was incurred in respect of the Dearborn CGU (2019 – $nil). In the year-end test performed, cash flows were discounted using a nominal pre-tax rate of 12% and no further impairment is required as forecast expectations have improved. Should the forecast revenue CAGR deteriorate between 2020 and 2025 by 7% in actual results or future forecasts, this could result in a material impairment charge in the next financial year. Dearborn is part of the US operating segment. Dearborn is part of the US operating segment.
(iv) Other CGUsGoodwill in Hunting Specialty and European Well Intervention was fully impaired, giving rise to a charge of $5.0m in Hunting Specialty and, after foreign exchange movements of $0.4m, a charge of $4.3m was reflected in European Well Intervention. Hunting Specialty is part of the US operating segment and European Well Intervention is part of the EMEA operating segment.
(c) Impairment of Property, Plant and EquipmentA total impairment of $19.4m was recorded against property, plant and equipment in the year. In the US operating segment, $10.1m of impairment was charged relating to rental tools and property. In the EMEA operating segment, $8.8m was charged, with $8.0m charged to a property in Well Intervention and $0.8m related to equipment that is not expected to be utilised in the Netherlands following the fall in demand, as a result of the CGU test referred to above. In Canada, $0.1m was charged as a result of the closure of operations and $0.4m in Hunting Titan in relation to obsolete equipment. During 2019, impairment of our drilling tools motor fleet and associated parts of $19.0m was recognised.
(d) Impairment of Right-of-use AssetsFollowing the closure of leased properties, impairment charges of $3.9m in Canada and $0.2m in Hunting Titan, totalling $4.1m, were recognised in the year (2019 – $nil).
(e) Impairment of Other Intangible AssetsImpairments of other intangible assets in the year gave rise to a charge of $39.2m (2019 – $nil). As a result of the reduced revenue and profitability in Hunting Titan, the remaining balance for customer relationships recognised on the acquisition in 2011 was written off, generating a charge of $24.6m. The fall in expected future demand led to a $14.4m impairment of self-developed technologies, with $4.9m related to perforating products in Hunting Titan, $5.2m for OCTG in the US, $2.6m for well intervention products in EMEA and $1.7m for OCTG arising on the closure of Canada. The Canadian closure also resulted in a $0.2m write-off related to IT systems.
(f) Impairment of InventoryCertain inventory was written down to its net realisable value due to the reduced movement in inventories, lower oil and gas prices reducing demand and inventory selling prices being lowered. A net impairment charge of $36.4m was recognised in the year (2019 – $5.9m), with $34.2m of the impairment charge (2019 – $nil) being recognised as an exceptional item (note 6).
17. Investments
2020$m
2019$m
Non-current:Listed equity investments and mutual funds 1.7 1.6Investments in associates 18.1 0.7 19.8 2.3
Current:Listed equity investments and mutual funds – 0.5
The listed equity investments and mutual funds are equity instruments measured at fair value through profit or loss. Returns on the listed equity investments and mutual funds of $nil (2019 – $0.3m) are included in finance income in note 9.
Notes to the Consolidated Financial Statementscontinued
158Hunting PLC Annual Report and Accounts 2020
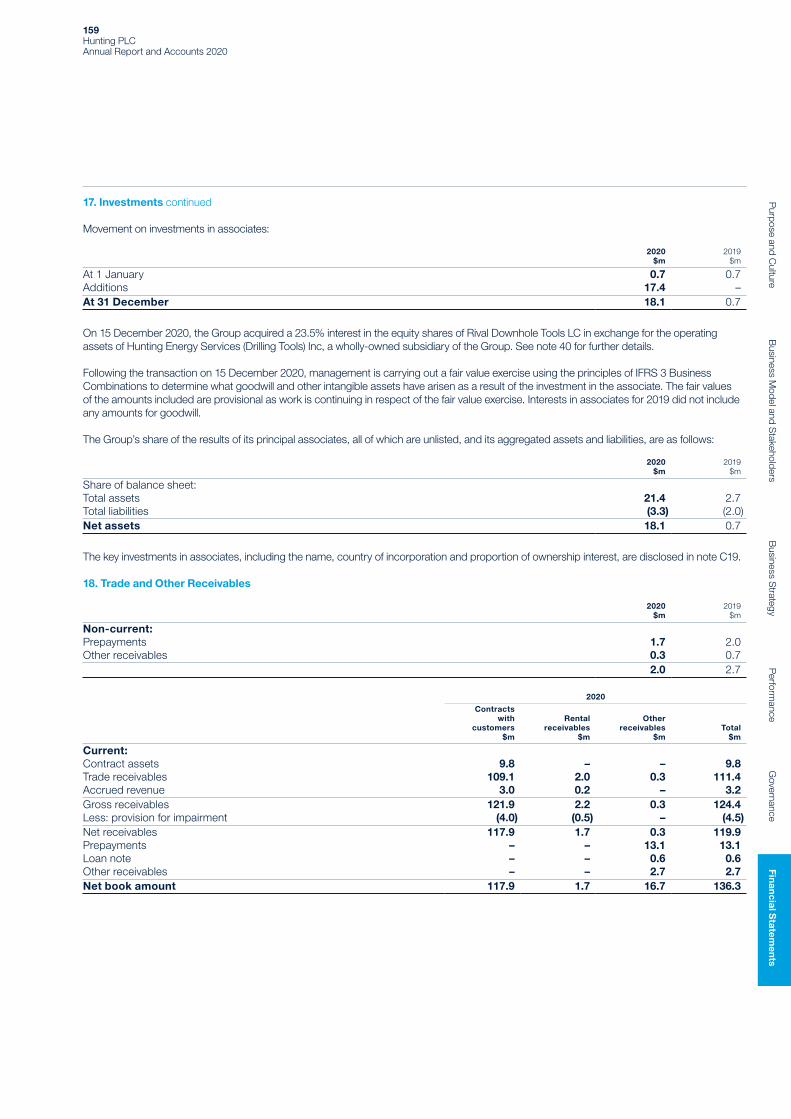
17. Investments continued
Movement on investments in associates:
2020$m
2019$m
At 1 January 0.7 0.7Additions 17.4 –At 31 December 18.1 0.7
On 15 December 2020, the Group acquired a 23.5% interest in the equity shares of Rival Downhole Tools LC in exchange for the operating assets of Hunting Energy Services (Drilling Tools) Inc, a wholly-owned subsidiary of the Group. See note 40 for further details.
Following the transaction on 15 December 2020, management is carrying out a fair value exercise using the principles of IFRS 3 Business Combinations to determine what goodwill and other intangible assets have arisen as a result of the investment in the associate. The fair values of the amounts included are provisional as work is continuing in respect of the fair value exercise. Interests in associates for 2019 did not include any amounts for goodwill.
The Group’s share of the results of its principal associates, all of which are unlisted, and its aggregated assets and liabilities, are as follows:
2020$m
2019$m
Share of balance sheet:Total assets 21.4 2.7Total liabilities (3.3) (2.0)Net assets 18.1 0.7
The key investments in associates, including the name, country of incorporation and proportion of ownership interest, are disclosed in note C19.
18. Trade and Other Receivables
2020$m
2019$m
Non-current:Prepayments 1.7 2.0 Other receivables 0.3 0.7 2.0 2.7
2020
Contractswith
customers$m
Rental receivables
$m
Other receivables
$mTotal
$m
Current: Contract assets 9.8 – – 9.8 Trade receivables 109.1 2.0 0.3 111.4 Accrued revenue 3.0 0.2 – 3.2 Gross receivables 121.9 2.2 0.3 124.4 Less: provision for impairment (4.0) (0.5) – (4.5)Net receivables 117.9 1.7 0.3 119.9 Prepayments – – 13.1 13.1 Loan note – – 0.6 0.6 Other receivables – – 2.7 2.7 Net book amount 117.9 1.7 16.7 136.3
159Hunting PLC Annual Report and Accounts 2020
Purpose and C
ultureB
usiness Model and S
takeholdersB
usiness Strategy
Perform
anceG
overnanceFin
ancial Statem
ents

18. Trade and Other Receivables continued
2019
Contractswith
customers$m
Rentalreceivables
$m
Other receivables
$mTotal
$m
Current: Contract assets 8.3 – – 8.3 Trade receivables 149.0 10.4 – 159.4 Accrued revenue 12.0 0.3 – 12.3 Gross receivables 169.3 10.7 – 180.0 Less: provision for impairment (3.6) (0.3) – (3.9)Net receivables 165.7 10.4 – 176.1 Prepayments – – 21.9 21.9 Loan note – – 0.7 0.7 Other receivables – – 3.3 3.3 Net book amount 165.7 10.4 25.9 202.0
Trade receivables of $111.4m (2019 – $159.4m), accrued revenue of $3.2m (2019 – $12.3m) and the loan note of $0.6m (2019 – $0.7m) are financial assets measured at amortised cost and total $115.2m (2019 – $172.4m). Interest income on the loan note is immaterial in 2019 and 2020.
Other receivables generally arise from transactions outside the usual operating activities of the Group and comprise receivables from tax receivables (VAT, GST, franchise taxes, and sales and use taxes) of $1.6m (2019 – $2.0m), derivative financial assets of $0.1m (2019 – $0.3m) and other receivables of $1.3m (2019 – $1.7m), which are financial assets measured at amortised cost. Derivative financial assets of $0.1m (2019 – $0.2m) are held for trading measured at fair value through profit or loss and derivative financial assets of $nil (2019 – $0.1m) are designated in a hedge measured at fair value.
Apart from personal director guarantees for the $0.6m loan note, the Group does not hold any other collateral as security and no assets have been acquired through the exercise of any collateral previously held.
In accordance with the requirements of the Group’s committed bank facility, security has been granted over certain trade receivables and other receivables in the UK, US and Canada, which have a gross value of $84.3m (2019 – $127.3m). For the receivables pledged as security, their carrying value approximates their fair value.
Impairment of Trade and Other ReceivablesThe Group has chosen to apply lifetime expected credit losses (“ECLs”) to trade receivables, accrued revenue and contract assets upon their initial recognition. Each entity within the Group uses provision matrices for recognising ECLs on its receivables, which are based on actual credit loss experience over the past two years, at a minimum. Receivables are appropriately grouped by geographical region, product type or type of customer, and separate calculations produced, if historical or forecast credit loss experience shows significantly different loss patterns for different customer segments. Actual credit loss experience is then adjusted to reflect differences in economic conditions over the period the historical data was collected, current economic conditions, forward-looking information based on macroeconomic information and the Group’s view of economic conditions over the expected lives of the receivables. The contract assets relate to unbilled work in progress and have substantially the same risk characteristics as the trade receivables for the same types of contracts. It has, therefore, been concluded that the expected loss rates for trade receivables are a reasonable approximation of the loss rates for the contract assets.
At 31 December 2020, the ageing of the Group’s gross financial assets, based on days overdue, is as follows:
Notoverdue
$m
1 – 30days
$m
31 – 60days
$m
61 – 90days
$m
91 – 120days
$m
More than120 days
$m
Total gross financial
assets$m
Contract assets 9.8 – – – – – 9.8 Trade receivables – contracts with customers 52.3 18.0 18.1 4.1 9.4 7.2 109.1 Trade receivables – rental receivables 1.0 0.1 0.2 0.2 0.1 0.4 2.0 Trade receivables – other 0.3 – – – – – 0.3Accrued revenue – contracts with customers 3.0 – – – – – 3.0 Accrued revenue – rental receivables 0.2 – – – – – 0.2 Loan note 0.6 – – – – – 0.6 Other receivables 1.3 0.1 – – – – 1.4
68.5 18.2 18.3 4.3 9.5 7.6 126.4
Notes to the Consolidated Financial Statementscontinued
160Hunting PLC Annual Report and Accounts 2020
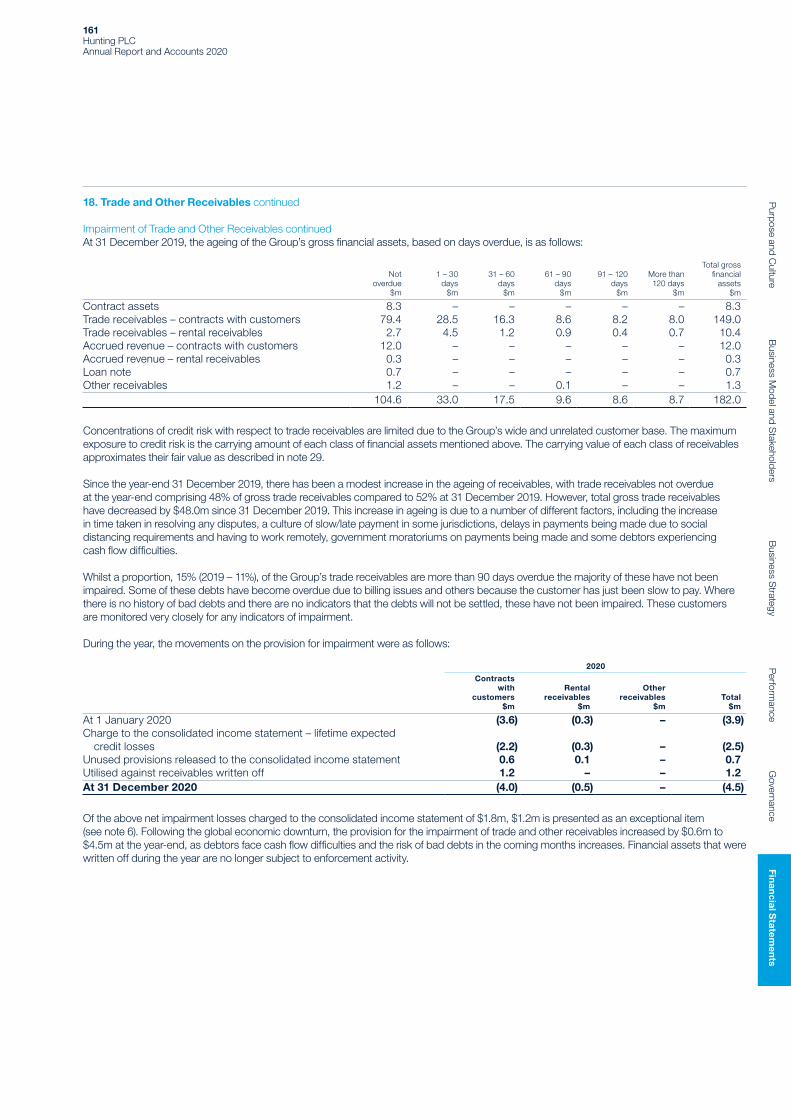
18. Trade and Other Receivables continued
Impairment of Trade and Other Receivables continued At 31 December 2019, the ageing of the Group’s gross financial assets, based on days overdue, is as follows:
Notoverdue
$m
1 – 30days
$m
31 – 60days
$m
61 – 90days
$m
91 – 120days
$m
More than120 days
$m
Total gross financial
assets$m
Contract assets 8.3 – – – – – 8.3 Trade receivables – contracts with customers 79.4 28.5 16.3 8.6 8.2 8.0 149.0 Trade receivables – rental receivables 2.7 4.5 1.2 0.9 0.4 0.7 10.4 Accrued revenue – contracts with customers 12.0 – – – – – 12.0 Accrued revenue – rental receivables 0.3 – – – – – 0.3 Loan note 0.7 – – – – – 0.7 Other receivables 1.2 – – 0.1 – – 1.3
104.6 33.0 17.5 9.6 8.6 8.7 182.0
Concentrations of credit risk with respect to trade receivables are limited due to the Group’s wide and unrelated customer base. The maximum exposure to credit risk is the carrying amount of each class of financial assets mentioned above. The carrying value of each class of receivables approximates their fair value as described in note 29.
Since the year-end 31 December 2019, there has been a modest increase in the ageing of receivables, with trade receivables not overdue at the year-end comprising 48% of gross trade receivables compared to 52% at 31 December 2019. However, total gross trade receivables have decreased by $48.0m since 31 December 2019. This increase in ageing is due to a number of different factors, including the increase in time taken in resolving any disputes, a culture of slow/late payment in some jurisdictions, delays in payments being made due to social distancing requirements and having to work remotely, government moratoriums on payments being made and some debtors experiencing cash flow difficulties.
Whilst a proportion, 15% (2019 – 11%), of the Group’s trade receivables are more than 90 days overdue the majority of these have not been impaired. Some of these debts have become overdue due to billing issues and others because the customer has just been slow to pay. Where there is no history of bad debts and there are no indicators that the debts will not be settled, these have not been impaired. These customers are monitored very closely for any indicators of impairment.
During the year, the movements on the provision for impairment were as follows:
2020
Contractswith
customers$m
Rental receivables
$m
Other receivables
$mTotal
$m
At 1 January 2020 (3.6) (0.3) – (3.9)Charge to the consolidated income statement – lifetime expected credit losses (2.2) (0.3) – (2.5)Unused provisions released to the consolidated income statement 0.6 0.1 – 0.7 Utilised against receivables written off 1.2 – – 1.2 At 31 December 2020 (4.0) (0.5) – (4.5)
Of the above net impairment losses charged to the consolidated income statement of $1.8m, $1.2m is presented as an exceptional item (see note 6). Following the global economic downturn, the provision for the impairment of trade and other receivables increased by $0.6m to $4.5m at the year-end, as debtors face cash flow difficulties and the risk of bad debts in the coming months increases. Financial assets that were written off during the year are no longer subject to enforcement activity.
161Hunting PLC Annual Report and Accounts 2020
Purpose and C
ultureB
usiness Model and S
takeholdersB
usiness Strategy
Perform
anceG
overnanceFin
ancial Statem
ents

18. Trade and Other Receivables continued
Impairment of Trade and Other Receivables continued
2019
Contractswith
customers$m
Rentalreceivables
$m
Other receivables
$mTotal
$m
At 1 January 2019 (2.7) (0.3) (0.1) (3.1)Charge to the consolidated income statement – lifetime expected credit losses (1.6) – – (1.6)Unused provisions released to the consolidated income statement 0.4 – 0.1 0.5Utilised against receivables written off 0.3 – – 0.3At 31 December 2019 (3.6) (0.3) – (3.9)
Default on a financial asset is usually considered to have occurred when any contractual payments under the terms of the debt are more than 90 days overdue. Usually, no further deliveries are made or services provided to customers that are more than 90 days overdue unless there is a valid reason to do so, such as billing issues have prevented the customer from settling the invoice. Permission from the local financial controller can be obtained to continue trading with customers with debts that are more than 90 days overdue, and the outstanding debts may also be rescheduled with the permission of the financial controller.
Receivables are written off when there is no reasonable expectation of recovery. Indicators that receivables are generally not recoverable include the failure of the debtor to engage in a repayment plan, failure to make contractual payments for a period greater than 180 days past due and the debtor being placed in administration. Where receivables have been written off, the entity will continue to try and recover the outstanding receivable. Impairment losses on receivables are presented net of unused provisions released to the consolidated income statement within operating expenses. Subsequent recoveries of amounts previously written off are credited against the same line item.
19. Deferred Tax
Deferred income tax assets and liabilities are only offset when there is a legally enforceable right to offset, when the deferred income taxes relate to the same fiscal authority and there is an intention to settle the balance net. The offset amounts are as follows:
2020$m
2019$m
Deferred tax assets 15.3 29.9Deferred tax liabilities (9.8) (0.8) 5.5 29.1
The movement in the net deferred tax asset is as follows:
2020$m
2019$m
At 1 January 29.1 24.8Adoption of IFRS 16 – 1.7 At 1 January amended 29.1 26.5 Exchange adjustments 0.2 0.1 Acquisition of subsidiary (note 39) (4.0) – (Charge) credit to the consolidated income statement (14.2) 2.5 Change in tax rates (0.8) –Total (charge) credit to the consolidated income statement (15.0) 2.5Taken direct to equity (0.5) – Other movements (4.3) – At 31 December 5.5 29.1
The change in tax rates relates to the rate at which UK and Canada deferred tax balances are recorded.
Deferred tax assets of $306.5m gross and $80.5m tax (2019 – $95.4m gross and $15.8m tax) have not been recognised as realisation of the tax benefit is currently not probable within a reasonable timeframe. This includes $191.4m gross and $49.8m tax (2019 – $89.4m gross and $14.8m tax) in respect of trading losses, the majority of which do not have an expiry date. A deferred tax asset of $12.0m (2019 – $24.0m) has been recognised in respect of tax losses in various locations on the basis of forecast future taxable profits against which those tax losses could be utilised.
Notes to the Consolidated Financial Statementscontinued
162Hunting PLC Annual Report and Accounts 2020

19. Deferred Tax continued
The movements in deferred tax assets and liabilities, prior to taking into consideration the offsetting of balances within the same tax jurisdictions, are shown below:
At 1 January
2020$m
Exchange adjustments
$m
Acquisitionof
subsidiary$m
(Charge) credit to income
statement$m
Change in tax rates
$m
Taken direct to equity
$m
Other movements
$m
At 31 December
2020 $m
Netdeferred
tax assets
$m
Net deferred
tax liabilities
$m
Tax losses 24.0 0.3 – (7.4) (0.6) – (4.3) 12.0 12.0 – Inventory 7.1 – – (6.0) (0.1) – – 1.0 1.0 – Goodwill and intangibles 7.2 (0.2) (3.4) (11.4) – – – (7.8) – (7.8)Post-retirement benefits 0.4 – – (0.4) – – – – – – Asset decommissioning provision 0.9 – – (0.9) – – – – – – Accumulated tax depreciation (20.9) – (0.6) 19.6 (0.1) – – (2.0) – (2.0)Share-based payments 3.7 – – (2.8) – (0.5) – 0.4 0.4 – Other 6.7 0.1 – (4.9) – – – 1.9 1.9 –
29.1 0.2 (4.0) (14.2) (0.8) (0.5) (4.3) 5.5 15.3 (9.8)
At 1 January
2019$m
Adoption of IFRS 16
$m
Exchange adjustments
$m
Credit (charge) to
income statement
$m
Taken direct to equity
$m
Other movements
$m
At 31 December
2019 $m
Netdeferred
tax assets
$m
Net deferred
tax liabilities
$m
Tax losses 19.1 – – 0.2 0.2 4.5 24.0 24.0 – Inventory 6.3 – – 0.8 – – 7.1 7.1 – Goodwill and intangibles 10.0 – – (2.7) (0.2) 0.1 7.2 7.4 (0.2)Post-retirement benefits 0.3 – – 0.2 (0.1) – 0.4 0.4 – Asset decommissioning provision 1.1 – – (0.2) – – 0.9 0.9 – Accumulated tax depreciation (17.2) – 0.1 (3.8) – – (20.9) (20.0) (0.9)Share-based payments 3.9 – – (0.3) 0.1 – 3.7 3.7 – Other 1.3 1.7 – 8.3 – (4.6) 6.7 6.4 0.3
24.8 1.7 0.1 2.5 – – 29.1 29.9 (0.8)
20. Inventories
2020$m
2019$m
Raw materials 101.6 105.4 Work in progress 50.9 65.4Finished goods 173.1 206.5 Gross inventories 325.6 377.3 Less: provisions for losses (37.2) (26.5)Net inventories 288.4 350.8
The Group’s inventory is highly durable and is well maintained. It can, therefore, hold its value well with the passing of time. When volume demand falls, or prices are reduced, management has to assess whether the carrying value of inventory can still be achieved. For some markets and product lines there may be a limited number, or even no sales, to form a benchmark in the current year. In these cases, management looks at historical activity levels and has to form a judgement as to likely future demand in the light of market forecasts and likely competitor activities. Management has considered the judgements and estimates made in each of the Group’s businesses and has not identified any individual estimates which, in the event of a change, would lead to a material change in the next financial period.
As a result of such judgements, the net inventory balance comprises $240.6m of inventory carried at cost (2019 – $301.4m) and $47.8m carried at net realisable value (“NRV”), which represents 17% of net inventories (2019 – $49.4m at NRV representing 14% of net inventories). Provisions for inventories held at NRV are subject to change if expectations change.
163Hunting PLC Annual Report and Accounts 2020
Purpose and C
ultureB
usiness Model and S
takeholdersB
usiness Strategy
Perform
anceG
overnanceFin
ancial Statem
ents

20. Inventories continued
Gross inventories decreased by $51.7m from $377.3m at 31 December 2019 to $325.6m at 31 December 2020. Additions to inventories were $465.7m (2019 – $673.1m), additions from acquisitions of $0.7m (2019 – $0.4m) and foreign exchange movements of $4.8m (2019 – $3.0m) were offset by inventories expensed to cost of sales of $505.7m (2019 – $667.5m) and inventories written off of $14.9m (2019 – $4.3m) against the inventory provision, inventories transferred to PPE of $0.6m (2019 – $0.1m) and $1.7m in relation to the disposal of US Drilling Tools’ assets.
The inventory provision increased by $10.7m from $26.5m at 31 December 2019 to $37.2m at 31 December 2020, as a result of impairment charges included in cost of sales of $37.4m (2019 – $7.5m) and foreign exchange movements of $0.2m (2019 – $0.4m) offset by $14.9m (2019 – $4.3m) of the provision being utilised in the year against inventories written off and $12.0m (2019 – $1.6m) released to the consolidated income statement in cost of sales. The reversal of previous write-downs occurred when inventory was sold for an amount higher than its net realisable value and also where older inventories, which had previously been written off, were sold as market conditions improved in the oil and gas sector. Overall, Hunting’s provision for inventory losses increased to 11% (2019 – 7%) of gross inventory balances at 31 December 2020 following the downturn in the oil and gas sector. Details of the impairment review can be found in note 16.
Inventories of $165.0m are expected to be realised within 12 months of the balance sheet date (2019 – $293.0m) and $123.4m will be realised after 12 months (2019 – $57.8m).
In accordance with the requirements of the Group’s committed bank facility, security has been granted over inventories in certain subsidiaries in the UK, US and Canada, which have a gross value of $198.2m (2019 – $229.9m).
21. Cash and Cash Equivalents
2020$m
2019$m
Cash at bank and in hand 102.9 66.6 Money market funds – 26.2 Short-term deposits of less than three month’s maturity – 35.8 Cash and cash equivalents 102.9 128.6
Cash at bank and in hand and short-term deposits are carried at amortised cost. Money market funds are financial assets carried at fair value through profit or loss. The maximum exposure to credit risk is the carrying amount of each class of financial assets mentioned.
As shown in note 26, cash and cash equivalents for cash flow statement purposes also includes bank overdrafts shown in borrowings in note 25.
22. Trade and Other Payables
2020$m
2019$m
Non-current:Accruals 0.4 0.5Social security and other taxes 0.3 0.6US deferred compensation plan obligation (note 32) 1.7 1.6 2.4 2.7
2020$m
2019$m
Current:Trade payables 26.4 56.3 Accruals 29.0 45.3 Social security and other taxes 7.2 7.7 Contract liabilities 2.4 6.8 US deferred compensation plan obligation (note 32) – 0.5Other payables 2.9 4.6 67.9 121.2
Trade payables of $26.4m (2019 – $56.3m), accruals of $29.4m (2019 – $45.8m) and other payables of $1.5m (2019 – $3.4m) are financial liabilities measured at amortised cost and total $57.3m (2019 – $105.5m). Other payables also include derivative financial liabilities of $0.6m (2019 – $1.0m) held for trading measured at fair value through profit or loss and derivative financial liabilities designated in a net investment hedge measured at fair value of $nil (2019 – $0.2m).
Notes to the Consolidated Financial Statementscontinued
164Hunting PLC Annual Report and Accounts 2020

23. Contract Assets and Liabilities
The following table provides information about receivables, contract assets and contract liabilities from contracts with customers.
2020$m
2019$m
2018$m
Contract assets (note 18) 9.8 8.3 11.8Contract liabilities (note 22) (2.4) (6.8) (5.5)
Trade receivables – contracts with customers (note 18) 109.1 149.0 172.1Loss allowance (note 18) (4.0) (3.6) (2.7)Net trade receivables – contracts with customers 105.1 145.4 169.4
(a) Significant Changes in Contract Assets and Contract Liabilities Contract assets increased from $8.3m at 31 December 2019 to $9.8m at 31 December 2020 due to the addition of contract assets following the acquisition of Enpro and increased levels of bespoke customer work-in-progress in the Subsea Spring business, which were partly offset by a reduction in bespoke customer work-in-progress in Dearborn.
Contract liabilities represent deposits received on contracts relating to the purchase of pipe in the Asia Pacific businesses, prior to Hunting placing an order with the steel mills, and decreased from $6.8m at 31 December 2019 to $2.4m at 31 December 2020, reflecting the lower activity levels in the region.
(b) Revenue Recognised in Relation to Contract LiabilitiesThe following table shows how much of the revenue recognised in the current reporting period relates to carried-forward contract liabilities and how much relates to performance obligations that were satisfied in a prior year.
2020$m
2019$m
Revenue recognised that was included in the contract liability balance at the beginning of the year 6.7 5.5Revenue recognised from performance obligations satisfied (or partially satisfied) in previous years – –Total 6.7 5.5
(c) Unsatisfied Performance ObligationsThe aggregate amount of the transaction price allocated to partially or fully unsatisfied performance obligations as at the year-end on confirmed purchase orders received prior to the year-end is $144.4m (2019 – $239.0m). It is expected that 81% or $117.0m (2019 – 95% or $227.4m) will be recognised as revenue in the 2021 financial year and the remaining 19% or $27.4m (2019 – 5% or $11.6m) in future years.
24. Leases
The Group leases various offices, warehouses, equipment and vehicles. Rental contracts for offices and warehouses are typically made for fixed periods of between three and ten years, but may have extension options as described below. Rental contracts for equipment and vehicles are typically made for fixed periods of between three and seven years. The Group also has short-term leases and leases of low-value assets. Lease terms are negotiated on an individual basis and contain a wide range of different terms and conditions. The lease agreements do not impose any covenants. As at 31 December 2020, the Group did not have any commitments for leases that were due to commence in 2021 or later. There were no commitments for leases at the end of 2019.
Extension and break options are included in a number of property and equipment leases across the Group. These terms are used to maximise operational flexibility in terms of managing contracts. For extension and break options that are exercisable only by the Group and not by the respective lessor, management considers all facts and circumstances that create an economic incentive for the Group to exercise an extension option, or not exercise a break option in determining the lease term. The lease term is determined according to management’s expectation of exercising any available extension and break options. Extension or termination options are only adjusted in the lease term if the lease option is reasonably certain to be exercised.
(a) Amounts Recognised in the Consolidated Balance SheetThe analysis of right-of-use assets is presented in note 13.
2020 $m
2019 $m
Lease liabilitiesCurrent 10.2 9.8Non-current 30.1 35.4 40.3 45.2
165Hunting PLC Annual Report and Accounts 2020
Purpose and C
ultureB
usiness Model and S
takeholdersB
usiness Strategy
Perform
anceG
overnanceFin
ancial Statem
ents

24. Leases continued
(b) Amounts Recognised in the Consolidated Income Statement The consolidated income statement includes the following amounts relating to leases:
2020 $m
2019 $m
Depreciation of right-of-use assets (note 13) 7.5 7.9Reversal of impairment of right-of-use assets (included in operating expenses) (note 13) (0.6) –Expense relating to short-term leases and leases of low-value assets (included in cost of sales and operating expenses) 2.5 3.0Lease charges included in underlying (loss) profit from operations 9.4 10.9Impairments of right-of-use assets – exceptional (included in operating expenses) (note 13) 4.1 –Lease charges included in reported (loss) profit from operations 13.5 10.9Interest on lease liabilities (included in finance costs (note 9)) 1.9 2.2Lease charges included in (loss) profit before tax 15.4 13.1
(c) Amounts Recognised in the Statement of Cash Flows
2020 $m
2019 $m
Payments for short-term and low-value leases 2.5 3.0Payments for capitalised leases 10.4 10.6 12.9 13.6
Payments for short-term leases, payments for leases of low-value assets and variable lease payments that are not included in the measurement of the lease liabilities are presented within cash flows from operating activities. Payments for the principal and interest elements of recognised lease liabilities are presented within cash flows from financing activities.
The analysis of the contractual, undiscounted cash flows relating to lease liabilities is shown in note 30(d).
(d) The Group as LessorA number of the Group’s properties included within property, plant and equipment and capitalised as right-of-use assets are let under operating lease agreements. Income from subleasing these assets during the year was $1.8m (2019 – $1.4m) and is included in operating lease rental income in note 4. The Group also earns revenue from the rental of rental tools, which are items of property, plant and equipment, as disclosed in note 12. Rental revenue earned during the year was $14.2m (2019 – $31.4m) as shown in note 3.
The table below shows the maturity analysis of the undiscounted future lease payments expected to be received in relation to non-cancellable operating leases are:
Property2020
$m
Property2019
$m
Year one 1.6 1.1Year two 1.3 1.0Year three 0.5 0.6Year four 0.4 –Year five 0.1 –Total lease income receivable 3.9 2.7
25. Borrowings
2020$m
2019$m
Non-current:Shareholder loan from non-controlling interest 3.9 3.9 Current:Bank overdrafts secured 1.2 1.6
Total borrowings 5.1 5.5
In accordance with the Group’s committed bank facility, security has been granted over certain property, plant and equipment, receivables and inventory. The carrying amounts of the assets pledged as security are disclosed in notes 12, 18 and 20.
The shareholder loan from a non-controlling interest and the bank overdrafts are all denominated in US dollars.
Notes to the Consolidated Financial Statementscontinued
166Hunting PLC Annual Report and Accounts 2020

26. Changes in Net Cash (Debt)
Hunting operates a centralised treasury function that manages all cash and loan positions throughout the Group and ensures funds are used efficiently through the use of cash concentration account structures and other such measures. Total cash and bank balance is a non-GAAP measure and is a key metric for management and for the Group treasury function, which monitors this balance on a daily basis and reviews weekly forecasts to ensure the business has sufficient liquidity to meet business requirements and to determine if the Group will need to draw down on its RCF. As the Group manages funding on a total cash and bank basis, internal reporting focuses on changes in total cash and bank and this is presented in the Strategic Report. The net cash (debt) reconciliation below provides an analysis of the movement in the year for each component of net debt split between cash and non-cash items. Net cash (debt) comprises cash and cash equivalents (analysed in note 21) less bank overdrafts, total lease liabilities, unsecured bank loans and the shareholder loan from a non-controlling interest.
At 1 January
2020 $m
Cash flow $m
Non-cash movements
on leaseliabilitiesi
$m
Exchange movements
$m
At 31 December
2020 $m
Cash and cash equivalents (note 21) 128.6 (29.2) – 3.5 102.9Bank overdrafts (note 25) (1.6) 0.4 – – (1.2)Cash and cash equivalents – per cash flow statement 127.0 (28.8) – 3.5 101.7
Total lease liabilities (note 24) (45.2) 10.4 (4.7) (0.8) (40.3)Shareholder loan from non-controlling interest (note 25) (3.9) – – – (3.9)Liabilities arising from financing activities (49.1) 10.4 (4.7) (0.8) (44.2)Total net cash (debt) 77.9 (18.4) (4.7) 2.7 57.5
Analysed between:Total cash and bank 127.0 (28.8) – 3.5 101.7Total lease liabilities (45.2) 10.4 (4.7) (0.8) (40.3)Shareholder loans from non-controlling interests (3.9) – – – (3.9)Total net cash (debt) 77.9 (18.4) (4.7) 2.7 57.5
i. Non-cash movements on lease liabilities comprise new leases of $1.9m, interest expense of $1.9m and new leases from the acquisition of Enpro of $0.3m and lease modifications of $0.6m.
During the year, $0.5m of loan facility fees were amortised.
At 1 January
2019 $m
Adoption of IFRS 16
$m
At 1 January
2019 amended
$mCash flow
$m
Non-cash movements
on leaseliabilitiesi
$m
Exchange movements
$m
At 31 December
2019 $m
Cash and cash equivalents (note 21) 67.9 – 67.9 58.3 – 2.4 128.6Bank overdrafts (note 25) (1.8) – (1.8) 0.2 – – (1.6)Cash and cash equivalents – per cash flow statement 66.1 – 66.1 58.5 – 2.4 127.0
Total lease liabilities (note 24) – (49.0) (49.0) 10.6 (5.9) (0.9) (45.2)Unsecured bank loans (note 25) (0.9) – (0.9) 0.9 – – –Shareholder loan from non-controlling interest (note 25) (3.9) – (3.9) – – – (3.9)Liabilities arising from financing activities (4.8) (49.0) (53.8) 11.5 (5.9) (0.9) (49.1)Total net cash (debt) 61.3 (49.0) 12.3 70.0 (5.9) 1.5 77.9
Analysed between:Total cash and bank 65.2 – 65.2 59.4 – 2.4 127.0Total lease liabilities – (49.0) (49.0) 10.6 (5.9) (0.9) (45.2)Shareholder loans from non-controlling interests (3.9) – (3.9) – – – (3.9)Total net cash (debt) 61.3 (49.0) 12.3 70.0 (5.9) 1.5 77.9
i. Non-cash movements on lease liabilities comprise new leases of $3.4m, interest expense of $2.2m and lease modifications of $0.3m.
During 2019, $0.4m of loan facility fees were paid and $0.4m were amortised.
167Hunting PLC Annual Report and Accounts 2020
Purpose and C
ultureB
usiness Model and S
takeholdersB
usiness Strategy
Perform
anceG
overnanceFin
ancial Statem
ents

27. Provisions
Asset decommissioning
$mOther
$mTotal
$m
At 1 January 2020 5.1 3.3 8.4Exchange adjustments – 0.1 0.1Charged to the consolidated income statement 0.1 0.8 0.9Provisions utilised (0.4) (0.1) (0.5)Unutilised amounts reversed (0.2) (0.6) (0.8)Unwinding of discount 0.1 – 0.1Remeasurement 0.7 – 0.7At 31 December 2020 5.4 3.5 8.9
Provisions are due as follows:
2020 $m
2019 $m
Current 2.9 3.2Non-current 6.0 5.2 8.9 8.4
Asset decommissioning and remediation obligations of $5.4m (2019 – $5.1m) relate to the Group’s obligation to dismantle and remove items of property, plant and equipment. The asset decommissioning provision reflects uncertainty in the timing and amounts of the costs expected to arise in meeting this obligation. Provision is made on a discounted basis, the vast majority of which is estimated to be utilised over a period of eight years. Other provisions include provisions for onerous contracts of $0.4m (2019 – $nil), restructuring of $0.6m (2019 – $0.9m), provision for a pension fund for officers and ratings in the mercantile marine industry from a legacy subsidiary of $1.0m (2019 – $1.0m), warranties and tax indemnities of $0.9m (2019 – $0.9m) and $0.6m (2019 – $0.5m) for various other items.
28. Derivatives and Hedging
(a) Currency DerivativesThe Group uses derivatives for economic hedging purposes and no speculative positions are entered into by the Group. However, where derivatives do not meet the hedge accounting criteria, they are classified as “held for trading” for accounting purposes and are accounted for at fair value through profit or loss. The Group has used spot and forward foreign exchange contracts to hedge its exposure to exchange rate movements during the year. Currency exposure in the Group’s treasury function is managed by using funding swaps to convert US dollars into different currencies required by the Group’s entities, when required.
Fair values of outstanding derivative financial instruments:
2020 2019
Total assets
$m
Totalliabilities
$m
Total assets
$m
Total liabilities
$m
Forward foreign exchange contracts – in a cash flow hedge – – 0.1 –Forward foreign exchange contracts – not in a hedge – – 0.2 (0.1)Foreign currency swaps – in a net investment hedge – – – (0.2)Foreign currency swaps – not in a hedge 0.1 (0.6) – (0.9)Total 0.1 (0.6) 0.3 (1.2)
Gains on contracts that are not designated in a hedge relationship of $0.5m (2019 – $0.2m) were recognised in the consolidated income statement during the year.
(b) Fair Value HedgeForward foreign exchange contracts have also been designated in a fair value hedge to hedge the foreign exchange movement in foreign currency trade payables during the year. The value of the forward foreign exchange contract matches the value of the trade payables and they move in opposite directions as a result of movements in the CAD/USD exchange rate, being the hedged risk. Immaterial fair value gains have been recognised in the consolidated income statement during the year. At the year-end, the fair value of derivatives designated in a fair value hedge is immaterial.
Notes to the Consolidated Financial Statementscontinued
168Hunting PLC Annual Report and Accounts 2020

28. Derivatives and Hedging continued
(c) Cash Flow HedgeThe Group has entered into contracts to purchase materials from suppliers in a currency other than the Group’s subsidiary’s functional currency. Certain of these highly probable forecast transactions have been designated in a cash flow hedge relationship and hedged using forward foreign exchange contracts during the year. The value of the forward foreign exchange contract matches the value of the forecast inventory purchase and they move in opposite directions as a result of movements in the CAD/USD and the CNY/USD exchange rates, being the hedged risk. This will effectively result in recognising inventory at the fixed foreign currency rate for the hedged purchases. It is anticipated that the materials will be sold within 12 months after purchase, at which time the amount deferred in equity will be reclassified to profit or loss as part of the cost of inventories sold.
The Group’s cash flow hedge reserve, which is disclosed as part of other components of equity in note 34, relates to the spot component of forward foreign exchange contracts. The balance on the cash flow hedge at the year end is <$0.1m and the movements during the year were also <$0.1m.
The effects of outstanding forward foreign exchange contracts on the Group’s financial position and performance are as follows:
2020 2019
Carrying amount of the forward foreign exchange contracts – other receivables (note 18) $m <0.1 0.1Notional amount of the forward foreign exchange contracts $m 0.7 8.5Maturity date 04.03.21 03.01.20 to
08.05.20Hedge ratioi 1:1 1:1Change in value of hedged item used to determine hedge effectiveness $m <(0.1) (0.1)
i. The forward foreign exchange contracts are denominated in the same currency as the highly probable forecast transactions to match the exposed currency risk, therefore the hedge ratio is 1:1.
Immaterial changes in the forward points, the differential between the forward rate and the market spot rate, have been recognised in the consolidated income statement during the year and previous year.
(d) Net Investment HedgeIn order to hedge the translation foreign currency risk arising on Canadian dollar denominated net assets, the Group entered into funding swaps that have maturities of up to three months. The fair value of the funding swaps and the value of the Canadian dollar denominated net assets move in the opposite direction as a result of movements in the USD/CAD exchange rate, being the hedged risk. There was no ineffectiveness in the net investment hedge. During the year, the Canadian dollar denominated net assets were dedesignated from the net investment hedge.
There were no outstanding funding swaps designated in a net investment hedge. The effects of the outstanding funding swap at 31 December 2019 on the Group’s financial position and performance was as follows:
2020 2019
Carrying amount of the foreign currency swap – other payables (note 22) $m – (0.2)Notional amount of the foreign currency swap $m – 14.9Maturity date – 31.01.20Hedge ratioi – 1:1Change in carrying amount of net assets as a result of foreign currency movements since inception, recognised in OCI
$m – 0.2
Change in value of hedged item used to determine hedge effectiveness $m – 0.2
i. The funding swap is denominated in the same currency as the Canadian dollar denominated net assets to match the exposed currency risk, therefore the hedge ratio is 1:1.
The balance relating to the net investment hedge in the currency translation reserve at the beginning of the year was a $0.1m gain (2019 – $0.9m) and the cumulative spot to spot movement of a $0.5m gain (2019 – $0.8m loss) was recognised during the year, resulting in a balance relating to the net investment hedge at the end of the year of a $0.6m gain (2019 – $0.1m).
169Hunting PLC Annual Report and Accounts 2020
Purpose and C
ultureB
usiness Model and S
takeholdersB
usiness Strategy
Perform
anceG
overnanceFin
ancial Statem
ents

28. Derivatives and Hedging continued
(e) Hedge EffectivenessHedge effectiveness is determined at the inception of the hedge relationship and through periodic prospective effectiveness assessments to ensure that an economic hedge relationship exists between the hedged item and the hedging instrument.
For hedges of foreign currency purchases, the Group enters into hedge relationships where the critical terms of the hedging instrument match exactly with the terms of the hedged item. The Group, therefore, performs a qualitative assessment of effectiveness. If changes in circumstances affect the terms of the hedged item such that the critical terms no longer match exactly with the critical terms of the forward foreign exchange contract, then the Group uses the hypothetical derivative method to assess effectiveness. Ineffectiveness may arise if there is a change in the timing of the forecast transaction from what was originally estimated or from a change in the US dollar amount charged and invoiced. A possible source of ineffectiveness is also a change in credit risk of either party to the derivative; however, any change in credit risk is not expected to be material.
For net investment hedges, the Group enters into hedge relationships where the value of the foreign currency swap matches exactly with the value of the loan. The Group, therefore, performs a qualitative assessment of effectiveness. Ineffectiveness will arise if the value of the foreign currency net assets falls below the value of the foreign currency swap prior to the maturity of the foreign currency swap. There was no ineffectiveness during 2019 or 2020.
29. Financial Instruments: Fair Values
Due to their short-term nature, the carrying value of investments, the loan note, contract assets, trade receivables, accrued revenue, other receivables, short-term deposits, cash and cash equivalents, trade payables, accruals, contingent consideration and other payables considered to be financial liabilities, bank overdrafts and other unsecured loans approximates their fair value. Drawdowns under the revolving credit facility are typically for periods of one month or less and, as a result, the carrying value and the fair value are considered to be the same.
The Group has lease liabilities of $40.3m (2019 – $45.2m) at the year-end, which are not measured at fair value, in the consolidated balance sheet. The fair value of these financial liabilities has not been disclosed as their fair value cannot be measured reliably as there is no active market for these financial instruments.
The following tables present the Group’s other financial assets and liabilities that are measured at fair value at the year-end and show the level in the fair value hierarchy in which the fair value measurements are categorised. There were no transfers between Level 1 and Level 2 during the year.
Fair value at 31 December
2020$m
Level 1$m
Level 2$m
Equity instruments at fair value through profit or lossListed equity investments and mutual funds 1.7 1.7 –Current derivatives held for tradingDerivative financial assets 0.1 – 0.1Derivative financial liabilities (0.6) – (0.6)
1.2 1.7 (0.5)
Fair value at 31 December
2019$m
Level 1$m
Level 2$m
Equity instruments at fair value through profit or lossListed equity investments and mutual funds 2.1 2.1 –Debt instruments at fair value through profit or lossMoney market funds 26.2 26.2 –Current derivatives held for tradingDerivative financial assets 0.2 – 0.2Derivative financial liabilities (1.0) – (1.0)Current derivatives in a hedgeDerivative financial assets 0.1 – 0.1Derivative financial liabilities (0.2) – (0.2)
27.4 28.3 (0.9)
The fair value hierarchy has the following levels:Level 1 – inputs are quoted prices (unadjusted) in active markets for identical assets or liabilities.Level 2 – inputs other than quoted prices included within Level 1 that are observable for the asset or liability.
Notes to the Consolidated Financial Statementscontinued
170Hunting PLC Annual Report and Accounts 2020

29. Financial Instruments: Fair Values continued
The fair value of forward foreign exchange contracts is determined by comparing the cash flows generated by the contract with the coterminous cash flows potentially available in the forward exchange market on the balance sheet date. The fair values of non-US dollar denominated financial instruments are translated into US dollars using the year-end exchange rate. The inputs used to determine the fair value of derivative financial instruments are inputs other than quoted prices that are observable and so the fair value measurement is categorised in Level 2 of the fair value hierarchy. Details of the fair value gains and losses recognised during the year on derivative contracts are given in note 28.
The fair value of money market funds and listed equities and mutual funds is based on their current bid prices in an active market, which is considered to be the most representative of fair value, at the balance sheet date. As the fair values are based on quoted market prices, the fair value measurements are categorised in Level 1 of the fair value hierarchy. The fair value gains of $0.1m (2019 – $0.6m) recognised on money market funds during the year and the gains on the listed equities and mutual funds of $nil (2019 – $0.3m) have been included in finance income (note 9).
The contingent consideration recognised on the acquisition of Enpro of $2.5m was estimated by calculating the present value of the future expected cash flows using the income approach and appropriate discount rates. The expected cash flows were based on probabilities of achieving a required threshold for an adjusted EBITDA measure (as defined in the purchase and sale agreement) in the 2020 financial year. The fair value calculated was a Level 3 measurement as per the fair value hierarchy as defined within IFRS 13 due to unobservable inputs used in the valuation. At 31 December 2020, the required EBITDA threshold was not achieved and the contingent consideration recognised on the acquisition was released. The remeasurement was recognised in the consolidated income statement as an exceptional credit to operating expenses (see note 6).
30. Financial Risk Management
The Group’s activities expose it to certain financial risks, namely market risk (including currency risk, fair value interest rate risk and cash flow interest rate risk), credit risk and liquidity risk. The Group’s risk management strategy seeks to mitigate potential adverse effects on its financial performance. As part of its strategy, both primary and derivative financial instruments are used to hedge certain risk exposures.
There are clearly defined objectives and principles for managing financial risk established by the Board of Directors, with policies, parameters and procedures covering the specific areas of funding, banking relationships, foreign currency and interest rate exposures and cash management. The Group’s treasury function is responsible for implementing the policies and providing a centralised service to the Group for funding, foreign exchange and interest rate management and counterparty risk management. It is also responsible for identifying, evaluating and hedging financial risks in close co-operation with the Group’s operating companies.
(a) Market Risk: Foreign Exchange RiskThe Group’s international base is exposed to foreign exchange risk from its investing, financing and operating activities, particularly in respect of Sterling, Canadian dollars, Singapore dollars and Chinese Yuan Renminbi. Foreign exchange risks arise from future transactions and cash flows, and from recognised monetary assets and liabilities that are not denominated in the functional currency of the Group’s local operations.
The Group’s material foreign exchange rates are:
Singapore dollar Chinese Yuan Sterling Canadian dollar
2020 2019 2020 2019 2020 2019 2020 2019
Average exchange rate to US dollars 1.38 1.36 6.90 6.91 0.78 0.78 1.34 1.33Year-end exchange rate to US dollars 1.32 1.34 6.54 6.97 0.73 0.75 1.27 1.30
(i) Transactional RiskThe exposure to exchange rate movements in significant future transactions and cash flows is hedged by using forward foreign exchange contracts. Certain forward foreign exchange contracts have been designated as hedging instruments of highly probable forecast transactions. Operating companies prepare quarterly rolling 12-month cash flow forecasts to enable working capital currency exposures to be identified. Exposures are also identified and hedged, if necessary, on an ad-hoc basis, such as when a purchase order in a foreign currency is placed. Currency exposures arise where the cash flows are not in the functional currency of the entity. Exposures arising from committed long-term projects beyond a 12-month period are also identified. The currency flows to be hedged are committed foreign currency transactions greater than $50,000 equivalent. Exposures of less than $50,000 equivalent will also be hedged but only where the underlying foreign currency cash flow is expected to occur 60 days or more from the point of entering into the transaction.
The table below shows the carrying values of the Group’s financial instruments at 31 December, including derivative financial instruments, on which exchange differences would potentially be recognised in the consolidated income statement in the following year. The table excludes derivatives designated in a cash flow hedge as fair value gains and losses arising on these are recognised in other comprehensive income.
171Hunting PLC Annual Report and Accounts 2020
Purpose and C
ultureB
usiness Model and S
takeholdersB
usiness Strategy
Perform
anceG
overnanceFin
ancial Statem
ents

30. Financial Risk Management continued
(a) Market Risk: Foreign Exchange Risk continued(i) Transactional Risk continued
At 31 December 2020
Currency of denomination
Sterling$m
US dollars$m
AED$m
SGD$m
MXN$m
AUD$m
Other currencies
$mTotal
$m
Functional currency of Group’s entities:Sterling – 0.1 – – – – – 0.1US dollars (3.3) – (1.4) (0.9) (0.6) 1.1 (1.2) (6.3)Canadian dollars – (0.6) – – – – – (0.6)Singapore dollars – 2.6 – – – – – 2.6Euro – 0.5 – – – – – 0.5Chinese CNY – 0.4 – – – – – 0.4
(3.3) 3.0 (1.4) (0.9) (0.6) 1.1 (1.2) (3.3)
The Sterling, US dollar, United Arab Emirates (“UAE”) Dirham (“AED”), Singapore dollar (“SGD”), Mexican Peso (“MXN”) and Australian dollar (“AUD”) denominated financial instruments consist of cash balances, trade and other receivables, accrued revenue, trade and other payables, accrued expenses, finance lease liabilities, provisions and intra-Group balances.
At 31 December 2019
Currency of denomination
Sterling$m
US dollars$m
AED$m
ChineseCNY
$mEuro
$mAUD
$m
Other currencies
$mTotal
$m
Functional currency of Group’s entities:Sterling – (5.0) – – (0.4) – 0.2 (5.2)US dollars (2.6) – (1.6) (1.0) (0.6) 1.3 (1.5) (6.0)Canadian dollars – (1.2) – – – – – (1.2)Singapore dollars – 2.7 – – – – – 2.7Euro (0.1) 0.8 – – – – – 0.7Chinese CNY – (0.6) – – – – – (0.6)
(2.7) (3.3) (1.6) (1.0) (1.0) 1.3 (1.3) (9.6)
The Sterling, US dollar, United Arab Emirates (“UAE”) Dirham (“AED”), Australian dollar (“AUD”) and Chinese Yuan Renminbi (“CNY”) denominated financial instruments consist of cash balances, trade and other receivables, accrued revenue, trade and other payables, accrued expenses, finance lease liabilities, provisions and intra-Group loans.
(ii) Translational RiskForeign exchange risk also arises from financial assets and liabilities not denominated in the functional currency of an entity’s operations and forward foreign exchange contracts are used to manage the exposure to changes in foreign exchange rates. Where appropriate, hedge accounting is applied to the forward foreign exchange contracts and the hedged item to remove any accounting mismatch.
Foreign exchange risk also arises from the Group’s investments in foreign operations. During the year, foreign currency swaps have been designated in a net investment hedge to hedge the foreign currency translation risk arising on a Canadian dollar denominated investment.
The foreign exchange exposure arising from the translation of its net investments in foreign operations into the Group’s presentation currency of US dollars has also previously been managed by designating any borrowings that are not US dollar denominated as a hedge of the net investment in foreign operations.
The foreign exchange exposure primarily arises from Sterling and Canadian dollar denominated net investments.
(b) Market Risk: Interest Rate RiskVariable interest rates on cash at bank, short-term deposits, overdrafts and borrowings expose the Group to cash flow interest rate risk and fixed interest rates on loans and short-term deposits expose the Group to fair value interest rate risk. The Group’s treasury function manages the Group’s exposure to interest rate risk and uses interest rate swaps and caps, when considered appropriate.
(c) Credit RiskThe Group’s credit risk arises from its cash at bank and in hand, money market funds, short-term deposits, investments, derivative financial instruments, the loan note, accrued revenue, outstanding trade receivables and contract assets.
At the year-end, the Group had credit risk exposure to a wide range of counterparties. Credit risk exposure is continually monitored and no individual exposure is considered to be significant in the context of the ordinary course of the Group’s activities whether through exposure to individual customers, specific industry sectors and/or regions.
Notes to the Consolidated Financial Statementscontinued
172Hunting PLC Annual Report and Accounts 2020
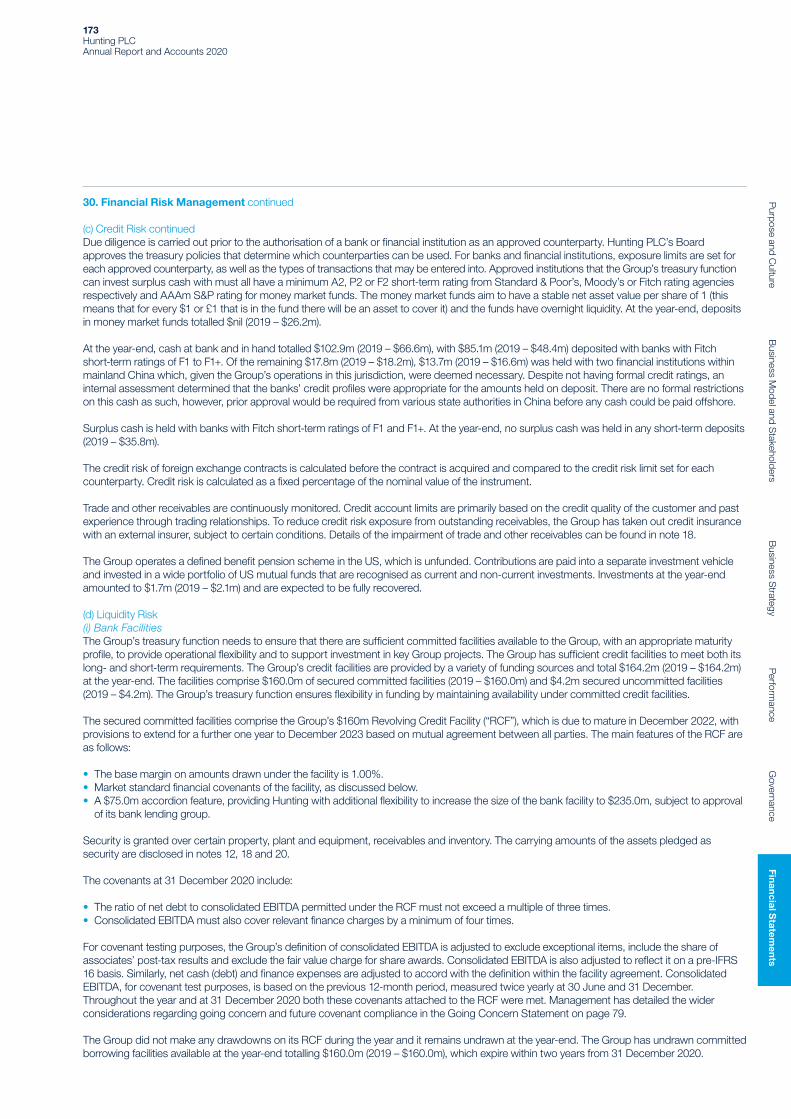
30. Financial Risk Management continued
(c) Credit Risk continued Due diligence is carried out prior to the authorisation of a bank or financial institution as an approved counterparty. Hunting PLC’s Board approves the treasury policies that determine which counterparties can be used. For banks and financial institutions, exposure limits are set for each approved counterparty, as well as the types of transactions that may be entered into. Approved institutions that the Group’s treasury function can invest surplus cash with must all have a minimum A2, P2 or F2 short-term rating from Standard & Poor’s, Moody’s or Fitch rating agencies respectively and AAAm S&P rating for money market funds. The money market funds aim to have a stable net asset value per share of 1 (this means that for every $1 or £1 that is in the fund there will be an asset to cover it) and the funds have overnight liquidity. At the year-end, deposits in money market funds totalled $nil (2019 – $26.2m).
At the year-end, cash at bank and in hand totalled $102.9m (2019 – $66.6m), with $85.1m (2019 – $48.4m) deposited with banks with Fitch short-term ratings of F1 to F1+. Of the remaining $17.8m (2019 – $18.2m), $13.7m (2019 – $16.6m) was held with two financial institutions within mainland China which, given the Group’s operations in this jurisdiction, were deemed necessary. Despite not having formal credit ratings, an internal assessment determined that the banks’ credit profiles were appropriate for the amounts held on deposit. There are no formal restrictions on this cash as such, however, prior approval would be required from various state authorities in China before any cash could be paid offshore.
Surplus cash is held with banks with Fitch short-term ratings of F1 and F1+. At the year-end, no surplus cash was held in any short-term deposits (2019 – $35.8m).
The credit risk of foreign exchange contracts is calculated before the contract is acquired and compared to the credit risk limit set for each counterparty. Credit risk is calculated as a fixed percentage of the nominal value of the instrument.
Trade and other receivables are continuously monitored. Credit account limits are primarily based on the credit quality of the customer and past experience through trading relationships. To reduce credit risk exposure from outstanding receivables, the Group has taken out credit insurance with an external insurer, subject to certain conditions. Details of the impairment of trade and other receivables can be found in note 18.
The Group operates a defined benefit pension scheme in the US, which is unfunded. Contributions are paid into a separate investment vehicle and invested in a wide portfolio of US mutual funds that are recognised as current and non-current investments. Investments at the year-end amounted to $1.7m (2019 – $2.1m) and are expected to be fully recovered.
(d) Liquidity Risk(i) Bank FacilitiesThe Group’s treasury function needs to ensure that there are sufficient committed facilities available to the Group, with an appropriate maturity profile, to provide operational flexibility and to support investment in key Group projects. The Group has sufficient credit facilities to meet both its long- and short-term requirements. The Group’s credit facilities are provided by a variety of funding sources and total $164.2m (2019 – $164.2m) at the year-end. The facilities comprise $160.0m of secured committed facilities (2019 – $160.0m) and $4.2m secured uncommitted facilities (2019 – $4.2m). The Group’s treasury function ensures flexibility in funding by maintaining availability under committed credit facilities.
The secured committed facilities comprise the Group’s $160m Revolving Credit Facility (“RCF”), which is due to mature in December 2022, with provisions to extend for a further one year to December 2023 based on mutual agreement between all parties. The main features of the RCF are as follows:
• The base margin on amounts drawn under the facility is 1.00%. • Market standard financial covenants of the facility, as discussed below. • A $75.0m accordion feature, providing Hunting with additional flexibility to increase the size of the bank facility to $235.0m, subject to approval of its bank lending group.
Security is granted over certain property, plant and equipment, receivables and inventory. The carrying amounts of the assets pledged as security are disclosed in notes 12, 18 and 20.
The covenants at 31 December 2020 include:
• The ratio of net debt to consolidated EBITDA permitted under the RCF must not exceed a multiple of three times. • Consolidated EBITDA must also cover relevant finance charges by a minimum of four times.
For covenant testing purposes, the Group’s definition of consolidated EBITDA is adjusted to exclude exceptional items, include the share of associates’ post-tax results and exclude the fair value charge for share awards. Consolidated EBITDA is also adjusted to reflect it on a pre-IFRS 16 basis. Similarly, net cash (debt) and finance expenses are adjusted to accord with the definition within the facility agreement. Consolidated EBITDA, for covenant test purposes, is based on the previous 12-month period, measured twice yearly at 30 June and 31 December. Throughout the year and at 31 December 2020 both these covenants attached to the RCF were met. Management has detailed the wider considerations regarding going concern and future covenant compliance in the Going Concern Statement on page 79.
The Group did not make any drawdowns on its RCF during the year and it remains undrawn at the year-end. The Group has undrawn committed borrowing facilities available at the year-end totalling $160.0m (2019 – $160.0m), which expire within two years from 31 December 2020.
173Hunting PLC Annual Report and Accounts 2020
Purpose and C
ultureB
usiness Model and S
takeholdersB
usiness Strategy
Perform
anceG
overnanceFin
ancial Statem
ents

30. Financial Risk Management continued
(d) Liquidity Risk continued(ii) Management of CashThe Group needs to ensure that it has sufficient liquid funds available to support its working capital and capital expenditure requirements and that adequate liquidity levels are maintained. All subsidiaries submit weekly and bi-monthly cash forecasts to the treasury function to enable it to monitor the Group’s requirements. A central cash forecast, produced weekly, is maintained by the Group’s treasury function, which monitors the availability of liquidity to meet long- and short-term business requirements and also any unexpected variances. The treasury function also ensures that the Group has a pool of cash available to protect the Group in a downturn, given the cyclical nature of the oil and gas sector.
The treasury function seeks to centralise surplus cash balances to ensure that funds are managed in the best interests of the Group, as detailed further below. Short-term cash balances, together with undrawn facilities, enable the treasury function to manage its day-to-day liquidity risk. Any short-term surplus is invested in accordance with treasury policy.
Short-term deposits and investments in money market funds are held for the purpose of meeting short-term cash commitments, minimising counterparty concentration risk and improving cash investment returns.
Short-term deposits of surplus cash are made for varying periods of between one day and three months, depending on the immediate cash requirements of the Group. These deposits earn interest at the respective short-term deposit rates.
The Group has invested surplus cash with money market funds as they are considered to be highly liquid since cash can be redeemed from each fund on a same day basis. The yield on the funds is calculated on the daily performance of the various instruments within a particular fund.
Cash at bank earns interest at floating rates based on daily bank deposit rates.
Barclays Composite Accounting System Certain UK subsidiaries in the Group are party to a cross-guarantee and set-off arrangement with Barclays Bank UK PLC. Each subsidiary that is a party to this arrangement is jointly and severally liable for any gross liability position held by any of the other companies’ party to the aforementioned arrangements in the event of default. Any gross liability limit cannot exceed a combined facility limit of $2.3m. As there is no legally enforceable right of set-off, there is no set-off in the presentation of cash balances held by the Group in the consolidated financial statements. The gross balances in the consolidated balance sheet at the year-end subject to this agreement are gross cash balances of $0.7m (2019 – $0.1m) and gross overdraft balances of $nil (2019 – $nil).
Cash Management ArrangementsTreasury’s cash management objective is to centrally manage and, where possible, to concentrate the Group’s cash and bank balances back to the treasury function. This strategy is subject to legislative and regulatory constraints in certain jurisdictions such as exchange control restrictions and minimum capital requirements. Where cash concentration cannot be applied, Group treasury approves all local banking arrangements, including the opening and closing of bank accounts and the investment of surplus cash via bank deposits.
In respect of the UK business units and head office companies, the treasury function has arranged a cash concentration structure with HSBC Bank UK whereby, at the close of each business day, any surplus balances held in certain subsidiaries’ bank accounts are swept to treasury-owned accounts (“pool header” accounts), with a corresponding adjustment to the intercompany loan receivable, or payable, between that subsidiary and treasury. Similarly, any end-of-day deficit in the same group of subsidiary accounts is funded by a cash sweep from the treasury-owned pool header accounts, and the corresponding intercompany loan is adjusted accordingly. This arrangement enables more efficient utilisation of UK-based entities’ surplus cash and at the same time allows the treasury function to meet any short-term funding needs of the UK business units in a more coordinated fashion and from one single pool of liquidity.
In addition, a similar cash concentration structure has been organised with Wells Fargo bank in the US, whereby surplus and deficit cash balances are swept to and from a single pool header account, held by one central US subsidiary, with a corresponding movement in the respective companies’ intercompany loan balance. Treasury has systems in place that allows for same day centralisation of net surplus cash balances in the US to the UK, or indeed to fund any net cash deficit in the US cash concentration structure. As above, this arrangement allows treasury to efficiently repatriate surplus operational cash from the US to the UK on a daily basis, if deemed cost effective to do so, and the most appropriate application of that cash can then be decided upon by treasury. This arrangement also allows treasury to meet any short-term funding needs of the Group’s US-based business units from cash resources held in, or borrowing facilities that have been arranged by, treasury in the UK.
For other regions, such as Canada and Singapore, while formal sweeping arrangements are not in place, treasury monitors balances on a daily basis and periodically transfers surplus cash to the centre using similar intercompany loan arrangements as described above. The Group’s interests in China are subject to the most highly regulated environment of all the Group’s active jurisdictions, in regards to cash management operations. The free movement of cash both to and from China is a highly restricted activity and, as a consequence, treasury is unable to arrange intercompany loans in the same way as it does for the rest of the Group. However, treasury has organised banking arrangements with HSBC in China on behalf of the Group’s Chinese business units and, therefore, has visibility of cash balances and transaction data via HSBC’s proprietary online banking system.
Notes to the Consolidated Financial Statementscontinued
174Hunting PLC Annual Report and Accounts 2020

30. Financial Risk Management continued
(d) Liquidity Risk continued (iii) Future Cash Flows of Financial LiabilitiesThe following tables analyse the expected timings of cash outflows for each of the Group’s non-derivative financial liabilities. The tables analyse the cash outflows into relevant maturity groupings based on the remaining period at the balance sheet date to the contractual maturity date of the financial liabilities. The amounts disclosed in the tables are the contractual, undiscounted cash flows and include interest cash flows and other contractual payments, where applicable, so will not always reconcile with the amounts disclosed in the consolidated balance sheet. The carrying values are the amounts in the consolidated balance sheet and are the discounted amounts. Balances due within one year have been included in the maturity analysis at their carrying amounts, as the impact of discounting is not significant.
2020
On demand or within one year
$m
Between one and
five years$m
After five years
$mTotal
$m
Carrying value
$m
Non-derivative financial liabilities:Trade payables 26.4 – – 26.4 26.4Accruals 29.0 0.4 – 29.4 29.4Other payables 1.5 – – 1.5 1.5Lease liabilities 10.0 26.8 7.1 43.9 40.3Secured bank loans 0.6 0.6 – 1.2 –Shareholder loan from non-controlling interest – – 3.9 3.9 3.9Bank overdrafts secured 1.2 – – 1.2 1.2Total 68.7 27.8 11.0 107.5 102.7
2019
On demand or within one year
$m
Between one and
five years$m
After five years
$mTotal
$m
Carrying value
$m
Non-derivative financial liabilities:Trade payables 56.3 – – 56.3 56.3Accruals 45.3 0.4 0.1 45.8 45.8Other payables 3.4 – – 3.4 3.4Lease liabilities 10.3 28.1 14.6 53.0 45.2Secured bank loans 0.6 1.1 – 1.7 –Shareholder loan from non-controlling interest – – 3.9 3.9 3.9Bank overdrafts secured 1.6 – – 1.6 1.6Total 117.5 29.6 18.6 165.7 156.2
The Group had no net settled financial liabilities at the year-end (2019 – none).
The table below analyses the Group’s derivative financial instruments, which will be settled on a gross basis, into maturity groupings based on the period remaining from the balance sheet date to the contractual maturity date. The amounts disclosed in the table are the contractual, undiscounted cash flows.
On demandor withinone year
2020$m
On demandor withinone year
2019$m
Currency derivatives – inflows 68.5 111.8– outflows (69.1) (112.7)
(e) Capital Risk ManagementThe Group’s objectives, policies and processes for managing capital are outlined in the Strategic Report within the Financial Capital Management section on pages 64 and 65. Within this section, the Group provides a definition of capital, provides details of the external financial covenants imposed, key measures for managing capital and the objectives for managing capital. Quantitative disclosures have been made together with the parameters for meeting external financial covenants.
175Hunting PLC Annual Report and Accounts 2020
Purpose and C
ultureB
usiness Model and S
takeholdersB
usiness Strategy
Perform
anceG
overnanceFin
ancial Statem
ents

31. Financial Instruments: Sensitivity Analysis
The following sensitivity analysis is intended to illustrate the sensitivity to changes in market variables on the Group’s financial instruments and show the impact on profit or loss and shareholders’ equity. Financial instruments affected by market risk include cash at bank and in hand, money market funds, short-term deposits, trade and other receivables, trade and other payables, lease liabilities, borrowings and derivative financial instruments. The sensitivity analysis relates to the position as at 31 December 2020. The analysis excludes the impact of movements in market variables on the carrying value of pension and other post-retirement obligations, provisions and non-financial assets and liabilities of foreign operations.
The following assumptions have been made in calculating the sensitivity analysis:
• Foreign exchange rate and interest rate sensitivities have an asymmetric impact on the Group’s results, that is, an increase in rates does not result in the same amount of movement as a decrease in rates;
• For floating rate assets and liabilities, the amount of asset or liability outstanding at the balance sheet date is assumed to be outstanding for the whole year;
• Fixed-rate financial instruments that are carried at amortised cost are not subject to interest rate risk for the purpose of this analysis; and • The carrying values of financial assets and liabilities carried at amortised cost do not change as interest rates change.
Positive figures represent an increase in profit or equity.
(a) Interest Rate SensitivityThe sensitivity rate of 0.1% (2019 – 0.25%) for US interest rates represents management’s assessment of a reasonably possible change, based on historical volatility and a review of analysts’ research and banks’ expectations of future interest rates.
The post-tax impact on the consolidated income statement, with all other variables held constant, at 31 December, for an increase or decrease of 0.1% (2019 – 0.25%) in US interest rates, is not material (2019 – not material). There is no impact on other comprehensive income (“OCI”) for a change in interest rates.
(b) Foreign Exchange Rate SensitivityThe sensitivity rates disclosed in the table below represent management’s assessment of a reasonably possible change, based on historical volatility and a review of analysts’ research and banks’ expectations of future foreign exchange rates.
The table below shows the post-tax impact for the year of a reasonably possible change in foreign exchange rates, with all other variables held constant, at 31 December.
2020 2019
Income statement
$mOCI$m
Income statement
$mOCI$m
Sterling exchange rate +10% (2019: +5%) (0.2) – (0.3) –Sterling exchange rate -10% (2019: -5%) 0.2 – 0.3 –Singapore dollar exchange rate +5% (2019: +5%) 0.1 – (0.2) –Singapore dollar exchange rate -5% (2019: -5%) (0.1) – 0.2 –Chinese Yuan Renminbi exchange rate +5% (2019: +2%) – – (0.1) (0.1)Chinese Yuan Renminbi exchange rate -5% (2019: -2%) – – 0.1 0.1Canadian dollar exchange rate +5% (2019: +5%) (0.1) – 0.1 –Canadian dollar exchange rate -5% (2019: -5%) 0.1 – (0.1) –
The movements in the consolidated income statement mainly arise from cash, intra-Group balances, trade and other receivables, trade and other payables, accrued expenses and provisions, where the functional currency of the entity is different to the currency that the monetary items are denominated in. The movements in OCI arise from foreign exchange contracts designated in a cash flow hedge.
The post-tax impact on the consolidated income statement of reasonably possible changes in the Singapore dollar, Euro, Australian dollar, UAE Dirham and Mexican Peso exchange rates were considered and were immaterial.
32. Post-employment Benefits
(a) Defined Contribution ArrangementsA number of defined contribution (“DC”) arrangements, which are open to current employees, are operated across the Group. Employer contributions to these arrangements are charged directly to profit and loss and in 2020 these totalled $7.4m (2019 – $8.7m).
(b) Unfunded Defined Benefit SchemeThe Group operates a cash balance arrangement in the US for certain executives. Members build up benefits in this arrangement by way of notional contributions and notional investment returns. Actual contributions are paid into an entirely separate investment vehicle held by the Group, which is used to pay benefits due from the arrangement when a member retires. Under IAS 19, the cash balance arrangement is accounted for as an unfunded defined benefit scheme.
Notes to the Consolidated Financial Statementscontinued
176Hunting PLC Annual Report and Accounts 2020

32. Post-employment Benefits continued
(b) Unfunded Defined Benefit Scheme continuedThe amounts recognised in the consolidated income statement during the year were $0.1m (2019 – $0.1m) for the employer’s current service cost (recognised in operating expenses), $nil (2019 – $0.1m) interest expense on the benefit obligations and $nil (2019 – $0.3m) fair value gains on the listed equities and mutual funds (recognised in net finance expense).
Movements in the present value of the obligation for the unfunded defined benefit US deferred compensation plan
2020$m
2019$m
Present value of the obligation at the start of the year 2.1 1.7Current service cost (equal to the notional contributions) 0.1 0.1Interest on benefit obligations – 0.1Remeasurement – excess of notional investment returns over interest cost – 0.2Benefits paid (0.5) –Present value of the obligation at the end of the year 1.7 2.1
The obligation is presented in the consolidated balance sheet with $nil (2019 – $0.5m) in current payables and $1.7m (2019 – $1.6m) in non-current payables (note 22).
33. Share Capital and Share Premium
The Company’s share capital comprises a single class of Ordinary shares, which are classified as equity.
2020
Ordinary shares of 25p eachNumber
Ordinary shares of 25p each
$m
Share premium
$m
At 1 January 2020 166,940,082 67.3 153.0 Share buyback (2,000,000) (0.8) –At 31 December 2020 164,940,082 66.5 153.0
Hunting PLC commenced an on-market share buyback programme on 27 February 2020 to purchase up to 2.0m Ordinary shares of 25p each in the Company. Between 27 February and 19 March 2020, the Company purchased 2.0m Ordinary shares of 25p each at an average price of 228.43p, for a total of $5.1m, including costs of $0.1m. Shares purchased under the programme were cancelled and, as a result, have reduced the Company’s issued share capital. A capital redemption reserve of $0.6m has been created following the cancellation of the share capital (note 34).
There are no restrictions attached to any of the Ordinary shares in issue and all Ordinary shares carry equal voting rights. The rights attached to the Company’s Ordinary shares are summarised on page 211. All of the Ordinary shares in issue are fully paid.
At 31 December 2020, 2,562,281 (2019 – 1,609,150) Ordinary shares were held by an Employee Benefit Trust. Details of the carrying amount are set out in note 35.
2019
Ordinary shares of 25p eachNumber
Ordinary shares of 25p each
$m
Share premium
$m
At 1 January 2019 165,073,603 66.7 153.0Shares issued – share option schemes and awards 1,866,479 0.6 – At 31 December 2019 166,940,082 67.3 153.0
177Hunting PLC Annual Report and Accounts 2020
Purpose and C
ultureB
usiness Model and S
takeholdersB
usiness Strategy
Perform
anceG
overnanceFin
ancial Statem
ents

34. Other Components of Equity
2020
Merger reserve
$m
Share-based payments
reserve$m
Capital redemption
reserve$m
Currency translation
reserve$m
Total$m
At 1 January 2020 46.4 19.7 0.2 (9.8) 56.5Exchange adjustments – – – 5.4 5.4Fair value gains and losses– gains originating on net investment hedges arising
during the year net of tax – – – 0.4 0.4Share buyback (note 33) – – 0.6 – 0.6Share options and awards– value of employee services – 9.0 – – 9.0– discharge – (11.4) – – (11.4)Transfer between reserves (8.2) – – – (8.2)At 31 December 2020 38.2 17.3 0.8 (4.0) 52.3
The merger reserve comprises the proceeds received, net of transaction costs, in excess of the nominal value of the Ordinary shares issued by way of the share placing completed on 31 October 2016. In accordance with section 612 of the Companies Act 2006, the premium was credited to the merger reserve, instead of to the share premium account, because the share placing was pursuant to the Company securing over 90% of another entity. The proceeds were used to pay down the Group’s borrowings at that time.
The reserve is currently non-distributable and is transferred to distributable retained earnings when the proceeds meet the definition of a qualifying consideration. During the year, $8.2m (2019 – $20.8m) was transferred from the merger reserve to retained earnings. This portion of the reserve was considered to be realised, as the equivalent amount of the proceeds from the share placing in 2016 have now met the definition of qualifying consideration.
2019
Merger reserve
$m
Share-based payments
reserve$m
Capital redemption
reserve$m
Currency translation
reserve$m
Total$m
At 1 January 2019 67.2 22.3 0.2 (13.9) 75.8Exchange adjustments – – – 5.0 5.0Release of foreign exchange on liquidation of subsidiaries net of tax – – – (0.2) (0.2)Fair value gains and losses– losses originating on net investment hedges arising
during the year net of tax – – – (0.7) (0.7)Share options and awards– value of employee services – 9.0 – – 9.0– discharge – (11.6) – – (11.6)Transfer between reserves (20.8) – – – (20.8)At 31 December 2019 46.4 19.7 0.2 (9.8) 56.5
Notes to the Consolidated Financial Statementscontinued
178Hunting PLC Annual Report and Accounts 2020
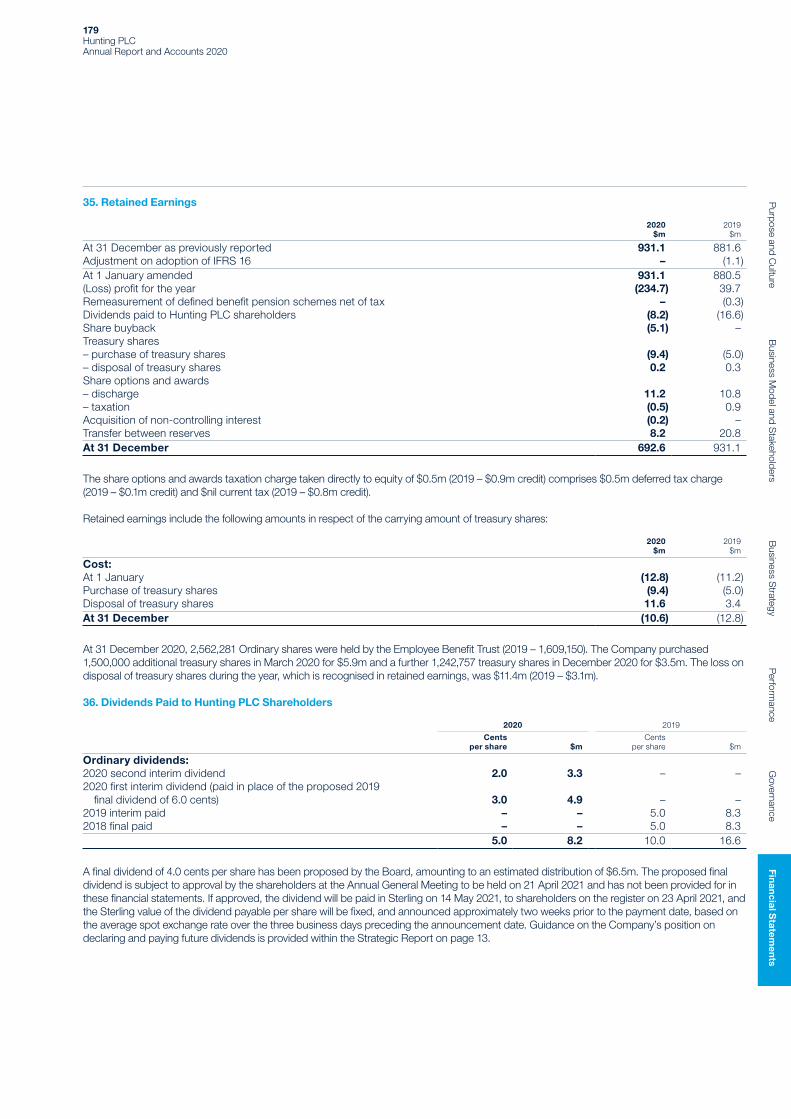
35. Retained Earnings
2020$m
2019$m
At 31 December as previously reported 931.1 881.6Adjustment on adoption of IFRS 16 – (1.1)At 1 January amended 931.1 880.5(Loss) profit for the year (234.7) 39.7Remeasurement of defined benefit pension schemes net of tax – (0.3)Dividends paid to Hunting PLC shareholders (8.2) (16.6)Share buyback (5.1) –Treasury shares– purchase of treasury shares (9.4) (5.0)– disposal of treasury shares 0.2 0.3Share options and awards– discharge 11.2 10.8– taxation (0.5) 0.9Acquisition of non-controlling interest (0.2) –Transfer between reserves 8.2 20.8At 31 December 692.6 931.1
The share options and awards taxation charge taken directly to equity of $0.5m (2019 – $0.9m credit) comprises $0.5m deferred tax charge (2019 – $0.1m credit) and $nil current tax (2019 – $0.8m credit).
Retained earnings include the following amounts in respect of the carrying amount of treasury shares:
2020$m
2019$m
Cost:At 1 January (12.8) (11.2)Purchase of treasury shares (9.4) (5.0)Disposal of treasury shares 11.6 3.4At 31 December (10.6) (12.8)
At 31 December 2020, 2,562,281 Ordinary shares were held by the Employee Benefit Trust (2019 – 1,609,150). The Company purchased 1,500,000 additional treasury shares in March 2020 for $5.9m and a further 1,242,757 treasury shares in December 2020 for $3.5m. The loss on disposal of treasury shares during the year, which is recognised in retained earnings, was $11.4m (2019 – $3.1m).
36. Dividends Paid to Hunting PLC Shareholders
2020 2019
Cents per share $m
Cents per share $m
Ordinary dividends:2020 second interim dividend 2.0 3.3 – –2020 first interim dividend (paid in place of the proposed 2019 final dividend of 6.0 cents) 3.0 4.9 – –2019 interim paid – – 5.0 8.32018 final paid – – 5.0 8.3
5.0 8.2 10.0 16.6
A final dividend of 4.0 cents per share has been proposed by the Board, amounting to an estimated distribution of $6.5m. The proposed final dividend is subject to approval by the shareholders at the Annual General Meeting to be held on 21 April 2021 and has not been provided for in these financial statements. If approved, the dividend will be paid in Sterling on 14 May 2021, to shareholders on the register on 23 April 2021, and the Sterling value of the dividend payable per share will be fixed, and announced approximately two weeks prior to the payment date, based on the average spot exchange rate over the three business days preceding the announcement date. Guidance on the Company’s position on declaring and paying future dividends is provided within the Strategic Report on page 13.
179Hunting PLC Annual Report and Accounts 2020
Purpose and C
ultureB
usiness Model and S
takeholdersB
usiness Strategy
Perform
anceG
overnanceFin
ancial Statem
ents

37. Share-based Payments
(a) 2009 Performance Share Plan (“PSP”)(i) Performance-based Awards and OptionsThe Company granted nil-cost performance-based share awards and options under the PSP between 2009 and 2013. Annual conditional awards were made to executive Directors and senior employees. Awards were subject to performance conditions during the vesting period. The PSP was replaced by the 2014 Hunting Performance Share Plan following shareholder approval at the Annual General Meeting (“AGM”) of the Company on 16 April 2014. The final grant under the PSP occurred in 2013, with the final measurements of the performance conditions being completed in 2016. There are no outstanding performance-based awards and the fair value charge to the consolidated income statement was $nil (2019 – $nil).
(ii) Time-based Awards and OptionsThe Company granted nil-cost, time-based share awards and options under the PSP between 2009 and 2013. Annual awards were made to employees, subject to continued employment during the vesting period. There were no performance conditions attached. The final grant under the PSP occurred in 2013 and vested in 2016 and option holders had seven years in which to exercise their vested awards. Details of the time-based share option movements during the year are as follows:
2020Number of
shares
2019Number of
shares
Outstanding at the beginning of the year 3,601 7,004Vested and exercised during the year – (1,947)Lapsed during the year – (1,456)Outstanding and exercisable at the end of the year 3,601 3,601
The weighted average share price at the date of exercise during 2020 was nil (2019 – 569.1 pence).
Share awards can only be exercised by the employees to whom they were granted.
Details of the time-based PSP awards and options outstanding at 31 December 2020 are as follows:
2020Number of
shares
2019Number of
sharesNormal
vesting date
Date of grant:25 February 2011 875 875 25.02.1417 April 2012 1,725 1,725 17.04.1520 March 2013 1,001 1,001 20.03.16Outstanding and exercisable at the end of the year 3,601 3,601
The fair value charge to the consolidated income statement attributable to the time-based PSP is $nil (2019 – $nil).
(b) 2014 Hunting Performance Share Plan (“HPSP”)(i) Performance-based AwardsThe Company grants performance-based share awards annually to executive Directors and senior employees under the HPSP. Awards are granted at nil cost under the HPSP. The performance-based HPSP awards to the executive Directors and senior employees are divided into four tranches of differing proportions. Each tranche is subject to a three-year vesting period and Company performance is measured against (i) the TSR of a bespoke comparator group, (ii) underlying diluted earnings per share (“EPS”), (iii) underlying Return on Capital Employed (“ROCE”), and (iv) a Balanced Scorecard, comprising of non-financial KPIs including Quality and Safety performance. The 2020 award weightings are EPS 25%; TSR 25%; ROCE 35% and the Balanced Scorecard 15%. The performance period for the 2020 awards granted under the HPSP is 1 January 2020 to 31 December 2022. The vesting date of the 2020 award is 3 March 2023.
Details of the performance-based HPSP awards movements during the year are set out below:
2020Number of
shares
2019Number of
shares
Outstanding at the beginning of the year 3,365,222 3,372,764Granted during the year to executive Directors 835,737 541,708Granted during the year to senior employees 1,417,204 835,464Vested and exercised during the year (586,869) (977,588)Lapsed during the year (643,799) (407,126)Outstanding at the end of the year 4,387,495 3,365,222
Notes to the Consolidated Financial Statementscontinued
180Hunting PLC Annual Report and Accounts 2020
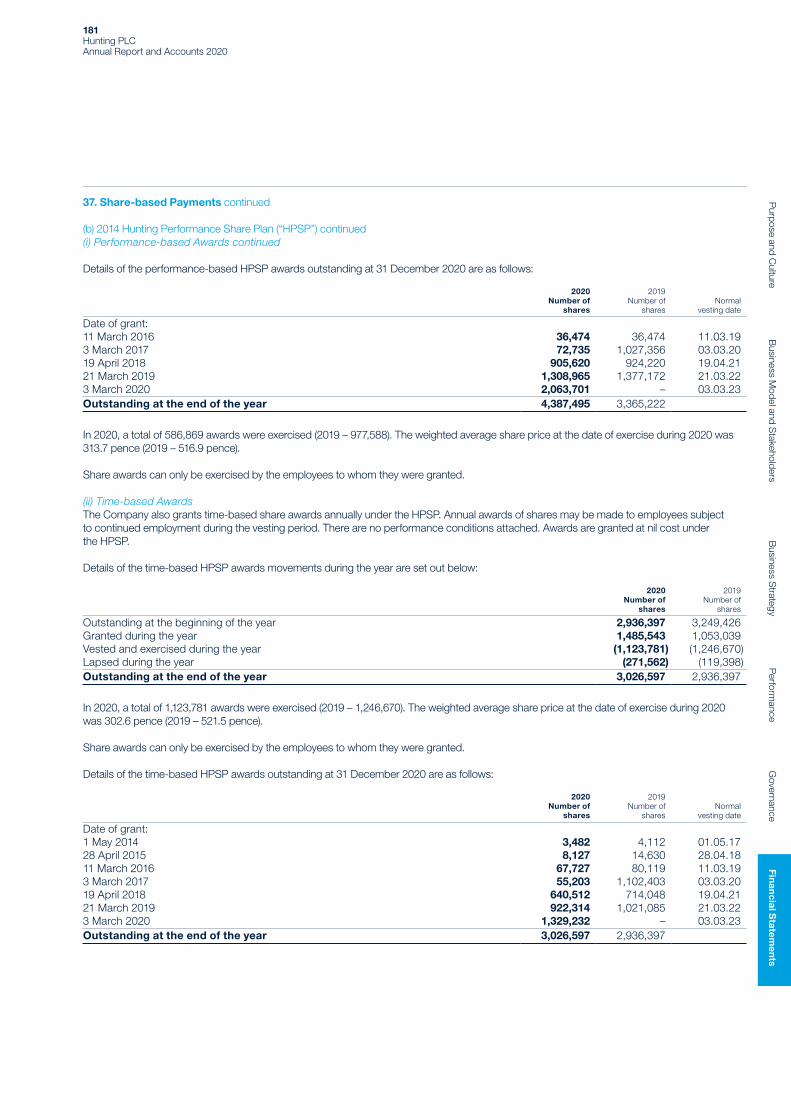
37. Share-based Payments continued
(b) 2014 Hunting Performance Share Plan (“HPSP”) continued(i) Performance-based Awards continued
Details of the performance-based HPSP awards outstanding at 31 December 2020 are as follows:
2020Number of
shares
2019Number of
sharesNormal
vesting date
Date of grant:11 March 2016 36,474 36,474 11.03.193 March 2017 72,735 1,027,356 03.03.2019 April 2018 905,620 924,220 19.04.2121 March 2019 1,308,965 1,377,172 21.03.223 March 2020 2,063,701 – 03.03.23Outstanding at the end of the year 4,387,495 3,365,222
In 2020, a total of 586,869 awards were exercised (2019 – 977,588). The weighted average share price at the date of exercise during 2020 was 313.7 pence (2019 – 516.9 pence).
Share awards can only be exercised by the employees to whom they were granted.
(ii) Time-based AwardsThe Company also grants time-based share awards annually under the HPSP. Annual awards of shares may be made to employees subject to continued employment during the vesting period. There are no performance conditions attached. Awards are granted at nil cost under the HPSP.
Details of the time-based HPSP awards movements during the year are set out below:
2020Number of
shares
2019Number of
shares
Outstanding at the beginning of the year 2,936,397 3,249,426Granted during the year 1,485,543 1,053,039Vested and exercised during the year (1,123,781) (1,246,670)Lapsed during the year (271,562) (119,398)Outstanding at the end of the year 3,026,597 2,936,397
In 2020, a total of 1,123,781 awards were exercised (2019 – 1,246,670). The weighted average share price at the date of exercise during 2020 was 302.6 pence (2019 – 521.5 pence).
Share awards can only be exercised by the employees to whom they were granted.
Details of the time-based HPSP awards outstanding at 31 December 2020 are as follows:
2020Number of
shares
2019Number of
sharesNormal
vesting date
Date of grant:1 May 2014 3,482 4,112 01.05.1728 April 2015 8,127 14,630 28.04.1811 March 2016 67,727 80,119 11.03.193 March 2017 55,203 1,102,403 03.03.2019 April 2018 640,512 714,048 19.04.2121 March 2019 922,314 1,021,085 21.03.223 March 2020 1,329,232 – 03.03.23Outstanding at the end of the year 3,026,597 2,936,397
181Hunting PLC Annual Report and Accounts 2020
Purpose and C
ultureB
usiness Model and S
takeholdersB
usiness Strategy
Perform
anceG
overnanceFin
ancial Statem
ents
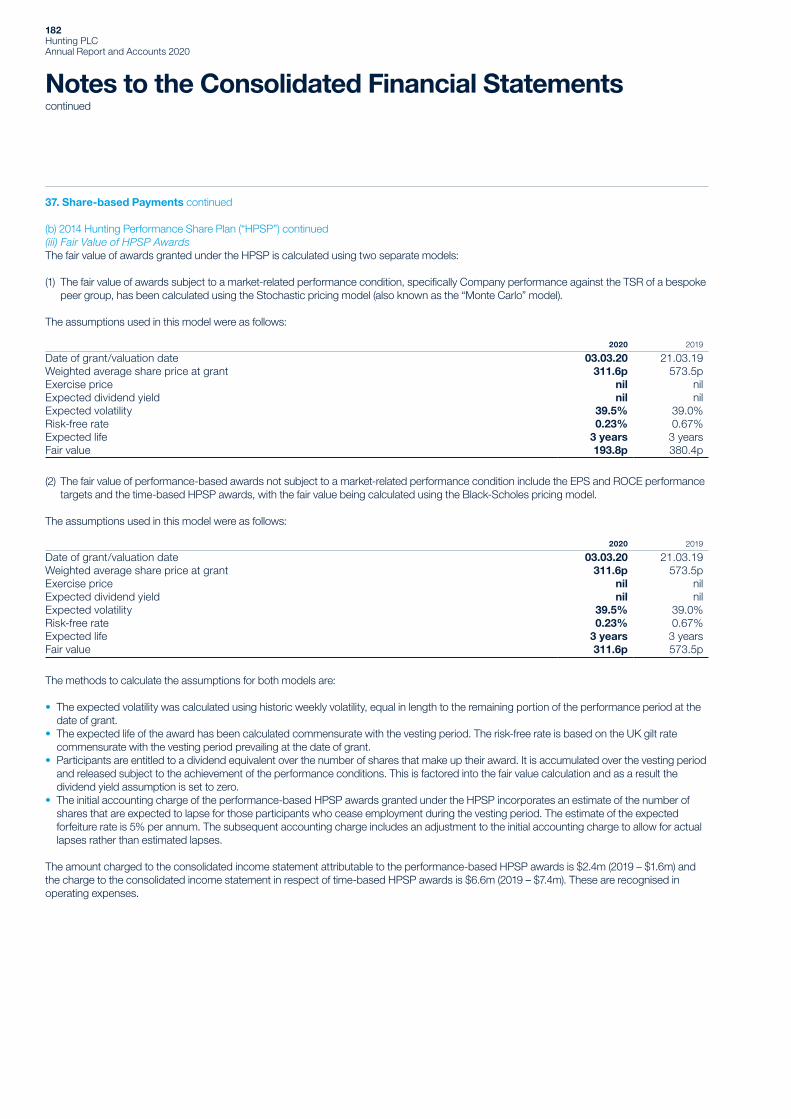
37. Share-based Payments continued
(b) 2014 Hunting Performance Share Plan (“HPSP”) continued (iii) Fair Value of HPSP AwardsThe fair value of awards granted under the HPSP is calculated using two separate models:
(1) The fair value of awards subject to a market-related performance condition, specifically Company performance against the TSR of a bespoke peer group, has been calculated using the Stochastic pricing model (also known as the “Monte Carlo” model).
The assumptions used in this model were as follows:
2020 2019
Date of grant/valuation date 03.03.20 21.03.19Weighted average share price at grant 311.6p 573.5pExercise price nil nilExpected dividend yield nil nilExpected volatility 39.5% 39.0%Risk-free rate 0.23% 0.67%Expected life 3 years 3 yearsFair value 193.8p 380.4p
(2) The fair value of performance-based awards not subject to a market-related performance condition include the EPS and ROCE performance targets and the time-based HPSP awards, with the fair value being calculated using the Black-Scholes pricing model.
The assumptions used in this model were as follows:
2020 2019
Date of grant/valuation date 03.03.20 21.03.19Weighted average share price at grant 311.6p 573.5pExercise price nil nilExpected dividend yield nil nilExpected volatility 39.5% 39.0%Risk-free rate 0.23% 0.67%Expected life 3 years 3 yearsFair value 311.6p 573.5p
The methods to calculate the assumptions for both models are:
• The expected volatility was calculated using historic weekly volatility, equal in length to the remaining portion of the performance period at the date of grant.
• The expected life of the award has been calculated commensurate with the vesting period. The risk-free rate is based on the UK gilt rate commensurate with the vesting period prevailing at the date of grant.
• Participants are entitled to a dividend equivalent over the number of shares that make up their award. It is accumulated over the vesting period and released subject to the achievement of the performance conditions. This is factored into the fair value calculation and as a result the dividend yield assumption is set to zero.
• The initial accounting charge of the performance-based HPSP awards granted under the HPSP incorporates an estimate of the number of shares that are expected to lapse for those participants who cease employment during the vesting period. The estimate of the expected forfeiture rate is 5% per annum. The subsequent accounting charge includes an adjustment to the initial accounting charge to allow for actual lapses rather than estimated lapses.
The amount charged to the consolidated income statement attributable to the performance-based HPSP awards is $2.4m (2019 – $1.6m) and the charge to the consolidated income statement in respect of time-based HPSP awards is $6.6m (2019 – $7.4m). These are recognised in operating expenses.
Notes to the Consolidated Financial Statementscontinued
182Hunting PLC Annual Report and Accounts 2020

37. Share-based Payments continued
(c) Cash Conditional Share AwardsThe Company also grants Cash Conditional Awards annually to employees in certain overseas tax jurisdictions. These awards are aligned with the rules of the HPSP and are subject to employees continued employment during the vesting period. Awards are granted at nil cost and are settled at the closing mid-market price of a Hunting PLC ordinary share on the third anniversary of the date of grant.
(i) Performance-based Awards Details of the cash conditional performance-based award movements during the year are set out below:
2020Number of
shares
2019Number of
shares
Outstanding at the beginning of the year – –Granted during the year 165,243 –Outstanding at the end of the year 165,243 –
Details of the cash conditional performance-based awards outstanding at 31 December 2020 are as follows:
2020Number of
shares
2019Number of
sharesNormal
vesting date
Date of grant:3 March 2020 165,243 – 03.03.23Outstanding at the end of the year 165,243 –
The charge to the consolidated income statement attributable to the cash conditional awards is <$0.1m (2019 – $nil).
The fair value of the cash conditional performance-based awards is calculated using the same assumptions and model as the fair value of performance-based awards subject to a market-related condition (see 37(b)(iii) above). The fair value of the award at 31 December 2020 was 223.0 pence (2019 – nil).
(ii) Time-based Awards
Details of the cash conditional time-based award movements during the year are set out below:
2020Number of
shares
2019Number of
shares
Outstanding at the beginning of the year 78,380 10,697Granted during the year 126,170 75,981Vested and exercised during the year (15,435) (745)Lapsed during the year (29,195) (7,553)Outstanding at the end of the year 159,920 78,380
The weighted average share price at the date of exercise during 2020 was 206.2 pence (2019 – 447.9 pence).
Details of the cash conditional time-based awards outstanding at 31 December 2020 are as follows:
2020Number of
shares
2019Number of
sharesNormal
vesting date
Date of grant:3 March 2017 – 4,575 03.03.2019 April 2018 6,017 6,122 19.04.2121 March 2019 49,460 67,683 21.03.223 March 2020 104,443 – 03.03.23Outstanding at the end of the year 159,920 78,380
The charge to the consolidated income statement attributable to the cash conditional awards is <$0.1m (2019 – $0.1m).
The fair value of the cash conditional awards is calculated using the same assumptions and model as the fair value of performance-based awards not subject to a market-related performance condition (see 37(b)(iii) above). The fair value of the award at 31 December 2020 was 223.0 pence (2019 – 417.4 pence).
183Hunting PLC Annual Report and Accounts 2020
Purpose and C
ultureB
usiness Model and S
takeholdersB
usiness Strategy
Perform
anceG
overnanceFin
ancial Statem
ents

37. Share-based Payments continued
(d) Amounts Included in the AccountsThe charge to the consolidated income statement attributable to the cash conditional share awards is <$0.1m (2019 – $0.1m) and the total charge attributable to the equity-settled awards is $9.0m (2019 – $9.0m). The total charge to the consolidated income statement for the year for share-based payments is $9.0m (2019 – $9.1m), see note 8. The total liability in relation to the cash-settled awards included in accruals at the year-end is $0.1m (2019 – $0.1m), of which $nil (2019 – $nil) related to awards that had vested.
38. Related-party Transactions
The following related-party transactions took place between wholly-owned subsidiaries of the Group and associates during the year:
2020$m
2019$m
Net loans to associates repaid – 0.3Dividends paid to non-controlling interests (0.9) –Year-end balances: Shareholder loan from non-controlling interest (3.9) (3.9)
The outstanding balances at the year-end are unsecured and have no fixed date for repayment. No expense was recognised in the year for bad or doubtful debts in respect of amounts owed by associates.
All ownership interests in associates are in the equity shares of those companies. The ownership interests in associates and subsidiaries are set out in notes C19 and C20 to the Company financial statements. On 8 March 2020, the Group acquired 5% of the share capital of Hunting Energy Saudi Arabia LLC from the non-controlling interest, thereby increasing its shareholding to 65%, for $nil consideration.
The key management of the Group comprises the Hunting PLC Board and members of the Executive Committee. Details of their compensation are disclosed in note 8. The Hunting PLC Directors and the members of the Executive Committee had no material transactions other than as a result of their service agreements.
Hunting PLC is the parent company of the Hunting PLC Group. The Company is listed on the London Stock Exchange, with none of the shareholders owning more than 20% of the issued share capital of the Company (see page 14). Accordingly, the Directors do not consider there to be an ultimate controlling party.
39. Acquisitions
Acquisition of Enpro Subsea Limited (“Enpro”)The Group acquired 100% of the share capital of Enpro Subsea Limited (“Enpro”) for a consideration of $38.3m, excluding costs, with an additional maximum earn-out of $3.0m agreed, subject to key financial milestones being met, on 21 February 2020. The total consideration of $40.8m comprised $38.0m cash paid in February 2020 (which included an estimate of $5.0m for cash in the business and therefore was $33.0m on a cash free/debt free basis), a further payment of $0.3m in April 2020 for adjustments specified in the agreement and $2.5m for contingent consideration. The cash consideration paid by the Group was, therefore, $32.8m, excluding cash acquired of $5.5m, as disclosed in the consolidated statement of cash flows.
An earn-out in the agreement entitles the former owners of Enpro to additional consideration of up to $3.0m if EBITDA targets are achieved in 2020. If the EBITDA is below a set value, as set out in the agreement, then no further payment is to be made. If EBITDA is between the lower and upper limits, as set out in the agreement, then a payment between $2.4m and $3.0m will be made. If EBITDA is above the upper limit, then the maximum payment to be made is $3.0m. Therefore, the potential undiscounted amount of all future payments that the Group could be required to make under this arrangement is between $nil and $3.0m. The fair value of the contingent consideration arrangement of $2.5m was estimated by calculating the present value of the future expected cash flows using the income approach and appropriate discount rates. The fair value is a Level 3 measurement as per the fair value hierarchy as defined within IFRS 13 due to unobservable inputs used in the valuation.
At 31 December 2020, the required EBITDA threshold was not achieved and the contingent consideration recognised at acquisition was released. The remeasurement was recognised in the consolidated income statement as an exceptional credit to operating expenses (see note 6).
Enpro was founded in 2011 and, since this time, has developed leading subsea production technology that has been adopted by offshore operators within the global oil and gas industry. Enpro’s products focus on delivering production-enhancing technologies and include FlowAccess Modules, Flow Intervention Services and Decommissioning. These products offer low-cost, flexible, field development solutions to clients including production and intervention modules to enhance recovery from oil and gas wells. The business has been classified as part of the US segment.
Acquisition-related costs of $1.4m were included in operating expenses as an exceptional item (note 6) in the consolidated income statement.
Notes to the Consolidated Financial Statementscontinued
184Hunting PLC Annual Report and Accounts 2020

39. Acquisitions continued
Details of the acquired net assets, goodwill and consideration are set out below:
Fair value$m
Property, plant and equipment 5.8Right-of-use assets 0.3Other intangible assets 19.2Cash and cash equivalents 5.5Inventories 0.7Trade and other receivables 5.2Trade and other payables (5.4)Lease liability (0.3)Deferred tax liabilities (4.0)Current tax assets 0.4Net assets acquired 27.4Goodwill 13.4Consideration 40.8
Goodwill on the acquisition of Enpro represents the value of the assembled workforce at the time of acquisition, specific knowledge and technical skills that will enhance Hunting’s products and services and the prospective future economic benefits expected to accrue from the portfolio of products and services to the Group’s customers and increased exposure to offshore operators. There is an opportunity to bring Enpro’s manufacturing in-house and utilise Hunting’s existing global manufacturing platform to commercialise further the technology across all of the Group’s key regional operating hubs. In addition, Hunting’s broad customer base offers significant opportunities to extend Enpro’s current market reach. The provisional amount of goodwill that is expected to be deductible for tax purposes is $nil.
Other intangible assets recognised on acquisition include the following:
Fair value$m
Customer relationships 7.6Patented technology 10.5Other 1.1Other intangible assets 19.2
The fair values of the other intangible assets were calculated using the income approach whereby the present values of the future expected cash flows were discounted using appropriate discount rates of between 10% and 13%.
The fair value of trade and other receivables is $5.2m and includes trade receivables with a fair value of $4.8m. The gross contractual amount for trade receivables due is $4.8m, all of which is expected to be collectable.
The pre-acquisition carrying value of inventories and the fair value at acquisition was $0.7m.
Enpro has contributed the following to the Group’s performance from 21 February 2020 to 31 December 2020:
Before amortisation
and exceptional items
$m
Amortisationand exceptional
items $m
Total$m
Revenue 10.3 – 10.3Loss from operations (0.2) (2.5) (2.7)Loss before tax – (2.5) (2.5)Loss for the year (0.2) (2.0) (2.2)
If Enpro had been acquired on 1 January 2020, the Group’s performance during 2020 would have been as follows:
Before amortisation
and exceptional items
$m
Amortisationand exceptional
items $m
Total$m
Revenue 11.1 – 11.1Loss from operations (0.2) (2.5) (2.7)Loss before tax (0.1) (2.5) (2.6)Loss for the year (0.3) (2.0) (2.3)
185Hunting PLC Annual Report and Accounts 2020
Purpose and C
ultureB
usiness Model and S
takeholdersB
usiness Strategy
Perform
anceG
overnanceFin
ancial Statem
ents

40. Disposals
On 15 December 2020, Rival Downhole Tools LC (“Rival”) acquired the operating assets of Hunting Energy Services (Drilling Tools) Inc, a wholly-owned subsidiary of the Group. In exchange for the assets, the Group acquired a 23.5% interest in the equity shares of Rival. The interest in Rival is accounted for as an associated company (see note 17).
The carrying value of the assets disposed of are given in the table below:
Carryingvalue
$m
Property, plant and equipment 14.7Inventories 1.7Trade receivables 1.0
17.4
41. Principal Accounting Policies
The Group’s principal accounting policies are described below:
(a) Consolidation • The Group financial statements include the results of the Company and its subsidiaries, together with its share of associates. • Subsidiaries are consolidated from the date on which control is transferred to the Group and are de-consolidated from the date control ceases.
• The Group uses the acquisition method of accounting for business combinations. Consequently, the consideration is determined as the fair value of the net assets transferred to the vendor and includes an estimate of any contingent consideration. The net assets acquired are also measured at their respective fair values for initial recognition purposes on the acquisition date.
• Acquisition-related costs are expensed to the consolidated income statement as incurred.
(b) Revenue(i) Revenue from Contracts with Customers • Revenue from contracts with customers is measured as the fair value of the consideration received or receivable for the provision of goods and services in the ordinary course of business, net of trade discounts, volume rebates, and sales taxes.
• Revenue is recognised when control of the promised goods or services is transferred to the customer. Consequently revenue for the sale of a product is recognised either:1. Wholly at a single point in time when the entity has completed its performance obligation, which is most commonly indicated by shipment
of the products or the products are made available to the customer for collection; or2. Piecemeal over time during the period that control incrementally transfers to the customer while the good is being manufactured or the
service is being performed. • Hunting’s activities that require revenue recognition over time comprise:1. Work undertaken to enhance customer-owned products – most commonly the lathing of a thread onto the ends of customer-owned
plain-end pipe;2. The manufacture of goods that are specifically designed for and restricted to the use of a particular customer, such as the manufacture of
bespoke specialised circuitry and housing, and for which Hunting is entitled to a measure of recompense that reflects the fair value of the stage of production prior to their completion; and
3. The provision of services in which the customer obtains the benefit while the service is being performed – most commonly the storage and management services of customer-owned pipe.
• Hunting’s activities that require revenue recognition at a point in time comprise:1. The sale of goods that are not specifically designed for use by one particular customer. These products include tubulars acquired by
Hunting as plain-end pipe on which lathing work has been applied and which are resold as threaded pipe; and2. The manufacture of goods that are specifically designed for one particular customer but for which Hunting is not entitled to a measure of
recompense that reflects the fair value of the stage of production prior to completion.
(ii) Rental Revenue • Rental revenue is measured as the fair value of the consideration received or receivable for the provision of rental equipment in the ordinary course of business, net of trade discounts and sales taxes.
• Revenue from the rental of plant and equipment is recognised as the income is earned.
(c) Other Income: Government Financial Assistance • Cash received in respect of the COVID-19 pandemic is recognised in the consolidated income statement when the funded costs are incurred and are included in other operating income.
Notes to the Consolidated Financial Statementscontinued
186Hunting PLC Annual Report and Accounts 2020

41. Principal Accounting Policies continued
(d) Amortisation and Exceptional Items • Exceptional items are items of income or expense that the Directors believe should be separately disclosed by virtue of their significant size or nature to enable a better understanding of the Group’s financial performance. The Group discloses such items in the “middle column” of the consolidated income statement.
• The tax effect of any transaction considered to be exceptional is also treated as exceptional. • Amortisation expenses for intangible assets arising on the acquisition of businesses are also shown in the “middle column” due to the significance of these amounts and to clearly identify the effect on profits, which will arise as current balances become fully written-off, or as new acquisitions give rise to new expenses. The post-acquisition profits of acquired businesses shown in the underlying column do not, therefore, reflect these costs.
(e) Interest • Interest income and expense is recognised in the consolidated income statement using the effective interest method.
(f) Foreign Currencies(i) Individual Subsidiaries’ and Associates’ Financial Statements • The financial statements for each of the Group’s subsidiaries and associates are denominated in their functional currency. • The functional currency is the currency of the primary economic environment in which the entity operates. • Transactions denominated in currencies other than the functional currency are translated into the functional currency at the exchange rate ruling at the date of the transaction.
• Monetary assets and liabilities, except borrowings designated as a hedging instrument in a net investment hedge, denominated in non-functional currencies are retranslated at the exchange rate ruling at the balance sheet date and exchange differences are taken to the consolidated income statement.
• Borrowings designated as a hedging instrument in a net investment hedge are retranslated at the exchange rate ruling at the balance sheet date and exchange differences are taken directly to equity.
(ii) Group Consolidated Financial Statements • The presentation currency of the Group is US dollars. • The net assets of non-US dollar denominated subsidiaries and associates are translated into US dollars at the exchange rates ruling at the balance sheet date.
• The income statements of subsidiaries and associates are translated into US dollars at the average rates of exchange for the year. • Exchange differences are recognised directly in equity in the currency translation reserve (“CTR”), together with exchange differences arising on foreign currency loans used to finance foreign currency net investments.
• Upon adoption of IFRS on 1 January 2004, accumulated exchange differences arising on consolidation prior to 31 December 2003 were reset to zero and the CTR recommenced under IFRS on 1 January 2004.
• The balance on the CTR represents the exchange differences arising on the retranslation of non-US dollar amounts into US dollars since 1 January 2004.
• On the disposal of a business, the cumulative exchange differences previously recognised in the CTR relating to that business are transferred to the consolidated income statement as part of the gain or loss on disposal.
(g) Taxation • The taxation recognised in the consolidated income statement comprises current tax and deferred tax arising on the current year’s result before tax and adjustments to tax arising on prior years’ results.
• Current tax is the expected tax payable or receivable arising in the current year on the current year’s result before tax, using tax rates enacted or substantively enacted at the balance sheet date, plus adjustments to tax in respect of prior years’ results.
• Deferred tax is the tax that is expected to arise when the assets and liabilities recognised in the Group’s consolidated balance sheet are realised, using tax rates enacted or substantively enacted at the balance sheet date that are expected to apply when the asset is realised or the liability is settled.
• Full provision is made for deferred taxation, using the liability method, on all taxable temporary differences. Deferred tax assets and liabilities are recognised separately in the consolidated balance sheet and are reported as non-current assets and liabilities.
• Deferred tax assets are recognised only to the extent that they are expected to be recoverable. Deferred taxation on unremitted overseas earnings is provided for to the extent a tax charge is foreseeable.
• When items of income and expense are recognised in other comprehensive income, the current and deferred tax relating to those items is also recognised in other comprehensive income.
• Tax arising on the discharge of share options and awards is recognised directly in equity.
187Hunting PLC Annual Report and Accounts 2020
Purpose and C
ultureB
usiness Model and S
takeholdersB
usiness Strategy
Perform
anceG
overnanceFin
ancial Statem
ents

41. Principal Accounting Policies continued
(h) Segmental Reporting • Financial information on operating segments that corresponds with information regularly reviewed by the Chief Operating Decision Maker (“CODM”) is disclosed in the financial statements. Consequently, the Group’s principal segmental reporting is largely established on a geographical basis. However, due to its size and independent management team, Hunting Titan is disclosed as a separate operating segment. As Enpro, a UK company forms part of the Subsea group of companies, it is managed by the US, and is included in the US operating segment.
• The geographical information is based on the location of where the sale originated and where the non-current assets are located. • Revenue is also disclosed by product group, which is provided to assist in investor understanding of the underlying performance trends. Each product group consists of goods and services that are similar in nature or serve similar markets.
(i) Property, Plant and Equipment • Property, plant and equipment is stated at cost less accumulated depreciation and any impairment in value. Cost includes expenditure that is directly attributable to the acquisition and installation of the asset.
• Land and assets under construction are not depreciated. • With the exception of drilling tools, which are depreciated using the units of production method, and oil and gas exploration and production equipment (see (ii) below), assets are depreciated using the straight-line method at the following rates:
Freehold buildings – 2% to 10% Leasehold buildings – life of lease Plant, machinery and motor vehicles – 6% to 331⁄3%
• The assets’ residual values and useful lives are reviewed, and adjusted if appropriate, at the end of each reporting period.
(j) Leases – Lessees • Lessees are required to recognise lease obligations as a liability and a right-of-use asset. The cost of the lease is subsequently recognised in the consolidated income statement as interest charged on the liability and as depreciation charged on the right-of-use asset. Hunting has adopted the two exemptions that permit lessees to charge the cost of certain leases directly to the consolidated income statement on a straight-line basis. The two exemptions apply to: i. leases that have a duration of one year or less; and ii. leases of assets that would have cost $5,000 or less, when new, to acquire if the asset had been purchased rather than leased.
(k) Goodwill • Goodwill arises when the fair value of the consideration paid for a business exceeds the fair value of the Group’s share of the net assets acquired. • Goodwill is recognised as an asset and is carried at cost less accumulated impairment losses. • Goodwill is allocated to cash-generating units for the purpose of impairment testing. The allocation is made to the cash-generating units or groups of cash-generating units that are expected to benefit from the business combination in which the goodwill arose.
• On the disposal of a business, goodwill relating to that business that remains in the consolidated balance sheet at the date of disposal is included in the determination of the profit or loss on disposal.
(l) Other Intangible Assets • Other intangible assets, whether obtained through acquisition or internal development, are capitalised when it is probable that the future economic benefits that are attributable to the asset will be generated, provided the cost of the asset can be measured reliably.
• Capitalisation occurs from the point when technical and commercial feasibility of the asset has been established. Prior to this costs are expensed. • For internally generated assets, only costs directly attributable to the development of the asset are capitalised. This typically includes employee remuneration and the cost of materials and services, such as testing, consumed in generating the intangible asset.
• Other intangible assets are stated at cost less accumulated amortisation and impairment losses where applicable. • These assets have a finite life and are amortised in accordance with the pattern of expected future economic benefits, or when this cannot be reliably estimated, by using the straight-line method.
• Intangible assets are amortised over the following periods:
Customer relationships – eight to ten years Patents – eight to ten years Unpatented technology – eight to ten years Trademarks and domain names – one to five years
(m) Impairments • The Group assesses at least annually whether there is any indication that an asset is impaired, and undertakes an assessment for an impairment if such an indication exists.
• In addition, the Group undertakes an annual impairment assessment of goodwill and other intangible assets that have an indefinite life, whether or not an indication of impairment actually exists.
• For the purposes of impairment testing, assets are grouped at the lowest levels for which there are separately identifiable cash flows. • Where impairment exists, the asset is written down to the higher of: (a) its fair value minus costs to sell; and (b) its value in use. Impairments are recognised immediately in the consolidated income statement.
• An impairment to goodwill is never reversed. When applicable, an impairment of any other asset is reversed, but only to the extent that the consequent carrying value does not exceed what would have been the carrying value had the impairment not originally been made.
Notes to the Consolidated Financial Statementscontinued
188Hunting PLC Annual Report and Accounts 2020

41. Principal Accounting Policies continued
(n) Inventories • Inventories are stated at the lower of cost and net realisable value. • Cost is determined using the first-in-first-out method and net realisable value is the estimated selling price less costs of disposal in the ordinary course of business. The cost of inventories includes direct costs plus production overheads.
(o) Cash and Cash Equivalents • Cash and cash equivalents comprise cash at bank and in hand, short-term deposits with a maturity of less than three months from the date of deposit and money market funds.
• Short-term deposits and money market funds have been classified as cash and cash equivalents as they are short term, highly liquid, are readily convertible to a known amount of cash and are subject to an insignificant risk of change in value.
• For cash flow statement purposes, cash and cash equivalents include bank overdrafts. In the consolidated balance sheet, bank overdrafts are shown within borrowings in current liabilities.
(p) Financial Assets • At initial recognition, the Group measures a financial asset at its fair value plus, in the case of a financial asset not at fair value through profit or loss (“FVTPL”), transaction costs. Transaction costs of financial assets at FVTPL are expensed immediately to the consolidated income statement.
• Subsequent measurement of debt instruments depends on each Group entity’s business model for managing the asset in order to generate cash flows and the cash flow characteristics of the financial asset. The Group’s debt instruments are classified either into amortised cost or fair value through profit or loss.
• Debt instruments that are held for the collection of contractual cash flows, where those cash flows represent solely payments of principal and interest, are subsequently measured at amortised cost. Interest income from these financial assets is included in finance income using the effective interest method. If collection is expected in one year or less they are classified as current assets, otherwise they are presented as non-current assets. Debt instruments held for collection of contractual cash flows include the loan note, contract assets, trade receivables, accrued revenue and other receivables.
• Any other debt instruments, including money market funds, which are subsequently not measured at amortised cost have been measured at fair value through profit or loss.
• The Group’s financial assets that are equity instruments are subsequently measured at fair value through profit or loss. Changes in the fair value of the equity instruments are recognised in other operating income, operating expenses, finance income or finance expense, as appropriate. Financial assets that are equity instruments comprise listed equity investments and mutual funds.
• The Group assesses on a forward-looking basis the expected credit losses (“ECLs”) at each balance sheet date associated with its loan note that is carried at amortised cost. The impairment methodology applied, following the adoption of the general model under IFRS 9, will depend on whether there has been a significant increase in credit risk. Indications of a significant increase in credit risk include events that have a negative impact on the estimated future cash flows and if any payments under the terms of the debt are more than 30 days overdue.
• The Group has chosen to apply lifetime ECLs to trade receivables, accrued revenue, contract assets and lease receivables, both short term and long term, upon their initial recognition.
(q) Financial Liabilities • Financial liabilities are initially recognised at fair value at the trade date which is normally the consideration received less, in the case of financial liabilities that are not measured at fair value through profit or loss, transaction costs. The Group subsequently remeasures all of its non-derivative financial liabilities, including trade payables, at amortised cost.
• Payables are classified as current liabilities if payment is due within one year, otherwise they are presented as non-current liabilities.
(r) Derivatives and Hedging • Derivatives are initially recognised at fair value on the date the derivative contract is entered into and are subsequently remeasured to their fair value at the end of each reporting period.
• The full fair value of a derivative is classified as a non-current asset or liability when the remaining maturity of the hedged item is more than 12 months from the balance sheet date.
• The accounting for subsequent changes in fair value depends on whether the derivative is designated as a hedging instrument, and if so, the nature of the item being hedged.
• Where the derivatives are not designated in a hedge and accounted for using hedge accounting, they are classified as “held for trading” and are accounted for at fair value through profit or loss, with changes in the fair value recognised immediately within the consolidated income statement.
• The Group designates certain derivatives as:i. hedges of the fair value of recognised assets and liabilities; orii. hedges of a particular risk associated with the cash flows of highly probable forecast transactions; oriii. a hedge of the net investment in a foreign operation.
(i) Fair Value Hedges • Fair value gains or losses on derivatives designated in a fair value hedge are recognised immediately in the consolidated income statement if the changes in the fair value of the hedged item are taken to the consolidated income statement.
189Hunting PLC Annual Report and Accounts 2020
Purpose and C
ultureB
usiness Model and S
takeholdersB
usiness Strategy
Perform
anceG
overnanceFin
ancial Statem
ents

41. Principal Accounting Policies continued
(r) Derivatives and Hedging continued(ii) Cash Flow Hedges • When forward foreign exchange contracts are designated in a cash flow hedge of forecast transactions, the Group generally designates only the change in fair value of the forward contract relating to the spot component as the hedging instrument. Gains or losses relating to the effective portion of the change in the spot component of the forward contracts are recognised in the cash flow hedge reserve within equity. The Group has chosen to recognise the change in the forward element of the contract that relates to the hedged item, defined as the forward points, within the consolidated income statement immediately rather than in equity. The forward points are discounted, where material.
• Where the hedged item subsequently results in the recognition of a non-financial asset, such as inventory or property, plant and equipment, the deferred hedging gains and losses in equity are included within the initial cost of the asset. The deferred amounts are subsequently recognised in profit or loss when the hedged item affects profit or loss (for example through cost of sales or depreciation).
• When a hedging instrument expires, or is sold or terminated, or when a hedge no longer meets the criteria for hedge accounting, any cumulative deferred gain or loss in equity at that time remains in equity until the forecast transaction occurs. When the forecast transaction is no longer expected to occur, the cumulative gain or loss of hedging that was reported in equity is immediately reclassified to the consolidated income statement.
(iii) Net Investment Hedges • Fair value gains or losses relating to the effective portion on derivatives designated in a net investment hedge are recognised in the other comprehensive income and accumulated in equity in the cumulative translation reserve (“CTR”). The gain or loss relating to the ineffective portion is recognised immediately in profit or loss. The cumulative gain or loss in the CTR is reclassified to the consolidated income statement as part of the gain or loss on disposal when the foreign subsidiary is disposed of or liquidated.
(s) Provisions • Provisions are recognised when the Group has a present obligation as a result of a past event and it is probable that an outflow of resources will be required to settle the obligation.
• The measurement of a provision is based on the most likely amount and timing of the expenditures. Payments that are expected to arise after more than one year are discounted to their present value using a risk-free interest rate that is relevant to the region in which the past event occurred. The risk-free interest rate is based on the redemption yields of government securities.
(t) Post-employment Benefits • Payments to defined contribution retirement schemes are charged to the consolidated income statement when they fall due.
(u) Share-based Payments • The Group issues equity-settled, share-based payments (HPSP awards) to certain employees as consideration for services received from the employees. The fair value of the employees’ services is recognised as an expense in the consolidated income statement on a straight-line basis over the vesting period based on the Group’s estimate of awards that will ultimately vest. The obligation to settle these awards is recognised within other components of equity.
(v) Share Capital • Incremental costs directly attributable to the issue of new shares are charged to equity as a deduction from the proceeds, net of tax.
(w) Merger Reserve • The merger reserve comprises the proceeds received, net of transaction costs, in excess of the nominal value of the Ordinary shares issued by way of the share placing completed on 31 October 2016. In accordance with section 612 of the Companies Act 2006, the premium was credited to the merger reserve, instead of to the share premium account, because the share placing was pursuant to the Company securing over 90% of another entity. The proceeds were used to pay down the Group’s borrowings at that time. The reserve is currently non-distributable and will be transferred to distributable retained earnings when the proceeds meet the definition of a qualifying consideration.
(x) Dividends • Dividends to the Group’s shareholders are recognised as liabilities in the Group’s financial statements in the period in which the dividends are approved by shareholders. Interim dividends are recognised when paid. All dividends are dealt with in the statement of changes in equity.
(y) Employee Benefit Trust • The Hunting PLC Employee Benefit Trust (“EBT”) holds treasury shares, which are shares in Hunting PLC, for the purpose of issuing shares to employees of the Group under share-based remuneration schemes. The EBT is consolidated in accordance with 41(a) above.
• The cost of treasury shares is presented as a deduction from retained earnings in the consolidated balance sheet. • The cost of shares issued to employees is recognised on a weighted average cost basis.
42. Events After the Balance Sheet Date
The Company has purchased 1,590,281 treasury shares for $4.7m since 1 January 2021.
In February 2021, the Group entered into a strategic alliance with Well Data Labs, a data analytics business focused on the onshore drilling market, through the provision of $2.5m in convertible capital financing.
Notes to the Consolidated Financial Statementscontinued
190Hunting PLC Annual Report and Accounts 2020

Company Balance Sheet At 31 December 2020
Notes2020
$m2019
$m
ASSETSNon-current assetsInvestments in subsidiaries C4 436.8 436.8Other receivables C5 273.6 284.3 710.4 721.1
Current assetsOther receivables C5 1.7 1.1 LIABILITIESCurrent liabilitiesOther payables C6 1.3 6.1Provisions 0.4 0.4Current tax liability 0.2 0.2 1.9 6.7Net current liabilities 0.2 5.6
Non-current liabilitiesProvisions 0.6 0.6 Net assets 709.6 714.9
Equity attributable to owners of the parentShare capital C13 66.5 67.3Share premium C13 153.0 153.0Other components of equity C14 37.1 47.1Retained earnings C15 453.0 447.5Total equity 709.6 714.9
The Company has elected to take the exemption under Section 408 of the Companies Act 2006 from presenting its own income statement and statement of comprehensive income. Profit and total comprehensive income for the year of $8.6m (2019 – $7.2m) has been accounted for in the financial statements of the Company.
The notes on pages 194 to 202 are an integral part of these financial statements. The financial statements on pages 191 to 202 were approved by the Board of Directors on 4 March 2021 and were signed on its behalf by:
Jim Johnson Bruce FergusonDirector Director Registered number: 0974568
191Hunting PLC Annual Report and Accounts 2020
Purpose and C
ultureB
usiness Model and S
takeholdersB
usiness Strategy
Perform
anceG
overnanceFin
ancial Statem
ents

Company Statement of Changes in Equity
Notes
Year ended 31 December 2020
Sharecapital
$m
Sharepremium
$m
Other components
of equity$m
Retained earnings
$m
Total equity
$m
At 1 January 2020 67.3 153.0 47.1 447.5 714.9Profit for the year and total comprehensive income – – – 8.6 8.6
Dividends paid to equity shareholders C16 – – – (8.2) (8.2)Share buyback C13 (0.8) – 0.6 (5.1) (5.3)Treasury shares– purchase of treasury shares – – – (9.4) (9.4)– disposal of treasury shares – – – 0.2 0.2Share options and awards– value of employee services C14 – – 9.0 – 9.0– discharge C14, C15 – – (11.4) 11.2 (0.2)Transfer between reserves – – (8.2) 8.2 –Total transactions with owners (0.8) – (10.0) (3.1) (13.9)
At 31 December 2020 66.5 153.0 37.1 453.0 709.6
Notes
Year ended 31 December 2019
Sharecapital
$m
Sharepremium
$m
Other components
of equity$m
Retained earnings
$m
Total equity
$m
At 1 January 2019 66.7 153.0 70.5 430.0 720.2Profit for the year and total comprehensive income – – – 7.2 7.2
Dividends paid to equity shareholders C16 – – – (16.6) (16.6)Shares issued– share option schemes and awards C13 0.6 – – – 0.6Treasury shares– purchase of treasury shares – – – (5.0) (5.0)– disposal of treasury shares – – – 0.3 0.3Share options and awards– value of employee services C14 – – 9.0 – 9.0– discharge C14, C15 – – (11.6) 10.8 (0.8)Transfer between reserves – – (20.8) 20.8 –Total transactions with owners 0.6 – (23.4) 10.3 (12.5)
At 31 December 2019 67.3 153.0 47.1 447.5 714.9
192Hunting PLC Annual Report and Accounts 2020

Company Statement of Cash FlowsFor the year ended 31 December 2020
Notes2020
$m2019
$m
Operating activitiesProfit (loss) from operations 4.6 (0.3)Share-based payments expense 9.0 9.1Increase in receivables (0.6) –(Decrease) increase in payables (5.2) 3.7Decrease in provisions – (0.4)Net exchange differences – 0.2Taxation paid (0.4) (2.0)Net cash inflow from operating activities 7.4 10.3Investing activitiesInterest received 4.5 9.5Loan issued – (19.2)Loan issued repaid 10.6 20.7Net cash inflow from investing activities 15.1 11.0Financing activitiesDividends paid to equity shareholders C16 (8.2) (16.6)Share capital issued – 0.6Share buyback (5.1) –Purchase of treasury shares (9.4) (5.0)Disposal of treasury shares 0.2 0.3Loan received repaid – (0.6)Net cash outflow from financing activities (22.5) (21.3)
Net cash inflow (outflow) in cash and cash equivalents – –Cash and cash equivalents at the beginning of the year – –Cash and cash equivalents at the end of the year – –
193Hunting PLC Annual Report and Accounts 2020
Purpose and C
ultureB
usiness Model and S
takeholdersB
usiness Strategy
Perform
anceG
overnanceFin
ancial Statem
ents
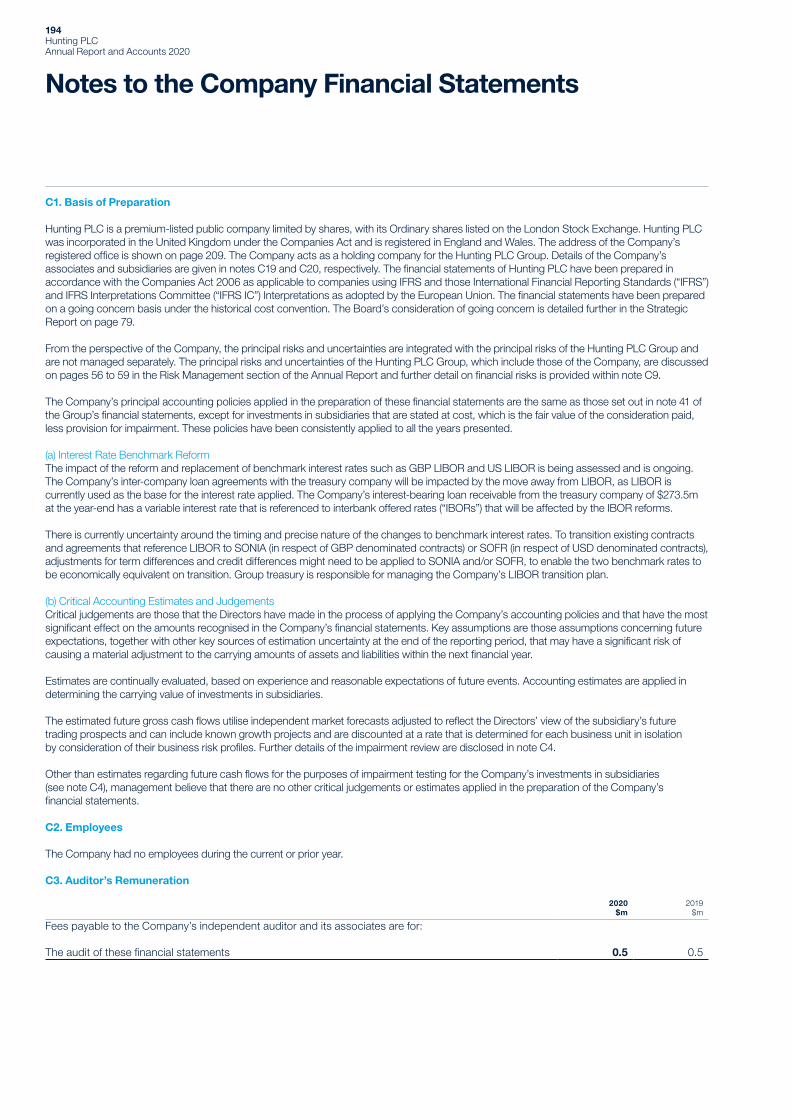
Notes to the Company Financial Statements
C1. Basis of Preparation
Hunting PLC is a premium-listed public company limited by shares, with its Ordinary shares listed on the London Stock Exchange. Hunting PLC was incorporated in the United Kingdom under the Companies Act and is registered in England and Wales. The address of the Company’s registered office is shown on page 209. The Company acts as a holding company for the Hunting PLC Group. Details of the Company’s associates and subsidiaries are given in notes C19 and C20, respectively. The financial statements of Hunting PLC have been prepared in accordance with the Companies Act 2006 as applicable to companies using IFRS and those International Financial Reporting Standards (“IFRS”) and IFRS Interpretations Committee (“IFRS IC”) Interpretations as adopted by the European Union. The financial statements have been prepared on a going concern basis under the historical cost convention. The Board’s consideration of going concern is detailed further in the Strategic Report on page 79.
From the perspective of the Company, the principal risks and uncertainties are integrated with the principal risks of the Hunting PLC Group and are not managed separately. The principal risks and uncertainties of the Hunting PLC Group, which include those of the Company, are discussed on pages 56 to 59 in the Risk Management section of the Annual Report and further detail on financial risks is provided within note C9.
The Company’s principal accounting policies applied in the preparation of these financial statements are the same as those set out in note 41 of the Group’s financial statements, except for investments in subsidiaries that are stated at cost, which is the fair value of the consideration paid, less provision for impairment. These policies have been consistently applied to all the years presented.
(a) Interest Rate Benchmark Reform The impact of the reform and replacement of benchmark interest rates such as GBP LIBOR and US LIBOR is being assessed and is ongoing. The Company’s inter-company loan agreements with the treasury company will be impacted by the move away from LIBOR, as LIBOR is currently used as the base for the interest rate applied. The Company’s interest-bearing loan receivable from the treasury company of $273.5m at the year-end has a variable interest rate that is referenced to interbank offered rates (“IBORs”) that will be affected by the IBOR reforms.
There is currently uncertainty around the timing and precise nature of the changes to benchmark interest rates. To transition existing contracts and agreements that reference LIBOR to SONIA (in respect of GBP denominated contracts) or SOFR (in respect of USD denominated contracts), adjustments for term differences and credit differences might need to be applied to SONIA and/or SOFR, to enable the two benchmark rates to be economically equivalent on transition. Group treasury is responsible for managing the Company’s LIBOR transition plan.
(b) Critical Accounting Estimates and JudgementsCritical judgements are those that the Directors have made in the process of applying the Company’s accounting policies and that have the most significant effect on the amounts recognised in the Company’s financial statements. Key assumptions are those assumptions concerning future expectations, together with other key sources of estimation uncertainty at the end of the reporting period, that may have a significant risk of causing a material adjustment to the carrying amounts of assets and liabilities within the next financial year.
Estimates are continually evaluated, based on experience and reasonable expectations of future events. Accounting estimates are applied in determining the carrying value of investments in subsidiaries.
The estimated future gross cash flows utilise independent market forecasts adjusted to reflect the Directors’ view of the subsidiary’s future trading prospects and can include known growth projects and are discounted at a rate that is determined for each business unit in isolation by consideration of their business risk profiles. Further details of the impairment review are disclosed in note C4.
Other than estimates regarding future cash flows for the purposes of impairment testing for the Company’s investments in subsidiaries (see note C4), management believe that there are no other critical judgements or estimates applied in the preparation of the Company’s financial statements.
C2. Employees
The Company had no employees during the current or prior year.
C3. Auditor’s Remuneration
2020$m
2019$m
Fees payable to the Company’s independent auditor and its associates are for:
The audit of these financial statements 0.5 0.5
194Hunting PLC Annual Report and Accounts 2020

C4. Investments in Subsidiaries
2020$m
2019$m
Cost:At 1 January and 31 December 436.8 436.8
Impairment:At 1 January and 31 December – –
Net book amount 436.8 436.8
The Company’s subsidiaries are detailed in note C20. Investments in subsidiaries are recorded at cost, which is the fair value of the consideration paid, less impairment.
(a) Impairment Tests In respect of the carrying value of the Company’s investment in subsidiaries, assessments are undertaken at least annually to determine whether there have been any events or changes in circumstances that indicate that the carrying value may be impaired. An impairment review is carried out when such indicators are present by comparing the carrying value of a subsidiary to its recoverable amount. The recoverable amount is the higher of fair value less costs of disposal (“FVLCD”) and value in use (“VIU”).
The recoverable amount for the investments has been determined using a fair value less costs of disposal (“FVLCD”) method, which represents the value of the investment in a sales transaction on an arm’s-length basis. As there is no active market for the Company’s subsidiaries, the FVLCD is determined using discounted cash flow techniques based on the estimated future gross cash flows that are expected to be generated by each subsidiary and are discounted at a rate that is determined for each subsidiary in isolation by consideration of their business risk profiles. This method allows approved capital projects that are in progress to be included.
The recoverable amount calculations use discounted pre-tax nominal cash flow projections. The value of each subsidiary’s debt has then been deducted from the cash flows. The impairment review is carried out using projected cash flows based on what could have reasonably been known as at 31 December 2020, the reporting date, of the conditions that existed at that date. The FVLCD is a Level 3 measurement as per the fair value hierarchy as defined within IFRS 13 due to unobservable inputs used in the valuation. The key assumptions for the recoverable amount calculations are revenue growth rates, taking into account the impact these have on margins, terminal growth rates and the discount rates applied.
For 2021, cash flows are based on the latest detailed forecast as approved by the Hunting PLC Board. For 2022 to 2025, management has made revenue projections using Spears & Associates “Drilling and Production Outlook” independent reports as a default basis, selecting the most appropriate geographic market and drivers (rig count, footage drilled or E&P spend) for each subsidiary. Management has then applied judgemental changes to revenue growth expectations, if appropriate, to reflect circumstances specific to the subsidiary. Having determined the projected revenues, management has then modelled the expected impact on margins and cash flow from the resulting revenue projections. This process can give a diverse range of outcomes depending on market or business specific conditions.
Compound annual growth rates (“CAGR”) for revenue for the subsidiaries from 2020 to 2025 vary between 8% and 18% (2019 – CAGR from 2019 to 2024 between 3% and 12%). After 2025, a terminal value has been calculated assuming growth of 50 basis points above assumed inflation (2019 – 25 basis points), giving nominal growth rates between 0% and 1% (2019 – between 1% and 2%). Cash flows have been discounted using nominal pre-tax rates between 11% and 13% (2019 – 9% and 10%). The discount rates reflect current market assessments of the equity market risk premiums, the volatility of returns, the risks associated with the cash flows, the likely external borrowing rate of the subsidiary and expected levels of leverage. Consideration has also been given to other factors such as currency risk, operational risk and country risk.
No impairment charges were recognised following the impairment review. In the opinion of the Directors, following the impairment review, the value of the investments in the subsidiaries is not less than the aggregate carrying value amount shown in the balance sheet and that the carrying value of the investments is supported by their underlying net assets.
(b) SensitivitiesManagement has reviewed various downside sensitivities versus the base case assumptions used in the projections. These covered revenue growth rates, terminal revenue growth rates, discount rates and foreign exchange rates. Management has concluded that there are no reasonably foreseeable changes in key assumptions that would give rise to an impairment charge.
195Hunting PLC Annual Report and Accounts 2020
Purpose and C
ultureB
usiness Model and S
takeholdersB
usiness Strategy
Perform
anceG
overnanceFin
ancial Statem
ents

C5. Other Receivables
2020$m
2019$m
Non-current:Loans receivable from a subsidiary – interest-bearing 273.5 284.2Prepayments 0.1 0.1 273.6 284.3
Current:Receivables from subsidiaries 1.1 0.8Prepayments 0.6 0.2Other receivables – 0.1 1.7 1.1
The loan receivable from a subsidiary and current receivables from subsidiaries of $274.6m (2019 – $285.0m) are financial assets measured at amortised cost. Other receivables relate to VAT balances, which are not financial assets. The interest-bearing loan receivable from a subsidiary is unsecured and interest is charged based on a margin over bank lending rates. Receivables from subsidiaries’ current accounts are unsecured, interest free and repayable on demand. The Company does not hold any collateral as security and no assets have been acquired through the exercise of any collateral previously held.
(a) Impairment of ReceivablesDefault on a financial asset is usually considered to have occurred when any contractual payments under the terms of the debt are more than 90 days overdue. Receivables are written off when there is no reasonable expectation of recovery. Indicators that receivables are generally not recoverable include the failure of the debtor to engage in a repayment plan, failure to make contractual payments for a period greater than 180 days past due and the debtor being placed in administration. Where receivables have been written off, the entity will continue to try and recover the outstanding receivable.
(b) Impairment of Loan ReceivableThe Company assesses on a forward-looking basis the expected credit losses (“ECLs”) at each balance sheet date associated with its loan receivable from a subsidiary company carried at amortised cost. The impairment methodology applied, following the adoption of the general model under IFRS 9, will depend upon whether there has been a significant increase in credit risk.
To assess whether there has been a significant increase in credit risk, the risk of default occurring as at 31 December 2020 is compared with the risk of default occurring at the date of initial recognition. Indications of a significant increase in credit risk include events that have a negative impact on the estimated future cash flows and if any payments under the terms of the debt are more than 30 days overdue. Macroeconomic information is also considered.
At 31 December 2020, the Company’s loan receivable was not overdue and the Company does not consider it necessary to provide for any impairment. The loan receivable is expected to be fully recovered, as there is no recent history of default or any indications that the contractual payments will not be made (see note C9(c)). The Company’s maximum exposure to credit risk is the fair value of the loan receivable, as described in note C8.
(c) Impairment of Receivables from Subsidiaries and Other ReceivablesNone of the Company’s receivables from subsidiaries and other receivables (2019 – none) were overdue at the year-end and the Company does not consider it necessary to provide for any impairments as there is no recent history of default or any indications that the contractual payments will not be made. The Company’s maximum exposure to credit risk is the fair value of each class of receivable, as described in note C8.
C6. Other Payables
2020$m
2019$m
Current:Payables to subsidiaries 0.2 5.3Accruals 0.6 0.5Other payables 0.5 0.3 1.3 6.1
Payables to subsidiaries, accruals and other payables of $1.3m (2019 – $6.1m) are financial liabilities carried at amortised cost. Current payables due to subsidiaries are unsecured, interest free and repayable on demand.
Notes to the Company Financial Statementscontinued
196Hunting PLC Annual Report and Accounts 2020

C7. Derivatives and Hedging
The Company has used forward foreign exchange contracts to hedge its exposure to exchange rate movements during the year. At 31 December 2020, the Company had no outstanding forward foreign exchange contracts (2019 – $nil). Gains and losses on contracts that are not designated in a hedge relationship are taken directly to the income statement. Changes in the fair value of currency derivatives not designated in a hedge relationship amounting to a $0.1m loss (2019 – $0.7m gain) were recognised in the income statement during the year.
C8. Financial Instruments: Fair Values
Due to their short-term nature, the carrying value of current receivables from subsidiaries, other receivables, payables to subsidiaries, accruals, other payables, provisions, borrowings and bank overdrafts approximates their fair value. The carrying value of the loan receivable from a subsidiary approximates its fair value as interest is charged based on a margin over current bank lending rates.
C9. Financial Risk Management
The Company’s activities expose it to certain financial risks, namely market risk (including currency risk, cash flow interest rate risk and fair value interest rate risk), credit risk and liquidity risk. From the perspective of the Company, these financial risks are integrated with the financial risks of the Hunting PLC Group and are not managed separately.
(a) Foreign Exchange RiskThe Company is mainly exposed to foreign exchange risk from its financing and operating activities in respect of Sterling. Foreign exchange risks arise from future transactions and cash flows and from recognised monetary assets and liabilities that are not denominated in US dollars and, where appropriate, forward foreign exchange contracts are used to manage the exposure to changes in foreign exchange rates. The Company has Sterling denominated financial assets and financial liabilities.
The carrying amount of the Company’s financial assets included in current receivables from subsidiaries at 31 December on which exchange differences would be recognised in the income statement in the following year, is $0.9m (2019 – $0.2m) for Sterling denominated financial assets. Loans receivable from a subsidiary of $0.3m (2019 – $0.1m) at the year-end are denominated in Sterling, with exchange differences being recognised in the income statement in the following year.
The carrying amount of the Company’s financial liabilities included in accruals and other payables at 31 December, on which exchange differences would be recognised in the income statement in the following year, is $1.1m (2019 – $0.8m) for Sterling denominated financial liabilities.
(b) Interest Rate RiskThe Company is exposed to cash flow interest rate risk from its loans receivable from a subsidiary, which are at variable interest rates.
(c) Credit RiskThe Company’s credit risk arises from its outstanding current receivables and loans receivable from a subsidiary. The Company is exposed to credit risk to the extent of non-receipt of its financial assets, however, it has no significant concentrations of credit risk other than from related parties. Credit risk is continually monitored and no individual exposure is considered to be significant in the ordinary course of the Company’s activities.
The interest-bearing loans receivable due from a subsidiary have not been impaired as no losses are expected from non-performance of this counterparty. The credit risk at the time the loans were taken out was deemed to be low and there has not been an increase in the credit risk since the time the loans were initially recognised. Therefore, management does not believe that there is a significant increase in credit risk such that the loans move from stage 1 to stage 2 of the IFRS 9 general impairment model. There is no history of default and previously all payments under the original terms of the loan have been made. The loans are with the Group’s central treasury company, which has sufficient cash, short-term deposits and credit facilities, in the form of the RCF, to repay the loan. Management does not have any reason to believe that any future payments will not be made in accordance with the terms of the loans. Therefore no provision for 12-month expected credit losses has been made under IFRS 9.
The Company’s outstanding receivables due from subsidiaries are current accounts and no losses are expected from non-performance of these counterparties.
(d) Liquidity Risk(i) Management of Cash The Company has sufficient facilities available to satisfy its requirements. The Company submits weekly and bi-monthly cash forecasts to Hunting’s treasury function to enable them to monitor the Company’s and the Group’s requirements.
The Group’s treasury function has put in place a cash concentration structure across the Hunting Group’s bank accounts in the UK, such that at the end of each day balances in any of their bank accounts are swept to the Group’s central treasury function, with a corresponding increase or decrease in the loan receivable balance with fellow group companies. As a result, at the end of the year, cash at bank is $nil.
197Hunting PLC Annual Report and Accounts 2020
Purpose and C
ultureB
usiness Model and S
takeholdersB
usiness Strategy
Perform
anceG
overnanceFin
ancial Statem
ents

C9. Financial Risk Management continued
(d) Liquidity Risk continued(ii) Barclays Composite Accounting SystemThe Company is party to a cross-guarantee and set-off arrangement with Barclays Bank Plc. There is no set-off in the presentation of cash balances held by the Company in the financial statements. Under this arrangement the Company is jointly and severally liable for any gross liability position held by any of the companies’ party to the aforementioned arrangements in the event of default. Any gross liability limit cannot exceed a combined facility limit of $2.3m.
(iii) Future Cash Flows of Financial Liabilities The following table analyses the expected timings of cash outflows for each of the Company’s non-derivative financial liabilities. The table below analyses the Company’s cash outflows into relevant maturity groupings based on the remaining period at the balance sheet date to the contractual maturity date of the financial liabilities. The amounts disclosed in the table are the contractual, undiscounted cash flows and include interest cash flows, where applicable, so will not always reconcile with the amounts disclosed in the Company balance sheet. The carrying values are the amounts in the Company balance sheet and are the discounted amounts.
2020 2019
On demand or within one year
$m
Carrying value
$m
On demand or within one year
$m
Carrying value
$m
Non-derivative financial liabilities:Payables to subsidiaries 0.2 0.2 5.3 5.3Accruals 0.6 0.6 0.5 0.5Other payables 0.5 0.5 0.3 0.3 1.3 1.3 6.1 6.1
The Company did not have any derivative financial liabilities at the end of 2020 or 2019.
C10. Capital Risk Management
The Company’s capital consists of equity and net cash. Net cash comprises the loan receivable from a subsidiary and borrowings. It is managed with the aim of maintaining an appropriate level of financing available for the Company’s activities, having due regard to interest rate risks and the availability of borrowing facilities.
Changes in equity arise from the retention of earnings and from issues of share capital. Net cash is monitored on a periodic basis. At the year-end, capital comprised:
2020$m
2019$m
Total equity 709.6 714.9Net cash: Loans receivable from subsidiary (note C5) (273.5) (284.2)Capital employed 436.1 430.7
The decrease in total equity during the year is mainly attributable to the profit for the year of $8.6m and the increase in the share-based payments reserve of $9.0m being offset by the payment of dividends of $8.2m, the share buyback programme of $5.3m and the net purchase of treasury shares of $9.2m. The loans receivable from a subsidiary decreased by $10.7m largely due to dividend income, royalty income and interest income received during the year being offset by dividend payments, the share buyback programme and the purchase of treasury shares. There have been no significant changes in the Company’s funding policy during the year. The Company is not subject to any externally imposed capital requirements.
C11. Financial Instruments: Sensitivity Analysis
The following sensitivity analysis is intended to illustrate the sensitivity to changes in market variables on the Company’s financial instruments and show the impact on profit or loss and shareholders’ equity. Financial instruments affected by market risk include non-current receivables from subsidiaries and borrowings. The sensitivity analysis relates to the position as at 31 December 2020.
The analysis excludes the impact of movements in market variables on the carrying value of provisions and on non-financial assets and liabilities.
The following assumptions have been made in calculating the sensitivity analysis:
• Foreign exchange rate and interest rate sensitivities have an asymmetric impact on the Company’s results, that is, an increase in rates does not result in the same amount of movement as a decrease in rates;
• For floating rate assets and liabilities, the amount of asset or liability outstanding at the balance sheet date is assumed to be outstanding for the whole year; and
• The carrying values of financial assets and liabilities carried at amortised cost do not change as interest rates change.
Notes to the Company Financial Statementscontinued
198Hunting PLC Annual Report and Accounts 2020
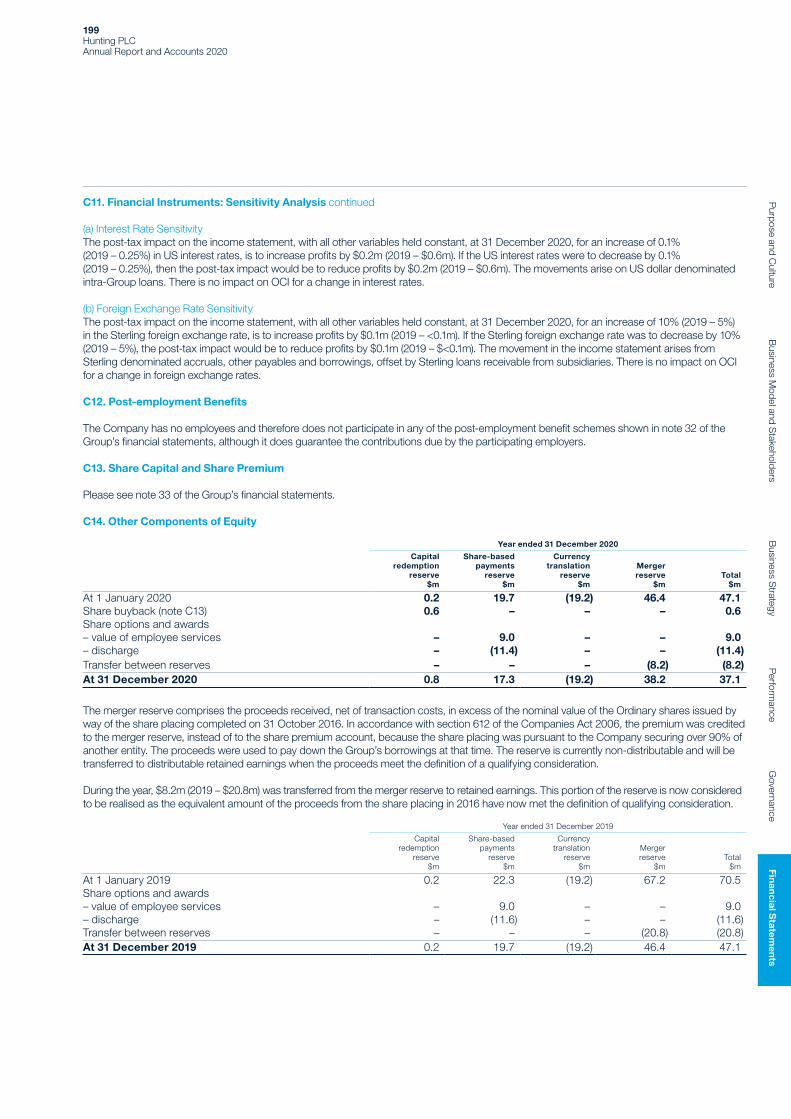
C11. Financial Instruments: Sensitivity Analysis continued
(a) Interest Rate SensitivityThe post-tax impact on the income statement, with all other variables held constant, at 31 December 2020, for an increase of 0.1% (2019 – 0.25%) in US interest rates, is to increase profits by $0.2m (2019 – $0.6m). If the US interest rates were to decrease by 0.1% (2019 – 0.25%), then the post-tax impact would be to reduce profits by $0.2m (2019 – $0.6m). The movements arise on US dollar denominated intra-Group loans. There is no impact on OCI for a change in interest rates.
(b) Foreign Exchange Rate SensitivityThe post-tax impact on the income statement, with all other variables held constant, at 31 December 2020, for an increase of 10% (2019 – 5%) in the Sterling foreign exchange rate, is to increase profits by $0.1m (2019 – <0.1m). If the Sterling foreign exchange rate was to decrease by 10% (2019 – 5%), the post-tax impact would be to reduce profits by $0.1m (2019 – $<0.1m). The movement in the income statement arises from Sterling denominated accruals, other payables and borrowings, offset by Sterling loans receivable from subsidiaries. There is no impact on OCI for a change in foreign exchange rates.
C12. Post-employment Benefits
The Company has no employees and therefore does not participate in any of the post-employment benefit schemes shown in note 32 of the Group’s financial statements, although it does guarantee the contributions due by the participating employers.
C13. Share Capital and Share Premium
Please see note 33 of the Group’s financial statements.
C14. Other Components of Equity
Year ended 31 December 2020
Capital redemption
reserve$m
Share-based payments
reserve$m
Currency translation
reserve$m
Merger reserve
$mTotal
$m
At 1 January 2020 0.2 19.7 (19.2) 46.4 47.1Share buyback (note C13) 0.6 – – – 0.6Share options and awards– value of employee services – 9.0 – – 9.0– discharge – (11.4) – – (11.4)Transfer between reserves – – – (8.2) (8.2)At 31 December 2020 0.8 17.3 (19.2) 38.2 37.1
The merger reserve comprises the proceeds received, net of transaction costs, in excess of the nominal value of the Ordinary shares issued by way of the share placing completed on 31 October 2016. In accordance with section 612 of the Companies Act 2006, the premium was credited to the merger reserve, instead of to the share premium account, because the share placing was pursuant to the Company securing over 90% of another entity. The proceeds were used to pay down the Group’s borrowings at that time. The reserve is currently non-distributable and will be transferred to distributable retained earnings when the proceeds meet the definition of a qualifying consideration.
During the year, $8.2m (2019 – $20.8m) was transferred from the merger reserve to retained earnings. This portion of the reserve is now considered to be realised as the equivalent amount of the proceeds from the share placing in 2016 have now met the definition of qualifying consideration.
Year ended 31 December 2019
Capitalredemption
reserve$m
Share-based payments
reserve$m
Currency translation
reserve$m
Merger reserve
$mTotal
$m
At 1 January 2019 0.2 22.3 (19.2) 67.2 70.5Share options and awards– value of employee services – 9.0 – – 9.0– discharge – (11.6) – – (11.6)Transfer between reserves – – – (20.8) (20.8)At 31 December 2019 0.2 19.7 (19.2) 46.4 47.1
199Hunting PLC Annual Report and Accounts 2020
Purpose and C
ultureB
usiness Model and S
takeholdersB
usiness Strategy
Perform
anceG
overnanceFin
ancial Statem
ents
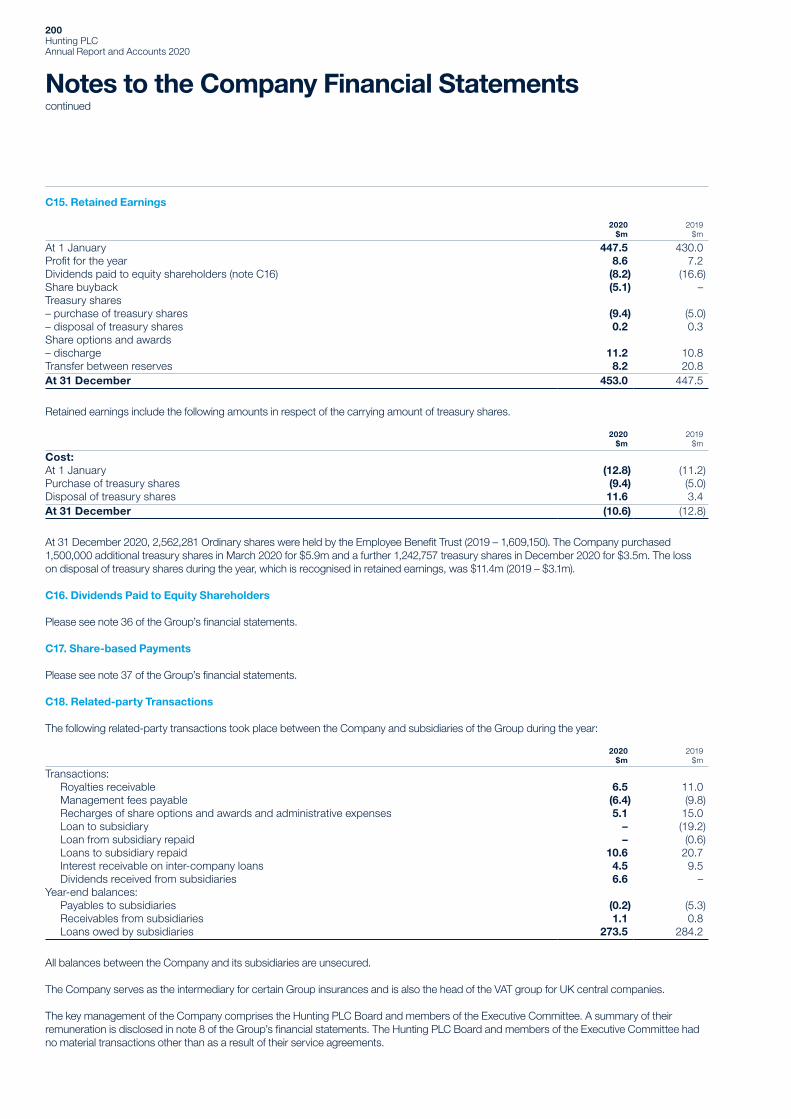
C15. Retained Earnings
2020$m
2019$m
At 1 January 447.5 430.0Profit for the year 8.6 7.2Dividends paid to equity shareholders (note C16) (8.2) (16.6)Share buyback (5.1) –Treasury shares– purchase of treasury shares (9.4) (5.0)– disposal of treasury shares 0.2 0.3Share options and awards– discharge 11.2 10.8Transfer between reserves 8.2 20.8At 31 December 453.0 447.5
Retained earnings include the following amounts in respect of the carrying amount of treasury shares.
2020$m
2019$m
Cost:At 1 January (12.8) (11.2)Purchase of treasury shares (9.4) (5.0)Disposal of treasury shares 11.6 3.4At 31 December (10.6) (12.8)
At 31 December 2020, 2,562,281 Ordinary shares were held by the Employee Benefit Trust (2019 – 1,609,150). The Company purchased 1,500,000 additional treasury shares in March 2020 for $5.9m and a further 1,242,757 treasury shares in December 2020 for $3.5m. The loss on disposal of treasury shares during the year, which is recognised in retained earnings, was $11.4m (2019 – $3.1m).
C16. Dividends Paid to Equity Shareholders
Please see note 36 of the Group’s financial statements.
C17. Share-based Payments
Please see note 37 of the Group’s financial statements.
C18. Related-party Transactions
The following related-party transactions took place between the Company and subsidiaries of the Group during the year:
2020$m
2019$m
Transactions: Royalties receivable 6.5 11.0 Management fees payable (6.4) (9.8) Recharges of share options and awards and administrative expenses 5.1 15.0 Loan to subsidiary – (19.2) Loan from subsidiary repaid – (0.6) Loans to subsidiary repaid 10.6 20.7 Interest receivable on inter-company loans 4.5 9.5 Dividends received from subsidiaries 6.6 –Year-end balances: Payables to subsidiaries (0.2) (5.3) Receivables from subsidiaries 1.1 0.8 Loans owed by subsidiaries 273.5 284.2
All balances between the Company and its subsidiaries are unsecured.
The Company serves as the intermediary for certain Group insurances and is also the head of the VAT group for UK central companies.
The key management of the Company comprises the Hunting PLC Board and members of the Executive Committee. A summary of their remuneration is disclosed in note 8 of the Group’s financial statements. The Hunting PLC Board and members of the Executive Committee had no material transactions other than as a result of their service agreements.
Notes to the Company Financial Statementscontinued
200Hunting PLC Annual Report and Accounts 2020
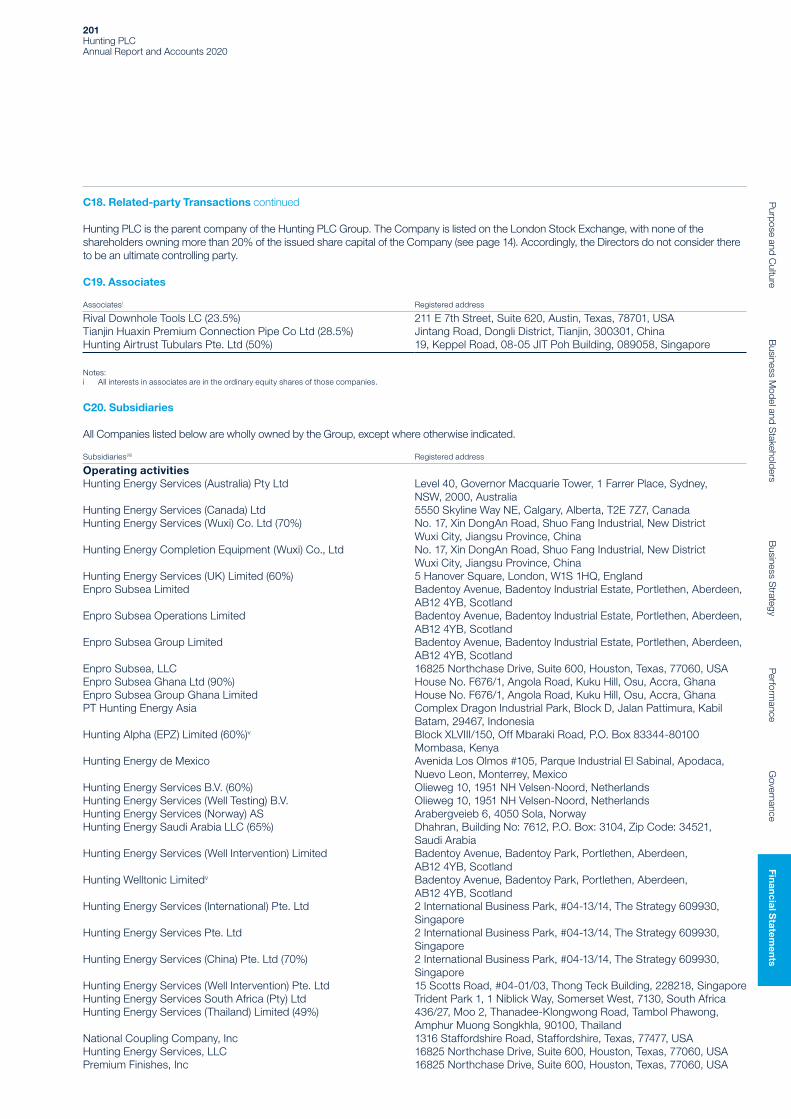
C18. Related-party Transactions continued
Hunting PLC is the parent company of the Hunting PLC Group. The Company is listed on the London Stock Exchange, with none of the shareholders owning more than 20% of the issued share capital of the Company (see page 14). Accordingly, the Directors do not consider there to be an ultimate controlling party.
C19. Associates
Associatesi Registered address
Rival Downhole Tools LC (23.5%) 211 E 7th Street, Suite 620, Austin, Texas, 78701, USATianjin Huaxin Premium Connection Pipe Co Ltd (28.5%) Jintang Road, Dongli District, Tianjin, 300301, ChinaHunting Airtrust Tubulars Pte. Ltd (50%) 19, Keppel Road, 08-05 JIT Poh Building, 089058, Singapore
Notes:i All interests in associates are in the ordinary equity shares of those companies.
C20. Subsidiaries
All Companies listed below are wholly owned by the Group, except where otherwise indicated.
Subsidiariesi/iii Registered address
Operating activitiesHunting Energy Services (Australia) Pty Ltd Level 40, Governor Macquarie Tower, 1 Farrer Place, Sydney,
NSW, 2000, Australia Hunting Energy Services (Canada) Ltd 5550 Skyline Way NE, Calgary, Alberta, T2E 7Z7, CanadaHunting Energy Services (Wuxi) Co. Ltd (70%) No. 17, Xin DongAn Road, Shuo Fang Industrial, New District
Wuxi City, Jiangsu Province, ChinaHunting Energy Completion Equipment (Wuxi) Co., Ltd No. 17, Xin DongAn Road, Shuo Fang Industrial, New District
Wuxi City, Jiangsu Province, ChinaHunting Energy Services (UK) Limited (60%) 5 Hanover Square, London, W1S 1HQ, EnglandEnpro Subsea Limited Badentoy Avenue, Badentoy Industrial Estate, Portlethen, Aberdeen,
AB12 4YB, ScotlandEnpro Subsea Operations Limited Badentoy Avenue, Badentoy Industrial Estate, Portlethen, Aberdeen,
AB12 4YB, ScotlandEnpro Subsea Group Limited Badentoy Avenue, Badentoy Industrial Estate, Portlethen, Aberdeen,
AB12 4YB, ScotlandEnpro Subsea, LLC 16825 Northchase Drive, Suite 600, Houston, Texas, 77060, USAEnpro Subsea Ghana Ltd (90%) House No. F676/1, Angola Road, Kuku Hill, Osu, Accra, GhanaEnpro Subsea Group Ghana Limited House No. F676/1, Angola Road, Kuku Hill, Osu, Accra, GhanaPT Hunting Energy Asia Complex Dragon Industrial Park, Block D, Jalan Pattimura, Kabil
Batam, 29467, IndonesiaHunting Alpha (EPZ) Limited (60%)v Block XLVIII/150, Off Mbaraki Road, P.O. Box 83344-80100
Mombasa, KenyaHunting Energy de Mexico Avenida Los Olmos #105, Parque Industrial El Sabinal, Apodaca,
Nuevo Leon, Monterrey, MexicoHunting Energy Services B.V. (60%) Olieweg 10, 1951 NH Velsen-Noord, NetherlandsHunting Energy Services (Well Testing) B.V. Olieweg 10, 1951 NH Velsen-Noord, Netherlands Hunting Energy Services (Norway) AS Arabergveieb 6, 4050 Sola, NorwayHunting Energy Saudi Arabia LLC (65%) Dhahran, Building No: 7612, P.O. Box: 3104, Zip Code: 34521,
Saudi ArabiaHunting Energy Services (Well Intervention) Limited Badentoy Avenue, Badentoy Park, Portlethen, Aberdeen,
AB12 4YB, ScotlandHunting Welltonic Limitedv Badentoy Avenue, Badentoy Park, Portlethen, Aberdeen,
AB12 4YB, ScotlandHunting Energy Services (International) Pte. Ltd 2 International Business Park, #04-13/14, The Strategy 609930,
SingaporeHunting Energy Services Pte. Ltd 2 International Business Park, #04-13/14, The Strategy 609930,
SingaporeHunting Energy Services (China) Pte. Ltd (70%) 2 International Business Park, #04-13/14, The Strategy 609930,
SingaporeHunting Energy Services (Well Intervention) Pte. Ltd 15 Scotts Road, #04-01/03, Thong Teck Building, 228218, SingaporeHunting Energy Services South Africa (Pty) Ltd Trident Park 1, 1 Niblick Way, Somerset West, 7130, South AfricaHunting Energy Services (Thailand) Limited (49%) 436/27, Moo 2, Thanadee-Klongwong Road, Tambol Phawong,
Amphur Muong Songkhla, 90100, ThailandNational Coupling Company, Inc 1316 Staffordshire Road, Staffordshire, Texas, 77477, USAHunting Energy Services, LLC 16825 Northchase Drive, Suite 600, Houston, Texas, 77060, USAPremium Finishes, Inc 16825 Northchase Drive, Suite 600, Houston, Texas, 77060, USA
201Hunting PLC Annual Report and Accounts 2020
Purpose and C
ultureB
usiness Model and S
takeholdersB
usiness Strategy
Perform
anceG
overnanceFin
ancial Statem
ents
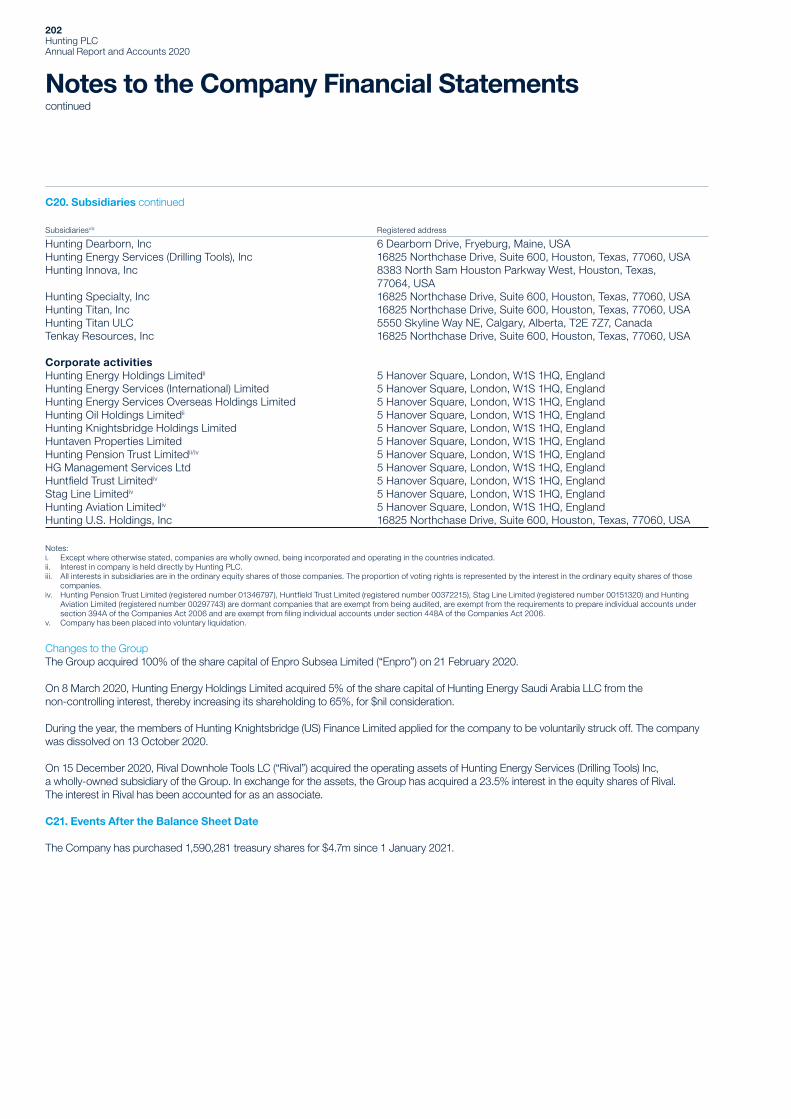
Subsidiariesi/iii Registered address
Hunting Dearborn, Inc 6 Dearborn Drive, Fryeburg, Maine, USAHunting Energy Services (Drilling Tools), Inc 16825 Northchase Drive, Suite 600, Houston, Texas, 77060, USA Hunting Innova, Inc 8383 North Sam Houston Parkway West, Houston, Texas,
77064, USAHunting Specialty, Inc 16825 Northchase Drive, Suite 600, Houston, Texas, 77060, USA Hunting Titan, Inc 16825 Northchase Drive, Suite 600, Houston, Texas, 77060, USA Hunting Titan ULC 5550 Skyline Way NE, Calgary, Alberta, T2E 7Z7, CanadaTenkay Resources, Inc 16825 Northchase Drive, Suite 600, Houston, Texas, 77060, USA
Corporate activitiesHunting Energy Holdings Limitedii 5 Hanover Square, London, W1S 1HQ, EnglandHunting Energy Services (International) Limited 5 Hanover Square, London, W1S 1HQ, England Hunting Energy Services Overseas Holdings Limited 5 Hanover Square, London, W1S 1HQ, EnglandHunting Oil Holdings Limitedii 5 Hanover Square, London, W1S 1HQ, EnglandHunting Knightsbridge Holdings Limited 5 Hanover Square, London, W1S 1HQ, EnglandHuntaven Properties Limited 5 Hanover Square, London, W1S 1HQ, EnglandHunting Pension Trust Limitedii/iv 5 Hanover Square, London, W1S 1HQ, England HG Management Services Ltd 5 Hanover Square, London, W1S 1HQ, EnglandHuntfield Trust Limitediv 5 Hanover Square, London, W1S 1HQ, EnglandStag Line Limitediv 5 Hanover Square, London, W1S 1HQ, EnglandHunting Aviation Limitediv 5 Hanover Square, London, W1S 1HQ, EnglandHunting U.S. Holdings, Inc 16825 Northchase Drive, Suite 600, Houston, Texas, 77060, USA
Notes:i. Except where otherwise stated, companies are wholly owned, being incorporated and operating in the countries indicated.ii. Interest in company is held directly by Hunting PLC.iii. All interests in subsidiaries are in the ordinary equity shares of those companies. The proportion of voting rights is represented by the interest in the ordinary equity shares of those
companies.iv. Hunting Pension Trust Limited (registered number 01346797), Huntfield Trust Limited (registered number 00372215), Stag Line Limited (registered number 00151320) and Hunting
Aviation Limited (registered number 00297743) are dormant companies that are exempt from being audited, are exempt from the requirements to prepare individual accounts under section 394A of the Companies Act 2006 and are exempt from filing individual accounts under section 448A of the Companies Act 2006.
v. Company has been placed into voluntary liquidation.
Changes to the GroupThe Group acquired 100% of the share capital of Enpro Subsea Limited (“Enpro”) on 21 February 2020.
On 8 March 2020, Hunting Energy Holdings Limited acquired 5% of the share capital of Hunting Energy Saudi Arabia LLC from the non-controlling interest, thereby increasing its shareholding to 65%, for $nil consideration.
During the year, the members of Hunting Knightsbridge (US) Finance Limited applied for the company to be voluntarily struck off. The company was dissolved on 13 October 2020.
On 15 December 2020, Rival Downhole Tools LC (“Rival”) acquired the operating assets of Hunting Energy Services (Drilling Tools) Inc, a wholly-owned subsidiary of the Group. In exchange for the assets, the Group has acquired a 23.5% interest in the equity shares of Rival. The interest in Rival has been accounted for as an associate.
C21. Events After the Balance Sheet Date
The Company has purchased 1,590,281 treasury shares for $4.7m since 1 January 2021.
C20. Subsidiaries continued
Notes to the Company Financial Statementscontinued
202Hunting PLC Annual Report and Accounts 2020

Non-GAAP Measures (unaudited)
The Directors believe it is appropriate to include in the Strategic Report and consolidated financial statements a number of non-GAAP measures (“NGMs”) that are commonly used within the business. These measures supplement the information provided in the IFRS “reported” financial statements and accompanying notes, providing additional insight to the users of the Annual Report.
This section provides a definition of the non-GAAP measures, the purpose for which the measure is used, and a reconciliation of the non-GAAP measure to the reported IFRS numbers. The auditors are required under the Companies Act 2006 to consider whether these non-GAAP measures are prepared consistently with the financial statements.
Income Statement Non-GAAP Measures
The Directors have applied the provisions of IAS 1 with regards to exceptional items and have chosen to present these, together with amortisation of acquired intangible assets, in a separate column on the face of the consolidated income statement. All profit and loss measures adjusted for amortisation of acquired intangible assets and exceptional items are referred to as “underlying”. This is the basis used by the Directors in assessing performance and in determining certain components of senior management and executive remuneration.
A. EBITDAPurpose: This profit measure is used as a simple proxy for pre-tax cash flows from operating activities.
Calculation definition: Underlying results before share of associates’ post-tax results, interest, tax, depreciation, impairment and amortisation.
2020$m
2019$m
Reported (loss) profit from operations (consolidated income statement) (220.0) 46.8 Depreciation of property, plant and equipment (note 12) 32.1 33.7 Depreciation of right-of-use assets (note 13) 7.5 7.9 Reversal of impairment of right-of-use assets (note 13) (0.6) – Non-exceptional amortisation of intangible assets (note 7) 3.5 3.8Non-exceptional amortisation and depreciation 42.5 45.4Amortisation of acquired intangible assets and exceptional items (note 6) 203.6 47.5Underlying EBITDA 26.1 139.7
B. Underlying Tax RatePurpose: The weighted average tax rate represents the level of tax, both current and deferred, being borne by operations on an underlying basis.
Calculation definition: Taxation on underlying (loss) profit before tax divided by underlying (loss) profit before tax, expressed as a percentage.
2020$m
2019$m
Underlying taxation (credit) charge (note 10) (0.9) 17.0Underlying (loss) profit before tax for the year (consolidated income statement) (19.4) 93.1
Underlying tax rate 5% 18%
Balance Sheet Non-GAAP Measures
C. Working CapitalPurpose: Working capital is a measure of the Group’s liquidity identifying whether the Group has sufficient assets to cover liabilities as they fall due.
Calculation definition: Trade and other receivables excluding receivables from associates, derivative financial assets and loan notes, plus inventories less trade and other payables excluding payables due to associates, derivative financial liabilities, dividend liabilities and retirement plan obligations.
2020$m
2019$m
Trade and other receivables – non-current (note 18) 2.0 2.7 Trade and other receivables – current (note 18) 136.3 202.0 Inventories (note 20) 288.4 350.8 Trade and other payables – current (note 22) (67.9) (121.2)Trade and other payables – non-current (note 22) (2.4) (2.7)Less: non-working capital loan note (note 18) – (0.7)Add: non-working capital US deferred compensation plan obligation (note 22) 1.7 2.1 Add: non-working capital current other receivables and other payables 0.2 0.3 358.3 433.3
203Hunting PLC Annual Report and Accounts 2020
Purpose and C
ultureB
usiness Model and S
takeholdersB
usiness Strategy
Perform
anceG
overnanceFinancial S
tatements

Balance Sheet Non-GAAP Measures continued
D. Inventory DaysPurpose: This is a working capital efficiency ratio that measures inventory balances relative to business activity levels.
Calculation definition: Inventory at the year-end divided by underlying cost of sales for the last three months of the year multiplied by 92 days, adjusted for the impact of acquisitions and disposals when applicable.
2020$m
2019$m
Inventories (note 20) 288.4 350.8Underlying cost of sales for October to December 98.4 150.6
Inventory days 270 days 214 days
E. Trade Receivables DaysPurpose: This is a working capital efficiency ratio that measures receivable balances relative to business activity levels.
Calculation definition: Net trade receivables, contract assets and accrued revenue at the year-end divided by revenue for the last three months of the year multiplied by 92 days, adjusted for the impact of acquisitions and disposals when applicable.
2020$m
2019$m
Net trade receivables (note 18) 106.9 155.5Contract assets (note 18) 9.8 8.3Accrued revenue (note 18) 3.2 12.3Net receivables 119.9 176.1
Revenue for October to December 119.3 205.7
Trade receivable days 92 days 79 days
F. Other Net AssetsPurpose: Provides an analysis of other net assets in the Summary Group Balance Sheet in the Strategic Report.
2020$m
2019$m
Investments (note 17) 19.8 2.8Held-for-sale asset (note 12) 1.8 –Non-working capital loan note (NGM C) – 0.7Non-working capital US deferred compensation plan obligation (NGM C) (1.7) (2.1)Non-working capital current other receivables and other payables (NGM C) (0.2) (0.3) 19.7 1.1
G. Capital EmployedPurpose: Used in the calculation of the return on average capital employed (see NGM N).
Calculation definition: Capital employed is the amount of capital that the Group has invested in its business and comprises the historic value of total equity plus net (cash) debt at amortised cost.
The Group’s capital comprised:
2020$m
2019$m
Total equity (consolidated balance sheet) 976.6 1,223.8Net cash (note 26) (57.5) (77.9) 919.1 1,145.9
Non-GAAP Measures(unaudited) continued
204Hunting PLC Annual Report and Accounts 2020

Cash Flow Non-GAAP Measures
H. Cash Flow Working Capital MovementsPurpose: Reconciles the working capital movements in the Summary Group Cash Flow in the Strategic Report.
2020$m
2019$m
Working capital – opening balance 433.3 436.5Adjustment on adoption of IFRS 16 – 2.1Working capital – opening balance amended 433.3 438.6Foreign exchange – 3.1Exceptional items impacting working capital: Impairments of inventories (note 6) (34.2) – Impairments of receivables (note 6) (1.2) – Profit on disposal of Canada assets 0.6 –Acquisition (note 39) 0.5 0.2Disposal of business (note 40) (2.7) (0.6)Adjustments: Transfer to property, plant and equipment (note 12) (0.6) (0.1) Capital investment debtors/creditors cash flows (0.1) 0.1 Asset disposals debtors/creditors cash flows 1.7 0.3 Other non-cash flow movements – (0.1) Other cash flow movement (0.2) (0.6)Working capital – closing balance (NGM C) (358.3) (433.3)Cash flow 38.8 7.6
I. Capital InvestmentPurpose: Capital investment identifies the cash resources being absorbed organically within the business to maintain or enhance operating activity levels.
Calculation definition: Capital investment is the cash paid on tangible non-current assets to maintain existing levels of operating activity and to grow the business from current operating levels and enhance operating activity.
2020$m
2019$m
Property, plant and equipment additions (note 12) 14.8 35.9Capital investment debtors/creditors cash flows (NGM H) (0.1) 0.1Cash flow 14.7 36.0
Per the consolidated statement of cash flows:Purchase of property, plant and equipment held for rental – operating activities 3.0 5.6Purchase of property, plant and equipment – investing activities 11.7 30.4Cash flow 14.7 36.0
Hunting Titan 3.9 14.3US 8.5 19.3Canada 0.1 1.0EMEA 1.0 0.6Asia Pacific 1.0 0.7Central 0.2 0.1Cash flow 14.7 36.0
205Hunting PLC Annual Report and Accounts 2020
Purpose and C
ultureB
usiness Model and S
takeholdersB
usiness Strategy
Perform
anceG
overnanceFinancial S
tatements

Cash Flow Non-GAAP Measures continued
J. Other Operating Cash and Non-Cash MovementsPurpose: Reconciles other operating cash and non-cash movements in the Summary Group Cash Flow in the Strategic Report.
2020$m
2019$m
Loans from associates repaid (consolidated statement of cash flows) – 0.3Decrease in provisions (consolidated statement of cash flows) (0.2) (2.4)Other non-cash flow items (1.3) (0.3)
(1.5) (2.4)
K. Free Cash FlowPurpose: Free cash flow is a measure of financial performance and represents the cash that the Group is able to generate. Free cash flow represents the amount of cash the Group has available to either retain for investment, whether organic or by way of acquisition, or to return to shareholders.
Calculation definition: All cash flows before transactions with shareholders, investment in non-current assets and lease financing costs.
2020$m
2019i
$m
Underlying EBITDA (NGM A) 26.1 139.7Add: share-based payment charge (note 37) 9.0 9.1 35.1 148.8Working capital movements (NGM H) 38.8 7.6Net tax paid (consolidated statement of cash flows) (5.0) (7.7)Proceeds from business and asset disposals (consolidated statement of cash flows) 3.9 8.9Gains on business and asset disposals (2.4) (5.8)Lease payments (10.4) (10.6)Restructuring costs (10.7) –Other operating cash and non-cash movements (NGM J) (1.5) (2.4) 47.8 138.8
i. Free cash flow for 2019 has been revised to include lease payments of $10.6m as this better represents the cash that the Group had available.
Other Non-GAAP Measures
L. Dividend Per Share DeclaredPurpose: Identifies the total amount of dividend declared in respect of a period. This is also used in the calculation of dividend cover (see NGM M).
Calculation definition: The amount in cents returned to Ordinary shareholders.
2020Cents
per share
2019Cents
per share
First interim dividend 3.0 5.0Second interim dividend 2.0 –Final dividend 4.0 – 9.0 5.0
The first interim dividend in 2020 was paid in place of the proposed 2019 final dividend of 6.0c per share.
Non-GAAP Measures(unaudited) continued
206Hunting PLC Annual Report and Accounts 2020
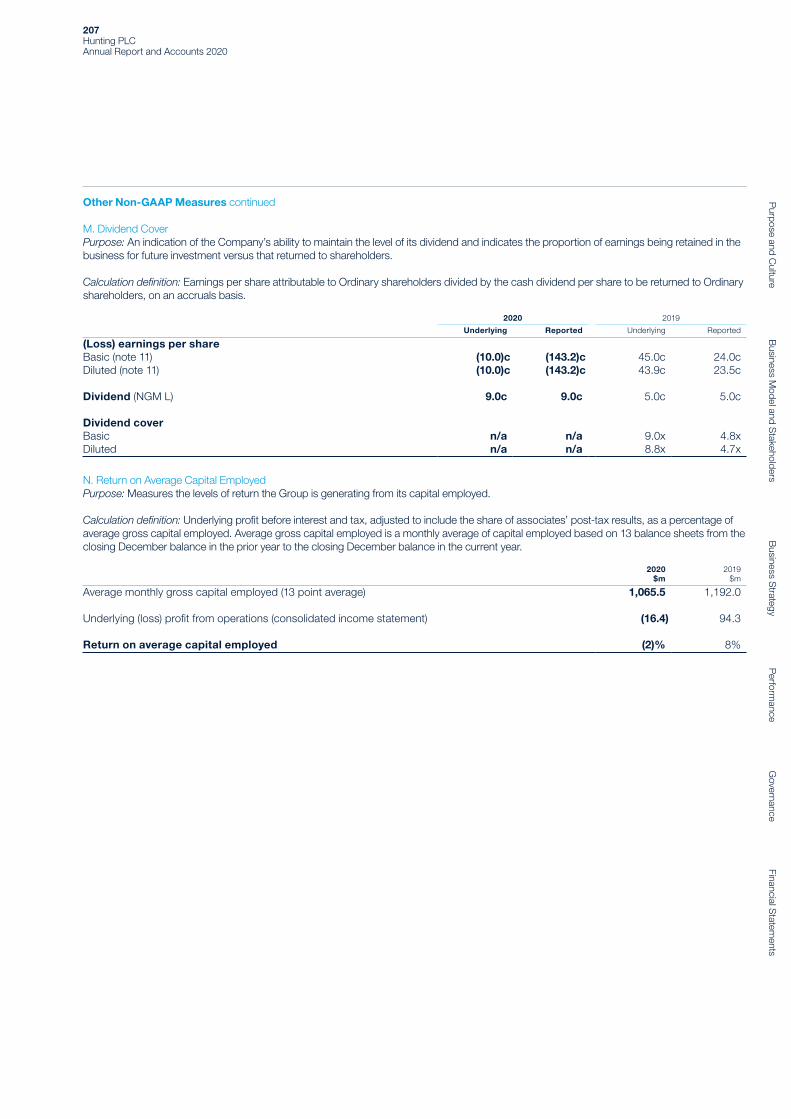
Other Non-GAAP Measures continued
M. Dividend CoverPurpose: An indication of the Company’s ability to maintain the level of its dividend and indicates the proportion of earnings being retained in the business for future investment versus that returned to shareholders.
Calculation definition: Earnings per share attributable to Ordinary shareholders divided by the cash dividend per share to be returned to Ordinary shareholders, on an accruals basis.
2020 2019
Underlying Reported Underlying Reported
(Loss) earnings per shareBasic (note 11) (10.0)c (143.2)c 45.0c 24.0cDiluted (note 11) (10.0)c (143.2)c 43.9c 23.5c
Dividend (NGM L) 9.0c 9.0c 5.0c 5.0c
Dividend coverBasic n/a n/a 9.0x 4.8xDiluted n/a n/a 8.8x 4.7x
N. Return on Average Capital EmployedPurpose: Measures the levels of return the Group is generating from its capital employed.
Calculation definition: Underlying profit before interest and tax, adjusted to include the share of associates’ post-tax results, as a percentage of average gross capital employed. Average gross capital employed is a monthly average of capital employed based on 13 balance sheets from the closing December balance in the prior year to the closing December balance in the current year.
2020$m
2019$m
Average monthly gross capital employed (13 point average) 1,065.5 1,192.0
Underlying (loss) profit from operations (consolidated income statement) (16.4) 94.3
Return on average capital employed (2)% 8%
207Hunting PLC Annual Report and Accounts 2020
Purpose and C
ultureB
usiness Model and S
takeholdersB
usiness Strategy
Perform
anceG
overnanceFinancial S
tatements

2020$m
2019ii
$m2018ii
$m2017ii
$m2016ii
$m
Revenue 626.0 960.0 911.4 724.9 455.8EBITDA 26.1 139.7 142.3 56.0 (48.9)Depreciation and non-exceptional amortisation and impairment (42.5) (45.4) (37.6) (41.7) (43.3)(Loss) profit from operations (16.4) 94.3 104.7 14.3 (92.2)Net finance expense (3.0) (1.2) (0.7) (1.5) (0.7)Share of associates’ post-tax losses – – – (1.3) (0.3)(Loss) profit before tax (19.4) 93.1 104.0 11.5 (93.2)Taxation 0.9 (17.0) (22.0) (1.0) 19.9(Loss) profit for the year (18.5) 76.1 82.0 10.5 (73.3)
cents cents cents cents cents
Basic (loss) earnings per share (10.0) 45.0 51.6 8.0 (45.3)Diluted (loss) earnings per share (10.0) 43.9 49.6 8.0 (45.3)
Dividend per shareiii 9.0 5.0 9.0 – –
$m $m $m $m $m
Balance sheetProperty, plant and equipment 307.1 354.7 360.2 383.3 419.0Right-of-use assets 29.8 36.7 – – –Goodwill and other intangible assets 207.1 308.7 329.7 355.7 380.5Working capital 358.3 433.3 436.5 344.0 300.2Taxation (current and deferred) 6.0 19.8 13.7 (6.0) (3.4)Provisions (8.9) (8.4) (14.2) (18.0) (15.7)Other net assets 19.7 1.1 3.9 22.7 38.7Capital employed 919.1 1,145.9 1,129.8 1,081.7 1,119.3 Total cash and bank 101.7 127.0 65.2 34.3 2.0 Lease liabilities (40.3) (45.2) – – – Other borrowings (3.9) (3.9) (3.9) (3.9) (3.9)Net cash (debt) (note 26) 57.5 77.9 61.3 30.4 (1.9)Net assets 976.6 1,223.8 1,191.1 1,112.1 1,117.4Non-controlling interests (12.2) (15.9) (14.0) (18.8) (19.3)Equity attributable to owners of the parent 964.4 1,207.9 1,177.1 1,093.3 1,098.1
cents cents cents cents cents
Net assets per share 592.2 733.3 721.4 677.3 682.6
i. Information is stated before exceptional items and amortisation of acquired intangible assets. ii. IFRS 16 Leases was adopted with effect from 1 January 2019. The modified retrospective approach was applied and consequently information for the years 2015 to 2018 has not been
restated, as permitted under the specific transitional provisions in IFRS 16 Leases. iii. Dividend per share is stated on a declared basis.
Financial Recordi (unaudited)
208Hunting PLC Annual Report and Accounts 2020
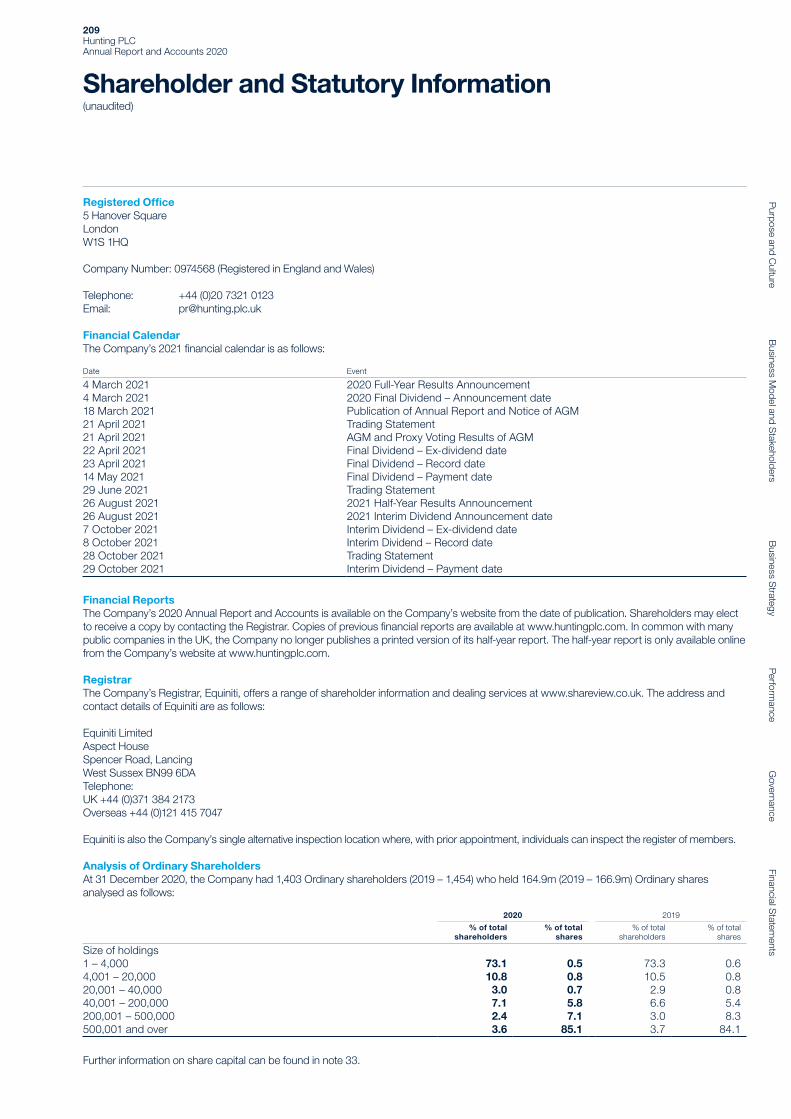
Shareholder and Statutory Information (unaudited)
Registered Office5 Hanover SquareLondon W1S 1HQ
Company Number: 0974568 (Registered in England and Wales)
Telephone: +44 (0)20 7321 0123Email: [email protected]
Financial CalendarThe Company’s 2021 financial calendar is as follows:
Date Event
4 March 2021 2020 Full-Year Results Announcement4 March 2021 2020 Final Dividend – Announcement date18 March 2021 Publication of Annual Report and Notice of AGM21 April 2021 Trading Statement21 April 2021 AGM and Proxy Voting Results of AGM22 April 2021 Final Dividend – Ex-dividend date23 April 2021 Final Dividend – Record date14 May 2021 Final Dividend – Payment date29 June 2021 Trading Statement26 August 2021 2021 Half-Year Results Announcement26 August 2021 2021 Interim Dividend Announcement date7 October 2021 Interim Dividend – Ex-dividend date8 October 2021 Interim Dividend – Record date28 October 2021 Trading Statement29 October 2021 Interim Dividend – Payment date
Financial ReportsThe Company’s 2020 Annual Report and Accounts is available on the Company’s website from the date of publication. Shareholders may elect to receive a copy by contacting the Registrar. Copies of previous financial reports are available at www.huntingplc.com. In common with many public companies in the UK, the Company no longer publishes a printed version of its half-year report. The half-year report is only available online from the Company’s website at www.huntingplc.com.
RegistrarThe Company’s Registrar, Equiniti, offers a range of shareholder information and dealing services at www.shareview.co.uk. The address and contact details of Equiniti are as follows:
Equiniti LimitedAspect HouseSpencer Road, LancingWest Sussex BN99 6DATelephone:UK +44 (0)371 384 2173Overseas +44 (0)121 415 7047
Equiniti is also the Company’s single alternative inspection location where, with prior appointment, individuals can inspect the register of members.
Analysis of Ordinary ShareholdersAt 31 December 2020, the Company had 1,403 Ordinary shareholders (2019 – 1,454) who held 164.9m (2019 – 166.9m) Ordinary shares analysed as follows:
2020 2019
% of total shareholders
% of total shares
% of total shareholders
% of total shares
Size of holdings1 – 4,000 73.1 0.5 73.3 0.64,001 – 20,000 10.8 0.8 10.5 0.820,001 – 40,000 3.0 0.7 2.9 0.840,001 – 200,000 7.1 5.8 6.6 5.4200,001 – 500,000 2.4 7.1 3.0 8.3500,001 and over 3.6 85.1 3.7 84.1
Further information on share capital can be found in note 33.
209Hunting PLC Annual Report and Accounts 2020
Purpose and C
ultureB
usiness Model and S
takeholdersB
usiness Strategy
Perform
anceG
overnanceFinancial S
tatements

Shareholder and Statutory Information (unaudited) continued
Annual General Meeting 2021The AGM of the Company will take place on Wednesday 21 April 2021 at 5 Hanover Square, London, W1S 1HQ, commencing at 2.30p.m.
Format and Business of MeetingThe 2021 AGM is proposed to be a Closed Meeting, given the ongoing issues in relation to the COVID-19 pandemic. The health and safety of our shareholders and employees is of primary importance at this time and given the ongoing risks associated with travel, the Directors have decided to limit the attendance at the meeting to a quorum of two shareholders, who will comprise a Director and the Company Secretary.
The formal business of the AGM will involve putting to the meeting a number of ordinary and special resolutions. Details of the resolutions will be communicated to shareholders ahead of the meeting in a formal “Notice of AGM”. The Notice will also contain explanatory notes that will provide details to shareholders on how to lodge their vote. Those shareholders who have elected to continue to receive hard copy documentation or have signed up to receive a notification by e-mail will also receive a proxy form, which will contain details of how to lodge a vote by proxy.
The AGM is to be broadcast via the internet. Details of the weblink will be included in the Notice of AGM. Prior to the formal business of the AGM, a presentation will be delivered by the Chief Executive.
The Directors have made available to shareholders the ability to submit questions ahead of the AGM. These questions will be answered in the form of a presentation noted above. Shareholders are therefore asked to submit all questions, in relation to the business to be considered at the AGM, by Monday 19 April 2021, to the Company’s Registered Office, for the attention of the Company Secretary. Alternatively, questions can be submitted via email at [email protected].
Shareholder voting procedures follow the provisions of the Articles of Association of the Company (the “Articles”) and the UK Corporate Governance Code, including a separate resolution on each material item of business, the availability of voting via proxy and the offer of a “vote withheld”.
Voting on all resolutions at the AGM will be completed via proxy. Alternatively, shareholders may submit proxy voting instructions via the internet at www.sharevote.co.uk or via Equiniti’s online portfolio service, Shareview, if they are registered as a member. Alternatively, shares held in CREST may be voted through the CREST Proxy Voting Service. To be valid, all votes must be received no later than 2.30p.m. on Monday 19 April 2021.
The Directors have been authorised to allot and issue Ordinary shares and to disapply statutory pre-emption rights. These powers are exercised under authority of resolutions of the Company passed at its AGM. During the financial year ended 31 December 2020, no Ordinary shares were issued pursuant to the Company’s various share plans.
The Company has authority, renewed annually, to purchase up to 14.99% of the issued share capital, equating to 25,024,318 shares. Any shares purchased will either be cancelled and the number of Ordinary shares in issue reduced accordingly, held in treasury, sold for cash or (provided Listing Rule requirements are met) transferred for the purposes of or pursuant to an employee share scheme. During 2020, 2.0m Ordinary shares were purchased by the Company’s corporate broker and cancelled. As noted below, through the Group’s Employee Benefit Trust, 2,742,757 Ordinary shares were purchased in the year.
These powers are effective for 15 months from the date of shareholder approval, or up to the next general meeting where new authorities are sought. The Directors will be seeking a renewal for these powers at the 2021 AGM.
A new Directors’ Remuneration Policy (the “Policy”) will be put to shareholders for approval. The Policy is binding which means that after it takes effect, all payments to Directors by way of remuneration or for loss of office after that date must be made in accordance with the Policy. If approved, the Policy will take effect from the end of the AGM and will replace the Remuneration Policy approved by shareholders in 2018. The Policy can be found on pages 98 to 106 of the Company’s 2020 Annual Report and Accounts.
As part of the routine business to be considered at the AGM, all Directors’ will submit themselves for re-appointment, in addition to a resolution proposing the re-appointment of Deloitte LLP as auditor to the Company.
Documents on DisplayDue to the restrictions in place in respect to COVID-19, the inspection of copies of the executive Directors’ service contracts and letters of appointment of non-executive Directors is not possible at present. However, all enquiries in relation to the service contracts and letters of appointment can be addressed by writing to the Company Secretary.
Employee Benefit TrustThe Group operates an Employee Benefit Trust (the “Trust”) as a vehicle to satisfy share options and awards granted to employees who participate in the Company’s share-based incentive schemes. At 31 December 2020, the Trust held 2,562,281 Ordinary shares in the Company (2019 – 1,609,150). The Trust has a policy to purchase shares in the market or subscribe for new shares to partially meet the future requirements of these incentive schemes. The Trust has waived all dividends payable by the Company and voting rights in respect of the Ordinary shares held by it.
210Hunting PLC Annual Report and Accounts 2020

Share Capital Hunting PLC is a premium-listed public company limited by shares, with its Ordinary shares quoted on the London Stock Exchange.
The Company’s issued share capital comprises a single class, which is divided into 164,940,082 Ordinary shares of 25 pence each. All of the Company’s issued Ordinary shares are fully paid up and rank equally in all respects.
Details of the issued share capital of the Company and the number of shares held in treasury as at 31 December 2020 can be found in note 33 to the financial statements.
Subject to applicable statutes, shares may be issued with such rights and restrictions as the Company may, by ordinary resolution, decide, or(if there is no such resolution or so far as it does not make specific provision) as the Board (as defined in the Articles) may decide.
Voting Rights and Restrictions on Transfer of SharesHolders of Ordinary shares are entitled to receive dividends (when declared), receive the Company’s Annual Report and Accounts, attend and speak at general meetings of the Company, and appoint proxies or exercise voting rights.
On a show of hands at a general meeting of the Company, every holder of Ordinary shares present in person or by proxy and entitled to vote, has one vote and, on a poll, every member present in person or by proxy and entitled to vote has one vote for every Ordinary share held. None of the Ordinary shares carry any special rights with regard to control of the Company. Proxy appointments and voting instructions must be received by the Company’s Registrars no later than 48 hours before a general meeting.
A shareholder can lose their entitlement to vote at a general meeting where that shareholder has been served with a disclosure notice and has failed to provide the Company with information concerning interests in those shares. Shareholders’ rights to transfer shares are subject to the Articles.
Transfers of uncertificated shares must be carried out using CREST and the Directors can refuse to register a transfer of an uncertificated share in accordance with the regulations governing the operation of CREST.
The Directors may decide to suspend the registration of transfers, for up to 30 days a year, by closing the register of shareholders. The Directors cannot suspend the registration of transfers of any uncertificated shares without obtaining consent from CREST.
There are no restrictions on the transfer of Ordinary shares in the Company other than:
• certain restrictions that may, from time to time, be imposed by laws and regulations, for example insider trading laws; • pursuant to the Company’s share dealing code whereby the Directors and certain employees of the Company require approval to deal in the Company’s shares; and
• where a shareholder with at least a 0.25% interest in the Company’s certificated shares has been served with a disclosure notice and has failed to provide the Company with information concerning interests in those shares.
Interests in Voting RightsOther than as stated in the table on page 14, the Company is not aware of any further agreements between shareholders that may result in restrictions on the transfer of Ordinary shares or on voting rights.
Market CapitalisationThe market capitalisation of the Company at 31 December 2020 was £0.4bn (2019 – £0.7bn).
Share Price
2020p
2019p
At 1 January 417.4 480.0At 31 December 223.0 417.4High during the year 426.0 657.0Low during the year 120.1 363.8
DividendsThe Company normally pays dividends semi-annually. Details of the Company’s dividend policy is set out on page 13.
In place of the 2019 Final Dividend, the Company paid an interim dividend of 3.0 cents per share on 15 May 2020, which absorbed $4.9m of cash. In addition, the Company paid a second interim dividend of 2.0 cents per share to shareholders on 23 October 2020, which absorbed $3.3m of cash. The Board are recommending a Final Dividend for 2020 of 4.0 cents per share, to be paid to shareholders on 14 May 2021, subject to approval by shareholders at the Company’s 2021 AGM.
211Hunting PLC Annual Report and Accounts 2020
Purpose and C
ultureB
usiness Model and S
takeholdersB
usiness Strategy
Perform
anceG
overnanceFinancial S
tatements

Shareholder and Statutory Information (unaudited) continued
DirectorsPowers of the DirectorsSubject to the Articles, UK legislation and any directions prescribed by resolution at a general meeting, the business of the Company is managed by the Board. The Articles may only be amended by special resolution at a general meeting of shareholders. Where class rights are varied, such amendments must be approved by the members of each class of share separately.
Appointment and Replacement of DirectorsThe rules about the appointment and replacement of Directors are contained in the Articles. On appointment, in accordance with the Articles, Directors may be appointed by a resolution of the Board but are then required to be reappointed by ordinary resolution by shareholders at the Company’s next AGM.
Directors’ InterestsDetails of Directors’ remuneration, service contracts and interests in the Company’s shares and share options are set out in the Directors’ Remuneration Policy and Annual Report on Remuneration, located at www.huntingplc.com. Further information regarding employee long-term incentive schemes is given in note 37 of the financial statements.
Directors’ Conflict of InterestAll Directors have a duty under the Companies Act 2006 to avoid a situation in which they have, or could have, a direct or indirect conflict of interest with the Company. The duty applies, in particular, to the exploitation of any property, information or opportunity, whether or not the Company could take advantage of it. The Articles provide a general power for the Board to authorise such conflicts.
Directors are not counted in the quorum for the authorisation of their own actual or potential conflicts. Authorisations granted are recorded by the Company Secretary in a register and are noted by the Board. On an ongoing basis, the Directors are responsible for informing the Company Secretary of any new, actual or potential conflicts that may arise, or if there are any changes in circumstances that may affect an authorisation previously given. Even when provided with authorisation, a Director is not absolved from his or her statutory duty to promote the success of the Company. If an actual conflict arises post-authorisation, the Board may choose to exclude the Director from receipt of the relevant information and participation in the debate, or suspend the Director from the Board, or, as a last resort, require the Director to resign. As at 31 December 2020, no Director of the Company had any beneficial interest in the shares of Hunting’s subsidiary companies.
Statement of Disclosure of Information to AuditorsIn accordance with the Companies Act 2006, all Directors in office as at the date of this report have confirmed, so far as they are aware, there is no relevant audit information of which the Group’s auditors are unaware and each Director has taken all reasonable steps necessary in order to make themselves aware of any relevant audit information and to establish that the Group’s auditors are aware of that information. This confirmation should be interpreted in accordance with the provisions of Section 418 of the Companies Act 2006.
Research and DevelopmentGroup subsidiaries undertake, where appropriate, research and development to meet particular market and product needs. The amount expensed by the Group during the year was $5.0m (2019 – $4.2m).
Political ContributionsIt is the Group’s policy not to make political donations. Accordingly, there were no political donations made during the year (2019 – $nil).
Significant AgreementsThe Company is party to a revolving credit facility in which the counterparties can determine whether or not to cancel the agreement where there has been a change of control of the Company. The service agreements of the executive Directors include provisions for compensation for loss of office or employment as a result of a change of control.
Payments to GovernmentsIn accordance with the UK’s Disclosure and Guidance Transparency Rule 4.3A, Hunting PLC is required to report annually on payments made to governments with respect to its oil and gas activities. Hunting’s report on “Payments to Governments” for the year ended 31 December 2019 was published on 30 April 2020 and totalled $310,645.
Statement of Listing Rule ComplianceIn accordance with Listing Rule 9.8.4C, the Directors confirm that all waivers of dividends over the Company’s Ordinary shares are noted on page 210.
212Hunting PLC Annual Report and Accounts 2020

Glossary
A
AEDUnited Arab Emirates Dirham.
AGMAnnual General Meeting.
AMGAdvanced Manufacturing Group – combines the precision engineering and manufacturing capabilities in Hunting’s US segment for the Electronics division (Hunting Innova), Hunting Specialty and Hunting Dearborn product lines. Hunting is aiming to become a leading single source of MWD/LWD tools.
APIAmerican Petroleum Institute.
AUDAustralian dollar.
Average gross capital employed*See NGM N.
B
Basic EPS*Basic (loss) earnings per share – calculated by dividing the (loss) earnings from operations before amortisation and exceptional items attributable to Ordinary shareholders by the weighted average number of Ordinary shares in issue during the year.
bblBarrel of oil – one barrel of oil equals 159 litres or 42 US gallons.
BOEBarrel of oil equivalent.
bnBillion.
bopdBarrels of oil per day.
C
cCents.
CADCanadian dollar.
CAGRCompound annual growth rate.
Capital employed*See NGM G.
Capital investment – “Capex”*See NGM I.
CGUCash-generating unit.
CNYChinese Yuan Renminbi.
CO2
Carbon dioxide.
CO2(e)Carbon dioxide equivalent.
CO2 intensity factorScope 1 and 2 carbon dioxide equivalent metric, reported as kilogrammes per $’000 of revenue.
CPIConsumer Price Index.
CTRCurrency translation reserve.
D
DEFRAUK Department for Environment, Food & Rural Affairs.
Diluted EPS*Diluted (loss) earnings per share – calculated by dividing (loss) earnings from operations before amortisation and exceptional items attributable to Ordinary shareholders by the weighted average number of Ordinary shares in issue during the year, as adjusted to assume conversion of all dilutive potential Ordinary shares. Dilution arises through the possible issue of shares to satisfy awards made under the Group’s long-term incentive plans. When the effect of dilutive share options and long-term incentive plans is anti-dilutive, they are not included in the calculation of diluted (loss) earnings per share.
Dividend cover*See NGM M.
DownholeDownhole refers to something that is located within the wellbore.
DPS*See NGM L.
E
EBITDA*See NGM A.
EBTEmployee Benefit Trust.
EMEAEurope, Middle East and Africa.
ESOPExecutive Share Option Plan.
ETREffective tax rate.
ExCoThe Hunting Executive Committee.
213Hunting PLC Annual Report and Accounts 2020
Purpose and C
ultureB
usiness Model and S
takeholdersB
usiness Strategy
Perform
anceG
overnanceFinancial S
tatements
Glossarycontinued
F
FCAFinancial Conduct Authority.
FRCFinancial Reporting Council.
Free cash flow*See NGM K.
FVLCDFair value less costs of disposal.
G
GAAPGenerally Accepted Accounting Principles.
GHGGreenhouse gas.
GWhGiga-watt hours.
H
HMRCHer Majesty’s Revenue and Customs.
HPSPHunting Performance Share Plan.
HRSPHunting Restricted Share Plan.
HSEHealth, Safety and Environment.
I
IASInternational Accounting Standards.
IFRICInternational Financial Reporting Interpretations Committee.
IFRSInternational Financial Reporting Standards as adopted by the European Union.
Incident rateThe US Occupational Safety and Health Administration (“OSHA”) Recordable Incident Rate (or Incident Rate) is calculated by multiplying the number of recordable incidents by 200,000 and then dividing that number by the number of labour hours worked.
Intensity factorThe total controlled Scope 1 and Scope 2 emissions divided by the total revenue of the Group.
Internal manufacturing reject ratePercentage of parts rejected during the manufacturing process.
Inventory days*See NGM D.
IOCInternational Oil Company.
IPIntellectual Property.
ISOInternational Standards Organization.
K
kThousand.
kWhKilowatt hours.
L
LeanA production practice that eliminates wasteful processes, thereby reducing production time and costs, and improving efficiency.
LIBORLondon Inter-bank Offered Rate.
LNGLiquefied Natural Gas.
LPGLiquefied Petroleum Gas.
LTIPLong-Term Incentive Plan.
M
mMillion.
m3
Cubic metre.
mcf1,000 cubic feet.
mmBtuMillion British thermal units.
MWD/LWDMeasurement-while-drilling/Logging-while-drilling.
MXNMexican Peso.
N
Net cash/debtSee note 26.
NGMNon-GAAP measure – see pages 203 to 207.
NOCNational Oil Company.
NRVNet realisable value.
NYMEXNew York Mercantile Exchange.
214Hunting PLC Annual Report and Accounts 2020

O
OCIOther comprehensive income.
OCTGOil Country Tubular Goods – pipe and tubular goods and products used in the oil and gas industry, such as drill pipe, pipe casing and production pipes.
OECDThe Organisation for Economic Co-operation and Development.
OEMOriginal equipment manufacturer.
OOROrganic oil recovery.
OPECOrganization of the Petroleum Exporting Countries.
P
pPence.
PCBPrinted circuit board.
PCEPressure control equipment.
PDMRPerson discharging managerial responsibilities.
PPEProperty, plant and equipment.
PSIPounds per square inch.
PSP2009 Performance Share Plan.
Q
QMSQuality Management System.
R
RCFRevolving Credit Facility.
Recordable incidentsAn incident is recordable if it results in any of the following: death, days away from work, restricted work or transfer to another job, medical treatment beyond first aid, or loss of consciousness. Also included are any significant injuries or illnesses diagnosed by a physician or other licensed health care professional, even if it does not result in death, days away from work, restricted work or job transfer, medical treatment beyond first aid, or loss of consciousness.
ROCE*See NGM N.
S
Scope 1Scope 1 emissions are direct GHG emissions from sources that are owned or controlled by the entity. Scope 1 emissions include fossil fuels burned on site, emissions from vehicles and other direct sources.
Scope 2Scope 2 emissions are indirect GHG emissions resulting from the generation of electricity, heating and cooling or steam generated off site but purchased by the entity.
SIDSenior Independent Director.
SHARPSafety and Health Achievement Recognition Programme.
SOFRSecured Overnight Financing Rate.
SONIASterling Overnight Index Average.
T
TCFD Task Force on Climate-related Financial Disclosures.
Trade Receivable days* See NGM E.
TSR*Total Shareholder Return – the net share price change plus the dividends paid during that period.
U
UAEUnited Arab Emirates.
UnderlyingResults for the year, as reported under IFRS, adjusted for amortisation of intangible assets arising on the acquisition of businesses (“acquired intangible assets”) and exceptional items, which is the basis used by the Directors in assessing performance.
UKCSUnited Kingdom Continental Shelf, the portion of the North Sea within the UK’s territorial waters.
UKUnited Kingdom.
UKLAUK Listing Authority.
USUnited States.
USDUS dollar.
W
WellboreThe wellbore refers to the drilled hole.
Well completionWell completion refers to the processes of preparing a well for production. This involves the assembly of downhole tubulars and equipment required to enable safe and efficient production from an oil or gas well.
Well constructionWell construction refers to the initial drilling and processes of constructing the wellbore in an oil and gas well. These processes typically include drilling and logging the hole; running, cementing and logging the casing; hydraulic fracturing or stimulating the well and monitoring well performance and integrity.
Well interventionWell intervention refers to any operation carried out on an oil or gas well that maintains or enhances the production of the well or provides well diagnostics.
Working capital*See NGM C.
WTIWest Texas Intermediate – the price per barrel of Texas light sweet crude oil.
* Non-GAAP measure.
215Hunting PLC Annual Report and Accounts 2020
Purpose and C
ultureB
usiness Model and S
takeholdersB
usiness Strategy
Perform
anceG
overnanceFinancial S
tatements

Professional Advisers
SolicitorsCMS Cameron McKenna Nabarro Olswang LLP
Independent AuditorsDeloitte LLP
Joint Corporate BrokersBarclays Bank PLC and RBC Capital Markets
Financial AdvisersDC Advisory Limited
Insurance BrokersWillis Towers Watson
Pension Advisers & ActuaryLane Clark & Peacock LLP
Financial Public RelationsBuchanan Communications Limited
Registrars & Transfer OfficeEquiniti LimitedAspect HouseSpencer Road, LancingWest Sussex BN99 6DA
Telephone:UK +44 (0)371 384 2173Overseas +44 (0)121 415 7047
216Hunting PLC Annual Report and Accounts 2020

Designed and produced by Gatherwww.gather.london
Printed by CPI ColourThis product is made of material from well-managed, FSC®-certified forests and other controlled sources
CPI Colour is certified to ISO 14001 Environmental Management System and the EU Eco-Management and Audit Scheme (EMAS)

www.huntingplc.com
Hunting PLC5 Hanover SquareLondon W1S 1HQUnited KingdomTel: +44 (0)20 7321 0123Fax: +44 (0)20 7839 2072