11367_2013_555_moesm1_esm.docx - springer …10.1007... · web viewspain (castilla-y-leon) corn, at...
TRANSCRIPT

EXERGY-BASED ACCOUNTING FOR LAND AS A NATURAL RESOURCE IN LIFE CYCLE ASSESSMENT
Rodrigo A. F. de Alvarenga* 1, Jo Dewulf 1, Herman Van Langenhove 1, Mark A. J. Huijbregts 2
1Department of Sustainable Organic Chemistry and Technology, Research Group EnVOC, Ghent University, Coupure Links 653, Ghent, B-9000, Belgium.
2Department of Environmental Sciences, Institute for Water and Wetland Research, Radboud University Nijmegen, P.O. Box 9010, 6500 GL, Nijmegen, The Netherlands.
*Corresponding author footnote: E-mail: [email protected]; [email protected] . Telephone: (++32) 9 264 99 27. Fax: (++32) 9 264 62 43.
SUPPORTING INFORMATION
Contents:
Supporting Information S1: Forest Systems Supporting Information S2: Exergy calculations Supporting Information S3: Information on the products from case study 1 Supporting Information S4: Information on the products from case study 2 Supporting Information S5: Maps with larger scale Supporting Information S6: Files for the map with site-dependent CF (at grid level) Supporting Information S7: Site-dependent CF at country and regional level Supporting Information S8: CF of land resources implemented into ecoinvent reference flows References used for the Supporting Information
23 pages14 Tables17 Figures
S1

SUPPORTING INFORMATION S1: FOREST SYSTEMS
Detailed information of the two systems presented in Figure 1 of the paper, exclusively for forests. Natural forest systems are sub-divided in four.
Table S1 – S1: Description of forest types for the two systems from Figure 1 of the research paper.
Forest systems
Natural systemHuman-made
systemSustainable extraction
Unsustainable extraction
(A) Natural managed
forests
(B) Secondary managed
forestsClassification according to
Carle and Holmgren
(2008)
"Primary" "Primary" "Modified natural"
"Modified natural" and
"Semi-natural, planted"
"Semi-natural, assisted natural regeneration",
"Plantation, productive", and
"Plantation, protective"
Explanation
Natural Forests, where
the human intervention is
negligible. Extractions of forest products (fruits, natural
gum) may happen, but in a small scale
Natural Forests with high human intervention, but
only for extraction. The forest products are extracted
much faster than their regrowth,
leading to species’
extinctions, or deforestation
Natural Forests, where
the human intervention is moderate, and the extractions may occur at a high rate, but in
a sustainable way
Secondary forests (may be planted) with low human intervention
during its growth,
allowing it to work similar to a natural forest.
The forestry processes are
extensive
Forest with high human interference during the
whole forest cycle (intensive management)
Net Primary Production
= Potential NPP = Potential NPP ≈ Potential
NPP≈ Potential
NPP ≠ Potential NPP (usually)
Biotic extraction (harvesting)
Negligible or few
(sustainable)Unsustainable Sustainable Ssustainable Similar to
agriculture harvest
Forestry Negligible (small scale) Intensive Extensive Extensive Intensive
The biomass extracted…
regenerates naturally
doesn’t grow back (in a short
time length)
regenerates naturally
is planted again or regenerates
naturally
is planted again or regenerates naturally, but
through intensive management
SUPPORTING INFORMATION S2: EXERGY CALCULATIONS
For exergy calculations on biomass, we used two methods: (a) Group contribution; (b) By β-LHV. For both of them, the data was collected basically from Phillys Database (Phyllis 2011) (except for ‘ roots from grass’, where we got from Saunders et al. (2006), since Phillys database didn’t have it). Depending on the data available, we performed the calculations for either method. For the data in which information was available on the chemical compounds and their percentage, we performed the group contribution method, and for the data where there was available only information on the atomic percentage of carbon, oxygen, nitrogen, and hydrogen, and their LHV, we performed the calculations of the method (b).
S2

For method (a), we needed the exergy for several chemical compounds: (1) Cellulose; (2) Hemicellulose; (3) Starch; (4) Lignin; (5) Total non-structural carbohydrates; (6) Proteins; (7) Lipids; (8) Oils; (9) Extractives, hot water; (10) Ash; among others that we did not consider (e.g., extractives EtOH/toluene). The procedure to obtain the exergy value of each chemical compound will be explained below:
(1) Cellulose
For cellulose we considered the polymer of glucose (Figure S2 – S1). The molecular weight considered was 162.1402 g/mol and the chemical exergy was 3005.89 kJ/mol. Therefore, the exergy value is 18.54 MJex/kgDM.
Figure S2 – S1: Polymer of cellulose
(2) Hemicellulose
For Hemicellulose we considered the polymer of Xylan (Figure S2 – S2), as it is considered as the most abundant in hemicellulose. The molecular weight considered was 951.804 g/mol and the chemical exergy was 18986.59 kJ/mol. Therefore, the exergy value is 19.95 MJex/kgDM.
Figure S2 – S2: Polymer of Xylan
(3) Starch
For starch we considered starch, per se (Figure S2 – S3). The molecular weight considered was 162.1402 g/mol and the chemical exergy was 3005.89 kJ/mol. Therefore, the exergy value is 18.54 MJex/kgDM.
Figure S2 – S3: Polymer of Starch considered in the study
S3

(4) Lignin
For lignin, we considered a polymer that is most seen in the lignin structure (Figure S2 – S4). With a molecular weight of 179.1921 g/mol and a chemical exergy of 5220.45 kJ/mol, its exergy value is 29.13 MJex/kgDM.
Figure S2 – S4: Polymer of Lignin considered in the study
(5) Total non-structural carbohydrates
For Total non-strucutral carbohydrates, we considered an average value of glucose, fructose, and sucrose. Their exergy values were either calculate through group contribution method, or obtained in tables from Szargut (1988), and were respectively: 16.52 MJex/kgDM, 16.38 MJex/kgDM, and 17.55 MJex/kgDM. Therefore, the average value used for the compound was 16.82 MJex/kgDM. The chemical structure of them are presented below (Figure S2 – S5).
Figure S2 – S5: Chemical structure of glucose (a), fructose (b), and sucrose (c)
(6) Proteins
For proteins, we searched in literature which would be the most abundant aminoacids in plants. We used data from three different authors: (a) Akubugwo et al. (2007) considered the aminoacids in Amaranthus hybridus leaves; (b) Glew et al. (2010) considered the aminoacids present in shoots and leaves from Abrus precatorius, the nuts from Burnatia enneandra and the leaves and stems from Cadaba farinose, and finally, (c) Yeoh et al. (1984) considered the amino acids present in Mimosoideae species, Caesalpinioideae species, and Papilionoideae species. We considered only the ten most abundant amino acids. We used the average results, coming up with the following numbers (Table S2 – S1):
S4

Table S2 – S1: Average composition and exergy value of aminoacids considered for proteins in biomass
Aminoacid Average composition Exergy of their polymers (MJex/kgDM)
Glutamic acid 22.6% 19.21Aspartic acid 16.8% 15.89Leucine 11.3% 32.90Proline 7.7% 30.73Arginine 7.2% 25.87Serine 7.0% 18.63Phenylalanine 7.0% 32.93Lysine 7.0% 30.52Alanine 6.8% 24.96Glycine 6.6% 19.78 Average 100% 23.71
(7) Lipids and (8) Oils
For lipids and oils, we considered an average value of triglycerides. Through literature (Glew et al. (2010) and Rezanka and Rezanková (1999)) we made an average composition of triglycerids monomers present in some plants: (a) Glew et al. (2010) considered the fatty acids present in shoots and leaves from Abrus precatorius, the nuts from Burnatia enneandra and the leaves and stems from Cadaba farinose; while Rezanka and Rezanková (1999) considered the fatty acids present in vegetable oils (from corn, cotton, grape, olive, peanut, soy, palm, cocoa, and sunflower). We considered only the five most abundant fatty acids. The average contribution of each monomer and their exergy value, presented below (Table S2 – S2):
Table S2 – S2: Average composition and exergy value of triglycerids’ monomers considered for the average composition for triglycerides in biomass
Monomer of the triglycerides Average composition Exergy of their triglycerides (MJex/kgDM)
Linoleic acid (C18:2) 34.83% 39.46Oleic acid (C18:1) 26.57% 39.74Palmitic acid (C16:0) 21.83% 39.35Stearic acid (C18:0) 10.03% 40.02Linolenic acid (C18:3) 6.74% 39.17 Average 100% 39.55
(9) Extractives, hot water
As was done for proteins and for lipids and oils, for Extractives (hot water), we searched in literature what would be the most abundant extractives from hot water in biomass. We used the substances and their amount presented by Hartonen et al. (2007) considering only the four most abundant ones. Their average amount and exergy values are presented below (Table S2 – S3):
S5

Table S2 – S3: Average composition and exergy value of extractives, from hot water, considered for the compound ‘Extractives, hot water’
Extractives Amount of each extractive in biomass
Exergy of each extractive (MJex/kgDM)
Dihydrokaempferol (aromadendrin) 44% 24.14Naringin 27% 22.88Naringenin 25% 26.30Taxifolin 3% 22.35 Average 100% 24.29
(10) Ash
For Ash in biomass, we used the mixture considered in Brehmer et al. (2008) which consists of: 35% of SiO2, 30% of K2O, 15% of CaO, 10% of P2O5, 5% of MgO and 5% of Na2O. We simply made a weighted sum of their exergy values, obtaining a final value of 2.11 MJex/kgDM
(11) Exergy values for the group composition method
Table S2 – S4: Exergy values considered
Compound Exergy value (MJex/kgDM)Cellulose 18.54Hemicellulose 19.95Starch 18.54Lignin 29.13Total non-structural carbohydrates 16.82Proteins 23.71Lipids 39.55Oils 39.55Extractives, hot water 24.29Ash 2.11
(12) Calculation of the conversion factor, from carbon to exergy
In this section we will present the calculation of the conversion factor of the Oak tree, for illustration:
Oak tree: For this species, there was data available only on the wood and leaves, at Phyllis database. Data on roots were not available and therefore we used data from “Wood, pine roots” (the only available data on roots from trees in this database). The data used for the oak tree, for the three compartments (roots, wood, leaves) are in Table S2 – S5.
S6

Table S2 – S5: Data used for Oak tree
Compartment Roots Leaves Wood
Name at Phyllis database Wood, pine roots Fallen leaves, oak Wood, oak
HHVdry (kJ/kgDM) 19078LHVdry (kJ/kgDM) 17769C (% of DM) 49.5H (% of DM) 6.0O (% of DM) 44.5N (% of DM) 0.0Cellulose (g) 44.6 29.6Hemicellulose (g) 25.6 26.4Lignin (g) 31.3 24Lipids (g) 0 10.1Protein (g) 0 4.4Extractives hot water (g) 0 11Total (g) 101.5 105.5
The roots and leaves were calculated with the group contribution method, using the data from Table S2 – S4 and Table S2 – S5. The wood was calculated through the β-LHV, using equation 1 and 2.
Chemical exergy = β x LHV (1)
(2)
The values to be put in equation 2 are supposed to be the atomic ratio of the elements. Therefore, in the case of the data from Oak wood, the values to be put in equation 2 are presented in Table S2 – S6 (atomic ratio).
Table S2 – S6: Transformation of the atomic fraction to the atomic ratio
Elements Percentage (%) Atomic weight Atomic ratioC 49.5 12 4.12H 6.0 1 6.00O 44.5 16 2.78N 0.0 14 0.00
The values from the column “atomic ratio”, from Table S2 – S6, were implemented to equation 2, and can be seen in equation 3. From the result of β (1.127), we calculated the chemical exergy value of Oak wood (equation 4). After this we multiplied the chemical exergy value of each compartment (e.g. leaves) with the respective percentage of NPP from the biome “Temperate broadleaf and mixed forest”, from Luyssaert et al. (2007), obtaining a chemical exergy value per mass of dry matter, as demonstrated in Table S2 – S7.
= 1.127 (3)
Chemical exergy = β x LHV = 1.127 x 17769 = 20025 kJex/kgDM = 20.025 MJex/kgDM (4)
S7

Table S2 – S7: Chemical exergy value of Oak tree from a “Temperate broadleaf and mixed forest” biome
Roots Leaves WoodChemical exergy value (MJex/kgDM) 22.1 24.1 20.0Fraction contributing to the total NPP at the respective biome (Luyssaert et al., 2007) 37% 23% 39%
Chemical exergy value of the NPP from Oak tree, from a Temperate broadleaf and mixed forest biome (MJex/kgDM) 21.5
Considering that 1 kgDM contains 0.5 kg of carbon (a common conversion factor used in literature), we obtained a chemical exergy of 43.0 MJex/kgC for the Oak tree from Temperate broadleaf and mixed forest biome. The same procedure was done for all other species with data available in Phyllis database, for the same biome, and an average value for the aforementioned biome was calculated. This was done in all biomes (except mangroves), and an average conversion factor was obtained, as expressed in table S2 – S8.
Table S2 – S8: Conversion factors for thirteen biomes and their average value (which was used in the manuscript)
Biome – according to Olson et al. (2001) Conversion factor (MJex/kgC)Tropical and subtropical moist broadleaf forests 43.4Tropical and subtropical dry broadleaf forest 43.0Tropical and subtropical coniferous forests 43.9Temperate broadleaf and mixed forests 43.2Temperate coniferous forests 43.7Boreal forests/taiga 43.0Mediterranean forests, woodlands, and scrub or Sclerophyll forests 42.7Tropical and subtropical grasslandas, savannas, and shrublands 41.7Temperate grasslandas, savannas, and shrublands 43.0Flooded grasslands and savannas 42.1Montane grasslands and shrublands 42.6Tundra 41.2Desert and xeric shrublands 43.5Average value (used in the manuscript) 42.9
SUPPORTING INFORMATION S3: INFORMATION ON THE PRODUCTS FROM CASE STUDY 1
In the Table S3 – S1, it can be seen the LCI inventory considered in the case study, for 1m 3 of round wood, in a forest road. For the first case (human-made), we based the data on a process from ecoinvent database (ecoinvent, 2010) called “Roundwood, paraná pine (SFM), under bark, u=50%, at forest road/BR”. According to ecoinvent report, this type of wood is produced both in plantations and managed natural forests, but for our case study we assumed it was produced exclusively in plantations, therefore human-made systems. For the second case, which is also from a human-made system, we considered the data from the ecoinvent process called “Roundwood, eucalyptus ssp. (SFM), under bark, u=50%, at forest road/TH”. For natural system, we used data from the process “Roundwood, meranti (SFM), under bark, u=70%, at forest
S8

road/MY”, and from the process “Round wood, azobe (SFM), under bark, u=30%, at forest road”. A discussion on the quality of the data from ecoinvent database for round wood, used in the case studies, is out of the scope of this paper.
Table S3 – S1: Land resources inventoried in the life cycle of the four products used in case study 1 (according to ecoinvent database), with function unit of 1m3
System Process nameLand resources inputs
Energy (in biomass, HHV) (MJ)
Land occupation (m2.year)
Human-made Parana Pine (Brazil) 13,032.00 6,120.00Human-made Eucalyptus (Thailand) 24,294.00 360.00Natural Meranti (Malaysia) 19,068.00 32,600.00Natural Azobe (Cameroon) 26,513.00 17,940.00
SUPPORTING INFORMATION S4: INFORMATION ON THE PRODUCTS FROM CASE STUDY 2
The name of the processes used in case study 2 can be seen in Table S4 – S1. Except for Barley from France and Wheat grains from Spain, the other seven processes did not have details on the region where the data came from. For this reason, we assumed specific regions for them, which are also in the table below.
Table S4 – S1: Information regarding case study 2, on the processes’ names at ecoinvent database (ecoinvent, 2010)
Process’ name Country (region)
Barley grains conventional, Barrois, at farm/FR France (Barrois)
Wheat grains conventional, Castilla-y-Leon, at farm/ES Spain (Castilla-y-Leon)
Corn, at farm/US USA (Illinois)
Potatoes, at farm/US USA (Washington)
Soybeans, at farm/BR Brazil (Mato Grosso)
Sugarcane, at farm/BR Brazil (Sao Paulo)
Sweet sorghum grains, at farm/CN China (Jiangsu)
Palm fruit bunches, at farm/MY Malaysia (Sarawak)
Roundwood, eucalyptus ssp. (SFM), under bark, u=50%, at forest road/TH Thailand (Khon Kaen)
SUPPORTING INFORMATION S5: MAPS WITH LARGER SCALE
In order to better visualize, through maps, the variability of data with a continent or a country, we elaborated several figures of maps, with larger scales. The legend used in the map from Figure 2, from the manuscript, was kept the same for all the other figures, for better visualization.
S9

Figure S5 – S1: Characterization factors (for human-made systems) in Europe
Figure S5 – S2: Characterization factors (for human-made systems) in Africa
S10

Figure S5 – S3: Characterization factors (for human-made systems) in North America, Central America, and Caribbean
Figure S5 – S4: Characterization factors (for human-made systems) in South America
S11

Figure S5 – S5: Characterization factors (for human-made systems) in Asia (east)
Figure S5 – S6: Characterization factors (for human-made systems) in Asia (west)
S12

Figure S5 – S7: Characterization factors (for human-made systems) in Oceania and Austrilia (which is sub-divided in administrative regions)
Figure S5 – S8: Characterization factors (for human-made systems) in Russia
Figure S5 – S9: Characterization factors (for human-made systems) in China
S13

Figure S5 – S10: Characterization factors (for human-made systems) in Canada
Figure S5 – S11: Characterization factors (for human-made systems) in the USA
Figure S5 – S12: Characterization factors (for human-made systems) in Brazil
S14

SUPPORTING INFORMATION S6: FILES FOR THE MAP WITH SITE-DEPENDENT CF (AT GRID LEVEL)
The image files and the ASCII file for the map with site-dependent CF can be accessed through the files available as supplementary material.
SUPPORTING INFORMATION S7: SITE-DEPENDENT CF AT COUNTRY AND REGIONAL LEVEL
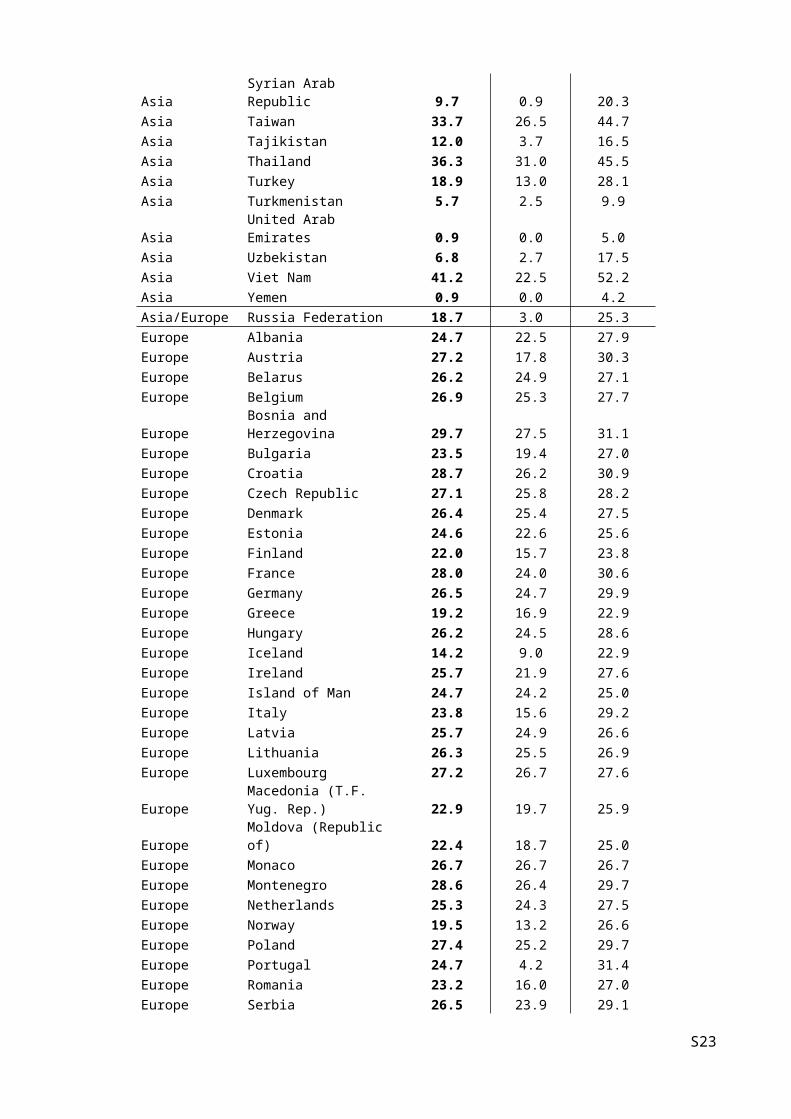
We calculated the site-dependent CF of 165 countries (Table S7 – S1). We were not able to calculate site-dependent CF for other countries because the data was not available in Haberl et al. (2007). Note that the variability of the values for each country are related to the individual grid cells within each country, while the site-dependent CF are related to the weighted-to-the-area average from that country.
Table S7 – S1: Site-dependent CF at country level for 165 countries, with their variability in the values
CF (MJex/m2.year)
Variability of the values (MJex/m2.year)
Continent Country Mean value 2,5th
percentile97,5th
percentileAfrica Algeria 1.8 0.0 18.3Africa Angola 33.1 3.6 46.0Africa Benin 27.8 23.7 30.4Africa Botswana 14.8 3.0 28.1Africa Burkina Faso 24.5 18.6 29.2Africa Burundi 43.9 41.4 46.3Africa Cameroon 39.3 23.8 48.5Africa Central African Rep. 39.0 24.0 49.1Africa Chad 10.5 0.0 26.5Africa Congo 45.3 37.2 49.5Africa Côte d'Ivoire 35.7 29.4 42.5Africa Dem. Rep. of Congo 42.6 31.6 52.1Africa Djibouti 11.5 4.5 17.7Africa Egypt 0.2 0.0 2.1Africa Equatorial Guinea 42.5 39.8 45.4Africa Eritrea 8.4 1.0 20.8Africa Ethiopia 25.7 3.6 45.3Africa Gabon 39.8 36.7 47.0Africa Gambia 24.7 22.1 27.3Africa Ghana 30.5 25.9 35.5Africa Guinea 32.3 26.3 43.0Africa Guinea-Bissau 26.1 24.8 27.5Africa Kenya 27.9 5.3 59.6Africa Lesotho 34.7 29.4 38.5
S15

Africa Liberia 41.5 37.9 43.8Africa Libyan Arab Jamah. 0.7 0.0 7.1Africa Madagascar 42.1 27.0 59.3Africa Malawi 31.8 27.1 36.4Africa Mali 11.0 0.0 28.5Africa Mauritania 2.8 0.0 15.9Africa Morocco 10.8 0.5 23.8Africa Mozambique 31.6 26.1 38.1Africa Namibia 8.6 0.0 27.3Africa Niger 6.2 0.0 24.6Africa Nigeria 28.3 17.0 39.3Africa Rwanda 46.3 42.6 48.3Africa Senegal 22.6 10.6 28.3Africa Sierra Leone 32.5 29.8 36.8Africa Somalia 5.4 0.0 22.6Africa South Africa 16.7 1.7 39.3Africa Sudan 14.9 0.0 38.7Africa Swaziland 27.0 23.9 30.1Africa Togo 29.5 26.3 31.8Africa Tunisia 6.3 0.2 18.3Africa Uganda 49.6 33.3 59.0Africa United Rep. Tanzania 35.5 30.2 45.7Africa Western Sahara 0.4 0.0 0.9Africa Zambia 31.2 28.1 35.7Africa Zimbabwe 27.0 12.8 35.4Asia Afghanistan 8.4 0.3 18.8Asia Armenia 16.0 9.9 22.3Asia Azerbaijan 15.8 10.2 20.7Asia Bangladesh 36.7 30.8 43.1Asia Bhutan 27.4 12.8 33.6Asia Brunei Darussalam 48.0 46.2 50.2Asia Cambodia 40.4 34.5 46.5Asia China 16.0 0.0 29.0Asia Cyprus 17.9 16.6 20.0Asia Georgia 25.9 19.2 31.2Asia India 23.5 3.0 39.1Asia Indonesia 49.2 35.7 58.6Asia Iran (Islamic Rep. of) 7.8 0.4 15.7Asia Iraq 6.7 0.3 19.9Asia Israel 7.5 0.0 19.1Asia Japan 25.7 23.8 28.5Asia Jordan 2.0 0.0 12.8Asia Kazakhstan 13.0 2.9 22.9Asia Korea (Dem. Ppl's. Rep. of) 26.0 24.1 27.7Asia Korea (Republic of) 27.2 25.7 29.0Asia Kuwait 2.2 1.4 3.6Asia Kyrgyzstan 16.2 7.8 23.9Asia Lao People's Dem. Rep. 42.0 34.8 51.9
S16

Asia Lebanon 18.3 15.0 20.2Asia Malaysia 48.3 42.7 55.4Asia Myanmar 34.0 25.5 42.5Asia Nepal 23.0 3.0 31.2Asia Oman 0.6 0.0 2.4Asia Pakistan 5.5 0.0 27.2Asia Papua New Guinea 48.5 43.3 57.6Asia Philippines 45.1 35.1 52.5Asia Qatar 1.0 0.7 1.4Asia Republic of Mongolia 8.2 0.3 20.1Asia Saudi Arabia 0.4 0.0 1.9Asia Sri Lanka 40.1 27.9 49.3Asia Syrian Arab Republic 9.7 0.9 20.3Asia Taiwan 33.7 26.5 44.7Asia Tajikistan 12.0 3.7 16.5Asia Thailand 36.3 31.0 45.5Asia Turkey 18.9 13.0 28.1Asia Turkmenistan 5.7 2.5 9.9Asia United Arab Emirates 0.9 0.0 5.0Asia Uzbekistan 6.8 2.7 17.5Asia Viet Nam 41.2 22.5 52.2Asia Yemen 0.9 0.0 4.2Asia/Europe Russia Federation 18.7 3.0 25.3Europe Albania 24.7 22.5 27.9Europe Austria 27.2 17.8 30.3Europe Belarus 26.2 24.9 27.1Europe Belgium 26.9 25.3 27.7Europe Bosnia and Herzegovina 29.7 27.5 31.1Europe Bulgaria 23.5 19.4 27.0Europe Croatia 28.7 26.2 30.9Europe Czech Republic 27.1 25.8 28.2Europe Denmark 26.4 25.4 27.5Europe Estonia 24.6 22.6 25.6Europe Finland 22.0 15.7 23.8Europe France 28.0 24.0 30.6Europe Germany 26.5 24.7 29.9Europe Greece 19.2 16.9 22.9Europe Hungary 26.2 24.5 28.6Europe Iceland 14.2 9.0 22.9Europe Ireland 25.7 21.9 27.6Europe Island of Man 24.7 24.2 25.0Europe Italy 23.8 15.6 29.2Europe Latvia 25.7 24.9 26.6Europe Lithuania 26.3 25.5 26.9Europe Luxembourg 27.2 26.7 27.6Europe Macedonia (T.F. Yug. Rep.) 22.9 19.7 25.9Europe Moldova (Republic of) 22.4 18.7 25.0Europe Monaco 26.7 26.7 26.7
S17

Europe Montenegro 28.6 26.4 29.7Europe Netherlands 25.3 24.3 27.5Europe Norway 19.5 13.2 26.6Europe Poland 27.4 25.2 29.7Europe Portugal 24.7 4.2 31.4Europe Romania 23.2 16.0 27.0Europe Serbia 26.5 23.9 29.1Europe Slovakia 28.2 25.4 29.9Europe Slovenia 29.8 28.2 30.8Europe Spain 23.0 14.7 31.9Europe Sweden 22.0 12.3 27.5Europe Switzerland 24.4 12.0 28.8Europe Ukraine 24.5 18.5 28.8Europe United Kingdom 23.2 18.5 28.8Central America Belize 49.8 43.2 52.9Central America Costa Rica 51.7 38.3 62.7Central America El Salvador 40.9 37.8 43.8Central America Guatemala 48.2 40.3 55.7Central America Honduras 50.9 39.9 57.9Central America Nicaragua 49.3 36.3 58.5Central America Panama 52.1 45.6 63.6Caribbean Cuba 39.7 32.1 45.9Caribbean Dominican Republic 51.3 40.3 56.3Caribbean Haiti 45.2 34.2 54.9Caribbean Jamaica 44.8 43.5 46.8Caribbean Puerto Rico 53.8 51.2 55.0Caribbean Trinidad and Tobago 44.9 44.4 45.5North America Canada 17.3 0.0 26.2North America Mexico 21.8 1.5 46.0North America United States 19.8 3.0 29.3Oceania Australia 17.3 2.1 34.9Oceania New Zeland 30.7 26.2 35.1South America Argentina 24.0 4.8 36.6South America Bolivia 34.6 4.0 48.3South America Brazil 38.8 26.7 50.1South America Chile 14.7 0.0 30.6South America Colombia 45.6 31.5 56.0South America Ecuador 39.2 26.2 47.5South America French Guiana 49.2 47.0 51.5South America Guyana 49.1 46.2 53.9South America Paraguay 36.8 27.1 53.0South America Peru 33.7 1.2 51.0South America Suriname 48.0 46.2 50.5South America Uruguay 31.7 29.8 33.3South America Venezuela 42.5 25.5 55.2
S18

We also calculated site-dependent CF at regional level for the six largest countries in area: (1) Russia, with 88 adminstrative regions; (2) Canada, with 13 adminstrative regions; (3) China, with 33 adminstrative regions; (4) USA, with 51 adminstrative regions; (5) Brazil, with 28 adminstrative regions; and (6) Australia, with 8 adminstrative regions. The values can be seen in Table S7 – S2. Note that the variability of the values for each region are related to the individual grid cells within each region, while the site-dependent CF are related to the weighted-to-the-area average from that region.
Table S7 – S2: Site-dependent CF at regional level for the six largest countries in area, with their variability in the values
Country Administrative region
CF (MJex/m2.year)Variability of the values
(MJex/m2.year)
Mean value2,5th
percentile97,5th
percentileRussia Adygeya 27.7 25.6 29.8Russia Aga Buryat 20.0 18.0 21.0Russia Altay 23.1 19.8 26.2Russia Amur 22.2 17.2 25.6Russia Arkhangelsk 18.1 0.0 23.7Russia Astrakhan 12.4 8.7 15.9Russia Bashkortostan 23.5 21.4 25.1Russia Belgorod 23.4 21.8 25.2Russia Bryansk 26.0 24.9 27.0Russia Buryat 20.4 16.7 23.6Russia Chechnya 21.0 15.2 23.8Russia Chelyabinsk 24.3 22.2 25.9Russia Chita 20.5 17.1 22.8Russia Chukot 8.8 0.0 14.7Russia Chuvash 22.7 21.8 23.3Russia City of St. Petersburg 24.3 24.0 24.5Russia Dagestan 18.0 13.1 23.1Russia Evenk 17.0 10.5 22.0Russia Gorno-Altay 21.9 10.2 27.0Russia Ingush 24.5 23.2 25.5Russia Irkutsk 21.1 17.4 24.0Russia Ivanovo 23.0 22.1 23.4Russia Kabardin-Balkar 24.3 21.8 26.1Russia Kalingrad 27.0 26.8 27.2Russia Kalmyk 15.4 11.2 21.3Russia Kalunga 25.7 24.9 26.5Russia Kamchatka 12.5 5.0 18.7Russia Karachay-Cherkess 26.2 22.1 28.3Russia Karelia 22.7 20.6 23.9Russia Kemerovo 24.6 23.1 26.9Russia Khabarovsk 18.7 6.9 24.6Russia Khakass 24.4 22.4 26.2Russia Khanty-Mansiy 21.8 18.2 24.0Russia Kirov 23.5 22.4 24.2
S19

Russia Komi 19.4 13.6 23.0Russia Komi-Permyak 23.4 22.6 23.9Russia Koryak 13.6 7.1 17.2Russia Kostroma 23.1 22.0 24.1Russia Krasnodar 25.6 22.7 29.2Russia Krasnoyarsk 21.6 14.4 24.9Russia Kurgan 24.3 22.2 26.0Russia Kursk 25.8 24.8 26.6Russia Leningrad 24.2 23.5 24.9Russia Lipetsk 25.2 24.3 25.8Russia Maga Buryatdan 12.7 6.5 16.8Russia Mariy El 22.9 21.6 24.1Russia Mordovia 24.3 22.8 25.3Russia Moskva 24.1 22.7 25.5Russia Murmansk 18.2 16.0 21.4Russia Nenets 15.6 13.2 19.7Russia Nizhegorod 23.4 21.6 25.2Russia North Ossetia 25.7 23.3 26.4Russia Novgorod 24.5 23.4 25.1Russia Novoslbirsk 22.2 20.2 23.8Russia Omsk 22.2 20.0 24.0Russia Orel 26.4 25.7 26.9Russia Orenburg 20.3 17.0 23.2Russia Penza 24.0 23.0 25.2Russia Perm 23.4 20.7 24.4Russia Promorye 24.9 21.3 25.9Russia Pskov 25.3 24.7 25.8Russia Rostov 21.0 18.2 24.2Russia Ryazan 24.1 22.9 25.1Russia Sakha 17.0 9.4 20.5Russia Sakhalin 21.7 18.2 24.5Russia Samara 22.5 20.7 24.0Russia Saratov 20.7 16.9 23.1Russia Smolensk 25.5 24.4 26.2Russia Stavropol 22.1 16.5 27.1Russia Sverdlovsk 24.1 21.0 26.1Russia Tambov 24.4 22.7 25.3Russia Tatarstan 23.9 23.1 24.3Russia Taymyr 10.7 0.0 14.4Russia Tomsk 23.4 22.0 24.1Russia Tula 25.7 25.1 26.6Russia Tuva 19.5 11.7 24.2Russia Tver 24.5 22.7 25.2Russia Tyumen 23.5 22.6 25.0Russia Udmurt 23.6 22.7 24.5Russia Ulyanovsk 23.1 22.3 23.8Russia Ust-Orda-Buryat 21.4 20.4 22.7Russia Vladimir 23.4 22.5 24.0
S20

Russia Volgograd 19.0 16.2 21.7Russia Vologda 23.5 22.5 24.3Russia Voronezh 22.5 20.3 24.9Russia Yamal-Nenets 16.0 6.5 21.1Russia Yaroslavl 23.1 22.3 23.9Russia Yevrey 24.3 22.9 25.5Canada Alberta 22.5 14.7 24.9Canada British Columbia 19.9 12.8 24.9Canada Manitoba 23.6 18.8 27.5Canada New Brunswick 26.3 25.0 26.5Canada Newfoundland and Labrador 20.0 8.1 25.5Canada Northern Territories 15.2 0.0 23.7Canada Nova Scotia 26.1 25.1 27.7Canada Nunavut 5.0 0.0 16.4Canada Ontario 24.8 21.8 26.9Canada Prince Edward Island 24.8 24.1 26.2Canada Quebec 20.8 6.1 26.6Canada Saskatchewan 23.5 18.8 27.5Canada Yukon 15.3 3.6 20.6China Anhui 24.3 21.4 27.6China Beijing 20.6 18.8 22.5China Chongqing 26.6 24.7 28.0China Fujian 28.1 24.2 29.2China Gansu 12.9 0.1 27.6China Guangdong 26.4 21.5 39.0China Guangxi 24.4 21.2 27.6China Guizhou 28.1 25.5 29.7China Hainan 39.6 36.7 42.5China Hebei 21.5 18.7 24.7China Heilongjiang 23.8 19.9 26.0China Henan 21.9 18.0 25.0China Hong Kong 24.4 24.3 24.6China Hubei 24.9 22.1 27.5China Hunan 26.8 25.2 27.9China Jiangsu 24.4 21.2 27.3China Jiangxi 27.3 26.0 28.4China Jilin 24.1 19.9 26.7China Liaoning 23.1 19.5 27.3China Macau 24.3 24.3 24.3China Nei Mongol / Inner Mongolia 13.2 0.3 25.1China Ningxia Hui 17.0 4.3 27.1China Qinghai 7.7 0.0 26.0China Shaanxi 23.4 16.5 26.8China Shandong 22.0 17.8 24.6China Shanghai 27.7 26.8 28.0China Shanxi 21.1 18.1 23.6China Sichuan 24.0 8.8 30.9China Tianjin 20.9 20.3 22.3
S21

China Xinjiang Uygur 2.9 0.0 15.3China Xizang/Tibet 10.3 0.0 25.8China Yunnan 28.4 24.3 32.9China Zhejiang 27.3 24.9 28.8USA Alabama 27.4 25.8 29.4USA Alaska 14.7 0.8 21.0USA Arizona 7.4 0.9 15.0USA Arkansas 25.8 24.2 28.3USA California 15.3 1.1 25.3USA Colorado 17.0 8.7 22.5USA Connecticut 27.3 26.8 27.9USA Delaware 27.9 27.0 28.3USA District of Columbia 25.9 25.8 25.9USA Florida 31.6 23.5 52.2USA Georgia 27.1 25.2 29.5USA Hawaii 46.7 37.6 55.1USA Idaho 15.4 9.4 22.6USA Illinois 28.6 26.2 29.8USA Indiana 27.1 25.9 28.2USA Iowa 29.0 27.3 30.4USA Kansas 22.5 18.3 25.5USA Kentucky 26.6 25.4 28.2USA Louisiana 26.4 25.1 27.4USA Maine 25.7 24.9 27.0USA Maryland 27.2 25.3 28.8USA Massachussets 27.3 26.7 27.7USA Michigan 26.0 24.5 27.9USA Minnesota 27.5 25.6 29.3USA Mississippi 27.7 26.0 29.0USA Missouri 26.7 24.9 28.8USA Montana 19.4 14.1 24.3USA Nebraska 22.7 16.4 30.9USA Nevada 7.2 3.6 13.5USA New Hampshire 26.3 25.2 27.4USA New Jersey 27.2 26.4 27.9USA New Mexico 9.0 3.6 16.2USA New York 27.0 25.8 28.0USA North Carolina 29.0 26.1 31.2USA North Dakota 24.9 21.0 27.2USA Ohio 27.4 26.4 28.8USA Oklahoma 23.2 17.2 27.1USA Oregon 16.5 10.6 27.7USA Pennsylvania 27.9 27.0 28.8USA Rhode Island 27.2 27.0 27.4USA South Carolina 27.0 25.5 29.3USA South Dakota 22.4 18.3 27.3USA Tennessee 27.0 25.2 28.8USA Texas 19.2 3.8 28.3
S22
USA Utah 9.9 4.6 18.3USA Vermont 26.1 25.0 26.9USA Virginia 27.0 25.4 30.0USA Washington 19.3 8.4 28.2USA West Virginia 28.2 27.2 29.3USA Wisconsin 28.1 26.0 30.0USA Wyoming 14.5 9.8 20.0Brazil Acre 43.3 40.6 48.2Brazil Alagoas 36.7 27.3 45.9Brazil Amapa 43.9 39.5 49.5Brazil Amazonas 41.6 39.0 48.3Brazil Bahia 35.2 24.6 51.4Brazil Ceara 27.5 24.5 31.8Brazil Distrito Federal 40.5 39.3 40.9Brazil Espirito Santo 47.8 42.9 50.1Brazil Goias 38.1 33.2 44.1Brazil Maranhao 34.5 28.2 39.5Brazil Mato Grosso 38.5 33.1 42.6Brazil Mato Grosso do Sul 44.8 34.3 50.4Brazil Minas Gerais 38.4 30.0 47.0Brazil Para 40.9 35.0 46.1Brazil Paraiba 32.1 26.1 42.8Brazil Parana 34.8 28.5 52.7Brazil Pernambuco 33.0 25.2 46.2Brazil Piaui 28.7 25.1 34.8Brazil Rio de Janeiro 43.3 39.1 47.6Brazil Rio Grande do Norte 28.3 23.6 38.7Brazil Rio Grande do Sul 30.8 28.3 33.7Brazil Rondonia 42.6 40.3 45.0Brazil Roraima 47.6 41.7 52.9Brazil Santa Catarina 30.6 28.4 34.0Brazil Sao Paulo 42.2 29.3 50.6Brazil Sergipe 35.0 27.5 39.9Brazil Tocantins 34.7 32.9 37.7Australia Australian Cap. Terr. and Jervis Bay Terr. 29.3 28.1 30.3Australia New South Wales 20.2 3.9 35.6Australia Northern Territory 20.6 3.6 33.0Australia Queensland 21.6 2.5 43.0Australia South Australia 6.3 1.4 22.7Australia Tasmania 30.3 27.4 34.2Australia Victoria 25.2 8.1 33.8Australia Western Australia 14.6 3.4 32.9
SUPPORTING INFORMATION S8: CF OF LAND RESOURCES IMPLEMENTED INTO ECOINVENT REFERENCE FLOWS
S23

The ecoinvent database does not support fully the framework proposed by this paper, through the existing reference flows. Therefore, in this section we proposed more speficic reference flows to this database, in order to support our framework, and applied the site-generic CF.
Because most of the data from ecoinvent is from Western Europe, the CF implemented for human-made systems was the site-dependent CF, at continent level, for Europe (23.20 MJex/m2.year). The land occupation reference flows which received a zero value were considered to be from natural systems. The site-generic CF are presented in Table S8 – S1.
The data from Haberl et al. (2007) is related only for the terrestrial potential NPP, and ecoinvent database also considers occupation of sea waters (“Occupation, sea and ocean”). Therefore, for that reference flow we needed to consider data from another source. We considered the average value for Western European sea waters (Mediterranean Sea and Northeastern Atlantic Sea) from Saba et al. (2011). Then, we multiplied this average value of NPP, in gC/m2a, by a phytoplankton-exergy conversion factor that was calculated by the chemical composition of microalgae, available in Phyllis database (Phyllis, 2011) and through the β-LHV method (there was not enough data to proceed the exergy calculation through group contribution method). As a result, we obtained a CF of 10.04 MJex/m2a.
Table S8 – S1: Reference flows from ecoinvent adjusted to the framework proposed in this paper, with the site-generic
CF for land resources
System Reference flow CF for land resources Unit
Natural Energy, gross calorific value, in biomass, natural system 1.06 MJex/MJHuman-made Energy, gross calorific value, in biomass, human-made system 0.00 MJex/MJHuman-made Occupation, arable 23.20 MJex/m2aHuman-made Occupation, construction site 23.20 MJex/m2aHuman-made Occupation, dump site 23.20 MJex/m2aHuman-made Occupation, dump site, benthos 0.00 MJex/m2aNatural Occupation, forest, natural system 0.00 MJex/m2aHuman-made Occupation, forest, human-made system 23.20 MJex/m2aHuman-made Occupation, heterogeneous, agricultural 23.20 MJex/m2aHuman-made Occupation, industrial area 23.20 MJex/m2aHuman-made Occupation, industrial area, benthos 0.00 MJex/m2aHuman-made Occupation, industrial area, built up 23.20 MJex/m2aHuman-made Occupation, industrial area, vegetation 23.20 MJex/m2aHuman-made Occupation, mineral extraction site 23.20 MJex/m2aHuman-made Occupation, pasture and meadow 23.20 MJex/m2aNatural Occupation, pasture and meadow, extensive 0.00 MJex/m2aHuman-made Occupation, pasture and meadow, intensive 23.20 MJex/m2aHuman-made Occupation, permanent crop 23.20 MJex/m2aNatural Occupation, permanent crop, extensive 0.00 MJex/m2aHuman-made Occupation, permanent crop, intensive 23.20 MJex/m2aHuman-made Occupation, sea and ocean 10.04 MJex/m2aNatural Occupation, shrub land, sclerophyllous 0.00 MJex/m2aHuman-made Occupation, traffic area 23.20 MJex/m2aNatural Occupation, tropical rain forest, natural system 0.00 MJex/m2aHuman-made Occupation, tropical rain forest, human-made system 23.20 MJex/m2aHuman-made Occupation, unknown 23.20 MJex/m2aHuman-made Occupation, urban 23.20 MJex/m2aHuman-made Occupation, water bodies, artificial 23.20 MJex/m2aHuman-made Occupation, water courses, artificial 23.20 MJex/m2a
S24

REFERENCES
Akubugwo IE, Obasi NA, Chinyere GC, Ugbogu AE (2007) Nutritional and chemical value of Amaranthus hybridus L. leaves from Afikpo, Nigeria. African Journal of Biotechnology 6 (24):2833-2839
Brehmer B, Struik PC, Sanders J (2008) Using an energetic and exergetic life cycle analysis to assess the best applications of legumes within a biobased economy. Biomass and Bioenergy 32 (12):1175-1186
Carle J, Holmgren P (2008) Wood from Planted Forests: A global outlook 2005-2030. Forest Products Journal 58 (12):6-18
Ecoinvent (2010) Ecoinvent data v2.2. Ecoinvent reports No.1-25. Swiss Centre for Life Cycle Inventories, Dübendorf
Glew RH, Kramer JKG, Hernandez M, Pastuszyn A, Ernst J, N. ND, VanderJagt DJ (2010) The Amino Acid, Mineral and Fatty Acid content of three species of human plant foods in Cameroun. Food 4 (1):1-6
Haberl H, Erb KH, Krausmann F, Gaube V, Bondeau A, Plutzar C, Gingrich S, Lucht W, Fischer-Kowalski M (2007) Quantifying and mapping the human appropriation of net primary production in earth's terrestrial ecosystems. Proceedings of the National Academy of Sciences 104 (31):12942-12947
Hartonen K, Parshintsev J, Sandberg K, Bergelin E, Nisula L, Riekkola M-L (2007) Isolation of flavonoids from aspen knotwood by pressurized hot water extraction and comparison with other extraction techniques. Talanta 74 (1):32-38
Luyssaert S, Inglima I, Jung M, Richardson AD, Reichstein M, Papale D, Piao SL, Schulze ED, Wingate L, Matteucci G, Aragao L, Aubinet M, Beer C, Bernhofer C, Black KG, Bonal D, Bonnefond JM, Chambers J, Ciais P, Cook B, Davis KJ, Dolman AJ, Gielen B, Goulden M, Grace J, Granier A, Grelle A, Griffis T, GrÜNwald T, Guidolotti G, Hanson PJ, Harding R, Hollinger DY, Hutyra LR, Kolari P, Kruijt B, Kutsch W, Lagergren F, Laurila T, Law BE, Le Maire G, Lindroth A, Loustau D, Malhi Y, Mateus J, Migliavacca M, Misson L, Montagnani L, Moncrieff J, Moors E, Munger JW, Nikinmaa E, Ollinger SV, Pita G, Rebmann C, Roupsard O, Saigusa N, Sanz MJ, Seufert G, Sierra C, Smith ML, Tang J, Valentini R, Vesala T, Janssens IA (2007) CO2 balance of boreal, temperate, and tropical forests derived from a global database. Glob Change Biol 13 (12):2509-2537. doi:10.1111/j.1365-2486.2007.01439.x
Olson DM, Dinerstein E, Wikramanayake ED, Burgess ND, Powell GVN, Underwood EC, D'Amico JA, Itoua I, Strand HE, Morrison JC, Loucks CJ, Allnutt TF, Ricketts TH, Kura Y, Lamoreux JF, Wettengel WW, Hedao P, Kassem KR (2001) Terrestrial Ecoregions of the World: A New Map pf Life on Earth. Bioscience 51 (11):933-938
Phyllis - Database for biomass and waste (2011) Energy research Centre of the Netherlands. http://www.ecn.nl/phyllis. Accessed 01/02/2011
Rezanka T, Rezanková H (1999) Characterization of fatty acids and triacylglycerols in vegetable oils by gas chromatography and statistical analysis. Analytica Chimica Acta 398 (2-3):253-261
Saba VS, Friedrichs MAM, Antoine D, Armstrong RA, Asanuma I, Behrenfeld MJ, Ciotti AM, Dowell M, Hoepffner N, Hyde KJW, Ishizaka J, Kameda T, Marra J, Mélin F, Morel A, O'Reilly J, Scardi M, Jr. WOS, Smyth TJ, Tang S, Uitz J, Waters K, Westberry TK (2011) An evaluation of ocean color model estimates of marine primary productivity in coastal and pelagic regions across the globe. Biogeosciences 8 (2):489-503
Saunders C, Megonigal J, Reynolds J (2006) Comparison of belowground biomass in C3- and C4-dominated mixed communities in a Chesapeake Bay brackish marsh. Plant and Soil 280 (1):305-322. doi:10.1007/s11104-005-3275-3
Szargut J, Morris DR, Steward FR (1988) Exergy analysis of thermal, chemical, and metallurgical processes. Springer, Berlin
S25

Yeoh H-H, Chin Wee Y, Watson L (1984) Systematic variation in leaf amino acid compositions of leguminous plants. Phytochemistry 23 (10):2227-2229
S26