~11t1i1r~~~ ltn[;tlm1 - purdue university college of ... 3. land value per bushel of estimated com...
TRANSCRIPT
~ August 1989Ull.li1.li..!lli A QUARTERLY PUBLICATION OF THE AGRICULTURAL ECONOMICS FACULTY
------
EDITOR: CHRIS HURT
~11T1i1r~~~
lTn[;tlm1EDITORIAL BOARD: STEPHEN B. LOVEJOY AND JOE UHL
AGRICULTURAL ECONOMICS DEPARTMENT. PURDUE UNIVERSITY
Upward Trend in Land Values Continuesi.H. Atkinson and Kim Cook. Department of Agricultural Economics
During the early years of the 1981-87 decline inIndiana land values, there were reports of decreasingnumbers of sales and increasing amounts of land forsale. This situation was reversed about 1987 and con-tinues today as indicated by a majority of Purdue landvalues survey respondents who believe there is lessland on the market now than a year ago and thatsales have picked up. The same or less land on themarket and an increase in the number of landtransfers are the conditions that tend to accompany anincrease in land values. The June 1989 Purdue surveyindicates that land values have continue~.to increas~.
Statewide Land Prices' The survey showed statewide average increases for
the 6 months ending in June 1989 of 5.3 percent on
top land, 4.8 percent on average land, and 4.5 percenton poor land (Table I). These increases are slightlyless than were reported for the same period a yearago. Two-thirds of the respondents reported that mostclasses of land increased during the 6-month period,under 3 percent reported declines, and about 30 per-cent felt there was no change in land values. Last year,70 percent of the respondents indicated increases inland values and 24 percent thought they had beenstable.
The statewide increase in value for the year endingin June 1989 was 11.2 percent on top land, n.6 per-cent on average land, and 13.5 percent on poor land(Table 2). Like the 6-month increases, top and averageland increases this year were a few percentage points
Purdue University Cooperative Extension Service, West Lafayette, IN 47907
Table 1. Average estimated land value per acre (tillable, bare land) and percentage change by &eOIJ'8phic areaand land class, selected time periods, Purdue Land Values Survey, Indiana, July 1989. .
ProjectedLand Com Dec. June Chance Dec. Chance
Area class billA 1988 1989 12/83-6/89 1989 6/89-12/89
5 5 % 5 %North Top 137 1401 1482 5.8 ISO5 1.6
Average 110 1012 1065 5.2 1086 2.0Poor 80 695 729 4.9 737 1.1
Northeast Top 134 1403 1488 6.1 1526 2.6
Average 109 1025 1082 5.6 1103 1.9Poor 84
I714 747 4.6 763 2.1
West centra] Top 144 1490 1568 5.2 1612 2.8Average 119 1195 1255 5.0 1302 3.7Poor 93 873 913 4.6 936 2.5
Central Top 144 1603 1688 5.3 1732 2.6Average 118 1285 1349 5.0 1388 2.9Poor 94 948 999 5.4 1020 2.1
Southwest Top 142 1500 1564 4.3 1619 3.5Average 112 1114 1162 4.3 1206 3.8Poor 84 755 779 3.2 803 3.1
Southeast Top 129 1085 1126 3.8 1127 0.1Average 104 810 826 2.0 843 2.1Poor 78 621 629 1.3 644 2.4
---' Indiana Top 139 1442 1518 5.3 1553 2.3Average 113 1101 1154 4.8 1185 2.7Poor 86 783 818 4.5 835 2.1Transition. - 2844 3003 5.6 3129 4.2
.Land movingout of agriculture.
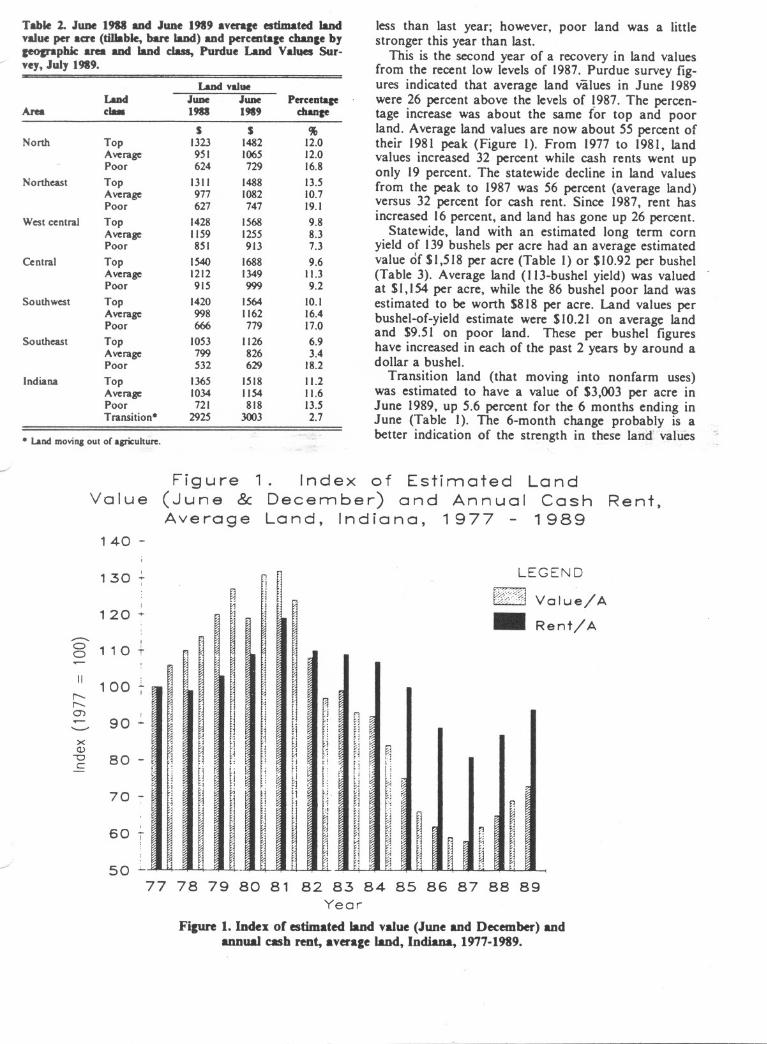
Table 2. June 1988 and JUDe1989 averqe estimated landvalue per acre (tillable, bare land) and percentace chance byCeopapbic area and land class, Purdue Land Values Sur-
./ vey,July 1989.
less than last year; however, poor land was a littlestronger this year than last.
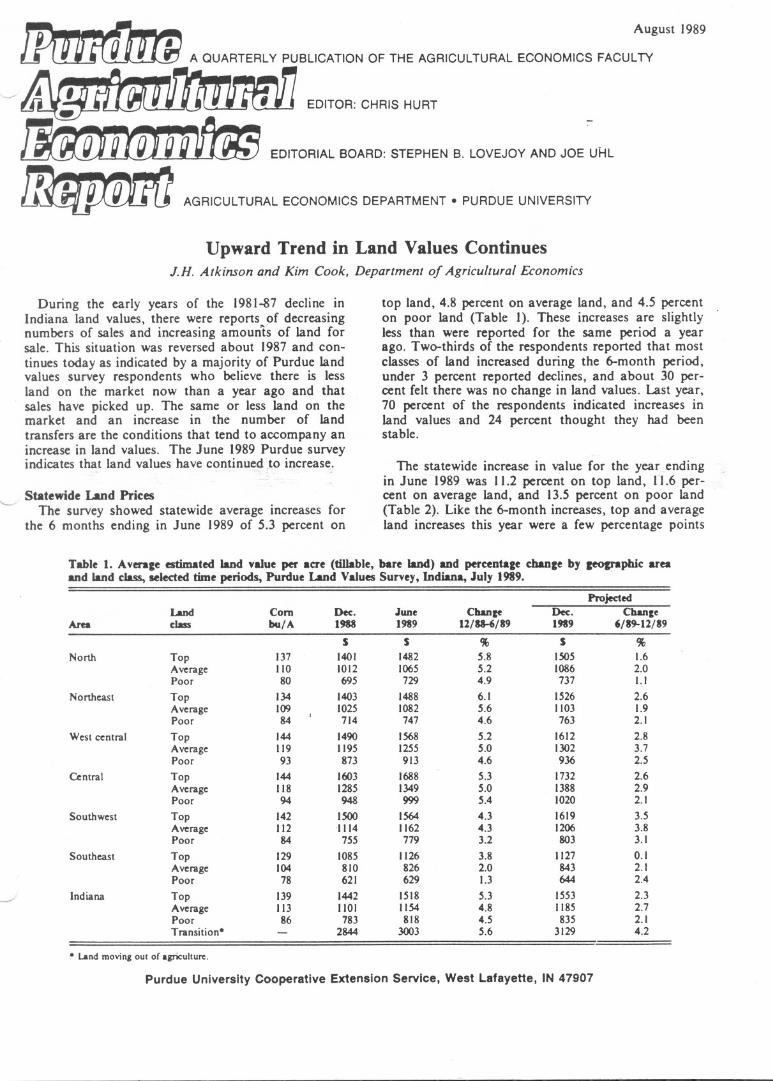
This is the second year of a recovery in land valuesfrom the recent low levels of 1987. Purdue survey fig-ures indicated that average land values in June 1989were 26 percent above the levels of !987. The percen-tage increase was about the same for top and poorland. Average land values are now about 55 percent oftheir 1981 peak (Figure I). From 1977 to 1981, landvalues increased 32 percent while cash rents went uponly 19 percent. The statewide decline in land valuesfrom the peak to 1987 was 56 percent (average land)versus 32 percent for cash rent. Since 1987, rent hasincreased 16 percent, and land has gone up 26 percent.
Statewide, land with an estimated long term cornyield of 139 bushels per acre had an average estimatedvalue df SI,518 per acre (Table I) or SIO.92 per bushel(Table 3). Average land (1l3-bushel yield) was valued '
at S1,154 per acre, while the 86 bushel poor land wasestimated to be worth S818 per acre. Land values perbushel-of-yield estimate were SIO.21 on average landand S9.51 on poor land. These per bushel figureshave increased in each of the past 2 years by around adollar a bushel.
Transition land (that moving into nonfarm uses)was estimated to have a value of S3,003 per acre inJune 1989, up 5.6 percent for the 6 months ending inJune (Table 1). The 6-month change probably is abetter indication of the strength in these land values
ValueFigure 1. Index of Estimated Land
(June & December) and Annual CashAverage Land, Indiana, 1977 - 1989
Rent,
140 -
130 -;-~
120 .......-...
8 1 10 +
1f,j,j,;,~
~
II
j
~ ~
j
] '
,
!~~ <
,
I~ '
I
,i ~
~j , n '1, r, ht<
j Ij d
70 -:-
60 T'
50 '-
LEGEND
PdW'(~j Value/A.. Rent/ A
~
JI
"
'
I
~i, '
~
;
,
i I' ,:
~ : r!
,j fj
,j ~~'j lU! I
77 78 79 80 81 82 83 84 85 86 87 88 89Year
Fipre 1. Index of estimated land value (June and December) andannual cash rent, average land, Indiana, 1977-1989.
L8DdvuueL8Dd JUDe JUDe Percentqe
Area c... 1988 1989 c:bance
S S %North Top 1323 1482 12.0
Avenage 951 1065 12.0Poor 624 729 16.8
Northeast Top 1311 1488 13.5Avenage 977 1082 10.7Poor 627 747 19.1
West centnal Top 1428 1568 9.8Avenage 1159 1255 8.3Poor 851 913 7.3
Centnal Top 1540 1688 9.6Avenage 1212 1349 11.3Poor 915 999 9.2
Southwest Top 1420 1564 10.1Avenage 998 1162 16.4Poor 666 779 17.0
Southeast Top 1053 1126 6.9Avenage 799 826 3.4Poor 532 629 18.2
Indiana Top 1365 1518 11.2Avenage 1034 1154 11.6Poor 721 818 13.5Transition* 2925 3003 2.7
* Land movinaout of agriculture.
--'
II100-r-r-
O"'J90-"'--'
xQ)
-c 80-c::

Table 3. Land value per bushel of estimated com yield, Pur-due Land Values Survey, Indiana, July 1989.
Land clasArea Top Averace Poor
Nonh S10.82 S 9.68 S 9.11Nonheast 11.10 9.93 8.89Westcentral 10.89 10.55 9.82Central 11.72 11.43 10.63Southwest 11.01 10.38 9.27Southeast 8.73 7.94 8.06Indiana 10.92 10.21 9.51
than the 2.7 percent increase for the 12-month period(Table 2). Only 43 percent of the respondents reporton transition land values, the range in estimates isquite wide, and the reliability of the averages is not asgood as with farmland.
'--'
Statewide Rents IncreaseCash rents increased statewide from 1988 to 1989 byabout 9 percent on top and average land and nearly10.5 percent on poor land (Table 4). The estimate foraverage land was S84 per acre. Rent per bushel ofestimated yield was 76ft, 74( and 73ft respectively fortop, average, and poor land or 5ft to 7ft more than the1988 estimates. Cash rents were still 21 percent below1981 levels.
Cash rent as a percent of estimated land valuedeclined slightly for the second year in a row (Table4). This state average figure is 7 percent for top land,7.3 percent for average land, and 7.7 percent for poorquality land. Ten years ago, the S88 rent reported foraverage cropland was only 4.8 percent of the estimatedvalue of that quality land.
Area EstimatesFarmland value increases from December 1988 to
June 1989 were mostly 5 percent to 6 percent in thenorth and the two central areas (Figure 2) and 4.3percent or less in the southern ar~
For the year ending June 1989, top and averagequality land in the north, northeast, 'and both centralareas increased in a range of 8.3 to 13.5 percent (Table2). Top land in the southwest was within this range,but average and poor lands were up much moresharply, 16 to 17 percent. Increases of this magnitudewere reported for poor land in several other areas. Butin the central and west central areas, poor landincreased less than the better land, perhaps because ofthe effects of the 1988 drought. The percentageincrease from the low land values of 1987 has beensomewhat greater for poor than for top quality landin all areas of the state except the southeast.
The central area again had the highest land valuesper acre as well as per bushel of estimated yield (Table3). Top land, with an estimated long-term yield. of 144bushels of corn per acre, was valued at an average ofS1,688 per acre in the central area or S11.72 perbushel. In the other areas "except the southeast, topland was valued at around SII per bushel of estimatedyield. Average land was around S1.I5 per bushel lessthan top land in the north and northeast, under 35ft inthe two central areas, and 63ft and 79ft in thesouthwest and southeast. ,-
Cash rents increased in all areas of the state, but theincreases varied considerably by area and land quality(Table 4). Average area increases on top land were inthe range of 5.3 percent to 8.4 percent except in thesouthwest. Increases on average and poor land were
Table 4. AVer8le estimated cash rents, bare tillable land, 1988 and 1989, Purdue Land Values Survey, Indiana,July 1989.
Percentace Reot/bu. ReDtua%OrLaDd ReDt/acre cbaDce or com JuDe IaDcIvalue
Area class 1988 1989 '18to '19 1989 1988 1989S S % S % %
Nonh Top 99 106 7.1 0.77 7.5 7.2Average 75 83 10.7 0.75 7.9 7.8Poor 51 59 15.7 0.74 8.2 8.1
Nonheast Top 87 92 5.7 0.69 6.6 6.2Average 67 73 9.0 0.67 6.9 6.7Poor 49 54 10.2 0.64 7.8 7.2
West central Top 114 120 5.3 0.83 8.0 7.7Average 93 100 7.5 0.84 8.0 8.0Poor 70 76 8.6 0.82 8.2 8.3
Central Top 107 116 8.4 0.81 6.9 6.9Average 88 96 9.1 0.81 7.3 7.1Poor 69 75 8.7 0.80 7.5 7.5
Southwest Top 90 101 12.2 0.71 6.3 6.5Average 72 79 9.7 0.71 7.2 6.8Poor 52 57 9.6 0.68 7.8 7.3
Southeast Top 76 82 7.9 0.64 7.2 7.3Average 59 63 6.8 0.61 7.4 7.6Poor 42 45 7.1 0.58 7.9 7.2
Indiana Top 97 106 9.3 0.76 7.1 7.0Average 77 84 9.1 0.74 7.4 7.3Poor 57 63 10.5 0.73 7.9 7.7
't

""" I ...VOI-
_. .......
Figure 2. Geographic areas used inthe Purdue Land Values Survey.
greater than on top land except in the two southernareas.
Although land values were highest in the centralarea, cash rents were highest in the west central area,$120 per acre on top quality land or 83~ per bushel.In the north, west central, and central areas rents ontop and average land were 75~ to 84c. The range inother areas was 61e to 71e.
There was little difference in the rent per bushel ontop and average land although budget analysis indi-cates that a difference of 1O~per bushel or more couldbe justified in many situations between average andtop quality land.
Cash rent as a percentage of the value of top and
average land tended to fall slightly in all areas,although in several cases there was no change or aslight increase. These area average percentages fell inthe range of 6.2 percent to 8.3 percent with the higherfigures being in the north and west central areas andthe lower ones in the northeast and-southwest.
What or the Future?
Survey respondents were more optimistic than theywere a year ago. This year, the percentage of respond-ents expecting higher land prices by December jumpedto 58 percent from 42 percent last year. Only 5 percentexpect lower land values, and 36 percent think therewill be no change.
The group average expected increase in land valueswas 2.7 percent statewide on average land, and a littleless on top and poor land. (Table I). Increases wereexpect~d in all areas with averages under 1 percent ontop land in the southeast to nearly 4 percent on aver- .age land in the southwest and west central areas.
Ninety percent of the 1989 respondents expect landvalues to be higher 5 years hence. The group averagechange was 15 percent this year, the same as last year.This is an annual average compound rate of onlyabout 2.8 percent.
Respondents were asked to estimate annual aver-ages over the next 5 years for corn and soybeanprices, farm mortgage interest rates, and the rate ofinflation. The projections they made in each year since1984 are shown below:
ItemCom priceBean priceInterest rateInflation rate
1914 1985 1986 1987 1981 1989$3.13 $2.70 $2.32 $2.16 $2.50 $2.48
7.35 6.13 5.43 5.62 6.82 6.5513.3 12.3 11.0 10.7 10.9 11.06.5 5.1 4.2 4.5 4.6 4.7
Except for less optimism about soybean prices,these expectations show little change from last year;however, note that the gradual increase from 1986 ininflation expectations continued.
Whether eastern Corn Belt land values continue toincrease the rest of this year and into 1990 dependsupon such factors as the extent of crop losses in someareas caused by excessive spring rains and whethercrop size and utilization projections indicate the likeli-hood of an increase in stocks to burdensome levels..
The land values survey was made possible by the cooperation ofprofessional managers, appraisers, brokers, bankers, and personsrepresenting the Farm Credit System, the Farmers Home Adminis-tration, ASCS county offices and insurance companies. Their dailywork requires that they keep well-informed about land values andcash rent in Indiana. To these friends of Purdue and Indiana agri-culture, sincere thanks are expressed. They provided more than 300responses representing most of Indiana's counties.
Appreciation is also expressed to Julie Gable of the Departmentof Agricultural Economics for her help in conducting the survey.