1/21/09 iowa core culum e cs - carroll community school...
TRANSCRIPT

1 of 120
1/21/09
Iowa Core Cur riculum K-12 Mathematics
Essential Concepts and Skills with Details and Examples
Introduction Recent results of national and international tests show that the United States is facing a crisis in mathematics education. American high school students score near the bottom on the international TIMSS and PISA tests, while students in elementary and middle school perform only somewhat better. A common criticism of the U.S. mathematics curriculum is that it is “a mile wide and an inch deep,” trying to cover too many topics in not enough depth. All Iowa students must be better prepared in mathematics to successfully compete in the technology-rich, information-dense, global society. To achieve this we must redesign our mathematics curriculum so that it is focused on providing deep understanding of important mathematics. The Iowa Core Curriculum for K–12 Mathematics identifies the essential characteristics, skills, and content of the world-class mathematics curriculum that Iowa needs. This Iowa Core Curriculum for school mathematics is based on recommendations from the National Council of Teachers of Mathematics (Principles and Standards for School Mathematics, 2000, and Curriculum Focal Points for Prekindergarten through Grade 8 Mathematics, 2006), five years of experience with Iowa’s Every Student Counts mathematics initiative (ESC), and best practices identified from reviews of research conducted by the National Research Council (2001), the International Bureau of Education (Grouws and Cebulla, 2000), the National Council of Teachers of Mathematics (Kilpatrick, 2003), the federal What Works Clearinghouse, and Iowa’s Mathematics Content Network research review project. In addition, the essential skills, concepts, and characteristics recommended here have been informed by a careful review of many background resources, including the Mathematics F ramework for the National Assessment of Educational Progress (NAEP, 2005 and 2007), Guidelines for Assessment and Instruction in Statistics Education (GAISE Report, American Statistical Association, 2005), mathematics standards recommended by Achieve (2007), mathematics standards recommended by the College Board (2007), ACT college readiness standards (2007), the mathematics curricula of Japan and Singapore, the National Center for the Study of Mathematics Curricula, mathematics standards in other states, and recommendations from the Iowa Core Curriculum Project Lead Team. Further resources consulted are included in the Bibliography. In order to provide effective guidance and technical assistance for Iowa’s schools, the Iowa Core Curriculum for K–12 Mathematics draws from the above resources to identify the essential skills, content, and characteristics of a world-class school mathematics curriculum.

2 of 120
Essential Character istics of a World-C lass Cur riculum in Mathematics A world-class mathematics curriculum should be built around and focused on:
Teaching for Understanding Problem-Based Instructional Tasks Distributed Practice that is Meaningful and Purposeful Mathematical Modeling (secondary school emphasis) Deep Conceptual and Procedural Knowledge Rigor and Relevance Effective Use of Technology Connected and Coherent Content
T eaching for Understanding First and foremost, teaching mathematics for understanding is the basis of the world-class core curriculum in mathematics that all Iowa students deserve. We must shift from a paradigm of “memorize and practice” to one of “understand and apply.” Teaching for understanding involves:
Developing deep conceptual and procedural knowledge of mathematics (See description below.)
Posing problem-based instructional tasks (See description below.)
Engaging students in the tasks and providing guidance and support as they develop their own representations and solution strategies
Promoting discourse among students to share their solution strategies and justify their reasoning
Summarizing the mathematics and highlighting effective representations and strategies Extending students’ thinking by challenging them to apply their knowledge in new
situations, especially in real-world settings Listening to students and basing instructional decisions on their understanding
Problem-Based Instructional Tasks Problem-based instructional tasks are at the heart of teaching for understanding. A world-class mathematics curriculum should be built around rich instructional tasks focused on important mathematics. Problem-based instructional tasks:
Help students develop a deep understanding of important mathematics Emphasize connections, especially to the real world Are accessible yet challenging to all Can be solved in several ways Encourage student engagement and communication Encourage the use of connected multiple representations Encourage appropriate use of intellectual, physical, and technological tools

3 of 120
Distributed Practice that is Meaningful and Purposeful Practice is essential to learn mathematics. However, to be effective in raising student achievement, practice must be meaningful, purposeful, and distributed. Meaningful Purposeful Distributed Practice:
Meaningful: Builds on and extends understanding Purposeful: Links to curriculum goals and targets an identified need based on multiple
data sources Distributed: Consists of short periods of systematic practice distributed over a long period
of time Mathematical Modeling (secondary school emphasis) Mathematical modeling is the process of applying mathematics to solve real-world problems. As such, it is an essential characteristic of a world-class mathematics curriculum. The diagram below summarizes the process of mathematical modeling.
Process of M athematical Modeling
Deep Conceptual and Procedural K nowledge The goal of a world-class curriculum in mathematics is for all students to develop a deep understanding of important mathematics, which can be applied flexibly and powerfully to solve problems. An ongoing debate in mathematics education revolves around conceptual knowledge (knowledge of mathematical concepts such as function and rate of change) versus procedural knowledge (knowledge of mathematical procedures such as factoring and equation solving). In particular, questions persist about how to teach procedures, when to teach them, how much time to spend teaching them, and the relation of procedural knowledge to conceptual knowledge.
Real-World Situation
Solution Expressed in Real-World Setting
Mathematical Model
Mathematical Solution
Represent
Makes Sense? Evaluate Extend
Generalize Synthesize
Analyze
Interpret

4 of 120
A common view is that conceptual knowledge is deep knowledge and procedural knowledge is superficial. However, recent research (e.g., Star, 2005) suggests that this view confusingly combines type of knowledge with quality of knowledge. Separating out these two dimensions yields the following table, where XX indicates the goal of deep knowledge for both procedures and concepts.
Type and Quality of Knowledge Knowledge of Concepts Knowledge of
Procedures Superficial Knowledge
Deep Knowledge XX XX Deep-level knowledge is characterized by comprehension, abstraction, flexibility, critical judgment, and evaluation. It is structured in memory so that it is maximally useful for performance of tasks. This is in contrast to superficial knowledge, which is rote or at best inflexible knowledge. The debates about conceptual knowledge versus procedural knowledge and about deep versus superficial knowledge are in fact based on false dichotomies. Students must develop deep knowledge of both concepts and procedures. Furthermore, concepts and procedures should be connected. “As students develop a view of mathematics as a connected and integrated whole, they will have less of a tendency to view mathematical skills and concepts separately. If conceptual understandings are linked to procedures, students will not perceive mathematics as an arbitrary set of rules. This integration of procedures and concepts should be central in school mathematics” (NCTM, 2000, p. 65). In addition to procedures and concepts, a typical third goal of mathematics instruction is problem solving. One often sees mathematics curricula and assessments discussed and organized in terms of skills, concepts, and problem solving. The prevalent view is that each of these three tends to be taught in a specific way, as summarized in the left-hand column of the following table. However, in a world-class mathematics curriculum, practice is not just for skills, understanding is not just for concepts, and problem solving is not just for developing the ability of solving problems, as shown in the right-hand column of the table.

5 of 120
Prevalent F ragmented V iew of the Mathematics Cur riculum
What to teach: How to teach and learn:
Procedures, Skills, Facts
Memorize and Practice
Concepts Understand and Apply
Problem Solving Heuristics and Solving Problems
World-C lass Mathematics Curriculum What to teach:
Concepts, Skills, and Problem Solving
How to teach: Teach all three for understanding Problem-based instructional tasks
for all three Meaningful purposeful distributed
practice for all three Result:
Deep conceptual knowledge Deep procedural knowledge Powerful problem solving ability Increased student achievement in
mathematics Mathematically empowered citizens
E ffective Use of T echnology Technology is an integral part of contemporary life, and as such should be an integral part of mathematics education. Technological tools, such as graphing calculators, computers, and the Internet, should be used to enhance teaching and learning. As stated in NCTM’s Principles and Standards:
When technological tools are available, students can focus on decision making, reflection, reasoning, and problem solving. Students can learn more mathematics more deeply with the appropriate use of technology (Dunham and Dick 1994; Sheets 1993; Boers-van Oosterum 1990; Rojano 1996; Groves 1994). … Technology enhances mathematics learning – Students' engagement with, and ownership of, abstract mathematical ideas can be fostered through technology. Students can examine more examples or representational forms than are feasible by hand, so they can make and explore conjectures easily … thus allowing more time for conceptualizing and modeling. Technology supports effective mathematics teaching – The effective use of technology in the mathematics classroom depends on the teacher. Technology is not a panacea. As with any teaching tool, it can be used well or poorly. Teachers should use technology to enhance their students' learning opportunities by selecting or creating mathematical tasks that take advantage of what technology can do efficiently and well—graphing, visualizing, and computing. Technology influences what mathematics is taught – Technology not only influences how mathematics is taught and learned but also affects what is taught and when a topic appears in the curriculum. With technology at hand, young children can explore and solve problems involving large numbers, or they can investigate characteristics of shapes using dynamic geometry software. Elementary school students can organize and analyze large sets of data. Middle-

6 of 120
grades students can study linear relationships and the ideas of slope and uniform change with computer representations and by performing physical experiments with calculator-based-laboratory systems. High school students can use simulations to study sample distributions, and they can work with computer algebra systems that efficiently perform most of the symbolic manipulation that was the focus of traditional high school mathematics programs. The study of algebra need not be limited to simple situations in which symbolic manipulation is relatively straightforward. Using technological tools, students can reason about more-general issues, such as parameter changes, and they can model and solve complex problems that were heretofore inaccessible to them. Technology also blurs some of the artificial separations among topics in algebra, geometry, and data analysis by allowing students to use ideas from one area of mathematics to better understand another area of mathematics. Technology can help teachers connect the development of skills and procedures to the more general development of mathematical understanding. As some skills that were once considered essential are rendered less necessary by technological tools, students can be asked to work at higher levels of generalization or abstraction (NCTM, 2000, pp. 24-26).
Rigor and Relevance A world-class school mathematics curriculum should be rigorous and relevant. These terms, while open to a variety of interpretations, are used in the Iowa Core Curriculum with reference to their meaning as given by Daggett (2005). “Daggett asserts that schools can no longer afford to teach only a discrete set of facts, but instead must teach students how to think. It is insufficient to teach students how to do things by rote; now schools must teach people how to do things with deeper levels of understanding. He recommends levels of cognitive knowledge [rigor] applied to real-world situations [relevance], that is, academic rigor applied in open-ended and unpredictable ways. Daggett advises educators to use the Rigor/Relevance Framework to move beyond the what of curriculum to the how of instruction” (Iowa Department of Education 2005, p. 4). Connected and Coherent Content “Mathematics comprises different topical strands, such as algebra and geometry, but the strands are highly interconnected. The interconnections should be displayed prominently in the curriculum …. A coherent curriculum effectively organizes and integrates important mathematical ideas so that students can see how the ideas build on, or connect with other ideas thus enabling them to develop new understandings and skills” (NCTM, 2000, Curriculum Principle, p. 15). The school mathematics curriculum, in kindergarten through grade 12, should be connected and coherent.
7 of 120
The United States is virtually the only country in the world in which the high school mathematics curriculum is generally not connected across strands. In particular, the countries that consistently outperform the U.S. on international mathematics achievement tests, including those countries often looked to for solutions such as Singapore and Japan, have a connected high school mathematics curriculum. What is a connected mathematics curriculum? One can consider the content to be connected and the method of connecting the content. With respect to the content that is connected, the strands of mathematics (such as algebra, geometry, and statistics) might be connected or different disciplines (such as mathematics, science, and social studies) might be connected. Concerning methods of connecting the content, connections might be made through use of thematic units, whereby a particular theme or application is the organizing principle for the unit and targeted mathematics is developed to pursue that theme or application; or connections could be made through use of big-idea strand-dominant units, whereby a big mathematical idea, typically from a specific strand, is the main organizing principle for the unit and a variety of contexts and mathematical connections are utilized to help develop that big idea. The curriculum content connection prevalent throughout the world is across the strands of mathematics, with courses typically consisting of several connected blocks each focused on a particular mathematical strand. Thus, mathematics courses are taught, not separate courses in algebra, geometry, advanced algebra, trigonometry, etc. According to Burkhardt (2001), “Nowhere else in the world would people contemplate the idea of a year of algebra, a year of geometry, another year of algebra, and so on.” The advantages of connected mathematics courses are that “they build essential connections, help make mathematics more usable, avoid long gaps in learning, allow a balanced curriculum, and support equity. I know of no comparable disadvantages, provided that the ‘chunks’ of learning are substantial and coherent.” As stated in the NCTM Connections Standard, “Mathematics is not a collection of separate strands or standards, even though it is often partitioned and presented in this manner. Rather, mathematics is an integrated field of study. … When students can connect mathematical ideas, their understanding is deeper and more lasting. …” (NCTM, 2000, p. 64). “In a coherent curriculum, mathematical ideas are linked to and build on one another so that students' understanding and knowledge deepens and their ability to apply mathematics expands” (NCTM, 2000, Curriculum Principle, p. 15). Thus, the value of a connected and coherent curriculum is that students gain deeper understanding of mathematics and greater ability to apply mathematics. The essential content and skills specified in the Iowa Core Curriculum can be taught in integrated or non-integrated courses, and there is no requirement to restructure schools or adopt any specific materials. It is essential that, whatever courses or materials are chosen, the mathematics content should be connected and coherent.

8 of 120
Essential Skills in a World-C lass Cur riculum in Mathematics Students need powerful skills to be successful in the globally competitive workforce of the 21st century. Business and industry demand workers who can solve problems, work in teams, and are able to apply learning to new and changing situations, especially as workers change jobs and careers many times in their lifetimes. Therefore, students must acquire powerful, flexible, and widely-applicable mathematical skills by the time they graduate from high school. Many such skills have been discussed in surveys of businesses (e.g., SCANS 1991, NCEE 2006) and in the NCTM Process Standards (NCTM 2000). The skills identified here are taken substantively from the NCTM Process Standards.
Essential Skills in a World-C lass Mathematics Curriculum • Problem Solving • Communication • Reasoning and Proof • Ability to Recognize, Make, and Apply Connections • Ability to Construct and Apply Multiple Connected Representations
Problem Solving All students should be able to:
Build new mathematical knowledge through problem solving Solve problems that arise in mathematics and in other contexts Apply and adapt a variety of appropriate strategies to solve problems Monitor and reflect on the process of mathematical problem solving
“Problem solving means engaging in a task for which the solution method is not known in advance. In order to find a solution, students must draw on their knowledge, and through this process, they will often develop new mathematical understandings. Solving problems is not only a goal of learning mathematics but also a major means of doing so. Students should have frequent opportunities to formulate, grapple with, and solve complex problems that require a significant amount of effort and should then be encouraged to reflect on their thinking. By learning problem solving in mathematics, students should acquire ways of thinking, habits of persistence and curiosity, and confidence in unfamiliar situations that will serve them well outside the mathematics classroom. In everyday life and in the workplace, being a good problem solver can lead to great advantages.” (NCTM, 2000, p. 52) Implications for Curriculum, Instruction, and Assessment Problem solving is not just a skill that all students must develop, it is also the means for effectively teaching and learning mathematics. Problem-based instructional tasks should be used in the classroom to teach important mathematics. These tasks should be chosen carefully, addressing real-world problems that allow students to have multiple ways to solve the problems, centered on an important mathematical idea, concept, or skill that is part of a course of study. These tasks should encourage the connection across curricular strands of mathematics. Teachers should choose tasks that require a high level of cognitive demand to promote the development of a deep knowledge of mathematics. Assessments designed to check for understanding should

9 of 120
allow for problem solving to be demonstrated. Assessments should focus on the process of solving the problems as well as on correct solutions. (Adapted from Teaching Mathematics through Problem Solving, Schoen, NCTM, 2003) “Problem solving is an integral part of all mathematics learning, and so it should not be an isolated part of the mathematics program. Problem solving in mathematics should involve all [mathematical strands]. The contexts of the problems can vary from familiar experiences involving students' lives or the school day to applications involving the sciences or the world of work. Good problems will integrate multiple topics and will involve significant mathematics.” (NCTM, 2000, p. 52) Communication (Reading, Writing, Speaking, Listening, Viewing) All students should be able to:
Organize and consolidate their mathematical thinking through communication Communicate their mathematical thinking coherently and clearly to peers, teachers, and
others Analyze and evaluate the mathematical thinking and strategies of others Use the language of mathematics to express mathematical ideas precisely
Changes in the workplace increasingly demand teamwork, collaboration, and communication. To be prepared for the future, students must be able to communicate mathematical ideas effectively. As students interact with their classmates, teachers, and others, opportunities arise for exchanging and reflecting on ideas; hence, communication is a fundamental element of mathematics learning. Listening to others’ explanations gives students opportunities to develop their own understandings. Students should be able to formulate ideas to share information or arguments to convince others. As students develop clearer and more-coherent communication (using verbal explanations and appropriate mathematical notation and representations), they will become better mathematical thinkers. (Adapted from NCTM, 2000) Implications for Curriculum, Instruction, and Assessment Communication should be addressed throughout curriculum, instruction and assessment. The curriculum materials used in a classroom should reflect this emphasis on communication by providing lessons that promote student-to-student, student-to-teacher, and teacher-to-student communication. Instructional practices should provide opportunities for students to communicate with each other as they study mathematics in the classroom. Teachers should act as facilitators for learning, encouraging student discourse. In doing this, students should be encouraged to explain their thinking and listen to each other as they solve problems. “Students who have opportunities, encouragement, and support for speaking, writing, reading, and listening in mathematics classes reap dual benefits: they communicate to learn mathematics, and they learn to communicate mathematically. … Students need to work with mathematical tasks that are worthwhile topics of discussion. Procedural tasks for which students are expected to have well-developed algorithmic approaches are usually not good candidates for such discourse. Interesting problems that ‘go somewhere’ mathematically can often be catalysts for rich conversations.” (NCTM, 2000, p. 60)
10 of 120
The students’ ability to communicate is vital to assessing their mathematical understanding. Students’ understanding should be assessed through the use of good questions that promote the need for communication among students. Assessments in the mathematics classroom should include open-ended questions as well as peer and self-assessment. Assessments should ask students to describe and explain mathematical concepts and methods in multiple ways (with multiple representations) to demonstrate deep understanding. Reasoning and Proof All students should be able to:
Reason in a wide range of mathematical and applied settings Recognize reasoning and proof as fundamental aspects of mathematics Make and investigate mathematical conjectures Develop and evaluate mathematical arguments and proof Select and use various types of reasoning and methods of proof
“Being able to reason is essential to understanding mathematics. By developing ideas, exploring phenomena, justifying results, and using mathematical conjectures in all content areas and—with different expectations of sophistication—at all grade levels, students should see and expect that mathematics makes sense. Building on the considerable reasoning skills that children bring to school, teachers can help students learn what mathematical reasoning entails. By the end of secondary school, students should be able to understand and produce mathematical proofs—arguments consisting of logically rigorous deductions of conclusions from hypotheses—and should appreciate the value of such arguments” (NCTM, 2000, p. 56). Implications for Curriculum, Instruction, and Assessment Reasoning and proof should be addressed throughout curriculum, instruction, and assessment. These skills should be taught as an integral part of classroom instruction in all areas of mathematics. As the context for reasoning and proof, teachers should choose problems rich in mathematical content and accessible and challenging to all students. Students build confidence in their abilities to develop and defend their own arguments as they solve problems in a classroom environment that supports questioning, discussion, and listening. In such a supportive, inquiry-based classroom environment students will use their mathematical knowledge to make conjectures about problems. Students will analyze various approaches to investigate their conjectures. They will develop a carefully reasoned mathematical argument to support their conclusion. This justification of their conjecture will be communicated through interactions with classmates and teacher and validated against conventional arguments. “Reasoning and proof cannot simply be taught in a single unit on logic, for example, or by "doing proofs" in geometry. Proof is a very difficult area for undergraduate mathematics students. Perhaps students at the postsecondary level find proof so difficult because their only experience in writing proofs has been in a high school geometry course, so they have a limited perspective (Moore 1994). Reasoning and proof should be a consistent part of students' mathematical experience in prekindergarten through grade 12. Reasoning mathematically is a habit of mind, and like all habits, it must be developed through consistent use in many contexts.” (NCTM, 2000, p. 56)
11 of 120
Ability to Recognize, Make, and Apply Connections All students should be able to:
Recognize and use connections among mathematical ideas Understand how mathematical ideas interconnect and build on one another to produce a
coherent whole Recognize and apply mathematics in contexts outside of mathematics
When students are able to see the connections across different mathematical content areas, they develop a view of mathematics as an integrated whole. As students build on their previous mathematical understandings while learning new concepts, students become increasingly aware of the connections among various mathematical topics. This focus on connections while learning mathematics develops students’ ability to recognize, make, and apply connections more generally. (Adapted from NCTM, 2000) Implications for Curriculum, Instruction, and Assessment “As the Learning Principle [in NCTM’s Principles and Standards] emphasizes, understanding involves making connections” (NCTM 2000, p. 64). A connected and coherent mathematics curriculum helps students make connections across the strands of mathematics. Problem-based instructional tasks provide connections to other disciplines and to the real world. Instruction should emphasize important mathematics across and within the disciplines. Educators should pose questions that encourage students to make connections, including connections to their previous mathematical knowledge. Ability to Construct and Apply Multiple Connected Representations All students should be able to:
Create and use representations to organize, record, and communicate mathematical ideas Select, apply, and translate among mathematical representations to solve problems Use representations to model and interpret physical, social, and mathematical phenomena
“The ways in which mathematical ideas are represented is fundamental to how people can understand and use those ideas. When students gain access to mathematical representations and the ideas they represent, they have a set of tools that significantly expand their capacity to think mathematically” (NCTM, 2000, p. 67). Students should be able to choose appropriate representations in order to gain particular insights or achieve particular ends. Students should understand that different representations represent different ways of thinking about and manipulating mathematical objects. An object can be better understood when viewed through multiple lenses. As students encounter new representations for mathematical concepts, they need to be able to convert flexibly among those representations. (Adapted from NCTM, 2000) Implications for Curriculum, Instruction, and Assessment Teachers should introduce students to multiple connected mathematical representations and help them use those representations effectively. They should highlight ways in which different representations can convey different information and emphasize the importance of selecting representations suited to the particular mathematical tasks at hand. Assessments should allow for students to have choices when representing problems and solutions. Students should be
12 of 120
encouraged to evaluate which representation is best to use when solving a problem or investigating a mathematical idea. (Adapted from NCTM, 2000) “Representations should be treated as essential elements in supporting students' understanding of mathematical concepts and relationships; in communicating mathematical approaches, arguments, and understandings to one's self and to others; in recognizing connections among related mathematical concepts; and in applying mathematics to realistic problem situations through modeling. New forms of representation associated with electronic technology create a need for even greater instructional attention to representation” (NCTM, 2000, p. 67).
13 of 120
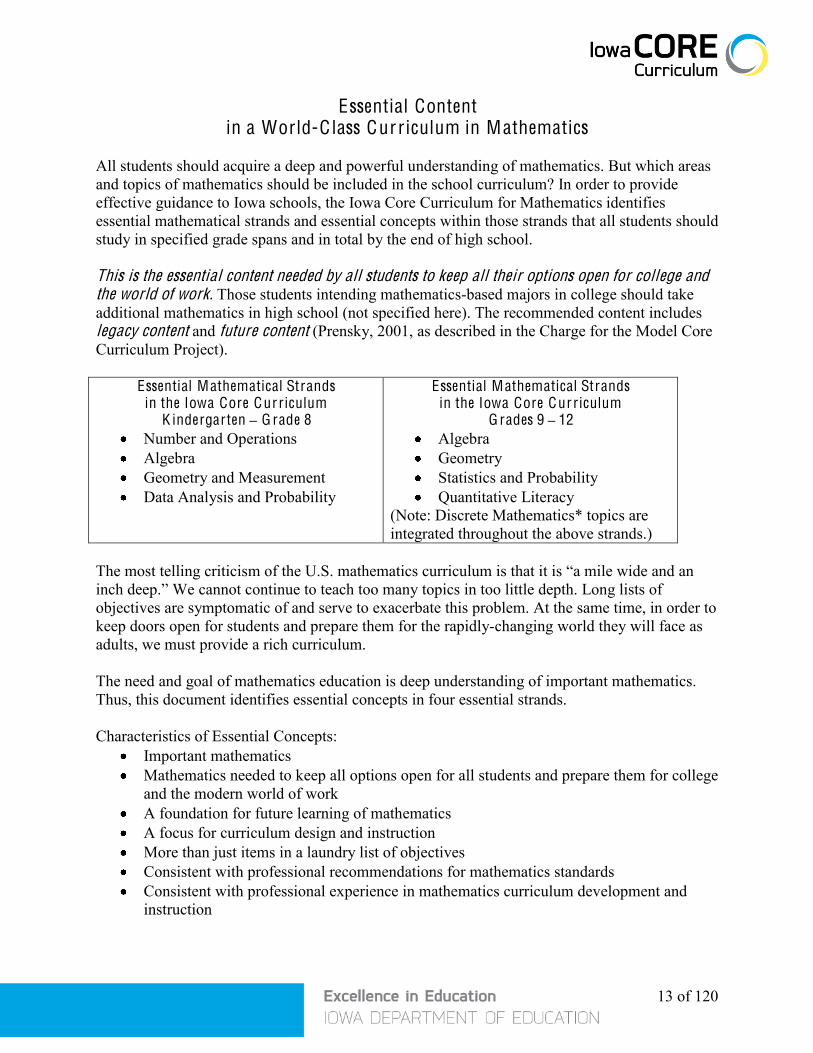
Essential Content in a World-C lass Cur riculum in Mathematics
All students should acquire a deep and powerful understanding of mathematics. But which areas and topics of mathematics should be included in the school curriculum? In order to provide effective guidance to Iowa schools, the Iowa Core Curriculum for Mathematics identifies essential mathematical strands and essential concepts within those strands that all students should study in specified grade spans and in total by the end of high school. This is the essential content needed by all students to keep all their options open for college and the world of work. Those students intending mathematics-based majors in college should take additional mathematics in high school (not specified here). The recommended content includes legacy content and future content (Prensky, 2001, as described in the Charge for the Model Core Curriculum Project).
Essential Mathematical Strands in the Iowa Core Cur riculum
K indergarten – G rade 8 Number and Operations Algebra Geometry and Measurement Data Analysis and Probability
Essential Mathematical Strands in the Iowa Core Cur riculum
G rades 9 – 12 Algebra Geometry Statistics and Probability Quantitative Literacy
(Note: Discrete Mathematics* topics are integrated throughout the above strands.)
The most telling criticism of the U.S. mathematics curriculum is that it is “a mile wide and an inch deep.” We cannot continue to teach too many topics in too little depth. Long lists of objectives are symptomatic of and serve to exacerbate this problem. At the same time, in order to keep doors open for students and prepare them for the rapidly-changing world they will face as adults, we must provide a rich curriculum. The need and goal of mathematics education is deep understanding of important mathematics. Thus, this document identifies essential concepts in four essential strands. Characteristics of Essential Concepts:
Important mathematics Mathematics needed to keep all options open for all students and prepare them for college
and the modern world of work A foundation for future learning of mathematics A focus for curriculum design and instruction More than just items in a laundry list of objectives Consistent with professional recommendations for mathematics standards Consistent with professional experience in mathematics curriculum development and
instruction
14 of 120
In addition to an emphasis on essential concepts in each strand, it is also important to weave together general themes of mathematics. Mathematics has been described as a science of patterns, in particular patterns of number, shape, change, chance, and data (cf. Steen, 1990). These themes need to be woven together throughout the study of the mathematical strands. The topics identified here do not all require the same amount of time in the curriculum. For example, at the high school level, the topics of vertex-edge graphs or social decision making may take just a couple weeks or days in the entire high school curriculum, while other topics such as equations and inequalities or geometric properties and relationships will take much longer. * “Discrete mathematics is an important branch of contemporary mathematics that is widely used in business and industry. … Discrete mathematics is often described by listing the topics it includes, such as vertex-edge graphs, systematic counting, iteration and recursion, matrices, voting methods, and fair division. … Three key topics of discrete mathematics that are integrated within [NCTM’s] Principles and Standards are combinatorics, iteration and recursion, and vertex-edge graphs. … Other discrete mathematics topics that may be included in the school curriculum include the mathematics of information processing (e.g., error-correcting codes and cryptography), and the mathematics of democratic and social decision making (e.g., voting methods, apportionment, fair division, and game theory)” (Navigating through Discrete Mathematics in Grades 6–12, Hart, Kenney, DeBellis, and Rosenstein, NCTM, 2008).

15 of 120
Primary (K indergarten – G rade 2)
Number and Operations Overall in the number and operations strand, students should “understand numbers, ways of representing numbers, relationships among numbers, and number systems; understand meanings of operations and how they relate to one another; and compute fluently and make reasonable estimates” (NCTM, 2000, p. 32). Specific goals are the following. Count, represent, read, compare, order and conserve (knows that the total number does not change when configured differently) whole numbers. In particular , students will:
Count, represent, read, compare, order, and conserve whole numbers up to 1000. Write, compare, and order numbers to at least 120 using the words equal to, greater than,
less than, greatest, and least when appropriate. Count by tens or hundreds, forwards and backwards, starting at any number from 1 to
1000. Represent numbers to at least 1000 in different way using written words, numerals, or
models, and translate among representations. Identify the placement and relationships between digits and their values in numbers up to
1000. Develop understandings of addition and subtraction and strategies for basic addition facts and related subtraction facts. In particular , students will:
Solve and create story problems that match addition or subtraction expressions or equations using physical objects, pictures, or words.
Solve simple story problems (result unknown) involving joining, separating, and grouping situations. Solve story problems involving joining, separating, comparing, grouping, and partitioning using a variety of strategies, such as direct modeling with objects or pictures, counting on and counting back, and using related facts and known facts.
Add and subtract two-digit numbers efficiently and accurately using a procedure that can be generalized, including the standard algorithm and describe why the procedure works.
Express numbers as equivalent representations to fluently compose and decompose numbers (putting together and taking apart). In particular , students will:
Fluently compose (put together) and decompose (take apart) numbers at least to 10. Compose and decompose two- and three-digit numbers based on the values of the digits
used to write the number. Solve word problems involving joining, separating, part/whole, comparing, grouping, and
partitioning, using a variety of strategies, such as direct modeling, counting up or counting back by 1s or 10s, and deriving or recalling facts. (The unknown can appear in a variety of positions).
Develop fluency and quick recall of addition facts and related subtraction facts and fluency with multi-digit addition and subtraction. In particular , students will:

16 of 120
Show the inverse relationship between addition and subtraction by using physical models, diagrams, and/or acting-out situations.
Explain and use strategies for understanding addition facts for sums equal to at least 10, and related subtraction facts.
Develop and demonstrate quick recall of basic addition facts to 20 and related subtraction facts.
Solve word problems involving joining, separating, part/whole, comparing, grouping, and partitioning, using a variety of strategies, such as direct modeling, counting up or counting back by 1s or 10s, and deriving or recalling facts. (The unknown can appear in a variety of positions).
Estimate the answer to an addition or subtraction problem before computing, and determine whether the computed answer makes sense. In particular , students will:
Determine whether the computed answer to an addition or subtraction problem is reasonable.
Estimate an answer prior to computing. (For example, 23 + 48 is about 70.) Develop an understanding of whole number relationships, including grouping in tens and ones and apply place-value concepts. In particular , students will:
Group and count objects by 2s, 5s, and 10s. Find a number that is 10 more or 10 less than a given number. Group numbers into 10s and 1s in more than one way and explain why the total remains
the same. Explain and use strategies for remembering addition and subtraction facts to 20. Use mental strategies, invented algorithms, and traditional algorithms based on
knowledge of place value to add and subtract two-digit numbers. Understand fractional parts are equal shares or equal portions of a whole unit (a unit can be an object or a collection of things). In particular , students will:
Understand and represent commonly used fractions, such as 1/4, 1/3, and 1/2.
17 of 120
Algebra Overall in the algebra strand, students should “understand patterns, relations, and functions; represent and analyze mathematical situations and structures using algebraic symbols; use mathematical models to represent and understand quantitative relationships; and analyze change in various contexts” (NCTM, 2000, p. 37). Specific goals are the following. Recognize, describe, create and extend repeating and growing patterns such as physical, geometr ic and numeric patterns and translate from one representation to another . In particular , students will:
Recognize, describe, create and extend color, rhythmic, shape, number and letter repeating patterns with simple attributes.
Identify a missing element in a pattern. Make a generalization that patterns can translate from one representation to another. Recognize, describe, create and extend repeating and growing patterns. Translate a pattern between sound, symbols, movements and objects. Identify, create, describe, and extend simple number and growing patterns. involving
repeated addition and subtraction, skip counting and arrays of objects. Use patterns to solve problems in various contexts.
Sort, classify, and order objects by size, number and other properties. In particular , students will:
Sort and a classify objects by a single attribute and explain the sorting rule. Sort and a classify objects by multiple attributes and explain the sorting rule (sort and
classify the same set of objects in multiple ways and explain the various sorting rules.). Sort and classify a set of objects using a Venn diagram.
Demonstrate the use of the commutative and associative properties and mathematical reasoning to solve for the unknown quantity in addition and subtraction problems; justify the solution. In particular , students will:
Solve, with objects, simple problems involving joining and separating. Develop concepts of addition and subtraction (including commutativity and associativity
of addition) using mathematical tools (objects, number line, hundreds chart, etc.), pictures, and mathematical notation.
Use commutative and associative properties and mathematical reasoning to solve a variety of addition and subtraction problems involving two or more one-digit numbers; justify the solution.
18 of 120
Understand equality as meaning “the same as” and use the = symbol appropriately. In particular , students will:
Recognize the use of symbols to represent mathematical ideas in joining and separating problems.
Determine if equations involving addition and subtraction are true. Demonstrate an understanding that the “=” sign means “the same as” by solving open
number sentences including those with variables. Write number sentences using mathematical notation ( +, =, -, <, >, , and variables) to
represent mathematical relationships to solve problems. Solve equations in which the unknown and the equal sign appear in a variety of positions. Use number sentences involving addition and subtraction, and unknowns to represent and
solve given problem situations.

19 of 120
G eometry Overall in the geometry strand, students should “analyze characteristics and properties of two- and three-dimensional geometric shapes and develop mathematical arguments about geometric relationships; specify locations and describe spatial relationships using coordinate geometry and other representational systems; apply transformations and use symmetry to analyze mathematical situations; and use visualization, spatial reasoning, and geometric modeling to solve problems” (NCTM, 2000, p. 41). Specific goals are the following. Recognize and describe shapes and structures in the physical environment. In particular , students will:
Identify, name, sort, and describe two- and three-dimensional shapes (including circles, triangles, rectangles, squares, cubes, and spheres), and real-world approximations of the shapes, regardless of size or orientation.
Compose and decompose geometric shapes, including plane and solid figures to develop a foundation for understanding area, volume, fractions, and proportions. In particular , students will:
Compose (combine) and decompose (take apart) two- and three-dimensional figures and analyze the results.
Compose and decompose two- and three-dimensional shapes to develop a foundation of fractional relationships and proportions.
Cover two-dimensional objects with shapes to develop a foundation for area. Fill three-dimensional objects to develop a foundation for volume.

20 of 120
Identify, name, sort, and describe two- and three-dimensional geometr ic figures regardless of size or orientation. In particular , students will:
Describe characteristics of two- and three-dimensional objects (number of corners, edges, and sides, length of sides, etc.).
Describe and specify space and location with simple relationships and with coordinate systems. In particular , students will:
Describe the location of one object relative to another object using words such as in, out, over, under, above, below, between, next to, behind, and in front of.
Locate points on maps and simple coordinate grids with letters and numbers. Represent points and simple figures on maps using simple coordinate grids with letters
and numbers. Experience and recognize slides, flips, turns and symmetry to analyze mathematical situations. In particular , students will:
Identify shapes that have been rotated (turned), reflected (flipped), translated (slid), and enlarged. Describe the direction of the translation (left, right, up, down).
Use attributes of geometric figures to solve spatial problems. In particular , students will:
Describe and represent shapes from different perspective. Explore relationships of different attributes. Describe geometric shapes in the environment and specify their location.
21 of 120
Measurement Overall in the measurement strand, students should “understand measurable attributes of objects and the units, systems, and processes of measurement; and apply appropriate techniques, tools, and formulas to determine measurements” (NCTM, 2000, p. 44). Specific goals are the following. Identify attributes that are measurable, such as length, weight, time and capacity, and use these attributes to order objects and make direct comparisons. In particular , students will:
Identify attributes that are measurable such as length, volume, weight, and area. Use these attributes and appropriate language to make direct comparisons. (Taller, shorter, longer, same length; heavier, lighter, same weight; holds more, holds less, holds the same amount).
Recognize temporal concepts such as before, after, sooner, later, morning, afternoon, evening.
Use a seriated set of objects to order and compare lengths. Recognize that objects used to measure an attribute (length, weight, capacity) must have
that attribute and must be consistent in size. Determines the relationship between the size of the unit and the number of units needed
to make a measurement. Estimate, measure and compute measurable attributes while solving problems. In particular , students will:
Select appropriate measurement tools and units (standard and non-standard) to solve problems.
Estimate and measure length using standard (customary and metric) and non-standard units with comprehension. In particular , students will:
Understand the necessity for identical units (standard or non-standard) for accurate measurements.
Use a variety of non-standard units to measure length without gaps or overlaps. Use non-standard units to compare objects according to their capacities or weights. Associate the time of day with everyday events. Name standard units of time (day, week, month). Use both analog and digital clock to tell time to the hour and half hour. Estimate and measure length using metric and customary units. Select appropriate measurement tools and units (standard and non-standard) to solve
problems. Use both analog and digital clock to tell time to the nearest five-minute interval. Describe the relationship among standard units of time: minutes, hours days, weeks,
months and years.
22 of 120
Data Analysis and Probability Overall in the data analysis and probability strand, students should “formulate questions that can be addressed with data and collect, organize, and display relevant data to answer them; select and use appropriate statistical methods to analyze data; develop and evaluate inferences and predictions that are based on data; and understand and apply basic concepts of probability” (NCTM, 2000, p. 48). Specific goals are the following. Collect, sort, organize, and represent data to ask and answer questions relevant to the K -2 environment. In particular , students will :
Collect and organize data in lists, tables, and simple graphs. Collect, organize, represent, and interpret data in bar-type graphs, picture graphs,
frequency tables, and line plots. Use interviews, surveys, and observations to collect data that answers questions about
themselves and their surroundings. Compare different representations of the same data using these types of graphs: bar graphs, f requency tables, line plots, and picture graphs. In particular , students will:
Represent a collection of data using tallies, tables, picture graphs and bar graphs. Compare a single data set using different types of graphs.
Use information displayed on graphs to answer questions and make predictions, inferences and generalizations such as likely or unlikely events. In particular , students will:
Answer simple questions relating to the information displayed on a graph, table, or list. Use interviews, surveys, and observations to collect data that answers questions about
themselves and their surroundings. Analyze information by asking and answering questions about the data. Contrast different sets of data displayed on the same type of graph to draw conclusions
and make generalizations. Use information from data to make observations and inferences, draw conclusions, and
make predictions.

23 of 120
Intermediate (G rades 3–5)
Number and Operations Overall in the number and operations strand, students should “understand numbers, ways of representing numbers, relationships among numbers, and number systems; understand meanings of operations and how they relate to one another; and compute fluently and make reasonable estimates” (NCTM, 2000, p. 32). Specific goals are the following. Develop an understanding of multiplication and division concepts and strategies for basic multiplication facts and related division facts. In particular , students will:
Develop concepts of multiplication and division through the use of different representations (e.g. equal-sized groups, arrays, area models, and skip counting on number lines for multiplication, and successive subtraction, partitioning, and sharing for division).
Use commutative, associative, and distributive properties to develop strategies and generalizations to solve multiplication problems. These strategies will evolve from simple strategies (e.g. times 0, times 1, doubles, count by fives) to more sophisticated strategies, such as splitting the array.
Relate multiplication and division as inverse operations and learn division facts by relating them to the appropriate multiplication facts.
Consider the context in which a problem is situated to select the most useful form of the quotient for the solution, and they interpret it appropriately.
Be able to make comparisons involving multiplication and division, using such words as “twice as many” or “half as many”.
Develop fluency and quick recall of multiplication facts and related division facts and fluency with multi-digit multiplication and division. In particular , students will:
Extend their work with multiplication and division strategies to develop fluency and recall of multiplication and division facts.
Apply their understanding of models for multiplication (i.e. equal-sized groups, arrays, area models), place value, and properties of operations (in particular, the distributive property) as they develop, discuss, and use efficient, accurate, and generalizable methods to multiply multidigit whole numbers.
Apply their understanding of models for division (partitioning, successive subtraction) place value, properties, and the relationship of division to multiplication as they develop, discuss, and use efficient, accurate, and generalizable procedures to find quotients involving multidigit dividends.
Develop fluency with efficient procedures for multiplying and dividing whole numbers and use them to solve problems.

24 of 120
Develop the ability to estimate the results of computation with whole numbers, f ractions or decimals and be able to judge reasonableness. In particular , students will:
Generalize patterns of multiplying and dividing whole numbers by 10, 100, and 1000 and develop understandings of relative size of numbers.
Be able to estimate sums and differences with whole numbers up to three digits. Build facility and understand when estimation, mental computation or paper-and-pencil
computations are appropriate in a given problem. Select and apply appropriate strategies (mental computation, number sense and
estimation) for estimating products and quotients or determining reasonableness of results, depending on the context and numbers involved.
Make reasonable estimates of fraction and decimal sums and differences. Extend place value concepts to represent and compare both whole numbers and decimals. In particular , students will:
Extend their understanding of place value to numbers up to 10,000, 100,000 and millions in various contexts and depending on grade level.
Understand decimal notation as an extension of the base-ten system of writing whole numbers through place-value patterns and models (place-value charts and base-ten blocks) from tenths to hundredths and thousandths, depending on grade level.
Use benchmarks to help develop number sense. In particular , students will:
Use estimation in determining the relative sizes of number including amounts and distances, such as 500 is 5 flats or 5 x 100, or 500 is ½ of 1000.
Learn about the position of numbers in the base-ten number system (763 is 7 x 100 plus 6 x 10 plus 3 x 1) and its relationship to benchmarks such as 500, 750, 800 and 1000.
Extend common benchmarks such as 10, 25, 50, and 100 to understand and use benchmarks of 500 and 1000.
Understand and use common benchmarks such as ½ or 1 to compare fractions.

25 of 120
Develop an understanding of commonly used fractions, decimals, and percents, including recognizing and generating equivalent representations. In particular , students will:
Develop an understanding of the meanings and uses of fractions to represent parts of a whole, parts of a set, or points or distances on a number line.
Understand that the size of a fractional part is relative to the size of the whole, and use fractions to represent numbers that are equal to, less than, or greater than 1.
Solve problems that involve comparing and ordering fractions by using models, benchmark fractions, or strategies involving common numerators or denominators.
Understand and use models, including the number line, to identify equivalent fractions including numbers greater than one.
Connect and extend their understanding of fractions to modeling, reading and writing decimals (tenths, hundredth and thousandths), that are greater than or less than 1, identifying equivalent decimals, and comparing and ordering decimals.
Connect fractions (initially halves, fourths, and tenths, and then fifths, thirds, and eighths) and their equivalent decimals through representations including word names, symbols and models (10 x 10 grids and number lines).
Recognize and generate equivalent forms of commonly used fractions, decimals and percents.
Develop an understanding of and fluency with addition and subtraction of fractions and decimals. In particular , students will:
Apply their understandings of fractions and fraction models to represent the addition and subtraction of fractions with unlike denominators as equivalent calculations with like denominators.
Apply their understandings of decimal models, place value, and properties to develop strategies to add and subtract fractions and decimals.
Develop fluency with standard procedures for adding and subtracting fractions and decimals.
Add and subtract fractions and decimals to solve problems and use number sense to determine reasonableness of results.

26 of 120
Algebra Overall in the algebra strand, students should “understand patterns, relations, and functions; represent and analyze mathematical situations and structures using algebraic symbols; use mathematical models to represent and understand quantitative relationships; and analyze change in various contexts” (NCTM, 2000, p. 37). Specific goals are the following. Represent and analyze patterns and relationships involving multiplication and division to introduce multiplicative reasoning. In particular students will:
Build a foundation using multiplicative contexts for later understanding of functional relationships with such statements as, “The number of legs is 4 times the number of chairs” or “A quarter is five times the value of a nickel.”
Make generalizations by reasoning about the structure of the pattern to determine if the patterns are nonnumeric growing, repeating, or multiplicative patterns.
Identify the commutative, associative, and distr ibutive properties and use them to compute with whole numbers. In particular students will:
Explore the commutative and associative properties through models and examples to determine which properties hold for multiplication and division facts and develop increasingly sophisticated strategies based on these properties and the distributive property to solve multiplication problems involving basic facts.
Use properties of addition and multiplication to multiply and divide whole numbers and understand why these algorithms work.
Understand and apply the idea of a variable as an unknown quantity and express mathematical relationships using equations. In particular , students will:
Use invented notation, standard symbols and variables to express a pattern, generalization, or situation.
Develop an understanding of the use of a rule to describe a sequence of numbers or objects.
Use patterns, models, and relationships as contexts for writing and solving simple equations and inequalities.
Represent and analyze patterns and functions, using words, tables, and graphs. In particular , students will:
Describe patterns verbally and represent them with tables or symbols. Continue to identify, describe, and extend numeric patterns involving all operations and
nonnumeric growing or repeating patterns. Identify patterns graphically, numerically, or symbolically and use this information to
predict how patterns will continue. Create graphs of simple equations. Be able to use various techniques including words, tables, numbers and symbols for
organizing and expressing ideas about relationships and functions.

27 of 120
G eometry and Measurement Overall in the geometry and measurement strand, students should “analyze characteristics and properties of two- and three-dimensional geometric shapes and develop mathematical arguments about geometric relationships; specify locations and describe spatial relationships using coordinate geometry and other representational systems; apply transformations and use symmetry to analyze mathematical situations; and use visualization, spatial reasoning, and geometric modeling to solve problems” (NCTM, 2000, p. 41). Students should also “understand measurable attributes of objects and the units, systems, and processes of measurement; and apply appropriate techniques, tools, and formulas to determine measurements” (NCTM, 2000, p. 44). Specific goals are the following. Describe, analyze and classify two-dimensional and three-dimensional shapes. In particular , students will:
Describe, analyze, and compare two-dimensional shapes by their sides and angles and connect these attributes to definitions of shapes.
Relate two-dimensional shapes to three-dimensional shapes and analyze properties of polyhedral solids, describing them by the number of edges, faces, or vertices as well as the types of faces.
Classify two- and three-dimensional shapes according to their attributes and develop definitions of classes of shapes such as parallelograms and prisms.
Explore congruence and similarity. In particular , students will:
Understand attributes and properties of two-dimensional space through building, drawing and analyzing two-dimensional shapes and use the attributes and properties to solve problems, including applications involving congruence and symmetry.
Apply congruence to other contexts such as three-dimensional shapes and repeating the congruent shapes to build a similar shape.
Explore similar shapes to determine that angle measure is the same and the related sides are proportional, that is, related by the same multiplicative or scale factor.
Predict and describe the results of sliding (translation), flipping (reflection), and turning (rotation) two-dimensional shapes. In particular , students will:
Investigate, describe, and reason about decomposing, combining, and transforming polygons to make other polygons.
Investigate and describe line and rotational symmetry. Extend their understanding of two-dimensional space by using transformations to design
and analyze simple tilings and tessellations. Use ordered pairs on a coordinate grid to descr ibe points or paths (first quadrant). In particular , students will:
Learn how to use two numbers to name points on a coordinate grid and know this ordered pair corresponds to a particular point on the grid.
Make and use coordinate systems to specify locations and to describe paths. Explore methods for measuring the distance between two locations on the grid along
horizontal and vertical lines.
28 of 120
Use geometric models to solve problems, such as determining perimeter , area, volume , and surface area. In particular , students will:
Develop measurement concepts and skills through experiences in analyzing attributes and properties of two- and three-dimensional objects.
Form an understanding of perimeter as a measurable attribute and quantify perimeter by finding the total distance or length around the shape.
Recognize area as an attribute of two-dimensional regions and that they can quantify area by finding the total number of same-sized units of area that cover the shape without gaps or overlaps.
Connect area measure to the area model that has been used to represent multiplication, and use this connection to justify the formula for the area of a rectangle.
Develop, understand and use formulas to find the area of rectangles, related triangles and parallelograms and learn to measure the necessary attributes of shapes.
Recognize volume as an attribute of three-dimensional space and understand they can quantify volume by finding the total number of same-sized units of volume that fill the space without gaps or overlaps.
Decompose three-dimensional shapes to develop strategies for determining surface area. Develop strategies to determine the volumes of prisms by layering.
Select and apply appropriate standard (customary and metric) units and tools to measure length, area, volume, weight, time, temperature, and the size of angles. In particular , students will:
Select appropriate units, strategies, and tools to solve problems that involve estimating and measuring perimeter, area and volume.
Develop facility in measuring with fractional parts of linear units. Understand that a square that is 1 unit on a side is the standard unit for measuring area. Understand that a cube that is 1 unit on an edge is the standard unit for measuring
volume. Select and apply appropriate units, strategies and tools to solve problems that involve
estimating and measuring weight, time and temperature. Measure and classify angles.
Select and use benchmarks ( 1
2inch, 2 liters, 5 pounds, etc.) to estimate measurements. In
particular , students will: Develop strategies for estimating measurements using appropriate benchmarks, both
standard units such as 1 foot and nonstandard units such as the length a book. Learn to use strategies involving multiplicative reasoning to estimate measurements (i.e. estimating their teacher’s height to be one and a quarter times the student’s own height).
Estimate angle measure using a right angle as the benchmark.

29 of 120
Data Analysis and Probability Overall in the data analysis and probability strand, students should “formulate questions that can be addressed with data and collect, organize, and display relevant data to answer them; select and use appropriate statistical methods to analyze data; develop and evaluate inferences and predictions that are based on data; and understand and apply basic concepts of probability” (NCTM, 2000, p. 48). Specific goals are the following. Represent and analyze data using tallies, pictographs, tables, line plots, bar graphs, ci rcle graphs and line graphs. In particular , students will:
Recognize the differences representing categorical and numerical data. Construct and analyze frequency tables, bar graphs, picture graphs, and line plots and use
them to address a question. Compare different representations of the same data and evaluate how well each
representation shows important aspects of the data. Use their understanding of whole numbers, fractions, and decimals to construct and
analyze circle graphs and line graphs. Apply their understanding of place value to develop and use stem-and-leaf plots.
Describe the distr ibution of the data using mean, median, mode or range. In particular , students will:
Learn to compare related data sets, noting the similarities and differences between the two sets and develop the idea of a “average” value.
Learn to select and use measures of center: mean, median and mode and apply them to describing data sets.
Build an understanding of what the measures of center tells them about the data and to see this value in the context of other characteristics of the data such as the range.
Begin to conceptually explore the meaning of mean as the balance point for the data set. Propose and justify conclusions and predictions based on data. In particular , students will:
Learn how to describe data, make a prediction to describe the data, and then justify their predictions.
Learn to collect data using observations, surveys and experiments and propose conjectures.
Design simple experiments to examine their conjectures and justify their conclusions. Design investigations to address a question and consider how data collection methods
affect the nature of the data set. Examine the role of sample size has in predictions about data.

30 of 120
Predict the probability of simple experiments and test predictions. In particular , students will:
Examine the probability of experiments that have only a few outcomes, such as game spinners (i.e., how likely is it that the spinner will land on a particular color?), by first predicting the probability of the desired event and then exploring the outcome through experimental probability.
Learn to represent the probability of a certain event as 1 and the probability of an impossible event as 0.
Learn to use common fractions to represent events that are neither certain nor impossible. Describe events as likely or unlikely and discuss the degree of likelihood using words like certain, equally likely and impossible. In particular , students will:
Understand probability as the measurement of the likelihood of events. Learn to estimate the probability of events as certain, equally likely or impossible by
designing simple experiments to collect data and draw conclusions.

31 of 120
Middle (G rades 6–8)
Number and Operations Overall in the number and operations strand, students should “understand numbers, ways of representing numbers, relationships among numbers, and number systems; understand meanings of operations and how they relate to one another; and compute fluently and make reasonable estimates” (NCTM, 2000, p. 32). Specific goals are the following.
Understand, apply, and be computationally fluent with multiplication and division of fractions and decimals. In particular , students will:
Understand that multiplying two numbers does not necessarily make a bigger number, nor does dividing always result in a smaller number.
Understand and explain procedures for multiplying and dividing fractions by using the meanings of fractions, multiplication and division, and the inverse relationship between multiplication and division.
Understand and explain procedures for multiplying and dividing decimals by using the relationship between decimals and fractions, as well as the relationship between finite decimals and whole numbers (i.e., a finite decimal multiplied by an appropriate power of 10 is a whole number).
Use common procedures to multiply and divide fractions and decimals efficiently and accurately.
Convert from one unit to another in the metric system of measurement by using understanding of the relationships among the units and by multiplying and dividing decimals.
Convert from one unit to another in the customary system of measurement by using understanding of the relationships among the units and by multiplying and dividing fractions.
Multiply and divide fractions and decimals to solve problems, including multi-step problems.
Understand, apply, and be computationally fluent with rational numbers, including negative numbers. In particular , students will:
Understand negative numbers in terms of their position on the number line, their role in the system of all rational numbers, and in everyday situations (e.g., situations of owing money or measuring elevations above and below sea level).
Understand absolute value in terms of distance on the number line and simplify numerical expressions involving absolute value.
By applying properties of arithmetic and considering negative numbers in everyday contexts, explain why the rules for adding, subtracting, multiplying, and dividing with negative numbers make sense.
Understand positive integer exponents in terms of repeated multiplication and evaluate simple exponential expressions.
Effectively compute with and solve problems using rational numbers, including negative numbers.
32 of 120
Understand, estimate, and represent real numbers, including common ir rational numbers and with scientific notation. In particular , students will:
Recognize that the set of real numbers, which can be represented as the number line, consists of two disjoint sets – the set of rational numbers and the set of irrational numbers.
Estimate irrational numbers and represent them as points on the number line. Recognize irrational numbers as non-repeating, non-terminating decimals, including common irrational numbers such as π and non-perfect square roots and cube roots
Understand and determine the square roots of perfect squares. Understand and estimate square roots of non-perfect-squares, and determine more precise
values using a calculator. Represent, use, and interpret numbers in scientific notation. Use scientific notation and rational and irrational numbers to model and solve problems.
Understand and apply ratio and rate, including percents, and connect ratio and rate to fractions and decimals. In particular , students will:
Build on understanding of fractions and part-whole relationships to understand ratios (by, for example, analyzing the relative quantities of boys and girls in the classroom or triangles and squares in a drawing).
Understand percent as a rate and develop fluency in converting among fractions, decimals, and percents.
Understand equivalent ratios as deriving from, and extending, pairs of rows (or columns) in the multiplication table.
Understand rate as a way to compare unlike quantities (such as miles per hour or a situation in which 5 pens cost $3.75).
Use a variety of strategies to solve problems involving ratio and rate. Understand and apply proportional reasoning. In particular , students will:
Understand that a proportion is an equation that states that two ratios are equivalent. Understand proportional relationships (y = kx or y
x= k), and distinguish proportional
relationships from other relationships, including inverse proportionality (xy = k or y = kx
).
Understand that in a proportional relationship of two variables, if one variable doubles or triples, for example, then the other variable also doubles or triples, and if one variable changes additively by a specific amount, a, then the other variable changes additively by the amount ka.
Graph proportional relationships and identify the constant of proportionality as the slope of the related line.
Use ratios and proportionality to solve a wide variety of percent problems, including problems involving discounts, interest, taxes, tips, and percent increase or decrease.
Use proportionality to solve single and multi-step problems in a variety of other contexts.

33 of 120
Algebra Overall in the algebra strand, students should “understand patterns, relations, and functions; represent and analyze mathematical situations and structures using algebraic symbols; use mathematical models to represent and understand quantitative relationships; and analyze change in various contexts” (NCTM, 2000, p. 37). Specific goals are the following. W rite, interpret, and use mathematical expressions and equations, find equivalent forms, and relate such symbolic representations to verbal, graphical, and tabular representations. In particular , students will:
Write mathematical expressions, equations, and formulas that correspond to given situations.
Understand that variables represent numbers whose exact values are not yet specified, use single letters, words, or phrases as variables, and use variables appropriately.
Evaluate expressions (for example, find the value of 3x if x is 7). Understand that expressions in different forms can be equivalent, and rewrite an
expression to represent a quantity in a different way (e.g., to make it more compact or to feature different information).
Understand that solutions of an equation are the values of the variables that make the equation true.
Solve simple one-step equations (i.e., involving a single operation) by using number sense, properties of operation, and the idea of maintaining equality on both sides of an equation.
Construct and analyze tables (e.g., to show quantities that are in equivalent ratios), and use equations to describe simple relationships shown in a table (such as 3x = y).
Use expressions, equations, and formulas to solve problems, and justify their solutions. Understand and apply proportionality. In particular , students will:
Understand that a proportion is an equation that states that two ratios are equivalent. Understand proportional relationships (y = kx or y
x= k), and distinguish proportional
relationships from other relationships, including inverse proportionality (xy = k or y = kx
).
Graph proportional relationships and identify the constant of proportionality as the slope of the related line.
Use ratios and proportionality to solve a wide variety of percent problems, including problems involving discounts, interest, taxes, tips, and percent increase or decrease.
Use proportionality to solve single and multi-step problems in a variety of other contexts.
34 of 120
Understand, solve, and apply linear equations and inequalities. In particular , students will: Make strategic choices of procedures to solve linear equations and inequalities in one
variable and implement them efficiently. Recognize and generate equivalent forms of linear expressions, by using the associative,
commutative, and distributive properties. Understand that when properties of equality are used to transform an equation into a new
equivalent equation, solutions obtained for the new equation also solve the original equation.
Solve more complicated linear equations, including solving for one variable in terms of another.
Solve linear inequalities and represent the solution on a number line. Formulate linear equations and inequalities in one variable and use them to solve
problems, including in applied settings, and justify the solution using multiple representations.
Understand and apply linear functions. In particular , students will:
Understand linear functions and slope of lines in terms of constant rate of change. Understand that the slope of a line is constant, for example by using similar triangles (e.g., as shown in the rise and run of “slope triangles”), and compute the slope of a line using any two points on the line.
Build on the concept of proportion, recognizing a proportional relationship ( yx
= k, or y =
kx) as a special case of a linear function. In this special case, understand that if one variable doubles or triples, for example, then the other variable also doubles or triples; and understand that if the input, or x-coordinate in this case, changes additively by a specific amount, a, then the output, or y-coordinate in this case, changes additively by the amount ka.
Understand that the graph of the equation y = mx + b is a line with y-intercept b and slope m.
Translate among verbal, tabular, graphical, and algebraic representations of functions, including recursive representations such as NEXT = NOW +3 (recognizing that tabular and graphical representations often only yield approximate solutions), and describe how such aspects of a linear function as slope, constant rate of change, and intercepts appear in different representations.
Use linear functions, and understanding of the slope of a line and constant rate of change, to analyze situations and solve problems.
Use tables and graphs to analyze systems of linear equations. In particular , students will:
Use tables and graphs to analyze and (approximately) solve systems of two linear equations in two variables.
Relate a system of two linear equations in two variables to a pair of lines in the plane that intersect, are parallel, or are the same.
Use systems of linear equations to analyze situations and solve problems.

35 of 120
G eometry Overall in the geometry strand, students should “analyze characteristics and properties of two- and three-dimensional geometric shapes and develop mathematical arguments about geometric relationships; specify locations and describe spatial relationships using coordinate geometry and other representational systems; apply transformations and use symmetry to analyze mathematical situations; and use visualization, spatial reasoning, and geometric modeling to solve problems” (NCTM, 2000, p. 41). Specific goals are the following.
Understand, determine, and apply area of polygons. In particular , students will:
Use physical models, such as geoboards, to develop and make sense of area formulas. Use knowledge of area of simpler shapes to help find area of more complex shapes. Understand and apply formulas to find area of triangles and quadrilaterals. Solve problems related to and using area, including in real-world settings.
Understand and apply similarity, with connections to proportion. In particular , students will:
Understand that two objects are similar if they have the same shape (i.e., corresponding angles are congruent) but not necessarily the same size.
Understand similarity in terms of a scale factor between corresponding lengths in similar objects (i.e., similar objects are related by transformations of magnifying or shrinking).
Understand that relationships of lengths within similar objects are preserved (i.e., ratios of corresponding sides in similar objects are equal).
Understand that congruent figures are similar with a scale factor of 1. Use understanding of similarity to solve problems in a variety of contexts.
Understand, determine, and apply surface area and volume of prisms and cylinders and ci rcumference and area of ci rcles. In particular , students will:
Find the area of more complex two-dimensional shapes, such as pentagons, hexagons, or irregular shaped regions, by decomposing the complex shapes into simpler shapes, such as triangles.
Understand that the ratio of the circumference to the diameter of a circle is constant and equal to , and use this fact to develop a formula for the circumference of a circle.
Understand that the formula for the area of a circle is plausible by decomposing a circle into a number of wedges and rearranging them into a shape that approximates a parallelogram.
Develop and justify strategies for determining the surface area of prisms and cylinders by determining the areas of shapes that comprise the surface.
By decomposing prisms and cylinders by slicing them, develop and understand formulas for their volumes (Volume = Area of base x Height).
Select appropriate two-and three-dimensional shapes to model real-world situations and solve a variety of problems (including multi-step problems) involving surface area, area and circumference of circles, and volume of prisms and cylinders.
36 of 120
Analyze two-dimensional space and figures by using distance, angle, coordinates, and transformations. In particular , students will:
Explore and explain the relationships among angles when a transversal cuts parallel lines. Use facts about the angles that are created when a transversal cuts parallel lines to explain
why the sum of the measures of the angles in a triangle is 180 degrees, and apply this fact about triangles to find unknown measures of angles.
Understand and explain how particular configurations of lines give rise to similar triangles because of the congruent angles created when a transversal cuts parallel lines (e.g., “slope triangles”).
Use reasoning about similar triangles to solve a variety of problems, including those that involve determining heights and distances.
Explain why the Pythagorean Theorem is valid by using a variety of methods – for example, by decomposing a square in different ways.
Apply the Pythagorean theorem to find distances between points in the Cartesian coordinate plane and to measure lengths and analyze polygons.
Understand and apply transformations – reflection, translation, rotation, and dilation, and understand similarity, congruence, and symmetry in terms of transformations.
Visualize, represent, and describe three-dimensional shapes. In particular , students will:
Recognize and draw two-dimensional representations of three-dimensional figures, including nets, front-side-top views, and perspective drawings.
Identify and describe three-dimensional shapes, including prisms, pyramids, cylinders, and spheres.
Examine, build, compose, and decompose three-dimensional objects, using a variety of tools, including paper-and-pencil, geometric models, and dynamic geometry software.
Use visualization and three-dimensional shapes to solve problems, especially in real-world settings.
37 of 120
Data Analysis and Probability Overall in the data analysis and probability strand, students should “formulate questions that can be addressed with data and collect, organize, and display relevant data to answer them; select and use appropriate statistical methods to analyze data; develop and evaluate inferences and predictions that are based on data; and understand and apply basic concepts of probability” (NCTM, 2000, p. 48). Specific goals are the following.
Understand, interpret, determine, and apply measures of center and graphical representations of data. In particular , students will:
Extend prior work with mode, median, and mean as measures of center. Compute the mean for small data sets and explore its meaning as a balance point for a
data set. Extend prior work with bar graphs, line graphs, line plots, histograms, circle graphs, and
stem and leaf plots as graphical representations of data to include box-and-whisker plots and scatterplots.
Create and interpret box-and-whisker plots and scatterplots. Analyze and summarize data sets, including initial analysis of variability. In particular , students will:
Select, determine, explain, and interpret appropriate measures of center for given data sets (mean, median, mode).
Select, create, explain, and interpret appropriate graphical representations for given data sets (bar graphs, circle graphs, line graphs, histograms, line plots, stem and leaf plots, box-and-whisker plots, scatterplots).
Summarize and compare data sets using appropriate numerical statistics and graphical representations.
Compare the information provided by the mean and the median and investigate the different effects that changes in the data values have on these measures of center.
Understand that a measure of center alone does not thoroughly describe a data set because very different data sets can share the same measure of center, and thus consider and describe the variability of the data (e.g, range and interquartile range).
Informally determine a line of best fit for a scatterplot to make predictions and estimates. Formulate questions, gather data relevant to the questions, organize and analyze the data
to help answer the questions, including informal analysis of randomness and bias.
38 of 120
Use proportions and percentages to analyze data and chance. In particular , students will: Use proportions to make estimates relating to a population on the basis of a sample. Apply percentages to make and interpret histograms and circle graphs. Explore situations in which all outcomes of an experiment are equally likely, and thus the
theoretical probability of an event is the number of outcomes corresponding to the event divided by total number of possible outcomes.
Use theoretical probability and proportions to make approximate predictions. Understand and represent simple probabilistic situations. In particular , students will:
Represent the probability of events that are impossible, unlikely, likely, and certain using rational numbers from 0 to 1.
List all possible outcomes of a given experiment or event. Understand, compute, and estimate simple probabilities using counting strategies and simulation. In particular , students will:
Understand and apply the Multiplication Principle of Counting in simple situations. Compute probabilities for compound events, using such methods as organized lists, tree
diagrams (counting trees), area models, and counting principles. Estimate the probability of simple and compound events through experimentation and
simulation. Use a variety of experiments to explore the relationship between experimental and
theoretical probabilities and the effect of sample size on this relationship.
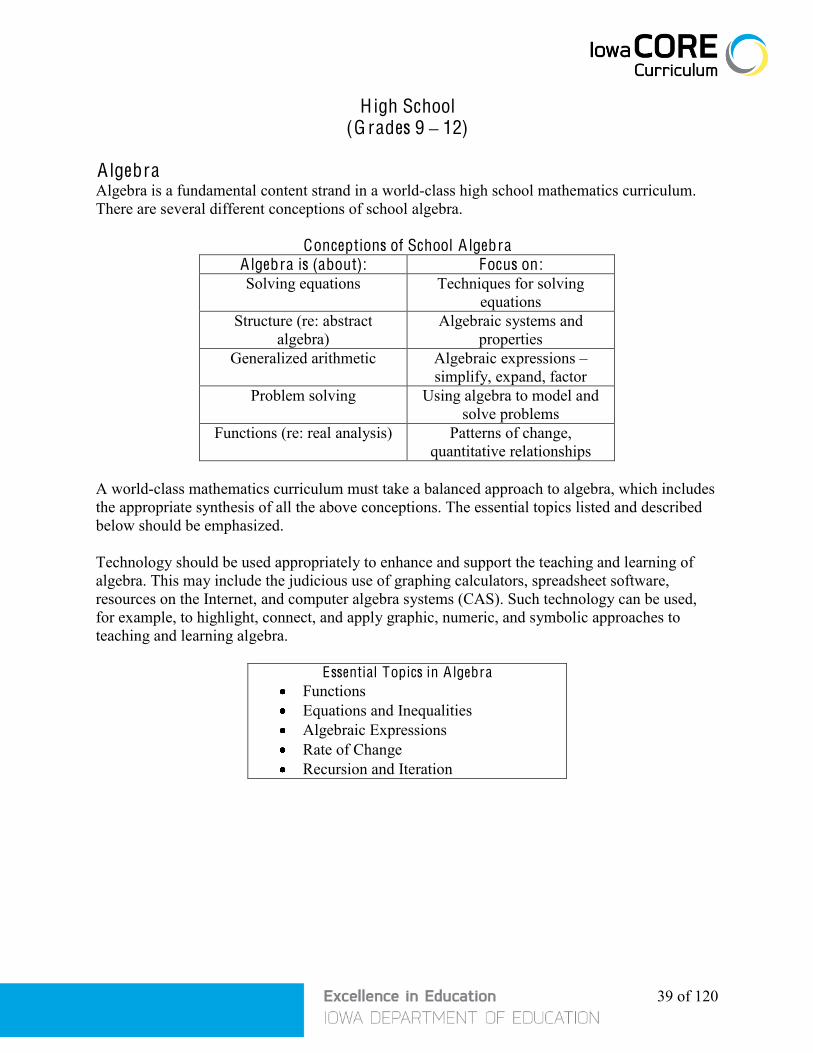
39 of 120
High School (G rades 9 – 12)
A lgebra Algebra is a fundamental content strand in a world-class high school mathematics curriculum. There are several different conceptions of school algebra.
Conceptions of School A lgebra A lgebra is (about): Focus on: Solving equations Techniques for solving
equations Structure (re: abstract
algebra) Algebraic systems and
properties Generalized arithmetic Algebraic expressions –
simplify, expand, factor Problem solving Using algebra to model and
solve problems Functions (re: real analysis) Patterns of change,
quantitative relationships A world-class mathematics curriculum must take a balanced approach to algebra, which includes the appropriate synthesis of all the above conceptions. The essential topics listed and described below should be emphasized. Technology should be used appropriately to enhance and support the teaching and learning of algebra. This may include the judicious use of graphing calculators, spreadsheet software, resources on the Internet, and computer algebra systems (CAS). Such technology can be used, for example, to highlight, connect, and apply graphic, numeric, and symbolic approaches to teaching and learning algebra.
Essential Topics in A lgebra Functions Equations and Inequalities Algebraic Expressions Rate of Change Recursion and Iteration

40 of 120
Functions Understand, analyze, represent, and apply functions
The concept of function is central to the study of algebra (and extends beyond algebra as well). Functions can be used to represent and reason about patterns of change and relationships between quantitative variables, including in real-world situations. Often when modeling or solving problems with functions, students will develop, analyze, and manipulate algebraic expressions and solve equations and inequalities. Students’ experiences with functions should include analysis of families of functions (linear, quadratic, other polynomial, exponential, trigonometric, rational, and logarithmic). Students should also study absolute value, square root, cube root, and piecewise functions. Analysis of functions should include: zeros, maximum and minimum, domain and range, global and local behavior, intercepts, rate of change, and inverse functions. Students should be able to recognize, represent, compare/contrast, compose, and transform functions. They should represent functions in multiple ways: symbolically (explicitly and recursively), graphically, numerically, and verbally, and understand the connections among these representations. Students should also understand and analyze relations that are not functions.
Equations and Inequalities Understand, analyze, solve, and apply equations and inequalities
Equations and inequalities can be used to symbolically model situations. Studying equations and inequalities in context helps students develop a deep understanding of the meaning of both the equation or the inequality and the solution. Students should become fluent in connecting the symbolic representation with the situation being represented. Inherent in the study of equations and inequalities is the use of algebraic expressions, and students should understand the difference between equations and expressions. Students should distinguish between an equation and an inequality and compare and contrast their properties and the methods for solving them. Further, discussion about the reasonableness and meaning of a solution is important. Methods for solving equations and inequalities include symbolic, numeric, and graphic. Algebraic properties of real numbers should be used fluently, with a focus on equivalent equations. A particular emphasis is on solving linear and quadratic equations, although much of the work with linear equations should have been completed in middle school. Students should be able to manipulate formulas, including solving for one variable in terms of the others, and they should develop a conceptual understanding of the meaning of the formulas through their context. Once the concept of an equation and its solution is studied, students move to the study of systems of equations, both linear and nonlinear systems. Students should analyze, apply, and choose appropriate methods for solving systems of equations (symbolic, graphic, numeric, and matrix methods).

41 of 120
Algebraic Expressions Understand, analyze, transform, and apply algebraic expressions
Algebraic expressions often arise when modeling situations. Students should understand and use algebraic expressions based on “symbol sense,” that is, the ability to connect algebraic forms to numeric, graphic, and contextual interpretations and implications. Students’ symbol sense builds on their number sense. Symbol sense allows students to represent situations with algebraic expressions and interpret expressions in terms of the situation. Students with symbol sense should meaningfully manipulate algebraic expressions to obtain equivalent forms by simplifying, factoring, expanding, and using order of operations, laws of exponents, and properties of real numbers.
Rate of Change Understand, analyze, approximate, and interpret rate of change
A key concept in the study of functions is rate of change. Rate of change is the rate at which one variable changes with respect to another. Situations involving rate of change may include the speed of a car, the number of people per year by which a population increases, and slope of a line. Rate of change should be analyzed in multiple ways, including numeric, symbolic (recursive and explicit), and graphic representations. Students should approximate and interpret rate of change based on graphs, numerical data, and real-world situations. The study of rate of change focuses on slope and lays the groundwork for calculus. Students should distinguish between a constant rate of change and a non-constant rate of change. In addition, some students may investigate rate of change in terms of finite differences tables.
Recursion and Iteration Understand and apply recursion and iteration
Recursion and iteration are powerful mathematical tools for solving problems related to sequential (i.e., step-by-step) change, such as population change from year to year or the growth of money over time due to compound interest. To iterate means to repeat, so iteration is the process of repeating a procedure or computation over and over again. Recursion is the method of describing a given step in a sequence in terms of the previous step(s). Students should be able to represent recursive relationships with informal notation, subscript notation, and function notation. They should understand and use a recursive view of functions, including for deeper understanding of key ideas. For example, NEXT = NOW + 3 could represent a linear function with slope 3, and S(n + 1) = 3S(n) could represent an exponential function with constant multiplier 3. Students should understand and apply finite arithmetic and geometric sequences and series, including an analysis with both recursive and explicit formulas. They should use recursion and iteration to represent and solve problems.

42 of 120
G eometry Geometry is the study of shape. We can begin by considering, in a sense, the situation of no shape. That is, consider geometric diagrams consisting of vertices and edges in which shape is not essential, only the connections among vertices are essential. This leads to the study of vertex-edge graphs (also called networks or simply graphs). Continuing the study of shape, consider properties of and relationships among shapes, including two- and three-dimensional shapes; location of shapes, leading to coordinate geometry; transformations of shapes, leading to transformation geometry; special shapes, such as circles and triangles, leading to trigonometry; and reasoning about shape, including geometric proof. All these aspects of shape are captured in the essential topics listed and described below. Technology should be used appropriately to enhance and support the teaching and learning of geometry. This may include the judicious use of graphing calculators, interactive geometry software, and resources on the Internet. Such technology can be used, for example, to facilitate an experimentation and conjecturing approach to teaching and learning geometry.
Essential Topics in Geometry Coordinates Transformations Geometric Properties and Relationships Trigonometric Relationships Vertex-Edge Graphs
43 of 120
Coordinates Represent and solve geometric problems by specifying location using coordinates
Rectangular coordinates are the focus of the study of coordinate geometry in the core curriculum. However, students should recognize that the location of a point can be described in other ways, such as by using angle and distance (as in polar coordinates or bearings) or using latitude and longitude. The study of coordinate geometry includes investigating conjectures, modeling, and solving problems. By using inductive and deductive reasoning with coordinates, properties of geometric objects can be conjectured and proven. Coordinates can be used to describe points, lines, and other two- and three-dimensional figures. Transformations of these objects can be described using coordinate rules. Analysis of the relationships of geometric objects includes the use of formulas for distance, midpoint, and slope, and the Pythagorean theorem. Students should find and analyze equations that represent lines, circles and parabolas. (Students should be introduced to the other conic sections–ellipses and hyperbolas). In three dimensions, students should be able to plot points using rectangular coordinates.
T ransformations Understand and apply the basic principles of transformation geometry
Transformations, such as reflections and rotations, are mappings that move points. Students should be familiar with three classes of transformations: (1) transformations that preserve distance (called isometries or rigid motions, such as reflections, rotations, translations), (2) transformations that preserve shape (such as size transformations, dilations, or similarity transformations), and (3) transformations that change distance and shape (e.g., shears). Students should recognize similarity and congruence in terms of certain transformations. Students should be able to identify, create, describe, and justify transformations using multiple representations. They should be able to find and describe an image under a given transformation or composition of transformations. Students should also be able to identify the transformations that produce a given image. Transformations should be represented algebraically (using coordinate rules, matrices, vectors), and those representations should be used to analyze and reason about transformations.
Geometr ic Properties and Relationships Understand and apply properties and relationships of geometric figures
Students should be able to visualize, describe, reason about, prove, and apply properties and relationships of two- and three-dimensional figures. Specific geometric skills students should demonstrate include visualizing, drawing, geometric modeling, making and testing conjectures, and using inductive and deductive reasoning. Properties and relationships of geometric figures should be examined and justified, including similarity, congruence, and measurement. Figures should be represented with drawings, coordinates, and matrices; and transformations of the figures should be investigated. The primary focus should be on two-dimensional figures, their properties and relationships. Particular emphasis should be given to properties of angles, lines, polygons, and

44 of 120
circles. In three dimensions, students should be able to visualize, draw, and determine measurements of simple three-dimensional shapes. Measurement skills and concepts should be included in the study of geometry, including finding perimeter, area, volume and surface area (much of which is studied in middle school). Estimation, appropriate units, dimensional analysis, and judgments about accuracy should be part of the study of measurement.
T rigonometric Relationships Use trigonometry based on triangles and circles
to solve problems about length and angle measures
Students should study trigonometry with respect to right triangles, general triangles, circles, and periodic relationships. Included in the study of right triangle trigonometry are the trigonometric ratios, the Pythagorean theorem and its converse, and the two special-case triangles, 30 –60 –90 and 45 –45 –90 . Trigonometry should be extended beyond right triangles to general triangles using the Law of Sines and Law of Cosines. Examining right triangles in relation to the unit circle extends analysis to general periodic relationships. Degree and radian measure should be studied. The analysis of trigonometric functions includes: domain and range, period, amplitude, and vertical and horizontal shifts. Students should be able to recognize and model relevant periodic phenomenon with trigonometric functions. Students should use trigonometry to solve problems. Students should reason about, reason with, and apply fundamental trigonometric relationships, including sin2x + cos2x = 1, tanx = sinx/cosx, and cosx = sin (90 – x).
Vertex-Edge G raphs Use diagrams consisting of vertices and edges (vertex-edge graphs)
to model and solve problems
Vertex-edge graphs are diagrams consisting of vertices (points) and edges (line segments or arcs) connecting some of the vertices. The term “vertex-edge graph” is used to distinguish this type of graph from other graphs, such as function graphs or data plots. Nevertheless, vertex-edge graphs are often simply called graphs, especially in college mathematics courses. Vertex-edge graphs are also sometimes called networks, discrete graphs, or finite graphs. Whatever term is used, a vertex-edge graph shows relationships and connections among objects, such as in a road network, a telecommunications network, or a family tree. Within the context of school geometry, which is fundamentally the study of shape, vertex-edge graphs represent, in a sense, the situation of no shape. That is, vertex-edge graphs are geometric models consisting of vertices and edges in which shape is not essential, only the connections among vertices are essential. These graphs are widely used in business and industry to solve problems about networks, paths, and relationships among a finite number of objects (such as, analyzing a computer network; optimizing the route used for snowplowing, garbage collection, or visiting business clients; scheduling committee meetings to avoid conflicts; or planning a large construction project to finish on time). Students should understand, analyze, and apply vertex-edge graphs to model and solve problems related to paths, circuits, networks, and relationships among a finite number of

45 of 120
elements, in real-world and abstract settings. Important vertex-edge graph topics for the high school curriculum include: Euler and Hamilton paths and circuits, the traveling salesman problem (TSP), minimum spanning trees, critical paths, shortest paths, and vertex coloring. These topics can be compared and contrasted in terms of algorithms, optimization, properties, and types of problems that can be solved. Students should represent and analyze vertex-edge graphs using adjacency matrices. Some students may also analyze and interpret powers of an adjacency matrix. This important material on vertex-edge graphs may be addressed as part of instruction in geometry or when teaching matrices or in separate mini-units.
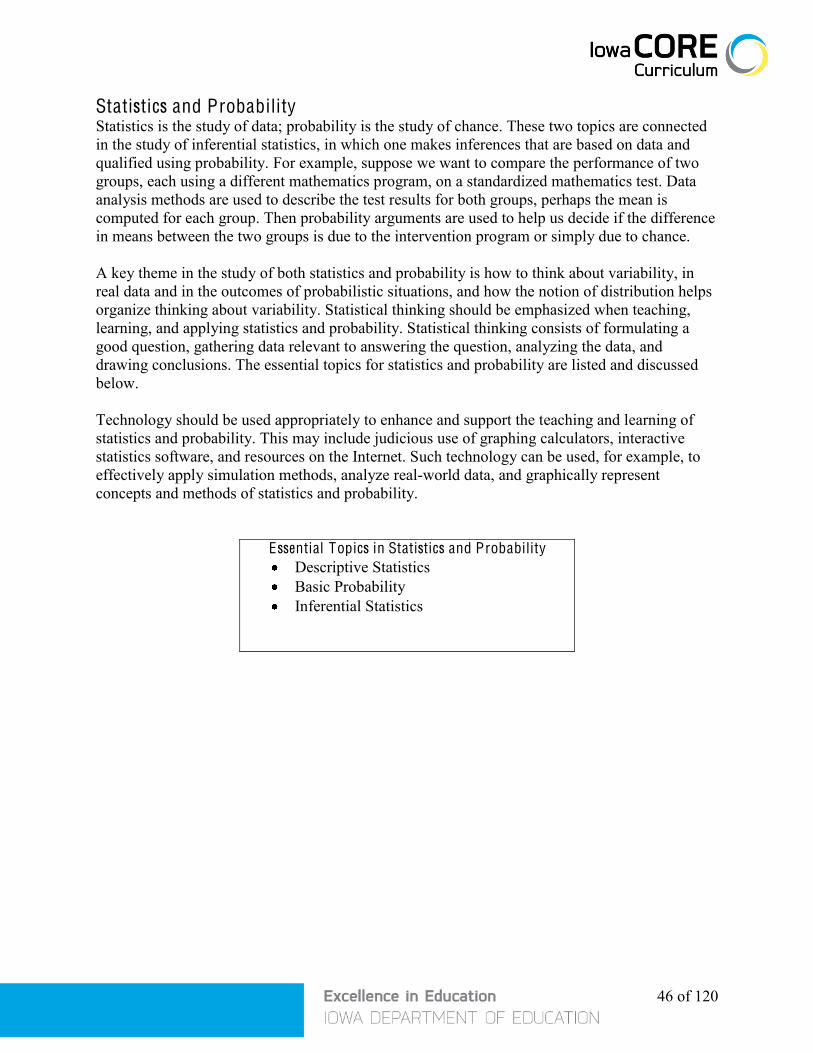
46 of 120
Statistics and Probability Statistics is the study of data; probability is the study of chance. These two topics are connected in the study of inferential statistics, in which one makes inferences that are based on data and qualified using probability. For example, suppose we want to compare the performance of two groups, each using a different mathematics program, on a standardized mathematics test. Data analysis methods are used to describe the test results for both groups, perhaps the mean is computed for each group. Then probability arguments are used to help us decide if the difference in means between the two groups is due to the intervention program or simply due to chance. A key theme in the study of both statistics and probability is how to think about variability, in real data and in the outcomes of probabilistic situations, and how the notion of distribution helps organize thinking about variability. Statistical thinking should be emphasized when teaching, learning, and applying statistics and probability. Statistical thinking consists of formulating a good question, gathering data relevant to answering the question, analyzing the data, and drawing conclusions. The essential topics for statistics and probability are listed and discussed below. Technology should be used appropriately to enhance and support the teaching and learning of statistics and probability. This may include judicious use of graphing calculators, interactive statistics software, and resources on the Internet. Such technology can be used, for example, to effectively apply simulation methods, analyze real-world data, and graphically represent concepts and methods of statistics and probability.
Essential Topics in Statistics and Probability Descriptive Statistics Basic Probability Inferential Statistics

47 of 120
Descriptive Statistics Understand and interpret descriptive statistics
Descriptive statistics involves describing and summarizing data. For example, for
univariate (one-variable) data like test scores, we might describe the range of the data, the mean score, or the standard deviation of the scores. For bivariate (two-variable) data like weight before and after a diet program, we might fit a line to the (before, after) data points and use the line to estimate and predict weight.
As societal demands for statistical reasoning increase, high school students need rich experiences to create, choose, understand, and interpret statistical models, with and without technology. These experiences should be built on their understanding of data analysis developed in the middle grades.
Students should collect, represent, and analyze numerical and categorical data, and both univariate and bivariate data. Representations of data should include histograms, box plots, scatterplots, bar graphs, line graphs, stem and leaf plots, frequency distributions, and relative frequency distributions. Students should compare and contrast these different representations, and choose appropriate representations. Analysis of data should include graphical representations, measures of center and variability, transformations of univariate data, outliers, regression, and correlation. Students should describe and analyze distributions of data in terms of center, spread, and shape. Much of this material should be studied in middle school. In high school, students should reinforce their previous knowledge of data analysis from the middle grades and focus on extending that knowledge to standard deviation, linear regression, and correlation.
Basic Probability Understand and apply the basic ideas of probability
Probability is the study of chance and likelihood. The study of probability should include the essential ideas needed for making inferences from data. Experiments should be conducted to develop the idea of sample space and events. Counting concepts and methods, including permutations, combinations, and the multiplication principle of counting, should be applied to probability. The probability of an event, when the outcomes are equally likely, should be understood as the ratio of the size of the event (number of outcomes corresponding to the event) to the size of the sample space (number of possible outcomes). The rules for probability of events and compound events should be addressed in terms of the students’ experiments and simulations. Special emphasis should be given to the addition rule, because of the need to consider the intersection, the analysis of which leads to the ideas of independent events, multiplication rule, mutually exclusive, and conditional probability. The notion of random variables and probability distribution of a discrete random variable should be introduced through simple experiments. Students should compare and contrast experimental and theoretical probabilities. The analysis of probability distributions should include the expected value and measures of variability. Various types of probability distributions should be studied, including binomial and normal distributions.
48 of 120
Inferential Statistics Understand and interpret inferential statistics
Statistical inference is the process of using a sample to draw conclusions (make
inferences) that go beyond the sample. Since the sample does not contain all the information about the population or all the results from all possible experiments, probability is used to help describe the limitations of the inference. For example, in an experiment to test the relative effectiveness of two drugs, the inference that one is better than the other is qualified by using probability to describe how likely it is that the results of the experiment are due to chance rather than effectiveness of the drugs.
Students should understand that information from a sample can be used to estimate information about a population. Instruction should start with activities involving concrete experiments and simulations and should address issues of randomness, rare events, sources of bias, and sample size. Building on the use of simulation, students should understand key ideas such as sampling distribution and rare event, and use these ideas to analyze and interpret published statistical reports, such as in newspaper articles. Making inferences from data is often part of a statistical study. A statistical study is a survey, observational study, or experiment that applies statistical thinking. Statistical thinking involves formulating questions, collecting data relevant to those questions, analyzing the data, and drawing appropriate conclusions. Students should apply statistical thinking to design, conduct, and analyze simple statistical studies. In doing so, they may use descriptive statistics, statistical inference, and probability.
49 of 120
Quantitative L iteracy Quantitative literacy has a particular significance and interpretation in our fast-changing, information-dense, high-technology global society. In this context, quantitative literacy includes the ability to estimate and judge precision of numbers (e.g., the size of the national debt), the ability to quantitatively understand and make decisions through voting and elections (e.g., the merits of preferential voting to fairly decide elections), and an understanding of the basic mathematics needed for informed Internet use (e.g., searching strategies and secure e-commerce transactions). The essential topics in this Quantitative Literacy strand are listed and discussed below. Technology should be used appropriately to enhance and support the teaching and learning of quantitative literacy. This may include judicious use of graphing calculators, specialty software, and resources on the Internet.
Essential Topics in Quantitative L iteracy Number Operations and Properties Systematic Counting Social Decision Making Mathematics of Information Processing
and the Internet

50 of 120
Number Operations and Properties Understand and apply number operations and properties
As problem situations become more sophisticated in high school, the need arises to build on and expand students’ understanding of number, operations on numbers, properties of numbers, and different number systems. Students should solve problems with solutions involving natural numbers, integers, rational numbers, real numbers, and complex numbers. Students should understand and apply the properties of the operations within the number systems. Students should understand and apply matrices and the operations of matrix addition and multiplication. They should compare and contrast the properties of matrix operations with the properties of operations on real numbers. Students should use mental, pencil-paper, and technology-based computation techniques. Given a variety of situations, students should determine the reasonableness of computation results. Students should develop skills in estimating, approximating, and judging the size and appropriateness of numbers.
Systematic Counting Understand and apply the mathematics of systematic counting
Systematic counting is sometimes more formally called combinatorics. This includes mathematical concepts and methods needed to solve counting problems, such as determining how many computer passwords are possible using two letters and four digits, how many different license plate numbers or telephone numbers are possible, or how many different pizzas you can order if you choose three toppings from six available toppings. Students should understand and apply basic counting methods including systematic listing, tree diagrams, and the multiplication principle of counting. They should understand the importance of ordering and repetition when attempting to count the number of possible choices from a collection. They should understand and apply permutations, combinations, and combinatorial reasoning.
Social Decision Making Understand and apply some basic mathematics
of decision making in a democratic society Two fundamental aspects of life in a modern democratic society are voting and the Internet. Social Decision Making as described here includes a mathematical analysis of voting. Some of the mathematics of the Internet is included in the next topic. To be informed and productive citizens in a democratic society, students should understand and apply basic voting methods, such as majority, plurality, runoff, approval, the Borda method (in which points are assigned to preferences), and the Condorcet method (in which each pair of candidates is run off head to head). Understanding these voting methods, and the issues associated with all voting methods, can help ensure fairer elections when there are more than two candidates. This important topic may only take a couple days in the entire high school curriculum, and could be taught in a social studies class. Related to the idea of social decision making, some students may also learn about mathematical concepts and methods of fair division and apportionment.

51 of 120
Mathematics of Information Processing and the Internet
Understand and apply some basic mathematics of information processing and the Internet
We live in a society in which the Internet is ubiquitous. To be informed consumers and citizens in the information-dense modern world permeated by the Internet, students should have a basic mathematical understanding of some of the issues of information processing on the Internet. For example, when making an online purchase, mathematics is used to help you find what you want, encrypt your credit card number so that you can safely buy it, send your order accurately to the vendor, and, if your order is immediately downloaded, as when purchasing software, music, or video, ensure that your download occurs quickly and error-free. Students should understand and apply elementary set theory and logic, as used in Internet searches. Students should also understand and apply basic number theory, including modular arithmetic, as used in cryptography. These topics are not only fundamental to information processing on the Internet, but they are also important mathematical topics in their own right with applications in many other areas. These topics may be included as part of instruction in other areas, such as number and operations or proof, or they could be included as separate mini-units. Some students may also learn about error-detecting and error-correcting codes and data compression through Huffman codes.

52 of 120
APPE NDI X A
Rigor and Relevance Quadrant Examples
Grades K – 8
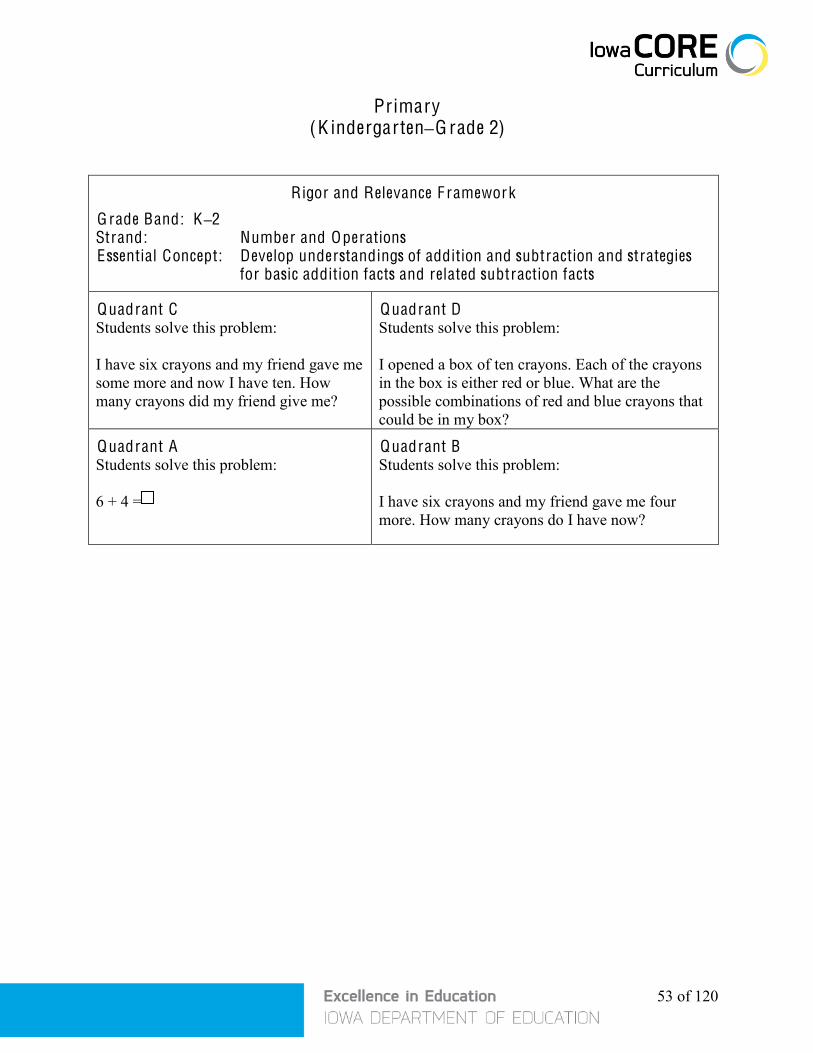
53 of 120
Primary (K indergarten–G rade 2)
Rigor and Relevance F ramework
G rade Band: K–2 Strand: Number and Operations Essential Concept: Develop understandings of addition and subtraction and strategies for basic addition facts and related subtraction facts
Quadrant C Students solve this problem: I have six crayons and my friend gave me some more and now I have ten. How many crayons did my friend give me?
Quadrant D Students solve this problem: I opened a box of ten crayons. Each of the crayons in the box is either red or blue. What are the possible combinations of red and blue crayons that could be in my box?
Quadrant A Students solve this problem: 6 + 4 =
Quadrant B Students solve this problem: I have six crayons and my friend gave me four more. How many crayons do I have now?

54 of 120
Rigor and Relevance F ramework
G rade Band: K–2 Strand: A lgebra Essential Concept: Recognize, describe, and extend repeating and growing patterns
such as physical, geometric and numeric patterns and translate from one representation to another
Quadrant C Students are asked to create an ABAB pattern. Pattern blocks are available for use as needed. Ask students to describe the pattern and name the next three components.
Quadrant D In pairs, each student creates a repeating linear pattern for a table runner using a set of pattern blocks. Students ask their partner to tell them the next shape in their pattern, then the next. Students ask their partner to predict the fifteenth shape in the pattern. Students duplicate the pattern to produce the table runner using appropriate materials.
Quadrant A Using pattern blocks, the teacher creates an ABAB pattern. The students are requested to duplicate the teacher’s pattern.
Quadrant B In art class, students use pattern blocks of only one shape and three different color (or 3 shapes of one color) and design their own pattern.

55 of 120
Rigor and Relevance F ramework
G rade Band: K–2 Strand: Geometry Essential Concept: Compose and decompose geometric shapes, including plane and
solid figures, to develop a foundation for understanding area, volume, fractions, and proportions
Quadrant C Students are given a set of pattern blocks with all squares and tan rhombuses removed. Teacher asks students to show: 1) How many green triangles are needed to cover one blue rhombus? 2) How many green triangles to cover three blue rhombuses? 3) How many green triangles do you need to cover one red trapezoid? 4) What other relations can you show between the shapes?
Quadrant D During the fish unit, children are given two outlines, one of a long skinny fish and one of a short fat fish. Given a set of pattern blocks with all squares and tan rhombuses removed, students are asked to cover the shapes and determine which fish has the larger area.
Quadrant A Using a set of pattern blocks with all squares and tan rhombuses removed, show the students different shapes and ask them to name the shapes. Teacher asks student to show how many green triangles are needed to cover a blue rhombus.
Quadrant B Students design the background for the cover of a shapes book. The cover has connected outlines of the hexagon shapes. Students are provided hexagons, triangles, trapezoids, and rhombuses to create the cover.
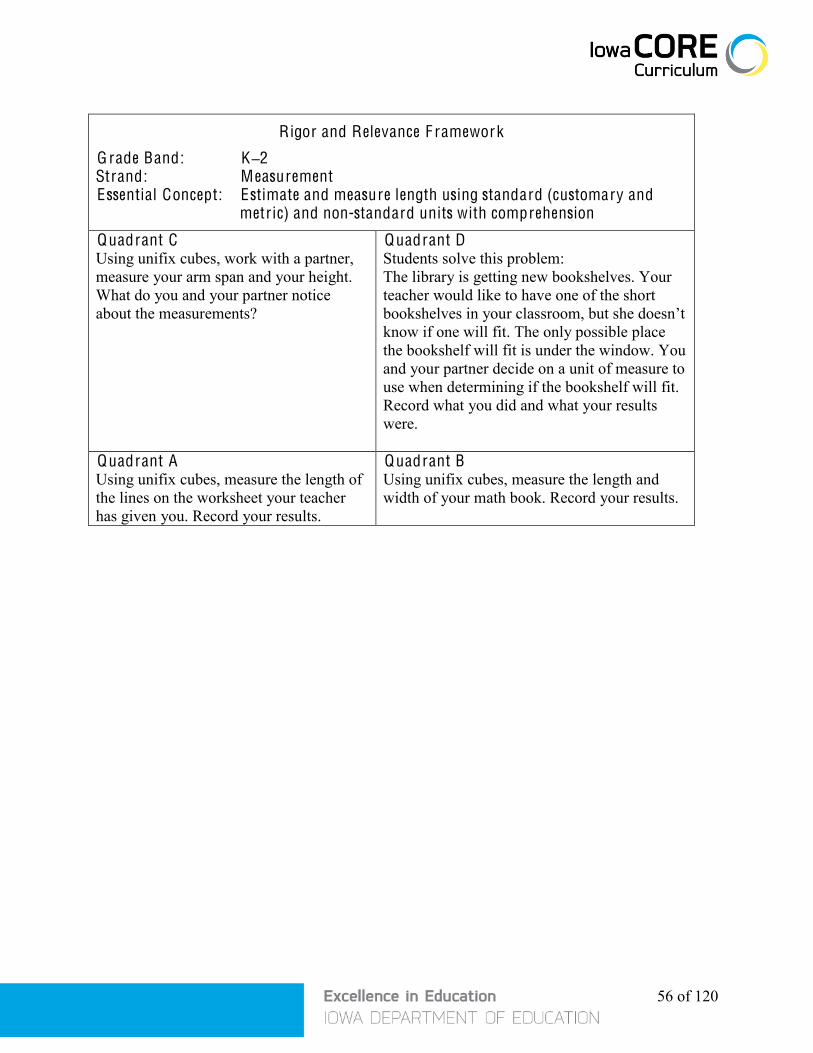
56 of 120
Rigor and Relevance F ramework
G rade Band: K–2 Strand: Measurement Essential Concept: Estimate and measure length using standard (customary and
metric) and non-standard units with comprehension
Quadrant C Using unifix cubes, work with a partner, measure your arm span and your height. What do you and your partner notice about the measurements?
Quadrant D Students solve this problem: The library is getting new bookshelves. Your teacher would like to have one of the short bookshelves in your classroom, but she doesn’t know if one will fit. The only possible place the bookshelf will fit is under the window. You and your partner decide on a unit of measure to use when determining if the bookshelf will fit. Record what you did and what your results were.
Quadrant A Using unifix cubes, measure the length of the lines on the worksheet your teacher has given you. Record your results.
Quadrant B Using unifix cubes, measure the length and width of your math book. Record your results.

57 of 120
Rigor and Relevance F ramework
G rade Band: K–2 Strand: Data Analysis and Probability Essential Concept: Collect, sort, organize, and represent data to answer questions
relevant to the K–2 environment
Quadrant C Given a set of buttons, students are asked to sort them by an attribute, determine how many are in each group, and order the groups from least to greatest.
Quadrant D Students generate a question they want answered by the class, collect the data, represent the information on a graph and report the findings to the class.
Quadrant A Given a set of buttons, students are asked to sort them by color and determine the quantity of each group.
Quadrant B Each student makes a unifix train with one cube for each button they have on their clothing. The class organizes their individual unifix trains from least to greatest to create a class graph.

58 of 120
Intermediate (G rades 3–5)
Rigor and Relevance F ramework
G rade Band: 3–5 Strand: Number and Operations Essential Concept: Develop an understanding of multiplication and division
concepts and strategies for basic multiplication facts and related division facts
Quadrant C Use base ten blocks to show 24 8 and explain your work.
Quadrant D Write a story problem to illustrate 24 8 and show at least two ways to get the answer.
Quadrant A Multiply: 24 8
Quadrant B Draw a diagram and explain how you would find the area of a room that measures 24 feet by 8 feet.
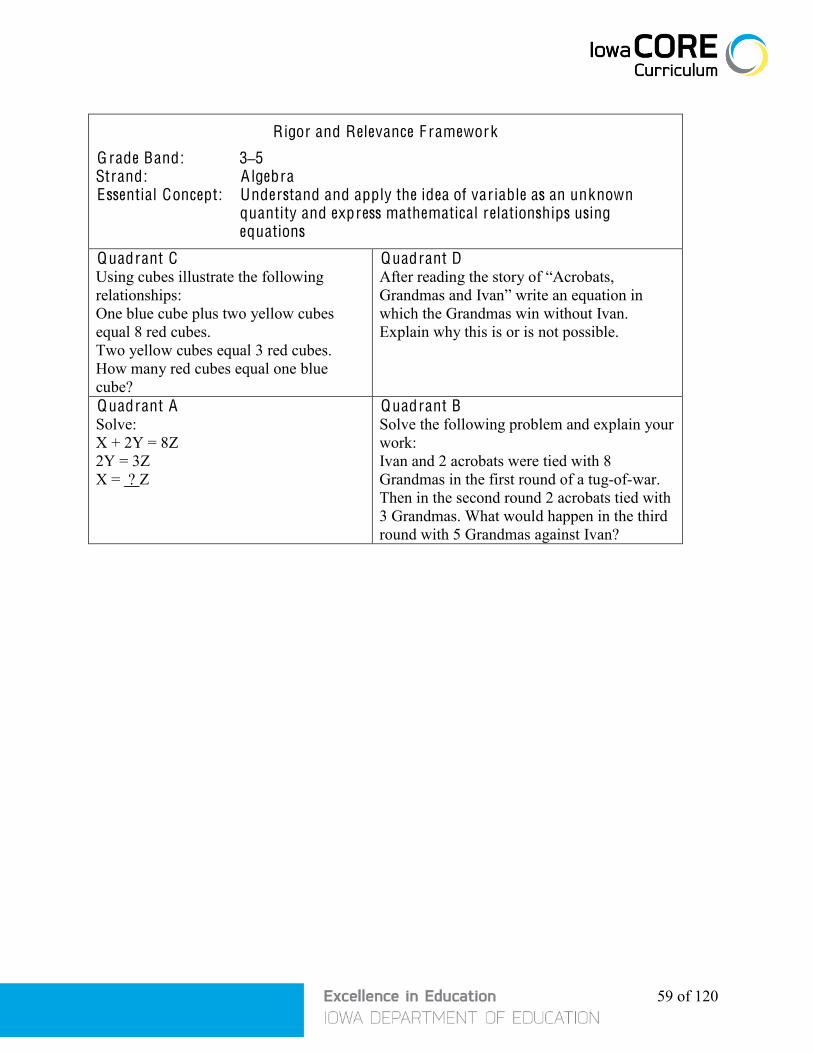
59 of 120
Rigor and Relevance F ramework
G rade Band: 3–5 Strand: A lgebra Essential Concept: Understand and apply the idea of variable as an unknown
quantity and express mathematical relationships using equations
Quadrant C Using cubes illustrate the following relationships: One blue cube plus two yellow cubes equal 8 red cubes. Two yellow cubes equal 3 red cubes. How many red cubes equal one blue cube?
Quadrant D After reading the story of “Acrobats, Grandmas and Ivan” write an equation in which the Grandmas win without Ivan. Explain why this is or is not possible.
Quadrant A Solve: X + 2Y = 8Z 2Y = 3Z X = ? Z
Quadrant B Solve the following problem and explain your work: Ivan and 2 acrobats were tied with 8 Grandmas in the first round of a tug-of-war. Then in the second round 2 acrobats tied with 3 Grandmas. What would happen in the third round with 5 Grandmas against Ivan?
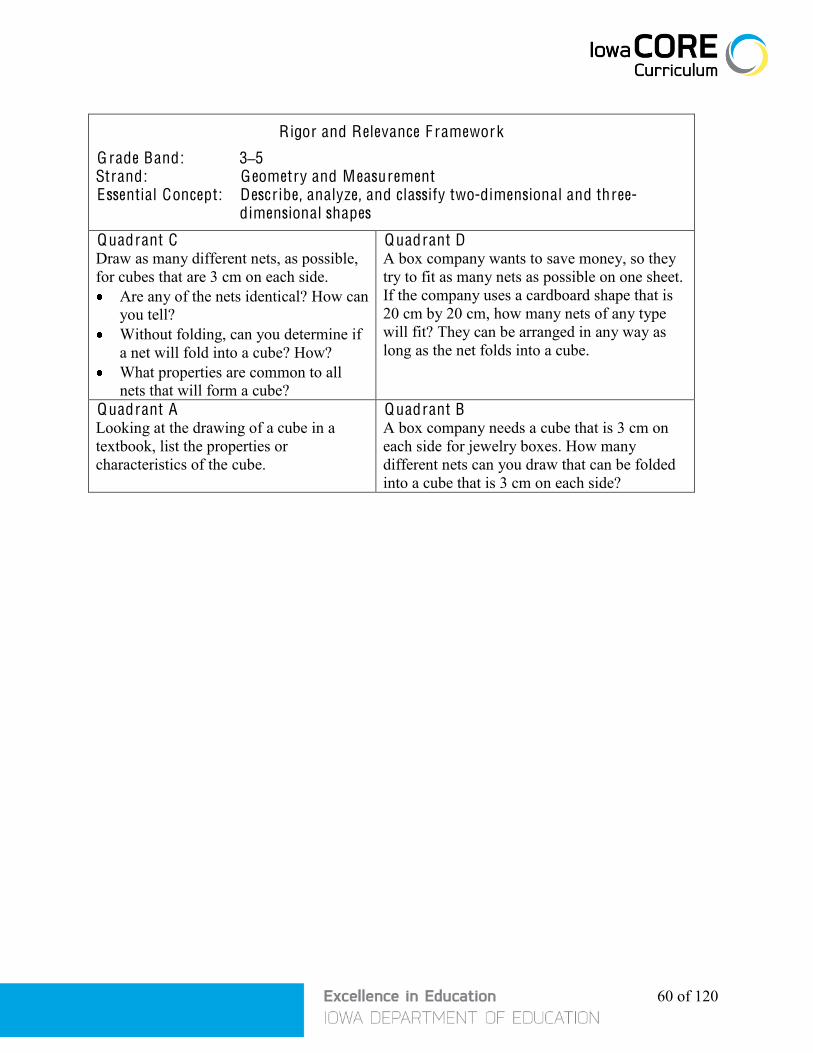
60 of 120
Rigor and Relevance F ramework
G rade Band: 3–5 Strand: Geometry and Measurement Essential Concept: Describe, analyze, and classify two-dimensional and three-
dimensional shapes
Quadrant C Draw as many different nets, as possible, for cubes that are 3 cm on each side. Are any of the nets identical? How can
you tell? Without folding, can you determine if
a net will fold into a cube? How? What properties are common to all
nets that will form a cube?
Quadrant D A box company wants to save money, so they try to fit as many nets as possible on one sheet. If the company uses a cardboard shape that is 20 cm by 20 cm, how many nets of any type will fit? They can be arranged in any way as long as the net folds into a cube.
Quadrant A Looking at the drawing of a cube in a textbook, list the properties or characteristics of the cube.
Quadrant B A box company needs a cube that is 3 cm on each side for jewelry boxes. How many different nets can you draw that can be folded into a cube that is 3 cm on each side?
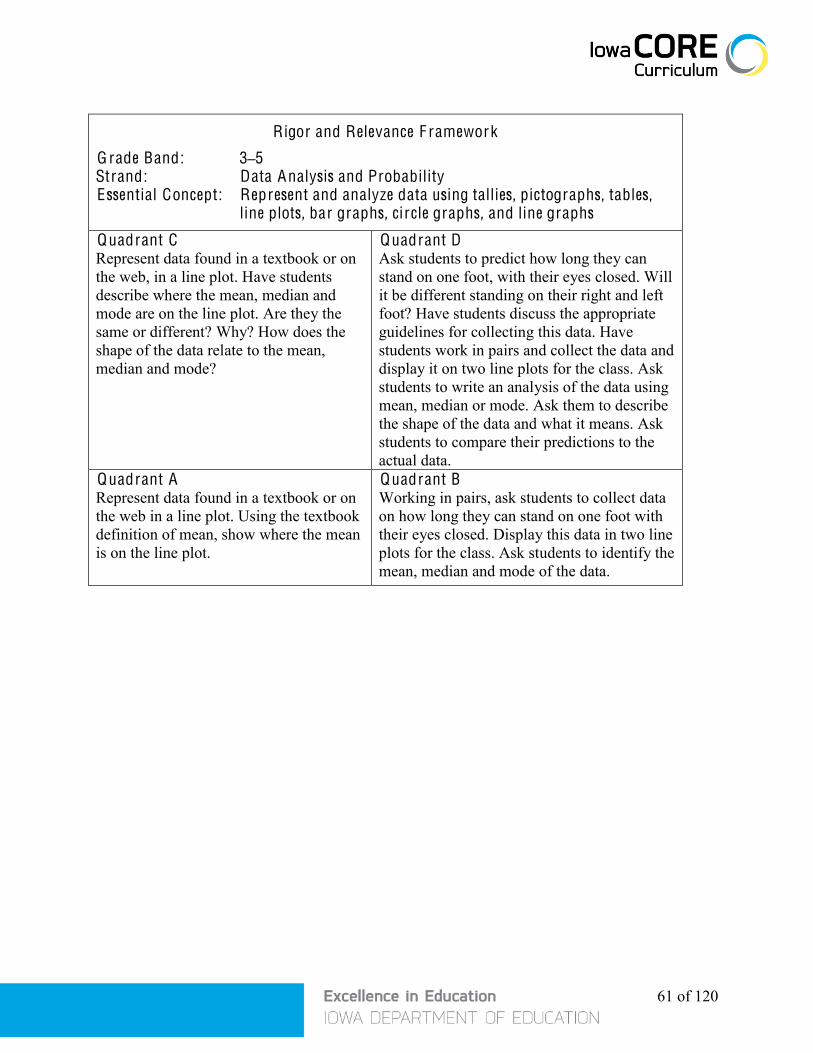
61 of 120
Rigor and Relevance F ramework
G rade Band: 3–5 Strand: Data Analysis and Probability Essential Concept: Represent and analyze data using tallies, pictographs, tables,
line plots, bar graphs, ci rcle graphs, and line graphs
Quadrant C Represent data found in a textbook or on the web, in a line plot. Have students describe where the mean, median and mode are on the line plot. Are they the same or different? Why? How does the shape of the data relate to the mean, median and mode?
Quadrant D Ask students to predict how long they can stand on one foot, with their eyes closed. Will it be different standing on their right and left foot? Have students discuss the appropriate guidelines for collecting this data. Have students work in pairs and collect the data and display it on two line plots for the class. Ask students to write an analysis of the data using mean, median or mode. Ask them to describe the shape of the data and what it means. Ask students to compare their predictions to the actual data.
Quadrant A Represent data found in a textbook or on the web in a line plot. Using the textbook definition of mean, show where the mean is on the line plot.
Quadrant B Working in pairs, ask students to collect data on how long they can stand on one foot with their eyes closed. Display this data in two line plots for the class. Ask students to identify the mean, median and mode of the data.

62 of 120
Middle (G rades 6–8)
Rigor and Relevance F ramework
G rade Band: 6–8 Strand: Number and Operations Essential Concept: Understand, apply, and be computationally fluent with multiplication and
division of fractions and decimals Essential Concept: Understand and apply ratio and rate, including percents, and connect ratio
and rate to fractions and decimals
Quadrant C Shade 6 of the small squares in the rectangle shown below.
Using the
rectangle, explain how to determine each of the following:
the percent of the area that is shaded the decimal part of the area that is shaded the fractional part of the area that is shaded
See L esson Plan in Appendix C .
(Adapted from Ron Castleman’s Task in the QUASAR Project (Implementing Standards-Based Mathematics Instruction, Stein, Smith, Henningsen, Silver, Teachers College Press, 2000; and Navigating Through Number and Operations in Grades 6–8, NCTM, pp. 26–28)
Quadrant D Divide students into teams with sets of magazines and newspapers. Each team should do the following. Find examples of fractions, decimals, and percents in ads and articles. Show where each of these are being used. Indicate when it would be appropriate to use the other forms, then state what those numbers would be. Create problems related to the ads that would be appropriate to solve using fractions, decimals, and percents. Solve the problems. Create a presentation to share with the class that displays, summarizes, and explains your work.
Quadrant A Shade 10 X 10 grids – then give the appropriate fraction, decimal, and percent representations. Shade 50 squares Fraction ___ Decimal ___ Percent ___ Shade 20 squares Fraction ___ Decimal ___ Percent ___ Shade 10 squares Fraction ___ Decimal ___ Percent ___ Shade 1 square Fraction ___ Decimal ___ Percent ___ Shade 150 squares Fraction ___ Decimal ___ Percent ___
Quadrant B Give the students a newspaper with a set of ads showing various percent-off sales. Given several 10 x 10 grids, students color in a grid for each ad showing the percent. Also label the colored part of the grid with the related fractions and decimals.

63 of 120
Rigor and Relevance F ramework
G rade Band: 6–8 Strand: A lgebra Essential Concept: W rite, interpret, and use mathematical expressions and equations,
find equivalent forms, and relate such symbolic representations to verbal, graphical, and tabular representations
Quadrant C Given a table of values for two variables: Look for all patterns that can be
found in the table. What patterns did you find?
What recursive formula(s) did you find?
What direct (explicit) formulas did you find?
What are some advantages and disadvantages of the two types of formulas?
Are the formulas equivalent? How do you know?
Why are equivalent formulas useful?
Quadrant D Examine metal beams in pictures of a construction site. If the length of the beam is determined by the number of rungs on the underside of the beam, determine how many rods are needed to make different lengths of beams.
Make a table of this information. Describe any patterns you see in the table. What recursive formula(s) can you find? What direct (explicit) formulas can you find? What are some advantages and disadvantages
of the two types of formulas? Are the formulas equivalent? How do you
know? Why are equivalent formulas useful?
Explain (justify) the formulas in the context of beams and rods. What generalizations can you make about how many rods will be needed for any beam length? (Adapted from Modeling Middle School Mathematics – MMM Project – lesson and classroom video: http://mmmproject.org/vp/mainframeS.htm)
Quadrant A Fill in the following table. What patterns do you see?
1 3 2 7 3 11 4 27 8 39
Quadrant B In order to build a trestle for your model, you will use toothpicks to build the beams.
Use 3 toothpicks to create a beam of length 1. Make beams of length 2, 3, 4, 5 and 6. How many toothpicks are used to make each
beam? Make a table with the length of the beam on one
side and the number of toothpicks on the other side.
Find any patterns you can in this table. Without building, determine how many toothpicks
would be needed to build a beam of length 7, 8, 9 and 10.
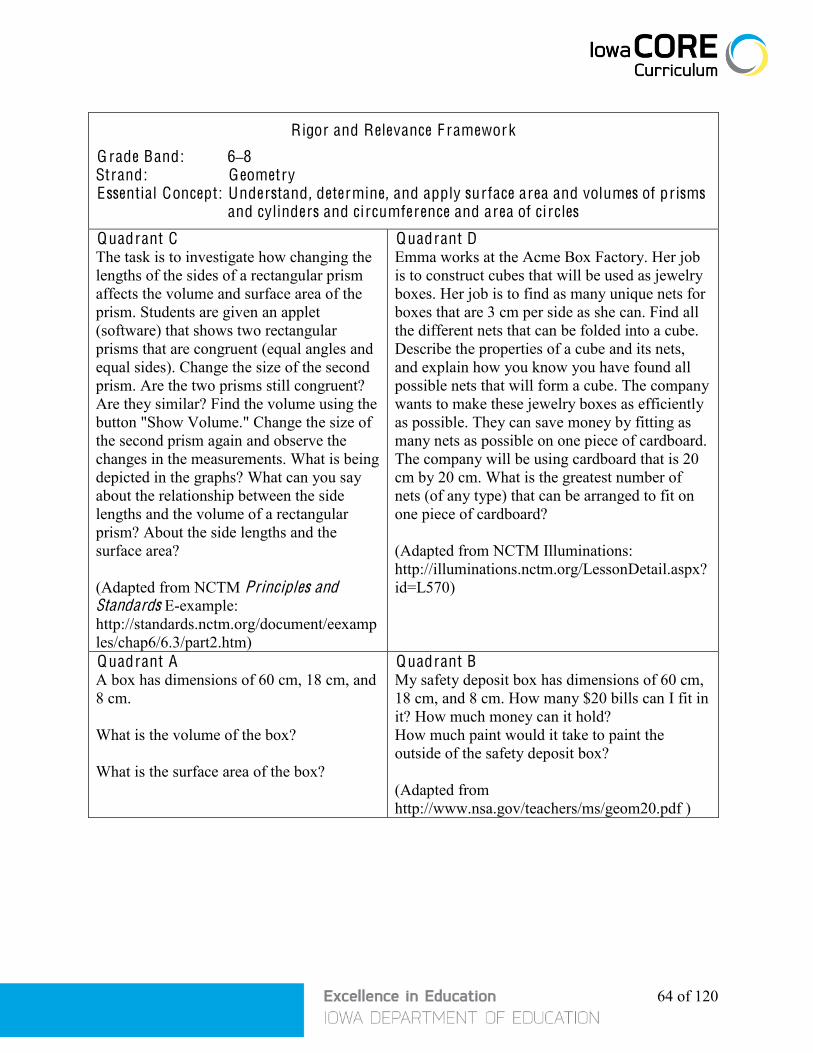
64 of 120
Rigor and Relevance F ramework
G rade Band: 6–8 Strand: Geometry Essential Concept: Understand, determine, and apply surface area and volumes of prisms
and cylinders and ci rcumference and area of ci rcles
Quadrant C The task is to investigate how changing the lengths of the sides of a rectangular prism affects the volume and surface area of the prism. Students are given an applet (software) that shows two rectangular prisms that are congruent (equal angles and equal sides). Change the size of the second prism. Are the two prisms still congruent? Are they similar? Find the volume using the button "Show Volume." Change the size of the second prism again and observe the changes in the measurements. What is being depicted in the graphs? What can you say about the relationship between the side lengths and the volume of a rectangular prism? About the side lengths and the surface area? (Adapted from NCTM Principles and Standards E-example: http://standards.nctm.org/document/eexamples/chap6/6.3/part2.htm)
Quadrant D Emma works at the Acme Box Factory. Her job is to construct cubes that will be used as jewelry boxes. Her job is to find as many unique nets for boxes that are 3 cm per side as she can. Find all the different nets that can be folded into a cube. Describe the properties of a cube and its nets, and explain how you know you have found all possible nets that will form a cube. The company wants to make these jewelry boxes as efficiently as possible. They can save money by fitting as many nets as possible on one piece of cardboard. The company will be using cardboard that is 20 cm by 20 cm. What is the greatest number of nets (of any type) that can be arranged to fit on one piece of cardboard? (Adapted from NCTM Illuminations: http://illuminations.nctm.org/LessonDetail.aspx?id=L570)
Quadrant A A box has dimensions of 60 cm, 18 cm, and 8 cm. What is the volume of the box? What is the surface area of the box?
Quadrant B My safety deposit box has dimensions of 60 cm, 18 cm, and 8 cm. How many $20 bills can I fit in it? How much money can it hold? How much paint would it take to paint the outside of the safety deposit box? (Adapted from http://www.nsa.gov/teachers/ms/geom20.pdf )

65 of 120
Rigor and Relevance F ramework
G rade Band: 6–8 Strand: Data Analysis and Probability Essential Concept: Understand, interpret, determine, and apply measures of center and
graphical representations of data Essential Concept: Analyze and summarize data sets, including initial analysis of variability
Quadrant C Are students carrying backpacks that are too heavy? Read an article about this issue. Examine TinkerPlots data already collected from a group of 1st, 5th, and 7th grade students regarding their weight and the weight of their backpacks. (See Appendix C). Create new sets of data showing what percent backpack weight is of student weight. Find the mean, median, and mode of these new sets of data and describe the variability. Graphically represent the data. Draw conclusions about whether students or groups of students are carrying backpacks that are too heavy. Provide evidence to support your conclusions. (Adapted from Tinkerplots activity, Key Curriculum Press, http://www.keypress.com/x5715.xml)
Quadrant D A group of students will design and conduct a statistical study to answer a question they have formulated (for example, a question about backpack weight). They can either collect data or use sources of information containing the data needed to answer the question. They will analyze and summarize the data, including measures of center and variability, and graphically represent the data. They will answer the question they formulated based on the data and their analysis. They will create a brief presentation with visuals and careful explanations.
Quadrant A Here is a collection of numbers. Find what percent B is of A. Find the mean, median, and mode of this new set of data and also describe the variability.
Weight A Weight B 87 21 94 5 78 14 82 12 72 9
114 22 98 19
107 39 120 20 104 27
79 19 95 19
Quadrant B Examine the data below from a group of seventh graders and their backpacks. Find what percent the backpack weight is of each student’s weight. Find the mean, median, and mode of this new set of data and also describe the variability.
Name Gender Weight Backpack
Weight Katie F 87 21 Deborah F 94 5 Jennifer F 78 14 Lori F 82 12 Sherry F 72 9 Kathy F 114 22 Pat F 98 19 Gayle F 107 39 Myrle F 120 20 Jeffrey M 104 27 Alan M 79 19 Paul M 95 19

66 of 120
APPE NDI X B
Rigor and Relevance Quadrant Examples for
Essential Content and Skills
High School (Grades 9 – 12)
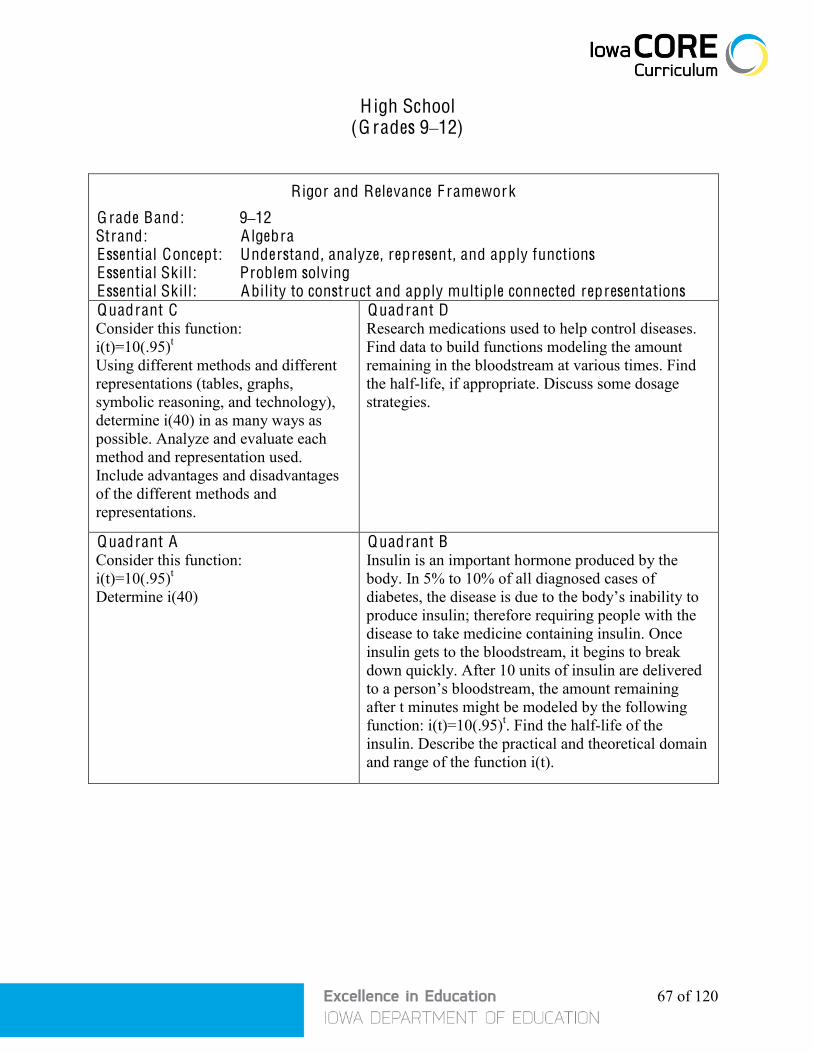
67 of 120
High School (G rades 9–12)
Rigor and Relevance F ramework
G rade Band: 9–12 Strand: A lgebra Essential Concept: Understand, analyze, represent, and apply functions Essential Skill: Problem solving Essential Skill: Ability to construct and apply multiple connected representations Quadrant C Consider this function: i(t)=10(.95)t
Using different methods and different representations (tables, graphs, symbolic reasoning, and technology), determine i(40) in as many ways as possible. Analyze and evaluate each method and representation used. Include advantages and disadvantages of the different methods and representations.
Quadrant D Research medications used to help control diseases. Find data to build functions modeling the amount remaining in the bloodstream at various times. Find the half-life, if appropriate. Discuss some dosage strategies.
Quadrant A Consider this function: i(t)=10(.95)t
Determine i(40)
Quadrant B Insulin is an important hormone produced by the body. In 5% to 10% of all diagnosed cases of diabetes, the disease is due to the body’s inability to produce insulin; therefore requiring people with the disease to take medicine containing insulin. Once insulin gets to the bloodstream, it begins to break down quickly. After 10 units of insulin are delivered to a person’s bloodstream, the amount remaining after t minutes might be modeled by the following function: i(t)=10(.95)t. Find the half-life of the insulin. Describe the practical and theoretical domain and range of the function i(t).

68 of 120
Rigor and Relevance F ramework
G rade Band: 9–12 Strand: A lgebra Essential Concept: Understand, analyze, solve, and apply equations and inequalities Related Skill: Communication Essential Skill: Ability to construct and apply multiple connected representations
Quadrant C Solve this equation: 13 = 0.10(x – 200) + 5 Use different methods and different representations (including tables, graphs, analytical methods, symbolic reasoning, using technology, etc.). Analyze and evaluate each method and representation, including advantages and disadvantages of different methods and representations.
Quadrant D Research some text-messaging plans available in your area. Find a mathematical model that represents each plan. Given your text-messaging habits and the mathematical models, evaluate these plans, and choose the one that is best for you. Explain your choice and why you think it’s the best plan for you. Include graphs, equations, and tables in your explanation, as appropriate.
Quadrant A Solve this equation: 13 = 0.10(x – 200) + 5
Quadrant B Consider this text messaging plan for your cell phone: You pay $5 per month for 200 text messages, then you are charged $0.10 for each additional message either sent or received. Find an equation that models this text messaging plan. Use your equation to determine how many text messages you can send or receive in a month if you are willing to spend $13 that month on text messages.

69 of 120
Rigor and Relevance F ramework
G rade Band: 9–12 Strand: A lgebra Essential Concept: Understand, analyze, transform, and apply algebraic expressions Essential Skill: Problem solving Essential Skill: Ability to recognize, make, and apply connections Quadrant C Consider this algebraic expression: 21.98x – 3.75x – 1.50x – 1.65x – 10x – 365,000. Write four other expressions that are equivalent to the given expression (use expansion and simplifying). Explain how you know the expressions are equivalent and state the properties used.
Quadrant D Find the current price of one of your favorite CDs. Profit for the record company that produces the CD is a function of CD sales. Assume that the record company had the following production and distribution costs related to this CD.
$365,000 for studio, video, touring, and promotion expenses; $3.75 per CD for pressing and packaging costs; $1.50 per CD for discounts to music stores; $1.65 per CD for other discounts. $10.00 per CD paid to the band
Given this information and the selling price of the CD, write a formula for a function that shows how the record company’s profit depends on the number of CDs sold. Using this formula, can the record company make a profit on this CD? Can they make a profit if the CD sells for $25? Can they make a profit if the CD sells for $12? For the selling price(s) for which the record company can make a profit, how many CDs must be sold before they begin making a profit? How many CDs must they sell to make a profit of $250,000? For the selling price(s) for which they cannot make a profit, how would you suggest they modify their costs so that they can make a profit?
Quadrant A Consider this algebraic expression: 21.98x – 3.75x – 1.50x – 1.65x – 10x – 365,000. Put the expression in simplest form.
Quadrant B Profit for a record company is a function of CD sales. For a given band, the record company had the following production and distribution conditions to consider.
$365,000 for studio, video, touring, and promotion expenses; $3.75 per CD for pressing and packaging costs; $1.50 per CD for discounts to music stores; $1.65 per CD for other discounts. $10.00 per CD paid to the band
The CD sells for $21.98. Using this information, write a formula for the function that shows how the record company’s profit depends on the number of CDs sold. Explain your formula. Make the formula as simple as possible.
Activities in quadrants B and D adapted from Contemporary Mathematics in Context, Course 3, Everyday Learning Corporation, 1999.

70 of 120
Rigor and Relevance F ramework
G rade Band: 9–12 Strand: A lgebra Essential Concept: Understand, analyze, approximate, and interpret rate of change Essential Skill: Communication Essential Skill: Problem solving
Quadrant C Consider this equation:
y = 27 23
x
Make a table and a graph, and write an equation using NOW and NEXT. Discuss how the rate of change is shown in each.
Quadrant D Suppose you must compare the elasticity of several different brands of golf balls. Get a variety of golf balls and a tape measure. Begin the comparison by choosing one of the balls. Decide on a method for measuring the height of successive rebounds after the ball is dropped from a height of at least 8 feet. (You may want to use technology to gather the data, such as a motion detector.) Collect data on the rebound height for successive bounces of the ball. Describe the change in consecutive rebound heights. Write an equation using NOW and NEXT that relates the rebound height of any bounce to the height of the preceding bounce. Write an equation y = …to predict the rebound height after any number of bounces. Use a different type of ball and repeat the process two more times. Compare the results of the three data sets. Write a brief report summarizing your findings.
Quadrant A Consider this equation:
y = 27 23
x
Describe the rate of change. How is the value of y changed from one integer value of x to the next?
Quadrant B Most popular American sports involve balls of some sort. One of the most important factors in playing with those balls is the bounciness or elasticity of the ball. If a new golf ball is dropped onto a hard surface, it should rebound to about 2
3 of its drop
height. Suppose a new golf ball drops downward from a height of 27 feet and keeps bouncing up and down. Make a table and plot of the data showing the expected heights of the first ten bounces. How does the rebound height change from one bounce to the next? How is that pattern shown by the shape of the data plot? What equation relating NOW and NEXT shows how to calculate the rebound height for any bounce from the height of the preceding bounce? Write an equation y = ….. to model the rebound height after any number of bounces. Discuss how the rate of change is shown in each equation.
Activities in quadrants B and D adapted from Contemporary Mathematics in Context, Course 1, Janson Publications, 1997
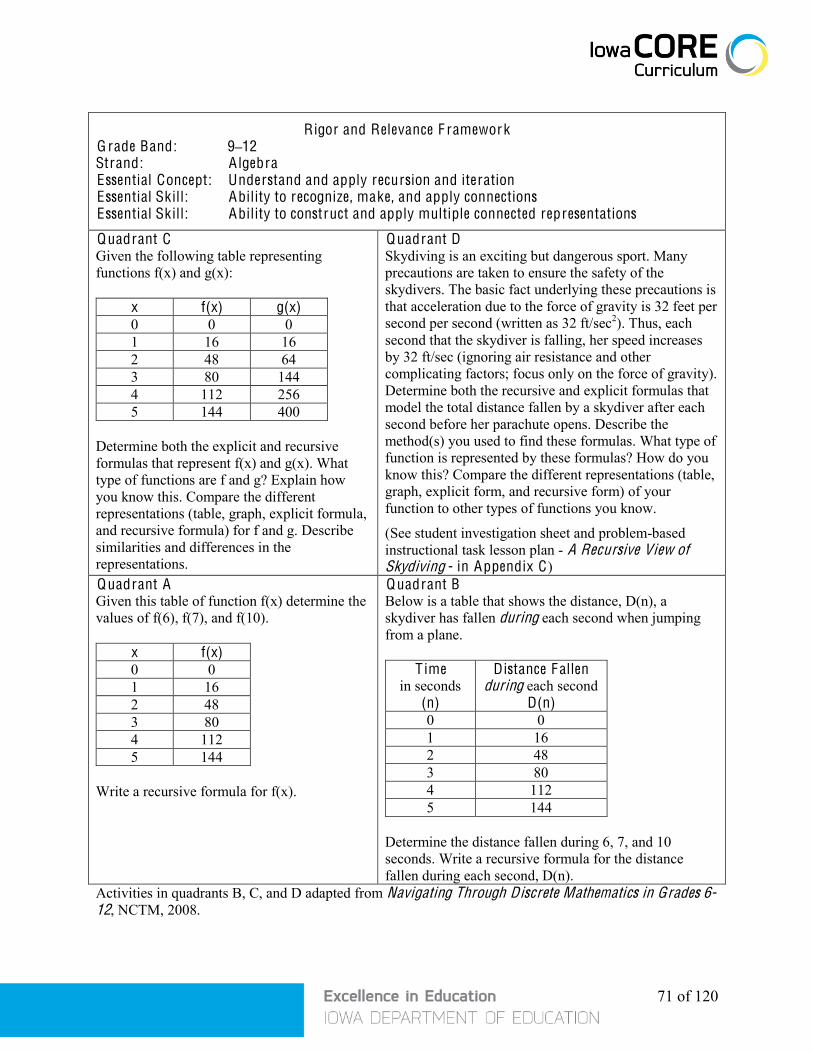
71 of 120
Rigor and Relevance F ramework G rade Band: 9–12 Strand: A lgebra Essential Concept: Understand and apply recursion and iteration Essential Skill: Ability to recognize, make, and apply connections Essential Skill: Ability to construct and apply multiple connected representations
Quadrant C Given the following table representing functions f(x) and g(x):
x f(x) g(x) 0 0 0 1 16 16 2 48 64 3 80 144 4 112 256 5 144 400
Determine both the explicit and recursive formulas that represent f(x) and g(x). What type of functions are f and g? Explain how you know this. Compare the different representations (table, graph, explicit formula, and recursive formula) for f and g. Describe similarities and differences in the representations.
Quadrant D Skydiving is an exciting but dangerous sport. Many precautions are taken to ensure the safety of the skydivers. The basic fact underlying these precautions is that acceleration due to the force of gravity is 32 feet per second per second (written as 32 ft/sec2). Thus, each second that the skydiver is falling, her speed increases by 32 ft/sec (ignoring air resistance and other complicating factors; focus only on the force of gravity). Determine both the recursive and explicit formulas that model the total distance fallen by a skydiver after each second before her parachute opens. Describe the method(s) you used to find these formulas. What type of function is represented by these formulas? How do you know this? Compare the different representations (table, graph, explicit form, and recursive form) of your function to other types of functions you know.
(See student investigation sheet and problem-based instructional task lesson plan - A Recursive View of Skydiving - in Appendix C)
Quadrant A Given this table of function f(x) determine the values of f(6), f(7), and f(10).
x f(x) 0 0 1 16 2 48 3 80 4 112 5 144
Write a recursive formula for f(x).
Quadrant B Below is a table that shows the distance, D(n), a skydiver has fallen during each second when jumping from a plane.
Time in seconds
(n)
Distance F allen during each second
D(n) 0 0 1 16 2 48 3 80 4 112 5 144
Determine the distance fallen during 6, 7, and 10 seconds. Write a recursive formula for the distance fallen during each second, D(n).
Activities in quadrants B, C, and D adapted from Navigating Through Discrete Mathematics in Grades 6-12, NCTM, 2008.

72 of 120
Rigor and Relevance F ramework
G rade Band: 9–12 Strand: Geometry Essential Concept: Represent and solve geometric problems by specifying location using
coordinates Essential Skill: Problem solving Essential Skill: Ability to recognize, make, and apply connections
Quadrant C Describe similarities and differences between using x–y coordinates to locate a point and using latitude and longitude to locate a point. Include at least one similarity and one difference, and give examples to illustrate.
Quadrant D Write a brief report on how latitude and longitude are measured on Mars. Describe similarities to and differences from latitude and longitude on Earth. Using images and information from the Internet or other sources, show a map and a give the latitude and longitude coordinates of a mountain on Mars.
Quadrant A Given a grid of latitude and longitude lines, plot the following locations on the grid. (a) N 30 , E 60 (b) S 15 , W30
Quadrant B A given map of the United States shows latitude and longitude in 5 intervals. A flight from Minneapolis to San Diego recorded the “way points” shown below. Mark the way points as accurately as possible on the map. (a) At 3:46 GMT, N 42 1.675’, W 101 2.590’ (b) At 4:20 GMT, N 40 40.125’, W 106 18.641’
Activity in quadrant B adapted from Navigating Through Geometry in Grades 9–12, N C T M , 2001.
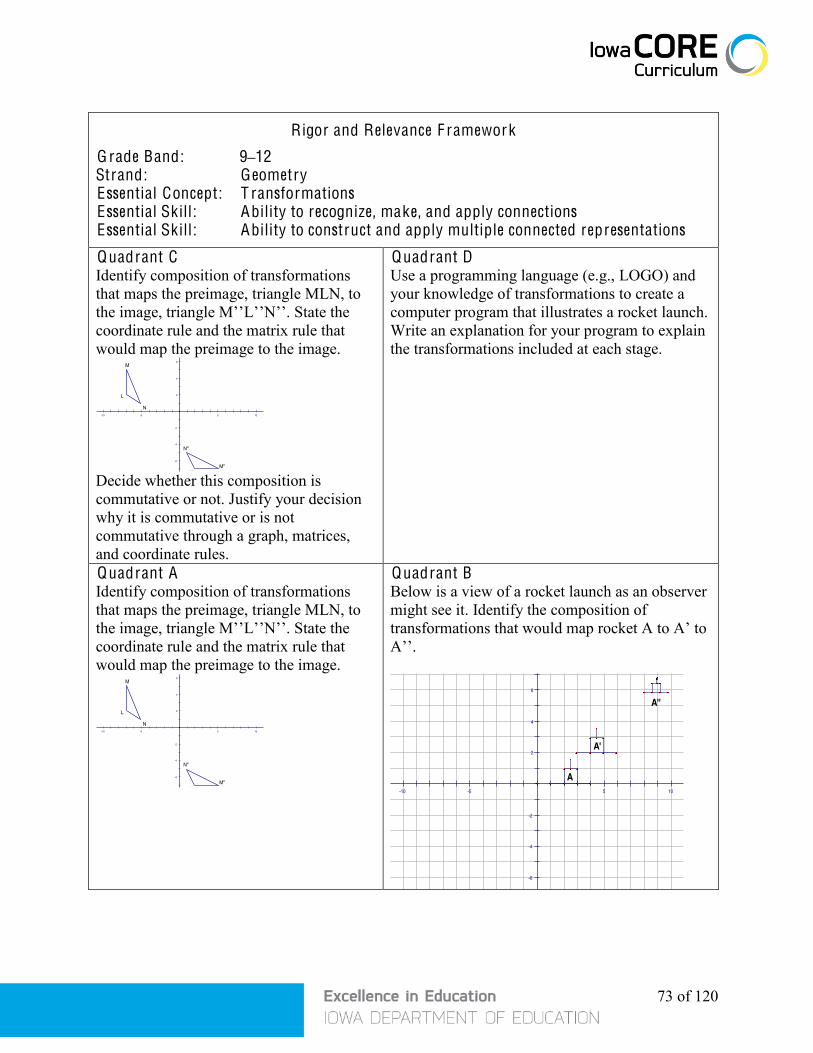
73 of 120
Rigor and Relevance F ramework
G rade Band: 9–12 Strand: Geometry Essential Concept: T ransformations Essential Skill: Ability to recognize, make, and apply connections Essential Skill: Ability to construct and apply multiple connected representations
Quadrant C Identify composition of transformations that maps the preimage, triangle MLN, to the image, triangle M’’L’’N’’. State the coordinate rule and the matrix rule that would map the preimage to the image.
6
4
2
-2
-4
-6
-10 -5 5 10
N''
L''M''
M
L
N
Decide whether this composition is commutative or not. Justify your decision why it is commutative or is not commutative through a graph, matrices, and coordinate rules.
Quadrant D Use a programming language (e.g., LOGO) and your knowledge of transformations to create a computer program that illustrates a rocket launch. Write an explanation for your program to explain the transformations included at each stage.
Quadrant A Identify composition of transformations that maps the preimage, triangle MLN, to the image, triangle M’’L’’N’’. State the coordinate rule and the matrix rule that would map the preimage to the image.
6
4
2
-2
-4
-6
-10 -5 5 10
N''
L''M''
M
L
N
Quadrant B Below is a view of a rocket launch as an observer might see it. Identify the composition of transformations that would map rocket A to A’ to A’’.
6
4
2
-2
-4
-6
-10 -5 5 10
A''
A'
A

74 of 120
Rigor and Relevance F ramework G rade Band: 9–12 Strand: Geometry Essential Concept: Understand and apply properties and relationships of geometric objects Essential Skill: Reasoning and proof Essential Skill: Problem solving
Quadrant C If you wanted to divide a right triangle into two equal parts (equal areas), how many ways are possible? Explain all solutions and any generalizations you can make.
Quadrant D Roger's Farm is a small corn and garden vegetable farm. Roger sells his produce at a local Farmer’s Market. His field is in the shape of right triangle with the two legs of length 1295 feet and 405 feet, pictured below. He wants to divide his field into two equal areas by creating a dividing line parallel to AC. Divide the field according to these requirements. Prove that your solution is correct. What is the area in each of the two field sections? One section of the field will be planted with sweet corn. Search the Internet to find estimates for the yield of sweet corn. How much sweet corn can Roger produce?
405 feet
1295feet
B
AC
Quadrant A Triangle BAC is a right triangle with BAC being the right angle. Where should a line segment that is parallel to the side AC be located so that the right triangle is divided into two equal areas?
405 feet
1295feet
B
AC
Quadrant B Roger's Market is a small fruit and vegetable stand off of Highway 218 just North of Cedar Falls, Iowa. This year the owner wanted to divide his field, so he could grow equal areas of corn and garden vegetables. He could not figure out how to divide his field accurately. He showed me a sketch of his field that was a right triangle with the two legs 1295 feet and 405 feet respectively. He wanted to separate his field so that the dividing line was parallel to one of the legs. How should he divide the field?

75 of 120
Rigor and Relevance F ramework G rade Band: 9–12 Strand: Geometry Essential Concept: Understand and apply properties and relationships of geometric objects Essential Skill: Reasoning and proof
Quadrant C Use dynamic geometry software to investigate the following problem: Find a point that is the same distance from all three vertices of a right triangle. Based on your investigation, make a conjecture about the point that is equidistant from all three vertices of a right triangle. Compare your conjecture to those of other students in your class. Discuss and resolve any differences, so that you have a final conjecture. Prove your conjecture.
Quadrant D Mr. Conway has a yard that is in the shape of a right triangle. He wants to put a stake somewhere so that he can attach a leash to the stake and his dog to the leash in such a way that the dog can reach all three corners of the yard and the shortest leash is used. Where should the stake be placed? Use dynamic geometry software to investigate this question. Make a conjecture for a solution. Compare your conjecture to those of other students in your class. Discuss and resolve any differences, so that you have a final conjecture. [Teacher: Make sure final conjecture agrees with the following: The midpoint of the hypotenuse of a right triangle is equidistant from the three vertices of the triangle.] Now you need to prove the conjecture. Consider the four diagrams below (see Diagram 7.37 in Appendix C), each of which illustrates a different proof of the conjecture. Work in your groups to write a complete proof related to each diagram. You will be asked to write one proof on chart paper to display and explain to the whole class. After completing and discussing each of the four proofs, discuss these questions: • Describe the general strategy used in each proof. • How are the strategies and proofs similar and different? • What are some advantages and disadvantages of each proof method? • Are some proofs easier or more convincing to you than others? Why? • What mathematical ideas are used in each of these proofs?
Quadrant A Prove that the midpoint of the hypotenuse of a right triangle is equidistant from the three vertices of the triangle.
Quadrant B Mr. Conway has a yard that is in the shape of a right triangle. He wants to put a stake somewhere so that he can attach a leash to the stake and his dog to the leash in such a way that the dog can reach all three corners of the yard and the shortest leash is used. Where should the stake be placed? Prove your answer.
Activities in quadrants B, C, and D adapted from Principles and Standards for School Mathematics, NCTM, 2000.
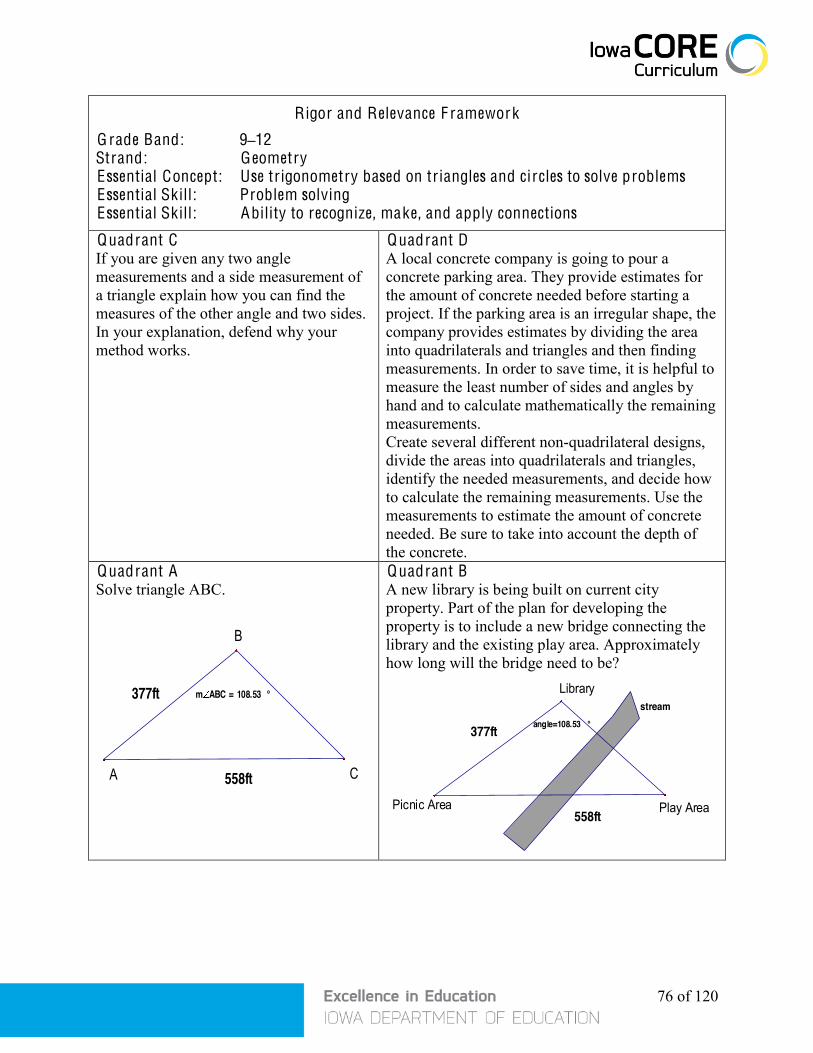
76 of 120
Rigor and Relevance F ramework
G rade Band: 9–12 Strand: Geometry Essential Concept: Use tr igonometry based on triangles and ci rcles to solve problems Essential Skill: Problem solving Essential Skill: Ability to recognize, make, and apply connections
Quadrant C If you are given any two angle measurements and a side measurement of a triangle explain how you can find the measures of the other angle and two sides. In your explanation, defend why your method works.
Quadrant D A local concrete company is going to pour a concrete parking area. They provide estimates for the amount of concrete needed before starting a project. If the parking area is an irregular shape, the company provides estimates by dividing the area into quadrilaterals and triangles and then finding measurements. In order to save time, it is helpful to measure the least number of sides and angles by hand and to calculate mathematically the remaining measurements. Create several different non-quadrilateral designs, divide the areas into quadrilaterals and triangles, identify the needed measurements, and decide how to calculate the remaining measurements. Use the measurements to estimate the amount of concrete needed. Be sure to take into account the depth of the concrete.
Quadrant A Solve triangle ABC.
377ft
558ft
m ABC = 108.53 °
A
B
C
Quadrant B A new library is being built on current city property. Part of the plan for developing the property is to include a new bridge connecting the library and the existing play area. Approximately how long will the bridge need to be?
streamangle=108.53 °377ft
558ftPicnic Area
Library
Play Area

77 of 120
Rigor and Relevance F ramework
G rade Band: 9–12 Strand: Geometry Essential Concept: Use diagrams consisting of vertices and edges (vertex-edge graphs) to model
and solve problems Essential Skill: Ability to recognize, make, and apply connections Essential Skill: Ability to construct and apply multiple connected representations
Quadrant C A complete graph is a graph in which there is exactly one edge between each pair of vertices. Does a complete graph with 2 vertices have an Euler circuit? A complete graph with 3 vertices? With 4 vertices? With 5 vertices? With n vertices? Investigate and summarize your findings. Explain your process and your reasoning.
Quadrant D You have been hired by the city as a deputy street supervisor. Part of your job is to inspect city streets for potholes. Your area of inspection is shown on the given street map. Devise a plan for street inspection that starts at your office, inspects each block at least once, ends at your office, and takes the least amount of time (time is money). Assume it takes five minutes to walk a block for inspections including corners and one minute to just walk a block without inspecting (called deadheading). (See attached lesson – Street Inspection – in Appendix C .)
Quadrant A Determine if the following vertex-edge graph has an Euler circuit or path. If there is an Euler circuit or path, find it. If there is not an Euler circuit or path, explain why not.
A
C
B
EF
D
Quadrant B The street network of a city can be modeled with a graph in which the vertices represent the street corners, and the edges represent the streets. Suppose you are the city street inspector and it is desirable to minimize time and cost by not inspecting the same street more than once.
I
A B
CH
J D
EF G
a. In this graph of the city, is it possible to begin at the garage (G) and inspect each street only once? Will you be back at the garage at the end of the inspection?
b. If not, find a route that inspects all streets, repeats the least number of edges possible, and returns to the garage.
B and C quadrant activities adapted from Crisler, Nancy, Patience Fisher, and Gary Froelich, Discrete Mathematics through Applications 2nd Edition. Quadrant D lesson cited in appendix.

78 of 120
Rigor and Relevance F ramework
G rade Band: 9–12 Strand: Statistics and Probability Essential Concept: Understand and interpret descriptive statistics Essential Skill: Ability to recognize, make, and apply connections
Quadrant C Draw a scatterplot of the given (X,Y) data. Describe patterns you see in the data. Discuss the strength of association between X and Y. Can you predict Y if you know X? Explain your reasoning using graphs, regression, and correlation. (See data below.)
Quadrant D Engage in the following example of statistical thinking: • Consider this question: Is size a useful predictor of price for houses in Des Moines – city-wide and in specific neighborhoods? • Gather data that will help you answer this question. • Analyze the data using summary statistics, graphs, regression, and correlation. • Draw conclusions. Write a report based on your data and analysis that helps answer the initial question. Provide all necessary details. Explain and justify your conclusions.
Quadrant A Draw a scatterplot of the given (X,Y) data. Describe the relationship between X and Y. (See data below.)
Quadrant B Consider the data below, where X = size (in hundreds of sq. ft.) of a home sold in a particular neighborhood in Des Moines last spring and Y = selling price of the home (in thousands of dollars) Is there a relationship between size of house and price of house in this neighborhood? Can you predict price if you know size? Explain your reasoning. (See data below.)
Data for quadrants A, B, and C: X 29 34 23 24 26 45 52 44 33 30 51 Y 315 360 240 256 245 390 435 350 340 320 260

79 of 120
Rigor and Relevance F ramework
G rade Band: 9–12 Strand: Statistics and Probability Essential Concept: Understand and apply the basic ideas of probability Essential Skill: Communication
Quadrant C Each student should roll a regular die 20 times and record the number that comes up after each roll. Consider the following events: • A: the number that comes up is even • B: the number that comes up is a factor of 6 • C: the number that comes up is at most 4 • A B • A B • A|C Each student should find the relative frequency for each event based on his or her outcomes. Then, all students should combine their results. Find the class relative frequencies. Then, determine the theoretical probability for each of these events. Discuss the connection between the experimental relative frequencies and the theoretical probabilities.
Quadrant D In a trial in Sweden, a parking officer testified to having noted the position of the valve stems on the tires on one side of a car. Returning later, the officer noted that the valve stems were still in the same position. The officer issues a ticket for overtime parking. However, the owner of the car claimed he had moved the car and returned to the same parking place. Who was right? Use probability to justify your answer. (See attached task – Compound Events in a Trial in Sweden – in Appendix C .)
Quadrant A Suppose you roll a regular die and see which number comes up. List all the elements in the sample space. List the elements in each of events A, B, and C, below: A: the number that comes up is even B: the number that comes up is a factor of 6 C: the number that comes up is at most 4 Find the probability of these events: P(A), P(B), P(C), P(A B), P(A B), P(A|C).
Quadrant B The diagram below shows the results of a two-question survey administered to 80 randomly selected students at Highcrest High School. (See attached diagram —Highcrest H igh School Survey—in Appendix C .) • Of the 2100 students in the school, how many would you expect to play a musical instrument? • Estimate the probability that an arbitrary student at the school plays on a sports team and plays a musical instrument. How is this related to estimates of the separate probabilities that a student plays a musical instrument and that he or she plays on a sports team? • Estimate the probability that a student who plays on a sports team also plays a musical instrument.
Activities in quadrants B and D adapted from Principles and Standards for School Mathematics, NCTM, 2000.

80 of 120
Rigor and Relevance F ramework
G rade Band: 9–12 Strand: Statistics and Probability Essential Concept: Understand and interpret inferential statistics Essential Skill: Reasoning and proof
Quadrant C Suppose a population is such that the population percent for “success” is 0.13. Consider drawing random samples of size 100 from this population, and counting the number of “successes” in the samples. Using technology, design and carry out a simulation that will produce a simulated sampling distribution in this situation. Based on your simulated sampling distribution, what sample outcomes would you consider to be rare events?
Quadrant D M&M’S® Milk Chocolate Candies have been a popular treat ever since they were first manufactured in 1940. The candies come in different colors. Red candies were discontinued in 1976 due to concerns about food coloring, but by popular demand the color red was brought back in 1987. Today, M&M’S® Milk Chocolate Candies are produced so that there are 13% reds. Suppose you are a quality control manager at the M&M® factory. Part of your job is to make sure the factory produces the correct percentage of reds, that is, 13% reds. If this correct percentage is not produced then the machines need to be shut down and reset, which is a very expensive process. Suppose you pull a random sample of 100 M&M’S® from the production line and you count 19 reds. Should you order the machines to be shut down and fixed? Explain and carry out the analysis and reasoning you would do to answer this question, including simulating or otherwise constructing a sampling distribution. (In fact, a quality control manager would probably pull several samples over time and use Statistical Process Control to help make a decision. In this problem, just assume that a single sample is drawn and use appropriate statistical reasoning to help make a decision.)
Quadrant A The given sampling distribution (provided) is based on counting the number of “successes” in random samples of size 100 drawn from a population in which the population percent for “success” is 0.13. Suppose you draw a random sample of 100 and count 19 “successes.” Show where this sample outcome would appear in the sampling distribution. Would you consider this sample outcome to be a “rare event?” Explain.
Quadrant B M&M’S® Milk Chocolate Candies are produced so that there are 13% reds. Suppose you are a quality control manager at the M&M® factory. Part of your job is to make sure the factory produces the correct percentage of reds, that is, 13% reds. If this correct percentage is not produced then the machines need to be shut down and reset, which is a very expensive process. Suppose you draw a random sample of 100 M&M’S® and count 19 reds. Compare this sample outcome to a given sampling distribution for this situation. Should you order the machines to be shut down and fixed? Explain.
Information from the M&M’S® company website: http://us.mms.com/us/index.jsp Red percentage from: http://us.mms.com/us/about/products/milkchocolate/

81 of 120
Rigor and Relevance F ramework
G rade Band: 9–12 Strand: Quantitative L iteracy Essential Concept: Understand and apply number operations and properties Essential Skill: Ability to recognize, make, and apply connections Essential Skill: Problem solving
Quadrant C A four digit number (in base 10) aabb is a perfect square. Discuss ways of systematically finding this number. (“Novemberish” from http://nrich.maths.org)
Quadrant D Research the change of the ISBN system from the former 10-digit format to the new 13-digit format. Explain the reasons for the new system and determine the benefits and any problems that may occur. Also determine what types of entities are affected by this major change and how they are affected. (“Check that Digit” prepared by Doug Schmid on http://illuminations.nctm.org/LessonDetail.aspx?id=L693)
Quadrant A Find the congruent value of 100 in mod 2, mod 7, and mod 12.
Quadrant B Many codes including UPC product codes, ISBN book numbers, and credit card numbers have a “check digit” as the last digit of the code. This allows the companies and computers to determine if account numbers and identification numbers are valid by combining digits using an algorithm and checking to see if the result is divisible by a certain number or meets some criterion based on modular arithmetic. Determine if the following UPC numbers are valid using the given algorithm. (See “Check that Digit” prepared by Doug Schmid on http://illuminations.nctm.org/LessonDetail.aspx?id=L693)
Activity in quadrant C adapted from the nrich.maths.org website. Activities in quadrants B and D adapted from the NCTM Illuminations website.

82 of 120
Rigor and Relevance F ramework G rade Band: 9–12 Strand: Quantitative L iteracy Essential Concept: Understand and apply some basic mathematics of decision making in a
democratic society Essential Skill: Communication Essential Skill: Problem Solving
Quadrant C Determine the plurality, Borda, runoff, and sequential runoff winners for the following set of preferences. Create a situation for the set of preferences and decide which method of voting would be the most fair. Justify your choice.
1st A B C C 2nd D D B D 3rd C A D A 4th B C A B Total Number of Voters
16 20 12 7
Quadrant D Research a variety of voting methods including (but not limited to) plurality, Borda, runoff, and sequential runoff. Create a proposal for how to fairly conduct an election for Homecoming King and Queen. In your proposal identify the current method and compare it to what you believe would be the most fair. Create mock ballots depending on the voting method and conduct a mock election with these different ballots. Write a short paper reporting the results and why you propose the voting method you have chosen.
Quadrant A Determine the plurality, Borda, runoff, and sequential runoff winners for the following set of preferences.
1st A B C C 2nd D D B D 3rd C A D A 4th B C A B Total Number of Voters
16 20 12 7
Quadrant B You have been chosen to serve on the committee that decides who this year's Homecoming King and Queen will be. As a committee, you have already determined the three sets of finalists to be, in no particular order, Alan and Alice, Bob and Betty, and Carl and Cathy. All finalists are seniors. You have already held elections in each class through class meetings and have collected the following results:
Freshmen Sophomores Juniors Seniors 1st Alan/Alice Bob/Betty Carl/Cathy Carl/Cathy 2nd Bob/Betty Alan/Alice Bob/Betty Bob/Betty 3rd Carl/Cathy Carl/Cathy Alan/Alice Alan/Alice Class size
60 students
50 students
40 students
30 students
Look at the election information above. In your opinion, which couple should reign as Homecoming King and Queen? Who would finish 2nd and 3rd? Write an explanation explaining your methodology for determining first, second and third.
Quadrant A adapted from Discrete Mathematics Through Applications, 2nd Edition, W.H. Freeman and Company, New York: 2000, p. 13. Quadrant B activity retrieved and adapted on 4/20/06 from a lesson from the The Discrete Math Project: http://www.colorado.edu/education/DMP/activities/election/dlshnd01.html
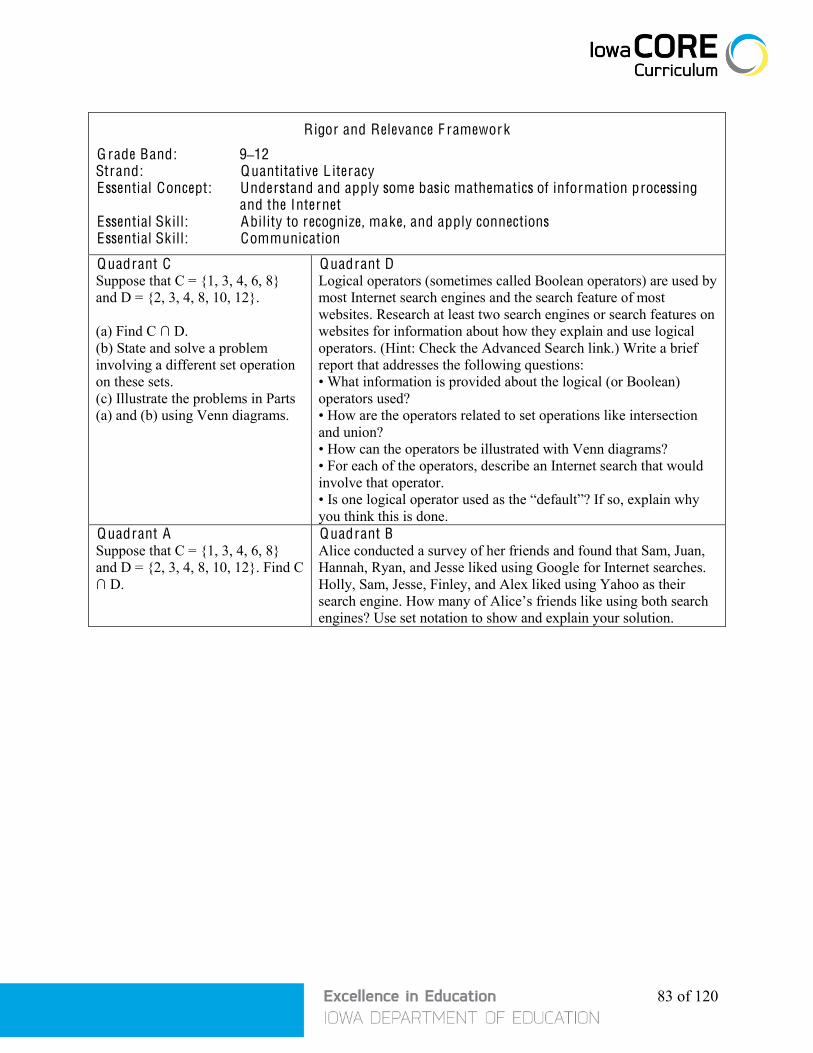
83 of 120
Rigor and Relevance F ramework
G rade Band: 9–12 Strand: Quantitative L iteracy Essential Concept: Understand and apply some basic mathematics of information processing
and the Internet Essential Skill: Ability to recognize, make, and apply connections Essential Skill: Communication
Quadrant C Suppose that C = 1, 3, 4, 6, 8 and D = 2, 3, 4, 8, 10, 12. (a) Find C ∩ D. (b) State and solve a problem involving a different set operation on these sets. (c) Illustrate the problems in Parts (a) and (b) using Venn diagrams.
Quadrant D Logical operators (sometimes called Boolean operators) are used by most Internet search engines and the search feature of most websites. Research at least two search engines or search features on websites for information about how they explain and use logical operators. (Hint: Check the Advanced Search link.) Write a brief report that addresses the following questions: • What information is provided about the logical (or Boolean) operators used? • How are the operators related to set operations like intersection and union? • How can the operators be illustrated with Venn diagrams? • For each of the operators, describe an Internet search that would involve that operator. • Is one logical operator used as the “default”? If so, explain why you think this is done.
Quadrant A Suppose that C = 1, 3, 4, 6, 8 and D = 2, 3, 4, 8, 10, 12. Find C ∩ D.
Quadrant B Alice conducted a survey of her friends and found that Sam, Juan, Hannah, Ryan, and Jesse liked using Google for Internet searches. Holly, Sam, Jesse, Finley, and Alex liked using Yahoo as their search engine. How many of Alice’s friends like using both search engines? Use set notation to show and explain your solution.

84 of 120
Rigor and Relevance F ramework
G rade Band: 9–12 Strand: Quantitative L iteracy Essential Concept: Understand and apply the mathematics of systematic counting Essential Skill: Ability to recognize, make, and apply connections Essential Skill: Problem solving
Quadrant C Find the value of P(7, 3) and C(7, 3). Describe the difference between permutations and combinations. Write a formula, using P(n, k) and C(n, k) that shows the relationship between these two numbers.
Quadrant D A ribonucleic acid (RNA) is a messenger molecule associated with deoxyribonucleic acid (DNA). RNA is made up of a “chain” (sequence) of smaller molecules called nucleotides. The nucleotides contain the bases: U(uracil), C(cytosine), G(guanine), and A(adenine). It is difficult to observe exactly what an entire RNA chain looks like, however it is possible to observe fragments of a chain by breaking it up with certain enzymes. Knowledge about these fragments can sometimes determine the makeup of an entire chain of RNA. The “G-enzyme” will break an RNA chain after each G(guanine) link. The “U-C-enzyme” will break an RNA chain after every U(uracil) and every C(cytosine). Consider the RNA chain AGUGGAUUGUCAUGA. A G-enzyme will break this chain into the fragments AG, UG, G, AUUG, UCAUG, and A. While the U-C-enzyme will break the same chain into the fragments AGU, GGAU, U, GU, C, AU, and GA. Unfortunately, the fragments of a broken-up chain may be mixed up and in the wrong order. Suppose an RNA chain is broken by a G-enzyme into the fragments AUG, AAC, CG, and AG. While the U-C-enzyme breaks the same RNA chain into the fragments GC, GAAC, and AGAU. What is the complete RNA chain of 10 bases?
Quadrant A Given the 4 letters A, B, C, and D. How many different 5-letter sequences are possible if letters can be repeated?
Quadrant B A deoxyribonucleic acid (DNA) molecule is made up of a “chain” (sequence) of smaller molecules called nucleotides. The nucleotides contain the bases A(adenine), C(cytosine), G(guanine), and T(thymine). In 1952, building on their predecessors’ research in genetics, James Watson and Francis Crick realized that the DNA molecule was too thick to be a single strand. After trying several models, they made one in which two strands were wrapped around each other (a twisted ladder). Today this twisted-two-strand model (called a double helix) is accepted as the correct structure for DNA. In addition, in the early 1950s American scientist Edwin Chargoff made an important discovery about the four nitrogenous bases. Chargoff’s work led to the discovery that across the rungs of the DNA twisted ladder Adenine always pairs with Thymine and Cytosine always pairs with Guanine. Given this information, how many different 5 molecule sequences are possible?
85 of 120
APPE NDI X C
Student Tasks, L esson Plans, Resources, Data, and Diagrams
for
Selected Quadrant Examples in Appendices A and B
(Middle School and H igh School)

86 of 120
Lesson Plan – M iddle School – Number and Operations See Rigor and Relevance Quadrant C Example f rom Appendix A
“Representing Shaded Areas of Rectangular Grids”
Adapted from Navigating through Number and Operations in Grades 6-8, NCTM, page 26-28 Reprinted with the permission of Grant Wood AEA Math Consultants
Objective(s): Identify shaded regions of rectangular grids by using fractions, decimals,
and percents Shade regions of rectangular grids to represent given fractions, decimals,
and percents Recognize that fractions, decimals, and percents are different ways of
representing the same quantity Develop general strategies--such as “chunking” and unit rate--for
representing rational numbers on a rectangular grid Use rectangular grids as tools for making sense of abstract mathematical
ideas Communicate mathematical thinking
G rade L evel 6-8 Est. T ime 45 minutes Pre-requisite K nowledge:
Understanding of area models of fractions Percents on 100 grids Decimal place value to thousandths
Vocabulary: Percent, decimal, fraction
Mater ials Needed:
Overhead projector, transparencies of BLM grids or BLM, calculator (optional-struggling learners), “Representing Shaded Areas of Rectangular Grids”, blank grids, and (optional) document from Navigations called “Shading Areas of Rectangular Grids”
NCTM Content Standard (Number and Operations)
Understand numbers, ways of representing numbers, relationships among numbers, and number systems.
Understand meanings of operations and how they relate to one another.
Compute fluently and make reasonable estimates.
NCTM Process Standard
Problem Solving
Reasoning & Proof
Communication Connections Representations
Launch (Taken from Ron Castleman’s Task, QUASAR Project) Have students work in pairs to work on the following problem: Shade 6 of the small squares in the rectangle shown below.
Using the rectangle, explain how to determine each of the following:
the percent of the area that is shaded the decimal part of the area that is shaded the fractional part of the area that is shaded

87 of 120
Explore Pairs of students will complete the BLM “Representing Shaded Areas of Rectangular Grids”. They should solve each problem in more than one way and be prepared to explain their method(s) for solving each problem. K ey Ideas Observe students and select some to report alternate solutions to the different problems.
K ey ideas/important points Teacher strategies/actions Students solving by utilizing the grid If a student uses only division, ask him/her to
solve it another way by using the diagram given Student can “unitize”, determine the amount that each square represents
If a student can determine the amount that is represented in a row or a column, ask how he/she could determine what one particular square could be.
Students can alter the grid to 100s or can use equivalent fractions with 100 as the denominator.
Ask students what a percent’s denominators is (100) and then if the grid can be altered in some way to represent the shaded fraction as an equivalent one with 100 as a denominator. How will the shading of your new grid change?
Students can use their knowledge of familiar fractions, decimal, and percent relationships.
What is 50% as a fraction? As a decimal? Do you know any other common relationships?
. Guiding Questions
Good questions to ask Possible student responses or actions
Possible teacher responses
How can you make this grid into a 100 grid?
Re-divide it into 100 pieces Where would you do that?
Add more squares until it is a hundred
Would you put those additional squares in any particular place? Why?
What do you notice about the grid dimensions?
It is ___ wide and ___ long. Can either of those amounts help relate to percents or decimals?
Did you look at this grid as a fractional amount, a decimal amount, or a percent?
A decimal since there are 10 columns and each would be .1.
If the column is .1, then what amount is each square or the shaded region?
A percent since there are 10 rows and each row would represent 10%.
If the row is 10%, how does that help you find the answer?
A fraction because I can redraw so it looks like ¾ and I know that fraction is 75% and .75
Are there other fraction-decimal-percent relationships that you know?
Have you used a calculator or division?
Yes, since every fraction can be changed to a decimal by division.
Could you do the problems without using the calculator?
Misconceptions, E rrors, T rouble Spots
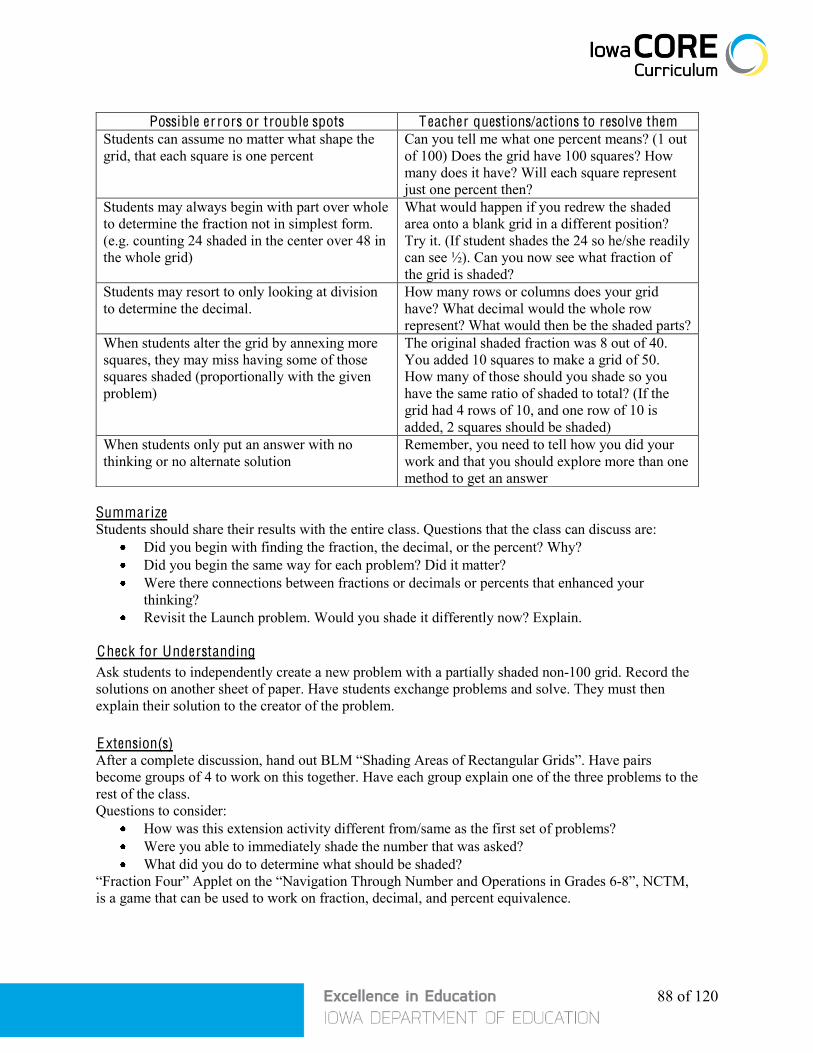
88 of 120
Possible er rors or trouble spots Teacher questions/actions to resolve them
Students can assume no matter what shape the grid, that each square is one percent
Can you tell me what one percent means? (1 out of 100) Does the grid have 100 squares? How many does it have? Will each square represent just one percent then?
Students may always begin with part over whole to determine the fraction not in simplest form. (e.g. counting 24 shaded in the center over 48 in the whole grid)
What would happen if you redrew the shaded area onto a blank grid in a different position? Try it. (If student shades the 24 so he/she readily can see ½). Can you now see what fraction of the grid is shaded?
Students may resort to only looking at division to determine the decimal.
How many rows or columns does your grid have? What decimal would the whole row represent? What would then be the shaded parts?
When students alter the grid by annexing more squares, they may miss having some of those squares shaded (proportionally with the given problem)
The original shaded fraction was 8 out of 40. You added 10 squares to make a grid of 50. How many of those should you shade so you have the same ratio of shaded to total? (If the grid had 4 rows of 10, and one row of 10 is added, 2 squares should be shaded)
When students only put an answer with no thinking or no alternate solution
Remember, you need to tell how you did your work and that you should explore more than one method to get an answer
Summarize Students should share their results with the entire class. Questions that the class can discuss are:
Did you begin with finding the fraction, the decimal, or the percent? Why? Did you begin the same way for each problem? Did it matter? Were there connections between fractions or decimals or percents that enhanced your
thinking? Revisit the Launch problem. Would you shade it differently now? Explain.
Check for Understanding Ask students to independently create a new problem with a partially shaded non-100 grid. Record the solutions on another sheet of paper. Have students exchange problems and solve. They must then explain their solution to the creator of the problem. Extension(s) After a complete discussion, hand out BLM “Shading Areas of Rectangular Grids”. Have pairs become groups of 4 to work on this together. Have each group explain one of the three problems to the rest of the class. Questions to consider:
How was this extension activity different from/same as the first set of problems? Were you able to immediately shade the number that was asked? What did you do to determine what should be shaded?
“Fraction Four” Applet on the “Navigation Through Number and Operations in Grades 6-8”, NCTM, is a game that can be used to work on fraction, decimal, and percent equivalence.
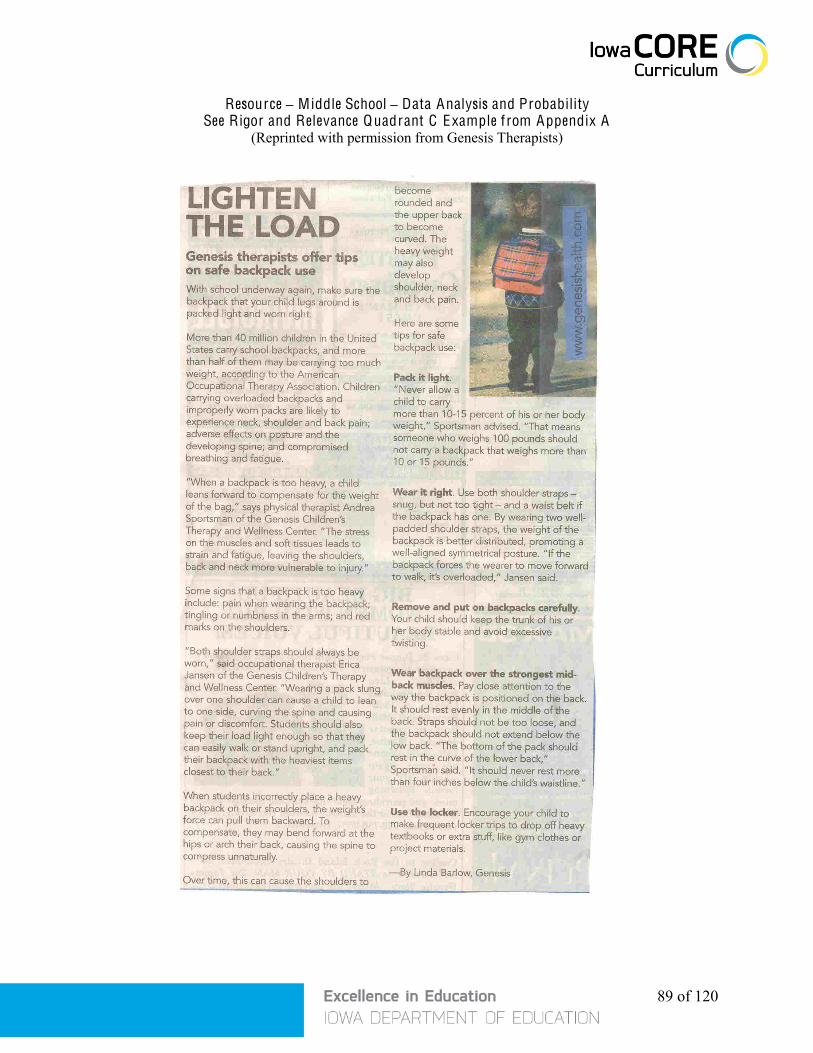
89 of 120
Resource – Middle School – Data Analysis and Probability See Rigor and Relevance Quadrant C Example f rom Appendix A
(Reprinted with permission from Genesis Therapists)

90 of 120
Resource – Middle School – Data Analysis and Probability See Rigor and Relevance Quadrant C Example f rom Appendix A
Backpack Data
Nam
e
Gen
der
Gra
de
Body
W
eigh
t
Pack
W
eigh
t
Angie F One 45 4 Emma F One 46 4 Sadie F One 32 3
Maddyn F One 47 3 Lorien F One 60 7 Bailey F One 52 6 Micah F One 57 6 Kilie F One 48 10
Abigail F One 46 3 Eugene M One 34 3 Leroy M One 61 5 Jim M One 44 4
Ross M One 49 3 Brennan M One 53 10 Finley M One 48 5
Jackson M One 46 5 Wesley M One 35 3
Elly F Three 56 7 Isable F Three 59 4 Haley F Three 51 7
Kayleen F Three 51 6 Alysaa F Three 62 7 Riley F Three 46 4
Rachel F Three 72 5 Alison F Three 62 11 Erin F Three 84 5
Kristen F Three 59 8 Wendy F Three 54 8 Bryant M Three 60 5 Trevor M Three 58 6 Karsten M Three 63 7 Anthony M Three 59 6
Greg M Three 56 7 Josh M Three 53 7 Todd M Three 73 7
Michael M Three 51 9 Byron M Three 44 7

91 of 120
Nam
e
Gen
der
Gra
de
Body
W
eigh
t
Pack
W
eigh
t
Dan M Three 84 4 Brandy F Five 53 10 Wendie F Five 66 5 Chessa F Five 73 7
Merinda F Five 76 19 Mimi F Five 76 14 Kelly F Five 78 13
Cameron F Five 81 3 Darice F Five 93 17
Heather F Five 108 12 Larry M Five 60 8
Tanner M Five 64 15 Quinn M Five 68 11 Tyson M Five 68 22 Darryl M Five 72 6 Ryan M Five 73 14 Brad M Five 75 12 Matt M Five 75 9 Chris M Five 80 11 Keith M Five 82 21 Lenn M Five 96 9
Nathan M Five 113 7 Megan F Five 96 8 Katie F Seven 87 21
Deborah F Seven 94 5 Jennifer F Seven 78 14
Lori F Seven 82 12 Sherry F Seven 72 9 Kathy F Seven 114 22
Pat F Seven 98 19 Gayle F Seven 107 39 Myrle F Seven 120 20 Jeffrey M Seven 104 27 Alan M Seven 79 19 Paul M Seven 95 19 Chad M Seven 84 3 Ken M Seven 98 16 Phil M Seven 111 19
Warren M Seven 76 16 Tim M Seven 90 9
Steve M Seven 119 21 William M Seven 70 21

92 of 120
Student Investigation – H igh School – A lgebra – Recursion and Iteration See Rigor and Relevance Quadrant D Example f rom Appendix B
(Adapted from Navigating Through Discrete Mathematics in Grades 6-12, NCTM, 2008.)
A Recursive V iew of Skydiving
Skydiving is an exciting but dangerous sport. Many precautions are taken to ensure the safety of the skydivers. The basic fact underlying these precautions is that acceleration due to the force of gravity is 32 feet per second per second (written as 32 ft/sec2). Thus, each second that the skydiver is falling, her speed increases by 32 ft/sec. (Throughout this investigation we ignore air resistance and other complicating factors; we focus only on the force of gravity.)
In this investigation, look for answers to these four questions:
What are recursive and explicit formulas for the total distance fallen by a skydiver after each second before her parachute opens?
What methods can you use to find these formulas? How are quadratic functions involved and why? How do the formulas, tables, and graphs for quadratic functions compare to those for other
functions you have studied?
To help answer these questions, consider the following table, which you will complete in the problems below. [You may need to write your solutions to problems on a separate sheet of paper.]
A Skydiver’s Speed and Distance Fallen Before the Parachute Opens
Time in seconds
n
Instantaneous Speed
at time n
Average Speed during each second
Distance F allen during each second
D(n)
Total Distance F allen after n seconds
T(n)
0 0 0 0 0 1 sec 32 ft/sec 16 ft/sec 16 ft 16 ft 2 sec 64 ft/sec 48 ft/sec 48 ft 64 ft 3 sec 4 sec
: : : : : n sec
1. Explain each entry in the row corresponding to Time = 1 sec in the table above. (The basis for computing
all entries is the fact that acceleration due to gravity is 32 ft/sec2.)
2. Explain each entry in the row corresponding to Time = 2 sec.
3. Complete the table for Time = 3 sec and Time = 4 sec. Compare your table entries to those of some of your classmates. Discuss and resolve any differences.

93 of 120
Distance F allen During Each Second – Now you will use the completed table to help find formulas for distance fallen. First, consider distance fallen during each second.
4. Find recursive and explicit formulas for D(n), Distance Fallen during the nth second, as follows. (For this problem, ignore the row in the table for Time = 0 sec.)
a. If NOW is the Distance Fallen during any given second and NEXT is the Distance Fallen during the next second, write an equation for NEXT in terms of NOW.
b. Rewrite the NEXT/NOW equation using D(n) and D(n-1). That is, if D(n) = Distance Fallen during the nth second, and D(n-1) = Distance Fallen during the
(n-1)st second, write an equation for D(n) in terms of D(n-1). (This is a recursive formula since D(n) is expressed in terms of a previous value, D(n-1).)
c. If D(n) = Distance Fallen during the nth second, write an equation for D(n) in terms of n. Explain how you got your equation and why it is correct. (A formula like this, where D(n) is written as a function of n, is called an explicit or closed-form formula.)
Total Distance F allen After n Seconds – The main goal of this investigation is to find formulas for T(n), the Total Distance Fallen after n seconds. You will use several methods to do this:
• use a general analysis • use an arithmetic sequence • use the method of Finite Differences.
Each of these methods is carried out in the next three problems.
5. Find formulas for Total Distance Fallen after n seconds, as follows. Let T(n) = Total Distance Fallen after the nth second.
a. As part of Problem 3, you computed T(3). Describe how you computed T(3).
b. Describe all the methods you can think of for how to compute T(n).
c. Write a formula for T(n) in terms of T(n-1) and D(n). (This is a recursive formula since T(n) is expressed in terms of the previous value, T(n-1).)
6. Find an explicit formula for T(n) by summing an arithmetic sequence, as follows. (This is optional – for those who have studied arithmetic sequences.)
a. One way that you may have described in Problem 5b for finding T(n) is to sum all the terms up to D(n) in the D(n) column. If you didn’t already describe this in Problem 5b, explain here why this is a valid method for computing T(n).
b. You found in Problem 4c above that D(n) = D(n-1) + 32 ft (ignoring the row for Time = 0 sec). This formula shows that you add a constant, 32, each time to get the next value of D(n). Thus, the terms D(n) form an arithmetic sequence. Therefore, T(n) = the sum of the arithmetic sequence: D(1) + D(2) + … + D(n). Compute this sum to find an explicit formula for T(n) in terms of n.

94 of 120
7. Another way to find an explicit formula for T(n) is to use a finite differences table. Here’s how it works.
a. Complete the three remaining entries in the bottom of the table below.
F inite Differences Table
n T(n) 1st Differences (entry in the previous column)
– (entry just above it)
2nd Differences (entry in the previous column)
– (entry just above it)
1 16 --------------- --------------- 2 64 64 - 16 = 48 --------------- 3 144 144 – 64 = 80 80 – 48 = 32 4 256 256 – 144 = 112 5 400
b. Describe the pattern in the 2nd differences column.
c. Now we apply a key fact: If the nth differences in a finite differences table are constant, then the formula for T(n) is an nth-degree polynomial. In this case, the 2nd differences are constant, so the formula for T(n) is a 2nd-degree polynomial, that is, the formula is quadratic. (Proving this key fact is not too hard, but it will take too long to do it now. If you are interested in the proof, you can ask your teacher for guidance or search for some references.)
So we know that T(n) is quadratic and thus it looks like:
T(n) = an2 + bn + c
Now we need to find the coefficients, a, b, and c. One way to find a, b, and c is to generate and solve a system of three linear equations. To help us do this, we know the value of T(n) for several values of n. Thus we get:
T(n) = an2 + bn + c n=1 16 = a + b + c n=2 64 = 4a + 2b + c n=3 144 = 9a + 3b + c
Explain the details of how these three equations are generated.
d. Now you need to solve this system of three linear equations. One way to do so is by using matrices. (For another method, see Problem 8 below.) To begin, a system of linear equations like this can be represented using matrices, as follows:
1 1 14 2 19 3 1
abc
1664144
Explain where all the entries in the matrices come from, and why this matrix equation is equivalent to the linear system in Part c.
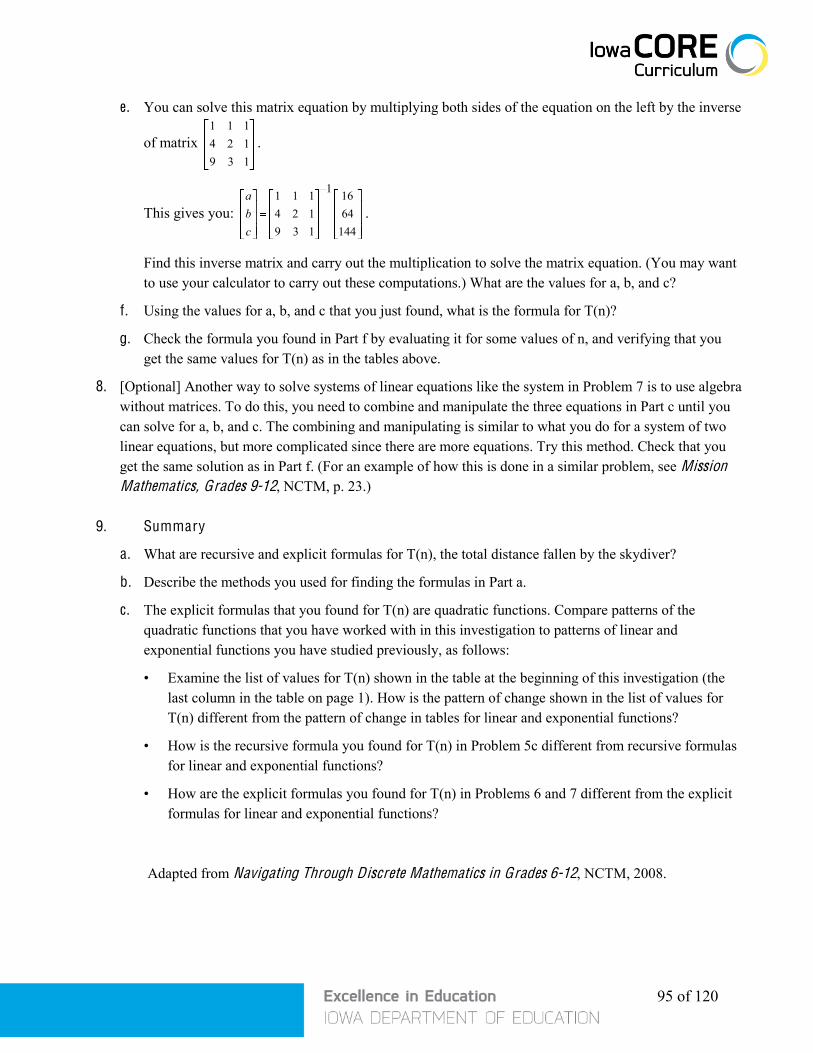
95 of 120
e. You can solve this matrix equation by multiplying both sides of the equation on the left by the inverse
of matrix 1 1 14 2 19 3 1
.
This gives you: abc
1 1 14 2 19 3 1
1 1664144
.
Find this inverse matrix and carry out the multiplication to solve the matrix equation. (You may want to use your calculator to carry out these computations.) What are the values for a, b, and c?
f. Using the values for a, b, and c that you just found, what is the formula for T(n)?
g. Check the formula you found in Part f by evaluating it for some values of n, and verifying that you get the same values for T(n) as in the tables above.
8. [Optional] Another way to solve systems of linear equations like the system in Problem 7 is to use algebra without matrices. To do this, you need to combine and manipulate the three equations in Part c until you can solve for a, b, and c. The combining and manipulating is similar to what you do for a system of two linear equations, but more complicated since there are more equations. Try this method. Check that you get the same solution as in Part f. (For an example of how this is done in a similar problem, see Mission Mathematics, Grades 9-12, NCTM, p. 23.)
9. Summary
a. What are recursive and explicit formulas for T(n), the total distance fallen by the skydiver?
b. Describe the methods you used for finding the formulas in Part a.
c. The explicit formulas that you found for T(n) are quadratic functions. Compare patterns of the quadratic functions that you have worked with in this investigation to patterns of linear and exponential functions you have studied previously, as follows:
• Examine the list of values for T(n) shown in the table at the beginning of this investigation (the last column in the table on page 1). How is the pattern of change shown in the list of values for T(n) different from the pattern of change in tables for linear and exponential functions?
• How is the recursive formula you found for T(n) in Problem 5c different from recursive formulas for linear and exponential functions?
• How are the explicit formulas you found for T(n) in Problems 6 and 7 different from the explicit formulas for linear and exponential functions?
Adapted from Navigating Through Discrete Mathematics in Grades 6-12, NCTM, 2008.
96 of 120
A Recursive V iew of Skydiving Problem-Based Instructional Task Lesson Plan
________________________________________________ Objectives/Benchmarks:
Mathematical modeling – Use mathematical modeling to find recursive and explicit formulas for distance fallen as governed by the force of gravity alone.
Recursive and explicit formulas – Develop and apply formulas. Arithmetic sequences – Review and apply the sum of an arithmetic sequence. Finite differences tables – Learn and apply finite differences tables. Quadratic functions – Represent quadratic functions explicitly and recursively, and compare to
previous work with linear and exponential functions.
Title: A Recursive View of Skydiving (Adapted from Navigating Through Discrete Mathematics in Grades 6-12, NCTM, 2008.)
G rade L evel/Course: Grade 10-12, depending on students and curriculum
Pre-requisite K nowledge:
Arithmetic sequences (although can be skipped if necessary) Quadratic functions (some initial study) Linear and exponential functions
N C T M Standard(s): (shaded)
NCTM Content Standards
Number & Operations
A lgebra Geometry Measurement Data Analysis & Probability
NCTM Process Standards
Problem Solving
Reasoning & Proof
Communication Connections Representation
Rigor and Relevance F ramework: C
D X X
A
B
Mater ials Needed:
• Copies of the student investigation sheet, “A Recursive View of Skydiving,” one for each student. • Calculator or computer with inverse matrix capability
97 of 120
M A IN L ESSO N D E V E L OPM E N T L A UN C H : Purposeful introduction to the lesson, typically teacher led Develop a situation, discussion, questions that:
set the stage for the lesson motivate engage find out what students know (note formative assessment) foreshadow the big ideas of lesson keep it relatively brief
For this problem-based instructional task, ask students:
Have you ever been skydiving, or know someone who has? What do you think influences how fast and how far a skydiver falls? Of the types of functions you have studied, which one do you think models the total distance
fallen by a skydiver? After a brief discussion of these questions, tell students that they will consider this last question carefully as they work through the investigation. They will have a good answer at the end. Then start students on the Explore part of the lesson - see below.
E XPL O R E : Get students engaged in investigating important mathematics, typically in teams. Characteristics:
effective guiding questions – in the task and by the teacher student-to-student communication high level of student engagement Note opportunity for formative assessment.
Teacher will: guide the students to work out the examples themselves, instead of the teacher and text presenting
completed examples be prepared for and carry out mini-summaries as needed be prepared for and help students and teams with key points and trouble spots
For this problem-based instructional task, use the attached student investigation sheet, entitled “A Recursive View of Skydiving.” This investigation will likely work best if you put the students into teams, so that they can work together and discuss. Students will answer the structured set of questions and solve the problems in the attached investigation sheet. Circulate and check on student teams. Be prepared to guide their work with questions. If many groups are having trouble on the same problem, you could bring the class together for a teacher-led discussion and resolution of that problem, then put them back into their teams to continue. In particular, be sure to check all teams’ work on Problems 3, 5c, and 7e.
98 of 120
SU M M A RI Z E Closure and summary for the lesson, typically teacher led:
Identify the 2-4 main points of the lesson. Ask 2-4 questions that get students to review, synthesize, and explain the main points. Note opportunity for formative assessment.
For this problem-based instructional task, students should answer the questions in the Summary section of the investigation, namely, Problem 9. After students have answered these questions, you could bring the class together and have randomly chosen teams explain their answers to each of the 3 questions. Discuss and resolve any errors and confusions. Modifications/Extensions:
If students have not studied sums of arithmetic sequences, they can skip Problem 6, or do some preview meaningful distributed practice on arithmetic sequences before this lesson.
For some students, you may ask them to solve the system of equations in Problem 7 using the optional method in Problem 8.
Checking for Understanding (Note formative assessment, in addition to above.)
What will you assess? o This problem-based instructional task has clear focus questions for the students at the
beginning. You should make sure students are focused on those questions and can answer them at the end.
o Also, see the objectives at the beginning of this lesson plan. o Also, see the Summary problem, Problem 9.
How will you assess it? o The engaged student discussion and teacher questioning will provide ongoing formative
assessment throughout the lesson. See above. o You can use student work on Problem 9 as one way to assess students’ learning in this
problem-based instructional task. You might ask them to write answers to the questions in Problem 9, which are turned in and graded; or you might ask student teams to give brief reports on Problem 9.
o You might create a checklist, and make checks as the student teams are working and you are circulating, to record students’ successful completion of the key problems identified in the Explore section, namely, Problems 3, 5c, and 7e.
o You might create a quiz with a similar problem.
--------------------(R E F L E C T I O N A F T E R T E A C H IN G T H E L ESSO N)------------------
How did the students perform? How do you know? What parts of the lesson went well? Not so well? How do you know? How will you use this information to guide future instructional decisions, about this lesson
and more generally?

99 of 120
Student Investigation/Project – H igh School – Vertex-Edge G raphs See Rigor and Relevance Quadrant D Example in Appendix B
Street Inspection You have been hired by the city as a deputy street supervisor. Part of your job is to inspect the city’s streets for potholes. Your area of inspection is shown on the given street map. Devise a plan for street inspection that starts at your office, inspects each block at least once, ends at your office, and takes the least amount of time (time is money). Assume it takes five minutes to walk a block for inspections including corners and one minute to just walk a block without inspecting (called deadheading).* Begin by completing the Traveling Networks Group Project. Next devise inspection plans for a variety of rectangular (both square and non-square) streets. Look for patterns in your plans. You should now be ready to complete the original task of inspecting the city streets for which you were hired. Explain why your plan is the most cost effective. Can you think of other occupations that might want to use your plan or a variation of your plan? *This problem is a variation of the Chinese postman problem first studied in 1962 by Meigu Guam, a Chinese mathematician.

100 of 120
Office
1st Avenue
2nd Avenue
3rd Avenue
4th Avenue
5th Avenue
6th Avenue
1st S
treet
2nd
Stre
et
3rd
Stre
et
4th
Stre
et
5th
Stre
et
6th
Stre
et

101 of 120
Office

102 of 120
T raveling Networks G roup Project
1. Determine which of the thirty networks can be traveled. Indicate where you started and where you ended your travel.
2. For the networks that can be traveled indicate whether or not your trip was a path or a circuit.
3. Complete the following conjectures. The degree of a pass through vertex must be … A network can be traveled whenever ... A network can be traveled via a path whenever ... A network can be traveled via a circuit whenever ... 4. Write a convincing argument that your conjectures are true. Your argument should convince someone that the
conjectures are true for any network, not just the thirty you were given. Your argument should be written so that a non-math person would be convinced. You may use diagrams as part of your argument. You may assume that the person has the list of vocabulary words and that you have fully explained the terms to the person.
5. Return to the original street inspection problem for which you were hired. Why does this problem require an
Eulerization of the street map? Investigate several other rectangular (both square & non-square) street maps and look for patterns in Eulerizing these street maps.
6. Find the most cost effective inspection plan for the street map you were hired to inspect and explain why
your plan is the most effective.

103 of 120
Network Vocabulary
Network: A network is a collection of vertices (points) connected by edges (segments).
T raveling a Network: A network can be “traveled” if the network can be drawn with a pencil without lifting the pencil off the paper and without retracing any edges. Vertices can be passed through more than once. Odd Vertex: An odd vertex has an odd number of edges with that vertex as an endpoint. Even Vertex: An even vertex has an even number of edges with that vertex as an endpoint. Loop: A loop is an edge (street – called a cul-de-sac) with only one endpoint. Note: A loop is counted twice at its endpoint. See Figure 1. Euler Path: Traveling a network such that the starting point and ending point are different. Euler C ircuit: Traveling a network such that the starting and ending points are the same. Note: An Euler path or circuit can be recorded by listing the vertices in the order in which they are passed through. The first vertex listed is where the path or circuit starts and the last vertex listed is where the path or circuit ends. For example, a possible Euler path for the network in Figure 1 can be recorded as A,E,E,D,A,B,C,D. When a loop is traveled it is indicated by listing its endpoints twice. Eulerizing a Network: The process of revising a network by adding edges so that the revised network has an Euler circuit.

104 of 120
Networks A “•” indicates that there is a vertex joining two or more edges. You may only move from one edge to another at a vertex. 1. 2. 3.
4. 5. 6.
7. 8. 9. 10.

105 of 120
11. 12. 13.
14. 15. 16.
17. 18. 19.

106 of 120
20. 21.
22. 23.
24. 25.

107 of 120
26. 27.
28. 29.
30.

108 of 120
The Paths and C ircuits
Network Ordered Listing of Vertices for Path or Circuit 1 2 3 4 5 6 7 8 9 10 11 12 13 14 15 16 17 18 19 20 21 22 23 24 25 26 27 28 29 30

109 of 120
Can a Network be T raveled?
Network # of odd vertices* # of even vertices** Can it be traveled? Path or Circuit?*** 1 2 3 4 5 6 7 8 9 10 11 12 13 14 15 16 17 18 19 20 21 22 23 24 25 26 27 28 29 30
* An odd vertex has an odd number of edges with that vertex as an endpoint. ** An even vertex has an even number of edges with that vertex as an endpoint. *** An Euler path is a traveled network such that the starting vertex and ending vertex are different. An Euler circuit is a traveled network such that the starting and ending vertices are the same.

110 of 120
Streets Project – What to hand in.
The G roup
1. An ordered listing of vertices for the paths and circuits
2. Data on number of odd and even vertices.
3. Complete statements of the conjectures from Group Project #3.
4. Convincing arguments why your conjectures are true, which should include:
a. A complete explanation why pass through vertices in paths and circuits must be even,
b. A complete explanation why in a circuit the vertex that is both the starting and ending vertex must be even,
and
c. A complete explanation why in a path both the starting and ending vertices must be odd.
5. Diagrams indicating an Eulerization of various street networks such as: 2x2, 3x3, 4x4, 1x2, 1x3, 1x4, 2x3,
2x4, 2x5, 3x4, 3x5.
6. An Eulerization of the original street inspection problem with an indication of the least amount of time
needed to complete the inspection.
Each Individual
1. An evaluation of your participation in the group.
2. An evaluation of the participation of the other members of your group.
G rading (Included in Unit T est Category)
75 points: Correctness of all work
5 points: Completion of all of the required work
5 points: Effective group member
5 points: Organization of hand-in materials
5 points: Clarity of hand-in materials
5 points: Neatness of hand-in materials
Copyright © 2006, J. Maltas, Price Lab School, University of Northern Iowa

111 of 120
Resources – H igh School See Rigor and Relevance Quadrant Examples in Appendix B
Highcrest H igh School Survey
Do you play a musical
instrument? Yes No
Do
you
play
on
a sp
orts
te
am?
Yes
14
32
No
20
14
(From NCTM’s Principles and Standards for School Mathematics, p. 331)
(From NCTM’s Principles and Standards for School Mathematics, p. 356)

112 of 120
Compound Events in a T rial in Sweden
In a trial in Sweden, a parking officer testified to having noted the position of the valve stems on the tires on one side of a car. Returning later, the officer noted that the valve stems were still in the same position. The officer noted the position of the valve stems to the nearest "hour." For example, in figure 7.26 [p. 332] the valve stems are at 10:00 and at 3:00. The officer issued a ticket for overtime parking. However, the owner of the car claimed he had moved the car and returned to the same parking place.
The judge who presided over the trial made the assumption that the wheels move independently and the odds of the two valve stems returning to their previous "clock" positions were calculated as 144 to 1. The driver was declared to be innocent because such odds were considered insufficient—had all four valve stems been found to have returned to their previous positions, the driver would have been declared guilty (Zeisel 1968). Given the assumption that the wheels move independently, students could be asked to assess the probability that if the car is moved, two (or four) valve stems would return to the same position. They could do so by a direct probability computation, or they might design a simulation, either by programming or by using spinners, to estimate this probability. But is it reasonable to assume that two front and rear wheels or all four wheels move independently? This issue might be resolved empirically. The students might drive a car around the block to see if its wheels do rotate independently of one another and decide if the judge's assumption was justified. They might consider whether it would be more reasonable to assume that all four wheels move as a unit and ask related questions: Under what circumstances might all four wheels travel the same distance? Would all the wheels travel the same distance if the car was driven around the block? Would any differences be large enough to show up as differences in "clock" position? In this way, students can learn about the role of assumptions in modeling, in addition to learning about the computation of probabilities.
Students could also explore the effect of more-precise measurements on the resulting probabilities. They could calculate the probabilities if, say, instead of recording markings to the nearest hour on the clockface, the markings had been recorded to the nearest half or quarter hour. This line of thinking could raise the issue of continuous distributions and the idea of calculating probabilities involving an interval of values rather than a finite number of values. Some related questions are, How could a practical method of obtaining more-precise measurements be devised? How could a parking officer realistically measure tire-marking positions to the nearest clock half-hour? How could measurement errors be minimized? These could begin a discussion of operational definitions and measurement processes.
(From: NCTM’s Principles and Standards for School Mathematics, pp. 332-333)

113 of 120
BIB L I O G R APH Y
Achieve, Inc. (2007). Secondary Mathematics Benchmarks Progressions (recommendations by strand—algebra, geometry, probability, and statistics, discrete mathematics), High School Model Three-Year Traditional Plus Course Sequence (recommendations by single-subject courses enhanced by the addition of topics from data analysis, statistics, and discrete mathematics), High School Model Three-Year Integrated Course Sequence (recommendations by integrated courses). American Diploma Project. http://www.achieve.org/node/969 ACT (2007). College Readiness Standards: Mathematics. http://www.act.org/standard/planact/math/index.html __________ (2004). Crisis at the Core: Preparing All Students for College and Work. http://www.act.org/research/policymakers/reports/crisis.html American Diploma Project (2004). Ready or Not: Creating a High School Diploma That Counts. Achieve, Inc. http://www.achieve.org/node/552 American Institutes for Research (2005). Reassessing U .S. International Performance: New F indings from the 2003 TIMSS and PISA. Report prepared by the American Institutes for Research for the U.S. Department of Education Policy and Program Studies Service (PPSS). http://www.air.org/news/documents/TIMSS_PISA%20math%20study.pdf American Statistical Association (2005). Guidelines for Assessment and Instruction in Statistics Education (GAISE). http://www.amstat.org/education/gaise/ Bransford, John D., Brown, Ann L., & Cocking, Rodney R. (Eds.) (1999). How People Learn: Brain, Mind, Experience, and School. Washington, D.C.: National Academy Press. Burkhardt, Hugh (2001). “The Emperor’s Old Clothes, or How the World Sees It…” Dialogues, January 2001. National Council of Teachers of Mathematics. http://www.nctm.org/resources/content.aspx?id=1666&ekmensel=c580fa7b_44_300_1666_2 Center for the Study of Mathematics Curriculum (2007). K – 12 Mathematics: What Should Students Learn and When Should They Learn It?– Conference Highlights. Columbia, MO: Center for the Study of Mathematics Curriculum. http://www.mathcurriculumcenter.org/MathStandardsConference/ __________ (2005). Development of State-Level Mathematics Curriculum Documents: Report of a Survey. Columbia, MO: Center for the Study of Mathematics Curriculum. http://www.mathcurriculumcenter.org http://www.mathcurriculumcenter.org/resources/ASSMReport.pdf

114 of 120
College Board (2007). Standards for College Success: Mathematics and Statistics—Adapted for Integrated Curricula. http://www.collegeboard.com/about/association/academic/standard.html __________ (2006). Standards for College Success: Mathematics and Statistics. http://www.collegeboard.com/about/association/academic/standard.html Committee on Prospering in the Global Economy of the 21st Century (2007). Rising Above the Gathering Storm: Energizing and Employing America for a Brighter Economic Future. Washington, D.C.: National Academies Press. http://www.nap.edu/catalog.php?record_id=11463 Daggett, Willard R. (2005). Achieving Academic Excellence through Rigor and Relevance. White Paper from the International Center for Leadership in Education. September 2005. http://www.leadered.com/white_papers.shtml Education Week (2007). “Diplomas Count: Ready for What?” Education Week, Vol. 26, No. 40. June 12, 2007. http://www.edweek.org/ew/toc/2007/06/12/index.html. Finn, Chester and Diane Ravitch (2007). “Why Liberal Learning.” In Finn and Ravitch (eds.) Beyond the Basics: Achieving a Liberal Education for All Children. Thomas B. Fordham Institute, July, 2007, pp. 1 – 10. www.edexcellence.net/institute/publication/publication.cfm?id=372 Friedman, Thomas L. (2005). “It’s a Flat World, After All.” The New York Times, April 3, 2005. Georgia Department of Education (2006). Georgia Mathematics Standards. http://www.georgiastandards.org/math.aspx Grouws, Douglas A. and Kristin J. Cebulla (2000). Improving Student Achievement in Mathematics. Geneva, Switzerland: The International Bureau of Education. Hart, Eric, Margaret Kenney, Valerie DeBellis, Joseph Rosenstein (2008). Navigating through Discrete Mathematics in Grades 6–12. Reston, VA: National Council of Teachers of Mathematics. Hart, Eric W. and W. Gary Martin (2008). “Standards for High School Mathematics: Why, What, How?” Mathematics Teacher (December 2008/January 2009): 377–382. Reston, VA: National Council of Teachers of Mathematics. Hasegawa, Junichi (2000). “Mathematics Education in Upper Secondary Schools (in Japan).” Journal of Japan Society of Mathematical Education, Special Issue: Mathematics Education in Japan during the F ifty-five Years since the War. Looking towards the 21st Century. Vol. 82, No. 7-8, pp. 130-138.

115 of 120
Hastings, Nancy Baxter (Ed.) (2006). A Fresh Start for Collegiate Mathematics: Rethinking the Courses below Calculus. MAA Notes 69. Mathematical Association of America. https://www.maa.org/ecomtpro/Timssnet/products/TNT_products.cfm?primary_id=NTE-69&secondary_id=null&Subsystem=ORD&action=long&format=table Hirsch, Chris, with Dana Cox, Lisa Kasm, Sandy Madden, and Diane Moore (2007). “Some Common Themes and Notable Differences Across Recent National Mathematics Curriculum Documents.” In K –12 Mathematics: What Should Students Learn and When Should They Learn It?— Conference Highlights. Columbia, MO: Center for the Study of Mathematics Curriculum. http://www.mathcurriculumcenter.org/MathStandardsConference/ Indiana Department of Education (2006). Indiana’s Academic Standards for High School Mathematics. http://www.doe.in.gov/standards/HS-Mathematics.html Iowa Department of Education (2005). Improving Rigor and Relevance in the High School Curriculum. September 2005. http://www.iowa.gov/educate/content/view/673/1024/ __________ (2005). Chapter 12 Rule Interpretation Matrix. Iowa Administrative Code Chapter 12, General Accreditation Standards for School Districts and Accredited Nonpublic Schools. Iowa Department of Education. http://www.iowa.gov/educate/content/blogcategory/61/896/ __________ (2000). Core Content Standards and Benchmarks. Iowa Department of Education. http://www.iowa.gov/educate/content/view/1350/1554/ Iowa Testing Programs (2006). Iowa Tests of Educational Development. Iowa City, IA: University of Iowa. Japan Society of Mathematical Education (2000). Mathematics Program in Japan. Tokyo, Japan. Kilpatrick J., W. G. Martin, and D. Schifter (Eds.) (2003). A Research Companion to Principles and Standards for School Mathematics. Reston, VA: National Council of Teachers of Mathematics. Kumakura, Hiroyuki (2000). “Towards Classroom Teaching that helps Students to Appreciate Mathematical Learning—Reviewing practical studies for upper secondary schools (in Japan) in JSME in the 1990s. Journal of Japan Society of Mathematical Education, Special Issue: Exploring Secondary School Mathematics Education of Japan in the 21st Century—Based on Practical Studies in the 1990s. Vol. 82, No. 9, pp. 24–26. Lockhart, Paul (2002). “A Mathematician’s Lament.” In Devlin’s Angle, March 2008. MAA Online. http://www.maa.org/devlin/devlin_03_08.html

116 of 120
Lott, J., and K. Nishimura (eds.) (2004). Standards and Curriculum: A View from the Nation, A Joint Report of the National Council of Teachers of Mathematics (NCTM) and the Association of State Supervisors of Mathematics (ASSM). Reston, VA: NCTM. Massachusetts Department of Education (2000). Massachusetts Mathematics F ramework. Boston, MA: Massachusetts Department of Education. http://www.doe.mass.edu/frameworks/current.html Mathematical Association of America (2007). Algebra: Gateway to a Technological Future. MAA. Summary—http://www.maa.org/algebra-report/index.html Report—http://www.maa.org/algebra-report/Algebra-Gateway-Tech-Future.pdf __________ (2007). CRAFTY Guidelines for College Algebra. Curriculum Renewal Across the First Two Years (CRAFTY) subcommittee of the Committee on the Undergraduate Program in Mathematics (CUPM). Mathematical Association of America. http://www.maa.org/cupm/crafty/ __________ (2004). Curriculum Foundations Project: Voices of the Partner Disciplines. Curriculum Renewal Across the First Two Years (CRAFTY) subcommittee of the Committee on the Undergraduate Program in Mathematics (CUPM). Mathematical Association of America.. http://www.maa.org/cupm/crafty/cf_project.html Michigan Department of Education (2006). High School Mathematics Content Expectations. http://www.michigan.gov/mde/0,1607,7-140-38924_41644_42668---,00.html Minnesota Department of Education (2007). Minnesota K – 12 Academic Standards in Mathematics. Roseville, MN: Minnesota Department of Education. Mullis, Ina V.S., Michael O. Martin, Albert E. Beaton, Eugenio J. Gonzalez, Dana L. Kelly, and Teresa A. Smith (1998). Mathematics and Science Achievement in the F inal Year of Secondary School: IEA’s Third International Mathematics and Science Study (TIMSS). International Association for the Evaluation of Educational Achievement (IES), Boston College. February 1998. National Assessment Governing Board (2006). Mathematics F ramework for the 2007 National Assessment of Educational Progress (NAEP). Washington, D.C: U.S. Department of Education. September 2006. http://www.nagb.org/frameworks/math_07.pdf __________ (2004). Mathematics F ramework for the 2005 National Assessment of Educational Progress (NAEP). Washington, D.C: U.S. Department of Education. September 2004. http://www.nagb.org/pubs/m_framework_05/toc.html

117 of 120
National Center for Education Statistics (NCES) (2007). National Assessment of Educational Progress at Grades 4 and 8: The Nation’s Report Card – Mathematics 2007. Washington, D.C.: National Center for Education Statistics, U.S. Department of Education. __________ (2006). National Assessment of Educational Progress: The Nation’s Report Card— Mathematics 2005. http://nces.ed.gov/nationsreportcard/pdf/main2005/2006453.pdf __________ (2005). A Profile of the American High School Senior in 2004. (Includes a study of mathematics performance.) U.S. Department of Education, Institute of Education Sciences, NCES. http://nces.ed.gov/pubsearch/pubsinfo.asp?pubid=2006348 http://nces.ed.gov/pubs2006/2006348.pdf __________ (2004). International Outcomes of Learning in Mathematics Literacy and Problem Solving: PISA 2003 Results from the U .S. Perspective. Institute of Education Sciences, U.S. Department of Education. December 2004. http://nces.ed.gov/pubsearch/pubsinfo.asp?pubid=2005003 National Center on Education and the Economy (NCEE) (2006). Tough Choices or Tough Times: The Report of the New Commission on the Skills of the American Workforce. Jossey-Bass, an Imprint of Wiley. http://skillscommission.org/ National Commission on the High School Senior Year (NCHSSY) (2001). Raising Our Sights: No High School Senior Left Behind. Final Report prepared for the U.S. Department of Education. http://e-archives.ky.gov/_govpatton/search/pressreleases/2001/sryearreport.htm National Council of Teachers of Mathematics (forthcoming). Discussion Draft of Focus on High School Mathematics: A Quest for Reasoning and Sense Making. Reston, VA: National Council of Teachers of Mathematics. __________ (2006). Curriculum Focal Points for Pre-Kindergarten through Grade 8 Mathematics: A Quest for Coherence. Reston, VA: National Council of Teachers of Mathematics. __________ (2000). Principles and Standards for School Mathematics. Reston, VA: National Council of Teachers of Mathematics. __________ (1989). Curriculum and Evaluation Standards for School Mathematics. Reston, VA: National Council of Teachers of Mathematics. __________ (1980). An Agenda for Action. Reston, VA: National Council of Teachers of Mathematics.

118 of 120
National Mathematics Advisory Panel (2008). Foundations for Success: Report of the National Mathematics Advisory Panel. Washington, D.C.: US Department of Education. http://www.ed.gov/about/bdscomm/list/mathpanel/index.html National Research Council (2005). How Students Learn: History, Mathematics, and Science in the Classroom. Washington, D.C.: The National Academies Press. http://www.nap.edu/catalog.php?record_id=10126 __________ (2002). Helping Children Learn Mathematics. Washington, D.C.: The National Academies Press. http://www.nap.edu/catalog.php?record_id=10434 __________ (2001). Adding it Up: Helping children Learn Mathematics. Washington, D.C.: The National Academies Press. http://www.nap.edu/catalog.php?record_id=9822 Noddings, Nell (2007). “The New Anti-Intellectualism in America: When Curricular Rigor and ‘Pedagogical Fraud’ Go Hand in Hand.” Education Week, March 20, 2007. Partnership for 21st Century Skills (2007). Beyond the Three Rs: Voter Attitudes toward 21st Century Skills. Report on results of a nationwide poll in September, 2007. http://www.21stcenturyskills.org http://www.21stcenturyskills.org/documents/P21_pollreport_singlepg.pdf __________ (2006). Are They Really Ready to Work? Employers’ Perspectives on the Basic Knowledge and Applied Skills of New Entrants to the 21st Century U .S. Workforce. Report on results of a nationwide pole in April and May 2006. http://www.21stcenturyskills.org http://www.21stcenturyskills.org/documents/FINAL_REPORT_PDF09-29-06.pdf Pellegrino, James W. (2006). Rethinking and Redesigning Curriculum, Instruction, and Assessment: What Contemporary Research and Theory Suggest. Paper commissioned by the National Center on Education and the Economy for the New Commission on the Skills of the American Workforce. NCEE. http://skillscommission.org/commissioned.htm Philips, Gary W. (2007). Chance Favors the Prepared Mind: Mathematics and Science Indicators for Comparing States and Nations. [Comparison using a common metric for NAEP and TIMSS] Washington, D.C.: American Institutes for Research. http://www.air.org/news/pr/8thGrader.aspx Poinsett, James (2006). Review of A Fresh Start for Collegiate Mathematics: Rethinking the Courses below Calculus (Nancy Baxter Hastings, Ed.). MAA Online. http://www.maa.org/reviews/FreshStart.html

119 of 120
Prensky, Marc (2001). “Digital natives, digital immigrants.” On the Horizon. NCB University Press Vol. 9 No. 5 (October 2001). Programme for International Student Assessment (PISA) (2007). PISA 2006 Science Competencies for Tomorrow’s World. [Focus on science, also has mathematics] Paris, France: OECD http://www.nces.ed.gov/pubsearch/pubsinfo.asp?pubid=2008016 http://www.pisa.oecd.org/document/2/0,3343,en_32252351_32236191_39718850_1_1_1_1,00.html __________ (2003). The PISA 2003 Assessment F ramework—Mathematics, Reading, Science and Problem Solving Knowledge and Skills. [Focus on mathematics] Paris, France: OECD http://nces.ed.gov/Surveys/PISA/pisa2003highlights.asp http://www.oecd.org/document/29/0,2340,en_32252351_32236173_33694301_1_1_1_1,00.html Schoen, Harold L. (Ed.) (2003). Teaching Mathematics Through Problem Solving, Grades 6 – 12 (pp. 245 – 256). Reston, VA: National Council of Teachers of Mathematics. Schoenfeld, Alan (2002). “Making Mathematics Work for All Children: Issues of Standards, Testing, and Equity.” Educational Researcher, Vol. 31, No 1 (pp. 13 – 25). http://www.aera.net/publications/Default.aspx?menu_id=38&id=431 Secretary’s Commission on Achieving Necessary Skills (SCANS) (1991). “What Work Requires of Schools.” U.S. Department of Labor. http://wdr.doleta.gov/SCANS/ Singapore Ministry of Education (2006). Secondary Mathematics Syllabuses. http://www.moe.gov.sg/cpdd/syllabuses.htm http://www.moe.gov.sg/cpdd/doc/2007%20Sec%20Math%20Syllabuses.pdf Star, Jon R. (2005). “Research Commentary: Reconceptualizing Procedural Knowledge.” Journal for Research in Mathematics Education. November 2005, Vol. 36, Issue 5, pp. 404 – 411. Reston, VA: National Council of Teachers of Mathematics. Steen, Lynn Arthur (2007). “Facing Facts: Achieving Balance in High School Mathematics.” The Mathematics Teacher, 100th Anniversary Issue, January 2007. __________ (2007). “On Being a Mathematical Citizen: The Natural NExT Step.” The Ninth James R. C. Leitzel Lecture, The Mathematical Association of America, San Jose, CA, August 4, 2007. http://www.stolaf.edu/people/steen/Papers/leitzel.html Steen, Lynn Arthur (Ed.) (1990). On the Shoulders of Giants: New Approaches to Numeracy. The National Academies Press. http://books.nap.edu/catalog.php?record_id=1532

120 of 120
Trends in International Mathematics and Science Study (TIMMS) (2003). Washington, D.C: National Center for Education Statistics, Institute of Education Sciences, U.S. Department of Education. http://nces.ed.gov/pubs2005/timss03/summary.asp Washington State Department of Education (2007). K – 12 Mathematics Standards. Olympia, WA: Washington State Department of Education. Washington State Office of the Superintendent of Public Instruction (2006). Mathematics Grade Level Expectations. http://www.k12.wa.us/CurriculumInstruct/EALR_GLE.aspx Washington State Transition Mathematics Project (2006). College Readiness Mathematics Standards. Collaborative project of the K – 12 schools, community and technical colleges, and baccalaureate institutions. http://www.transitionmathproject.org/standards.asp