14 - spatial analyst
TRANSCRIPT

1
Introduction to Spatial AnalystIntroduction to Spatial Analyst
SasaranSasaran
•• ApaApa ituitu Spatial Analysis?Spatial Analysis?•• Raster vs. VectorRaster vs. Vector•• LayerLayer--Layer Grid Layer Grid dandan FeatureFeature•• Spatial Analyst Toolbar Spatial Analyst Toolbar dandan ArcToolboxArcToolbox•• Raster Calculator Raster Calculator dandan Map AlgebraMap Algebra•• JenisJenis--JenisJenis AnalysisAnalysis•• AplikasiAplikasi daridari Spatial Analyst Spatial Analyst

2
ApaApa ituitu Spatial Analysis?Spatial Analysis?•• MengidentifikasiMengidentifikasi lokasilokasi dandan bentukbentuk daridari
fiturfitur--fiturfitur geografisgeografis dandan relasirelasidiantaranyadiantaranya. .
•• BergunaBerguna untukuntuk evaluasievaluasi kesesuaiankesesuaian•• BergunaBerguna untukuntuk meningkatkanmeningkatkan
pemahamanpemahaman ygyg baikbaik akanakan bagaimanabagaimanafiturfitur--fiturfitur geografisgeografis dandan fenomenafenomenadilokasikandilokasikan dandan didi distribusikandistribusikan..
Spatial Analysis Spatial Analysis MembantuMembantu dalamdalam::
•• MenjawabMenjawab pertanyaanpertanyaan22 geografisgeografis–– DimanaDimana sekolahsekolah yang yang terdekatterdekat dgndgn rumahrumah??
•• MembantuMembantu pengambilanpengambilan keputusankeputusan–– MemilihMemilih dlmdlm menentukanmenentukan dimanadimana lokasilokasi
kilangkilang minyakminyak•• MenambilMenambil tindakantindakan, , membuatmembuat
perubahanperubahan22
–– MengubahMengubah ruterute hikinghiking•• MembangunMembangun modelmodel--model model ygyg akuratakurat
–– PemodelanPemodelan dampakdampak peningkatanpeningkatan COCO22 ..

3
ApaApa ituitu Spatial Analyst?Spatial Analyst?Extension Extension ArcGISArcGIS ygyg dptdpt digunakandigunakan utkutk
mengintegrasikanmengintegrasikan analisaanalisa data raster data raster dandan vector vector sertasertacreate, query, map, create, query, map, dandan analisaanalisa data data raseterraseter berbasisberbasis
cell cell dandan masihmasih banyakbanyak lagilagi!!
Raster DataRaster Data•• Raster Raster adalahadalah data data berbasisberbasis cellcell
–– Cells Cells disusundisusun menjadimenjadi barisbaris dandan kolomkolom, , rows and columns, rows and columns, diberikandiberikan nomornomor posisiposisiindexindex
–– BeberapaBeberapa format storage: format storage: sptspt. TIFF, Jpeg, . TIFF, Jpeg, Imagine, ESRI Grid, MrSid Imagine, ESRI Grid, MrSid
–– Model Raster model Model Raster model bergunaberguna utkutkmenyimpanmenyimpan data data ygyg continuous, continuous, sptsptelevation (elevation (ketinggianketinggian), slope (), slope (lekuk,lerenglekuk,lereng), ), and temperature.and temperature.

4
Raster = Data ContinuousRaster = Data Continuous
•• SecaraSecara Continuous Continuous mengubahmengubah nilainilai•• TersimpanTersimpan sbgsbg nilainilai floating pointfloating point•• Elevation, noise pollution, rainfall, Elevation, noise pollution, rainfall,
slope, temperatureslope, temperature
FotoFoto Digital Digital merupakanmerupakan RasterRaster
•• SatuSatu cell = cell = SatuSatu pixelpixel
•• MisalMisal. TIFF, . TIFF, JPEG, GIFJPEG, GIF
•• FotoFoto SatelliteSatellite

5
Data VectorData Vector
•• Vector Vector adalahadalah data data berbasisberbasis shape shape ((bentukbentuk))–– RepresentasiRepresentasi daridari duniadunia menggunakanmenggunakan
points, lines, points, lines, dandan polygons.polygons.–– ModelModel--model Vector model Vector bergunaberguna utkutk
menyimpanmenyimpan data data ygyg memilikimemiliki batasbatas--batasbataspemisahpemisah ygyg jelasjelas sptspt batasbatas wilayahwilayah negaranegara, , bidangbidang tanahtanah dandan jalananjalanan..
Vector = Data DiscreteVector = Data Discrete
•• MenggunakanMenggunakan points, lines, and polygonspoints, lines, and polygons•• BatasBatas--batasbatas (Boundaries)/locations (Boundaries)/locations diikatdiikat
dgndgn koordinatekoordinate..•• BatasBatas--batasbatas negawanegawa. land parcels, . land parcels,
streets, rivers, trees.streets, rivers, trees.

6
Raster VectorRaster Vector
•• CellsCells
•• ContinuousContinuous
•• CellCell--basedbased
•• Points, lines, polygonsPoints, lines, polygons
•• DiscreteDiscrete
•• ShapeShape--basedbased
Feature and Grid LayersFeature and Grid Layers
••Feature layers use vectorsFeature layers use vectors
••Grid layers use rastersGrid layers use rasters
ArcGIS represents elements of the real ArcGIS represents elements of the real world for analysis:world for analysis:

7
OperationsOperations
Has its own environment (not part of geoprocessing)
The ArcGIS Spatial Analyst Toolbar
Can composeMap Algebraexpressions
Has dialogs for the mostcommonly-used tools

8
ArcGIS Spatial Analyst and the ArcToolbox Window
Opens ArcToolbox
Provides dialog interface for tools
Hints andlink to help
� Uses geoprocessing environments(right-click to set)
� Has Map Algebra tools
����
Raster CalculatorRaster Calculator
•• Works on ArcMap raster layers and grid Works on ArcMap raster layers and grid data setsdata sets–– Uses environment settings for layer inputUses environment settings for layer input
•• Type in GRID Map AlgebraType in GRID Map Algebra•• Perform mathematical functionsPerform mathematical functions•• Combine multiple rastersCombine multiple rasters

9
Raster CalculatorRaster Calculator
Con([slope] > 15, 1, 0)
Condition (If Slope is greater than 15 , Output = 1 if less than 15, Output raster = 0)
Where is the ground suitable to build a house?
Modeling spatial problemsModeling spatial problems•• Models help us understand and solve Models help us understand and solve
complex problemscomplex problems––Simplify realitySimplify reality––Combine geographic layers to answer Combine geographic layers to answer
questionsquestions•• Example: “What type of forest does the pine Example: “What type of forest does the pine
marten prefer?”marten prefer?”
Reality GIS layers Habitat suitability
Mixed forest40-90 year old forestHigh density forestForest height > 20m
Mixed forest40-90 year old forestHigh density forestForest height > 20m

10
The analysis environmentThe analysis environment•• Control how an output raster is createdControl how an output raster is created
–– Settings for geoprocessing and Spatial Analyst Settings for geoprocessing and Spatial Analyst are independentare independent
The output rasterThe input raster
ProjectionMask
Cell Size Extent
Output Workspace
Types of AnalysisTypes of Analysis

11
ReclassificationReclassification•• Everything within a range becomes the Everything within a range becomes the
same valuesame value–– E.g.: temperature: E.g.: temperature: --10 10 –– 0 = 1 (cold)0 = 1 (cold)
0 0 –– 10 = 2 (cool)10 = 2 (cool)10 10 –– 20 = 3 (warm)20 = 3 (warm)30 30 –– 40 = 4 (hot)40 = 4 (hot)
Converting Vector Layers to Converting Vector Layers to Raster Raster
•• Useful for making raster calculations Useful for making raster calculations with vector datawith vector data

12
Surface AnalysisSurface Analysis
•• HillshadeHillshade((lerenglereng bukitbukit))
•• Slope (Slope (lekuklekuk))•• Aspect (Aspect (araharah))•• ViewshedViewshed•• Cut/FillCut/Fill•• CurvatureCurvature
Surfaces
Distance and LocationDistance and Location•• Distance and Distance and
proximity proximity (kedekatan)(kedekatan)analysisanalysis
•• Density mappingDensity mapping•• Zonal overlayZonal overlay

13
ApplicationsApplications
Crime Analysis Crime Analysis • Mitigate (mengurangi) crime
• Locate areas of high risk for burglaries (pencuri)

14
Fire AnalysisFire Analysis
• Locate areas of high risk
• Analyze ‘what if’ scenarios
•Analyze the •spread potential
•Preplan fires
Analyze Transportation CorridorsAnalyze Transportation Corridors
• Foreseeproblems with new corridors
• Assess and propose new transport routes
15
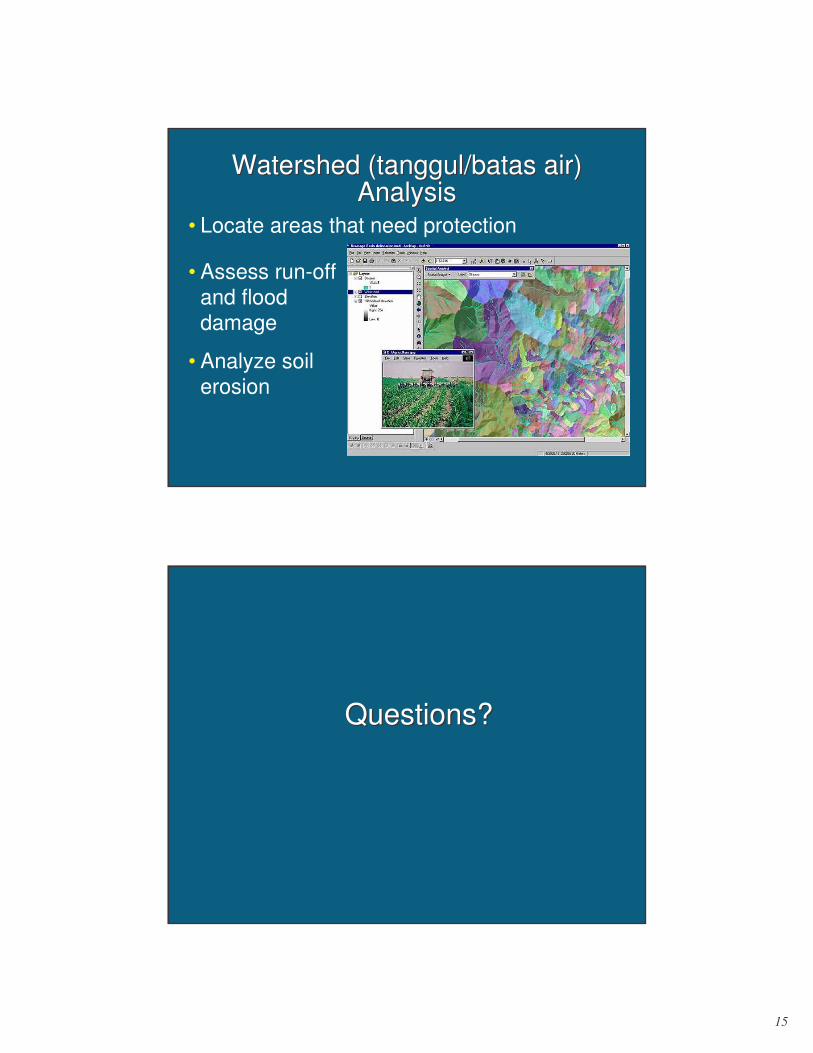
Watershed (Watershed (tanggul/batastanggul/batas air) air) AnalysisAnalysis
• Locate areas that need protection
• Assess run-off and flood damage
• Analyze soil erosion
Questions?Questions?