14th international conference on harmonisation kos island, …€¦ · q/nairs, pm fine fractions:...
TRANSCRIPT

THE USE AND EVALUATION OF MULTI-POLLUTANT SOURCE APPORTIONMENT METHODOLOGIES BY EU AUTHORITIES
AND RESEARCH GROUPS
John Douros1, Evangelia Fragkou1, Nicolas Moussiopoulos1, Claudio Belis2
1 Laboratory of Heat Transfer and Environmental Engineering, Aristotle University, Greece
2 Joint Research Centre, Institute for Environment and Sustainability, Ispra (VA), Italy
14th International Conference on HarmonisationKos Island, Greece, 2-6 October 2011

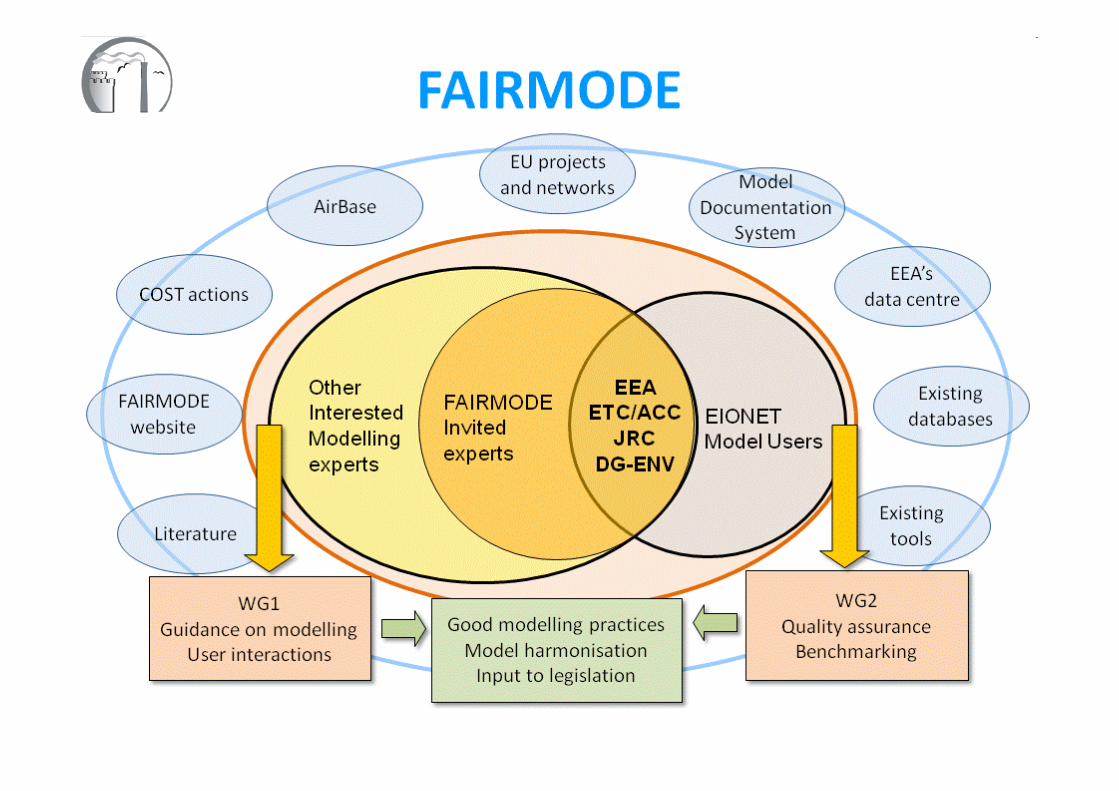
Scope and objective of FAIRMODE
In view of the requirement for increased modelling use in airquality assessment, as put forward within the frame of thecurrent Air Quality Directive (AQD) 2008/50/EC, the European Environment Agency (EEA) and the European Commission Joint Research Centre (JRC)set up a Forum for Air Quality Modelling.The Forum aims generally in:promoting the use of these modelling tools for policypurposes in a harmonised manner between member states,the promotion of good modelling practices andthe interaction between authorities and the modellingcommunity at national and European levels.

Structure of FAIRMODE
FAIRMODE
Guidance on use of models (WG1)
Quality assurance of models (WG2)
SG1 SG2 SG3 SG4
Forum for Air Quality
Modelling in Europe
Work-Groups
Sub-Groups
SG1: Combined Use of Monitoring & ModellingSG2: Contribution of Natural Sources and Source Apportionment SG3: Emissions & Projections SG4: Models Benchmarking
Source apportionment in the AQD
Source apportionment studies include assessing thecontribution from local sources as well as from naturalsources, neighbouring countries and the contribution fromresuspended road sand and salt.
AQD: possibility to discount natural sources and long-rangetransport of pollution and resuspension attributable to wintersanding-salting of roads when assessing compliance againstlimit values.
Although not explicitly mentioned in the AQD, modelling isnecessary for this purpose as monitoring of these contributionseverywhere in a zone or agglomeration would be unrealistic.

SG2 of FAIRMODE
SG2 of FAIRMODE focuses on source apportionment and thecontribution of natural sources on pollutant concentrationsand aims to: provide useful guidance and suggest best modelling practices
and quality assurance procedures for member countries. promote harmonised model use for source apportionment in the
EU Phase 1: Extensive review of the current status of modelling
practices used for source attribution and quantification ofcontributions by member states to identify gaps and problems.
Phase 2: Follow-up review of the current status of modellingpractices used by member states for source apportionment andfocusing on evaluation methods applied to validate SA results

Conclusions from Phase 1
The review from Phase 1 confirmed the increased use ofmodelling tools for source apportionment in member states
The analysis of the time extension reports revealed the lack of aa uniform methodology for source apportionment
A lack of uncertainty estimation, evaluation of SA results solelybased on traditional model validation
Limitations regarding: certain compounds not adequately quantified (e.g. biogenic
secondary organic material and the nitrate component) the apportionment of specific anthropogenic emission
sources not sufficiently discriminated in many sourceapportionment studies (e.g. shipping emissions)
the identification of biomass combustion sources

Phase 2 – Methodology followed
Questionnaires were prepared by FAIRMODE SG2 The questionnaires were a “Request for information concerning
source apportionment methodologies using models in Europe”and included questions on: the type of models used for SA the pollutants for which SA is performed by each member
state what SA methodology is used (short description and
references) if any evaluation of the SA methodology is performed
(short description and references) any issues, concerns related to SA using models, especially
in regard to the EU Air Quality Directive (2008/50/EC) affiliation and contact/personal details


Distribution of questionnaires and received responses
Distribution via e-mail to: EIONET NFPs representatives (representing 40 European
countries) 49 experts and regulators who have registered their interest
on SG2 activities (17 countries). Universities and research institutions, regulatory bodies and
environmental consulting companies were addressed. 18 questionnaires were returned from 12 EU countries, mostly
from the Mediterranean and the Balkan regions. Cyprus (1 response), Denmark (1 response), Finland (1
response), Germany (1 response), Greece (2 responses), Italy(4 responses), Lithuania (1 response), The Netherlands (1 response), Slovakia (1 response), Slovenia (1 response), Spain(3 responses), United Kingdom (1 response).

Phase 2: Target metrics for SA
PM: 100% of the q/nairs, PM10: 50% of the countries and 44% of the q/nairs, PM fine fractions: 17% of the countries, 11% of the q/nairs, NOx:
50% of the countries, 39% of the q/nairs, O3, CO: 33% of the countries
0 10 20 30 40 50 60 70 80 90 100
PM
PM10
PM fine fractions
NOx, NO2
O3
SO2
CO
Dioxines
Metals
VOC
Target metric in SA studies of different EU countries
Countries % Questionnaires %

Phase 2 results: Type of models used for SA
Country Modelling Methods
Cyprus Receptor model (PCA), Dispersion (Eulerian), Trajectory
Denmark Receptor model (COPREM), Dispersion (Eulerian, Gaussian)
Finland Dispersion (Eulerian-Lagrangian)
Germany Receptor model (Lenschow, PMF), Dispersion (Lagrangian), Trajectory, CFD
Greece Receptor model (PMF, PCA), Disperion (Eulerian), Trajectory
Greece Receptor model (PMF, PCA), Dispersion (Eulerian)
Italy Dispersion (Eulerian)
Italy Receptor model (CMB)
Italy Receptor model (PMF)
Italy Dispersion (Eulerian)
Lithuania Dispersion (Gaussian)
The Netherlands Receptor model (PMF, UNMIX), Trajectory
Slovakia Dispersion (Lagrangian)
Slovenia Receptor model (PCA)
Spain Dispersion (Eulerian, Lagrangian, Gaussian)
Spain Receptor model (PCA, PMF, ME, CMB), Trajectory
Spain Receptor model (PCA-APCS, PMF, UNMIX)
UK Dispersion (Gaussian-Lagrangian)

Phase 2 results: Type of models used for SA
Dispersion models (61% of the reported studies) and receptor models (61% of the reported studies) are equally used Trajectory models are less frequently used (28% of the returned forms) and always complementary to receptor or dispersion models.
0 10 20 30 40 50 60 70
Receptor
Eulerian
Lagrangian
Trajectory
Gaussian
CFD
Percentage of model type used for SA by different EU countries
Countries % Questionnaires %

Phase 2 results: Type of receptor models used for SA
PMF is the preferred receptor model (50% of countries, 44% of q/naires). The second preferred is CMB (42% of countries, 39% of q/nairs), followedby PCA and UNMIX (both in 17% of countries and 11% of q/naires).
0 5 10 15 20 25 30 35 40 45 50
PMF
PCA
CMB
UNMIX
ME
Lenschow
Percentage of receptor model type used for SA by different EU countries
Countries % Questionnaires %

The use of Receptor Models in SA (1)
Figures Claudio Belis & Federico Karagulian, 2011
• Dramatic increase in the number of publications dealing with SA and RM in scientific literature during the last decade. PMF is by far the most used tool worldwide. • USA and South East Asia are leaders in the application of these techniques and have dedicated monitoring networks for speciated PM. • In Europe there is an increasing interest but the lack of long term databases is limiting this development.

Presentation of the RM Intercomparison outline and timeline
JRC prepared and distributed a real world database to participants (20 groups from 13 countries).
The characteristics of the real world database, the supplementary information and the result reporting templates distributed to participants were explained.
There will be two step procedure: A progress report with the evaluation of a real world database
expected by the end of 2011. There will be a meeting to discuss first step and distribute an
artificial database. Final meeting will likely take place in June 2012.

The need for model validation
Uncertainties in emissions and models (e.g. secondaryorganics, nitrate partitioning, meteorological variability)
Models have to be assessed to ensure that they meet certainquality objectives recommended for regulatory use
Common methodologies for model validation and evaluation:1. Comparison with data from dedicated monitoring
campaigns to test model accuracy and representativity(monitoring data accuracy and coverage is essential)
2. Model intercomparison studies: provide useful information on model accuracy and reliability reveal model limitations for specific pollutants, spatial scales and
applications through similar exercises, hybrid models or combined model
application may emerge as innovative solutions to reduceuncertainty

Phase 2 results: SA evaluation methods used
A high percentage (89%) of reported SA studies by EU member states have evaluated their results
0 10 20 30 40 50 60 70
No evaluationModel intercomparison
Comparison with targeted measurementsStatistical evaluation
Comparison with literature studiesComparison with existing emission data
Model evaluationCombined use of models & measurements
Evaluation of SA methodology performed by different EU countries
Countries % Questionnaires %

Comparison between model results and data from measurement campaigns (58% of countries, 61% of studies)
Model intercomparison (25% of countries, 33% of studies) Greece and Spain: different receptor models were applied for SA
and their results were compared. Spain: results from different dispersion model types were
compared to evaluate NO2 and O3 SA results. Germany and the Netherlands: HYSPLIT back-trajectories were
performed to evaluate receptor model SA results. Model validation (33% of countries, 22% of questionnaires)
Finland, Slovakia, Lithuania and UK: comparison and statistical evaluation of calculated pollutant concentrations against measured values
Spain, Italy: model sensitivity runs to evaluate dispersion model SA results for NOx
Phase 2 results: SA evaluation methods used
Existing emission data and emission inventories were used for SA evaluation in questionnaires returned by Italy, Finland and Spain (25% of studies, 22% of countries).
Statistical evaluation (17% of countries and 11% of studies), comparison with literature studies for the area of interest (17% of countries and 11% of studies) and the combined use of model results and meteorological observations (8% of countries, 6% of studies)
No particular approach for calculating uncertainties was reported
Phase 2 results: SA evaluation methods used

Relevant to the Air Quality Directive and its requirements related to SA issues The Directive requires chemical analyses of possible indicator
compounds (sodium, calcium) only for PM2.5 The Directive puts emphasis on measurements of particulate matter
mass for PM10 and PM2.5, but measurements of many additional PM composition parameters are needed for realistic receptor modelling
Relevant to specific modelling problems PM mass underestimation by CTM models due to:
Lack of knowledge regarding aerosol processes Underestimation of aerosol organic matter Inability to realistically simulate the influence of local scale
processes, particularly in urban areas Models that do not account for changing source release heights
across different land surfaces
Phase 2 results: Points raised in responses (1)

Relevant to SA validation and QA/QC issues Well documenteed QA/QC procedures for input data and model
use are generally lacking Uncertainties largely related to emission inventories (e.g. smaller
industry emissions may not be well represented) Variability in SA accuracy depending on the pollutant (e.g.
pollutants that are more susceptible to resuspension) Need for validated models that can be used by non-experts and
guidance for result interpretation Need for comparability among receptor modelling results (what
are the causes, criteria to decide on which are more accurate)
Phase 2 results: Points raised in responses (2)
Relevant to guidance needs and harmonisation Which markers should be used for each specific source What is the appropriate data size that can be used and at low cost List of appropriate receptor models in relation to the AQD Need for standardisation to facilitate intercomparison and to
recommend best practices according to pollutants
Phase 2 results: Points raised in responses (3)

Phase 2 results:Conclusions
The results confirm the simultaneous use of different modelling tools and methods for SA.
The majority of the reported studies have applied some SA evaluation methodology.
Limited information was reported on the estimation of uncertainty and several answers have commented on the need for a guidance for SA evaluation.
Uncertainty is in a large degree linked to the uncertainty related to input data used for the SA calculations but needs to be quantified and reported.

Thanks for your attention!
http://fairmode.ew.eea.europa.eu/