1.5-degree lifestyles club of rome d-mat towards a fair
TRANSCRIPT

1
1.5-Degree LifestylesTowards A Fair Consumption Space for All
1.5-Degree Lifestyles: Towards A Fair Consumption Space for All
Repo
rt
Club of Rome • D-mat • IEEP • IGES • Hot or Cool Institute KR Foundation • ClimateWorks Foundation • Sitra

2
1.5-Degree LifestylesTowards A Fair Consumption Space for All

3
1.5-Degree LifestylesTowards A Fair Consumption Space for All
1.5–Degree Lifestyles: Towards A Fair Consumption Space for All
Report

1.5-Degree LifestylesTowards A Fair Consumption Space for All
Suggested citationLewis Akenji, Magnus Bengtsson, Viivi Toivio, Michael Lettenmeier, Tina Fawcett, Yael Parag,Yamina Saheb, Anna Coote, Joachim H. Spangenberg, Stuart Capstick, Tim Gore, Luca Coscieme, Mathis Wackernagel, Dario Kenner. 2021. 1.5-Degree Lifestyles: Towards A Fair Consumption Space for All. Hot or Cool Institute, Berlin.
Copyright Hot or Cool Institute, Berlin. October 2021.
ISBN 978-3-98664-001-9 (Print/paperback)ISBN 978-3-98664-002-6 (PDF)
Editing and proofreading Erik Assadourian
Graphic design Jalo Toivio DesignGraphics Koponen+HildénCover Photo Ryoji Iwata / Unsplash
Printed on Nautilus Classic, 100% recycled paperPrinted by Pinguin Druck GmbH, Berlin
Report
1.5–Degree Lifestyles:Towards A Fair Consumption Space for All
This report was produced thanks to generous financial support from

Coordinating Lead Author
Lewis Akenji (Hot or Cool Institute, Germany)
Authors Magnus Bengtsson (Hot or Cool Institute, Germany)Viivi Toivio (D-mat ltd., Finland; Hot or Cool Institute, Germany)Michael Lettenmeier (Aalto University, Finland; D-mat ltd., Finland)
Contributing Authors Tina Fawcett (Environmental Change Institute, University of Oxford, United Kingdom)Yael Parag (School of Sustainability, Interdisciplinary Center Herzliya, Herzliya, Israel)Yamina Saheb (Institute of Geography and Sustainability, University of Lausanne, Switzerland)Anna Coote (New Economics Foundation, United Kingdom)Joachim H. Spangenberg (Sustainable Europe Research Institute, Germany) Stuart Capstick (Economic and Social Research Council, United Kingdom)Tim Gore (Institute for European Environmental Policy, Belgium)Luca Coscieme (Hot or Cool Institute, Germany)Mathis Wackernagel (Global Footprint Network, United States of America)Dario Kenner (School of Global Studies, University of Sussex, United Kingdom)Jari Kolehmainen (D-mat ltd., Finland)
Reviewers Eva Alfredsson (KTH Royal Institute of Technology, Sweden); Garrette Clark (United Nations Environment Programme); Adriana Zacarias Farah (United Nations Environment Programme); Sumaya Yusuf Hasan (Arabian Gulf University, Bahrain); Andries Hof (PBL Netherlands Environmental Assessment Agency, Netherlands); Hui Jing (Energy Foundation China, China); Takeshi Kuramochi (NewClimate Institute for Climate Policy and Global Sustainability, Germany); Sylvia Lorek (Sustainable Europe Research Institute, Germany); Lucie Middlemiss (University of Leeds, United Kingdom); Oksana Mont (International Institute for Industrial Environmental Economics at Lund University, Sweden); Marja Salo (Hot or Cool Institute, Germany); Yuli Shan (University of Groningen, Netherlands); Steven Stone (United Nations Environment Programme); Vanessa Timmer (One Earth Initiative Society, Canada); Elisa Tonda (United Nations Environment Programme); Nicole van den Berg (Copernicus Institute of Sustainable Development, Utrecht University, Netherlands)
Additional contributions and support, thanks to Kate Power (Hot or Cool Institute, Germany)Elias Drost (Environmental Change Institute, University of Oxford, United Kingdom)Jennie Broman (Hot or Cool Institute, Germany)Ryu Koide (National Institute for Environmental Sciences, Japan)Simone Re (Erasmus Intern, Hot or Cool Institute)Karla Still (Intern, D-mat ltd., Finland)
Table of ContentsAbbreviations 9Foreword 10Executive Summary 12
Section I: A Budget for Living Within Limits 20
1. Towards a Fair Consumption Space 21 1.1. The urgency of sustainable lifestyles 21 1.2. Shrinking budget: the closing window for staying below 1.5 degrees 23 1.3. Worsening inequality 24 1.4. Defining a fair consumption space 25 1.5. About the 1.5-degree lifestyles report 27
2. Methods and Technical Notes 32 2.1. Consumption-based accounting and targets 32 2.2. Calculating bottom-up lifestyle footprints 33 2.3. Remaining carbon budget and reduction targets 36
Section II: Hotspots and Options for Footprint Reductions 40
3. Lifestyle Carbon Footprints 41 3.1.Comparing lifestyle carbon footprints 43 3.2. Overall patterns and analysis per economic grouping 44
4. Options and Priorities for Shrinking Lifestyle Carbon Footprints 59 4.1. Reduce, shift, improve 59 4.2. Estimated impacts of low-carbon lifestyle options 60
Section III: Policy Approaches For A Fair Consumption Space 72
5. Choice Editing: Taking Out the Harmful Consumption Options 74 5.1. History and common examples of choice editing 74 5.2. Mandate for sustainability choice editing 75 5.3. Implementing choice editing 75 5.4. Assessments for choice editing 78
6. Universal Basic Services: Social Guarantee for a Fair Consumption Space 80 6.1. Meeting human needs 80 6.2. A normative framework 81 6.3. Investing in the social infrastructure 82 6.4. Conclusion 86

7. Sufficiency: How Much is Enough to Stay Below 1.5°C? 90 7.1. Understanding the sufficiency concept 90 7.2. Sufficiency practices 91 7.3. Sufficiency levels in climate mitigation scenarios aiming at 1.5°C temperature target 92
8. Has the Time Come for Carbon Rationing? 94 8.1. Rationing: a socially just response to the climate crisis 94 8.2. Carbon rationing as an idea 94 8.3. Contemporary and historical resource rationing 94 8.4. Policy design 96 8.5. Mechanisms of change 99 8.6. Comparison with a carbon tax 101 8.7. Next steps 102
9. International Carbon Allowances in Achieving a Fair Consumption Space 103 9.1. Taxing or rationing 103 9.2. Institutions for international rationing 103 9.3. International rationing and the global trade regime 104 9.4. Near term perspectives 105 9.5. Not letting the best become the enemy of the good 105
Section IV: Scenarios for Living Within a Fair Consumption Space 108
10. Need for Both Individual and System Change 107 10.1. Carbon budget scenarios 108
Section V: The Way Forward 122
11. Conclusions 123 11.1. Current lifestyle carbon footprints 123 11.2. Pathways to a fair consumption space 123
12. Thinking Forward 125
References (Sections I–V) 128
Annexes
Annex A. Methodology of Current Lifestyle Footprint Estimation Online* Annex B. Country-specific Results 144 B.1. Country-specific lifestyle carbon footprints: major components and hotspots 144 B.2. Supplementary table of results 151Annex C. Assumption of Low-Carbon Option Online*Annex D. Carbon Budget Scenarios Online*
References (Annex B) 162
*Annexes A, C and D published online only on the website of the Hot or Cool Institute: hotorcool.org

8
1.5-Degree LifestylesTowards A Fair Consumption Space for All
Figures
1.1. A Fair Consumption Space for Sustainable Lifestyles 26
2.1. Comparison of the boundary of GHG emissions and footprint 33
3.1. Lifestyle carbon footprint budget from shortlisted mitigation pathways 423.2. Lifestyle carbon footprint budget comparable with 1.5°C target (without or with less use of negative emission technologies) 423.3 Carbon footprint and its breakdown between consumption domain and globally unified targets for the lifestyle carbon footprints 433.4. Food-related carbon footprint (tCO₂e/cap/yr) and its breakdown between consumption components 453.5. A comparison of carbon footprints and their breakdown (food, in kgCO₂e/cap/year 2019) in higher-income countries (A) and upper and lower middle-income countries (B) 46–473.6. Housing-related carbon footprint (tCO₂e/cap/yr) and its breakdown between consumption components 483.7. A comparison of carbon footprints in higher-income countries (A) and upper and lower middle-income countries (B) (housing energy, in kgCO₂e/cap/year 2019) 49–503.8. Transport related carbon footprint (tCO₂e/cap/yr) and its breakdown between consumption components 523.9. A comparison of carbon footprints in higher-income countries (A) and upper and lower middle-income countries (B) and their breakdown (transport, in kgCO₂e/cap/year 2019) 53–543.10. Consumer goods, leisure, and services related carbon footprint (tCO₂e/cap/yr) and its breakdown between consumption components 57
4.1. Key approaches for lifestyle carbon footprint reduction: absolute reduction, modal shift, and efficiency improvement 594.2.–11. A comparison of estimated per-capita carbon footprint reduction impacts (kgCO₂e/capita/year) of low-carbon lifestyle options 4.2. Canada 624.3. Finland 634.4. United Kingdom 644.5. Japan 654.6. China 664.7. South Africa 674.8. Turkey 684.9. Brazil 694.10. India 704.11. Indonesia 71
6.1. The Social Guarantee 816.2. Individual and collective means of securing life’s essentials 826.3. Health carbon footprints per capita, selected countries, 2014 85
E.1. Co-benefits of adopting 1.5-Degree Lifestyles 87
8.1. Key design elements of a carbon rationing policy, underlined choices are those combined in a Personal Carbon Allowances policy 968.2. How PCA mechanisms could influence energy-use decisions and lead to low carbon choices 99
10.1.–9. Current lifestyle carbon footprints and estimated consumption- and system-focused scenarios with needed adoption rates of selected low-carbon lifestyle options to meet the 1.5-degree target by 2030 10.1. Canada 11210.2. Finland 11310.3. United Kingdom 11410.4. Japan 11510.5. China 11610.6. South Africa 11710.7. Turkey 11810.8. Brazil 11910.9. India 120
Tables
2.1. Examples of the domain breakdown into components, sub-components and items 342.2. Shortlisted scenarios with reliance on carbon sinks 372.3. Shortlisted scenarios with demand-side measures 373.1. Current annual lifestyle carbon footprint per capita and reduction targets for case countries 446.1. In-kind benefits as a share of disposable income by quintile, average over 27 OECD countries 837.1. Sufficiency levels in 2050 for selected services in scenarios based on the sufficiency principles 938.1. Comparison between a PCA scheme and a carbon tax 101
Text boxes
A: Key features of the 1.5-degree lifestyles approach 29B: Lessons from research on enabling sustainable lifestyles 30–31C: Examples of sustainability choice editing in transport 77D: The polluter elite: Recognising inequalities in consumption 79E: Wellbeing: linking sustainable lifestyles, climate change, and health 87F: Carbon rationing in the UK 95G: Why trading? 97H: Winners and losers 98

9
1.5-Degree LifestylesTowards A Fair Consumption Space for All
Abbreviations
10YFP 10-Year Framework of Programmes for Sustainable Consumption and Production
AR5 IPCC Fifth Assessment Report
BECCS Bioenergy with carbon capture and storage
CBDR Common but differentiated responsibilities and respective capabilities
CCS Carbon capture and storage
CH4 Methane
CO₂ Carbon dioxide
CO₂e Carbon dioxide equivalent
DLE Decent living energy
GDA Guideline daily amount
GDP Gross domestic product
GHG Greenhouse gas
GLIO Global link input-output
GNI Gross national income
GTAP Global Trade Analysis Project
HFCs Hydrofluorocarbons
I/O Input-output tables
IPCC Intergovernmental Panel on Climate Change
LCA Life cycle assessment
LCF Lifestyle Carbon Footprint
LED Low energy demand
LNG Liquefied Natural Gas
LPG Liquefied Petroleum Gas
LULUCF Land use, land use change and forestry
NO2 Nitrous Oxide
OECD Organisation for Economic Co-operation and Development
PCA Personal carbon allowance
PCT Personal carbon trading
PFCs Perfluorocarbons
SDG Sustainable Development Goal
SF6 Sulphur hexafluoride
SG Social guarantee
SME Small and Medium Size Enterprise
UBI Universal basic income
UBS Universal basic services
UN United Nations
UNEP United Nations Environment Programme
UNFCCC United Nations Framework Convention on Climate Change

10
1.5-Degree LifestylesTowards A Fair Consumption Space for All
Foreword
S ince its establishment more than fifty years ago, the Club of Rome has drawn attention to the existence of ecological limits and alerted the world to the risks of transgress-ing those boundaries. The Club of Rome
has regularly warned of the risks of multiple crises and tipping points. This is our reality today as we grapple with the multiple shocks across the globe, from the pan-demic to the changing climate. Over these five decades, the Earth system´s limited capacity to assimilate rapid population growth and the direct greenhouse gas effects from ever increasing material consumption and waste-ful lifestyles has emerged as one of the most pressing global challenges for human society. Despite strong and repeated warnings from the scientific community, nu-merous high-level gatherings and pledges, and a grow-ing climate movement across the world, global emis-sions of climate-damaging gases are still on the rise.
With escalating impacts of climate change—such as the massive wildfires, record heat waves, and devastat-ing floods we have witnessed recently—coupled with increasing biodiversity loss and ecosystem stress, the world is now at a critical juncture. The amount of green-house gases that can be emitted without pushing glob-al warming above 1.5°C is now frustratingly small and humanity needs to consider carefully how to spend this limited “budget,” which can rightly be seen as a global commons belonging to all of humanity.
The 1.5-Degree Lifestyles report makes a valuable contribution to the discussions on how to tackle climate change by drawing attention to the need for significant lifestyle changes, especially in high-income countries and among the wealthy. The need for lifestyle chang-es, although often acknowledged in theory, is still not
1 IRP (2019). Global Resources Outlook 2019: Natural Resources for the Future We Want. A Report of the International Resource Panel. United Nations Environment Programme. Nairobi, Kenya.
well-reflected in government policies. On the contrary, many policies and infrastructure investments continue to enable and incentivise high-carbon behaviour and destructive consumption patterns. This report’s con-clusion that technological improvements in the emis-sion-intensity of goods and services must be accom-panied with major lifestyle changes towards reduced consumption is especially pertinent and should form the basis for emergency governmental plans of action.
We are in a planetary emergency and governments must act as such. Emergency plans of action must focus on the essential goal of curbing GHG emissions and im-mediately halt dangerous feedback loops between bio-diversity loss and ecosystems destruction. By focusing on consumption, we can solve several problems at once, reducing our carbon emissions whilst regenerating our biodiversity stocks and safeguarding ecosystems. Since 1970, when the Club of Rome’s seminal report, “The Limits to Growth” was written, the global extraction of materials grew from 27 billion tons a year to 92 billion tons by 2017. This is likely to double again by 2060, giv-en current trends1.
The bitter truth is that the use of natural resources cannot continue to increase year after year. It must lev-el off quickly – and then contract. Otherwise, there is no possibility of managing the well-being of 9–10 bil-lion people in the long run—perhaps more—within the planetary boundaries. The challenge is that this contrac-tion must take place at the same time as both energy and material use in low-income countries increases. This is required for the peoples of these countries to acquire a decent standard of living. The inequality in the use of ma-terials is flagrant today, with low-income countries us-ing 2 tons of materials per capita in 2017 compared to

11
1.5-Degree LifestylesTowards A Fair Consumption Space for All
27 tons per capita in high-income countries. In fact, while the material footprints of low-income countries managed to drop from 2.5 to 2 tons per capita, those of high-income countries grew from 20 to 27 tons per capita.
The curve of material consumption corresponds well to the data we have over greenhouse gas emissions per capita. The richest 10% of the world population were responsible for 50% of the GHG pollution added to the atmosphere between 1990 and 2015. The richest one percent accounted for 15 percent of emissions during the same period.
The only transition, moving forward, is three-fold: first, a redistribution of material resources between rich and poor countries and between rich and poor people in all countries including clear restrictions on the ma-terial consumption of the rich part of the world’s popu-lation. Second, a transition to a far more resource-effi-cient economy—from linear to circular and regenerative material flows—coupled with measures to deal with re-bound effects. Finally, shifts in purchasing power to-wards a shared services-driven economy fostering collective well-being rather than continued individual material consumption.
What will be needed urgently is a value shift—re-placing, or at least complementing, material consump-tion as the main objective in life. Instead, what’s needed is a wellbeing economy that fosters true quality of life factors such as a purposeful life, health care, healthy ecosystems and a stable climate, safe conditions in the workplace, education, and access to and participation in cultural activities and family life. The pandemic has shown us how important the above true quality of life factors are, no matter where we live. Countless research has shown that the priority given in contemporary so-ciety to growth at all cost, to profitability, and material consumption has not materialized in greater collective well-being or individual happiness for most.
By putting forward the concept of a Fair Consump-tion Space for All, the report highlights the importance
of justice and equity in the transition to a low-carbon society. With limited room for continued emissions—and, particularly, for increasing material footprints among the well-to-do—we need to consider both how to effectively meet basic needs everywhere and how to rein in excessive carbon-intensive consumption. It is no exaggeration to say that overcoming this du-al challenge is the greatest task of our current gener-ation. Taking on this task calls for responsible leader-ship and bold action at all levels but, if we succeed, will demonstrate that we can indeed be good ancestors to future generations.
If applied, the recommendations from the 1.5-Degree Lifestyles report will bring us back to a status of good an-cestry. Some of the policy proposals herewith may be perceived as too far-reaching and intruding on privacy and the rights of the individual. But we are in a precari-ous situation. Carbon emissions must be brought to net zero in less than a few decades. This means we have to explore all possible means at our disposal and design the future we want to truly emerge from the current planetary emergency. The 1.5-Degree Lifestyles report is a bold attempt to do just that.
Sandrine Dixson-DeclèveCo-PresidentClub of Rome
Anders Wijkman Honorary PresidentClub of Rome

12
1.5-Degree LifestylesTowards A Fair Consumption Space for All
Executive Summary
H istory of government commitments and failures on climate change shows that technological interventions and offset-ting emissions, which is central to the net-zero strategy, has been teased for
over three decades leading to the worsening state of affairs in which we now find ourselves—what the IPCC describes in its most recent report as “irreversible” damage to the environment, with worse to come unless we change course (IPCC 2021b). As this report demon-strates, changes in predominant lifestyles, especially in high-consuming societies, will determine whether we meet commitments in the Paris Agreement and avoid dire consequences of climate change. Overall reduc-tions in levels of consumption must be achieved, while attending to growing social tensions.
An indictment of the current unsustainable econom-ic development paradigm is the widening gap between the rich and the poor. The emissions share of the 10% richest, highest-emitting individuals ranges from 36-49% of the global total, while that of the poorest, low-est-emitting 50% of the world’s population ranges from 7-15% of the total (UNEP 2020). There is observed in-equality among countries, inequality within countries, inequality across races and between genders, and ine-quality across generations. And there are multiple ex-pressions of inequality: of income, of health, of access to natural resources and public services, of participation in decision-making processes, for example, and nota-bly in terms of inequality of carbon emissions. Calls for
climate justice are already growing loud; these tensions will only get worse as competition heightens over di-minishing resources and the remaining carbon budget to stay within sustainable limits.
The COVID-19 pandemic and the consequent unprec-edented lockdown revealed what could happen if the world is caught in an unplanned transition. The deaths, restrictions on visiting friends and family, runs on ne-cessities in shops, food shortages, and increased depres-sion and anxiety, were just as shocking as the partial col-lapses in economic, health, security, and transportation systems that society had come to rely upon. By even the most conservative IPCC assessments, runaway tempera-ture rise would produce a climate crisis several times the magnitude of the COVID pandemic. A planned transition (rather than a chaotic one as seen with the pandemic) to a society with sustainable lifestyles remains central to building a peaceful future in harmony with the ecologi-cal rhythm and balance of our planet.
Lifestyles embrace much more than just consump-tion patterns and behaviours. It includes non-econom-ic aspects of our lives, such as caring for children or elderly parents, spending time with our friends, play, volunteering, or activism. All of these potentially af-fect, directly or indirectly, our wellbeing and our car-bon footprint. Lifestyles are how we consume, and also how we relate to one another, what kind of neighbours, friends, citizens and parents we are, what kinds of val-ues we nurture, and how we let those values drive our choices.

13
1.5-Degree LifestylesTowards A Fair Consumption Space for All
While generally overlooked in our pursuit of techno-logical solutions to climate change, failing to shift the lifestyles of nearly eight billion human beings means we can never effectively reduce GHG emissions or suc-cessfully address our global climate crisis. This be-comes especially complex, considering that the most impoverished populations will need to consume more, in order to achieve basic levels of wellbeing. Oxfam es-timates that to reach the global average per capita emis-sions level by 2030 consistent with limiting global heat-ing to 1.5°C, the per capita consumption emissions of the richest 10% of the global population should be re-duced to about a tenth of their current level, while those of the poorest 50% could still increase by two to three times their current level (Oxfam 2020). Humanity will need to converge into “a fair consumption space” (See Figure A).
This report introduces the concept of a fair con-sumption space—an ecologically healthy perimeter that supports within it an equitable distribution of re-sources and opportunities for individuals and societies to fulfil their needs and achieve wellbeing. Within this space, there are a range of regenerative options (which this report details), but there are also clear demarcat-ing limits to over- and underconsumption: with a cap in emissions, overconsumption by one person affects the prospects of another, and encroaches into anoth-er’s consumption space, requiring collectively working toward a more equitable distribution of limited carbon budgets.
About this report
This report continues the science-based approach of linking concrete changes in lifestyles to measurable impacts on climate change in order to keep with the 1.5-degree aspirational target of the Paris Agreement on climate change. The 1.5-degree lifestyles approach examines GHG emissions and reduction potentials using consumption-based accounting, which cov-ers both direct emissions in a country and embodied emissions of imported goods while excluding emis-sions embodied in exported goods. It analyses life-style carbon footprints of ten sample countries, rep-resenting high-, middle-, and low-income countries, and identifies hotspots, or consumption domains with the highest impact on the environment.
The report also fills the knowledge gap arising from most prevailing climate scenarios that underplay the potential contributions of lifestyle changes to climate change mitigation and focus entirely or mainly on de-veloping new technologies and on changes in produc-tion. For each country in the report, the footprint gap between current and sustainable target levels are deter-mined for the years 2030, 2040, and 2050. To bridge these gaps, options for reducing footprints in each country are introduced, estimating potential impacts from various adoption rates in each country. Finally, two scenarios are developed for each country, one focused on systems change and another on behaviour change, showing in-dicative pathways for achieving the 2030 target.
Figure A. A Fair Consumption Space for Sustainable Lifestyles
Overconsumption(Environmentally unsustainable)
Underconsumption(Socially unsustainable)
FAIRCONSUMPTION
SPACE
Reduceconsumption
Floor(Social minima)
Ceiling(Environmental maxima)
Increaseconsumption
Food
Leisure
Housing
Services
Transport
Consumergoods

14
1.5-Degree LifestylesTowards A Fair Consumption Space for All
Targets and gaps
The results show massive gaps between current per capita footprints and targets; the lifestyle carbon foot-print target for 2050 is exceeded in all countries an-alysed, requiring rapid and radical reductions. Es-timates of current annual average lifestyle carbon footprints per person of countries analysed, as of 2019, are: Canada: 14.2 tCO₂e, Finland: 9.7, United Kingdom: 8.5, Japan: 8.1, China: 5.0, Turkey: 4.9, South Africa: 4.9, Brazil: 3.2, India: 3.0 and Indonesia: 2.2 tCO₂e (Fig-ure C). In comparison, we need to aim for a lifestyle carbon footprint target of 0.7 tCO₂e by 2050, with in-termediary targets of 2.5 and 1.4 tCO₂e by 2030 and 2040, respectively (Figure B). These targets are in line with the 1.5°C aspirational target of the Paris Agree-ment and for global peaking of GHG emissions as soon as possible without relying on the extensive use of neg-ative emission technologies.
The footprint gaps between actual lifestyle and the targets show that footprints in high-income countries need to be reduced by 91–95% by 2050. Upper-mid-dle income countries already need to reduce their foot-prints by 68–86% by 2050. Even lower-middle income countries need to reduce footprints by 76% in order to meet the 2050 target.
7.0
Carbon Footprint Budget (tCO₂e/cap/yr)
6.06.3
5.4
2.5
1.4
0.70.3
4.6
3.93.4
2.0
1.0
0.4
5.0
4.0
3.0
2.0
1.0
0.0
Total carbon footprint 1.5 degree (tCO₂e/cap/yr)
Lifestyle carbon footprint 1.5 degree (tCO₂e/cap/yr)
Note: Global total emission budget was calculated as a mean of “A2” scenario from Ranger et al. (2012) and “Low Non-CO₂ “ and “All Options” scenarios from Van Vuuren et al. (2018) for 1.5D Sce-nario. The emission budget was divid-ed by population projections from Unit-ed Nations (2017) and multiplied by the household footprint share estimated by Hertwich and Peters (2009) to estimate lifestyle carbon footprint budget.
2010 2030 2050 2070 2090
Figure 2.2. Lifestyle carbon footprint budget comparable with 1.5 °C target (without or with less use of CCS)
Figure B. Lifestyle carbon footprint budget comparable with 1.5°C target (without or with less use of negative emission technologies)
Hotspots
The report explores impacts of consumption in six do-mains: food; housing, personal transport; goods; lei-sure; and services, and uses these to aggregate total life-style carbon footprints and reveal hotspots in the ten surveyed countries. Focusing efforts to change lifestyles in relation to these domains would yield the most ben-efits; the three domains of food, housing, and personal transport tend to have the largest impact (approximate-ly 79%) on total lifestyle carbon footprints.
Food consumption impacts show relatively similar footprints between the case countries (Figure D), with the exception of India and Indonesia where the over-all meat consumption is notably lower than in the other countries. The reduction required in the footprint for food by 2030 ranges from 39% to 68% for all countries besides India and Indonesia where it is only 8%. In ad-dition to meat, dairy products are a major contributor to footprints, especially in high-income countries, such as Canada and Finland. Different food cultures are re-flected in the footprints as different consumption pat-terns between case countries: a primarily vegetarian di-et in India shows the value of protecting this low-impact, healthy diet. Meat consumption by a Canadian (160 kg per year) is four times that eaten by a Japanese (40 kg

15
1.5-Degree LifestylesTowards A Fair Consumption Space for All
Globally unified targets for the lifestyle carbon footprints
2050 20300.7 2.5 tonnes CO2e / capita / year
Indonesia
India
Brazil
Turkey
South Africa
China
Japan
United Kingdom
Finland
Canada
Food 1.8 1.6 Transport 3.7 1.4 1.2 Total 9.7 tonnes CO2e / capita / year
14.2Food 2.3 Housing 3.1 Transport 5.0 Goods 2.5 1.4
Leisure + Services
Transport 3.3Food 1.6 Housing 1.9 1.0 .8 8.5
Food 1.4 Housing 2.4 2.0 1.0 1.2 8.1
.81.3 1.2 1.2 .4 5.0
Food 1.7 1.0 1.2 .7 4.9
1.2 1.7 1.0 .6 4.9
Food 1.9 .5 .6 3.2
.8 1.7.4 3.0
.8 .6 .6 2.2
Note: Average lifestyle carbon footprint of country estimated as of 2019. The horizontal lines indicate 1.5D lifestyle footprint targets for 2030 and 2050 (1.5 °C without/less use of CCS).
Figure C. Carbon footprint and its breakdown between consumption domain and globally unified targets for the lifestyle carbon foot-prints.
per year) with no discernible additional nutritional ben-efits for the Canadian.
In the housing domain, non-renewable grid electric-ity is an important source of lifestyle carbon footprints in all countries, as shown in Figure E. In addition, gas used for heating and cooking is another major contribu-tor to the footprint of some countries, such as the United Kingdom, Japan, and Turkey. Large average living spac-es and higher living standards are reflected as higher footprints in high-income countries. This is especially the case in Canada and Finland, where large living spac-es together with long and cold winters are increasing the overall energy demand. Nevertheless, the housing foot-print is notably higher in Canada due to relatively high consumption of carbon-intensive energy sources, such as natural gas. In Finland, a high share of the heating en-ergy (the largest share of overall energy consumption) is based on district heating which has lower intensity due to the relatively high share of renewable energy sourc-es. In Japan, overall energy demand is the lowest of the high-income countries studied but is mostly based on non-renewable energy sources, which is similar in the upper and lower middle-income countries studied.
Footprints for personal transport are highest in the high-income countries due to a high overall transport demand and a high share of car use and carbon-inten-
sive air travel (Figure F). However, Japan has a high mo-bility demand but a notably higher share of public trans-port use than other high-income countries while India has a similar transport demand as Finland but motor-cycles are responsible for the largest share of transport demand and footprint. In countries with a lower share of car use, transport demand is mainly focused on public transportation (bus and train), except in India and In-donesia, where motorcycles are the biggest contributor to both mobility demand and footprints. While Indone-sia and Brazil would need to decrease the carbon foot-prints of personal transport for 2030 by 25% and 34%, respectively, all other countries require reductions in the range of 51% to 91%.
Footprints from other domains are strongly related with income levels, as shown in Figure G. In particu-lar, leisure related footprints are the lowest in coun-tries with the lowest average per capita spending, such as India and Indonesia. Consumer goods account for the greatest share of the footprint in most countries. Cana-da has a higher footprint compared to other countries, due to notably higher intensity for consumer goods and leisure related services. In middle-income countries the spending is focused on necessities, such as clothing and furniture/room coverings. The share of service-related footprints vary across countries and income groups.

16
1.5-Degree LifestylesTowards A Fair Consumption Space for All
0 0.5 1.0 1.5 2.0 2.5 3.0 3.5
Canada .52 Non-renewable .76 Renewable .68 Gas .54 Oil .36 N-r 3.05
Finland Non-r .51 R Oil Non-r .55 1.57
United Kingdom .35 Non-r .36 Gas .93 Oil 1.89
Japan .48 Non-renewable 1.32 Gas .34 Oil W 2.43
China .37 Non-r .56 G N 1.19
South Africa Non-renewable .79 1.04
Turkey Non-r .45 Gas Oil .55 N-r 1.69
Brazil N G .50
India C N-r G .43
Indonesia N-r G OW .59
Footprint, tonnes CO₂e / capita / year
Figure E. Housing-related carbon footprint (tCO₂e/cap/yr) and its breakdown between consumption components
Note: Construction/maintenance covers emissions related to the living space (m2/person).
0 0.5 1.0 1.5 2.0 2.5
Canada Meat 1.39 Dairy .34 E C V F Bev .19 O 2.27
Finland Meat .68 Dairy .55 E F C V F Bev .21 O 1.83
United Kingdom Meat .69 Dairy .37 F C V Bev O 1.59
Japan Meat .33 Dairy F Cereals Veg F Bev O 1.40
China Meat .52 D E F Cereals Veg .19 B O 1.33
South Africa Meat 1.23 D C V B O 1.71
Turkey Meat .40 Dairy .32 C Veg F O 1.21
Brazil Meat 1.11 Dairy .24 C Bev Other 1.88
India Dairy Cereals .42 V O .78
Indonesia M F Cereals .41 V O .80
Footprint, tonnes CO₂e / capita / year
Animal products Other foodsEggs
Fruits
BeveragesBeans+nuts
Vegetables
Figure D. Food-related carbon footprint (tCO₂e/cap/yr) and its breakdown between consumption components

17
1.5-Degree LifestylesTowards A Fair Consumption Space for All
0 0.5 1.0 1.5 2.0 2.5 3.0 3.5
Canada .52 Non-renewable .76 Renewable .68 Gas .54 Oil .36 N-r 3.05
Finland Non-r .51 R Oil Non-r .55 1.57
United Kingdom .35 Non-r .36 Gas .93 Oil 1.89
Japan .48 Non-renewable 1.32 Gas .34 Oil W 2.43
China .37 Non-r .56 G N 1.19
South Africa Non-renewable .79 1.04
Turkey Non-r .45 Gas Oil .55 N-r 1.69
Brazil N G .50
India C N-r G .43
Indonesia N-r G OW .59
Footprint, tonnes CO₂e / capita / year
Figure F. Personal transport related carbon footprint (tCO₂e/cap/yr) and its breakdown between consumption components
Figure G. Consumer goods, leisure, and services related carbon footprint (tCO₂e/cap/yr) and its breakdown between consumption components
0 1 2 3 4 5
Canada Car 3.54 Airplane 1.06 Bus .37 4.99
Finland Car 2.02 M Airplane 1.29 F B 3.65
United Kingdom Car 1.64 Airplane 1.44 R 3.25
Japan Car 1.25 Air .57 R 1.97
China Car .45 M Air B R 1.20
South Africa Car .72 A B R 1.20
Turkey Car .53 M Air .35 1.01
Brazil C Air B .64
India Car Motorcycle 1.18 B R 1.73
Indonesia C M A .57
Footprint, tonnes CO₂e / capita / year
Motorized private transport Flying Other
3.25Ferry
Rail
Note: Rail covers bullet, long-distance and local trains, as well as trams and metros; other public transportation covers local modes of transportation, such as auto-rickshaw in India and bajaj (three-wheelers) in Indonesia.
0 1 2 3 4
Canada Consumer goods 2.51 Leisure .68 Services .72 3.90
Finland Consumer goods 1.41 Leisure .54 Services .62 2.58
United Kingdom Consumer goods .97 Leisure Services 1.75
Japan Consumer goods 1.03 Leisure .58 Services .65 2.27
China Goods .41 L Services .71 1.25
South Africa Goods .73 L S .94
Turkey Goods .63 L S .95
Brazil G .22
India .01
Indonesia G S .25
Footprint, tonnes CO₂e / capita / year

18
1.5-Degree LifestylesTowards A Fair Consumption Space for All
Options and scenarios
Practical solutions will require three parallel types of ef-forts: absolute reductions in high-impact consumption (such as flying and driving less); modal shifts towards more sustainable options (such as shifting from driving to public transport or biking); and efficiency improve-ments (such as shifting to electric cars), to use three ex-amples from the transportation realm.
The options with large emission reduction poten-tials as revealed in this report are reducing car travel, air travel, meat consumption, and fossil-based energy usage. If these options are fully implemented they could reduce the footprint of each domain by a few hundred kg to over a ton annually. The magnitude of impacts would depend on adoption rates of actions by the public.
To present indicative pathways, this report analyses scenarios for which countries can meet the 2.5-ton tar-get for 2030. For each country it presents two scenarios: one prioritizing systems change (adjusting carbon in-tensity of lifestyles options) and one prioritizing behav-iour change (adjusting volume of consumption). Both in-tensity- and amount-adjusted carbon budget scenarios highlight the urgency of drastic lifestyle carbon footprint reductions in high-income countries, as the needed foot-print reductions of 69–82% require almost full (at least 95%) adoption of low-carbon lifestyle options in all coun-tries. Canada was an exception, as it is not able to meet the 2.5-ton target even with full adoption of the options applied in this report. Upper and lower-middle income countries also need lifestyle carbon footprint reductions of 23–50% by 2030, but pathways allow more freedom in terms of chosen actions and adoption rates, as well as the possibility of focusing on country-specific hotspots.
The results highlight the large potential lifestyle changes required across consumption domains in or-der to implement the Paris Agreement, and also imply
it is not an either-or question of technology or lifestyles but rather both—improvements to the energy system and technology as well as shifts in consumption pat-terns are required to achieve the ambitious climate targets.
Policies
With a diminishing carbon budget amid impacts of cli-mate change already being felt, growing social tension exacerbated by vast inequities in society, and a short timeline for action, we need every tool in the box, in-cluding options that may seem politically challenging. The report highlights a number of policy frameworks that may help society transition towards fair consump-tion within planetary boundaries. These recognise that significant lifestyle changes are, however, only possible if they occur within broader system change in the un-derlying economic and social conditions, and that the burden of change also includes communities, business-es and institutions, and government agencies.
Recommendations here deliberately focus on a few radical approaches that are not yet part of the main-stream climate discourse. This would hopefully broad-en the discussions on how to deal with the escalating climate emergency in an equitable manner and with-in a short timeframe. The first approach is taking out the harmful consumption options, through choice ed-iting. Choice editing is a traditional government ap-proach that has been primarily applied through the fil-ter of public safety, health, and security. However, in a climate emergency, governments need to incorporate and prioritise sustainability in their choice editing cri-teria. High impact options such as fossil-fuelled private jets and mega yachts, excessive meat consumption, and customer loyalty programs that encourage unnecessary

19
1.5-Degree LifestylesTowards A Fair Consumption Space for All
frequent flying and stays in wasteful hotels need to be edited out, for example, while innovation for more sus-tainable alternatives would need to be edited in.
The second approach requires setting limits for en-vironmentally harmful consumption and staying within those limits. The report asks the question of whether the time has come for carbon rationing. Rationing has been used in the past as a tool to regulate water shortages in times of droughts, and to ensure equitable availability of fuel and food when limited. Carbon rationing is rel-evant, since existing policies and programs are insuffi-cient for meeting carbon reduction targets, and because it is a policy idea that meets calls for socially just action on climate change. However, rationing can be complex and controversial and it is so far not clear what mecha-nism could be used to implement carbon rationing. At the very least, thoughtful conversations among politi-cians and the public are needed, and so is some bold ex-perimentation to implement such an approach.
The third set of policy approaches is intended to en-sure a more equitable wellbeing society. One recom-mendation is to adopt a sufficiency approach to the de-sign of policy and practical solutions. In contrast, and sometimes complementarily, to the dominant technol-ogy-driven efficiency approach with its open-ended in-crementalism, sufficiency prioritises needs-provision-ing with limits determined by the biophysical processes. A sufficiency approach will support a fair consumption space through a range of options for housing, personal transport, thermal comfort, and nutritional needs, for example, that are optimised for wellbeing within plan-etary boundaries. Another recommendation to ensure equity and guarantee access to basic needs for all, is to go beyond universal basic income and implement universal basic services (UBS). Meeting human needs through public services and other collective measures is more equitable, affordable, and sustainable than sim-
ply providing cash benefits to support individual mar-ket transactions. UBS are underscored by a social guar-antee, which recognises that everyone has basic human needs that enable them to participate with dignity in so-ciety; equitable access is based on needs, not ability to pay. UBS, to be provided through a combination of indi-vidual effort, organisations, and government mandates, would be determined for each society. In the UK, for ex-ample, these include: health and social care, education, housing, childcare, digital access, and transport.
Thinking forward
The final section puts forward some ideas on research policy and practice to accelerate the transformation to-wards a low-carbon society and a stable climate. Akin to annual GDP projections, national governments should announce annual emissions reductions targets, and es-tablish national carbon budgets. Sustainable Develop-ment Goal 12 on sustainable consumption and produc-tion is not sufficient on its own to carry the required global shifts in lifestyles. A midterm review of the SDGs needs to recognise its limits and boost the Goal through complementary programmes. One such programme is the 10-Year Framework of Programmes on sustainable consumption and production, which expires in 2022. The programme could be renewed and refocused on sustainable lifestyles and using a 1.5-degree lifestyles approach to boost SDG12 and link it to the Paris Agree-ment. More efforts also need to be put into creating vi-sions that can inspire people and guide society towards a just and sustainable future. These visions should show opportunity, centre on wellbeing, and engage the youth population that is heavily affected by climate anxiety and that is destined to live with our success or failure to create a sustainable future.

Section IA Budget for Living Within Limits
20

21
Section IA Budget for Living Within Limits
1 – Towards a Fair Consumption Space
1.1. The urgency of sustainable lifestyles
The future of our civilisation and its sustainability de-pend on resolving three key tensions that are already manifesting in increasingly disruptive ways across so-cieties: a tension between limited natural resources and the continuous extraction to feed our growth appetites; a tension between the socio-economic system and ine-qualities in distribution that continue to exacerbate ex-tremes of poverty and wealth; and a tension between the waste and pollution that we generate and the absorptive capacity of the planet (Akenji 2019). All three tensions derive from how society has been structured and how, at individual and collective levels, we define and pur-sue our needs and wants. Thus, far-reaching changes in how we live and consume are foundational to any at-tempts to address the sustainability challenge—in fact, as this report shows, sustainable lifestyles are both a driver as well as an objective of creating a peaceful fu-ture in harmony with the ecological rhythm and balance of our planet.
One of the most significant policy developments in recent years in this regard is on climate change miti-gation; more than 100 countries have committed to achieving net-zero emissions goals by around mid-cen-tury in order to achieve the Paris Agreement on cli-mate change (UNEP 2020). Local governments have al-so made decarbonization commitments, with more than 2,000 of them declaring a climate emergency (Climate Emergency Declaration 2021) and with a huge num-ber promising climate neutrality (e.g., Eurocities 2019; Laine et al. 2020; Carbon Neutral Cities Alliance 2021). However, despite the importance and rapid mitigation potential of behaviour change, most policy approach-es to climate change solutions have given it scant at-tention, choosing to focus instead on the application of
technology (Creutzig et al. 2016). Little is being done to directly address the overconsuming lifestyles, even as the IPCC releases some of the strongest scientific as-sessments of the consequences of consumerism and growth-obsessed capitalism. Very few net-zero strate-gies are focused on the potential contributions of life-style changes and their implications on future ways of living. By relying heavily on unproven technologies and prioritising interventions that continue to sustain eco-nomic growth, net-zero strategies risk leaving citizens feeling disenfranchised.
While news of net-zero commitments is encourag-ing, the problem is accelerating faster than the solu-tions package being offered. Scenarios from integrated assessment models show that in most of the cost-op-timal scenarios consistent with limiting global warm-ing to 1.5°C, taking together global commitments thus far, net-zero greenhouse gas (GHG) emissions occur between 2060 and 2085; net-zero CO₂ emissions occur earlier than net-zero GHG emissions, between 2045 and 2060 for 1.5°C, on a global level (IPCC 2018). This is of course later than the IPCC stresses when net-zero emis-sions must have been stabilized. Keeping aside the de-bate on the varying interpretations of net-zero, UNEP warns that the litmus test of these net-zero announce-ments will be the extent to which they are reflected in near-term policy action and the extent to which they are genuine (UNEP 2020). History of government commit-ments and failures on climate change shows that offset-ting emissions, which is central to the net-zero strate-gy, has been teased for over three decades, leading to the worsening state of affairs in which we now find our-selves—what the IPCC describes in its most recent re-port as “irreversible” damage to the environment (IPCC 2021b). This explains the widespread skepticism about net-zero commitments and calls for them to be carefully

22
Section IA Budget for Living Within Limits
examined if their technology and market driven focus is not to lead to further excuses for postponing crucial climate decisions affecting consumption choice archi-tecture, lifestyles, and inequalities.
In the two years since the publication of the first 1.5-degree lifestyles report (IGES et al. 2019), a num-ber of dramatic local and global events have occurred, pressing home the message that unless lifestyles are ad-dressed—that is, unless sustainable lifestyles move from a side topic to the centre of global frameworks on climate change, biodiversity, and resource scarcity—then social tensions and political disruptions will become a main-stay of the world as it grapples with the consequenc-es of a fast-changing climate. The COVID-19 pandemic and the consequent unprecedented lockdown came as a foretaste to the very least of what could happen if the world is caught in an unplanned transition (Shan et al. 2020). The heartbreaking millions of deaths, inability to commune with loved ones, runs on basic necessities in shops, food shortages, and increased depression and anxiety were just as shocking as the partial collapses in economic, health, security, and transportation sys-tems—systems that people had come to rely upon and trusted authorities responsible for them. Evidence of weakening public trust and disenfranchisement contin-ues to be seen in protests around the world, including rejections of vaccines and basic prevention measures such as wearing masks. And yet, at the end of a terrible year with people having experienced the harshest re-strictions in recent memory, the International Energy Agency reported just an 8% reduction in mean global CO₂ emissions (IEA 2020). And while that was the largest decline in annual emissions seen, it was far smaller than need be, especially considering the suffering endured. Worse still, a large majority of COVID-19 recovery plans are not “green;” government planning and spending, despite the rhetoric of “building back better,” is trapped in the same problematic economic growth design that is causing these problems and threatening wellbeing and aspirations (O’Callaghan and Smith 2021). There is a huge amount of inertia in our economies, wheth-er locked in fixed infrastructure, business interests, or simply unconscious patterns of behavior.
Contrary to pacifying commentary, impacts of cli-mate change on lifestyles are not far off into some dis-tant future; they are not only affecting vulnerable pop-ulations in developing countries; and impacts are not going to be gradual with advanced warnings. Rather, im-pacts of climate change on lifestyles are already being experienced today; they are occurring with increasing frequency and magnitude, and, although disproportion-ately affecting poorer countries, are also being experi-enced in highly industrialised and wealthy societies; and the manifestations are scattered and unpredicta-ble. A number of recent sporadic heat waves and cold
fronts and summer snows have left meteorologists baf-fled. One recent example of this is the heatwave that occured in Canada in June 2021. During this, Canada created and broke its temperature records for three straight days, reaching 49.6°C—with a consequence of over 100 deaths (BBC News 2021c); two months later, Europe logged its highest temperature in recorded his-tory: 48.8°C on August 11, 2021 in Sicily, Italy (Weston and Watts 2021). Even with being prepared for wild-fires, Australia witnessed mega-blazes across all states last summer, overpowering its firefighters and military support, with some professional firefighters losing their lives along with dozens of citizens and homes consumed by the fires (Shi et al. 2021). Nearly three billion animals were killed or displaced, and vegetation destroyed, in what was one of the worst wildfire disasters in its mod-ern history (BBC News 2020). Keeping with the errat-ic patterns, Germany and parts of western Europe not familiar with natural disasters saw massive floods and landslides that swept away houses and killed over 200 people (Deutsche Welle 2021). These single events rep-resent trends that have already been reported by IPCC’s and other publications (IPCC 2021b).
Of growing concern is observed anxiety among a population that is especially prone to social disruptions and that is also arguably more vested in a sustainable fu-ture: youth. The climate crisis is precipitating new psy-chological conditions and worsening existing mental illnesses among young people. Referred to as eco-anx-iety, climate distress, climate change anxiety, or cli-mate anxiety, these terms describe anxiety related to the global climate crisis and the threat of environmen-tal disaster. Natural disasters precipitated by climate change including hurricanes, heatwaves, wildfires, and floods can lead to direct psychological effects, such as increased rates of depression, anxiety, post-traumat-ic stress, and other mental health disorders (Wu et al. 2020). Younger people, compared to older adults, tend to report greater climate-related anxiety, possibly because younger people will be more likely to live through the climatic adversities in the decades to come. UNICEF’s new Children’s Climate Risk Index provides sobering data on how many children are currently exposed to a variety of climate and environmental hazards, shocks, and stresses: 820 million children (more than one-third of children globally) are currently highly exposed to heatwaves; 920 million children are currently highly exposed to water scarcity; 600 million children (more than a quarter of children globally) are currently high-ly exposed to vector-borne diseases, such as malaria and dengue, among others; 330 million children (one in seven children globally) are currently highly exposed to riverine flooding (UNICEF 2021). As impacts of cli-mate change become more evident, the stability of sys-tems that society has come to rely upon are also falling

23
Section IA Budget for Living Within Limits
apart: predictable weather patterns, jobs and careers, pension schemes, eradicated diseases, stable commu-nities, relative political and economic stability all seem to be at play (Clayton 2020). Climate-related anxiety al-so tends to be greater in people who deeply care for the environment. Levels of climate anxiety are likely to in-crease over time as increasingly more people are direct-ly affected (Taylor 2020), and in all likelihood will in-creasingly drive political action. In March 2019 alone, an estimated 1.6 million school-aged protestors in 125 countries demanded action be taken to combat climate change (Wu et al. 2020).
The focus of this report is on lifestyles and climate change. Lifestyles embrace much more than just con-sumption patterns and behaviours. Lifestyles include non-economic aspects of our lives, such as caring for children or elderly parents, spending time with our friends, play, engaging in voluntary work, activism, or supporting a local campaign or political party. All of these potentially affect, directly or indirectly, our well-being and our carbon footprint. Lifestyles are how we consume, and also how we relate to one another, what kind of neighbours, friends, citizens, and parents we are, what kinds of values we nurture, and how we let those values drive our choices.
The UN Environment Programme defines a sustain-able lifestyle as “a cluster of habits and patterns of be-haviour embedded in a society and facilitated by institu-tions, norms and infrastructures that frame individual choice, in order to minimize the use of natural resources and generation of wastes, while supporting fairness and prosperity for all” (Akenji and Chen 2016).
As is the case with this report, focusing on life-styles instead of just consumption implies considering non-economic aspects of our lives, as well as the role of factors outside the marketplace, and of policy, business, innovation, and other factors that enable or constrain adopting any consumption or lifestyle choice. A quan-tification of the impacts of aspects beyond consump-tion in terms of carbon emissions is, however, very dif-ficult to obtain and often relies on strong assumptions and generalisations. For this reason, we focus on quan-titative analysis of carbon footprints1 for consumption, while maintaining a broader perspective on lifestyles through considering and discussing other factors, ena-blers, and co-benefits of lifestyle change.
1 Carbon footprint refers not only to CO₂ but also other greenhouse gases. The report considers emissions of methane (CH₄), nitrous oxide (N₂O), hydrofluorocarbons (HFCs), perfluorocarbons (PFCs), and sulphur hexafluoride (SF₆), converted into CO₂-equivalents (CO₂e).
1.2. Shrinking budget: the closing window for staying below 1.5 degrees
Opportunities for maintaining or improving comforta-ble ways of living are decreasing along with the shrink-ing budget to stay below a 1.5˚C increase in global tem-perature. The Intergovernmental Panel on Climate Change’s Special Report (IPCC 2018) emphasised that an average warming of 1.5˚C should not be regarded as a “safe” climate target although the expected risks and negative impacts at this level are considerably low-er than at 2˚C. The Special Report also reviewed the sci-entific literature on the remaining carbon budget—how much more CO₂ humanity can emit while still having a fair chance of meeting the agreed warming targets. It concluded that to have a 50% chance of limiting warm-ing to 1.5°C, the world can emit 580–770 gigatons of CO₂ (GtCO₂) from the start of 2018. The range in values re-flects different ways of calculating the pre-industrial global average temperature. For a likely chance (67%) of meeting the target, the remaining budget decreases to 420–570 GtCO₂, equivalent to around 10–14 years of current emissions.
Recent research has updated the IPCC’s estimates of humanity’s remaining carbon budget. A study pub-lished in early 2021 (Matthews et al. 2021) finds that the available 1.5°C budget has decreased to 230 GtCO₂ from 2020 onwards for a 67% chance of meeting the target, corresponding to around six years of global emissions. The corresponding budget for a 50% chance amounts to 440 GtCO₂ or around 11 years of global emissions, if they remain at current levels. The first part of the IPCC’s 6th Assessment Report, which deals with the physics of cli-mate change and was published in August 2021, large-ly confirms previous estimations of remaining carbon budgets for different warming targets and probabilities (IPCC 2021a). According to this latest assessment, start-ing from the beginning of 2020, the remaining carbon budget for a 50% likelihood of keeping warming to 1.5°C amounts to 500 GtCO₂.
With the carbon budget rapidly being spent, the un-sustainability tensions are surfacing faster, and political and social justice issues are being exacerbated—strain-ing debates on equity and fairness in the distribution of the remaining carbon budget in the process.

24
Section IA Budget for Living Within Limits
1.3. Worsening inequality
An indictment of the current unsustainable econom-ic development paradigm is the clear narrative show-ing the ever growing gap between the rich and the poor, magnified by the perversity of the poor paying a higher price (literally and metaphorically) than the rich. There is inequality among countries, inequality within coun-tries, inequality across races and between genders, and inequality across generations. And there are multiple ex-pressions of inequality: of income, of health, of access to natural resources and public services, of participation in decision-making processes, for example, and notably in terms of inequality of carbon emissions. Calls for climate justice are already growing loud; these tensions will only get worse as competition heightens over the shrinking carbon budget to stay within sustainable limits. Equity is central to ensuring sustainable lifestyles.
Research shows a strong correlation between in-come and emissions, and a pattern of a highly unequal global distribution of consumption emissions between people of high and low income. The UNEP Emissions Gap Report 2020 (UNEP 2020) presents the following data to highlight the link between inequality and con-sumption. The emissions share of the 10% richest, highest-emitting individuals ranges from 36-49% of the global total, while that of the poorest, lowest-emit-ting 50% of the world’s population ranges from 7-15% of the total. This disparity is particularly pronounced at the top of the global income scale—the emissions share of the top 1% highest income earners is greater than the total emissions of the bottom 50% combined—and may be twice as high, according to some estimates. Around half of the consumption emissions of the global top 10% and 1% are today associated with citizens of high-in-come countries, and most of the other half with citi-zens in middle income countries. Oxfam estimates that to reach the global average per capita emissions level by 2030 consistent with limiting global heating to 1.5°C, the per capita consumption emissions of the richest 10% of the global population should be reduced to about a tenth of their current level, while those of the poorest 50% could still increase by two to three times their cur-rent level (Oxfam 2020).
Yet this inequality trend is growing bigger. During the COVID-19 pandemic, billionaires and millionaires have gotten even richer while poverty has deepened among lower income groups (Parolin et al. 2020). This contrast was manifest in the United States, for example, when 40 million Americans filed for bankruptcy as bil-lionaires saw their wealth rise by half a trillion dollars (Woods 2020). This disparity is present in both indus-trialised and developing countries, where a rich class is emerging with lifestyles similar to their Western coun-terparts. In India, for example, just 1% own 58% of the
total wealth of the country (Oxfam 2017). The UN Food and Agriculture Organization estimates that global hunger increased to 811 million undernourished peo-ple worldwide in 2020, and the number of people living with food insecurity, a lack of year-round access to ad-equate food, rose by 318 million, to 2.38 billion (FAO et al. 2021). In Peru, a country that had made progress and halved poverty over the last two decades, national data shows that poverty jumped from 20% to 30% in a year (FAO et al. 2021). If not addressed, the effects of climate change will be far worse than the pandemic, and these inequalities and their impacts will get even more dra-matic as provisioning systems, social safety nets, and natural capital all get compromised.
Analysis shows the unfortunate implications of this growing inequality of income for climate mitigation. Ox-fam found that while the European Union’s total con-sumption emissions fell between 1990 and 2015, in-come inequality in the EU increased, meaning that only the per capita emissions of low and middle income EU citizens actually declined in this period, while the per capita emissions of the richest 10% of EU citizens con-tinued to increase. Oxfam observes that the richest 10% of EU citizens today have a per capita footprint over 10 times higher than the level needed by 2030 consistent with achieving the 1.5-degree target, while the foot-print of the richest 1% is 30 times higher. By contrast the footprints of the poorest 50% of Europeans will need on average to be halved by 2030 (Oxfam 2020). Similar observations have been made for the lifestyle carbon footprints of the Japanese population (Koide et al. 2019).
Analysis in this report also highlights the deep ine-qualities at the heart of the climate crisis, in particular the inequalities between countries. For example, cur-rent per capita consumption emissions in Canada (14.2 tons CO₂e) are six times those in India (2.2 tons CO₂e). While it is broadly understood that Canada and simi-lar countries need to drastically reduce consumption, countries such as India also already need to start cutting their emissions. Japan and Finland, for example, need to reduce lifestyle carbon footprints by about 90% by 2050; China, Brazil, and India need reductions of 86%, 78%, and 76%, respectively. These reductions need to be carried out by emerging economies while simultane-ously getting hundreds of millions of people out of pov-erty. In addition, they are also dealing with droughts, hurricanes, fires, and other disasters—exacerbated by climate change. Although this report does not include further detail on the inequalities within those coun-tries, it is nonetheless clear that a policy approach that does not reflect an equitable distribution of the carbon budget will only further embed social inequalities, un-dermine development opportunities for billions of peo-ple in lower income countries, and foment resistance to addressing climate change.

25
Section IA Budget for Living Within Limits
1.4. Defining a fair consumption space
This report asks the question: in order to stay within ecological limits, how do we distribute the remaining carbon budget in a fair manner that allows everyone eq-uitable opportunities for a life of dignity, including fu-ture generations?
The longer we fail to curb carbon emissions, the smaller the global carbon budget gets, and the more challenging the remedial actions we must take. Com-petition over the remaining budget, if not carefully man-aged, will invite exercises of power and exacerbate ten-sions between those who have and those who have not. In a world of finite resources and planetary boundaries (including a tight carbon budget), in which everyone has needs and desires, a lack of balance in the system means that overconsumption by one group comes at the expense of opportunities by others to meet their own needs. Consumerism by some can only exist if others are deprived of their own livelihoods. Political economic analysis of the current economic climate points to the growing extremes in poverty and wealth being easily correlated to vast differences in power (Ravallion 2010; Oxfam 2015), as well as to impacts on the environment. Perversely, it is the poor, those at a power disadvantage and with limited agency, who experience the most dire impacts of climate change and unsustainability (IPCC 2012). But it is everyone who ultimately bears the con-sequences, as COVID-19 outbreaks and climate migra-tion pressures have shown us. Thus, there is a need for a system that takes into account the limits of resources, the needs of everyone, and a balance in opportunities to meet those needs.
This report proposes identifying a fair consumption space: an ecologically healthy perimeter that supports within it an equitable distribution of resources and op-portunities for individuals and societies to fulfil their needs and achieve wellbeing. This “space” constitutes a range of lifestyle options and consumption choices with different combinations of goods and services that can be exchanged, substituted, and adjusted over time as the ecological balance shifts. Such a space exists with-in a distributive system that equally allocates resources for everyone such that current and future generations have similar opportunities. With a cap on resources, over-
2 The notion of fair distribution of efforts towards emissions reductions remains a point of discussion in UNFCCC negotiations—where they are sometimes referred to as “burden sharing” or “effort sharing”—and is steeped in politics. The UNFCCC uses a territorial- based accounting approach, which covers only direct emissions from domestic production activities within the geographical boundaries and offshore activities under the control of a country. However, to account for carbon leakage and place responsibility on consuming countries, this report uses consumption-based accounting, which covers household carbon footprints from domestic sources and emissions embodied in imported goods while excluding emissions embodied in exported goods. This allows calculations in this report to show the size of impact of households and individuals based on actual consumption. Furthermore, the equity debate in the UNFCCC is focused on who pays for emissions reductions, while from a lifestyle carbon footprint analysis the approach is that of whose direct or induced consumption is having the bigger impact—hence the more consumptive a lifestyle the higher the footprint, and the bigger the effort to reduce it to the globally unified target to stay under a 1.5°C increase in temperature.
consumption by one person affects the prospects of another; consuming beyond one’s fair consumption space would cause deficit and thus encroach into another’s space. If not balanced this would lead to ecological disequilibri-um and social tensions.
This report asks the question: in order to stay within ecologi-cal limits, how do we distribute the remaining carbon budget in a fair manner that allows everyone equitable opportuni-ties for a life of dignity, includ-ing future generations?
Achieving a fair consumption space is predicated on three principles: limits, equity, and wellbeing. The first is the need to stay within ecological limits, or one-plan-et living, as reflected in planetary boundaries. For this report, the limits are defined by the current carbon budget within which global temperature increases are likely to stay below 1.5 degrees. The second is equity, captured by the principle of ecological justice—includ-ing intragenerational and intergenerational justice—in access to resources and opportunities. It also asks the question, given that impacts of climate change are not limited to where the problems are caused, who benefits from actions that lead to continuing emissions and who suffers from the impacts. For this report, the global sus-tainable carbon budget is distributed equally among the global population2 (see Methodology subchapter 2.2). The third is wellbeing. Carbon budget use within a fair consumption space should be optimised for the well-being of individuals and society rather than guided by economic growth. Within this space are not just reduc-tions in consumption, but also innovation and regener-ative measures.

26
Section IA Budget for Living Within Limits
The concept of a fair consumption space is adapt-ed from the ‘environmental space,’ coined in the early 1980s and related to the political economy of natural resource use (Opschoor 1987; Opschoor and Reijnders 1991). The ‘environmental space’ concept was proposed as an approach to address the limitation of various re-sources available for human consumption; it was ap-plied to limit the use of oil, copper, natural gas, and bio-mass, necessary to guarantee the long-term availability of sufficient reserves to avoid that resource scarcity de-veloping into a serious obstacle for economic develop-ment in the following century (Weterings and Opschoor 1992; Spangenberg 2002). It was later modified for the National Environmental Policy Plan of the Netherlands and used to describe external limits to private resource consumption due to climate change, the limited avail-ability of wood and water, as well as issues of growing waste generation (Buitenkamp et al. 1992). For this, it estimated upper thresholds for car mobility, water and meat consumption, and so forth on a per capita basis.
In determining a per-capita environmental space, (Opschoor 1987), for example, estimated that a re-
3 Friedrich Schmidt-Bleek (2008), for example, calculated that a worldwide per-capita consumption of non-renewable resources should be fewer than five to six tons per year (requiring a “Factor 10” increase in resource efficiency in industrialized countries like Germany); von Weizsacker et al. (2010) estimated “Factor 5” through 80% improvements in resource productivity.
duction of northern per-capita consumption by a fac-tor of eight to ten was necessary. Already back in the 1990s, calculations showed that fossil-fuel and miner-al-resource use needed reductions of about 90% in the over-consuming countries.3 These studies form a basis for determining a per-capita fair consumption space.
The notion of establishing science-based limits and equitable distribution is central to setting a “space.” Reconciling social and environmental criteria in sus-tainable lifestyles strategies requires a suitable concep-tual framework, and an environmental space concept provides a suitable basis (Spangenberg 2014, 2002). The space is characterised by an upper limit to resource consumption (the ceiling) based on carrying capaci-ty and equity arguments, and a lower limit (the floor) which is socially motivated and defines the minimum resource accessibility that permits people to lead a dig-nified life in society. Identifying fair consumption ceil-ing and floor values will set a fair consumption space. In this sense, setting the fair consumption space is akin to defining the “safe operating space” in the planetary boundaries (Steffen et al. 2015) literature as well in the
Figure 1.1. A Fair Consumption Space for Sustainable Lifestyles
Based on Spangenberg (2014)
Overconsumption(Environmentally unsustainable)
Underconsumption(Socially unsustainable)
FAIRCONSUMPTION
SPACE
Reduceconsumption
Floor(Social minima)
Ceiling(Environmental maxima)
Increaseconsumption
Food
Leisure
Housing
Services
Transport
Consumergoods

27
Section IA Budget for Living Within Limits
so-called “doughnut economics” (Raworth 2017) that questions the conventional wisdom about unbounded, demand-led economic growth.
More recently, attempts to define fair consumption shares can be seen in the concept of “consumption cor-ridors.” Consumption corridors tie sustainable con-sumption and the good life to the right of the individual and the duty of governments. This concept recognises that people are entitled to have access to the necessary resources allowing them to satisfy their objective needs and live a good life, while governments have the duty to provide individuals with the necessary conditions to do so. In exercising these rights and duties, individuals and governments should use only amounts that allow others to also have similar access (Di Giulio and Fuchs 2014).
A fair consumption space therefore establishes a glob-al or per-unit perimeter defined by resource limits, but also the absorptive and regenerative capacity of the plan-et. Figure 1.1 illustrates a fair consumption space. Within the space are consumption ranges with upper limits (i.e. ceiling) and lower limits (i.e. floor) for various resources. For this report, the rations are linked to emissions from high-impact domains of lifestyles such as food, housing, transportation, leisure, and consumer goods. Following calculations for this report, the fair consumption space should dynamically balance at 0.7 tCO₂e per person per year by 2050 in order to stay with the 1.5-degree temper-ature increase of the Paris Agreement.
The fair consumption space is about a balance of power among different actors in society, with rations per person determined through equitable distribu-tion of the carbon budget and considerations of funda-mental needs for wellbeing. With a clearly articulated space, there is a balance in which wants do not over-power needs; economic demands stay within environ-mental limits; and political platforms and policies do not exacerbate social disparities and ecological deficits. It is characterised by a rationing system that adjusts ap-petites equitably to periodic and physical constraints.
1.5. About the 1.5-degree lifestyles report
While changes in lifestyles have been widely recognised as part of a sustainable civilisation, it remained large-ly in the normative domain, with little quantifiable and systematic guidance of policy design and prioritisation of actions under specific climate regimes. The 1.5-de-gree lifestyles report was introduced as a science-based approach to link concrete changes in lifestyles to meas-urable impacts on climate change while keeping with the 1.5-degree aspirational target of the Paris Agree-ment on climate change. Changing lifestyles, especially by prioritising high-impact areas (such as food, person-al transport, housing, consumer goods, leisure, and ser-
vices), can bring about results relatively quickly, espe-cially in consumption domains that are not locked into existing infrastructure (Moore 2013; Lettenmeier et al. 2017; Salo and Nissinen 2017).
Most scenarios for meeting climate targets are still hopeful on developing new technologies (including neg-ative emissions technologies) and on changes in pro-duction (Rogelj et al. 2015; Rockström et al. 2017). This technology and production focus tends to underplay, if not ignore, both the contributions of lifestyle changes and impacts of how such technology developments and emerging business practices would impact lifestyles and society. While some pathway scenarios incorpo-rating demand-side reduction measures have recently emerged (van Vuuren et al. 2018), these and other ex-isting consumption-focused literature providing quan-tification of the mitigation potential of low-carbon life-styles do not directly link reduction targets to pathways leading to achieving the temperature targets of the Paris Agreement (Vandenbergh et al. 2008; Dietz et al. 2009; Jones and Kammen 2011). This report and the approach taken fill a gap in the existing research by establishing global targets for lifestyle carbon footprints, examin-ing current consumption patterns and their impacts on footprints, and evaluating potential reduction impacts of low-carbon lifestyle options.
The 1.5-degree lifestyles approach examines GHG emissions and reduction potentials using consump-tion-based accounting, instead of production-based accounting, which covers only direct emissions from domestic production activities within certain geograph-ical boundaries. Consumption-based accounting covers both direct emissions in a country and embodied emis-sions of imported goods while excluding emissions em-bodied in exported goods. This accounts especially for the global impacts of high-consuming societies, and recognises that some communities still need to increase consumption to meet basic needs of their citizens.
The 1.5-degree lifestyles approach has been widely covered by the media, referenced by researcher organ-isations and think tanks, and has become very influen-tial in policy discussions seeking to integrate lifestyles perspectives in climate policy. The Hot or Cool Institute has worked with partners to realise several results. The first report became the basis for the low-carbon life-styles chapter of the United Nations Environment Pro-gramme Emissions Gap Report 2020 (UNEP 2020) and continues to inform the work of UNEP on sustainable lifestyles. It is providing knowledge input on the life-styles component under the Global Opportunities for SDGs (GO4SDGs) (Green Growth 2020), funded by the government of Germany and led by UNEP. Recognizing the need for such an approach the European Commis-sion has funded a multi-year research project consor-tium on “EU 1.5-Degree Lifestyles” under the Horizon

28
Section IA Budget for Living Within Limits
2020 scheme. In Finland, Sitra has adopted the 1.5-de-gree lifestyles approach to develop the “Shift-1.5 Meth-od” (SITRA 2020) that has engaged almost a fifth of the country. The approach is also informing the philan-thropic community’s work on behaviour change, such as the Funders for Sustainable Living network, con-vened by the KR Foundation. It prompted the work and report by the Cambridge Sustainability Commission on Scaling Behaviour Change (Newell et al. n.d.). At the city level, ICLEI (the Local Governments for Sustainability network), the Institute for Global Environmental Strat-egies, and partners under the One-Planet network are analysing 1.5-degree urban lifestyle solutions in Kyo-to, Yokohama, Cape Town, New Delhi, São Paulo and Nonthaburi. Similarly, C40, the network of the world’s megacities committed to addressing climate change, is using the 1.5-degree lifestyles approach to support its work under the Thriving Cities Initiative.
This report builds on the first one published in 2019: “1.5-Degree Lifestyles: Targets and options for reducing lifestyle carbon footprints” (IGES et al. 2019). It presents a more refined methodology, updated da-ta from countries in the first report, and extends de-tailed analysis to five additional countries. While the first report focused on establishing quantifiable glob-al targets for sustainable lifestyles, this report goes further, introducing the need for a fair consumption space, and exploring choice editing, carbon rationing, and other strategies to achieve low-carbon lifestyles in an equitable manner.
4 Annexes A,C and D published online only on the website of the Hot or Cool Institute: hotorcool.org
This report is divided into four sections. Section I provides a background, putting sustainable lifestyles in the context of the climate emergency and the need for a fair consumption space. It also introduces key concepts and methods used to determine proposed globally unified per capita targets for lifestyle carbon footprints from household consumption.
Section II presents detailed analysis of current av-erage lifestyle carbon footprints of 10 countries: Can-ada, Finland, United Kingdom, Japan, China, Turkey, South Africa, Brazil, India, and Indonesia. These case countries were selected to capture a range of different consumption contexts, including capturing the differ-ences between industrialised and industrialising coun-tries. They are all members of the Group of Twenty (G20) countries, apart from Finland. As the report only covers these case countries, future studies can widen the selec-tion to other countries by using the methodology, data sources, and results of estimation that are detailed in Annexes A to D4. The report estimates levels of physical consumption in each country, comparing them to glob-al targets. For each country, it analyses low-carbon op-tions for reducing lifestyle carbon footprints of house-holds and calculates the carbon reduction potentials of identified options based on various adoption rates and country-specific contexts.
Section III looks at policy approaches to reconcile the tightening carbon emissions budget and vast inequal-ities and power dynamics manifesting in the sustaina-bility transition. The section focuses on approaches that are less frequently discussed but which hold potential to break the worsening trends and to usher in effective solutions, as is required by the scale and urgency of the transitioning challenge. Examples include choice edit-ing, carbon rationing, universal basic services, and suf-ficiency.
Section IV brings together and illustrates the sev-eral elements of this report: reducing current lifestyle carbon footprints through varying adoption rates of the solutions options introduced, in order to meet the 2030 target of 2.5-tons per person. For each country, it pre-sents two scenarios: one with an emphasis on reducing intensity of supply options and a second with an em-phasis on reducing consumption. In doing so it seeks to dispel the false dichotomy of systems changes versus behaviour change, and demonstrates the need for both to be orchestrated. The report ends with a final section, Section V, on recommendations for moving forward.
A fair consumption space is predicated on three principles: consumption within ecological limits; equity and ecological justice; optimised for the wellbeing of individuals and society.

29
Section IA Budget for Living Within Limits
TEXT BOX A: Key features of the 1.5-degree lifestyles approach
Global carbon budget. The remaining carbon budget refers to the maximum amount of carbon dioxide equivalents that humanity can still emit while limiting global warming to a given target, such as 1.5°C. The longer mitigation action is delayed, the faster the budget is used up. The remaining carbon budget can be a powerful tool for communicating the urgency of climate mitigation.
Lifestyle carbon footprints. These are measures of GHG emissions directly and indirectly induced by an average household’s consumption but excluding those from the public sec-tor and capital investment. In principle, lifestyle carbon footprints are calculated by multi-plying average annual consumption in physical units with life-cycle-based carbon inten-sities for a wide range of goods and services in case countries. For consumption areas where physical units cannot be easily expressed, such as for “leisure,” consumer expendi-tures can be used. This consumption-based accounting approach ensures a clear focus on emissions attributable to lifestyles, and allocates emissions to specific goods and ser-vices consumed by households.
Hotspots. Lifestyle carbon footprints are analysed to identify “hotspots”—consumption are-as with the highest climate impact. Identification of specific hotspots is made easier by the use of physical consumption units, such as distances travelled by car or vegetables eaten.
Equity-based reduction targets. To ensure that the temperature limits of the Paris Agree-ment are met, per capita targets are determined by distributing the remaining carbon budget on an equitable basis across the global population. (Targets for this report are set at 0.7tCO₂e by 2050, with intermediary targets of 2.5t in 2030 and 1.4t by 2040.) Estab-lishing long-term per-capita carbon targets requires balancing GHG emissions and effects of sinks. Thus proposed per-capita carbon footprint targets dynamically shrink into the future as the total carbon budget shrinks—the longer action is delayed to stabilise and re-duce emissions, the more rapidly the budget will shrink.
Low-carbon options. To support meeting 1.5-degree lifestyle targets, a number of low-car-bon lifestyle options are drawn from the scientific literature and their emissions reduction potential is estimated. Options include both production-side efficiency improvements and consumption-side changes, grouped according to three key approaches: absolute con-sumption reductions, modal shift to alternative products or services, and efficiency im-provements of current goods and services.
Adoption rates. Adoption rates are used to account for the varying extents to which a pop-ulation changes to low-carbon options. They represent the share of the population imple-menting an option (e.g. 50% of population adopt a vegetarian diet) and/or the extent of implementation of the option (e.g. vegetarian diet implemented by 50%, i.e. half of one’s meals are vegetarian). Estimated impacts and policy recommendations are calculated on the basis of partial or full implementation (or adoption) of each low-carbon lifestyle option.

30
Section IA Budget for Living Within Limits
TEXT BOX B: Lessons from research on enabling sustainable lifestyles
Changes in ways of living are a political hot-potato and can be psychologically daunting. Yet, with about two-thirds of global greenhouse gas emissions attributed to household con-sumption, sustainable lifestyles are integral to the solutions package required for a sustain-able future (Capstick et al. 2020). Yet, practical and philosophical questions abound, as do misconceptions on the issue. Below are some key messages from this report, and culled from multidisciplinary research on transitioning to sustainable lifestyles.
1 Green consumption is not the same as sustainable living.Sustainable living incorporates green consumption (Akenji 2014) where necessary, and
extends to immaterial aspects of labour, love, and laughter, while being guided by equity in, and wellbeing of society. While green consumption and eco-labelled products might be better than conventional ones, buying too many of them leads to rebound effects (Her-twich 2008)—potentially erasing the environmental value.
In a sustainable lifestyles transition, we need to provide non-consumption and out-of-market options; and to protect lifestyles of communities already living well without consumerism.
2 The environmental impacts of lifestyles mainly come from four domains: food, personal transport, housing, and consumer goods.
Among these, as this report shows, eating meat, using fossil fuel cars, flying, and large and high energy-consuming houses are especially problematic.
Prioritising design, production, and consumption patterns in these domains will address about three-quarters of environmental impacts.
3 There is no universal sustainable lifestyle—what is sustainable in one place may not be sustainable in another.
If one must use a car, then an electric car in Iceland might make sense, where 100 percent of electricity comes from renewables, but not in India where electricity is primarily generat-ed from coal.
Successful examples of sustainable lifestyle practices should be replicated and scaled in new places only after careful adaptation.
4 The environmental impacts of lifestyles are not intentional but rather a consequence of people aspiring to fulfil needs or desires, and to function in society.
Everyday practices of people are determined by social norms and values, and depend on systems and infrastructures around them (Shove 2012).
Change needs to focus on the choice architecture (Szaszi et al. 2018), social values and norms, physical infrastructure, provisioning systems.
5 Increasing awareness does not necessarily lead to action.Knowledge of environmental impacts of consumption does not necessarily lead to
changes in lifestyle. This knowledge-action or attitude-behaviour gap shows the limits of mere information campaigns (Terlau and Hirsch 2015).
Awareness is easily subordinated by lack of access or lock-in by prevailing options (Seto et al. 2016). In a sustainable society, the default options—the most widely available means of meeting needs—should already be made sustainable.

31
Section IA Budget for Living Within Limits
6 The question of individual behaviour change versus systems change is a false dichotomy.
Lifestyles choices are enabled and constrained by social norms and the physical environ-ment or infrastructure (Sahakian and Steinberger 2011). And at the same time, history is full of heroes and communities that have come together to defy the odds.
It is important to differentiate between the factors that can be addressed at the individual level and those that are beyond individual control, and to recognise how the two are mutually reinforcing.
7 Beyond the point of enabling basic needs and a life of dignity, having more money does not directly translate to more happiness.
There is little evidence, especially in industrialised nations, to support the assumption that unending growth of gross domestic product beyond current levels translates to increas-es in wellbeing.
People’s expressions of happiness correlate with the level of trust in the community, social ties, education, health, and meaningful employment (Helliwell et al. 2020); and these tend to be less consumerist.
8 Inequality and perceived unfairness in society is a strong predictor of whether an intervention will fail or succeed.
People will accept radical solutions if they are justified and everyone is perceived as bearing a fair share of responsibility (Gampfer 2014). Manifestations of social tension get strong-er as disparity in socio-economic conditions between groups get wider (Cushman 1998).
Ensuring sustainable lifestyles will fail if efforts are not made to address the extremes of pov-erty and wealth in society.
9 Lifestyles are not static; needs are a function of time and place.Individuals’ needs and aspirations in life change as their personal situation, society,
and the physical environment change. Different stages of life bring different perspectives.Milestones and key transition moments in life—marriage, graduations, relocations, and births
and deaths—offer heightened opportunities for reshaping lifestyles (Burningham and Venn 2017).
10 Sustainable lifestyles are not all about reducing consumption.A central tenet of sustainable societies is not complete abstinence but consump-
tion within regenerative capacity (Wahl 2018). Social evolution includes examination and creative adaptation towards new ways of meeting our needs.
Social innovations, social movements, and grassroots experiments are pivotal in opening up new avenues and engendering acceptability of sustainable solutions.

32
Section IA Budget for Living Within Limits
2 – Methods and Technical Notes
2.1. Consumption-based accounting and targets
The 1.5-degree lifestyles approach examines carbon footprints and reduction potentials using consump-tion-based accounting. This measure better reflects the emissions associated with a population’s standard of liv-ing than production-based accounting (also referred to as territorial-based accounting) used in countries’ of-ficial reporting to the UNFCCC. Production-based ac-counting covers only direct emissions from domestic production activities within the geographical bounda-ries and offshore activities under the control of a coun-try, and does not consider emissions embodied in in-ternationally traded goods (Boitier 2012; Moore 2013).
Conversely, consumption-based accounting (carbon footprinting) covers household carbon footprints from domestic sources and emissions embodied in imported goods while excluding emissions embodied in exported goods (Figure 2.1). This approach thus corrects for car-bon leakage, where a shift from carbon-intensive do-mestic production to increased reliance on imports re-sults in an apparent decarbonisation. In addition, when comparing countries’ emissions in the context of inter-national negotiations, consumption-based account-ing does not burden industrialising countries with ex-cessive emission commitments (Peters and Hertwich 2008). Compared to production-based accounting, it can be considered a better measure of the global cli-mate impacts associated with individuals’ consumption and lifestyles.
In this report, the term ‘carbon footprint’ refers not only to CO₂ but also other greenhouse gases, thus it is al-so sometimes referred to as ‘greenhouse gas footprint.’ The report considers emissions of methane (CH₄), ni-
trous oxide (N₂O), hydrofluorocarbons (HFCs), per-fluorocarbons (PFCs), and sulphur hexafluoride (SF₆), converted into CO₂-equivalents, as in most global car-bon footprint analysis literature, including the UNEP Emissions Gap Report 2018 (UNEP 2018).
To date, studies of carbon footprints have mostly concerned the impacts of specific products, activities, and the final demand of countries. Research into house-hold consumption over the past few decades (see Her-twich 2005; Tukker et al. 2010; Girod et al. 2014; Ivanova and Wood 2020) has generally been based on monetary estimations focused on typical domains; few studies have covered the broader perspective of lifestyles cut-ting across the typical domains (Schanes et al. 2016; Salo and Nissinen 2017) or looked at consumption pat-terns based on physical amounts, such as food intake, transport distance, and energy consumption (Barrett et al. 2002; Nissinen et al. 2007; Girod and De Haan 2010; Moore et al. 2013; Vita et al. 2020).
This report estimates carbon footprints associat-ed with average lifestyles primarily based on physical consumption data and life cycle assessment data on the carbon intensity of goods and services. This approach, using physical consumption data rather than econom-ic data on consumer spending, makes it easier to iden-tify emission reduction opportunities through either changes in consumption modes (such as mode of trans-portation or type of fuel used) or reduction of physical consumption (such as distance travelled).
In addition to estimating current footprints, the re-port suggests future targets for such footprints and ex-plores pathways towards those targets. Earlier studies have proposed per-capita carbon emission or footprint targets (Nykvist et al. 2013; Dao et al. 2015), but few have explored the role of lifestyles and lifestyle-related path-

33
Section IA Budget for Living Within Limits
ways (Girod et al. 2014). Building on these efforts, the report establishes per-capita, consumption-based tar-gets of GHG emissions compatible with the Paris Agree-ment temperature goal of 1.5°C. (How footprint targets were determined is described in subchapter 2.3.) These targets can be seen as constituting a fair consumption space for all, determined through equitable distribution of the remaining global carbon budget for staying be-low 1.5-degree increase in warming. It therefore sets a shared direction for over-consuming and under-con-suming populations—a global “contraction and conver-gence” (Meyer 2000) towards a shared prosperity with-in a “safe operating space for humanity” (Rockström et al. 2009).
2.2. Calculating bottom-up lifestyle footprints
Lifestyle carbon footprint calculations presented in this report include embedded and indirect emissions, i.e., those resulting from intermediate consumption dur-ing production induced by household final demand, but exclude direct and indirect emissions and footprints caused by public sector and capital investment (Figure
Households
Final consumption
Final consumption
Intermediate consumption and
production
Territorial Boundary (Country B, C, etc.)
Intermediate consumption and
production
Households
Governments & Capital Investment
Territorial Boundary (Country A)
Territorial-based emissions Lifestyle footprintFootprint of countries
Governments & Capital Investment
Producers(goods & services)
Producers(goods & services)
Figure 2.1. Comparison of the boundary of GHG emission and footprint
Based on IGES et al. (2019)
2.1). This accounting method reflects emissions that re-sult from individual choices and the way they are ena-bled and constrained by the sociotechnical systems that households are part of (Akenji and Chen 2016). Some types of public spending contribute directly to citizens’ wellbeing and can therefore moderate the need for pri-vate spending. This relationship between public and pri-vate provisioning and the implications for greenhouse gas emissions is not well reflected in the method used here. There are significant differences in public services among the countries studied so this limitation should be kept in mind when comparing countries. Some studies indicate that public spending can play a significant role in reducing overall energy consumption and therefore greenhouse gas emissions as well (e.g. Vogel et al. 2021).
The report covers ten countries: Brazil, Canada, Chi-na, Finland, India, Indonesia, Japan, South Africa, Tur-key, and the United Kingdom. Nine of these countries are major G20 economies, selected to represent a range of income-levels and degrees of industrialisation. Fin-land is not a member of the G20, but was included since it was part of the 2019 1.5-Degree Study. These coun-tries also differ significantly politically, culturally, and socially, which could highlight differences in both cur-rent lifestyles and potential changes.

34
Section IA Budget for Living Within Limits
For this report, countries are classified into three cat-egories based on per capita gross national income (GNI) (United Nations 2020), listed here from highest to lowest:
→ High-income countries: Finland, Canada, United Kingdom, and Japan
→ Upper-middle income countries: China, Turkey, Brazil, South Africa, and Indonesia
→ Lower-middle income countries: India
2.2.1. Lifestyle carbon footprint estimationThe Organisation for Economic Co-operation and De-velopment (OECD) defines household consumption as the “consumption of goods and services by house-holds,” and refers to their choices and actions that en-compass the entire lifestyle: from selection to dispos-al of products and services (OECD 2002). This report classifies household resource consumption into six domains, based on previous studies: food, housing, personal transport, consumer goods, leisure, and ser-vices (Michaelis and Lorek 2004; Tukker et al. 2006; Kotakorpi et al. 2008; Seppälä et al. 2011; Lettenmeier et al. 2014). It uses a bottom-up approach, combining micro-level carbon footprint data with national statis-tical data for major consumption domains and items for three domains (food, housing, personal transport) (see Table 2.1). These calculations are based on physi-cal units (e.g., weight of food, transport distance, and
5 Emissions created by products or activities from the beginning of their life cycles to their end or disposal.
residential living area) rather than amounts of expendi-ture. The use of physical units makes it easier to analyse emission reduction actions to be taken at the house-hold level. Current carbon footprints are calculated on a per-person annual basis, with 2019 as the reference year. In the absence of 2019 data, information from the latest year available was used. For a more detailed de-scription of the used data sources, see Annex A.3.
The estimation covers “cradle-to-grave” emissions5 over the whole life cycle of the goods and services con-sumed by households, including resource extraction, material processing, manufacturing, delivery, retail, use, and disposal, but excluding land use, land use change, and forestry (LULUCF). When available emissions data was based on different systems boundaries, supplemen-tary data was used to expand the scope of the estima-tion wherever possible. The lifestyle footprints for each domain and major consumer articles were calculated by multiplying physical consumption data (amount per person per year) with life-cycle assessment (LCA) data (e.g. Wernet et al. 2016) on carbon intensities (emissions per unit) for the consumption domains of food, hous-ing, and personal transport. For the other three domains (goods, leisure, and services), a top-down method, with data from multi-region input-output models, was used.
Footprints of single items were summed up by com-ponents (e.g. meat, cereals and vegetables) and fur-ther, components to domains (food, housing, personal transport, goods, services, and leisure) (Table 2.1.). For a more detailed description of the lifestyle carbon foot-print calculations, see Annex A.
Table 2.1. Examples of the domain breakdown into components, sub-components and items
Domain Component Sub-components Items
Food Meat Beef, lamb, chicken, other Bovine meat, mutton & goat meat, poultry, pigmeat, edible offals, game meat
Housing Grid-electricity Renewable, non-renewable, nuclear
Hydropower, wind power, solar PV, natural gas, oil, coal, nuclear
Personal transport Car Conventional, flex fuel, gas, electric, hybrid
Petrol, diesel, ethanol, battery electric, plug-in hybrid
Other
Consumer goods Clothes Wearing apparel, footwear
Leisure Cultural Creative, arts, culture, entertainment services
Services Education Public education, private education

35
Section IA Budget for Living Within Limits
2.2.2. LimitationsThe data and methods used for this report have a num-ber of limitations, which should be kept in mind when reading the findings. First, the bottom-up LCA data used in the analysis cover major domains but do not fully cov-er all activities in all domains. Second, since the amount of consumption was estimated using official statistics and other nation-level data, there is a possibility that different definitions and collection methods have been used, resulting in potential inconsistencies. The gener-al quality of this data can also vary. Third, where data for the reference year (2019) was unavailable, statistics were drawn from the closest years for which data was available.
Other limitations related to data sources exist, such as differences in boundaries and assumptions of LCA-based carbon intensity data. Efforts were made to se-lect data sources that are based on the boundary used for this report, but there may be slight differences in boundaries and assumptions or, in some cases, uncer-tainty due to insufficiently described data (poor qual-ity metadata). Furthermore, country-specific data on carbon intensity was not always available. The report also assumed the intensity of imported products was the same as for domestic products.6 Uncertainty in foot-
6 Except for the top-down estimates based on the intensity data from the globally linked input-output (GLIO) model in Japan.
print estimation is a common issue, as even top-down I/O analysis-based estimations involve uncertainty due to model selection and sectoral aggregation, and models tend to have different results, in some cases significant-ly different (Arto et al. 2014; Owen et al. 2014; Steen-Ols-en et al. 2014). For more details, see Tables A.2-A.21 in Annex A.
Considering these limitations, intensity data for spe-cific items may not be fully comparable among coun-tries. This report therefore mainly compares more ag-gregated consumption, footprint, and intensity at the component level or domain level. The purpose is to il-lustrate the overall pattern of GHG emissions driven by different lifestyles rather than the footprint of particular products or services.
Another limitation is that available data only al-lows analysing the lifestyle carbon footprints based on national averages. This hides the huge differenc-es in lifestyles and carbon footprints that exist within all countries. There is a growing literature analysing greenhouse gas emissions from an equality perspective, which is highly complementary to the lifestyle carbon footprints approach (see subchapter 1.3). Finding ways to connect these analytical approaches is something to consider for future work.

36
Section IA Budget for Living Within Limits
2.3. Remaining carbon budget and reduction targets
In this report, proposed targets for Paris-aligned life-style carbon footprints are based on emission budget pathways found in the literature. One key assumption that distinguishes different pathways estimations is the utilisation of human-made carbon sink technologies (or negative emission technologies). For this reason, both pathways that utilise negative emission technologies at large scale and those that only rely on such technol-ogies to a very limited extent are included. Scenarios considered include those in the IPCC AR5 Scenario Da-tabase1, the United Nations Environment Programme Emissions Gap Report 2017 (UNEP 2017), as well as indi-vidual peer-reviewed papers in academic journals pub-lished after these reports. The scenarios used in this re-port were selected from the larger body of pathways, based on the following criteria:
→ Provides a pathway to keep the global average temperature increase below 2°C with at least 66% probability, or below 1.5°C with at least 50% probability.→ Provides a quantified estimate of a carbon budget on a time scale up to year 2100, information on the type of model, and the baseline scenario.→ Aims to limit atmospheric GHG concentration at 430–480 parts per million (ppm) CO₂e for 2°C target and 430–450 ppm CO₂e for 1.5°C target (in 2100).→ Estimates a cumulative carbon budget at 350–950 GtCO2 for 2°C target and less than 350 GtCO₂ for 1.5°C target (2011–2100).→ Covers CO₂, CH₄, N₂O, HFCs, PFCs, and SF₆ gases in its estimation.→ Explains the assumptions of “human carbon sink” utilisation (also known as negative emissions or CO₂ removal technologies).→ If formulated before the year 2015, assumes a global climate policy commitment is secured in the near future to reduce GHG emissions and limit the increase in the global average temperature (as represented by the Paris Agreement).
For more details, see Annex A in the first 1.5 Degree Life-styles Report (IGES et al. 2019).
One of the challenges of establishing long-term per capita carbon targets lies in the dynamics of GHG emis-sions and sinks. Proposing carbon budgets places limits on the amount of global emissions in order to stabilise the concentration of GHGs in the atmosphere; a num-ber of published emission scenarios suggest pathways for reducing total emissions at the global level, such as in the UNEP Emissions Gap Report 2016 (UNEP 2016). The proposed per-capita carbon footprint targets in this
report assume the targets will dynamically shrink over time, based on the selected emission scenarios.
In this report, the aim is to illustrate the per capi-ta GHG footprint budget for the final consumption of households for the 1.5°C target under the Paris Agree-ment as a main scenario and also for the 2°C target for indicating a range of targets. There are few modeling studies specifically focused on the 1.5°C target; such studies are typically iterations of 2°C pathway assess-ments with more stringent mitigation measures. Hence, in 1.5°C scenarios, meeting the 2°C target is projected with higher probability.
The three scenarios used in the study are taken from literature sources that were publicly available at the time the previous 1.5 Degree Lifestyles report (IGES et al. 2019) was written. They are labelled the 1.5D, 1.5S, and 2S scenarios, reflecting the temperature targets they are consistent with and whether they require large-scale deployment of carbon sink technologies (S) or minimise the need for such technologies through wide-spread use of demand-side measures (D). The 1.5S and 2S scenarios are described in Table 2.2. Scenario 1.5D was calculated as the average of the three scenarios de-scribed in Table 2.3. More details about the methodolo-gy for screening emissions scenarios and details of each shortlisted scenario can be found in the first 1.5-Degree Lifestyles Report, in Annex A (IGES et al. 2019).
This report estimates carbon footprints associated with average lifestyles primarily based on physical consump-tion data and life cycle assess-ment data on the carbon inten-sity of goods and services. This approach, using physical con-sumption data rather than eco-nomic data on consumer spend-ing, makes it easier to identify emission reduction opportuni-ties through either changes in consumption modes (such as mode of transportation or type of fuel used) or reduction of physical consumption (such as distance travelled).

37
Section IA Budget for Living Within Limits
Table 2.2. Shortlisted scenarios with reliance on carbon sinks
Scenario Description Reference
1.5S: 1.5°C with Human Carbon Sinks Scenario
Pathway to the 2°C target with 75% probability and the 1.5°C target with 50% probability, considering the use of all sinks starting before year 2050
(Rockström et al. 2017)
2S: 2°C with Human Carbon Sink Scenario
Pathway to the 2°C target with more than 66% probability, considering the use of CCS technologies
(Rogelj et al. 2011)
Table 2.3. Shortlisted scenarios with demand-side measures
Scenario Description Reference
1.5D (a): 1.5°C with Demand-side Measure Scenario
Pathway to the 1.5°C target with 60% probability, without the use of CCS
“A2” scenario from (Ranger et al. 2012)
1.5D (b): 1.5°C with Demand-side Measure Scenario
Pathway to the 1.5°C target with stringent measures to reduce end-of-pipe emissions and non-CO₂ GHG emissions.
“Low Non CO₂” scenario from (van Vuuren et al. 2018)
1.5D (c): 1.5°C with Demand-side Measure Scenario
Pathway to the 1.5°C target with land sector sequestra-tion, increased efficiency, renewable electricity, agricultural intensification, low non-CO₂ emissions, lifestyle changes, and low population growth.
“All Options” scenario from (van Vuuren et al. 2018)
2.3.1. Determining “fair” lifestyle carbon footprint targetsThe principle of ‘common but differentiated responsi-bilities and respective capabilities’ (CBDR) lies at the heart of the UN Framework Convention on Climate Change (UNFCCC) and the Paris Agreement.7 It implies that countries that have more responsibility for causing the climate crisis and more capacity to address it should reduce their emissions further and/or faster than those with less responsibility and capacity.
While the UNFCCC negotiations are conventional-ly based on national territorial rather than consump-tion-based emissions, the same basic equity princi-ple should nonetheless apply to deriving ‘fair’ lifestyle emissions footprint targets, if they are to be widely considered as legitimate (particularly by the govern-ments and citizens in lower income and less respon-sible countries).
7 See Article 3, paragraph 1 in the UNFCCC (United Nations 1992); and Article 2, paragraph 2 in the Paris Agreement (United Nations 2015).
A wide range of approaches have been proposed for operationalising the CBDR principle, based on different methods for determining the relative responsibilities and capabilities of different countries. One approach, in line with efforts to establish a fair consumption space, assumes that all countries began with an equal per capi-ta fair share of the global carbon budget before the start of the industrial revolution. It then calculates the his-toric responsibility of all countries—based on their con-sumption-based emissions—for global emissions since this time, and identifies those (principally Northern, high-income) countries that have surpassed their equal per capita fair share allocation (termed ‘debtors’), and those (principally Southern, lower-income) countries that remain within their allocation (termed ‘creditors’) (Hickel 2020).
In addition to these differentiated responsibilities, countries’ differentiated capabilities can be seen, for ex-

38
Section IA Budget for Living Within Limits
ample, in the different levels of GDP/capita at which the citizens of different countries are required to peak and then reduce their emissions if the world is to avoid sur-passing the remaining global carbon budget.8
Given that a minority of countries have already over-used their allocation of the carbon budget—and reached globally high income levels in the process—the only ‘fair’ target for their citizens’ lifestyle emissions today may logically be seen to be zero—or even negative. Indeed, the Civil Society Equity Review group, using an ap-proach to calculate ‘fair’ mitigation efforts for all coun-tries based on their responsibility and capability, de-rives substantially negative emissions targets for many countries (Climate Equity Reference Project 2015).9
But given the very significant social and environ-mental risks associated with negative emissions tech-nology at scale (Anderson and Peters 2016), one practi-cal means of operationalising this fair share approach is likely through a combination of deep emission reduc-tions by such high-income, over-using countries in ad-dition to the provision of financial, technological, and capacity-building support to lower-income countries to enable those countries to limit their emissions to less than their fair share. In practice, it could be reasonable to expect the citizens of high income countries that have over-used their allocation of the global carbon budget, to reduce their lifestyle footprints at least to the global average level needed by 2030 that is consistent with a 1.5°C global warming pathway, and in addition, provide significant financial and other types of support to ena-ble lower income countries to do the same (Gore, forth-coming).
Therefore, global average per capita lifestyle foot-prints are used for all countries to illustrate the order of magnitude of reductions that are necessary, although this assumes that lower-income countries will be enti-tled to substantial financial and other forms of support in order to limit their citizens’ footprints to this level.
2.3.2. National targets for footprint reductionIn this report, per-capita carbon footprint targets are assumed to be globally unified by 2030. Since climate change is a global scale phenomenon, the assumption is that everyone living in the same year in the world, regardless of age, location, and any other status, would have an identical carbon footprint target at the national average level. The approach partly adopts the concept of “contraction and convergence” proposed by (Meyer 2000), but with simplified assumptions. “Contraction
8 Presentation by Sivan Kartha to the UNFCCC plenary in 2012: (Davis 2012)
9 Note that the CSER approach (Climate Equity Reference Project 2015) calculates fair shares among countries not of the global carbon budget, but of the mitigation effort required to remain within the global carbon budget. Nonetheless the principle result— that some countries’ fair shares require negative emissions, based on their high responsibility and capability—remains the same.
and convergence” suggests that global greenhouse gas emissions should be reduced towards an equal per-cap-ita level across countries in the long run, while assum-ing different pathways of the reduction from current per-capita emission levels towards the target for each region. This approach incorporates a combination of ‘equality’ and ‘responsibility’ equity principles (Höhne et al. 2013; van den Berg et al. 2019).
“Contraction and convergence” refers to the con-vergence of per-capita emissions of countries estimat-ed based on territorial, production-based emissions. This is a different approach to this report, which focus-es on the footprints of household consumption from a carbon budget point of view. Analyses for this report are aimed at estimating the average per capita lifestyle car-bon footprint the inhabitants of the world can still afford while staying within the 1.5-degree aspirational target of the Paris Agreement with a certain probability. Such an estimation helps in understanding the lifestyle peo-ple can afford in the future, e.g. in 2030 and 2050. The implications on fairness from a consumption-based accounting perspective, as opposed to territorial based accounting, are twofold. First, historical emissions are not used as a basis for determining the carbon footprint of an average future lifestyle. Historical emissions are only accounted for insofar as they are reflected both in the sociotechnical context (e.g. roads, energy sourc-es, food imports) that affects the intensity and volume of consumption and in the carbon budget we have left nowadays after all those historical emissions. Second, fairness from a lifestyles carbon footprint perspective also incorporates fairness for future generations; future generations should have the opportunity of living de-cent lives.
However, estimations in this report still use average current footprints of the countries studied, and do not directly focus on individuals and individual household footprints. The first reason is that countries provide the best (though sometimes far from good-enough) statisti-cal basis for the bottom-up calculation of lifestyle carbon footprints. Second, countries are extremely relevant ac-tors influencing the conditions under which lifestyles and their carbon footprints emerge. Third, each country has its own conditions and starting situation as a basis for pursuing 1.5-degree lifestyles. High-income coun-tries may have more financial capability for facilitating the transition but they are also much more locked into unsustainable (infra)structures and consumption pat-terns. Middle- and lower-income countries may have

39
Section IA Budget for Living Within Limits
less financial capability but leap-frogging could help them jump directly into more sustainable lifestyles in-cluding technologies and infrastructures. Overall, av-erage lifestyle carbon footprints by country provide a fairly good basis for illustrating, imagining, and imple-menting both the transition to 1.5-degree lifestyles and how to make decisions by governments, businesses, and individuals that facilitate this transition.
Rather than trying to precisely simulate reduction pathways for each country, per-capita targets are here calculated based on the mathematical means of the se-lected emission scenarios. In order to do this, the total GHG emission limit per year was divided by the estimat-ed population of the reference year based on the median projection of the 2017 Revision of the World Population Prospects (United Nations 2017), thus the per-capita carbon footprint targets in this report use the formu-la below:
Per-capita annual carbon footprint target= Annual global emission target / projected world population
To determine the share of national carbon footprints that is directly related to individual lifestyles, this re-port relies on the results of existing I/O analyses of multi-country carbon footprint estimates. Of these, Hertwich and Peters (2009) cover 73 countries and 14 aggregated regions for 2001 using the Global Trade Analysis Project (GTAP) database, giving an average share of carbon footprint by household consumption at the global level of 72%.10 Another study, Ivanova et al. (2016), gives an estimate of 65%±7% (mean ± stand-ard deviation). Although the latter study is more recent (based on 2007 data), it only considers 43 countries (EX-IOBASE database) and is skewed towards the EU. The 72% was selected for this report and the lifestyle carbon footprint targets were calculated as follows:
Per-capita annual lifestyle carbon footprint target= Per-capita annual carbon footprint target x 0.72
It should be noted that the above estimates are some-what uncertain since they are based on the very few publicly available household footprint share calcula-tions. Also, the assumed share in the present report is based on a mean of the countries included in the afore-mentioned study, which does not consider the variation among countries, due to their economic structure and the level of per-capita carbon footprints. Furthermore,
10 The remaining 28% is divided between government consumption (10%) and investments (18%) (Hertwich and Peters 2009). Examples of government consumption include road and infrastructure repairs and national defence; examples of investments include factories, transport equipment, and materials used for the future production of goods.
the household footprint shares in this report are fixed towards the future, without assuming shifts over time in the allocation of carbon footprints between households, public sector, and capital investment.
This report proposes per-capita footprints targets for 2030, 2040, and 2050. However, the targets do not consider historical emissions, or climatic or other nat-ural conditions of the countries concerned. Instead, the proposed targets are based on a simplified calcula-tion using population projections and household foot-print share, and thus do not consider dynamic aspects of modeling of consumer lifestyles and scenario analy-sis, which should be further researched in the future.
2.3.3. Reduction options and scenariosIn addition to calculating current lifestyle carbon foot-prints for the ten countries, the study also assessed the emission reduction impact of a wide range of options selected and analysed for each country (see Chapter 4). Options were identified through a literature review and selected to represent three categories of change: reduced physical consumption (called absolute reduc-tion), shifted consumption to low-carbon alternatives (called modal shift), and reduced life cycle carbon inten-sity (called efficiency improvement). For each option, the amount of greenhouse gas emissions that could be saved was calculated for different adoption rates. Based on these results, for each country, a limited number of options were selected based on their calculated effec-tiveness in terms of reducing emissions.
The study also developed country-specific scenari-os towards the intermediate emission target of 2.5tCO₂e per person per year (Chapter 6). For each country, two distinct scenarios were created—one relying to a greater extent on options that individual consumers have more direct influence over and the other focused on efficiency improvements in provisioning systems. In practice, all scenarios include a combination of these two approach-es but the emphasis differs. Each scenario was estab-lished by combining a range of improvement options taken from those identified and assessed in Chapter 4, with varying assumptions on adoption rates, through an iterative process until the 2.5t target was met. In those calculations, care was taken to ensure that consump-tion amounts did not drop to unrealistic levels that could threaten health and wellbeing (i.e. the floor levels of the fair consumption space, see subchapter 1.4).

Section IIHotspots and Options for Footprint Reductions
40
Section II Hotspots and Options for Footprint Reductions

41
Section IIHotspots and Options for Footprint Reductions
3 – Lifestyle Carbon Footprints
T he focus of this report is on the daily ac-tivities of individuals determined by their lifestyle choices. To achieve this, the report uses the unit of lifestyle carbon footprints: GHG emissions both directly emitted and
indirectly induced by household consumption, exclud-ing those induced by government consumption and capital formation.11 Through consumption-based ac-counting, and by excluding emissions from government expenditure and capital formation, lifestyle carbon foot-prints allow a strong focus on emissions resulting from deliberate individual choices and due to lock-in effects of sociotechnical systems, which inevitably constrain these choices (Akenji and Chen 2016).
Household resource consumption is classified into six domains, based on previous studies, e.g., Michaelis and Lorek (2004); Tukker et al. (2006); Kotakorpi et al. (2008); Seppälä et al. (2011); Lettenmeier et al. (2014), as follows:
Food: intake of all foodstuffs and beverages consumed at home and outside the home, e.g., meat, fish, dairy, ce-real, vegetable and fruit, and alcohol and nonalcoholic beverages.12
Housing: housing infrastructure and supply of utilities, e.g., construction, maintenance, energy use, and water use.
11 Examples of government consumption include road and infrastructure repairs and national defence; examples of capital formation include factories, transport equipment, and materials used for the future production of goods.
12 Direct emissions from cooking at home are included under housing, whereas emissions from operation of restaurants are included under leisure.
13 Emissions from business purpose trips are excluded here as they are included under respective domains of the products and services supplied.
14 Emissions from ingredients of food taken out of home are included in food, whereas direct emissions from leisure performed at home are included in housing.
15 Public services covered by government expenditure are excluded from lifestyle carbon footprints.
16 Scenario 1.5D was calculated as the average of the three scenarios described in Table 2.2
Personal transport: use of owned transport equipment and transportation services for commuting, leisure, and other personal purposes, e.g., cars, motorbikes, public transport, air travel, and bicycles.13
Consumer goods: goods and materials purchased by households for personal use not covered by other do-mains, e.g., home appliances, clothes, furniture, daily consumer goods.14
Leisure: activities performed outside of the home, e.g., sports, culture, entertainment, and hotel services. Services: services for personal purposes, e.g., insur-ance, communication and information, ceremonies, cleaning and public baths, and public services.15
The targets of lifestyle carbon footprints (carbon foot-prints from households) in the five shortlisted scenar-ios16 (introduced in Chapter 2, Tables 2.2 and 2.3) are summarised in Figure 3.1–3.2. In terms of all GHGs, the ranges of the estimated lifestyle carbon footprint targets for 2030, 2040, and 2050 are respectively 3.2–2.5, 2.2–1.4, and 1.5–0.7 tCO₂e per capita (IGES et al. 2019). The ranges overlap due to different assumptions regard-ing negative emission technologies and temperature targets. The selection of targets between the lower and higher ends depends on assumed long-term availability

42
Section IIHotspots and Options for Footprint Reductions
of human carbon sinks or negative emissions technolo-gies, such as BECCS, and the selection of the global aver-age temperature targets, either 1.5°C or 2.0°C.
Based on our review of the emission scenarios, we need to aim for a lifestyle carbon footprints target of 0.7 tCO₂e by
6.0
Lifestyles Carbon Footprint Budget (tCO₂e/cap/yr)
5.0
4.4
3.0
2.2
1.5
0.7
4.94.8
3.2
2.2
0.81.4
4.6
3.9
2.5
1.4
0.7
4.0
3.0
2.0
1.0
0.0
1.5D Scenario (tCO₂e/cap/yr) 1.5S Scenario (tCO₂e/cap/yr) 2S Scenario (tCO₂e/cap/yr)
Note: Global total emission budget was adopted from Rockström et al. (2017) for 1.5S, Rogelj et al. (2011) for 2S, and calculated as a mean of the “A2” scenario from Ranger et al. (2012) and “Low NonCO₂ “ and “All Options” scenarios from Van Vuuren et al. (2018) for 1.5D. The emis-sion budget was divided by popula-tion projections from United Nations (2017) and multiplied by the house-hold footprint share estimated by Her-twich and Peters (2009) to estimate lifestyle carbon footprint budget.
2010 2030 2050 2070 2090
Figure 3.1. Lifestyle carbon footprint budget from shortlisted mitigation pathways
0.3
4.1
7.0
Carbon Footprint Budget (tCO₂e/cap/yr)
6.06.3
5.4
2.5
1.4
0.70.3
4.6
3.93.4
2.0
1.0
0.4
5.0
4.0
3.0
2.0
1.0
0.0
Total carbon footprint 1.5 degree (tCO₂e/cap/yr)
Lifestyle carbon footprint 1.5 degree (tCO₂e/cap/yr)
Note: Global total emission budget was calculated as a mean of “A2” scenario from Ranger et al. (2012) and “Low Non-CO₂ “ and “All Options” scenarios from Van Vuuren et al. (2018) for 1.5D Sce-nario. The emission budget was divid-ed by population projections from Unit-ed Nations (2017) and multiplied by the household footprint share estimated by Hertwich and Peters (2009) to estimate lifestyle carbon footprint budget.
2010 2030 2050 2070 2090
Figure 3.2. Lifestyle carbon footprint budget comparable with 1.5°C target (without or with less use of negative emission technologies)
2050, with proposed intermediary targets of 2.5 in 2030 and 1.4 tCO₂e by 2040. These targets are in line with the 1.5°C aspirational target of the Paris Agreement and for global peaking of GHG emissions as soon as possible without rely-ing on the extensive use of negative emission technologies.

43
Section IIHotspots and Options for Footprint Reductions
3.1. Comparing lifestyle carbon footprints
Total average lifestyle carbon footprints vary notably between the countries analysed for this report—Can-ada has the highest at 14.2 tCO₂e per year, followed by Finland at 9.7, the United Kingdom at 8.5, Japan at 8.1, China at 5.0, South Africa and Turkey at 4.9, Brazil at 3.2, India at 3.0, and Indonesia at 2.2 tCO₂e. The results are visualized in Figure 3.3, which gives the total foot-print and its breakdown into different components in tons CO₂e/cap/yr for each country. Compared with the carbon footprint target proposed for 2030 (2.5 tons per capita in terms of all GHGs), Canada, Finland, the Unit-ed Kingdom, and Japan heavily exceed the targets; Chi-na, Turkey and South Africa overshoot moderately; and
Globally unified targets for the lifestyle carbon footprints
2050 20300.7 2.5 tonnes CO2e / capita / year
Indonesia
India
Brazil
Turkey
South Africa
China
Japan
United Kingdom
Finland
Canada
Food 1.8 1.6 Transport 3.7 1.4 1.2 Total 9.7 tonnes CO2e / capita / year
14.2Food 2.3 Housing 3.1 Transport 5.0 Goods 2.5 1.4
Leisure + Services
Transport 3.3Food 1.6 Housing 1.9 1.0 .8 8.5
Food 1.4 Housing 2.4 2.0 1.0 1.2 8.1
.81.3 1.2 1.2 .4 5.0
Food 1.7 1.0 1.2 .7 4.9
1.2 1.7 1.0 .6 4.9
Food 1.9 .5 .6 3.2
.8 1.7.4 3.0
.8 .6 .6 2.2
Note: Average lifestyle carbon footprint of country estimated as of 2019. The horizontal lines indicate 1.5D footprint targets for 2030 and 2050 (1.5°C without/less use of negative emissions technologies).
Figure. 3.3. Carbon footprint and its breakdown between consumption domain and globally unified targets for the lifestyle carbon footprints
Brazil and India slightly. As a result, lifestyle carbon footprints need to drop by the following percentages by 2030: Canada 82%, Finland 74%, the United King-dom 70%, Japan 69%, China 50%, South Africa 49%, Turkey 49%, Brazil 23%, and India 14%. Indonesia is al-ready currently close to the target level set for 2030 (Ta-ble 3.1). The lifestyle footprint target for 2050 (0.7 tons per capita in terms of all GHGs) is exceeded in all case countries. Large footprint reductions of 95% and 93% are needed in Canada and Finland, respectively, 92% and 91% reductions are needed in the United Kingdom and Japan, and 86% reductions are needed in China, Turkey, and South Africa. Reductions are also needed in Brazil, India, and Indonesia of 78%, 76%, and 68%, respectively.

44
Section IIHotspots and Options for Footprint Reductions
Table 3.1. Current annual lifestyle carbon footprint per capita and reduction targets for case countries
Current annual lifestyle carbon footprint (tCO₂e/cap/year)
Domain Canada Finland United Kingdom Japan China South Africa Turkey Brazil India Indonesia
Food 2.3 1.8 1.6 1.4 1.3 1.7 1.2 1.9 0.8 0.8
Housing 3.1 1.6 1.9 2.4 1.2 1.1 1.7 0.5 0.4 0.6
Transport 5.0 3.7 3.3 2.0 1.2 1.2 1.0 0.6 1.7 0.6
Goods 2.5 1.4 1.0 1.0 0.4 0.7 0.6 0.1 <0.1 0.1
Leisure & Services 1.4 1.2 0.8 1.2 0.8 0.2 0.3 0.1 <0.1 0.1
Total 14.2 9.7 8.5 8.1 5.0 4.9 4.9 3.2 3.0 2.2
Reduction targets for lifestyle carbon footprints
2.5 tCO₂e/ person/ yr by2030
82% 74% 70% 69% 50% 49% 49% 23% 16%
0.7 tCO₂e/ person/ yr by 2050
95% 93% 92% 91% 86% 86% 86% 78% 76% 68%
3.2. Overall patterns and analysis per economic grouping
This section elaborates country-specific results by com-paring the overall patterns and hotspots of the aver-age lifestyle carbon footprints per economic grouping. While differences in culture and infrastructure (Aken-ji et al. 2016; Akenji and Chen 2016) and availability of public services (Ottelin et al. 2018) shape lifestyle-re-lated consumption patterns in countries, characteris-tics provide a clear point of comparison between coun-tries, not only because related data is widely collected, but also because income levels correlate with levels of consumption and impacts of lifestyles (United Nations 2018). For country-specific data sources and details of estimation results, refer to Annex A.2 and B.
3.2.1. FoodOverall the food domain is relatively similar in foot-prints between all case countries (Figure 3.4), except In-dia and Indonesia where overall meat consumption is notably lower compared to other countries. In South Af-rica and Brazil, meat, especially beef, is reflected in the footprints due to relatively high consumption and no-tably higher carbon intensity compared to other coun-tries. In addition to meat, dairy products are another major contributor to footprints, especially in high-in-come countries, such as Canada and Finland, due to high consumption of milk and carbon-intensive cheese.
Also different food cultures are reflected in the foot-prints as different consumption patterns between case countries: fish consumption is high in Japan, China,
and Indonesia, whereas those countries have the low-est dairy consumption among all case countries; beans are eaten most in Japan, Turkey, India, and Indonesia, whereas meat consumption has the overall lowest share of the total food consumption in these case countries; high consumption of carbon-intensive rice reflects on the footprints in Japan, China, India and Indonesia.
In the high-income countries, meat consumption is the largest contributor to the average person’s carbon footprint for food, varying across countries—from the 160 kg eaten in Canada to the 40 kg eaten in Japan, as shown in Figures 3.4 and 3.5. In Figure 3.5, the results are visualized using “skyline charts”, which give the amount of consumption (x-axis) and the carbon intensity (y-ax-is) for the different components. The size of each rec-tangle thus expresses the component’s carbon footprint, and the left-right order of the rectangles represents the highest-to-lowest footprint of components. In these charts, the average intensity and total consumption in each domain is indicated by dotted grey rectangles, and the 1.5-degree targets for 2030 and 2050 as red and blue rectangles, respectively. In the United Kingdom and Fin-land, most of the meat consumed is pork (31% and 39%, respectively) and chicken (38% and 33%, respectively). In Canada, half of the meat consumed is chicken (51%), yet, Canada has the highest beef consumption (54 kg) due to the overall high consumption of meat.
Dairy products are another significant contributor to the carbon footprint in Canada, Finland, and the United Kingdom. In Canada and Finland this is due to the large consumption of milk, carbon-intensive cheese, and oth-er dairy products. In the United Kingdom, the total dairy

45
Section IIHotspots and Options for Footprint Reductions
consumption is only given in milk liters in the current data (Food and Agriculture Organization of the United Nations 2021). In Japan, dairy consumption is less than half of the other high-income countries, which could be due to cultural habits.
Other major contributors to food are cereals and bev-erages. Cereals have relatively high intensity in Japan due to rice consumption, which tends to have higher in-tensity than wheat and other cereals consumption. The share of beverages in the food footprint is explained in Finland by the relatively high consumption (10 kg/capi-ta/year) of highly carbon-intensive coffee and in Canada and the United Kingdom by the relatively high consump-tion of relatively carbon-intensive alcohol products, such as beer. Beans are a relatively low-carbon and pro-tein-rich food, but their consumption is very limited in high-income countries, with over 20 kg in Japan and less than 5 kg in Canada, Finland, and the United Kingdom.
In the upper-middle income countries the overall amount of food consumed is relatively similar to high-in-come countries.17 The overall meat consumption is rela-tively similar to high-income countries: it varies from 104 kg in Brazil to 41 kg in Turkey. Indonesia is an exception where meat consumption is only 14 kg. Beef is respon-sible for the greatest share of the meat-related footprint
17 In comparison between the average intake of high-income, upper-middle income, and lower-middle income countries studied.
due to it’s high carbon intensity, especially in South Af-rica and Brazil. Yet, in Turkey, South Africa, Brazil, and Indonesia, most of the meat consumed is chicken (51%, 55%, 45%, and 52%, respectively). Indonesia has the highest fish consumption of all countries (45 kg) and it accounts for the second largest share (13%) of the coun-try’s total footprint, as it has relatively high intensity.
Cereals and vegetables often account for the largest share of total consumption but the related footprint for the most part remains small due to the notably lower carbon intensity. Share of total intake for cereals varies from 49% in Indonesia to 13% in Brazil, and for vegeta-bles from 45% in China to 13% in Brazil. In China and Indonesia, cereals have a relatively high carbon foot-print (20% and 52% of the food footprint), due to the high share of carbon-intensive rice consumption (In China 61% and in Indonesia 75% of the cereal consumption).
Dairy consumption varies a lot within middle income countries. Dairy plays only a minor role in the food car-bon footprint in China, South Africa, and Indonesia (3%, 4% and 2%, respectively). In Turkey and Brazil total dairy consumption is close to that of high-income countries (179 kg and 142 kg, respectively). Dairy consumption is also trending upward in many countries (Food and Agri-culture Organization of the United Nations 2021).
Figure. 3.4. Food-related carbon footprint (tCO₂e/cap/yr) and its breakdown between consumption components
0 0.5 1.0 1.5 2.0 2.5
Canada Meat 1.39 Dairy .34 E C V F Bev .19 O 2.27
Finland Meat .68 Dairy .55 E F C V F Bev .21 O 1.83
United Kingdom Meat .69 Dairy .37 F C V Bev O 1.59
Japan Meat .33 Dairy F Cereals Veg F Bev O 1.40
China Meat .52 D E F Cereals Veg .19 B O 1.33
South Africa Meat 1.23 D C V B O 1.71
Turkey Meat .40 Dairy .32 C Veg F O 1.21
Brazil Meat 1.11 Dairy .24 C Bev Other 1.88
India Dairy Cereals .42 V O .78
Indonesia M F Cereals .41 V O .80
Footprint, tonnes CO₂e / capita / year
Animal products Other foodsEggs
Fruits
BeveragesBeans+nuts
Vegetables

46
Section IIHotspots and Options for Footprint Reductions
In India, the lower-middle income country studied, the total food consumption amount is the smallest com-pared to the high-income and upper-middle income countries studied. Most of the food consumed is plant-based (72%), as vegetarianism is a predominant diet. The main protein source together with beans and nuts are dairy products—the consumption of which is similar to high-income countries (approximately 110 kg). India has the highest consumption of beans and nuts (26 kg) among all countries.
Similar to Indonesia, only very little meat is con-sumed in India (less than 5 kg), of which more than half (54%) is chicken. Fish consumption is one of the low-est (only 7 kg), similar to Canada, Turkey, South Africa, and Brazil.
As indicated by the dotted rectangles in Figure 3.5, the food footprints of high-income countries need to be greatly reduced: by 47–68% by 2030 and by 75–85% by 2050. For upper-middle income countries, the food foot-prints need to be reduced by 7–61% by 2030 and 56–82% by 2050. For the lower-middle income country, India, the reduction required in the food footprint is 6% by 2030 and 56% by 2050. Yet, the estimated reduction required in food is below that of other domains as there is less variation in current footprints, reflecting that food is considered a ne-cessity (see the first 1.5-Degree Lifestyles Report, Annex D (IGES et al. 2019) for more details). Shifting nutrition sources and reducing carbon intensity or physical con-sumption amounts where possible while satisfying nutri-tional requirements can contribute to reducing footprints.
0 200 400 600 800 1,0000
2
4
6
8
10
12
Meat
Dairy
Beverages
Other
VegetablesCereals
Fruits
Eggs Fish
Beans +nuts
Current
20302050
Amount of food consumption (kg / capita / year)
Carbon intensity (kg CO₂e / kg)
Canada2,270kg CO₂e
Animal productsOther foodstuffs
0 200 400 600 800 1,0000
2
4
6
8
10
12
Meat
Dairy
Beverages Other
Cereals
Vegetables
Fish Eggs
Fruits
Beans + nutsCurrent
20302050
Amount of food consumption (kg / capita / year)
Carbon intensity (kg CO₂e / kg)
United Kingdom1,590kg CO₂e
Animal productsOther foodstuffs
0 200 400 600 800 1,0000
2
4
6
8
10
12
Meat
Dairy
Beverages Other
CerealsVegetables
Fruits
Fish EggsBeans + nutsCurrent
20302050
Amount of food consumption (kg / capita / year)
Carbon intensity (kg CO₂e / kg)
Finland1,830kg CO₂e
Animal productsOther foodstuffs
0 200 400 600 800 1,0000
2
4
6
8
10
12
Meat
Cereals
Dairy
Vegetables
Other
Fish
FruitsEggs
Beans + nuts
Current20302050
Amount of food consumption (kg / capita / year)
Carbon intensity (kg CO₂e / kg)
Japan1,400kg CO₂e
Animal productsOther foodstuffs
Beverages
Figure 3.5. A comparison of carbon footprints and their breakdown (food, in kgCO₂e/cap/year 2019) in higher-income countries (A) and upper and lower middle-income countries (B)
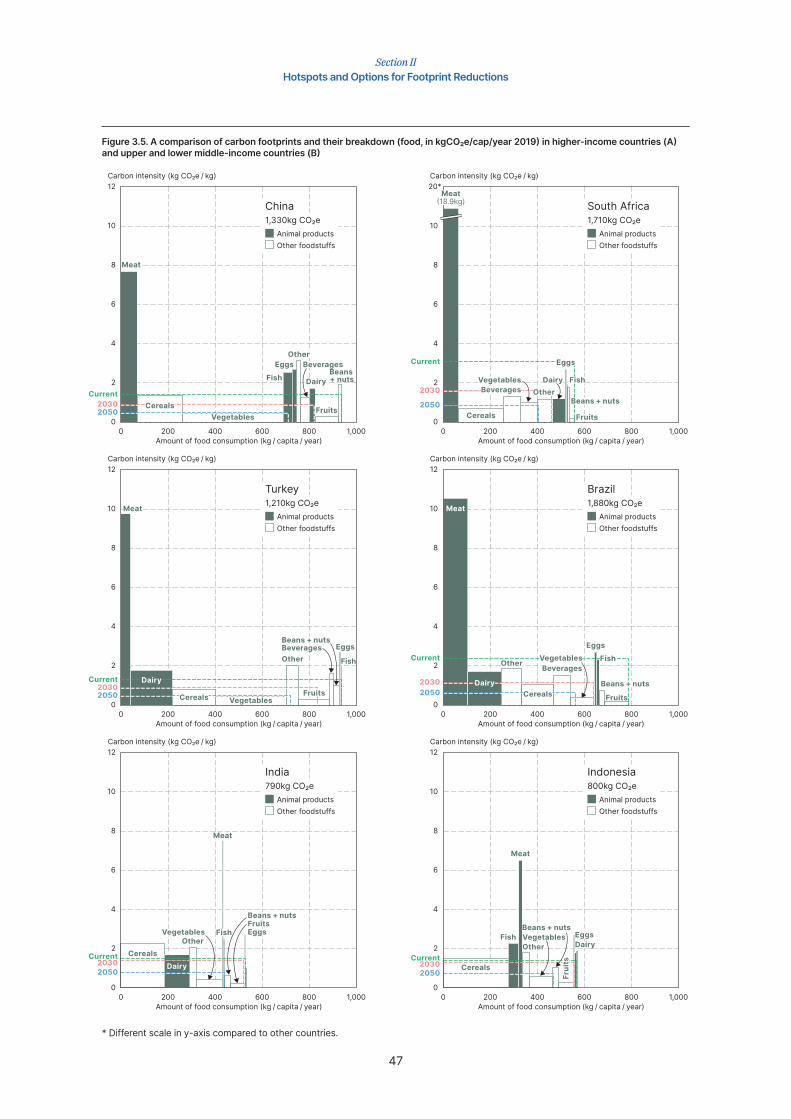
47
Section IIHotspots and Options for Footprint Reductions
0 200 400 600 800 1,0000
2
4
6
8
10
12
Meat
CerealsVegetables
Fish
EggsOther
Beverages
Dairy
Fruits
Beans + nuts
Current20302050
Amount of food consumption (kg / capita / year)
Carbon intensity (kg CO₂e / kg)
China1,330kg CO₂e
Animal productsOther foodstuffs
0 200 400 600 800 1,0000
2
4
6
8
10
20*Meat
BeveragesVegetables
OtherDairy
Eggs
Fish
Beans + nuts
Fruits
Current
2030
2050
Amount of food consumption (kg / capita / year)
Carbon intensity (kg CO₂e / kg)
South Africa1,710kg CO₂e
Animal productsOther foodstuffs
Cereals
0 200 400 600 800 1,0000
2
4
6
8
10
12
Meat
Dairy
Cereals Vegetables
Other
Fruits
BeveragesBeans + nuts
Eggs
Current20302050
Amount of food consumption (kg / capita / year)
Carbon intensity (kg CO₂e / kg)
Turkey1,210kg CO₂e
Animal productsOther foodstuffs
Fish
0 200 400 600 800 1,0000
2
4
6
8
10
12
Meat
Dairy
Other
Cereals
BeveragesVegetables
EggsFish
Beans + nuts
Current
20302050
Amount of food consumption (kg / capita / year)
Carbon intensity (kg CO₂e / kg)
Brazil1,880kg CO₂e
Animal productsOther foodstuffs
Fruits
0 200 400 600 800 1,0000
2
4
6
8
10
12
CerealsDairy
OtherVegetables
Meat
Fish
Beans + nutsFruitsEggs
Current20302050
Amount of food consumption (kg / capita / year)
Carbon intensity (kg CO₂e / kg)
India790kg CO₂e
Animal productsOther foodstuffs
0 200 400 600 800 1,0000
2
4
6
8
10
12
Fish
Meat
OtherVegetablesBeans + nuts
Frui
ts
EggsDairy
Current20302050
Amount of food consumption (kg / capita / year)
Carbon intensity (kg CO₂e / kg)
Indonesia800kg CO₂e
Animal productsOther foodstuffs
Cereals
Figure 3.5. A comparison of carbon footprints and their breakdown (food, in kgCO₂e/cap/year 2019) in higher-income countries (A) and upper and lower middle-income countries (B)
* Different scale in y-axis compared to other countries.

48
Section IIHotspots and Options for Footprint Reductions
3.2.2. HousingIn the housing domain, non-renewable grid electricity is an important source of lifestyle carbon footprints in all countries, as shown in Figure 3.6. In addition, gas used for heating and cooking is another major contrib-utor to the footprint for some countries, such as the United Kingdom, Japan, and Turkey. Large average liv-ing spaces and higher living standards are reflected as higher footprints in high-income countries. This is es-pecially the case in Canada and Finland, where large living spaces together with long and cold winters in-crease the overall energy demand. Nevertheless, the housing footprint is notably higher in Canada due to relatively high consumption of carbon-intensive ener-gy sources, such as natural gas. Also a high share of re-newable grid energy is based on pumped hydropower, which has the highest carbon intensity compared to all other renewable energy sources. In Finland, a high share of the heating energy (the largest share of over-all energy consumption) is based on district heating, which has lower intensity due to the relatively high share of renewable energy sources. In Japan, overall energy demand is the lowest of the high-income coun-tries studied but is mostly based on non-renewable en-ergy sources, which is similar in the upper and lower middle-income countries studied.
0 0.5 1.0 1.5 2.0 2.5 3.0 3.5
Canada .52 Non-renewable .76 Renewable .68 Gas .54 Oil .36 N-r 3.05
Finland Non-r .51 R Oil Non-r .55 1.57
United Kingdom .35 Non-r .36 Gas .93 Oil 1.89
Japan .48 Non-renewable 1.32 Gas .34 Oil W 2.43
China .37 Non-r .56 G N 1.19
South Africa Non-renewable .79 1.04
Turkey Non-r .45 Gas Oil .55 N-r 1.69
Brazil N G .50
India C N-r G .43
Indonesia N-r G OW .59
Footprint, tonnes CO₂e / capita / year
Figure 3.6. Housing-related carbon footprint (tCO₂e/cap/yr) and its breakdown between consumption components
Note: Construction/maintenance covers emissions related to the living space (m2/person).
High-income countries have large living space per capita, varying from the United Kingdom’s 39m² to Can-ada’s 58m² per person, with construction and mainte-nance accounting for up to a fifth (from 15% for Finland up to 22% for the United Kingdom) of the footprint (see Figure 3.6). However, there are big differences in direct energy use (from Canada’s 11,500 to Japan’s 4,200 kWh) (see Figure 3.7), and energy use per living space (from Finland’s 280 to Japan’s 100 kWh per m²). This is partly because of the high energy demand for heating in Can-ada, Finland, and the United Kingdom—for indoor heat-ing and water heating, 63–67% and 15–17%, respective-ly. In addition, 5% of the households’ energy use is for sauna heating in Finland. Japan has a relatively high de-mand for hot water use of 29%, whereas indoor heating and cooling only account for, respectively, 22% and 2% of the home energy consumption (Agency for Natural Resources and Energy, Japan 2017).
Electrification of direct housing energy use with re-newables can contribute to low-carbon lifestyles, but non-renewable electricity can be less efficient in com-parison with non-electricity energy sources. Japan has the highest electrification rate of direct energy con-sumption in the housing domain among high-income countries, with 51% compared to lowest 22% in the United Kingdom. Typically, electricity-based room tem-

49
Section IIHotspots and Options for Footprint Reductions
perature control systems such as heat pumps have high-er energy conversion efficiency at the household level. If fossil fuels are used to produce the grid electricity for home heating, it generally has higher carbon intensity than home-heating systems using non-renewable heat-ing energy because the conversion efficiency of pow-er plants is relatively low. Therefore, electrification of home energy sources should be promoted together with renewable-based grid electricity.
The carbon intensity of grid electricity in Canada, Finland, and the United Kingdom is about half that in Japan (0.15–0.31 vs 0.63 kgCO₂e/kWh), as a large share comes from renewables (37–65%), whereas 84% of Ja-pan’s electricity is generated from fossil fuel, over a third
of which (39%) is coal. For Canada, over 90% of the re-newable grid-electricity is hydropower and of that 40% is based on pumped hydropower, which has higher in-tensity compared to natural gas used for heat and pow-er cogeneration. Thus, the average carbon intensity for Canadian grid electricity is twice as high compared to Finland and the United Kingdom yet only half of Japan’s.
For non-electricity energy, Japanese homes typically use LPG and urban gas for heating and cooking, as well as kerosene for heating (49% of overall energy from housing). On the other hand, 48% of the energy used for room and water heating in Finnish homes is dis-trict heat, which has relatively low carbon intensity despite nearly half of it being non-renewable based,
Figure 3.7. A comparison of carbon footprints in higher-income countries (A) and upper and lower middle-income countries (B) (housing energy, in kgCO₂e/cap/year 2019)
0 2,500 5,000 7,500 10,000 12,5000
0.2
0.4
0.6
0.8
1.0
1.2
Non-renewable
Renewable
Gas
Oil
Other non-renewable
Other renewable
Nuclear
Current
20302050
Amount of energy consumption (kWh / capita / year)
Carbon intensity (kg CO₂e / kWh)
Canada3,060kg CO₂e
Grid electricityOther energy
0 2,500 5,000 7,500 10,000 12,5000
0.4
0.6
0.8
1.0
1.2
Gas
Non-renewable
Other non-renewable
Other renewableRenewable
Current
2030
2050
Amount of energy consumption (kWh / capita / year)
Carbon intensity (kg CO₂e / kWh)
United Kingdom1,890kg CO₂e
Grid electricityOther energy
Oil
0 2,500 5,000 7,500 10,000 12,5000
0.2
0.4
0.6
0.8
1.0
1.2
Other non-renewable
Non-renewable
Oil
Renewable
Other renewable
Gas
Nuclear
Current20302050
Amount of energy consumption (kWh / capita / year)
Carbon intensity (kg CO₂e / kWh)
Finland1,570kg CO₂e
Grid electricityOther energy
0 2,500 5,000 7,500 10,000 12,5000
0.2
0.4
0.6
0.8
1.0
1.2
Non-renewable
Gas Oil
Renewable
Current
2030
2050
Amount of energy consumption (kWh / capita / year)
Carbon intensity (kg CO₂e / kWh)
Japan2,430kg CO₂e
Grid electricityOther energy

50
Section IIHotspots and Options for Footprint Reductions
Figure 3.7. A comparison of carbon footprints in higher-income countries (A) and upper and lower middle-income countries (B) (housing energy, in kgCO₂e/cap/year 2019)
0 2,500 5,000 7,500 10,000 12,5000
0.2
0.4
0.6
0.8
1.0
1.4*
Non-renewable
Other non-renewableGas
Renewable
Current
2030
2050
Amount of energy consumption (kWh / capita / year)
Carbon intensity (kg CO₂e / kWh)
China1,190kg CO₂e
Grid electricityOther energy
0 2,500 5,000 7,500 10,000 12,5000
0.2
0.4
0.6
0.8
1.0
1.2
Non-renewable
Other non-renewableOil
Current
2030
2050
Amount of energy consumption (kWh / capita / year)
Carbon intensity (kg CO₂e / kWh)
South Africa1,050kg CO₂e
Grid electricityOther energy
0 2,500 5,000 7,500 10,000 12,5000
0.2
0.4
0.6
0.8
1.0
1.2
Oil
Renewable
Gas
Other non-renewable
Non-renewable
Other renewable
Current
2030
2050
Amount of energy consumption (kWh / capita / year)
Carbon intensity (kg CO₂e / kWh)
Turkey1,700kg CO₂e
Grid electricityOther energy
0 2,500 5,000 7,500 10,000 12,5000
0.2
0.4
0.6
0.8
1.0
1.2
Gas
Non-renewable
Renewable
Other non-renewable
Other renewable
Current2030
2050
Amount of energy consumption (kWh / capita / year)
Carbon intensity (kg CO₂e / kWh)
Brazil500kg CO₂e
Grid electricityOther energy
0 2,500 5,000 7,500 10,000 12,5000
0.2
0.4
0.6
0.8
1.0
1.6*
Non-renewable
GasRenewable
Oil
Current
2030
2050
Amount of energy consumption (kWh / capita / year)
Carbon intensity (kg CO₂e / kWh)
India430kg CO₂e
Grid electricityOther energy
0 2,500 5,000 7,500 10,000 12,5000
0.2
0.4
0.6
0.8
1.0
1.2
Non-renewable
Gas
Oil
Renewable
Current2030
2050
Amount of energy consumption (kWh / capita / year)
Carbon intensity (kg CO₂e / kWh)
Indonesia590kg CO₂e
Grid electricityOther energy
* Different scale in y-axis compared to other countries.

51
Section IIHotspots and Options for Footprint Reductions
and 34% of the energy used for room, sauna, and wa-ter heating is from wood, which is classified as carbon neutral (except for indirect emissions such as trans-port and production). Canada and the United King-dom rely heavily on natural gas as the main energy source for heating, but the intensity for natural gas is over a fifth lower compared to LPG and urban gas used in Japan. As a result, for direct housing energy use, the overall renewable share in Canada and Fin-land is higher than in the United Kingdom and Japan (38–39% vs. 14–8%).
For upper-middle income countries, overall housing footprints, size of living space and energy demand are mainly lower compared to high-income countries (500–1,700 kgCO₂e, 19–41m², 1,100–1,900kWh, respectively, see Figure 3.7), resulting in a lower average carbon in-tensity per living space (36 kgCO₂e/m²) compared to high-income countries (50 kgCO₂e/m²). The smaller liv-ing space per person is due to the higher average num-ber of household members. The lower energy demand is due to less use of appliances and electricity and the lower heating demand is explained by the fact that the upper-middle income countries are situated in warmer regions of the world. Compared to Brazil’s high share of renewables in total energy demand (65%), that of Tur-key, China, South Africa, and Indonesia is much lower (17%, 9%, 14% and 12%, respectively) so that also the carbon intensity of grid electricity in these countries is significantly higher. In Brazil, 83% of grid electricity is
renewables, mainly hydropower. On the contrary, grid electricity is generated mainly with coal and its deriva-tives in other middle income countries.
Housing footprints are one of the smallest among all countries in the lower-middle income country, India (430 kgCO₂e, see Figure 3.6). Living space per person is the smallest (10 m²) and the overall energy demand is one of the lowest (540 kWh) among all countries stud-ied. A high share of the population living under poverty is reflected in an average living space (10 m²) that bare-ly fulfills decent living standards (Rao and Min 2018). The low use of energy is explained by the rudimentary living conditions on average and lower heating demand owing to the climate.
Non-renewables, mainly coal and oil based energy sources, play a major role in energy generation (48% of grid electricity and 90% of non-electricity energy). Re-newables used are mainly hydropower.
In relation to the 1.5-degree targets for 2030 and 2050, the carbon footprint reductions required in the high-income countries studied are 50–74% and 90–94%, respectively, which should be achieved either by reduced consumption or improved efficiency (see Figure 3.7). The reduction required in the middle-in-come countries’ housing footprint is 25–54% by 2030 and 64–89% by 2050. For the lower-middle income country, footprint reductions in the housing domain are not needed by 2030, but the needed reduction for 2050 is 52%.

52
Section IIHotspots and Options for Footprint Reductions
3.2.3. Personal transportPersonal transport related footprints are highest in high-income countries due to high overall transport de-mand and high share of car use and carbon-intensive air travel (Figure 3.8). Though Japan and India are an ex-ception: Japan has a high mobility demand but a notably higher share of public transport use compared to other high-income countries; India has a transport demand similar to Finland but motorcycles are responsible for the largest share of transport demand and footprint. In countries with a lower share of car use, transport de-mand is mainly focused on public transportation (bus and train), except in India and Indonesia, where motor-cycles are the biggest contributor to both mobility de-mand and footprints.
In high-income countries, the overall transport de-mand is higher compared to other countries, though India is an exception (see Figure 3.9). Canada has the highest transport demand at 22,200 km, compared with 17,500 km in Finland, 14,700 km in the United Kingdom and 11,000 km in Japan. Cars are the biggest contribu-tor to the carbon footprint of personal transport in all the high-income countries studied. The modal share of cars varies a lot within high-income countries, from very high (70%) in Canada to moderate (46%) in Japan.
Figure 3.8. Transport related carbon footprint (tCO₂e/cap/yr) and its breakdown between consumption components
0 1 2 3 4 5
Canada Car 3.54 Airplane 1.06 Bus .37 4.99
Finland Car 2.02 M Airplane 1.29 F B 3.65
United Kingdom Car 1.64 Airplane 1.44 R 3.25
Japan Car 1.25 Air .57 R 1.97
China Car .45 M Air B R 1.20
South Africa Car .72 A B R 1.20
Turkey Car .53 M Air .35 1.01
Brazil C Air B .64
India Car Motorcycle 1.18 B R 1.73
Indonesia C M A .57
Footprint, tonnes CO₂e / capita / year
Motorized private transport Flying Other
3.25Ferry
Rail
Note: Rail covers bullet, long-distance and local trains, as well as trams and metros; other public transportation covers local modes of transportation, such as auto-rickshaw in India and bajaj (three-wheelers) in Indonesia.
The carbon intensity of cars is slightly higher in Japan compared to other high-income countries, probably due to selection of intensity data, which is based on glob-al averages for different car classes and fuel types for countries other than Japan.
Air travel is the second largest contributor to trans-portation footprints (see Figures 3.8 and 3.9), though the modal share might be lower compared to other modes of transportation. For example in the United Kingdom, flights induce 1,400 kgCO₂e/capita (44% of the transport footprint), while only accounting for 29% of transport demand. Flights contribute more to the carbon footprint than other modes of transportation due to the notably higher carbon-intensity of air travel.
Travelling by land-based public transportation var-ies a lot within the high-income countries. Japan has the highest rate of public transportation use (3,600 km or 33% of the total transport demand), compared to other countries (from 9% in Finland to 15% in Canada), part-ly reflecting the higher service coverage supported by high population density in Japan. Japan has a notably higher use of trains (28% of transport demand) com-pared to Canada’s 0.5% and to the United Kingdom’s 8%. The use of buses is almost reversed—highest in Canada with 15% and lowest in Japan and the United Kingdom

53
Section IIHotspots and Options for Footprint Reductions
Figure 3.9. A comparison of carbon footprints in higher-income countries (A) and upper and lower middle-income countries (B) and their breakdown (transport, in kgCO₂e/cap/year 2019)
0 5,000 10,000 15,000 20,000 25,0000
0.1
0.2
0.3
0.4
0.5
Car
Airplane
Bus
Motorcycle
Rail
Current
2030
2050
Amount of transport demand (km / capita / year)
Carbon intensity (kg CO₂e / passenger-km)
Canada4,990kg CO₂e
Motorized private transportFlyingOther transport modes
0 5,000 10,000 15,000 20,000 25,0000
0.1
0.2
0.3
0.4
0.5
Car
Airplane
Bus
Other privateMotorcycle
Current
2030
2050
Amount of transport demand (km / capita / year)
Carbon intensity (kg CO₂e / passenger-km)
United Kingdom3,250kg CO₂e
Motorized private transportFlyingOther transport modes
Rail
0 5,000 10,000 15,000 20,000 25,0000
0.1
0.2
0.3
0.4
0.5
Car
AirplaneFerry
Motorcycle
Bus
RailBicycle
Current
2030
2050
Amount of transport demand (km / capita / year)
Carbon intensity (kg CO₂e / passenger-km)
Finland3,650kg CO₂e
Motorized private transportFlyingOther transport
0 5,000 10,000 15,000 20,000 25,0000
0.1
0.2
0.3
0.4
0.7*
Car
Airplane
Bus
Ferry
Motorcycle
Bicycle
Current
2030
2050
Amount of transport demand (km / capita / year)
Carbon intensity (kg CO₂e / passenger-km)
Japan1,970kg CO₂e
Motorized private transportFlyingOther transport modes
Rail
with 4% and 3%, respectively. The carbon-intensity of land-based public transportation is lowest in Finland due to the carbon-neutral policy of the national train service (VR Group Ltd. 2020). In Canada, a high share of the land-based public transportation is bus travel, which has notably higher carbon-intensity compared to train travel. Bicycles and walking account for a small share of the overall transport demand in high-income countries.
In the upper-middle income countries studied the av-erage transport demand is only two-fifths of the demand of high-income countries (see Figure 3.9). China has the highest transport demand at 9,300 km, compared to
7,200 km in South Africa, 4,600 km in Brazil, 4,400 km in Turkey, and 3,300 km in Indonesia. Lower transport demand probably reflects lower consumption levels in upper-middle income countries compared to high-in-come countries. Of transport, cars are also the biggest contributor to the carbon footprint in the upper-middle income countries, except for Brazil and Indonesia, where it is buses and motorcycles, respectively. Modal share of cars are moderate, from 14% for Indonesia (460 km) to 55% for Turkey (2,400 km). Country-specific carbon in-tensities of cars are similar to high-income countries, except for Brazil where the car fleet is mainly flex fuel cars with lower carbon intensity compared to only fos-
* Different scale in y-axis compared to other countries.

54
Section IIHotspots and Options for Footprint Reductions
Figure 3.9. A comparison of carbon footprints in higher-income countries (A) and upper and lower middle-income countries (B) and their breakdown (transport, in kgCO₂e/cap/year 2019)
0 5,000 10,000 15,000 20,000 25,0000
0.1
0.2
0.3
0.4
0.7*
Car
Motor-cycle
Airplane
Bus
Rail
Bicycle
Ferry
Current
2030
2050
Amount of transport demand (km / capita / year)
Carbon intensity (kg CO₂e / passenger-km)
China1,200kg CO₂e
Motorized private transportFlyingOther transport modes
0 5,000 10,000 15,000 20,000 25,0000
0.2
0.3
0.4
0.5
Car
Rail
Airplane
Bus
Current
2030
2050
Amount of transport demand (km / capita / year)
Carbon intensity (kg CO₂e / passenger-km)
South Africa1,200kg CO₂e
Motorized private transportFlyingOther transport modes
0 5,000 10,000 15,000 20,000 25,0000
0.1
0.2
0.3
0.4
0.5
Car
Airplane
Motorcycle
Bus
Rail
Current
2030
2050
Amount of transport demand (km / capita / year)
Carbon intensity (kg CO₂e / passenger-km)
Turkey1,010kg CO₂e
Motorized private transportFlyingOther transport modes
0 5,000 10,000 15,000 20,000 25,0000
0.1
0.2
0.3
0.4
0.5
Airplane
Bus
Car
Motorcycle
Rail
Current2030
2050
Amount of transport demand (km / capita / year)
Carbon intensity (kg CO₂e / passenger-km)
Brazil640kg CO₂e
Motorized private transportFlyingOther transport modes
0 5,000 10,000 15,000 20,000 25,0000
0.1
0.2
0.3
0.4
0.5
Motorcycle
Car Bus
Rail
Airplane
Current
2030
2050
Amount of transport demand (km / capita / year)
Carbon intensity (kg CO₂e / passenger-km)
India1,730kg CO₂e
Motorized private transportFlyingOther transport modes
0 5,000 10,000 15,000 20,000 25,0000
0.1
0.2
0.3
0.4
0.5
Car
Airplane
Public
Rail
Current2030
2050
Amount of transport demand (km / capita / year)
Carbon intensity (kg CO₂e / passenger-km)
Indonesia570kg CO₂e
Motorized private transportFlyingOther transport modes
* Different scale in y-axis compared to other countries.

55
Section IIHotspots and Options for Footprint Reductions
sil fuel cars. The occupancy rate for cars in upper-mid-dle income countries is similar to high-income countries though slightly lower, and the car fleet has a similar share of electric, hybrid, and alternative fuels using cars.
Air travel is the second largest contributor to the carbon footprint only in Turkey (see Figure 3.8), due to much higher transport demand for other modes of transportation in almost all upper-middle income countries. Land-based public transportation covers nearly half of the transport demand in China, South Africa, and Brazil (34%, 50%, and 48%, respective-ly). Turkey and Indonesia are an exception with a low share (7% and 18%, respectively) of public transpor-tation. The share of trains of the total public transpor-tation demand varies a lot among countries, from 13% in Brazil to 64% in South Africa. That also affects the carbon intensity of land-based public transportation, which is higher in countries with less train use. Motor-cycles cover over half (55%) of the transport demand in Indonesia and nearly one-fifth in China and Turkey (19% and 15%, respectively), and although motorcy-cles have lower intensity than cars, it is still much high-er than public transportation. In addition, other modes of public transportation cover altogether 15% of Indo-nesia’s transport needs. High use of motorcycles and similar means of transportation probably reflects dif-
ferences in cultural habits among the middle-income countries studied. Data for cycling and walking is in-adequate and therefore their comparison within mid-dle-income countries is not suitable.
In the lower-middle income country, India, overall demand for transport is similar to that of high-income countries (16,400 km in India, see Figure 3.8). Contrary to the countries of other income categories, motorcycles are responsible for the largest share of the transport footprint (68%) and transport demand (73%). Cars ac-count for only 15% of the transport demand. Air travel is minor in transport demand, which probably reflects the role of air travel as a privilege of higher income class-es, as over a fifth (22%) of the population live in poverty in India (World Bank Group 2020). Overall the share of public transportation is on a similar level with high-in-come countries (11%), but with the difference that other travel is not car-focused.
In relation to the 1.5-degree targets for 2030 and 2050, the reductions needed in high-income coun-tries’ personal transport are 78–91% and 97–99%, re-spectively (see Figure 3.9). For upper-middle income countries the needed reductions are 25–64% by 2030 and 88–95% by 2050. The lower-middle income coun-try studied also needs to reduce its transport footprint greatly: by 75% by 2030 and 96% by 2050.

56
Section IIHotspots and Options for Footprint Reductions
3.2.4. Other domain (consumer goods, leisure, and services)Other domain footprints are strongly related with in-come levels, as shown in Figure 3.10. In particular, lei-sure related footprints are the lowest in countries with the lowest average per capita spending, such as India and Indonesia.
Consumer goods account for the greatest share of the footprint in most countries. Canada has a notably high-er footprint compared to other countries, due in part to having the highest annual per capita spending but also due to notably higher spending on relatively high intensity consumer goods. In middle-income countries the spending is focused on necessities, such as clothing and furniture/room coverings.
The share of service-related footprints vary across countries and income groups. Although education and healthcare services are strongly subsidized by the gov-ernment in Finland, the country has the highest service related footprint due to notably higher spending on fi-nance/insurance related services.
The footprints of consumer goods, leisure, and ser-vices are highest in the high-income countries studied (see Figure 3.10), and the footprint varies among coun-tries from Canada’s highest footprint of 3,900 kgCO₂e to the lowest of 1,700 kgCO₂e in the United Kingdom. The spendings of high-income countries are also the high-est among all case countries, and they vary from Unit-ed Kingdom’s pound equivalent18 of 12,500 USD to Can-ada’s dollar equivalent of 9,000 USD.
In Canada, Finland, the United Kingdom, and Japan consumer goods have the highest footprint, though the service domain has the greatest spendings. In the con-sumer goods domain, clothes have the highest spend-ings in all other countries, except in Japan, where clothes are the second highest after the category of other consumer goods (including jewelry, tobacco, and mis-cellaneous manufacturing products). In the service do-main, finance and insurance-related services are clear-ly highlighted in all high-income countries. The leisure domain covers 17–26% of the summed up footprint and 12–29% of per capita spending in these three domains. Average carbon intensities for high-income countries are lowest for all three domains between case coun-tries, possibly due to a higher share of renewables used for service production in industrialised countries com-pared to industrialising countries.
For upper-middle income countries, both the foot-print and the spendings fall behind the high-income countries (see Figure 3.10). The average footprint is only one-fifth (19%: 720 kgCO₂e) and the per-capita consum-
18 Country-specific currency converted into USD by using the average currency exchange rate for the year 2019. (X-Rates 2021)
er spending less than a tenth (8%: 1,100 USD) of high-in-come countries. Nevertheless, within upper-middle in-come countries, Indonesia has a notably lower footprint and per-capita consumer spending compared to other countries. In Turkey, South Africa, Brazil, and Indonesia, consumer goods account for the greatest footprint, as it covers over half (67%, 78%, 59% and 58%, respective-ly) of the summed up footprint of the three domains. In China, the highest are services (57%). Spending varies a lot among countries due to the different data quality and level of details available. Nevertheless, for China, South Africa, Brazil, and Indonesia a major part of the spend-ing is targeted to services, though the use of different services vary between countries. In Turkey, consumer goods account for the greatest share of spendings, of which 67% is due to clothes and furniture/room cover-ings. Leisure is responsible for a minor part of spend-ing in China, South Africa, Brazil, and Indonesia—on-ly 6–28%—relatively similar to high-income countries.
For the lower-middle income country, India, the aver-age footprint and spendings in these three domains are only a fraction compared to high-income countries (1%: 10 USD/capita) (see Figure 3.10). Although the summed up consumption of the three domains is distributed similarly in India and the upper-middle income coun-tries—47% for consumer goods, 6% for leisure, and 47% for services—the overall consumption is vastly smaller. This is reflected in the footprint, which is only 15 kg-CO₂e. It shows clearly that the average per-capita con-sumer spending is targeted to necessities, to clothes and footwear, education and welfare/medical services. Lei-sure-related annual consumption is less than 1 USD. Av-erage carbon intensities for lower-middle income coun-tries are the highest for all three domains, possibly due to a lower share of renewable energy sources used for product and service production and distribution.
In relation to the 1.5-degree targets for 2030 and 2050, the reductions needed in high-income countries’ consumer goods, leisure, and services in total are 68–93% and 94–99%, respectively. For upper-middle in-come countries the needed reductions are 41–64% by 2030, except for Brazil and Indonesia where the foot-prints are already below the target, and 56–91% by 2050. The lower middle income country, India, has so far reached the 2030 and 2050 targets.

57
Section IIHotspots and Options for Footprint Reductions
0 1 2 3 4
Canada Consumer goods 2.51 Leisure .68 Services .72 3.90
Finland Consumer goods 1.41 Leisure .54 Services .62 2.58
United Kingdom Consumer goods .97 Leisure Services 1.75
Japan Consumer goods 1.03 Leisure .58 Services .65 2.27
China Goods .41 L Services .71 1.25
South Africa Goods .73 L S .94
Turkey Goods .63 L S .95
Brazil G .22
India .01
Indonesia G S .25
Footprint, tonnes CO₂e / capita / year
Figure 3.10. Consumer goods, leisure, and services related carbon footprint (tCO₂e/cap/yr) and its breakdown between consumption components

58
Section IIHotspots and Options for Footprint Reductions

59
Section IIHotspots and Options for Footprint Reductions
4 – Options and Priorities for Shrinking Lifestyle Carbon Footprints
T his chapter examines the reduction po-tentials of low-carbon lifestyle options to-wards meeting the 1.5-degree target, based on the estimates for current lifestyle foot-prints and proposed per-capita targets. Key
approaches concerning low-carbon lifestyles are ex-plained before evaluating country-specific impacts of low-carbon lifestyle options that could be applied.
4.1. Reduce, shift, improve
Analysis for this report estimates lifestyle carbon foot-prints based on the amount of consumption and the car-bon intensity of the items. The report adopts three main approaches for reducing footprints: absolute reduction, modal shift, and efficiency improvement (Figure 4.1). These approaches are in line with analyses and recom-mendations from related literature (Vandenbergh et al. 2008; Jones and Kammen 2011).
I. Absolute reduction (Akenji et al. 2016) refers to re-ducing physical consumption of goods or services con-sumed, such as food, kilometers driven, energy use, or living space, as well as avoiding unsustainable options.
II. Modal shift (Nelldal and Andersson 2012) means changing from one consumption mode to a less car-bon-intensive one, such as in adopting plant-based di-ets instead of eating excessive meat, using public trans-port instead of cars, or using renewable energy for electricity or heating instead of fossil fuels. Source: IGES et al. (2019)
Figure 4.1. Key approaches for lifestyle carbon footprint reduction: absolute reduction, modal shift, and efficiency improvement
III. Efficiency improvement means decreasing emissions by replacing technologies with lower-carbon ones while not changing the amount consumed or used, such as in energy-efficient vehicles, appliances, or housing.
0 5,000 10,000 15,000 20,000 25,0000
0.1
0.2
0.3
0.4
0.5
Car
AirplaneFerry
Motorcycle
Bus
RailBicycle
Amount of transport demand (e.g. km / capita / year)
Carbon intensity (e.g. kg CO₂e / passenger-km)
Motorized private transportFlyingOther transport
Modal shiftAreaCarbon footprint(kg CO₂e)
Reduction of amount
Effic
ienc
y im
prov
emen
t

60
Section IIHotspots and Options for Footprint Reductions
4.1.1. Rebound effectsWhen efficient products or environmentally sound be-haviours are introduced, rebound effects need to be considered. Rebound effects refer to “the unintended consequences of actions by households to reduce their energy consumption and/or greenhouse gas (GHG) emissions” (Sorrell 2012). Rebound effects mean that efficiency improvements can be less effective than in-tended and can even increase total consumption and associated emissions (Schmidt-Bleek 1993). A review of the rebound effect of energy consumption conclud-ed that direct rebound effects (rebound in the same consumption item) are expected to be up to 30%, while indirect and economy-wide rebound effects (rebound in other consumption items) can exceed 50% (Sorrell 2007). For example, introducing fuel-efficient cars might increase the total distance travelled by cars or the size of cars, which could potentially upset or even reverse the absolute amount of resource use or emis-sions. Rebound effects have also been considered in the context of other approaches including modal shift or absolute reduction (Buhl 2014; Ottelin et al. 2017). It is therefore important to examine cross-domain household behaviours to identify and try to address potential rebound effects.
Although theoretically, approaches such as the shar-ing economy can bring about significant synergies with low-carbon lifestyles, it also involves the possibility of rebound effects, depending on the options chosen (see Clausen et al. (2017) for potential negative effects). For example, car-sharing might increase the total distance of car use among citizens who were previously car-free, and increase car use especially outside rush-hours, thus potentially weakening demand for public transpor-tation. Sharing options should not raise total carbon footprints by inducing additional demand or causing adverse shifts in consumption modes.
4.1.2. “Lock-in” effectsAnother factor to consider when assessing the potential effectiveness of options for lifestyle changes is the “lock-in” effect (Sanne 2002; Akenji and Chen 2016). In facil-itating low-carbon lifestyles, consideration of behav-ioural “lock-in” is important. While technological and institutional lock-in have been discussed in the context of blocking sustainable innovations (Unruh 2000; Foxon 2002), lock-in also applies to consumer choices and life-styles in terms of products available on the market, in-frastructure and public services, the consumer’s com-munity and social networks (Akenji and Chen 2016), as well as by economic framework conditions (Lorek and Spangenberg 2014). Consumers in the current society are to a certain degree locked-in by circumstances in-cluding work-and-spend lifestyles (Sanne 2002). Con-sidering these challenges to behavioural change, there
is a need also to improve production processes, improve the availability of low-carbon products or services by the private and public sectors, and bring about shifts in infrastructure as well as introduce national policies to enable the adoption of more low-carbon options and to phase-out carbon-intensive options. The shifts in life-styles that are needed to meet the 1.5°C target thus need both systems and individual behaviour change (Ak-enji 2014). It remains with government and business and collaborative action by all stakeholders, especial-ly those who are actively driving the current consump-tion modes.
4.2. Estimated impacts of low-carbon lifestyle options
In this report, the carbon footprint reduction of select-ed low-carbon lifestyle options were assessed for each country. The selected low-carbon options are based on a literature review presented in the first 1.5-Degree Lifestyles report, Annex E (IGES et al. 2019) and include both production and consumption side options; offering different point of views to reduction (absolute reduc-tion, modal shift, efficiency improvement). The dras-tic reductions required to achieve the 2030 and 2050 targets (e.g. 60–82% by 2030 in high-income countries) highlight the need for high impact carbon reduction op-tions.
Country-specific impacts of selected options were calculated based on data on physical consumption amount and carbon intensity (see Chapter 3). The re-duction impacts were estimated based on the collected consumption and footprint data by changing the inten-sity and/or amount of relevant components depending on the nature of the options.
The percentage of the population changing their be-haviour and the extent of change by each individual are critical, so both different adoption rates and depths of change are presented. “Full implementation” means that individuals fully implement a low-carbon option and realise the maximum reduction potential of that option. “Partial-adoption” means an option is partial-ly adopted, either by individuals or by society. The “full implementation” practices of each option are defined as assumptions listed in Annex F in the first 1.5-Degree Lifestyles report (IGES et al. 2019) and the resulting maximum reduction potentials were estimated using LCA-based carbon footprint data by changing the car-bon intensity and/or consumption amount of relevant components. Impacts from “partial-adoption” were es-timated based on the following equation:
Partial adoption impacts = full implementation impacts x adoption rate (%)

61
Section IIHotspots and Options for Footprint Reductions
The results of the estimated carbon footprint re-duction impacts for each country from full and partial implementation of options are summarised in Figures 4.2.–4.11. It should be noted that the selected low-car-bon lifestyle options and their assumptions differ slight-ly among countries due to the applicability of options to local contexts and the availability of data.
In high-income countries the largest reduction po-tential of 500 to over 1,500 kg CO₂e/person/year per op-tion on average19 are car-free private travel, reduction of international flights, vegan diet, electric car, vegetarian diet, renewable grid electricity, vehicle fuel efficiency improvement, renewable off-grid electricity, low-car-bon protein instead of red meat, and renewable based heating and/or cooling.20 Most options are based on a modal shift from carbon-intensive to other lower-inten-sity consumption modes, such as car to public trans-port, fossil fuel to renewable energy sources, and meat to vegetarian nutrition sources. High-impact efficiency improvement options, such as electric car and vehicle fuel efficiency improvements, are mainly found in the transport domain. The majority of the highest impact options are from the transport domain, while housing and food also offer major reduction potential through switching from non-renewables to renewable sources and through shifting dietary habits. In upper-middle in-come countries, the options exceeding the full poten-tial of 500 kg per option on average19 are vegan diet and low-carbon protein instead of red meat, making these the highest impact options. In lower-middle income countries, only living closer to the workplace (i.e. re-ducing commuting distance) exceeded 500 kg per op-tion on average.19
Options with medium-high reduction potentials of 250 to 500 kg per option on average21 in high-income countries are living closer to the workplace, car-free commuting with electric bikes, ride sharing, smaller living space, hybrid car, car-free commuting with pub-lic transportation, closer weekend leisure, and efficien-cy improvement of home appliances. Options include modal shift, efficiency improvement, and absolute re-duction, such as car-free commuting, ride sharing, and living closer to work, respectively. In upper-middle in-come countries the options exceeding the full potential of 250 kg per option on average21 are vegetarian diets, renewable grid electricity, and renewable off-grid elec-
19 Estimated to have more than 500 kgCO₂e/capita/year reduction potential in full implementation as a mean of potentials. Descending order by estimated mean reduction potentials.
20 The assumption varies depending on whether the energy is used for heating or cooling purposes in each country.
21 Estimated to have more than 250 kgCO₂e/capita/year reduction potential in full implementation as a mean of potentials. Descending order by estimated mean reduction potentials.
22 Estimated to have less than 250 kgCO₂e/capita/year reduction potential in full implementation as a mean of potentials. Descending order by estimated mean reduction potentials.
tricity. In lower-middle income countries the second largest potential per option on average21 are vehicle fu-el efficiency improvement, vegan diet, and vegetarian diet. In middle income countries, options are mainly based on modal shifts, such as switching from fossil to renewable energy sources and changing dietary habits.
Options with moderate impacts, less than 250 kg per option on average22 in high-income countries are food production efficiency improvement, alternative dairy products, renting a guest room, telework, efficiency improvement of buildings, heat pump or air condition-er for temperature control20, reduction of sweets and alcohol, reduction of domestic flights, household food loss reduction, saving hot water, lowering temperature at home and supply side food loss reduction, i.e., op-tions based on efficiency improvement of production and products or absolute reduction of physical con-sumption amounts. In middle-income and lower mid-dle-income countries, the majority of the options have an impact of less than 250 kg per option on average.22
When reading these findings, it’s important to keep the limitations of this study in mind. First, the options analysed are not exhaustive but a selection based on available literature (see Annex E in the first 1.5-Degree Lifestyles report (IGES et al. 2019)). Second, the esti-mates are based on basic assumptions of changes in consumption amounts, modes, and/or carbon intensi-ty, as well as the production side adopting the most am-bitious company targets (see Annex C). Also, changes in energy systems, such as renewable electricity grid mix, were not systematically reflected in the estimation of every product and service but only as a specific option of direct energy use in the housing domain and as a gen-eral efficiency improvement in production in other do-mains (such energy system changes can be studied in future research). Last, this report does not consider the dynamic changes towards the future, such as interac-tions between demography, technology, economy, and consumption or comparisons with business-as-usual scenarios. The estimated impacts were calculated by altering amounts of consumption or carbon intensity of components based on the estimated footprints as of 2019, while the targets indicated for comparison relate to the future, such as 2030. A more comprehensive, dy-namic modelling of future lifestyles is beyond the scope of this report.

62
Section IIHotspots and Options for Footprint Reductions
Figure 4.2. A comparison of estimated per-capita carbon footprint reduction impacts (kgCO₂e/capita/year) of low-carbon lifestyle options (Canada)
0 500 1,000 1,500 2,000
25% 50% 75% 100%
1,600Vegan diet
1,470Vegetarian diet
1,010Low-carbon proteininstead of red meat
420Food productionefficiency improvement
230Alternative dairy products(plant-based)
200Food loss reduction(household side)
160Reduction of sweets andalcohol
90Food loss reduction(supply side)
710Renewable off-grid energy
550Renewable grid electricity
500Renewable based heatingand/or cooling
440Smaller living space
410Efficiency improvement(home appliances)
270Rent a guest room to atourists
160Saving hot water
150Efficiency improvement ofbuildings
120Heat pump/air conditionerfor temperature control
80Lowering temperature athome
1,750Car-free private travelling
970Vehicle fuel efficiencyimprovement
770Reduction of internationalflights
680Live closer to workplace
640Ride sharing(always 2 persons in a car)
610Car-free commuting withelectric bike
570Electric car
520Hybrid car
480Car-free commuting withpublic transportation
270Telework(white collar workers)
240Closer weekend leisure
210Reduction of domesticflights
Reduction in footprint, kg CO₂e / capita / year

63
Section IIHotspots and Options for Footprint Reductions
0 500 1,000 1,500 2,000
25% 50% 75% 100%
780Vegan diet
530Vegetarian diet
480Low-carbon proteininstead of red meat
370Alternative dairy products(plant-based)
210Reduction of sweets andalcohol
110Food productionefficiency improvement
50Food loss reduction(supply side)
50Food loss reduction(household side)
690Renewable based heatingand/or cooling
490Renewable grid electricity
380Renewable off-grid energy
360Efficiency improvement ofbuildings
350Smaller living space
220Heat pump/air conditionerfor temperature control
200Efficiency improvement(home appliances)
180Rent a guest room to atourists
80Lowering temperature athome
70Saving hot water
1,480Electric car
1,240Reduction of internationalflights
1,130Car-free private travelling
550Vehicle fuel efficiencyimprovement
510Closer weekend leisure
390Live closer to workplace
350Car-free commuting withelectric bike
340Car-free commuting withpublic transportation
320Hybrid car
300Ride sharing(always 2 persons in a car)
240Telework(white collar workers)
40Reduction of domesticflights
Reduction in footprint, kg CO₂e / capita / year
Figure 4.3. A comparison of estimated per-capita carbon footprint reduction impacts (kgCO₂e/capita/year) of low-carbon lifestyle options (Finland)

64
Section IIHotspots and Options for Footprint Reductions
0 500 1,000 1,500 2,000
25% 50% 75% 100%
730Vegan diet
510Low-carbon proteininstead of red meat
450Vegetarian diet
290Food productionefficiency improvement
240Alternative dairy products(plant-based)
140Food loss reduction(household side)
140Reduction of sweets andalcohol
10Food loss reduction(supply side)
770Renewable off-grid energy
380Renewable based heatingand/or cooling
340Smaller living space
330Renewable grid electricity
260Heat pump/air conditionerfor temperature control
230Rent a guest room to atourists
210Efficiency improvement(home appliances)
130Efficiency improvement ofbuildings
100Saving hot water
60Lowering temperature athome
1,370Reduction of internationalflights
950Car-free private travelling
530Closer weekend leisure
520Live closer to workplace
500Electric car
470Car-free commuting withelectric bike
420Vehicle fuel efficiencyimprovement
330Ride sharing(always 2 persons in a car)
270Car-free commuting withpublic transportation
250Hybrid car
220Telework(white collar workers)
30Reduction of domesticflights
Reduction in footprint, kg CO₂e / capita / year
Figure 4.4. A comparison of estimated per-capita carbon footprint reduction impacts (kgCO₂e/capita/year) of low-carbon lifestyle options (United Kingdom)

65
Section IIHotspots and Options for Footprint Reductions
0 500 1,000 1,500 2,000
25 50 75% 100%
440Vegan diet
310Vegetarian diet
210Low-carbon proteininstead of red meat
180Food productionefficiency improvement
130Alternative dairy products(plant-based)
90Reduction of sweets andalcohol
60Food loss reduction(supply side)
50Food loss reduction(household side)
1,280Renewable grid electricity
430Renewable based heatingand/or cooling
400Renewable off-grid energy
340Smaller living space
320Efficiency improvement(home appliances)
240Rent a guest room to atourists
220Efficiency improvement ofbuildings
110Saving hot water
70Heat pump/air conditionerfor temperature control
50Lowering temperature athome
900Car-free private travelling
790Electric car
430Ride sharing(always 2 persons in a car)
350Reduction of internationalflights
350Live closer to workplace
320Vehicle fuel efficiencyimprovement
310Hybrid car
300Closer weekend leisure
290Car-free commuting withelectric bike
220Car-free commuting withpublic transportation
200Reduction of domesticflights
190Telework(white collar workers)
Reduction in footprint, kg CO₂e / capita / year
Figure 4.5. A comparison of estimated per-capita carbon footprint reduction impacts (kgCO₂e/capita/year) of low-carbon lifestyle options (Japan)

66
Section IIHotspots and Options for Footprint Reductions
0 500 1,000 1,500 2,000
25% 50% 75% 100%
460Vegan diet
360Low-carbon proteininstead of red meat
260Vegetarian diet
180Food productionefficiency improvement
90Food loss reduction(household side)
50Reduction of sweets andalcohol
30Alternative dairy products(plant-based)
20Food loss reduction(supply side)
540Renewable grid electricity
160Smaller living space
160Renewable based heatingand/or cooling
160Renewable off-grid energy
140Efficiency improvement(home appliances)
90Rent a guest room to atourists
40Saving hot water
20Efficiency improvement ofbuildings
20Lowering temperature athome
240Live closer to workplace
220Vehicle fuel efficiencyimprovement
200Car-free private travelling
140Electric car
130Hybrid car
110Reduction of domesticflights
110Car-free commuting withelectric bike
70Ride sharing(always 2 persons in a car)
70Car-free commuting withpublic transportation
60Telework(white collar workers)
50Reduction of internationalflights
Reduction in footprint, kg CO₂e / capita / year
Figure 4.6. A comparison of estimated per-capita carbon footprint reduction impacts (kgCO₂e/capita/year) of low-carbon lifestyle options (China)

67
Section IIHotspots and Options for Footprint Reductions
0 500 1,000 1,500 2,000
25% 50% 75% 100%
1,090Low-carbon proteininstead of red meat
1,040Vegan diet
900Vegetarian diet
250Food productionefficiency improvement
120Food loss reduction(household side)
120Reduction of sweets andalcohol
50Food loss reduction(supply side)
30Alternative dairy products(plant-based)
750Renewable grid electricity
160Efficiency improvement(home appliances)
100Saving hot water
80Rent a guest room to atourists
70Renewable based heatingand/or cooling
50Smaller living space
20Renewable off-grid energy
10Efficiency improvement ofbuildings
10Lowering temperature athome
410Car-free private travelling
340Live closer to workplace
230Electric car
230Car-free commuting withelectric bike
220Ride sharing(always 2 persons in a car)
210Vehicle fuel efficiencyimprovement
210Hybrid car
150Car-free commuting withpublic transportation
90Telework(white collar workers)
90Closer weekend leisure
70Reduction of domesticflights
70Reduction of internationalflights
Reduction in footprint, kg CO₂e / capita / year
Figure 4.7. A comparison of estimated per-capita carbon footprint reduction impacts (kgCO₂e/capita/year) of low-carbon lifestyle options (South Africa)

68
Section IIHotspots and Options for Footprint Reductions
0 500 1,000 1,500 2,000
25% 50% 75% 100%
460Vegan diet
300Low-carbon proteininstead of red meat
210Alternative dairy products(plant-based)
150Vegetarian diet
120Food loss reduction(household side)
110Food productionefficiency improvement
30Reduction of sweets andalcohol
20Food loss reduction(supply side)
850Renewable off-grid energy
430Renewable grid electricity
330Renewable based heatingand/or cooling
220Heat pump/air conditionerfor temperature control
200Smaller living space
200Efficiency improvement(home appliances)
120Efficiency improvement ofbuildings
120Saving hot water
100Rent a guest room to atourists
30Lowering temperature athome
330Car-free private travelling
290Reduction of internationalflights
170Live closer to workplace
160Vehicle fuel efficiencyimprovement
160Closer weekend leisure
150Ride sharing(always 2 persons in a car)
130Car-free commuting withelectric bike
100Electric car
90Hybrid car
80Car-free commuting withpublic transportation
40Reduction of domesticflights
30Telework(white collar workers)
Reduction in footprint, kg CO₂e / capita / year
Figure 4.8. A comparison of estimated per-capita carbon footprint reduction impacts (kgCO₂e/capita/year) of low-carbon lifestyle options (Turkey)

69
Section IIHotspots and Options for Footprint Reductions
0 500 1,000 1,500 2,000
25% 50% 75% 100%
1,120Vegan diet
860Low-carbon proteininstead of red meat
850Vegetarian diet
180Food productionefficiency improvement
160Alternative dairy products(plant-based)
140Food loss reduction(household side)
110Reduction of sweets andalcohol
40Food loss reduction(supply side)
70Rent a guest room to atourists
70Smaller living space
70Renewable off-grid energy
60Renewable grid electricity
40Renewable based heatingand/or cooling
30Efficiency improvement(home appliances)
20Heat pump/air conditionerfor temperature control
20Saving hot water
10Efficiency improvement ofbuildings
230Live closer to workplace
120Reduction of domesticflights
100Vehicle fuel efficiencyimprovement
90Car-free commuting withelectric bike
70Reduction of internationalflights
60Telework(white collar workers)
50Ride sharing(always 2 persons in a car)
50Car-free commuting withpublic transportation
50Car-free private travelling
40Closer weekend leisure
10Hybrid car
10Electric car
Reduction in footprint, kg CO₂e / capita / year
Figure 4.9. A comparison of estimated per-capita carbon footprint reduction impacts (kgCO₂e/capita/year) of low-carbon lifestyle options (Brazil)

70
Section IIHotspots and Options for Footprint Reductions
0 500 1,000 1,500 2,000
25 50 75 100%
290Vegan diet
260Vegetarian diet
130Food productionefficiency improvement
110Alternative dairy products(plant-based)
70Food loss reduction(household side)
20Food loss reduction(supply side)
20Low-carbon proteininstead of red meat
10Reduction of sweets andalcohol
160Renewable grid electricity
50Efficiency improvement(home appliances)
50Renewable off-grid energy
30Renewable based heatingand/or cooling
30Saving hot water
10Efficiency improvement ofbuildings
780Live closer to workplace
400Vehicle fuel efficiencyimprovement
150Car-free commuting withelectric bike
120Electric car
110Hybrid car
100Car-free commuting withpublic transportation
90Closer weekend leisure
60Telework(white collar workers)
60Car-free private travelling
20Reduction of domesticflights
20Reduction of internationalflights
Reduction in footprint, kg CO₂e / capita / year
Figure 4.10. A comparison of estimated per-capita carbon footprint reduction impacts (kgCO₂e/capita/year) of low-carbon lifestyle options (India)

71
Section IIHotspots and Options for Footprint Reductions
0 500 1,000 1,500 2,000
25 5075100%
210Vegan diet
120Food productionefficiency improvement
100Food loss reduction(household side)
60Low-carbon proteininstead of red meat
30Vegetarian diet
20Food loss reduction(supply side)
10Reduction of sweets andalcohol
10Alternative dairy products(plant-based)
150Renewable grid electricity
100Renewable off-grid energy
80Rent a guest room to atourists
50Renewable based heatingand/or cooling
50Efficiency improvement(home appliances)
40Smaller living space
30Saving hot water
20Efficiency improvement ofbuildings
20Heat pump/air conditionerfor temperature control
370Live closer to workplace
100Vehicle fuel efficiencyimprovement
80Car-free commuting withelectric bike
50Telework(white collar workers)
50Reduction of domesticflights
50Car-free commuting withpublic transportation
30Electric car
30Hybrid car
30Reduction of internationalflights
20Closer weekend leisure
20Ride sharing(always 2 persons in a car)
20Car-free private travelling
Reduction in footprint, kg CO₂e / capita / year
Figure 4.11. A comparison of estimated per-capita carbon footprint reduction impacts (kgCO₂e/capita/year) of low-carbon lifestyle options (Indonesia)

Section IIIPolicy Approaches For a Fair Consumption Space
Section III Policy Approaches For a Fair Consumption Space
72
73
Section IIIPolicy Approaches For a Fair Consumption Space
In a world with a limited and fast-shrinking global carbon budget, coupled with vast power and
economic inequalities, how do we allocate the remaining carbon allowance in a manner that is
fair while drastically decreasing our footprints in a limited timeframe to avoid irreversible ecological damage?
One of the conclusions of the IPCC as-sessment is that the world is now very close to the point where the Paris tar-get of limiting heating to 1.5°C will get out of reach. Even under optimistic as-
sumptions, a 50/50 chance of achieving the 1.5°C tar-get requires global emissions to peak by the middle of the current decade—that is, 3–4 years from now—and to fall at unprecedented rates until reaching net zero around mid-century (IPCC 2021b). All IPCC scenari-os that manage to limit heating to 1.5°C either employ the most drastic reductions, or they first overshoot 1.5°C and then rely on the massive deployment of neg-ative emission technologies in the second half of this century, although there are no guarantees that such measures will work at scale.
What is happening to the planet as a result of con-tinued emissions of greenhouse gases is unprecedented and this calls for unprecedented actions. Efforts made so far, which have been typically measured to protect economic growth and to avoid inconveniencing the pol-luting consumer class, have been woefully inadequate—hence the worsening trends. The rapidly changing cli-mate and the increasing risks it generates have been called an emergency, even officially recognised as such (Climate Emergency Declaration 2021) by over 2,000 lo-cal governments in 34 countries (encompassing over one billion people), but it is not yet treated as such. The ongo-ing public health crisis caused by the COVID-19 pandem-ic offers an interesting comparison. In this case, many governments have taken quick and decisive actions de-spite the negative economic impacts of these policies.
In the following brief chapters, we highlight a num-ber of perspectives and approaches that may help soci-ety transition towards a fair consumption space within planetary boundaries. For this, we invited some lead-ing global thinkers and doers for contributions. We have chosen to focus on a few radical topics that are not yet part of the mainstream climate discourse. By doing so, we hope to broaden the discussions on how to deal with
the escalating climate emergency in an equitable man-ner and within a short timeframe.
The approaches can be grouped in three sets of pol-icy approaches: the first is removing carbon-intensive options from the market and driving social innovation, through choice editing (Chapter 5). The second requires setting limits for environmentally harmful consump-tion and staying within the remaining carbon budget. Tina Fawcett and Yael Parag (Chapter 8) discuss per-sonal carbon allowances and ask if the time has come for carbon rationing. To not put all the weight on con-sumers, Joachim H. Spangenberg (Chapter 9) examines the role of international carbon allowances, institutions, and the global trade regime, and discusses the Europe-an Commission’s planned Carbon Border Adjustment Mechanism and how it could avoid unfairly affecting low-income countries where cheap labour has been used to attract high intensity production facilities relo-cated from industrialised nations. The third set of pol-icy approaches is intended to ensure a more equitable society (through a social guarantee including universal basic services, and adopting a sufficiency approach to address climate change). Anna Coote writes on univer-sal basic services, going beyond universal basic income to ensure that meeting human needs through public services and other collective measures is more equi-table, affordable, and sustainable than simply provid-ing cash benefits to support individual market transac-tions (Chapter 6). Yamina Saheb explores how much is enough and contrasts a sufficiency approach with the current obsession with market solutions and technolo-gy efficiency (Chapter 7). Finally, Luca Coscieme high-lights the co-benefits of a society living within a fair con-sumption space, drawing from the Wellbeing Economy Alliance (WEAll 2020) and linking 1.5-degree lifestyles to personal, community, and ecological wellbeing, as well as a stimulant for a wellbeing economy (Textbox E).
Some of these sections will be published subse-quently in longer versions as part of a planned series of “Think Pieces” on rapid decarbonisation.

74
Section IIIPolicy Approaches For a Fair Consumption Space
5 – Choice Editing: Taking Out the Harmful Consumption Options
C hoice editing involves the use of specified criteria and set standards to filter out un-suitable options in the range of products and services being brought to the mar-ket. It is done by manufacturers and ser-
vice-providers when they decide on product and service portfolios, as well as their designs. Business choice edit-ing criteria is often based on, for example, profitability, available technology, or attractiveness. Brand owners choice edit what goods and quality to bring to different market segments; retailers choice edit what products they shelve for their customers in different zip codes (Gunn and Mont 2014; Kumar and Dholakia 2020). Gov-ernments also use choice editing to eliminate unsafe products or services, or to encourage development of safer alternatives, which may otherwise not be made available. Choice editing is effective because what is not available cannot be consumed. Consumption choice is
a function of the options available on the market—or, in other words, a response to opportunities created by a combination of government policy (or lack thereof), decisions by manufacturers and service providers, and decisions by retailers on what to shelve.
Lifestyles impacts of climate change are accelerat-ed by cultural norms that encourage consumerism, are driven by advertising, exacerbated by planned obsoles-cence, and are proliferating in a growth-driven macro-economic context that depends on ever increasing pri-vate and public consumption. Some of the products flooding the market and contributing to climate change, arguably, neither have a function nor contribute to the wellbeing of consumers, their existence predicated on fulfilling a profit motive. Yet, in our current situation, with a highly constrained ecological budget and the need to shrink our footprint very quickly, we need to assess carefully what products use our scarce natural resources and what should be allowed to use up the very limited carbon allowance. One approach to addressing overconsumption is to limit excess; to ensure available options fit within a fair consumption space where every-one first has an opportunity to meet their fundamen-tal human needs (Max-Neef 1991) within the planetary boundaries: hence choice editing.
5.1. History and common examples of choice editing
The UK Sustainable Consumption Roundtable, explor-ing how consumer choices could stay within environ-mental limits, concluded that given the complexity of consumption and considering the multiple influences on consumer decisions, it is not practical to place the burden of change on consumers alone. The Commis-
Lifestyles impacts of climate change are accelerated by cultural norms that encour-age consumerism, are driven by advertising, exacerbated by planned obsolescence, and are proliferating in a growth- driven macroeconomic context that depends on ever increasing private and public consumption.

75
Section IIIPolicy Approaches For a Fair Consumption Space
sion concluded that “the lead for ensuring environmen-tal stewardship must lie higher up in the supply chain” (Sustainable Consumption Roundtable 2006). Among its recommendations is the need for choice editing.
Traditional government use of choice editing is com-mon for public health and safety reasons. For example, in most European countries a consumer cannot simply walk into a shop and buy a pistol or hard drugs. These op-tions have been edited out of the market due to concerns for safety. Smoking in public places is banned in several countries, and seatbelts are mandated for car drivers out of concerns for the public wellbeing. Subsidies and stim-ulus packages are allocated to encourage new business-es in order to edit in new markets and production op-portunities. Choice editing is therefore not new, having been a strong basis for public policy. And in recent years, choice editing out of concern for environmental harm has been implemented, for example, banning leaded petrol and ozone-depleting chlorofluorocarbons (CFCs).
Awareness of the climate crisis has led to widening application of choice editing. The phasing out of incan-descent light bulbs from domestic use in Australia, the European Union, and other countries are contempo-rary examples of governmental choice editing driven by sustainability concerns. Likewise, the ban on plastic shopping bags and other single use plastic packaging from supermarkets by several countries can be seen as steps towards choice-editing for packaging (Akenji et al. 2020). These are basic examples and not nearly enough in a climate emergency.
5.2. Mandate for sustainability choice editing
National governments have signed on to several poli-cy frameworks with objectives and targets that require choice editing. The most recent report of the IPCC warns that human-induced climate change has already caused irreversible damage and that the further we delay ac-tion, the more entrenched the dramatic wildfires, floods, poor harvests, and physical illnesses we will witness. As these reports show, more than half of the contributing emissions can be reduced from changes in meat and cheese consumption, fossil-fuelled transportation, and changes in size and temperature of housing. The Con-vention on Biological Diversity has similar priority ar-eas for biodiversity loss. And yet government action to meet their obligations under these frameworks largely skirt actions that would reduce consumerism, despite rising evidence of acceptability of radical but fair public policy to address sustainability issues. To a large extent this avoidance of choice editing has been due to the fear of the consumer class—the mostly overconsuming pop-ulation that also doubles as voters.
The optics, especially in democratic or so-called free societies, of government intervention in private consumption choice is perceived as too costly for pol-iticians and for economic growth. For this reason, Di Giulio and Fuchs (2014) approach the prospect of lim-iting unsustainable consumption choices by acknowl-edging the need for caution in assessing how it could be feasible—not only empirically but especially politi-cally. The view that establishing consumption limits is against democratic governance and modern systems ensuring individual rights and freedoms is countered by di Giulio and Fuchs with two arguments that can be applied to choice editing and ensuring a fair consump-tion space. The first is that the pursuit of the common good is the responsibility of the political community—those mandated with governing. Governing includes the management of commons, which the atmosphere and most natural resources are considered to be. Thus the design and implementation of consumption limits is a way of guaranteeing the common good, especially when there is scarcity of said resources or risk that they may be severely (or “irreversibly” as put by the IPCC) dam-aged. The second argument is that since it is the task of the state to prevent discrimination and protect individ-uals against infringements on their freedom by others, the state has the right and the obligation to prevent indi-viduals from consuming to such an extent that access to a sufficient quality and quantity of resources is denied to others. Given the significant asymmetries in power that exist in the market and in politics today, the need of exerting this right and obligation to protect freedoms is, in fact, particularly important (Di Giulio and Fuchs 2014). This is only reinforced by recent observations of unpredictable and dangerous weather events, and the message in the recent IPCC report highlighting the pro-hibitive consequences of global temperature rise above 1.5 degrees (IPCC 2021b).
Whereas traditional choice editing has primarily been through the filter of public safety, health, and se-curity, in a climate emergency governments need to in-corporate and prioritise sustainability in their choice editing criteria.
5.3. Implementing choice editing
There are several ways to implement choice editing, from removing the worst products, to making the least sustainable choices less attractive or more expensive, to shifting the context for making choices (i.e. chang-ing the broader “choice architecture”) (Maniates 2010).
Removing the worst products is best seen with pro-grams like Japan’s “Top Runner” energy efficient appli-ance program. Each year, the government rates major appliances for energy efficiency, and the top-rated ap-

76
Section IIIPolicy Approaches For a Fair Consumption Space
pliances set the standard for future years, thus nudging the worst performing models out of the market. This essentially creates a race to the top as there is a clear incentive for companies to make models more efficient year after year. Thus it is not surprising that in the early 2000s, TVs, air conditioners, and refrigerators became 26, 68, and 56% more efficient, respectively (Inoue and Matsumoto 2019).
A second strategy is to make the least sustainable choices more expensive. Plastic bag taxes are a good ex-ample. Rather than banning, which draws consumer ire as well as industry lawsuits and work-arounds, taxing plastic bags can also reduce consumption significant-ly. The city of Chicago, for example, banned thin plas-tic bags in 2015 but allowed thicker plastic bags, which rather than reducing plastic bag usage significantly, led to retailers offering customers thicker plastic bags. In 2017, Chicago tried again, replacing the ban with a 7-cent tax, bringing plastic bag usage down from 82% per trip to 54% (Parbhoo et al. 2018). Gentler changes can also help people get used to a shifting choice archi-tecture. As more people shift to reusable bags to avoid the tax, when taking the next step of banning plastic bags, citizens are more comfortable with this further edit, having already gotten used to cultural shifts, such as bringing their own reusable bags.
Third, and most broadly, governments and institu-tions can shift the choice architecture, such as when cafeterias remove trays, diners consume less food (Thiagarajah and Getty 2013), or how municipal gov-ernments, by building sidewalks and bike lanes and implementing traffic calming infrastructure (like speed bumps), can draw people from cars to more sus-tainable modes of transportation (Aldred and Good-man 2020). In order to reduce car traffic and to encour-age walking, biking, or public transport use, London introduced the Congestion Charge, which vehicles must pay in order to drive within the charge zone in central London. In addition, vehicles that do not meet Ultra Low Emission Zone standards must pay an ad-ditional charge to drive in further restricted zones (Transport for London n.d.).
Perhaps one of the most effective, and subtlest forms of choice editing is to alter the default options. Limiting the use of public spaces for highways and car parking promotes innovation for more sustainable transport; revising local government zoning laws, size limits for housing construction, and raising the bar for minimum housing insulation standards defaults towards sustain-able housing; raising ethical standards for animal farms and mandating reforestation and regeneration of lands previously allocated for cattle and pigs would encourage low-carbon and healthier diets.
Tiered pricing is also a great example of shifting choice architecture. By increasing prices according to
usage, tiered pricing expands a basic level of access for all but ratchets down consumption as prices increase along with total usage. In Durban, South Africa, for ex-ample, the first 750 litres of water per month is free (rec-ognizing that access to water is a basic human right). But as consumption increases, so does the price. The cost of the next 20,000 litres jumps dramatically, and beyond that the cost doubles again (Vital Water Graphics 2009). Tiered pricing could easily be expanded to electricity and heating fuels, which in turn could further incentivize effi-ciency upgrades and solar panel installations on homes.
It is not only governments that can implement sig-nificant choice edits. While businesses have mostly used choice editing to sell more products (such as cultivat-ing planned obsolescence), companies can also design products to be longer-lasting, repairable, and, through everything from marketing and store design to shelf placement, can encourage more sustainable choices. Stores can even take a further step of only stocking sus-tainable goods, whether removing virgin paper prod-ucts, selling only sustainably harvested forest products, or selling only sustainably sourced fishes, as many com-panies have now committed to do. Companies can also shift default options. For example, utilities can make re-newable energy the default source of electricity for new customers, or investment companies can make a green portfolio the default, which leads customers to automati-cally opt for the more sustainable option (Maniates 2010).
Analyses in this report have shown that key areas where choice editing could have the most and quickest impact are food, private transport, and housing. Ulti-mately, considering that choice editing directly affects specific industries and product sales, it is rarely con-flict-free. Choice editing strategically can help success-fully navigate through the conflict, but not always avoid it. Therefore, if conflict is unavoidable, efforts to choice edit should be worthwhile. Thus, while mobilizing against plastic bags is useful, far greater impacts and quicker returns are to be seen in severely restricting or outrightly banning high carbon-intensive consumer-ism, especially where there are privatised benefits and distributed burden sharing. Private jets, mega yachts, fossil fuel investments and other domains where the polluter elite thrive while getting everyone else to pay the environmental price are examples (Textbox D). Common practices of the consumer class such as fre-quent flying (mileage) programs to accumulate and use miles for further flying, customer loyalty programs that encourage stays in wasteful hotels, etc., need to be seen in the context of their high climate impacts and banned (Carmichael 2019). Such a focus would have the addi-tional advantage of not victimising low-income or sus-tainable groups that already have limited consumption and environmental impacts. And while outright bans may be challenging with the heavily resourced pollut-

77
Section IIIPolicy Approaches For a Fair Consumption Space
er elite, significant taxes on such unmitigated environ-mentally destructive consumption options could help rein this in.
As choice editing is an effective and proven strategy, it should be applied across key sectors and sub-sectors:
TEXT BOX C: Examples of sustainability choice editing in transport
Phase out fossil fuel cars. A European Union proposal would ban the sale of new petrol and diesel cars from 2035 in order to address the climate crisis. The European Commission proposed a 55% cut in CO₂ emissions from cars by 2030 compared to 2021 levels (Carey and Steitz 2021). Carmaker Volkswagen has committed to stop selling combustion engine cars in Europe by 2030 (Reuters 2021).
Freeze all new road building projects. As a part of its plan to achieve net-zero carbon emis-sions by 2050 (Messenger 2021), the Welsh government announced in June 2021 a freeze on all new road projects. In Wales, 17% of emissions are from road vehicles. The government plans to redirect funding to public transport and maintaining current roads (BBC News 2021b).
Discourage private car use. The London Congestion Charge, which vehicles must pay in order to drive within the charge zone, reduces car traffic in central London, encourages walking, biking, and use of the public transport network. In addition, vehicles that do not meet Ultra Low Emission Zone standards must pay an additional charge to drive in further restricted zones (Transport for London n.d.).
Stop airport expansion. Plans to expand Bristol airport in the United Kingdom were re-jected by councillors following concerns that it would exacerbate the climate emergency, damage the health of local people, and harm flora and fauna (Morris 2020). Similarly, in 2017 concerns that an additional runway at the Vienna airport would lead to an additional 1.79% annual increase in carbon emissions led a Austrian court to block expansion of the airport (Berwyn 2017).
Ban short haul flights. France has banned short-haul domestic flights—journeys that could be made under two-and-a-half hours—in a bid to reduce climate impacts from flying. In-stead it would promote train travel, which is lower emissions per capita, as an alternative along those routes (BBC News 2021a). Similarly, Austrian Airlines replaced short domestic flights with increased train service after a government bailout (a good tool for implementing choice edits) required that it cut its carbon emissions and end flights that are under three hours and have a direct train connection (Halasz and Picheta 2020).
Keep oil in the ground. Governments of several countries, including New Zealand, Belize, Costa Rica, France, and Denmark have all enacted total or partial bans on oil and gas ex-ploration. New Zealand has a ban on new offshore oil and gas exploration permits, and has established a “Just Transitions Unit” to support parts of the country most dependent on the oil and gas industry (SEI et al. 2019).
number of houses owned, house sizes and insulation standards, electricity, water, and fuel usage, and so on. As Textbox C lists, there are many high-level transpor-tation choice edits that are already being implemented to great effect.

78
Section IIIPolicy Approaches For a Fair Consumption Space
5.4. Assessments for choice editing
Choice editing at an economy-wide scale requires facil-itation by governments and with the involvement of key stakeholders that recognise what is at stake, according to the (Sustainable Consumption Roundtable 2006). To ensure public acceptance, the objective of choice edit-ing needs to be clearly understood, the process trans-parent (based on a widely recognised criteria such as a scientific approach) and be seen as fair. Developing a choice editing framework is beyond the scope of this report, however, for demonstration purposes, a num-ber of logical and scientific assessment approaches are already widely available that can be used for a rigorous framework.
→ Impact and sustainability assessments ask the question of whether we can ecologically afford the option under consideration. It applies an under standing of biophysical capacity, including planetary boundaries, limits to resources, climate change from GHG emissions to set physical thresholds below which consumption should occur—the ceiling of a fair consumption space.
→ Needs and wellbeing assessments ask the question of whether products and services are necessary. Assessments can be useful to understand the utility of existing products and services, and distinguish products that satisfy needs (starting with fundamental human needs) versus wants. In a climate crisis, a luxury is any carbon emitting product or service that draws on the remaining limited carbon budget without a commensurate contribution to wellbeing or near-term opportunity for regeneration.
→ Social innovation stimulates development of alternative satisfiers of needs, or identification of options that could be modified to be more sustainable.
→ Cost assessments reveal whether alternative satisfiers are economically and socially affordable. Comparative costs reveal what it takes to introduce new product alternatives, modify existing options, or retire some obsolete or harmful products and services completely.
In promoting sustainable lifestyles, choice editing can be applied to edit-in desired options or to edit-out undesired ones. It can be used to edit-out unsustain-able products and services (those that don’t contrib-ute to the wellbeing of environment and society—or which adversely affect them), overconsumption (con-suming beyond the fair consumption space), superflu-ous consumption (which is neither sustainable nor un-sustainable but provides no additional value and takes up resources or opportunities for others to satisfy their needs). Conversely, it can be used to edit-in sustaina-ble alternatives to existing products or ways of meeting needs by stimulating innovation, or to ensure access to satisfiers of fundamental human needs and address un-der-consumption.

79
Section IIIPolicy Approaches For a Fair Consumption Space
TEXT BOX D: The polluter elite: Recognising inequalities in consumption
Not all lifestyles contribute equally to climate change; in approaching solutions, it is impor-tant to recognise that in fact there is a “polluter elite” who hold greater individual respon-sibility now and historically (Kenner 2019). The polluter elite are extremely rich individu-als whose net worth, lifestyle, and political influence mainly rest on wealth that is derived from investments in polluting activities. The 80 million richest people around the world are responsible for more greenhouse gas emissions from their consumption and their invest-ments than the poorest four billion (Chancel and Piketty 2015; Oxfam 2015; Knight et al. 2017). (Their much larger carbon footprints tend to remain hidden by the political institu-tions’ focus on territorial or averaging per-capita emissions.) For this reason, it is appropri-ate that environmental policies currently under consideration, such as carbon taxes and choice editing, target the richest in their consumption (particularly luxury transport) and investments (their portfolios invested in fossil fuels and agribusiness, which are likely to have much larger greenhouse gas emissions compared to their consumption).
In order to fund the war effort and post-war reconstruction after 1945, the UK govern-ment raised taxes on income, inheritance, and luxury goods. The top marginal income tax rate went up from 75% in 1938 to 98% in 1941, and it stayed at this level until 1952; the top inheritance tax rate went up from 50% in 1938 to 65% during the war, and it increased to 80% between 1949 and 1968 (Piketty 2014). Just as in the Second World War when those with the broadest shoulders were asked to contribute the most, in order to get the expected rapid decrease in lifestyles carbon footprints, climate policy must pay attention to asymmetries in power and ensure that actions address the richest while also avoiding disproportionate effects on the poor. If the richest continue their high carbon-intensive lifestyles (as some did when they flew in private jets during national lockdowns while the majority of the population did not leave where they lived) this undermines other efforts at wider behaviour change (Newell et al. n.d.).
Issues of who holds power and profits from the fossil fuel dominated status quo must be engaged with by those seeking to promote sustainable behaviour change (Akenji 2019). Perhaps the most important area and where the role of the polluter elite has been decisive is in their political influence. In addition to their own high carbon-intensive lifestyles, the polluter elite also hold more responsibility because as decision makers they approve lob-bying of governments (funding lobbyists and direct donations to political parties) to block the transition away from fossil fuels (Kenner and Heede 2021). With their wealth and access to those in decision making positions, they have contributed to lock-in the consumption options of ordinary citizens to be dependent on fossil fuels e.g. diesel and petrol vehicles, plastic packaging, coal and gas for electricity, heating, and cooking. Whilst some lower-car-bon consumption options exist, overall the polluter elite have broadly been successful in trapping consumers by shaping a socio-technical context of carbon-intensive lifestyles. For example, when people want to travel, often the most accessible option (and sometimes the cheapest) is to drive a petrol or diesel vehicle. One factor, of many, for this is because the polluter elite have historically lobbied governments for fossil fuel subsidies and to build infrastructure for the fossil fuel economy (and thus deprioritize low-carbon alternatives).
While many seek options of transforming to low carbon lifestyles, additional attention needs to be on the actors blocking systemic change and individual action. The fossil fuel based global economy we live in today has been built up over centuries of choices by a range of stakeholders. To undertake the necessary phase out of fossil fuel production and use economy-wide will require identifying, discussing, and taking on the power of the pol-luter elite, in particular their capacity to lobby and capture governments around the world.

80
Section IIIPolicy Approaches For a Fair Consumption Space
6 – Universal Basic Services: Social Guarantee for a
Fair Consumption Space
P ublic services and other collective meas-ures to meet human needs have an impor-tant role to play in identifying and realising a fair consumption space and sustainable life-styles. They represent a form of public con-
sumption that can be controlled democratically rather than by market forces (Coote 2021). It has been noted (in Chapter 1) that sustainable lifestyles can be ‘facilitated by institutions, norms and infrastructures that frame individual choice’ and that attention should also be paid to ‘non-economic aspects of our lives, as well as the role of factors outside the marketplace’ including policy and innovation. Therefore ensuring universal basic servic-es is an innovative and regenerative measure that can help to achieve fair and sustainable consumption within environmental limits.
Following is a brief summary of the case for univer-sal basic services (UBS) as part of a Social Guarantee (SG) (The Social Guarantee n.d.) designed to ensure that every individual has access to life’s essentials. The SG draws on experience of post-war welfare states, learn-ing from their strengths and their weaknesses, and re-imagines them for the 21st century. This brief piece also contributes to addressing a gap in the prevailing discourse about climate mitigation where social poli-cy ought to be and show how social and environmental policies can be mutually reinforcing.
The concept of UBS was initially put forward as an alternative to universal basic income (UBI) as a better way of tackling poverty and inequality (Coote and Per-cy 2020; Institute for Global Prosperity 2017). The basic argument is that meeting human needs through public services and other collective measures is more equita-ble, affordable, and sustainable than simply providing cash benefits to support individual market transactions. Growing enthusiasm for UBI as a regular unconditional
cash payment to all was seen as a threat to the collective ideal that inspired post-war welfare states—both fiscal-ly (because anything other than a token UBI would be hugely expensive and divert funds from services) and ideologically (because UBI favours markets and individ-ual autonomy over collective endeavour and social sol-idarity) (Coote and Yazici 2020). In 2021, proposals for a Social Guarantee (The Social Guarantee n.d.) brought together universal services with a fair income derived from a living wage and a guaranteed minimum income, as Figure 6.1 shows. The latter is designed to ensure that no one’s income falls below an agreed level of suf-ficiency. It shares the primary goals of many UBI sup-porters but is infinitely more affordable and compati-ble with UBS.
6.1. Meeting human needs
The Social Guarantee is grounded in need theory, rec-ognising that everyone shares the same set of basic hu-man needs that enable them to participate in society. It is argued that every individual should have secure ac-cess to these essentials, regardless of income, location, or status.
Doyal and Gough identify participation, health, and critical autonomy as basic human needs (Doyal and Gough 1991). In a similar vein, Nussbaum describes three ‘core’ capabilities: of affiliation, bodily integri-ty, and practical reason (Nussbaum 2001). While such needs are universal across time and space, the practical means by which they are satisfied vary widely, as norms, resources, and expectations shift and change between generations and countries. But there are certain need satisfiers or ‘intermediate needs’ that are generic and enduring. They are listed by need theorists as water,

81
Section IIIPolicy Approaches For a Fair Consumption Space
nutrition, shelter, secure and non-threatening work, ed-ucation, healthcare, security in childhood, significant primary relationships, physical and economic security, and a safe environment (Miller 2012). Added to the list more recently are access to motorised transport and to digital information and communications (Rao and Min 2018).
A key feature of this needs-based approach is that it recognises limits. While wants and preferences vary in-finitely and can multiply exponentially, needs are satia-ble: there’s a point beyond which more food, more work, or more security are no longer helpful and could even be harmful. Thus, sufficiency is integral to the process of meeting universal needs. The combination of these two concepts—universalism and sufficiency—is central to the Social Guarantee.
Generic need satisfiers provide a starting point for exploring the practical implications of the Social Guar-antee. So far, the focus has been on education, health-care, housing, transport and digital access, but it could well be extended to other necessities such as food, en-ergy, and access to green spaces.
6.2. A normative framework
The Social Guarantee is best understood as a normative framework for policy and practice. Each area of need re-quires a customised approach. As Figure 6.2 indicates, some needs are typically met by individuals through direct market-based transactions while others can on-
Figure 6.1. The Social Guarantee
Source: The Social Guarantee (n.d.)
The Social Guarantee
Living income
UniversalServices
Real living wage Education
Childcare
Guaranteed income
Health &Social care
Digital access
Housing
Transport
ly be met for all by pooling resources and sharing re-sponsibility. In all cases, collective measures—includ-ing taxation, investment, and regulation—are required to ensure that access to life’s essentials is both univer-sal and sufficient. And in all cases the same set of prin-ciples apply.
Accordingly, access to life’s essentials is a universal right. Access is based on need, not ability to pay. Power in deciding how needs are met is devolved to the lowest appropriate level. Services are delivered by a range of organisations with different models of ownership and control, but all share a clear set of enforceable public interest obligations, which support collaboration and reinvestment over competition and profit extraction. There is meaningful participation in planning and de-livering services by residents and service users, work-ing in close partnership with professionals and other service workers, reflecting the model of co-production (Boyle et al. 2010). Service workers are entitled to fair pay, secure conditions, and high-quality training and career development. There are clear rules and proce-dures for establishing and enforcing entitlements. Last, but most important in this context, services and oth-er collective measures to secure life’s essentials are de-signed and delivered to promote and enable sufficiency within planetary boundaries.
Within this framework, state institutions are likely to provide some services directly—at national and local levels—where appropriate. Beyond that, they have cer-tain key functions: to guarantee equality of access for individuals, between and within localities; to set and en-

82
Section IIIPolicy Approaches For a Fair Consumption Space
Figure 6.2. Individual and collective means of securing life’s essentials
force ethical and quality standards; to collect and invest the necessary funds, distributing them to maximise in-clusion and fairness; to encourage and support diverse models of service provision and enforce providers’ public interest obligations; and to coordinate activities across sectors to achieve optimal results.
It is proposed that key decisions—for example, about designing services and other measures, or about the or-der of priorities and pace of change—be made through a three-way democratic dialogue. This combines the experiential wisdom of lay residents with the codified knowledge of experts and the strategic and tactical in-sights of elected representatives. Citizens’ juries and citizens’ assemblies offer useful models that can be ad-justed for decision-making at national and local levels, and across a range of political settings.
There are many examples from a wide range of coun-tries that show how needs are being met collectively in ways that are fairer and more sustainable than where they are left to unfettered markets. It is impossible to do justice to them here, but details and further reading can be found inter alia in a briefing on ‘Universal Quali-ty Public Services’ (Coote and Yazici 2020) published re-cently by Public Services International and on the Social Guarantee website (The Social Guarantee n.d.).
6.3. Investing in the social infrastructure
The costs of implementing the Social Guarantee will vary between areas of need as well as between coun-tries. It will also depend on the scope and quality of measures that are introduced to secure life’s essentials for all. Most OECD countries already spend significant amounts on healthcare, transport, and access to digital information. It has been estimated that the total addi-tional annual expenditure required for the five areas of need on which the Social Guarantee is focused, if im-plemented all at once and provided universally, would be between 4 and 5% GDP in a typical OECD country.
To put this in perspective, both the UK and US gov-ernments increased public spending by more than 6% of GDP in 2008 to bail out private banks during the fi-nancial crisis and in 2020–21 the United States, Japan,
Food Internet Transport
Individual Collective
Housing Childcare Adult social care
Healthcare and education
Germany, Italy, and France all spent more that 20% of GDP on fiscal stimulus packages related to COVID-19 (Statista 2021b). These events are not directly compa-rable, but they do indicate that public spending can be more a matter of political imperative than applying rules of contemporary economics.
Further research is required to calculate the net costs of universal services alongside measures to se-cure a living income. This would take account not only of expenditure but also of potential savings, as well as returns on the investment in social infrastructure that the Social Guarantee entails. For example, there may be economies of scale where needs are met collective-ly rather than individually. Enabling people to co-pro-duce—as far as possible —he ways in which their needs are met can bring uncommodified human resources in-to the process: this can not only enhance the wellbe-ing of the individuals concerned—provided they are ad-equately supported—but also improve the quality and scope of the services without a corresponding increase in the overall cost. In addition, collective action to meet needs can prevent harm that would otherwise require more costly ‘downstream’ interventions by public ser-vices—for example, decent childcare and housing for all who need it can improve wellbeing and reduce demands for healthcare services. An analysis conducted for 74 low and middle income countries found that increas-ing health expenditures by just $5 a person with a fo-cus on preventative health measures could yield up to nine times that value in economic and social benefits in-cluding greater GDP growth and the prevention of need-less deaths (Stenberg et al. 2014). No less important is the fact that public investment in universal services can generate considerable returns as discussed below.
Protagonists claim that implementing the Social Guarantee can bring substantial benefits in terms of equality, efficiency, solidarity, and sustainability. These claims are not definitive because the framework is new and untested, and there has so far been little opportuni-ty for scrutiny and debate. There is nevertheless some evidence, drawn from studies of existing public servic-es that support them.

83
Section IIIPolicy Approaches For a Fair Consumption Space
6.3.1 EqualityPublic services are known to reduce income inequali-ties by providing a virtual income or ‘social wage’, made up of in-kind benefits. For example, UK research has shown that a free childcare service would save a cou-ple with two children more than £200 per week. This is worth much more to people in low income groups
(Davis et al. 2020). A study of OECD countries suggests that poor people would have to spend three quarters of their income on essential services (Verbist et al. 2012). Table 6.1 shows in-kind benefits—of education, health-care, social housing, ECEC (early childhood education and care), and elderly care—as a share of disposable in-come per quintile.
Table 6.1. In-kind benefits as a share of disposable income by quintile, average over 27 OECD countries
Q1 Q2 Q3 Q4 Q5 Total
Education 30.6% 18.5% 14.2% 10.4% 5.6% 11.8%
Healthcare 34.9% 22.2% 15.8% 11.8% 7.2% 13.9%
Social housing 1.8% 0.7% 0.4% 0.2% 0.1% 0.4%
ECEC 4.5% 3.0% 2.4% 1.5% 0.8% 1.8%
Elderly care 4.0% 1.9% 0.7% 0.4% 0.2% 0.9%
Total 75.8% 46.4% 33.5% 24.3% 13.7% 28.8%
Source: Verbist et al. (2012)
The 75.8% share for the lowest income quintile com-pares with a 13.7% income share for the highest quin-tile. Indeed, the study shows that inequality in OECD countries is reduced by one-fifth when the measure is extended from money incomes to a combination of money and social income (Verbist et al. 2012). Without in-kind benefits, many individuals and families would be unable to meet their needs and flourish. They are important for all families, and especially for those on lower incomes, not only directly through the services they offer (education, care, housing), but also indirectly through their preventative effects as well as improving wellbeing and a sense of security. The sense of security is also a foundation for trust, which in turn is good for social interaction, democratic relations, and the econ-omy at large. Those who can rely on getting an educa-tion, a decent home, and care when they need it are bet-ter protected over time against accumulating risks and vulnerabilities.
6.3.2. EfficiencyMeasures of efficiency in the public sector are usually complex and contested. Public services have been ac-cused of inefficiencies, to justify introducing market rules. But privatisation, competition between multiple providers, and customer choice for service users have largely failed to improve outputs let alone outcomes. These failings have been greatly exacerbated by pub-lic spending cuts.
Non-profit, collective forms of provision avoid in-efficiencies that routinely arise from market process-es: inflexible contracts, higher transaction costs, and moral hazards that are encountered when profit incen-tives combine with unequal knowledge in markets. A non-profit system does not need to extract funds to pay dividends to shareholders.
A 2016 study compared spending on healthcare and average life expectancy in OECD countries. It found the USA, which is a mainly market-based system, outspent the UK in 2014 by the equivalent of £6,311 ($8,000) per person, compared with £2,777 ($3,500, yet had an av-erage life expectancy at birth of 78.8 years, compared with 81.4 in the UK (Office for National Statistics 2016).
Calculations of efficiency must take account of the multiple dimensions of value, the many ways in which value is experienced and how it accrues. This calls for social value analysis to take account of longer-term, in-direct effects across social and environmental dimen-sions. As noted, expenditure on UBS can be seen as an investment in social infrastructure, which can be ex-pected to yield significant returns over time.
Social Return on Investment (SROI) is one approach that has been adopted by the UK government, which formally requires public authorities to consider wheth-er their procurement practices ‘improve the econom-ic, social and environmental well-being of the relevant area, and how, in conducting the process of procure-ment, it might act with a view to securing that improve-

84
Section IIIPolicy Approaches For a Fair Consumption Space
ment’ (Department for Digital, Culture, Media and Sport and Cabinet Office 2021). Bauwens has called for a ma-jor ‘Value Shift:’ instead of rewarding ‘extractive’ prac-tices ‘that enrich some at the expense of the others,’ we should reward ‘generative’ practices that enrich the so-cial and environmental resources to which they are ap-plied (Bauwens and Niaros 2017). Building support for UBS will partly depend on redefining efficiency along these lines, by asking how far universal basic servic-es lead to outcomes that renew local assets, safeguard planetary boundaries and nurture human flourishing.
6.3.3. SolidarityThe concepts of shared needs and collective respon-sibilities embody the idea of solidarity, and the Social Guarantee has potential to develop and strengthen it. Solidarity is taken to mean feelings of sympathy and re-sponsibility between people that promote mutual sup-port. It is an inclusive process, not just within well-ac-quainted groups but also, crucially, between people and groups who are ‘strangers’ to each other. It involves col-lective action towards shared objectives (Wilde 2013).
First, universal services can develop experience of shared needs and collective responsibility, which builds
understanding of how people depend on each other and a commitment to retaining those interconnections. Sec-ond, where services bring people together from differ-ent social groups, they can provide opportunities for developing mutual sympathy and responsibility. Third, the combined effects of more and better services bring benefits to society as a whole and have a redistributive effect, reducing inequalities that otherwise create bar-riers to solidarity.
By contrast, there is a rich literature on the ways in which systems based on individualism, choice, and competition weaken the values of social citizenship and undermine solidarity (Jayasuriya 2006; Brodie 2007; Akenji 2019; Lynch and Kalaitzake 2020).
6.3.4. SustainabilitySustainability involves, at its simplest, an inherent ‘ca-pacity for continuance’, as Ekins observes: a sustainable system is one that can function in ways that continue to achieve its desired goals over time (Ekins 2014). Uni-versal services have the potential to affect this capacity through prevention of harm, through economic stabili-sation and through helping to mitigate climate change and the depletion of natural resources. The urgent ne-
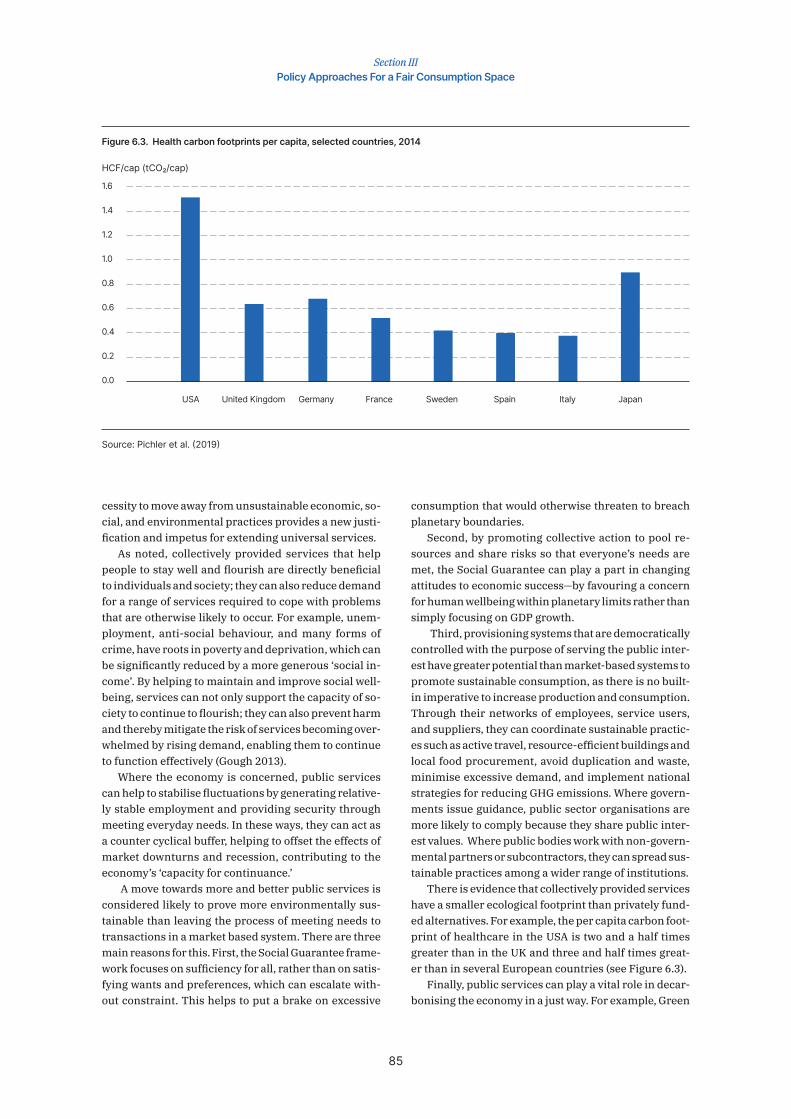
85
Section IIIPolicy Approaches For a Fair Consumption Space
cessity to move away from unsustainable economic, so-cial, and environmental practices provides a new justi-fication and impetus for extending universal services.
As noted, collectively provided services that help people to stay well and flourish are directly beneficial to individuals and society; they can also reduce demand for a range of services required to cope with problems that are otherwise likely to occur. For example, unem-ployment, anti-social behaviour, and many forms of crime, have roots in poverty and deprivation, which can be significantly reduced by a more generous ‘social in-come’. By helping to maintain and improve social well-being, services can not only support the capacity of so-ciety to continue to flourish; they can also prevent harm and thereby mitigate the risk of services becoming over-whelmed by rising demand, enabling them to continue to function effectively (Gough 2013).
Where the economy is concerned, public services can help to stabilise fluctuations by generating relative-ly stable employment and providing security through meeting everyday needs. In these ways, they can act as a counter cyclical buffer, helping to offset the effects of market downturns and recession, contributing to the economy’s ‘capacity for continuance.’
A move towards more and better public services is considered likely to prove more environmentally sus-tainable than leaving the process of meeting needs to transactions in a market based system. There are three main reasons for this. First, the Social Guarantee frame-work focuses on sufficiency for all, rather than on satis-fying wants and preferences, which can escalate with-out constraint. This helps to put a brake on excessive
Figure 6.3. Health carbon footprints per capita, selected countries, 2014
HCF/cap (tCO₂/cap)
Source: Pichler et al. (2019)
1.6
1.4
0.8
0.6
0.4
1.2
0.2
1.0
0.0
USA SwedenGermany ItalyUnited Kingdom SpainFrance Japan
consumption that would otherwise threaten to breach planetary boundaries.
Second, by promoting collective action to pool re-sources and share risks so that everyone’s needs are met, the Social Guarantee can play a part in changing attitudes to economic success—by favouring a concern for human wellbeing within planetary limits rather than simply focusing on GDP growth.
Third, provisioning systems that are democratically controlled with the purpose of serving the public inter-est have greater potential than market-based systems to promote sustainable consumption, as there is no built-in imperative to increase production and consumption. Through their networks of employees, service users, and suppliers, they can coordinate sustainable practic-es such as active travel, resource-efficient buildings and local food procurement, avoid duplication and waste, minimise excessive demand, and implement national strategies for reducing GHG emissions. Where govern-ments issue guidance, public sector organisations are more likely to comply because they share public inter-est values. Where public bodies work with non-govern-mental partners or subcontractors, they can spread sus-tainable practices among a wider range of institutions.
There is evidence that collectively provided services have a smaller ecological footprint than privately fund-ed alternatives. For example, the per capita carbon foot-print of healthcare in the USA is two and a half times greater than in the UK and three and half times great-er than in several European countries (see Figure 6.3).
Finally, public services can play a vital role in decar-bonising the economy in a just way. For example, Green

86
Section IIIPolicy Approaches For a Fair Consumption Space
New Deal programmes to retrofit the vast bulk of the housing stock will require public planning, finance, and management. They will be needed to ensure a ‘just tran-sition’ to lower carbon living, rather than one that will load costs onto the poorest people and communities.
6.4. Conclusion
To conclude, the Social Guarantee is a principled framework that seeks explicitly to contribute to cre-ating a fair consumption space in ways that are sum-marised briefly below.
First, the Social Guarantee puts collective (or pub-lic) consumption on the agenda, alongside individual (or private) consumption, as a site of efforts to achieve a sufficient social foundation for all, to avoid breach-ing planetary boundaries, and to constrain excessive—and unnecessary—consumption. It involves consump-tion through expenditures on goods and services by a wide range of social and public institutions at national and local levels. Hospitals, schools, and prisons are ob-vious examples.
Second, it aims to support a sufficient level of con-sumption for all through an enhanced ‘social income’. It offers benefits in kind, according to need, not ability, to pay, that are intended to enable everyone to have se-cure access to life’s essentials. This the most obvious and substantial way in which the Social Guarantee can contribute to maintaining the social foundation that constitutes the lower boundary of a fair consumption space for sustainable lifestyles.
Third, the Social Guarantee embodies an ethos of collective responsibility and a needs-based approach to human welfare, based on sufficiency. As such, it of-fers a robust framework for policy and practice that is closely aligned with the goal of living well within limits. It seeks to build solidarity and mutual support among people and groups in ways that cannot be achieved by systems based on market transactions alone. By en-couraging an awareness of interdependence and devel-oping practical experience of collective responsibility, it can help to create favourable conditions for society to play a pivotal role in imposing limits on individual free-dom to consume more than is required to live a good life (Fuchs 2019).
Fourth, as noted above, the SG framework can influ-ence provisioning systems so that they remain within ecological limits. Inherent in the framework is a stipu-lation that all organisations that receive public funds to provide universal services, providers subscribe to pub-lic interest obligations that include the requirement to cut emissions and safeguard natural resources. Also in-herent is the national allocation of resources to local and regional authorities to ensure equal access to services
between different areas and population groups. This of-fers a vehicle for shaping the practice of organisations involved in delivering services and for influencing con-sumption patterns of people using services. For exam-ple, a free bus service can discourage other, more en-ergy intensive forms of travel; housing policies can be designed not only to create zero-carbon homes made from renewable materials, but also to encourage resi-dents to change patterns of consumption and tread more lightly on the planet; childcare services can be organised and run in ways that raise awareness about sustainable consumption, and encourage and support it in practice.
Fifth, the UBS framework can help to constrain ex-cessive consumption by changing incentives and redi-recting resources. If collective provisioning became an acceptable—even popular—way to secure much of what is necessary to live well within limits, norms and ex-pectations would shift, influencing what people want to buy, how much is considered ‘enough’ and awareness of the negative effects of accumulating too much stuff. Fi-nancing UBS requires higher taxation, unless debt ris-es. Even where a tax system is proportional rather than progressive, higher disposable incomes are likely to be brought below the level they would otherwise be, reduc-ing luxury consumption (all else being equal). Compar-ing two countries, with high and low provision of public services but with similar total consumption, the extent and share of high-end consumption above any ceiling would be lower in the former country.
Finally, it is important to stress that the Social Guar-antee is not a single policy lever but a proposed route for policy making across a range of different areas. That route is shaped by distinctive values, favouring collec-tive action to meet shared needs now and in years to come. How far these proposals are able to fulfil their promise depends on how services are devised, organ-ised and funded, where power lies, models of owner-ship, how people participate, conditions of eligibility, and how entitlements are realised. The Social Guar-antee agenda can be introduced incrementally, but its ambitions go well beyond piecemeal reform. It is essen-tially about changing whole systems to achieve a sus-tainable future.

87
Section IIIPolicy Approaches For a Fair Consumption Space
TEXT BOX E: Wellbeing: linking sustainable lifestyles, climate change, and health
Achieving the 1.5 °C target of the Paris Agreement and transitioning towards a fair con-sumption space will not only reduce the impacts and costs of climate change (IPCC 2018), it will also bring about improvements in quality of life including on physical and mental health, the quality of social relationships, interpersonal trust, work-life balance, empower-ment, community engagement, and on many other levels.
Widespread adoption of 1.5-degree lifestyles requires an economy that prioritises hu-man and ecological wellbeing over growth, and that recognizes, protects, and promotes the contributions of natural, social, and human capital to collective wellbeing. Achieving a fair consumption space for sustainable lifestyles means reducing both within- and be-tween-countries inequalities by tackling over- as well as under-consumption. While, on the one hand sustainable lifestyles entail a radical change in the ways we satisfy our needs (Akenji 2019), on the other hand they entail consuming better, and living a healthier life in more equal societies that nurture participation, dignity, human connections, fairness, and ecological wellbeing.
Multiple Co-benefits
Figure E.1. Co-benefits of adopting 1.5-Degree Lifestyles
Achieving a fair consumption space could bring about a number of co-benefits in terms of increased personal, community, ecological, and economic wellbeing.
Social cohesionEquality
Community engagement
Fair Consumption
Resource securityInnovative business models
Localized production
Work-life balanceMental–physical health
Empowerment
Healthy ecosystemsLower environment risks
Ecosystem services
Community Wellbeing
Personal Wellbeing
Ecological Wellbeing Economic Wellbeing

88
Section IIIPolicy Approaches For a Fair Consumption Space
The quality of human relations and the living environment are both fundamental de-terminants of a person’s health (European Environment Agency 2018). Continuous materi-al growth and overconsumption are not only responsible for rising greenhouse gas emis-sions but also have detrimental impacts on social cohesion and psychological and physical wellness. Inequalities, psychological distress, anxiety, depression, narcissism, reduction of empathy, and other mental disorders are on the rise in modern societies (Friedli 2009; Botezat et al. 2017; Carod-Artal 2017; Macintyre et al. 2018). Growing inequalities have a negative bearing on personal and collective health outcomes, while greater equality affects many dimensions of wellbeing, from child development to life expectancy, from declining violence to improved social cohesion and interpersonal trust (Kasser 2003; Wilkinson and Pickett 2011). Care-based and trust-based activities, often voluntary, have a fundamental impact on societal wellbeing (Helliwell and Putnam 2004), and high levels of social capital are linked to collective action and more resilient societies.
Studies show how levels of physical health and life expectancy are lower in more eco-nomically unequal countries (De Vogli et al. 2005; Pickett and Wilkinson 2015). A meta-anal-ysis of 29 studies, including about 60 million participants in total, found that people living in regions with high income inequality have an excess risk of premature mortality and poor self-rated health, with a 0.05 unit increase in the Gini coefficient linked to an 8% excess mortality risk (Kondo et al. 2009). In industrialised countries, reduction of income inequal-ity was likely to be more effective in lowering infant mortality rates than further increases in Gross National Product per head would be (Hales et al. 1999).
There is an established link between economic inequality and rates of violence, prop-erty crime, and violent crime. For example, (Fajnzylber et al. 2002) show how a small per-manent decrease in inequality—such as reducing inequality from the level found in Spain to that in Canada—would reduce homicides by 20% and lead to a 23% long-term reduc-tion in robberies.
Countries with higher levels of income inequality tend to have lower levels of education and social mobility (Corak 2016). Lower scores in maths and reading are found in more un-equal countries (Wilkinson and Pickett 2009).
Studies show that people in European countries with higher levels of inequality are less likely to help each other (Paskov and Dewilde 2012), and that higher income inequality is linked with lower levels of voter turnout (Geys 2006; Solt 2010, 2008), lower rates of social and civic participation, and lower political engagement (Lancee and Van de Werfhorst 2012).
Wellbeing benefits of fair consumptionA 1.5-degree world is a world with little or no space for inequality. Societies enabling, main-streaming, and adopting 1.5-Degree Lifestyles within a fair consumption space can only do so in a context of reduced inequalities and increasing collective wellbeing. The co-benefits of 1.5-Degree Lifestyles are many.
Regarding food, the adoption of sustainable diets with reduced consumption of meat not only reduces personal carbon footprints, it is also healthier and linked to lower mortal-ity rates, higher life expectancy, and lower risks of developing heart diseases and diabetes (Willett et al. 2019). For example, one study following more than 200,000 people from three different cohorts for up to 30 years, reported an increment of about 35 grams/day of red meat as associated with a significant 6% increase in risk of type 2 diabetes (Pan et al. 2011).
Regarding transport, reducing private transport in favour of shared, public, and more sustainable transport modes not only reduces carbon footprints, it also reduces air pollution

89
Section IIIPolicy Approaches For a Fair Consumption Space
and encourages active modes of transportation, such as cycling or walking, with numerous benefits for mental and physical health, reduced stress and anxiety, and which increase sense of place and social connectedness. For example, (Requia et al. 2018) estimated that PM 2.5 emissions during congestion periods in the Greater Toronto and Hamilton Area have an impact of 119 to 206 deaths per year. These findings are consistent with other existing studies in international literature (Levy et al. 2010; Zhang et al. 2011), and call for transitioning to more sustainable mobility options.
A better work-life balance, for example introducing a 4-day work week, has benefits in terms of better personal health, quality of work, it frees up time for family care and helps adopting healthy lifestyles, all of that while reducing carbon footprints (Knight et al. 2012; Kossek et al. 2014; Lunau et al. 2014). Shorter and less frequent commuting also leads to health benefits (Requia et al. 2018), lowering the demand for carbon-in-tensive healthcare products and services. Avoiding the stress and anxiety of a traf-fic jam is also good for mental health (Higgins et al. 2018), especially among women (Sandow et al. 2014).
Business innovation Adopting 1.5-Degree Lifestyles also provides economic benefits through improved re-source security and by opening business opportunities and redefining the role of con-sumers. Business opportunities emerge through the innovations that could serve as ena-blers for 1.5-Degree Lifestyles, such as peer-to-peer models, open-source software and hardware, 3D printing, block-chains, precision agriculture and decentralised communi-ty-based renewable energy systems (microgrids). Participatory models, where users play an active role in the design and manufacture of products and services, are also proving effective in helping developing countries to transition towards a more sustainable and wellbeing-centred way to meet some basic needs, for instance in the production of re-newable energy. For example, by late 2014, an estimated 30% of the global cumulative installed capacity of PV in India was owned by private residents, “prosumers” both con-suming and producing electricity (Martin and Jairaj 2016).
By localising and customising production and consumption, business innovation can promote shorter value chains and local empowerment, providing economic opportuni-ties for multiple forms of entrepreneurs while reducing overproduction and waste of re-sources (Fioramonti 2020).
Finally, climate change mitigation through adopting 1.5-degree lifestyles contributes to tackling deforestation, habitat fragmentation and loss, and other concurrent causes of climate change, biodiversity loss, environmental degradation, and the emergence of pan-demics (Jones et al. 2008; Faust et al. 2018; Gibb et al. 2020) and animal-borne infectious diseases such as Ebola (Redding et al. 2019). Climate change impacts ecosystems and ecological wellbeing, affecting crop and seafood production (Nelson et al. 2013), drinking water provision, ecosystems’ “protective” services from floods and coastal storms, as well as other key contributors of nature to our lives (Pörtner et al. 2021).
Overall, by activating policy, innovation, and other enablers for behavioural change, the 1.5°C target of the Paris Agreement can be potentially achieved (IGES et al. 2019). At the same time, a 1.5-Degree society in a fair consumption space would be one of in-creased personal, community, ecological, and economic wellbeing with reduced inequali-ties, better mental and physical health, functioning ecosystems, lower environmental risk, and higher resource, food, and water security.

90
Section IIIPolicy Approaches For a Fair Consumption Space
7 – Sufficiency: How Much is Enough to
Stay Below 1.5°C?
7.1. Understanding the sufficiency concept
Sufficiency is defined as a set of policy measures and daily practices that reduce the demand for energy, mate-rials, land, water, and other natural resources, while de-livering a decent living standard for all within the plan-etary boundaries (Shaheb, n.d.)—decent living standard being a set of essential material preconditions for hu-man wellbeing, which includes housing, nutrition, ba-sic amenities, healthcare, transportation, information, education, and public space (Rao et al. 2019).
Sufficiency is not a new concept, its root goes back to the Greek word “sôphrosunè”, which was translated in Latin to “sobrietas”, in a sense of “enough” (Cézard and Mourad 2019). The sufficiency concept was introduced to the sustainability policy debate by (Sachs 1993) and to academia by (Princen 2003). With the adoption of the Paris Agreement (United Nations 2015) and the collec-tive failure in curbing global greenhouse gas emissions after three decades of climate mitigation policies (Stod-dard et al. 2021), sufficiency is emerging as a climate mitigation strategy to compensate for the unsuccessful efforts of efficiency and limitations of individual behav-iour agency in reducing energy demand and its related environmental impacts.
Sufficiency addresses how lifestyles can be sustaina-ble within a fair consumption space. The remaining car-bon budget, and its normative target for distributional equity, is the upper limit of sufficiency, while require-ments for a decent living standard define the minimum level of sufficiency. By limiting the over and under de-mand for energy, materials, land, water, and other re-sources, sufficiency is likely to become, in the current decade, central to the global climate mitigation strategy (Shaheb n.d.). In fact, the untapped sufficiency potential will contribute to address the unprecedented and ur-
gent transformation of the global economy and to limit the unequivocal role of human activities in global warm-ing (IPCC 2021b).
Sufficiency is often conceptualised by contrast to ef-ficiency. The latter is about the continuous short-term marginal technological improvements which allow do-ing more with less in relative terms without consider-ing the planetary boundaries, while the former is about long-term actions driven by non-technological solu-tions (i.e. land use management), which consume less in absolute terms and are determined by the biophysi-cal processes (Princen 2003). The focus of sufficiency is on human needs and the services required for human wellbeing (i.e., housing including thermal comfort, food, and personal transport) while the focus of efficiency is on human wants such as products and commodities (buildings, cars, appliances, and energy). In that sense, efficiency is a supply-side strategy while sufficiency is a demand-side one.
Sufficiency questions the current approach to cli-mate change mitigation, such as the promise of the technological breakthrough over lifestyle changes, be-havioural change of individuals over systemic change of the economy and the organisation of the society, the cost-benefit analysis over the biophysical reality of the planet, and the market-based instruments over redis-tributive ones (Akenji 2014). Moreover, sufficiency con-fronts the dominant discourse, which puts emphasis on trivial actions such as temperature set points and the over-reliance in the technological improvements driven by efficiency, which substitutes one technology with an-other and thus, increases the demand for materials and their related embodied energy and carbon. Unsurpris-ingly, sufficiency is perceived as controversial by the wealthiest consumers as it challenges their carbon-in-tensive lifestyles, requires changes in their consump-

91
Section IIIPolicy Approaches For a Fair Consumption Space
tion patterns and puts an indisputable cap in their con-sumption levels based on the remaining carbon budget to avoid the overshoot of the 1.5°C temperature target. Sufficiency, however, also includes ensuring that people have ‘enough’ not to suffer from underconsumption but takes into account that everyone has to have enough for a decent living standard.
Sufficiency principles include the moderation of the speed to enjoy life, the reduction of distances be-tween suppliers and consumers to avoid the ecological breakdown, the limitation of trade to focus more on commons as well as the limitation of goods’ ownership (Sachs 1993). Implementing sufficiency principles re-quires i) structural changes to moderate the demand for energy, materials, land, water, and other resourc-es as well as ii) flexibility to allow for developing user-ship of services and for adapting the size and the use of goods and infrastructures to evolving human needs (NégaWatt 2003).
7.2. Sufficiency practices
As described in the section below, by considering an equal distribution of the remaining carbon budget for the 1.5°C temperature target as an upper limit, suffi-ciency requires a metamorphosis in the way human needs (i.e. housing, personal transport, and food) are fulfilled.
7.2.1. FoodMeat consumption and dairy products are the two major contributors to greenhouse gas (GHG) emissions iden-tified in this report. Dietary changes will have a signifi-cant impact on limiting the overshoot of the 1.5°C target, especially in countries with carbon-intensive cuisines. Avoiding animal-based products in industrialised coun-tries would reduce food related emissions by more than 50% (Hallström et al. 2015). However, policies have pri-marily focused on increasing production of organic food (which is also important) and not on reducing car-bon-intensive food.
An integral food perspective, which includes pro-longing the lifespan of food through better planning, purchasing, storing, cooking, and managing the lefto-vers is also among the strategies highlighted in the liter-ature to reduce food waste and losses and consequent-ly their related emissions (Roodhuyzen et al. 2017). At a global level, about one-third of food produced for hu-man consumption is lost or wasted. This is equivalent to 1.3 billion tons per year. The highest food lost or wasted is observed in industrialised countries with an annual total of 95–115 kg/capita compared with 6–11 kg/capita in developing countries (Gustavsson et al. 2011).
7.2.2. HousingThe continuous increase of floor area per capita expe-rienced in industrialised countries is a hidden driver of emissions from the built environment at the construc-tion and the operation stage (Lamb et al. 2021). Applying sufficiency principles to housing requires putting a cap on the per-capita floor area. This cap could be achieved by downsizing dwellings through cohousing strategies by clustering apartments when existing buildings are renovated and by prioritising multi-family buildings over single-family homes in new developments or in-centives to move ‘empty nests’ when household sizes are shrinking (Wilson and Boehland 2008; Stephan et al. 2013; Sandberg 2018). The cap on the per-capita floor area will have a direct impact in reducing the demand for materials in the construction phase and energy de-mand for heating, cooling, and lighting in the use phase (Heinonen and Junnila 2014). Less space also means fewer appliances and equipment and changing prefer-ences towards smaller ones (Aro 2020).
Cohousing strategies provide users, in both new and existing buildings, a shared space (i.e, for laundry, of-fices, guest rooms, and dining rooms) to complement their private space, thus reducing per capita consump-tion of resources including energy, water, and electric-ity (Klocker et al. 2016), while offering social benefits such as limiting loneliness of elderly people and single parents (Riedy et al. 2019). Senior cooperative housing communities and ecovillages are considered among the cohousing examples to scale-up (Kuhnhenn et al. 2020).
Local authorities have an important role to play in the metamorphosis of housing by proposing communal spaces to be shared (Marckmann et al. 2012) through urban planning and land use policies (Newton et al. 2017). This can encourage intergenerational cohous-ing as well as interactions between people with different social backgrounds (Williams 2008) or spark the estab-lishment of sufficiency consultancy services to citizens (Spangenberg and Lorek 2019). Progressive taxation based on a cap in the per-capita floor area is also need-ed to adapt the size of dwellings to households’ needs (Murphy 2015; Cohen 2021).
7.2.3. MobilityOver the last three decades of climate mitigation poli-cies, emissions from mobility have increased in all coun-tries (Lamb et al. 2021) driven by the expansion of the use of private cars due to urban sprawl, the lack of public transport, as well as the social and financial incentives to become a car owner. Sufficiency practices to reduce emissions from mobility include living car-free, ride sharing, reducing the travelled-distances, the weight of private cars, and speed limits (Bigo 2020). However, the focus of policies and research has been mainly on

92
Section IIIPolicy Approaches For a Fair Consumption Space
changing the behaviour of individuals through car shar-ing instead of ride sharing (Chen and Kockelman 2016) and on making mobility smarter (Marsden et al. 2014; Barr 2018). The contribution of structural changes to reducing emissions from mobility through new cycling and walking infrastructure, ride sharing, and safe and friendly public transport (Hasselqvist and Hesselgren 2019) are rather neglected in both policies and research.
Air travel and its related emissions have also in-creased in the last three decades (Gössling and Humpe 2020), especially with the increased offers for low-cost flights and leisure as well as the variety of frequent fly-ers’ benefits. More recently, there has been an increas-ing focus on avoiding air travel with the flying shame movement. Using other modes of transportation and slowing travel to rediscover trips’ enjoyment are among the sufficiency practices to reduce emissions from air travel, which are estimated at 1.6 tCO₂e/capita saved per roundtrip transatlantic flight (Wynes and Nicho-las 2017).
Applying sufficiency principles to mobility requires framing mobility as a service to be provided within the limited per-capita carbon budget to avoid the over-shoot of the 1.5°C temperature target. Urban planning and land use policies (Duffy 2009) play a major role in triggering or avoiding the daily travelled distances. High density, multi-functional areas, teleworking, as well as progressive taxation of frequent flyers and owners of multiple cars and private jets are among the sufficiency solutions to limit emissions from mobility.
7.2.4. Other (consumer goods and services)Similar strategies are suggested in the literature for products and goods (Freudenreich and Schaltegger 2020). Increasing the lifespan of products and goods by penalising planned ob-solescence as well as moving from a linear use of materials and products to a circular one by reducing, reusing, recycling, and producing locally will reduce emissions from goods. Mov-ing from ownership of products to usership of services (Gru-bler et al. 2018) as well as a slowing down their use (i.e. Slow fashion (Joyner Armstrong et al. 2016)) are also among the sufficiency practices to consider.
7.3. Sufficiency levels in climate mitigation scenarios aiming at 1.5°C temperature target
The contribution of sufficiency practices in mitigating cli-mate change is hardly captured in global mitigation scenari-os due to the underpinning modelling methodologies, which do not capture climate change uncertainties and irreversi-ble changes. The most influential climate mitigation mod-els are driven by i) the narrow techno-economic rationality (Wilson et al. 2020), ii) the technological over-optimism and reliance in unproven supply side solutions with high un-certainties (Larkin et al. 2018), iii) the price signal, iv) the cost-benefits modelling approach and v) irrational faith in the “free” market to mitigate climate change. These math-ematical characterisations on which the most influential models are built are growth-based, leading to prioritising climate unfriendly actions such as creating and/or sustain-ing jobs in carbon-intensive industries considered cost-ef-fective in the short-term. Overall, scenarios based on influ-ential models do not capture the complexity and diversity of the long-term climate change damages, which are consid-ered as externalities translated into social costs that can be internalised using carbon pricing to have the market cor-rect its failures.
Since the adoption of the Paris agreement (United Na-tions 2015), new scenarios based on sufficiency principles are emerging. The Decent Living Energy (DLE) developed by (Mill-ward-Hopkins et al. 2020) and the Low Energy Demand (LED) developed by Grubler et al. (2018) have pioneering innovative modelling approaches. The former is based on a bottom-up modelling approach while the latter combines both bottom-up and top-down modelling approaches. The LED scenario is the only known scenario delivering on the 1.5°C target without negative emissions (Grubler et al. 2018). Global final energy demand in LED by 2050 is estimated at 245 EJ, which is 40% less than in 2018. On the other hand, the DLE, with its radical demand-side changes driven by sufficiency principles, pro-jects global final energy consumption to be at 149 EJ by 2050. Importantly, both scenarios assume a convergence between the global North and the global South in the fair consumption of space. However, the DLE scenario considers a much lower use of space for all (Table 7.1).
Using other modes of trans-portation and slowing travel to rediscover trips’ enjoyment are among the sufficiency practices to reduce emissions from air travel, which are estimated at 1.6 tCO₂e/capita saved per roundtrip transat-lantic flight.

93
Section IIIPolicy Approaches For a Fair Consumption Space
Table 7.1. Sufficiency levels in 2050 for selected services in scenarios based on the sufficiency principles
Well-being dimension
Sufficiency level per service required Unit Low-energy demand scenario (LED)(Grubler et al. 2018)
Decent Living Energy (DLE) scenario(Millward-Hopkins et al. 2020)
Floor area per capita m²/cap 30 15
Housing energy demand in the use phase GJ/cap 1.2–5 0.6–1.1
Housing thermal comfort (Heating) kWh/m²/yr 21 10.4–12.9
Housing thermal comfort (cooling) kWh/m²/yr 21 10.4–14.1
Nutrition GJ/cap/yr NA 3.1–3.3
Mobility services passenger-km/cap 9,544–17,117 4,900–15,000
Models and scenarios play an incredibly important role in decision-making. Innovative modelling frame-works, such as the ones used for the LED and DLE sce-narios, show that different pathways to decarbonise the global economy are possible. By considering the plane-tary boundaries, they both allow for a convergence and a fair consumption of space and use of resources be-tween the global North and the Global South. The 1.5°C target requires an innovative modelling framework to break the existing silos inherited from the disciplinary specialism and the theoretical frameworks that have led to increasing emissions during the last three decades of intensive climate mitigation policies.

94
Section IIIPolicy Approaches For a Fair Consumption Space
8 – Has the Time Come for Carbon Rationing?
8.1. Rationing: a socially just response to the climate crisis
New policies that address calls for climate justice and concerns about equity are needed. One policy approach that could resonate with these calls is carbon rationing. Personal carbon rationing23 is a policy concept that aims to fairly reduce carbon emissions by targeting end-users and by focusing on the contribution of individuals’ choic-es to global emissions. Carbon rationing also recognises individuals as citizens with a moral responsibility to con-tribute to protecting current and future generations from the climate crisis. It is based on the premise that climate change is a threat to society and therefore mitigation is a shared societal responsibility that should engage all members of society in a way that reflects their impact. It is both collective and individual, promoting society-wide and individual change, and making explicit links between global environmental limits and personal actions.
Carbon rationing is relevant for two main reasons: first, existing policies and programs are insufficient for meeting carbon reduction targets, and second because it meets calls for socially just action on climate change.
8.2. Carbon rationing as an idea
Rationing is usually introduced to control access to a scarce resource. It serves the double purpose of pre-venting overexploitation of the resource and ensuring
23 Rationing individuals’ carbon is an idea which has been discussed under a variety of names and different scheme designs: personal carbon trading, rations, allowances, budgets, quotas, individual carbon allowances, tradable energy quotas. The most common policy names in the academic literature are ‘personal carbon allowances’, PCA, and ‘personal carbon trading’, PCT. Here we use the language of rationing when referring to the general concept and PCA or PCT when referring to a specific policy.
that everyone has access to meet basic needs. ‘Carbon rationing’ is shorthand for rationing the right to emit carbon emissions where the scarce resource is the limited cumulative global greenhouse gas emissions budget if catastrophic climate change is to be avoided. The resource in this case is somewhat abstract, scien-tifically defined, and politically negotiated, and uncon-nected to people’s everyday experiences. This makes it different from other rationing schemes in very impor-tant respects. However, the principles are the same, and there can be relevant lessons from historic and current rationing policies.
8.3. Contemporary and historical resource rationing
Rationing of individual access to services or resources is used in a variety of contemporary contexts, includ-ing road space rationing (Victoria Transport Public In-stitute n.d.) and water rationing (Enqvist and Ziervogel 2019). Rationing may be in response to a short-term emergency—either of shortage or unacceptable impacts of continued consumption—or as a longer-term policy. For example, ‘load shedding’ is a form of electricity ra-tioning when power is cut to parts of the electricity grid for a limited time to avoid wide scale blackouts. This is used regularly in developing countries with inade-quate electricity systems (Hashemi 2021), but also oc-casionally in industrialised countries, particularly in re-

95
Section IIIPolicy Approaches For a Fair Consumption Space
sponse to extreme weather events (e.g. in Texas in 2021 in response to winter storm damage to the network (IEA 2021). Thus, rationing is part of the toolbox available to today’s public policy makers but, for many it is more associated with experiences in the Second World War.
During the Second World War years (1939–1945), some degree of food control and rationing operated in almost every country in the world. The British food scheme, for example, rationed meat, cheese, fats, sug-ar, and preserves in fixed quantities per head. Addition-al schemes were superimposed on this common basis to meet particular needs, e.g. extra protein, vitamins, and minerals were provided to children of preschool age, and nursing and pregnant mothers (Burnett 1989).
Food rationing in the UK, coupled with subsidies and price controls, promoted greater social equality, and consumption became more equal in contrast with the intense inequalities that existed previously. Despite dif-ficulties, contemporary opinion polls showed that ra-tioning and food control were on the whole popular and discontent was eclipsed by general satisfaction (Zwein-iger-Bargielowska 2000).
Reflecting upon three years as UK Minister of Food during the Second World War, Lord Woolton believed that “the success of any rationing scheme depends, in the long run, on two things; the first is its justice and impartiality, and secondly—and perhaps the more im-portant factor—on the general public acceptance of the correctness of its purpose and the fairness of its ad-ministration.” The UK government took great pains to convince the public that rationing was necessary and temporary, explaining the economic case and invoking popular memory of the success of rationing during the previous war (Roodhouse 2017). The evidence is that the political and public acceptability of rationing policies is not determined solely by the policy design, its benefits and disbenefits, and its place within the broader policy landscape. It is also about how these are communicat-ed and understood.
Carbon rationing also recog-nises individuals as citizens with a moral responsibility to contribute to protecting cur-rent and future generations from the climate crisis.
TEXT BOX F: Carbon rationing in the UK
Early carbon rationing research was predominantly carried out in the UK, and it is also the UK where the idea came closest to adoption by the government in 2007/08. However, de-spite initial high-level interest by the Environment Minister, after further government-com-missioned research, it was declared to be an idea ‘ahead of its time’ (Defra 2008). Subse-quent support from parliamentary committees and other influential bodies did not receive government interest in the idea (Fawcett and Parag 2010). There are different perspectives on why this was the case. The commissioned research certainly showed serious challenges with turning this idea into a policy—with high costs and concern about public acceptability of the idea being key barriers. However, it is also notable that at that time there were only a handful of published academic articles on personal carbon trading; there was almost no evidence base from which to examine the ideas as a potential policy. SImilarly, there was no significant civil society knowledge of or support for the idea. Arguably this idea had its moment in the political spotlight too soon in its development.
A recent study analyses carbon rationing policies using the multiple streams approach, which defines criteria that a policy proposal must meet to become part of the political agenda (Bothner 2021). It concludes that personal carbon trading will only move out of the ‘policy primeval soup’ when many researchers, practitioners, and politicians support the idea. A bright idea is not enough.

96
Section IIIPolicy Approaches For a Fair Consumption Space
8.4. Policy design
Several different policy proposals based on the idea of rationing or personal carbon trading have been ex-plored. The policy design elements which attract most debate are the scheme boundaries, i.e. which economic sectors/activities are covered, how allowances are allo-cated (including whether an equal per capita allowance is fair), and whether trading in allowances is possible. Figure 8.1 illustrates key design decisions, which are combined to form a carbon rationing policy.
Other decisions not illustrated here include the mon-itoring and enforcement systems, obligations on various parties involved in the carbon system, what happens if the carbon price becomes unacceptably high—these is-sues are explored in Eyre (2010). Also important is the technology used to operate the policy (Fuso Nerini et al. 2021), lifetime of allowances and surrounding policies.
24 It is possible to have a carbon rationing system without personal carbon trading, or with limits to what can be traded. In this regard, one approach to a more socially just rationing system is having merit goods or base amounts of goods that cannot be traded. Given the potential for trading to prey on inequalities between the rich and the poor, perpetuated by unregulated markets, a mechanism for exchange would need to be carefully thought through for a successful carbon rationing approach.
Critically important too is the rate at which personal al-lowances reduce over time—whether by a fixed percent-age per year, fixed amount per year, or more slowly ini-tially and then ramping up.
The combination of choices underlined in Figure 8.1 relate to a mandatory scheme, at a national level, with equal per capita allowances for adults and partial allowances for children, which covers household ener-gy use and personal transport, and where allowances are tradable24. While many different combinations of scheme attributes can be chosen, we use this version of carbon rationing for illustration purposes, and call it personal carbon allowances (PCA). It is very similar to that proposed in the early literature on carbon ration-ing (Hillman and Fawcett 2004), and shares important characteristics with others proposed, trialled and stud-ied, particularly the focus on direct uses of energy, the inclusion of trading, and equal per capita allowances.
Figure 8.1. Key design elements of a carbon rationing policy, underlined choices are those combined in a Personal Carbon Allowances policy
Carbon rationing policy
TradingNo tradingCentral carbon marketPeer-to-peer trading
Geographical boundariesLocal / cityNationalEUInternational
Legal statusMandatory enrolmentVolantary participation
Allowance allocationEqual per capita for adultsTargeted additional allowances in addition to equal per capitaFull / partial / zero per capita for childrenAuctions for business emissions (full economy model)
Surrender mechanismsEvery purchase involving carbonPeriodically
System boundariesAll energy / carbon in the economyHousehold energyAll transportPersonal transportPrivate carsFlightsFoodConsumer goods & combination of these

97
Section IIIPolicy Approaches For a Fair Consumption Space
To explain briefly these key design choices:
Focus on direct energy use: In 2018, 93% of global anthropogenic carbon was emitted from use of fos-sil fuel energy. In the same year, 76% of all green-house gases25 was from fossil fuel energy (Climate-watch 2021). A significant share of emissions result from energy-use decisions made by individuals, such as electricity use, heating and cooling, as well as land and air travel choices. Most literature on personal car-bon rationing proposes schemes covering direct us-es of energy —either household energy and personal transport emissions, or just personal transport. It is considerably more difficult to create a system which includes embedded energy in terms of, for example, food, due to the difficulty of calculating accurate car-bon footprints for such products.
25 This includes carbon dioxide, methane, nitrous oxide and F-gases.
Trading: With trading, those with low carbon footprints would have spare carbon units to sell, and those with high emissions would need to buy additional units when their allowance runs out. The high-polluter pays while the low-polluter is rewarded. Trading provides an economic incentive to reduce personal emissions, but, more importantly, it provides a mechanism for people to adjust to the impact of a fixed and reducing allowance (for more details see Text box G).
Equal per capita allowances: Simply, this is a demon-strably fair starting point for distributing access to this scarce resource, and a simple policy design. There are of course many arguments in principle and practice about definitions of fairness and the impact of policy designs on different groups (Starkey 2012). See Text box H for a discussion of winners and losers.
TEXT BOX G: Why trading?
The available evidence shows that carbon emissions from household energy plus transport energy vary hugely between individuals (by a factor of 12 in a small sample of 32 UK indi-viduals (Fawcett 2005). Emissions depend on lifestyle choices, but also on geographical location, housing type and available heating fuels, amongst other parameters. The large variation in individual emissions is a key reason for the inclusion of trading.
If a rationing scheme had equal annual allowances and no trading either:
(a) approximately 40% of the population (with above average emissions) would have their energy use significantly restricted, immediately, to fit within their personal allowance
or
(b) the personal allowance would have to be set so high—to ensure most people could get the energy services they are accustomed to—that no significant savings would be made.
Trading is a mechanism to ensure both that the cap can be set at a level which delivers collective carbon savings and that people who cannot manage with their ration can pur-chase extra units. It also rewards those with a low carbon footprint, as they can earn mon-ey from selling spare allowances.
Trading is controversial, and there are many objections to it from both principled and practical standpoints.

98
Section IIIPolicy Approaches For a Fair Consumption Space
These design choices can all be debated—and other researchers have proposed different policy designs. For example:
→ In the UK, electronic Tradable Energy Quotas (TEQs) were proposed, covering the whole economy and divided among individuals (40%) and other energy users (60%) (Fleming 2006);
→ In Ireland, Cap and Share (C&S) certificates covering the whole economy were proposed giving all adults emission certificates for an equal share of national emissions. Such certificates would be sold by individuals via banks and post offices to fossil fuel companies (Feasta 2008);
→ In California, household carbon trading was proposed for household energy, managed by the utilities (Niemeier et al. 2008).
TEXT BOX H: Winners and losers
Carbon rationing would create ‘winners’ and ‘losers’—those with emissions higher than the ration amount would be losers, and those with lower emissions would be winners. People with low emissions could sell their spare ration on the carbon market. As people adjusted their consumption patterns in response to the ration, the distribution of winners and los-ers would change.
Vulnerable losers—those on lower incomes, facing significant extra costs under ration-ing, and without the capability to reduce their emissions—are of particular policy concern.
In parallel to carbon rationing, there would likely be additional support policies for vul-nerable groups, to help them invest in/access lower carbon technologies or energy ser-vices. There could also be additional rations given to groups of concern—e.g. low income households living in rural areas, dependent on travelling long distances by car. However, raising the ration for some means that it is reduced for everyone else. It also effectively subsidises high carbon living, and should be a transitional measure for most groups, being phased out as low carbon options become more universally available.

99
Section IIIPolicy Approaches For a Fair Consumption Space
8.5. Mechanisms of change
Rationing carbon is envisaged to influence individuals’ carbon emitting behaviour through three interlinked and synergetic mechanisms: economic, cognitive, and normative (Parag et al. 2011). Figure 8.2 summarises the influence mechanisms.
Economic mechanism: the carbon price on personal emissions is likely to encourage people to prefer low over high carbon activities and goods, as the low car-bon options will cost less. In addition, the introduction of a new virtual “carbon currency” and the shortage of carbon units created by the shrinking cap is likely to encourage mental carbon accounting and to promote economical use of carbon.
Cognitive mechanism: a PCA scheme is likely to engen-der new carbon and climate discussions and conversa-tions in society, which in turn will increase carbon vis-ibility and enhance individuals’ awareness of their own impact on the climate. The cognitive process of linking actions and behavioural choices to consequences on cli-mate is likely to encourage people to rethink high car-bon emitting activities and prefer lower ones. Normative mechanism: the underlying PCA premises of environmental limits, emissions fair shares, societal climate responsibility, and social solidarity are likely to create new social norms of what is socially acceptable behaviour and what is not. Because people tend to com-ply with prevailing social norms, it is envisaged that PCA will foster widespread low carbon lifestyles.
Figure 8.2. How PCA mechanisms could influence energy-use decisions and lead to low carbon choices
Carbon emitting
behaviour
Cognitive Perception of Carbon
Carb
on vi
sibilit
y
Carb
on aw
aren
ess
Men
tal c
arbo
n acc
ount
ing
Price
of ca
rbon
Earth limits
Future generations
Societal effort
Fair share
Solidarity
Capped marketImpact & cost of climate
change
Economic Behaviour
SocialNorms

100
Section IIIPolicy Approaches For a Fair Consumption Space
8.5.1. TrialsPersonal carbon rationing has not been introduced an-ywhere on a mandatory basis. However, voluntary per-sonal carbon rations, allowances, or budgets have been tested at various scales: locally through small ‘carbon rationing action groups’ (Howell 2012); in businesses, for employees (WSP 2021); across Norfolk Island, Aus-tralia in a health improvement and carbon reduction trial (Webb et al. 2014); and for transport at city-level in Finland (Kuokkanen et al. 2020).
The most recent trial is a personal carbon trading pilot in urban mobility in the city of Lahti, Finland. The aim is to incentivise citizens to reduce their mo-bility-related emissions through the means of a digi-tal personal carbon trading (PCT) platform and mobile application. In addition, the aim is to improve citizens’ carbon emission literacy and introduce a personal car-bon trading approach to the wider public (Kuokkanen et al. 2020).
An earlier trial, the Norfolk Island Carbon/Health Evaluation Study (NICHE), occurred on Norfolk Island, 1,500 km off the coast of Australia from 2011. Hundreds of residents participated and there was an electronic carbon accounting system, feedback on carbon emis-sions, and rewards for participation. The research aims were to test attitudes to an incentive scheme for sav-ing energy and reducing carbon footprints and to test the hypothesis that increasing people’s environmen-tal consciousness will have a positive impact on their health through better health behaviours (i.e., more exer-cise and healthy diet) (Webb et al. 2014; Webb and Egger 2014). Research on engagement with the Personal Car-bon Monitoring System (PCMS) on Norfolk Island found significant pro-environmental changes in attitudes and behaviours towards the environment, carbon emis-sions, and climate change following the trial. Post-trial surveys also showed respondents believed most peo-ple would accept PCMS as a tool to improve the envi-ronment (Hendry 2019). Post-trial, there was an aver-age 18% reduction in total household carbon emissions, from vehicle fuels (25% reduction) and electricity usage (12%). However, there was no reduction in body weight, one of the other hypothesised benefits of the interven-tion (Webb 2018).
8.5.2. Distributional effectsThe distributional effects of carbon rationing depend on the design of the policy, the current distribution of per-sonal carbon emissions, and the capacity of individu-als and groups to respond to rationing and reduce their emissions. There is growing literature on how emis-sions vary by income and geography (e.g. Hargreaves et al. (2013); Kartha et al. (2020)). All the evidence sug-gests that carbon emissions go up with income, particu-larly transport emissions, and so lower income people
will be ‘winners’ and higher income people ‘losers’ un-der a PCA policy design, on average.
Detailed distributional modelling of the effect of a PCA in 2006 in the UK showed that despite the overall progressiveness of an equal per adult carbon allowance allocation system, a significant number of low-income households would be made worse off by PCT (30% of households in the lowest three income deciles). However, compensatory mechanisms—targeted additional allow-ances and financial compensation—if combined could significantly reduce the number of low-income losers by about half (White and Thumim 2009). Debate about different scheme designs to make rationing more just continues (Burgess and Whitehead 2020)—but there are few if any significant recent modelling studies—meaning that detailed questions about the distributional effects of rationing cannot be answered with confidence.
8.5.3. Public and political supportFrom the start, there has been concern about wheth-er carbon rationing would be publicly and politically acceptable. It runs contrary to the conventional wis-dom about the extent to which governments can and should challenge personal consumption. When it was discussed in the UK in the late 2000s, PCA was perceived by policymakers as a political risk (Bird and Lockwood 2009). There are clear political risks in advocating any challenging or radical policies, particularly if they have never been implemented elsewhere and there is no pre-vious policy experience to learn from. In fact, the em-pirical finding that most people in the UK had negative feelings towards PCT (Owen et al. 2008) helped put an end to political interest in the topic.
The evidence on public views towards PCT to date is mixed. In various empirical studies, the share of people who feel positively about PCT ranges between 25% and 77% (Guo et al. 2021; Bristow et al. 2010). This variation may in part be attributed to differences between more and less recent research, geographical, or methodolog-ical differences (Bothner 2021). Public acceptability has been examined with methods as diverse as surveys and questionnaires, focus groups, (semi-)structured inter-views, and choice experiments based on participants’ actual carbon footprints. On top of that, PCT is some-times assessed on its own or compared with other car-bon pricing mechanisms, such as a carbon tax or road pricing schemes. When confronted with alternatives, people tend to prefer PCT over these alternatives (Faw-cett 2010). Public acceptance is generally higher when people think PCT is effective in reducing emissions, raises awareness for their individual carbon footprint, and when the scheme is perceived to be fair. The latter point often refers to the allocation of extra allowances to households with children, to individuals in the coun-tryside with little access to public transportation, or to

101
Section IIIPolicy Approaches For a Fair Consumption Space
low-income households (Bristow et al. 2010). Moreover, acceptance is often linked with a higher level of edu-cation and environmental attitudes (Wadud and Chin-takayala 2019; Stam and Gerdes 2021).
For those who reject PCT, concerns about implemen-tation difficulties are key (von Knobelsdorff 2008). In ad-dition, acceptability tends to be lower with lower under-standing of the mechanism (Wallace et al. 2010). Maybe unsurprisingly, people who fly often, live in large hous-es, or generally have a high carbon footprint are less in favour of PCT than others (Larsson et al. 2020).
The overall message from this research is that the answer to the question of what the public thinks de-pends on the details of the rationing scheme, how it is explained, what it is compared with and which public is consulted.
Using deliberative processes to design and debate scheme rules could be a powerful way to build and en-sure public acceptance. In Lahti, Finland in a trial of per-sonal transport allowances, allowance allocation was determined with citizen engagement through surveys and workshops (Kuokkanen et al. 2020).
8.6. Comparison with a carbon tax
Key alternative approaches to personal rations are ‘up-stream’ trading and carbon taxation. Upstream trading
is where tradeable carbon caps are set high up the fos-sil fuel delivery chain, such as at the fossil fuel produc-ers, energy utilities, or the energy retailer level. Car-bon taxation could be implemented on fuels/energy sources at retail level, or higher up the delivery chain and then be passed down to household (or both). Eco-nomic evaluations from more than one decade ago in-dicated that introducing a personal carbon rationing mechanism would cost more and be more complex to implement than either upstream cap and trade or car-bon taxation (Lockwood 2010; Sorrell 2010). However, in the last decade the huge advancements in data man-agement capabilities and the penetration and availabil-ity of smartphones have dramatically reduced many of the implementation and management costs (Fuso Ner-ini et al. 2021).
Key comparisons between carbon rationing with taxation are set out very briefly (Table 8.1). Clearly there are pros and cons for each policy idea. For ex-ample, a carbon tax fits well with existing policy and economic paradigms that treat actors in society—com-panies and individuals alike—as economic entities. It encourages desirable behaviours by putting a price tag on undesirable ones, and encapsulates the pollut-er pays principle. Whereas PCA aims to influence be-haviour also by altering individuals’ perception of so-cial responsibility and by encouraging citizens to adopt low carbon lifestyles.
Table 8.1. Comparison between a PCA scheme and a carbon tax
Personal Carbon Allowance Carbon Tax
Coverage Depending on the design, could cover all direct and indirect personal emissions
Depending on the design, could cover all direct and indirect personal emissions
Influence mechanisms Economic, cognitive, normative Mainly economic
Allocation rule Equal per capita No allocation
Carbon visibility Increases carbon visibility and encourages carbon budgeting
Increases carbon visibility
Price of carbon Determined by shortage of units Pre-set by government
Trading Carbon units can be traded in the personal carbon market
No carbon market or carbon trading
Vulnerable groups Additional policies needed to support vulnerable groups
Tax revenues could be recycled to support specific vulnerable groups
Social norm Induces new carbon allowance social norm Does not induce social norm
Public support Unknown, likely to be influenced by communication and framing
Public tend to oppose new taxation
Policy certainty Cap on emissions increases the certainty of achieving the policy targets
No carbon cap, and lower certainty of meeting policy targets
Administrative cost Higher than taxation, as new administration and market structure need to be created
Lower than PCA, as the administration structure already exists
Policy risk Risky, as there is no policy experience Less risky, as taxation is familiar policy mechanism

102
Section IIIPolicy Approaches For a Fair Consumption Space
Readers will make their own judgement on which arguments are most compelling. However, when think-ing about carbon rationing or any new policy propos-als, it is important not to fall into the trap of ‘policy perfectionism.’26 All policies have downsides as well as upsides. They must be judged on a variety of criteria, and considered in light of the status quo, which itself is far from perfect.
8.7. Next steps
Carbon rationing is an important idea, which has the po-tential to be developed into a powerful policy tool. There is some research and evidence showing how it could be implemented in practice and what the effects would be, but also much which is unknown. More research is needed—but, importantly, so are thoughtful conversa-tions among politicians and with the public—not least to direct research to key issues of concern. Political and public engagement with and support for the idea is es-sential for it to be introduced (Fawcett and Parag 2010).
26 ‘Policy perfectionism’ has been identified as one type of ‘discourses of climate delay’—discourses that admit the existence of climate change, but justify inaction or inadequate efforts (Lamb et al. 2020).
Further public and political discussions about ra-tioning can begin immediately. Citizens assemblies have been shown to be a good venue for thoughtful re-sponses from citizens to policies needed to address the climate crisis (Mellier and Wilson 2020). Local and national assemblies focused on debating the value anddesign of carbon rationing policies would be ex-tremely valuable.
There is a significant research agenda to take ra-tioning from a promising idea to a policy design with enough supporting data for an evidence-based de-cision to be made on its adoption. Because the de-tailed design of rationing determines its effects, this research needs to be nationally-specific, to take ac-count of national priorities, the current distribution of carbon emissions and opportunities to reduce per-sonal emissions, and the surrounding policy environ-ment. Future research will need to include field trials of elements of carbon rationing including technology, communication and effects on behaviours and deci-sion-making, and modelling of the impacts of differ-ent policy designs.

103
Section IIIPolicy Approaches For a Fair Consumption Space
9 – International Carbon Allowances in Achieving a Fair Consumption Space
9.1. Taxing or rationing
The distribution of scarce resources (and the right to emit is seriously limited) can in principle be handled in two different ways: through market-based mecha-nisms or with physical caps. Market-based options use taxes to increase efficiency to decouple economic activ-ity from pollution—as in the green growth model. How-ever, effective and efficient protection of global public goods requires collective political action to overcome the inability of private agents to capture any benefits, and hence the failure of market mechanisms (Nordhaus 2015). Furthermore, a plethora of studies have shown that a permanent decoupling sufficient to address the climate crisis has not occurred anywhere, and is unlike-ly to do so in the future (e.g. (Haberl et al. 2020; Pihl et al. 2021; Vadén et al. 2021).
Hence, only the option with physical caps seems to have the potential to be effective. This means to quanti-tatively limit the total emissions through legal, econom-ic, and administrative means, regardless of to what ex-tent this is compensated by efficiency improvements. Given the social insensitivity of markets (Wilkinson and Pickett 2011) and the increasing intra- and internation-al polarisation of wealth (Piketty 2014), it is rather ob-vious that the social justice objective highlighted in the SDGs requires making this option operational (Ganzle-ben and Kazmierczak 2020; Xu et al. 2020).
This is where international carbon rationing comes in. Global carbon sinks are overwhelmingly public goods, which lack adequate legal protection. In par-ticular, a fair allocation of the environmental space is nothing individuals or free markets can achieve—the required collective action must be initiated and coor-dinated by authorities (Martínez-Alier 2002; Bromley 2007). Hence a broader approach, with governments
taking the lead, is needed to complement individual efforts.
Rationing is admittedly a controversial measure (of-ten strongly opposed by those advocating market solu-tions and betting on efficiency gains), but can be ef-fective also in the short run and is urgently needed to mitigate disaster and minimise global catastrophes—it is already too late to completely avoid large-scale dis-asters (Alcott 2010). The result would be a significant reduction in carbon-intensive consumption in affluent nations or trade blocs like the EU, where two-thirds of the global consumer class reside. Resistance by those benefiting from the status quo is to be expected, as one key result would be ending their current privileg-es (which they have enjoyed since the colonial era and have come to consider an entitlement) (Brand and Wis-sen 2017). However, ending overconsumption, that is consumption exceeding the planetary boundaries, is exactly what the climate, and sustainable development more generally, need right now.
9.2. Institutions for international rationing
This leads us to the question of how to distribute the scarce sink capacities of the planet. The climate sys-tem—like the atmosphere, space, or the deep sea—does not belong to anybody but can be considered the com-mon heritage of humankind. And as according to the Universal Declaration of Human Rights all humans are born equal, they are entitled to an equitable share of this heritage. Consequently, fair sharing requires that the re-maining carbon budget should be distributed amongst countries according to their population, based for exam-ple on the population projections for 2050 as the climate target year as these are the people, current and future,

104
Section IIIPolicy Approaches For a Fair Consumption Space
who will bear the burden of the climate crisis (Agarwal and Narain 1991). In a globalised, trade-intensive world, allowances must cover the carbon embedded in traded goods, leading to a carbon balance composed of domes-tic emissions and the net emissions embodied in trade to be accounted for, as using the quota allocated in the carbon sink rationing. The EU tradable permit system for CO₂ emissions, combined with the planned Carbon Border Adjustment Mechanism, already offer important building blocks for a carbon rationing regime.
Once the distribution of entitlements is allocated to countries on this basis, the next step is enforcing the resulting limitations on a national level. Staying with-in allocated limits cannot be left to individuals as even with willing citizens, many of the underlying factors that shape consumption patterns, such as public ser-vices and infrastructure investments, can only be ad-dressed by governments.
However, any such move towards allocation of sink entitlements needs to be administered international-ly. Individual countries or trading blocs can take initi-atives, as they have done in the past. For instance, the EU Green Deal policy of combining more ambitious cli-mate targets with a new Carbon Border Adjustment Mechanism has in essence established a Climate Club for its members. In such clubs, member states weigh the membership benefit against the decarbonisation ef-forts (and in the EU, the subsidies coming with them), and the otherwise more reluctant members go with the group (Nordhaus 2015).
Nonetheless, a full-scale global system for emission allowances would require a legal base in an internation-al convention. It will take considerable time to negotiate and adopt a new convention and to make an internation-al authority for carbon allocation operational.
9.3. International rationing and the global trade regime
Reducing consumption of carbon-intensive goods has knock-on effects as transporting, refining, transform-ing, delivering, and discarding materials are activities that consume a significant share of the total primary energy. In particular, the rare earth elements which re-quire extremely high inputs of energy per ton of ma-terial in mining and refining would be permanently limited, with severe implications for the Green Growth strategies pursued by any governments, but also for decarbonisation and climate policy. According to the International Energy Agency, “today, the data shows a looming mismatch between the world’s strengthened climate ambitions and the availability of critical miner-als that are essential to realising those ambitions. [… For instance, a] typical electric car requires six times the
mineral inputs of a conventional car, and an onshore wind plant requires nine times more mineral resourc-es than a similarly sized gas-fired power plant.” (IEA 2021).
Reducing energy consumption on a global scale, in-stead of only accelerating the switch from fossil to an ev-er increasing consumption of ‘non-renewable-resourc-es-based-renewable-energy’ appears an important condition to make decarbonisation sustainable; ration-ing the consumption of resources beyond carbon sink access is an option still not sufficiently explored, but undoubtedly necessary, not least to guarantee the con-tinued provision of carbon-free energy without break-ing through the walls of environmental space and con-sumption corridors.
Legally an import-limiting regime, for the time being regulating trade based on the embedded carbon con-tent, would probably be possible under the WTO regu-lations, as long as the standards set are non-discrimi-natory. However, the arbitration processes foreseen in most free trade agreements offer companies (foreign, or domestic through foreign subsidiaries) the opportunity to demand compensation for loss of expected revenues, caused by being hindered to continue polluting but lu-crative activities (Kumm 2015; Marisi 2020). An interna-tional Convention would minimise this risk.
The ethical principle of the right to equitable shares of global carbon sinks has been the starting point of this argumentation. However, obviously the current situa-tion is different, in and between nations. Hence an eq-uitable allocation of rights will cause surplus entitle-ments for some, and shortcomings for other nations or blocs. Applying trade mechanisms established since the Kyoto Protocol and the Clean Development Mecha-nism (CDM) to these emission rights is a matter of polit-ical will, not of technical or legal difficulties. Countries with the highest per capita emissions, like some Gulf monarchies and other oil producing countries—Canada, Australia, the USA, Korea, Taiwan, the EU and even Chi-na—would have to try buying certificates from poorer countries (OECD n.d.). A Carbon Allocation Authority or trading platform could help here as well, as in bilateral negotiations the poor tend to sell cheap, not least due to arms twisting by powerful nations, and the risk for cor-ruption where leaders agree to bad deals for private gain could be minimised. The current South-North mone-tary flows would be reverted, and the finances for strong sustainable development could be in sight at least. Si-multaneously, such a regime would provide incentives for poorer countries not to pursue the usual emission intensive development path, as this would diminish the permit income. Open access to renewable energy and energy efficiency technology should be one element of what a carbon managing authority would have to offer to its clients.

105
Section IIIPolicy Approaches For a Fair Consumption Space
9.4. Near term perspectives
International rationing—while strongly influencing prices through market mechanisms—does not gener-ate revenue for the state or bloc introducing it, but bor-der payments do so. The Carbon Border Adjustment Mechanism suggested by the European Commission will be charging imported goods according to the CO₂ emitted during their production, resulting in income for the public purse. The revenues will be partly needed to compensate exporters, but due to its negative trade bal-ance in terms of embodied resources, a significant sur-plus income for the EU can be expected (Bruckner et al. 2012; Dorninger et al. 2021). Since the market stabilisa-tion effect is reached by skimming off the price advan-tage resulting from less ambitious climate targets, the money is disposable, following politically set priorities. As long as the suggested, rationing-based permission trading system does not exist, the Border adjustment in-come is the most plausible stand-in for financing adjust-ment processes in countries affected by the new regime.
In particular, voices from the South have been crit-icising the planned Carbon Border Adjustment Mech-anism as discriminatory to their exports, and indeed exporters with the lowest carbon productivity will be hit hardest—but that is a stimulus which is part of the overall approach (UNCTAD United Nations Conference on Trade and Development 2021). Hence the question should not be one of exemptions, weakening the perfor-mance of the incentives offered by the club, but how to support the transition to a low carbon production sys-tem in the Global South.
To answer this question, three groups of Southern ex-porters to the EU have to be distinguished:
→ For all agricultural goods, lowering carbon intensity can be achieved by employing agroecology measures, reducing fertiliser and pesticide use, and improving crop composition. As an important co-benefit, such a move would significantly reduce the pressures driving the loss of biodiversity (IPBES 2019) while creating jobs and improving the quality of water streams above and below ground. This way, a Carbon Border Adjustment would contribute to a series of SDGs simultaneously.
→ For those companies, which moved to the South to avoid increasingly strict regulations (compliance and hence pollution is much cheaper in many parts
27 Many of the strategies presented in this policy section could support each other in implementation. For example, revenue created by a border mechanism could also help fund universal basic services (UBS), reducing private consumption further as well as countering the effects of increasing costs of imported consumer goods.
of the South) while exporting their products for in stance to Europe, it just means that the standards they tried to undercut will catch up with them. This would upend the abuse of the South as low-cost pollution location and production waste dump (Statista 2021a). This is not insignificant, as more than a third of the EU emission reductions has been achieved through relocation (Schütz et al. 2003), and with tightening rules more is to be expected without a Carbon Border Adjustment Mechanism.
→ For small farmers trading through cooperatives, for small and medium size enterprises (SMEs) and other local businesses, support is necessary. Here the surplus income from the Carbon Border Adjustment Mechanism comes in handily—instead of using it as a windfall profit for the EU budget, a portion27 should be spent on a Climate Adaptation Fund for production systems, in particular small holders and SMEs, helping them to keep step with the emerging EU legislation. Financing cooperation—including but not limited to technology transfer—would be an adequate and legitimising way of spending the funds.
9.5. Not letting the best become the enemy of the good
The jury is still out on what might be the best “how” to implement enforceable measures to make 1.5°C life-styles, in all their diversity, the ‘new normal’ of the fu-ture citizen-consumer society. However, all pros and cons of different pathways must not distract from the need for rapid action to drive down emissions. The state of the natural world and the ongoing trends make quantitative limitations of resource consumption and carbon emissions an undeniable necessity, requiring a radical change of existing policies. The term “radi-cal” is derived from the Latin “radix”, meaning “root”. Rationing is a rational approach to address the root causes of overconsumption, and turning the proposal into policy is one of the best instruments to address the climate crisis before it turns into a catastrophe.

Section IVScenarios for Living Within a Fair Consumption Space
Section IV Scenarios for Living Within a Fair Consumption Space
106

107
Section IVScenarios for Living Within a Fair Consumption Space
10 – Need for Both Individual and System Change
T his chapter elaborates selected low-carbon lifestyle options (introduced in Chapter 4) into carbon budget scenarios to meet tar-gets at a country level (see Chapter 2). The carbon budget scenario brings together
and illustrates the several elements of this report: the current level of average lifestyle carbon footprint, adop-tion rates for previously introduced options to meet the 2.5-ton target, differences and potentials of individual choices, but also the major role of policy making and recommendations to achieve the sustainable lifestyle carbon footprint target set for 2030.
As the remaining carbon budget is divided evenly be-tween the inhabitants of different countries, developing carbon budget scenarios offers a tool to illustrate the fair consumption space. It demonstrates a combination of both the type and magnitude of actions that could be taken to bring lifestyle carbon footprints within plane-tary limits. Because allocation of the available carbon budget should be done in a fair manner, it highlights the duty of countries with currently higher average life-style carbon footprints to bear greater responsibility for pursuing a smaller average lifestyle footprint and get-ting the world to within sustainable limits. In addition to country level responsibility, carbon budget scenarios stress the importance of enabling change at both individual behaviour and systems levels. Finally, scenarios are not on-ly about reductions; getting to, and thriving within a fair consumption space requires innovation for new ways of meeting needs in society and regeneration of existing measures to be compatible with wellbeing in a fair and equitable society within planetary limits.
The carbon budget scenarios—consumption-fo-cused and system-focused scenarios—are based on the aggregated impacts of lifestyle options. Evaluating aggregated impacts is necessary because sums of esti-
mated reduction impacts of individual options may not equal aggregated impacts due to overlaps and syner-gies between options. It is worth mentioning that many lifestyle options, as well as environmental initiatives in general, do not fall purely in one of the two categories (consumption-focused or system-focused), but repre-sent both the amount and intensity aspect, along with other dimensions entirely. For example, car-free com-muting with public transportation falls into both catego-ries, as modal shift from car to public transportation is often an individual’s choice, but it also requires system-ic changes in infrastructure to enable large scale adop-tion at a societal level; the efficiency improvement of household appliances is often a manufacturer’s choice, but a household can choose to use more efficient ap-pliances, reducing its energy consumption. Illustrating two scenarios per country allows for a comparison of the impacts and effectiveness of individual choices and systemic changes. Nevertheless, as it is not realistic to assume that the consumption-focused scenarios would be enabled without systemic changes, intensity type op-tions were included in the consumption-focused sce-narios and amount type options into system-focused scenarios (with bolded interventions corresponding to their appropriate category).
Note that estimation of aggregated impacts does not consider rebound effects. Therefore, this estimation should be considered as slightly optimistic, as some of the gains from the options could be lost through re-spending of money and time. In addition, aggregated impacts of previously introduced options consider on-ly food, housing, and personal transport. For consum-er goods, the impacts of leisure and services are based solely on absolute reduction of consumption (average spending) and/or efficiency improvement (average car-bon intensity), thus the footprints are decreasing pro-

108
Section IVScenarios for Living Within a Fair Consumption Space
portionally more compared to the three main domains (food, housing, and transport).
Scenarios here focus on the 2.5 tonCO₂e/capita/year target set for 2030. The year 2030 is mainly illustrative; a similar exercise could have been done for 2050—al-beit with the higher risks that further delays in rapid reductions of carbon would pose considerably more challenges than already being experienced. The 2030 target is one of the easiest intermediary targets, and one that must be met if the climate emergency is to be addressed. Also, comparatively more realistic assump-tions can be made of potential changes in society in the timeframe between now and 2030—making the scenar-ios more feasible.
Country specific scenarios, using adoption rates for selected aggregated options to meet the 2.5 ton-target set for 2030, are introduced in the Figures 6.1–6.9. See Annex D for more detailed descriptions of the scenarios.
10.1. Carbon budget scenarios
Both consumption-focused and system-focused scenar-ios show very ambitious adoption rates across all con-sumption domains for high-income countries to meet the 1.5-degree target, as seen in Figures 6.1–6.4. This highlights the urgency of drastic lifestyle carbon foot-print reductions in high-income countries, as the need-ed footprint reductions of 69–82% require an almost full (at least 95%) adoption rate in all countries. Canada was an exception, as it is not able to meet the 2.5-ton target with any adoption rate and has 99% for both intensity
and amount type options. Upper- and lower-middle in-come countries also need lifestyle carbon footprint re-ductions of 23–50% by 2030, although scenarios allow more freedom in terms of chosen actions and adoption rates, as well as the ability to focus on country-specific hotspots. In addition, a system-focused scenario turned out to be a more efficient way to meet the 1.5-degree tar-get by 2030, as the adoption rate of intensity type op-tions is notably lower for most of the countries in com-parison to the consumption-focused scenario. This indicates high lock-in of e.g. energy related consumer choices, as many of the middle-income countries are still heavily relying on non-renewable energy sources in their energy generation. Indonesia is an exception as its current lifestyle footprint is already less than 2.5 tons CO₂e/capita/year.
As shown in the estimated carbon budget scenari-os, the options listed in this report can satisfy this long-term target for most of the countries, but additional options including non-incremental changes in provi-sioning systems and lifestyles would be required. These results highlight the large potential lifestyle changes re-quired across consumption domains in order to imple-ment the Paris Agreement, and also imply it is not an either-or question of technology or lifestyles but rath-er both—improvements to the energy system and tech-nology as well as shifts in consumption patterns are re-quired to achieve the ambitious climate targets.
Note: scenarios for Indonesia are not discussed be-low due to the analysed target year being 2030 and the current per-capita footprints already being within the global target level.

109
Section IVScenarios for Living Within a Fair Consumption Space
Canada – The current target of 2.5-tons is not met with any adoption rate of options analysed for this report, even if it has 99% adoption for both intensity and amount type options, thus in practice leading to a single scenario. As well as having an urgent need for society-wide chang-es in consumption habits, countries with similar levels of consumption to Canada will need massive interventions in investments (including divestments) and significant political actions to reorient government planning to sup-port households to meet their needs within comparable material levels to the rest of the world.
The largest reduction is focused on the transport do-main, as the transport domain is one of the hot spots in Canada with high annual transport demand. Person-al transport demand would need to decrease at least a third (31%: 6,900 km) from the current level and achieve the current intensity of an average electric car in Cana-da. Transport serves as a means to conduct meaningful daily activities such as work and study related commit-ments, social and leisure activities, shopping and oth-er errands. Thus, the discussion on personal transport is not only about vehicles and fuels but on new ways to conduct these daily activities with fewer kilometers travelled.
Changes in the diet (e.g. vegan diet) and system-fo-cused changes (e.g. more efficient food production) would lead to a dietary footprint of 400 kg (CO₂e/per-son/yr) or an 82% (1,900 kgCO₂e) reduction from the current level.
The overall housing footprint would need to de-crease more than half, resulting in a footprint of 1,300 kg. The living space per person would need to drop from the current 58m² to at most 32m², and the energy con-sumption would need to drop 30% (3,400 kWh), result-ing in an intensity of 0.16 kg/kWh, which would be close to the average carbon intensity of current hydropow-er-based electricity production.
For others (consumed goods, leisure, and services), both the intensity and the per-capita consumer spend-ing would need to drop drastically.
Finland – Both scenarios require large scale improve-ments in consumption habits and systemic changes, as both the amount and intensity type options would need a 95% implementation. The lower adoption rate for supporting options28 in the consumption-focused scenario highlights the effectiveness of amount based options and the role of individual choices to reach the 2030 target. Nevertheless, supporting options in both scenarios is still critical.
28 Intensity type options were included in the consumption-focused scenarios and amount type options in the system-focused scenarios.
Similar to Canada, the largest reduction is focused on the transport domain in both scenarios, due to high annual transport demand. Transport demand would need to be halved (54%, or 8,100 km reduction), or the average carbon intensity should reach the current lev-el of electric cars in Finland in the consumption- and system-focused scenarios, respectively. The average intensity is lower in the consumption-focused scenar-io, as high intensity flying reaches a nearly 100% re-duction.
The housing-related footprint would need to drop dramatically in both consumption- and system-focused scenarios (62% and 76%, respectively), leading to at least a 34% (14 m²) reduction in living space and a min-imum 41% (4,620 kWh) reduction in total energy con-sumption in the consumption-focused scenario. The av-erage carbon intensity per kWh would need to reach the current level of an air heat pump (approximately 0.07 kg/kWh) in Finland in the system-focused scenario, to-gether with the efficiency improvement of buildings and more efficient use of space (e.g renting a guest room, or using these as co-working spaces in residential areas to reduce need for additional office buildings).
Food-related footprints would decrease more effec-tively in the system-focused scenario, due to shifts to-wards low-carbon dietary habits, i.e. lower intensity of consumed food products. In addition, system-focused scenarios have higher adoption of supporting (non-in-tensity type) options compared to consumption-fo-cused scenarios. (System-focused changes tend to be shifts towards plant-focus food production, which re-duces the intensity of the food without total food con-sumption reductions by consumers.)
Similarly to Canada, both per-capita consumer spending and the carbon-intensity of products and ser-vices would need to drop considerably. System-focused scenarios indicate being more effective in footprint re-duction due to higher improvement of carbon intensity of products and services, together with lower consum-er spending.
United Kingdom – Similar to Finland, large-scale imple-mentation is needed for both scenarios in order to meet the 1.5-degree target. Adoption rates for supporting op-tions is lower compared to the previous countries as the overall lifestyle carbon footprint reduction requirement is lower.
As for the previous countries, the largest reductions are focused on transport, but also on the housing do-main. In the consumption-focused scenario, transport

110
Section IVScenarios for Living Within a Fair Consumption Space
demand would need to be reduced by 55% from the cur-rent level (8,200 km reduction) and in the system-fo-cused scenario the reduction would need to be only 30% (4,300 km). In the system-focused scenario, the average carbon intensity should reach the current level of elec-tric cars in the United Kingdom.
For housing, the living space and overall energy consumption would need to decrease from the current 39 m² to a maximum of 25 m² (37% smaller) and from the current 7,200 kWh to 5,200 kWh (a 28% decrease).
For food, intensity would need to drop at least 30%, which is achieved by heavy adoption of consumption-fo-cused scenarios (95% adoption of amount type options and 30% adoption of intensity type options). The overall food consumption decreases approximately only 10% as most of the options focus on modal shifts of dietary habits, such as switching to a vegan diet.
Consumer goods, leisure, and services follow the same pattern as for Canada and Finland.
Japan – Typical to all high-income countries, Japan al-so needs large scale implementation for both scenar-ios. The adoption rate for supporting options is low-er in the system-focused scenario (compared to the consumption-focused scenario), which indicates the effectiveness of intensity type options on decreasing the lifestyle carbon footprint, though the reduction impacts are focused on different domains in different scenarios.
In the consumption-based scenario, the highest re-duction is focused on transport, which indicates large hot spots in the transport domain but also the role of consumer choices in reducing the transport related footprint. Mobility demand could drop 66% (7,200 km) in the consumption-focused scenario. As a contrast, transport demand would need to drop only 12% (1,300 km) if the average intensity of 0.09 kgCO₂e/km could be achieved, as shown in the system based scenario.
Housing related consumer choices, i.e. consump-tion-focused options, would reduce current living space 39% (15m²) to 24m² and overall energy consumption by 22% (940 kWh). Similar to transport, fewer reduc-ing actions would be needed if the average energy in-tensity of 0.18 kgCO₂e/kWh could be achieved with the system-focused scenario. In addition, system-focused scenarios account for a greater reduction in the hous-ing domain due to the shift towards renewable energy sources, which addresses a hot spot in the housing-re-lated footprint in Japan.
Similarly to Canada, both per-capita consumer spending and intensity of products and services would need to drop notably. The system-focused scenario is more effective in footprint reduction due to higher im-provement of carbon intensity of products and servic-es, together with lower per-capita consumer spending.
China – China, too, needs widespread adoption of options in both scenarios, but supporting options are already notably lower compared to high-income countries. This means that in consumption-focused scenarios house-holds play a major role in enabling shifts towards a sus-tainable footprint, but the system-level changes are a more efficient way to achieve the 2030 target.
Mobility accounts for the largest reduction in the consumption-focused scenario. Overall transport-relat-ed footprints would be reduced 51% (610 kgCO₂e reduc-tion) by cutting transport demand by 21% (1,900 km) and by the radical reduction of high intensive modes of transportation, such as flying and car driving.
In the system-focused scenario a marked shift to-wards lower intensity modes of transportation and general efficiency improvement of transport would reduce the transport footprint by 31% (380 kg), and the average intensity would decrease to a level of an average train, without decreasing the overall transport demand.
Living space and overall energy consumption would need to decrease 31% (13m²) and 14% (270 kWh) to meet the 2030 target in the consumption-focused scenario. In contrast, in the system-focused scenario, efficiency im-provements (e.g. a pronounced shift towards renewable energy sources) would result in a more efficient way to reduce housing-related footprints (58%, or 770 kg re-duction) as energy in China is generated mainly with non-renewable energy sources.
Turkey – Differences in the effectiveness of consump-tion- and system-focused scenarios are seen clearly in Turkey. Consumption-focused scenarios require near-ly full adoption of amount type options, in comparison to 65% adoption of intensity type options in the sys-tem-focused scenario. This means that the ambitious 2030 footprint target would need higher engagement of households in the consumption-focused scenario to meet the 2030 target.
As with China, the hotspots and the highest impact reduction potentials are found in the transport and housing domain. High reduction of overall transport demand would result in a notably lower footprint (71%, or 580 kgCO₂e reduction in the transport), but as men-tioned above, would need high adoption of related op-tions at the household level.
Overall, generation of grid electricity and other ener-gy with renewable energy sources, which is enabled in the system-focused scenario, is the most effective way to move towards a sustainable housing footprint, pro-viding a 60%, or 1,000 kgCO₂e reduction.
In food, differences between the two scenarios are not as notable as for transport and housing. The nutri-tion footprint is already relatively low in Turkey due to lower consumption of meat and dairy (compared to

111
Section IVScenarios for Living Within a Fair Consumption Space
high-income countries). The achieved footprint reduc-tion in the consumption- and system-focused scenar-ios are 21% (250 kg) and 38% (460 kg), respectively. It should be noted once again that the adoption of con-sumption-focused options is lower compared to sys-tem-focused options, which indicates a more efficient scenario towards sustainable consumption.
South Africa – As compared to previous countries, the system-focused scenario offers an even more efficient way to achieve the 1.5-degree target by 2030 in South Africa. The adoption rate of intensity type options in the system-focused scenario is only 55%, compared to heavy adoption (90%) of amount type options in the con-sumption-focused scenario. This highlights the poten-tial of system level changes, as many lifestyle options are locked-in due to current infrastructure (e.g. energy generation with non-renewables), thus making sustain-able lifestyle primarily out of reach.
As with most of the studied countries, significant re-duction of overall transportation demand (36%, or 2600 km) would decrease the footprint most efficiently (62%, or a 750 kg reduction), but would require considera-ble engagement at the household level (90% adoption of amount type options in the consumption-focused scenario).
In a system-focused scenario the highest reduction potential is in food. A shift towards plant-based diets would reduce food footprints by 57% (or 980 kg), as high intensity meat consumption is relatively high.
Brazil – Adoption rates for both amount and intensity type options are notably lower in Brazil, compared to previous countries, due to an overall lower reduction target from the current lifestyle carbon footprint. Nev-ertheless, the adoption rate for intensity type options is still 40% in the consumption-focused scenario, but on-ly 25% for intensity type options in the system-focused scenario.
In both scenarios the highest reduction potential is in food, due to heavy consumption of high intensi-ty meat products. Shifting towards plant-based diets in the system-focused scenario would result in a 32% low-er food footprint and an overall reduction of the current footprint by 600 kgCO₂e.
Current living space and energy consumption are al-ready relatively low (28m² and 1,500 kWh), compared to high-income countries. To achieve the 1.5-degree target by 2030, living space should be reduced by 10% and en-ergy consumption by 6% in the consumption-focused scenario. Almost the same reduction impact could be achieved in the system-focused scenario by shifting to-wards renewable off-grid energy sources, replacing re-maining non-renewable grid electricity sources with renewables, and using current living space more effi-
ciently (improved efficiency of houses and appliances and sharing a space by renting a guest room).
The mobility related footprint is currently relative-ly low due to the high share of flex fuel cars and public transportation. Nevertheless, high adoption of trans-port demand reducing options could reduce the trans-port footprint by 36% (or 240 kg) due to lower transpor-tation distances travelled (24%, or 1,100 km). A more realistic way to support sustainable footprint levels would be to support a shift towards public transporta-tion from car driving and/or introduction of hydrid and electric cars, as the share of non-white collar workers, i.e. people not able to remote work, is relatively high in Brazil (Lustig et al. 2020), compared to high-income countries.
India – With a notably lower footprint compared to high-income and upper-middle income countries, In-dia is able to achieve the 1.5-degree target only with an adoption rate of 30% in both scenarios. In addition, mainly transport related options were selected, as this is clearly the hotspot of the country’s current footprint.
Overall lower transport demand and use of cars in the consumption-focused scenario, together with shifting towards lower intensity modes of transporta-tion in the system-focused scenario could offer an ef-fective way of achieving a sustainable footprint level. It should be noted that, especially in the case of India, higher adoption of individual domain level options, in-stead of using the same adoption rate for all domains, could offer a more efficient and sustainable pathway towards the 2030 target.
A vegetarian diet is already the predominant diet in India and therefore shifts towards plant-based di-ets do not offer notable reductions to the current foot-print, as long as the present situation is maintained. Housing footprints are already very low in India and the current living space is at the lower limit of a de-cent living standard. Therefore low-carbon lifestyle options mainly target system-focused options, such as shifting towards renewable energy sources, which are often beyond consumer choices and locked-in in the current infrastructure.

112
Section IVScenarios for Living Within a Fair Consumption Space
Canada
Current
Food2,270kg
Amount 890kgIntensity 2.5kg/kg
400kgAmount 720kgIntensity 0.6kg/kg
400kgAmount 720kgIntensity 0.6kg/kg
Housing3,050kg
Amount 58m²Intensity 52kg/m²
1,300kg Amount 32m²Intensity 40kg/m²
1,300kg Amount 32m²Intensity 40kg/m²
Transport4,990kg
Amount 22,180kmIntensity 0.22kg/km
1,200kgAmount 15,330kmIntensity 0.08kg/km
1,200kgAmount 15,330kmIntensity 0.08kg/km
Goods2,510kg
Amount $3,850Intensity 0.65kg/$
680kgAmount $1,130Intensity 0.6kg/$
Services720kg
Amount $4,520Intensity 0.16kg/$
2030
Scenario A: Consumption focused
2030
Scenario B: System focused
Figure 10.1. Current lifestyle carbon footprints and estimated consumption- and system-focused scenarios with needed adoption rates of selected low-carbon lifestyle options to meet the 1.5-degree target by 2030 (Canada)
Scenario A: "Consumption Focused" Scenario B: "System Focused"
Current Footprint (kgCO₂e/capita/year) 14,220 14,220
Options Adoption rate Adoption rate
Consumption focused 99% System focused 99%
System focused 99% Consumption focused 99%
Scenario based footprint (kgCO₂e/cap/yr) 2,910 2,910
Note: Coloured rectangles indicate the average lifestyle carbon footprints of each component. Height, width, and size of the area represent the physical amount of consumption, carbon intensity, and carbon footprints, respectively.

113
Section IVScenarios for Living Within a Fair Consumption Space
Finland
Current
Food1,830kg
Amount 790kgIntensity 2.3kg/kg
1,080kg Amount 660kgIntensity 1.6kg/kg
870kg Amount 710kgIntensity 1.2kg/kg
Housing1,570kg
Amount 41m²Intensity 38kg/m²
600 Amount 27m²Intensity 22kg/m²
Amount 27m²Intensity 13kg/m²
Transport3,650kg
Amount 17,490kmIntensity 0.21kg/km
710 Amount 9,380kmIntensity 0.08kg/km
1,130 Amount 11,980kmIntensity 0.09kg/km
Goods1,410kg
Amount $3,750Intensity 0.38kg/$
Amount $1,310Intensity 0.02kg/$
540Leisure
Amount $2,850Intensity 0.19kg/$
Amount $1,000Intensity 0.01kg/$
Services690kg
Amount $4,110Intensity 0.17kg/$
30kgAmount $3,930Intensity 0.01kg/$
2030
Scenario A: Consumption focused
2030
Scenario B: System focused
Figure 10.2. Current lifestyle carbon footprints and estimated consumption- and system-focused scenarios with needed adoption rates of selected low-carbon lifestyle options to meet the 1.5-degree target by 2030 (Finland)
Scenario A: "Consumption Focused" Scenario B: "System Focused"
Current Footprint (kgCO₂e/capita/year) 9,700 9,700
Options Adoption rate Adoption rate
Consumption focused 95% System focused 95%
System focused 35% Consumption focused 65%
Scenario based footprint (kgCO₂e/cap/yr) 2,480 2,450

114
Section IVScenarios for Living Within a Fair Consumption Space
United Kingdom
Current
Food1,590kg
Amount 850kgIntensity 1.9kg/kg
910kg Amount 680kgIntensity 1.3kg/kg
630 Amount 770kgIntensity 0.8kg/kg
Housing1,890kg
Amount 39m²Intensity 48kg/m²
890kg Amount 23m²Intensity 37kg/m²
530 Amount 24m²Intensity 21kg/m²
Transport3,250kg
Amount 14,740kmIntensity 0.22kg/km
570 Amount 6,630kmIntensity 0.09kg/km
1,280kg Amount 10,470kmIntensity 0.12kg/km
970Goods
Amount $4,570Intensity 0.21kg/$
Amount $2,290Intensity 0.01kg/$
Leisure 360kgAmount $3,900
Intensity 0.09kg/$
Amount $1,950Intensity 0.0kg/$
Services 420kgAmount $5,080
Intensity 0.08kg/$
Amount $2,540Intensity 0.0kg/$
2030
Scenario A: Consumption focused
2030
Scenario B: System focused
Figure 10.3. Current lifestyle carbon footprints and estimated consumption- and system-focused scenarios with needed adoption rates of selected low-carbon lifestyle options to meet the 1.5-degree target by 2030 (United Kingdom)
Scenario A: "Consumption Focused" Scenario B: "System Focused"
Current Footprint (kgCO₂e/capita/year) 8,470 8,470
Options Adoption rate Adoption rate
Consumption focused 95% System focused 95%
System focused 30% Consumption focused 50%
Scenario based footprint (kgCO₂e/cap/yr) 2,430 2,490

115
Section IVScenarios for Living Within a Fair Consumption Space
Japan
Current
Food1,400kg
Amount 800kgIntensity 1.8kg/kg
960kg Amount 720kgIntensity 1.3kg/kg
820 Amount 780kgIntensity 1.0kg/kg
Housing2,430kg
Amount 39m²Intensity 61kg/m²
1,190kg Amount 24m²Intensity 48kg/m²
620 Amount 28m²Intensity 21kg/m²
Transport1,970kg
Amount 10,970kmIntensity 0.18kg/km
Amount 3,940kmIntensity 0.04kg/km
910 Amount 9,720kmIntensity 0.09kg/km
Goods1,030kg
Amount $3,270Intensity 0.32kg/$
Amount $2,780Intensity 0.02kg/$
580kgAmount $2,010Intensity 0.29kg/$
Amount $1,710Intensity 0.01kg/$
650ServicesAmount $4,050
Intensity 0.16kg/$
30kgAmount $3,450Intensity 0.01kg/$
2030
Scenario A: Consumption focused
2030
Scenario B: System focused
Figure 10.4. Current lifestyle carbon footprints and estimated consumption- and system-focused scenarios with needed adoption rates of selected low-carbon lifestyle options to meet the 1.5-degree target by 2030 (Japan)
Scenario A: "Consumption Focused" Scenario B: "System Focused"
Current Footprint (kgCO₂e/capita/year) 8,060 8,060
Options Adoption rate Adoption rate
Consumption focused 95% System focused 95%
System focused 30% Consumption focused 15%
Scenario based footprint (kgCO₂e/cap/yr) 2,400 2,450

116
Section IVScenarios for Living Within a Fair Consumption Space
China
Current
Food1,330kg
Amount 940kgIntensity 1.4kg/kg
1,010 Amount 810kgIntensity 1.2kg/kg
560kgAmount 750kgIntensity 0.7kg/kg
1,190kgHousingAmount 40m²
Intensity 29kg/m²
820kg Amount 28m²Intensity 29kg/m²
890 Amount 35m²Intensity 25kg/m²
1,200kgTransportAmount 9,310km
Intensity 0.13kg/km
590 Amount 7,400kmIntensity 0.08kg/km
830 Amount 9,290kmIntensity 0.09kg/km
Amount $620Intensity 0.17kg/$
2030
Scenario A: Consumption focused
2030
Scenario B: System focused
Figure 10.5. Current lifestyle carbon footprints and estimated consumption- and system-focused scenarios with needed adoption rates of selected low-carbon lifestyle options to meet the 1.5-degree target by 2030 (China)
Scenario A: "Consumption Focused" Scenario B: "System Focused"
Current Footprint (kgCO₂e/capita/year) 4,970 4,970
Options Adoption rate Adoption rate
Consumption focused 95% System focused 85%
System focused 15% Consumption focused 1%
Scenario based footprint (kgCO₂e/cap/yr) 2,470 2,460

117
Section IVScenarios for Living Within a Fair Consumption Space
South Africa
Current
Food 1,710kgAmount 560kgIntensity 3.1kg/kg
1,210kg Amount 430kgIntensity 2.8kg/kg
730kg Amount 560kgIntensity 1.3kg/kg
1,050kgAmount 22m²Intensity 46kg/m²
710kg Amount 18m²Intensity 38kg/m²
570kg Amount 19m²Intensity 29kg/m²
Transport1,200kg
Amount 7,160kmIntensity 0.17kg/km
460kg Amount 4,720kmIntensity 0.1kg/km
770kg Amount 7,140kmIntensity 0.11kg/km
Amount $460Intensity 0.3kg/$
Amount $450Intensity 0.13kg/$
2030
Scenario A: Consumption focused
2030
Scenario B: System focused
Figure 10.6. Current lifestyle carbon footprints and estimated consumption- and system-focused scenarios with needed adoption rates of selected low-carbon lifestyle options to meet the 1.5-degree target by 2030 (South Africa)
Scenario A: "Consumption Focused" Scenario B: "System Focused"
Current Footprint (kgCO₂e/capita/year) 4,890 4,890
Options Adoption rate Adoption rate
Consumption focused 90% System focused 55%
System focused 10% Consumption focused 1%
Scenario based footprint (kgCO₂e/cap/yr) 2,470 2,490

118
Section IVScenarios for Living Within a Fair Consumption Space
Turkey
Current
Food1,210
Amount 940kgIntensity 1.3kg/kg
960 Amount 820kgIntensity 1.2kg/kg
750 Amount 940kgIntensity 0.8kg/kg
Housing1,690kg
Amount 32m²Intensity 52kg/m²
1,100kg Amount 24m²Intensity 43kg/m²
680 Amount 29m²Intensity 23kg/m²
1,010kgAmount 4,400kmIntensity 0.23kg/km
Amount 2,470kmIntensity 0.12kg/km
710kg Amount 4,380kmIntensity 0.16kg/km
Amount $840Intensity 0.75kg/$
Amount $830Intensity 0.26kg/$
2030
Scenario A: Consumption focused
2030
Scenario B: System focused
Figure 10.7. Current lifestyle carbon footprints and estimated consumption- and system-focused scenarios with needed adoption rates of selected low-carbon lifestyle options to meet the 1.5-degree target by 2030 (Turkey)
Scenario A: "Consumption Focused" Scenario B: "System Focused"
Current Footprint (kgCO₂e/capita/year) 4,860 4,860
Options Adoption rate Adoption rate
Consumption focused 90% System focused 65%
System focused 10% Consumption focused 1%
Scenario based footprint (kgCO₂e/cap/yr) 2,430 2,470

119
Section IVScenarios for Living Within a Fair Consumption Space
Brazil
Current
Food1,880kg
Amount 790kgIntensity 2.4kg/kg
1,500kg Amount 720kgIntensity 2.1kg/kg
1,270kg Amount 780kgIntensity 1.6kg/kg
500HousingAmount 28m²
Intensity 17kg/m²
Amount 25m²Intensity 16kg/m²
440kgAmount 26m²Intensity 16kg/m²
650kgAmount 3,650kmIntensity 0.14kg/km
420kg Amount 3,650kmIntensity 0.12kg/km
580kg Amount 4,610kmIntensity 0.13kg/km
2030
Scenario A: Consumption focused
2030
Scenario B: System focused
Figure 10.8. Current lifestyle carbon footprints and estimated consumption- and system-focused scenarios with needed adoption rates of selected low-carbon lifestyle options to meet the 1.5-degree target by 2030 (Brazil)
Scenario A: "Consumption Focused" Scenario B: "System Focused"
Current Footprint (kgCO₂e/capita/year) 3,240 3,240
Options Adoption rate Adoption rate
Consumption focused 40% System focused 25%
System focused 10% Consumption focused 1%
Scenario based footprint (kgCO₂e/cap/yr) 2,470 2,450

120
Section IVScenarios for Living Within a Fair Consumption Space
India
CurrentFood780kg
Amount 530kgIntensity 1.5kg/kg
710kg Amount 510kgIntensity 1.4kg/kg
660kg Amount 530kgIntensity 1.2kg/kg
Amount 9m²Intensity 43kg/m²
Amount 9m²Intensity 38kg/m²
Amount 9m²Intensity 32kg/m²
1,730kgTransport
Amount 16,370kmIntensity 0.11kg/km
1,370 Amount 14,250kmIntensity 0.1kg/km
1,510 Amount 16,290kmIntensity 0.09kg/km
2030
Scenario A: Consumption focused
2030
Scenario B: System focused
Figure 10.9. Current lifestyle carbon footprints and estimated consumption- and system-focused scenarios with needed adoption rates of selected low-carbon lifestyle options to meet the 1.5-degree target by 2030 (India)
Scenario A: "Consumption Focused" Scenario B: "System Focused"
Current Footprint (kgCO₂e/capita/year) 2,960 2,960
Options Adoption rate Adoption rate
Consumption focused 30% System focused 30%
System focused 10% Consumption focused 1%
Scenario based footprint (kgCO₂e/cap/yr) 2,470 2,500

121
Section IVScenarios for Living Within a Fair Consumption Space
As a complement to their long-term national climate targets, national governments should establish annual emissions reduction targets,
akin to annual GDP projections. These targets should be monitored and
outcomes reported every year.
These targets further need to be tied to equity and achievement of shared wellbeing within the
country. Unless there is a change of indicators by which governments measure success, there will be little change in government
planning and investments.

Section VThe Way Forward
Section V The Way Forward
122

123
Section VThe Way Forward
11 – Conclusions
11.1. Current lifestyle carbon footprints
The study highlights the huge differences in lifestyle-re-lated greenhouse gas emissions that exist among the world’s major economies. An average person in Cana-da, the country with the highest per-capita emissions among the economies studied, was found to have a life-style footprint six times larger than a person in Indo-nesia. The other high-income countries studied (Fin-land, Japan, and the UK) were found to have around 70% larger footprints than the three more prosperous middle-income countries included in the study (China, South Africa, and Turkey). These results confirm the well-known relationship where greenhouse gas emis-sions are strongly linked to per-capita national incomes.
However, there is also considerable variation in emissions among some of the high-income countries. Canada, which has a lifestyle carbon footprint around twice as large as Japan and the UK, is a case in point. This variation shows the significance of factors other than economic activity, such as population density, pub-lic investments, climate, and culture, in explaining the carbon intensity of lifestyles.
When looking at different domains of consump-tion, the footprints related to food are relatively simi-lar for the ten countries studied, with the exception of India and Indonesia, where meat consumption is nota-bly lower. In addition to meat, dairy products are a ma-jor contributor to footprints, especially in high-income countries, in particular in Canada and Finland. Differ-ent food cultures are reflected in the footprints, for ex-ample with respect to fish, dairy, beans, rice and meat consumption.
In the housing domain, non-renewable grid electric-ity is an important source of lifestyle carbon footprints in all countries. This shows the importance of chang-
ing the socio-technical context in order to support sus-tainable lifestyles. In addition, gas used for heating and cooking is another major contributor to the footprint for some countries, such as the United Kingdom, Japan, and Turkey. Large average living spaces contribute to the higher footprints of high-income countries. This is the case, especially in Canada and Finland, where large living spaces together with long and cold winters in-crease the overall energy demand.
Footprints for personal transport are highest in the high-income countries due to high overall transport de-mand and a high share of car use and carbon-intensive air travel. Japan, however, has a high mobility demand but a notably higher share of public transport use than other high-income countries. In countries with a low-er share of car use, transport demand is mainly met through public transportation (bus and train), except in India and Indonesia, where motorcycles are the biggest contributor to both mobility demand and footprints.
11.2. Pathways to a fair consumption space
The study proposes a “fair consumption space” as a guiding principle for sustainability and the transition to a low-carbon society. This concept recognises the need to simultaneously address both underconsump-tion, which results in unmet human needs, poor health, and limited freedoms, and overconsumption, which harms planetary systems disproportionally. Based on this notion, the study establishes “contraction and con-vergence” pathways for countries’ lifestyle carbon foot-prints.
Drawing from model scenarios used by the IPCC, the study sets mid-century global targets for lifestyle im-pacts. The lifestyle carbon footprints target to stay un-

124
Section VThe Way Forward
der a 1.5-degree increase in global temperature is 0.7 tCO₂e by 2050, with intermediary targets of 2.5 tCO₂e by 2030 and 1.4 tCO₂e by 2040. These targets are consistent with the goal to limit global warming to 1.5°C and de-rived from scenarios that require only limited deploy-ment of negative emission technologies.
The pathway analysis focuses mainly on the inter-mediate target of 2.5 tCO₂e per person per year, which would need to be met around 2030. For high-income countries, this requires footprint reductions of 69–82%. Middle-income countries, such as China, South Africa, and Turkey, currently have lifestyle carbon footprints that are about twice as large as the 2030 tar-get. Of the ten countries analysed, it is only Indonesia that has some limited room to grow footprints in the current decade. Even so, it is already above the 2050 target, and so emissions would need to peak and fall soon thereafter.
The study analyses the potential footprint reduc-tions from a range of solutions options, for each of the target countries. The results show that there is a huge reduction potential, especially for high-income coun-tries. In these countries, the largest reduction poten-tials (of 500 to over 1,500 kg CO₂e/person/year) are found in car-free private travelling/transport, reduc-tion of international flights, vegan diet, electric car, vegetarian diet, renewable grid electricity, vehicle fuel efficiency improvement, renewable off-grid electricity, low-carbon protein instead of red meat, and renewa-ble based heating and/or cooling. In the upper-middle income countries studied, the options with a poten-tial to save more than 500 kg/person/year per option on average are vegan diet and low-carbon protein in-stead of red meat. In lower-middle income countries,
only reducing commuting distances exceeded 500 kg per option.
Based on the assessment of options for reducing foot-prints, the study analyses how the 2.5t target for 2030 could be reached in each of the countries covered. For each country, two different scenarios for how to reach the 2.5t target were developed—one that relies more on sup-ply-side solutions and one that builds more on changes in behaviour. A consistent finding across all countries is the need for both systems and behaviour change. Even with very ambitious assumptions on supply-side meas-ures (reduced carbon intensity) there is still a need to al-so reduce and shift overall consumption patterns. This need is especially pronounced for high-income coun-tries where drastic cuts are needed. Canada, which has by far the largest footprint among the countries stud-ied, is not even able to meet the 2.5-ton target with the options considered in this report. Middle-income coun-tries also need lifestyle carbon footprint reductions of 23–50% by 2030, but have more leeway in terms of what domains to focus on and what options to adopt.
The scenarios show that the low-carbon lifestyle options assessed in this report can meet the target for 2030 in most countries but this generally requires high adoption rates of several options in all consumption domains. Although the 2030 target can be met in dif-ferent ways, the scenarios with more emphasis on sup-ply-side measures were generally found to be more ef-fective. This finding highlights the importance of rapid decarbonisation of products, production systems, and infrastructure—transformations that cannot be brought about by individual consumers but require collective action, including political decisions and effective pub-lic policies.

125
Section VThe Way Forward
12 –Thinking Forward
A ccording to the IPCC, the remaining car-bon budget for limiting global heating to 1.5°C now corresponds to around ten years of emissions at the current level. This timeframe is reflected in the 2.5tCO₂e
by 2030 target for lifestyle carbon footprints proposed in this study. Considering the glacial pace of interna-tional climate negotiations, the inadequate and wildly inconsistent policies put in place by governments, and the inertia of a civilization shaped for many decades by the availability of cheap high-density energy, ten years is a short period. Time is not on our side and it is easy to understand the growing frustration of climate activ-ist movements.
This final section puts forward some ideas on how to accelerate the transformation towards a low-carbon so-ciety and a stable climate. Not all these ideas are derived directly from the footprints analyses presented in this report but have practical links. The ideas are not pre-sented in any specific order.
1 As a complement to their long-term national cli-mate targets, national governments should estab-
lish annual emissions reduction targets, akin to annu-al GDP projections. These targets should be monitored and outcomes reported every year. These targets fur-ther need to be tied to equity and achievement of shared wellbeing within the country. Unless there is a change of indicators by which governments measure success, there will be little change in government planning and investments.
2 Governments should also be more explicit in how much global heating they consider acceptable and
more transparent in how they intend to contribute to this target. This could involve establishing national
carbon budgets, revealing the amount of greenhouse gases that can be emitted during the remainder of the 21st century. Such budgets could also be used for cit-izens’ climate dialogues where people are invited to discuss how to set priorities within a limited national emissions cap.
3 The world is sorely in need of visions that can in-spire and guide us to a sustainable future civiliza-
tion. Imagining sustainable futures is a powerful cat-alyst for transformative change and for co-creating desired worlds that respond to different identities and aspirations. Most campaigns currently emphasise re-ductions and familiar ways of living that will be lost, and not enough innovation, regeneration, and inspi-ration from the past. Visions need to show opportuni-ties to meet needs differently through satisfiers that are less resource and carbon-intensive. The lived experi-ences of peoples and communities currently achiev-ing high levels of wellbeing with rather modest carbon footprints could be shared much more widely. Visions should be based on sound science (e.g. assessments of resource constraints, carbon budgets, etc.), to avoid technology-driven utopias that disregard resource lim-its and human psychological wellbeing. In the process of visioning, youth panels on future lifestyles can help communicate the aspirations of the younger genera-tions and identify what societal changes, for example in city planning, can help them turn hopes and dreams into reality.
4 In order to see the role of lifestyles in climate change, both as a driver of emissions and as part
of solutions, policymakers and implementation pro-grams need more analysis carried out using consump-tion-based accounting, of which the analyses presented

126
Section VThe Way Forward
in this report are an example. Such measures better re-flect the emissions associated with a population’s stand-ard of living than the production-based ones used in countries’ official reporting. Consumption-based anal-yses should also be extended beyond climate impacts to cover other critical environmental issues, such as bi-odiversity loss, air and water pollution, and freshwater use. Improving the accuracy of consumption-based ac-counting requires better data, updated more frequent-ly. More and better data on lifestyles and consumption patterns of different demographic groups, including of different socioeconomic strata, would be especially valuable for policy design. Ideally, efforts to strengthen data generation on lifestyles, consumption, and wellbe-ing should also be made at the international level to en-sure the availability of data that are comparable across countries.
5 This report presents and discusses mostly coun-try averages. However, literature shows that there
are huge differences in lifestyle carbon footprints with-in countries. These different population groups should be addressed in further research in order to direct de-cisions and facilitate governance as effectively as pos-sible. Analysis is also needed in-country and at more granular levels, e.g. cities and neighbourhoods/bor-oughs, inequalities within countries/cities, and reflect-ing unique lifestyle characteristics.
6 The process of collecting information and results from consumption-based accounting could pro-
vide an opportunity for public authorities to involve individuals and communities in participatory policy design, building legitimacy and acceptance to facili-tate uptake and implementation of resulting policies and programs. Acting on the basis of such an approach would also reveal what households can do on their own in transforming lifestyles and where intervention is needed at a policy level.
7 Sustainable Development Goal (SDG) 12 on sus-tainable consumption and production is not suf-
ficient on its own to carry the required global shift in lifestyles. The goal and its targets are an inadequate representation of sustainable lifestyles, the role of such ways of living in a sustainable society, and how the widespread adoption of such lifestyles could be promoted. The agreed indicators are weak, and most-ly related to waste management and efficiency, which can be helpful but in no way guarantee sustainable outcomes. In addition, the relationships to other goals are poorly articulated and recent assessments find that SDG12 is among the goals where the least progress has been made. As the international policy communi-ty gears up for a midterm review of the SDGs, it will be
essential to deal with this failure, and to mandate com-plementary programs that can boost SDG12.
8 One such complementary programme that could boost SDG12 is the UN mandated 10-Year Frame-
work of Programmes for Sustainable Consumption and Production (10YFP) that is soon to expire. While imple-mentation has had little visible impact, a renewed man-date, restructured governance, and more dedicated re-sources could provide opportunity for it to be refocused on lifestyles transition. Using a 1.5-degree lifestyles ap-proach would also immediately link the renewed 10YFP to the Paris Agreement, a link that has been missing, as well as to SDGs addressing climate, inequality, and wellbeing.
9 An unprecedented amount of capacity develop-ment is needed in order to support a global tran-
sition to sustainable future societies. The scale and ur-gency of change described in this report and by others, such as the IPCC, cannot be addressed with current lev-els of capacity. Capacity building for future lifestyles will be needed, not just for individuals and households but also for businesses, government agencies, and institu-tions influencing socio-cultural norms and physical in-frastructures that shape lifestyles. Capacity is needed: to reject familiar but unsustainable practices and insti-tutions; to imagine alternatives to current consumerist lifestyles; to understand and accept policies and solu-tions that may seem radical but are needed; to learn new ways of meeting needs; to build practical life-skills for sustainable living; and to be proactive and innovative towards future directions.
10 Be brave! Each delay in taking meaningful ac-tion only increases the likelihood of a climate
catastrophe, which would make even more drastic ac-tions necessary. There is enough evidence of worka-ble solutions, and additional opportunities for exper-iments with high-return potential in terms of climate mitigation, to get started right away.

127
Section VThe Way Forward
The world is sorely in need of visions that can inspire and guide us to a sustainable future
civilization. Imagining sustainable futures is a powerful catalyst for transformative change and for co-creating desired worlds that respond to different identities and
aspirations. Most campaigns currently emphasise reductions and familiar ways of living that will be lost,
and not enough innovation, regeneration, and inspiration – including from the past.
Visions need to show opportunities to meet needs differently – through satisfiers that are less resource and carbon-intensive. The lived experiences of peoples and
communities currently achieving high levels of wellbeing with rather modest carbon footprints could be
shared much more widely. Visions should be based on sound science (e.g. assessments of resource constraints, carbon budgets, etc.), to avoid technology-driven utopias that disregard resource limits and human psychological wellbeing. In the process of visioning, youth panels on
future lifestyles can help communicate the aspirations of the younger generations and identify what societal changes
can help them turn hopes and dreams into reality.

128
ReferencesSection I–V
References(Section I–V)
Agarwal, A., and S. Narain. 1991. “Global Warming in an Unequal World: A Case of Environmental Colonialism.” Centre for Science and Environment. https://www.osti.gov/etdeweb/biblio/6842576.
Agency for Natural Resources and Energy, Japan. 2017. Heisei 28 Nendo Enerugi Nikansuru Nenji Houkoku: Enerugi Hakusho 2017. [FY 2016 Annual Report on En-ergy (Energy White Paper 2017)].” http://www.enecho.meti.go.jp/about/whitepaper/2017pdf/whitepaper-2017pdf_2_1.pdf.
Akenji, L., M. Bengtsson, R. Bleischwitz, A. Tukker, and H. Schandl. 2016. “Ossified Materialism: Introduction to the Special Volume on Absolute Reductions in Materials Throughput and Emissions.” Journal of Cleaner Produc-tion 132 (September): 1–12.
Akenji, Lewis, Magnus Bengtsson, Yasuhiko Hotta, Mi-zuki Kato, and Matthew Hengesbaugh. 2020. “Chapter 21 - Policy Responses to Plastic Pollution in Asia: Sum-mary of a Regional Gap analysis1.” In Plastic Waste and Recycling, edited by Trevor M. Letcher, 531–67. Academ-ic Press.
Akenji, Lewis, and Huizhen Chen. 2016. “A Frame-work For Shaping Sustainable Lifestyles: Determinants and Strategies.” United Nations Environment Programme. https://www.semanticscholar.org/paper/6014d24c-7c14359f22bf2f9504ee967222422863.
Akenji, Lewis. 2014. “Consumer Scapegoatism and Lim-its to Green Consumerism.” Journal of Cleaner Production 63 (January): 13–23.
———. 2019. “Avoiding Consumer Scapegoatism. Towards a Political Economy of Sustainable Living.” Faculty of Agriculture and Forestry, University of Helsinki. https://helda.helsinki.fi/bitstream/handle/10138/303978/Avoiding.pdf?sequence=1&isAllowed=y.
Alcott, Blake. 2010. “Impact Caps: Why Population, Af-fluence and Technology Strategies Should Be Aban-doned.” Journal of Cleaner Production 18 (6): 552–60.
Aldred, Rachel, and Anna Goodman. 2020. “Low Traf-fic Neighbourhoods, Car Use, and Active Travel: Evi-dence from the People and Places Survey of Outer Lon-don Active Travel Interventions.” Findings Brief: Health Care Financing & Organization, September. https://doi.org/10.32866/001c.17128.
Anderson, Kevin, and Glen Peters. 2016. “The Trouble with Negative Emissions.” Science 354 (6309): 182–83.
Aro, Riikka. 2020. “‘A Bigger Living Room Required a Big-ger TV’: Doing and Negotiating Necessity in Well-to-Do Households.” Journal of Consumer Culture 20 (4): 498–520.
Arto, Iñaki, José Rueda-Cantuche, and Glen Peters. 2014. “Comparing The GTAP-MRIO Databases For Car-bon Footprint Analysis.” Economic Systems Research 26 (3): 327–53.
Barrett, John, Harry Vallack, Andrew Jones, and Gary Haq. 2002. “A Material Flow Analysis and Ecologi-cal Footprint of York.” Stockholm Environment Institute. https://www.researchgate.net/profile/Gary_Haq/pub-lication/257494298_A_Material_Flow_Analysis_and_Ecological_Footprint_of_York/links/02e7e525555fb-c95ab000000.pdf.

129
ReferencesSection I–V
Barr, Stewart. 2018. “Personal Mobility and Climate Change.” Wiley Interdisciplinary Reviews. Climate Change 9 (5): e542.
Bauwens, Michael, and Vasilis Niaros. 2017. Value in the Commons Economy: Developments in Open and Contributory Value Accounting. P2P Foundation.
BBC News. 2020. “Australia’s Fires ‘Killed or Harmed Three Billion Animals.’” Published July 28, 2020. https://www.bbc.com/news/world-australia-53549936. Ac-cessed July 16, 2021.
———. 2021a. “France Moves to Ban Short-Haul Domes-tic Flights.” Published April 12, 2021. https://www.bbc.com/news/world-europe-56716708. Accessed Septem-ber 04, 2021.
———. 2021b. “Wales Transport: Freeze on All New Road Building Projects.” Published June 22, 2021. https://www.bbc.com/news/uk-wales-politics-57552390. Ac-cessed September 05, 2021
———. 2021c. “Canada Weather: Dozens Dead as Heat-wave Shatters Records.” Published June 30, 2021. https://www.google.com/url?q=https://www.bbc.com/news/world-us-canada-57654133&sa=D&source=ed-itors&ust=1626417385144000&usg=AOvVaw0QJorg-K3LT5qSNrDf4Cyg3. Accessed June 30, 2021.
Berg, Nicole J. van den, Heleen L. van Soest, Andries F. Hof, Michel G. J. den Elzen, Detlef P. van Vuuren, Weny-ing Chen, Laurent Drouet, et al. 2019. “Implications of Various Effort-Sharing Approaches for National Carbon Budgets and Emission Pathways.” Climatic Change 162 (4): 1805–22.
Berwyn, Bob. 2017. “Climate Change Concerns Prompt Court to Block Vienna Airport Expansion.” Inside Climate News. Published February 15, 2017. https://insidecli-matenews.org/news/15022017/climate-change-vien-na-airport-paris-climate-agreement-james-hansen/. Accessed September 04, 2021.
Bigo, Aurélien. 2020. “Les transports face au défi de la transition énergétique. Explorations entre passé et ave-nir, technologie et sobriété, accélération et ralentisse-ment.” Institut Polytechnique de Paris. https://tel.ar-chives-ouvertes.fr/tel-03082127/document.
Bird, Jenny, and Matthew Lockwood. 2009. Plan B?: The Prospects for Personal Carbon Trading. Institute for Public Policy Research.
Boitier, Baptiste. 2012. “CO₂ Emissions Produc-tion-Based Accounting vs Consumption: Insights from the WIOD Databases.” http://www.wiod.org/conferenc-es/groningen/paper_Boitier.pdf.
Botezat, Ileana, Jonathan Campion, Pablo Garcia-Cu-billana, Dóra Guðmundsdóttir, Wendy Halliday, Nigel Henderson, Arne Holte, et al. 2017. Mental Health in All Policies. Joint Action on Mental Health and Well-Being. Sit-uation Analysis and Recommendations for Action. The Eu-ropean Union.
Bothner, Fabio. 2021. “Personal Carbon Trading—Lost in the Policy Primeval Soup?” Sustainability: Science Practice and Policy 13 (8): 1–16.
Boyle, David, Anna Coote, Chris Sherwood, and Julia Slay. 2010. Right Here, Right Now. Taking Co-Production in-to the Mainstream. NESTA, UK.
Brand, Ulrich, and Markus Wissen. 2017. “The Imperial Mode of Living.” In Routledge Handbook of Ecological Eco-nomics, 152–61.
Bristow, Abigail L., Mark Wardman, Alberto M. Zanni, and Phani K. Chintakayala. 2010. “Public Acceptability of Personal Carbon Trading and Carbon Tax.” Ecological Economics: The Journal of the International Society for Eco-logical Economics 69 (9): 1824–37.
Brodie, Janine M. 2007. “Reforming Social Justice in Neoliberal Times.” Studies in Social Justice 1 (2): 93–107.
Bromley, Daniel W. 2007. “Environmental Regulations and the Problem of Sustainability: Moving Beyond ‘Mar-ket Failure.’” Ecological Economics: The Journal of the In-ternational Society for Ecological Economics 63 (4): 676–83.
Bruckner, Martin, Stefan Giljum, Christian Lutz, and Kirsten Svenja Wiebe. 2012. “Materials Embodied in In-ternational Trade – Global Material Extraction and Con-sumption between 1995 and 2005.” Global Environmen-tal Change: Human and Policy Dimensions 22 (3): 568–76.
Buhl, Johannes. 2014. “Revisiting Rebound Effects from Material Resource Use. Indications for Germany Con-sidering Social Heterogeneity.” Resources 3 (1): 106–22.
Buitenkamp, Maria, H. Venner, and T. Wams. 1992. “Sus-tainable Netherlands: Action Plan for a Sustainable De-velopment of the Netherlands.” Vereniging Milieudefen-sie: Amsterdam.

130
ReferencesSection I–V
Burgess, Martin, and Mark Whitehead. 2020. “Just Tran-sitions, Poverty and Energy Consumption: Personal Car-bon Accounts and Households in Poverty.” Energies 13 (22): 1–24.
Burningham, Kate, and Susan Venn. 2017. “Moments of Change — Are Lifecourse Transitions Opportunities for Moving to More Sustainable Consumption?” Journal of Consumer Culture 20 (1): 102–21.
Capstick, Stuart, Radhika Khosla, and Susie Wang. 2020. “Bridging the Gap – the Role of Equitable Low-Carbon Lifestyles.” In Emissions Gap Report, edited by Anne Olhoff and John Christensen. Nairobi.
Carbon Neutral Cities Alliance. 2021. “Our Cities.” https://carbonneutralcities.org/cities/.
Carey, Nick, and Christoph Steitz. 2021. “EU Proposes Effective Ban for New Fossil-Fuel Cars from 2035.” Reu-ters. Published July 14, 2021. https://www.reuters.com/business/retail-consumer/eu-proposes-effective-ban-new-fossil-fuel-car-sales-2035-2021-07-14/. Accessed September 4, 2021.
Carmichael, Richard. 2019. “Behaviour Change, Public Engagement and Net Zero. A Report for the Committee on Climate Change.” https://www.theccc.org.uk/wp-con-tent/uploads/2019/10/Behaviour-change-public-en-gagement-and-Net-Zero-Imperial-College-London.pdf.
Carod-Artal, Francisco Javier. 2017. “Social Determi-nants of Mental Health.” In Global Mental Health: Pre-vention and Promotion, edited by Sabine Bährer-Kohler, 243:33–46.
Cézard, Florian, and Marie Mourad. 2019. “Panorama Sur La Notion de Sobriété – Définitions, Mises En œu-vre, Enjeux (rapport Final).” https://librairie.ademe.fr/cadic/491/rapport-etat-lieux-notion-sobriete-2019.pd-f?modal=false.
Chancel, Lucas, and Thomas Piketty. 2015. “Carbon and Inequality: From Kyoto to Paris.” http://piketty.pse.ens.fr/files/ChancelPiketty2015.pdf.
Chen, T. Donna, and Kara M. Kockelman. 2016. “Car-sharing’s Life-Cycle Impacts on Energy Use and Green-house Gas Emissions.” Transportation Research Part D: Transport and Environment 47 (August): 276–84.
Clausen, Jens, Katrin Bienge, Jaya Bowry, and Marti-na Schmitt. 2017. “The five Shades of Sharing.” Ökolo-gisches Wirtschaften - Fachzeitschrift, no. 4 (November): 30–34.
Clayton, Susan. 2020. “Climate Anxiety: Psychological Responses to Climate Change.” Journal of Anxiety Disor-ders 74: 102263.
Climate Emergency Declaration. 2021. Climate Emergen-cy Declaration. Published August 9, 2021. https://clima-teemergencydeclaration.org/climate-emergency-dec-larations-cover-15-million-citizens/. Accessed August 14, 2021
Climate Equity Reference Project. 2015. “Fair Shares: A Civil Society Equity Review of INDCS.” http://civilsocie-tyreview.org/report/.
Climatewatch. 2021. “Historical Carbon Emis-sions.” https://www.climatewatchdata.org/ghg-emis-sions?end_year=2018&start_year=1990.
Cohen, Maurie J. 2021. “New Conceptions of Suffi-cient Home Size in High-Income Countries: Are We Ap-proaching a Sustainable Consumption Transition?” Housing, Theory and Society 38 (2): 173–203.
Coote, Anna. 2021. “Universal Basic Services and Sus-tainable Consumption.” Sustainability: Science Practice and Policy 17 (1): 32–46.
Coote, Anna, and Andrew Percy. 2020. The Case for Uni-versal Basic Services. Cambridge: Polity.
Coote, Anna, and Edanur Yazici. 2020. “Universal Qual-ity Public Services.” Public Services International. https://pop-umbrella.s3.amazonaws.com/uploads/38065e03-df0f-4299-b2d1-0d4dba72737e_EN_F.pdf.
Corak, Miles. 2016. “Inequality from Generation to Gen-eration: The United States in Comparison.” 9929. In-stitute of Labor Economics (IZA). https://ideas.repec.org/p/iza/izadps/dp9929.html.
Creutzig, Felix, Blanca Fernandez, Helmut Haberl, Ra-dhika Khosla, Yacob Mulugetta, and Karen C. Seto. 2016. “Beyond Technology: Demand-Side Solutions for Cli-mate Change Mitigation.” Annual Review of Environment and Resources 41 (1): 173–98.
Cushman, John H., Jr. 1998. “POLLUTION POLICY IS UNFAIR BURDEN, STATES TELL E.P.A.” The New York Times. Published May 10, 1998. https://www.nytimes.com/1998/05/10/us/pollution-policy-is-unfair-burden-states-tell-epa.html. Accessed August 11, 2021.

131
ReferencesSection I–V
Matthews, H. Damon, Katarzyna B. Tokarska, Joeri Rogelj, Christopher J. Smith, Andrew H. MacDougall, Karsten Haustein, Nadine Mengis, Sebastian Sippel, Piers M. Forster, and Reto Knutti. 2021. “An Integrated Approach to Quantifying Uncertainties in the Remaining Carbon Budget.” Communications Earth & Environment 2 (1): 1–11.
Dao, Hy, Pascal Peduzzi, B. Chatenoux, Andrea De Bono, Stefan Schwarzer, and Damien Friot. 2015. “Environmen-tal Limits and Swiss Footprints Based on Planetary .” Swiss Federal Office for the Environment. https://www.gruenew-irtschaft.admin.ch/dam/grwi/de/dokumente/BAFU/Envi-ronmental-Limits-and-Swiss-Footprints-Based-on-Plan-etary-Boundaries-Final-Report%20(EN%20only).pdf.download.pdf/Environmental-Limits-and-Swiss-Foot-prints-Based-on-Planetary-Boundaries-Final-Report.pdf.
Davis, Abigail, Donald Hirsch, Matt Padley, and Claire Shepherd. 2020. A Minimum Income Standard for the Unit-ed Kingdom in 2020. Loughborough University.
Davis, Marion. 2012. “Bonn Spotlight: Equity at the Core of Debates.” Published May 29, 2012. https://www.sei.org/featured/bonn-spotlight-equity-core-debates/.
Defra. 2008. “Synthesis Report on the Findings from Defra’s Pre-Feasibility Study into Personal Carbon Trading.” De-partment for Environment, Food and Rural Affairs, London. https://www.teqs.net/Synthesis.pdf.
Department for Digital, Culture, Media and Sport, and Cabinet Office. 2021. “VCSEs: A Guide to Working with Government.” Government of the United Kingdom. Pub-lished January 20, 2021. https://www.gov.uk/guidance/vcses-a-guide-to-working-with-government.
Deutsche Welle. 2021. “Death Toll Climbs in Western Germany Flooding — Live Updates.” Published July 16, 2021. https://www.dw.com/en/death-toll-climbs-in-western-germany-flooding-live-updates/a-58284256. Accessed September 1, 2021
De Vogli, Roberto, Ritesh Mistry, Roberto Gnesotto, and Giovanni Andrea Cornia. 2005. “Has the Relation between Income Inequality and Life Expectancy Disappeared? Ev-idence from Italy and Top Industrialised Countries.” Jour-nal of Epidemiology & Community Health 59 (2): 158–62.
Dietz, Thomas, Gerald T. Gardner, Jonathan Gilli-gan, Paul C. Stern, and Michael P. Vandenbergh. 2009. “Household Actions Can Provide a Behavioral Wedge to Rapidly Reduce US Carbon Emissions.” Proceedings of the National Academy of Sciences of the United States of America 106 (44): 18452–56.
Di Giulio, Antonietta, and Doris Fuchs. 2014. “Sustain-able Consumption Corridors: Concept, Objections, and Responses.” GAIA - Ecological Perspectives for Science and Society 23 (3): 184–92.
Dorninger, Christian, Alf Hornborg, David J. Abson, Henrik von Wehrden, Anke Schaffartzik, Stefan Giljum, John-Oliver Engler, Robert L. Feller, Klaus Hubacek, and Hanspeter Wieland. 2021. “Global Patterns of Ecologi-cally Unequal Exchange: Implications for Sustainability in the 21st Century.” Ecological Economics: The Journal of the International Society for Ecological Economics 179 (Jan-uary): 106824.
Doyal, Len, and Ian Gough. 1991. A Theory of Human Need. THE MACMILLAN PRESS LTD, London.
Duffy, Aidan. 2009. “Land Use Planning in Ireland—a Life Cycle Energy Analysis of Recent Residential Devel-opment in the Greater Dublin Area.” International Jour-nal of Life Cycle Assessment 14 (3): 268–77.
Ekins, Paul. 2014. “Strong Sustainability and Critical Natural Capital.” In Handbook of Sustainable Development, edited by Giles Atkinson, Simon Dietz, Eric Neumayer, and Matthew Agarwala. Edward Elgar Publishing.
Enqvist, Johan P., and Gina Ziervogel. 2019. “Water Gov-ernance and Justice in Cape Town: An Overview.” WIREs. Water 6 (4): e1354.
Eurocities. 2019. “Cities Leading The Way on Cli-mate Action.” https://eurocities.eu/wp-content/up-loads/2020/08/EUROCITIES_cities_climate_ac-tion_2019.pdf.
European Environment Agency. 2018. “Unequal Expo-sure and Unequal Impacts.” https://www.eea.europa.eu/publications/unequal-exposure-and-unequal-impacts.
Eyre, Nick. 2010. “Policing Carbon: Design and Enforce-ment Options for Personal Carbon Trading.” Climate Pol-icy 10 (4): 432–46.
Fajnzylber, Pablo, Daniel Lederman, and Norman Loayza. 2002. “Inequality and Violent Crime.” Journal of Law and Economics 45 (1): 1–40.
FAO, IFAD, UNICEF, WFP, and WHO. 2021. The State of Food Security and Nutrition in the World 2021. Transform-ing Food Systems for Food Security, Improved Nutrition and Affordable Healthy Diets for All. Rome: FAO.

132
ReferencesSection I–V
Faust, Christina L., Hamish I. McCallum, Laura S. P. Bloomfield, Nicole L. Gottdenker, Thomas R. Gillespie, Colin J. Torney, Andrew P. Dobson, and Raina K. Plow-right. 2018. “Pathogen Spillover during Land Conver-sion.” Ecology Letters 21 (4): 471–83.
Fawcett, Tina. 2005. Investigating Carbon Rationing as a Policy for Reducing Carbon Dioxide Emissions from UK House-hold Energy Use. Unpublished PhD thesis, University Col-lege London.
———. 2010. “Personal Carbon Trading: A Policy ahead of Its Time?” Energy Policy 38 (11): 6868–76.
Fawcett, Tina, and Yael Parag. 2010. “An Introduction to Personal Carbon Trading.” Climate Policy 10 (4): 329–38.
Feasta. 2008. “Cap and Share – A Fair Way to Cut Green-house Emissions.” Published May 29, 2008. https://www.feasta.org/2008/05/29/cap-and-share-a-fair-way-to-cut-greenhouse-emissions/.
Fioramonti, Lorenzo. 2020. “Well-Being Economy: A Scenario for a Post-Growth Horizontal Governance Sys-tem.” In The New Systems Reader, 145–56. Routledge.
Fleming, David. 2006. Energy and the Common Purpose: De-scending the Energy Staircase with Tradable Energy Quotas (TEQs). London: Lean Economy Connection.
Food and Agriculture Organization of the United Na-tions. 2021. “New Food Balances.” http://www.fao.org/faostat/en/#data/FBS.
Foxon, Timothy J. 2002. “Technological and Institution-al ‘Lock-in’ as a Barrier to Sustainable Innovation.” Impe-rial College Centre for Policy and Technology Working Paper.
Freudenreich, Birte, and Stefan Schaltegger. 2020. “De-veloping Sufficiency-Oriented Offerings for Clothing Users: Business Approaches to Support Consumption Reduction.” Journal of Cleaner Production 247 (February): 119589.
Friedli, Lynne. 2009. “Mental Health, Resilience and In-equalities / by Lynne Friedli.” EU/08/5087203. Copenha-gen: WHO Regional Office for Europe: https://apps.who.int/iris/handle/10665/107925.
Fuchs, Doris. 2019. “Living Well within Limits : The Vision of Consumption Corridors.” In Routledge Hand-book of Global Sustainability Governance, edited by Agni Kalfagianni, Doris Fuchs, and Anders Hayden, 296–307. Routledge.
Fuso Nerini, F., T. Fawcett, Y. Parag, and P. Ekins. 2021. “Is the Time Ripe for Personal Carbon Allowances?” Springer Nature Sustainability Community. {Forthcom-ing}. https://sustainabilitycommunity.springernature.com/posts/is-the-time-ripe-for-personal-carbon-al-lowances.
Gampfer, Robert. 2014. “Do Individuals Care about Fair-ness in Burden Sharing for Climate Change Mitigation? Evidence from a Lab Experiment.” Climatic Change 124 (1): 65–77.
Ganzleben, Catherine, and Aleksandra Kazmierczak. 2020. “Leaving No One Behind - Understanding Envi-ronmental Inequality in Europe.” Environmental Health: A Global Access Science Source 19 (1): 57.
Geys, Benny. 2006. “Explaining Voter Turnout: A Re-view of Aggregate-Level Research.” Electoral Studies 25 (4): 637–63.
Gibb, Rory, David W. Redding, Kai Qing Chin, Christl A. Donnelly, Tim M. Blackburn, Tim Newbold, and Kate E. Jones. 2020. “Zoonotic Host Diversity Increases in Human-Dominated Ecosystems.” Nature 584 (7821): 398–402.
Girod, Bastien, and Peter De Haan. 2010. “More or Bet-ter? A Model for Changes in Household Greenhouse Gas Emissions due to Higher Income.” Journal of Industrial Ecology 14 (1): 31–49.
Girod, Bastien, Detlef Peter van Vuuren, and Edgar G. Hertwich. 2014. “Climate Policy Through Changing Consumption Choices: Options and Obstacles for Re-ducing Greenhouse Gas Emissions.” Global Environmen-tal Change: Human and Policy Dimensions 25 (March): 5–15.
Gore, Timothy. {Forthcoming}. “The Per Capita Emissions Gap Report”
Gössling, Stefan, and Andreas Humpe. 2020. “The Glob-al Scale, Distribution and Growth of Aviation: Implica-tions for Climate Change.” Global Environmental Change: Human and Policy Dimensions 65 (November): 102194.
Gough, Ian. 2013. “The Political Economy of Preven-tion.” British Journal of Political Science 45 (02): 1–21.
Green Growth. 2020. “Global Opportunities for SDGs (GO4SDGs).” Published December 1, 2020. https://www.greengrowthknowledge.org/initiatives/global-opportu-nities-sdgs-go4sdgs.

133
ReferencesSection I–V
Grubler, Arnulf, Charlie Wilson, Nuno Bento, Benigna Boza-Kiss, Volker Krey, David L. McCollum, Narasimha D. Rao, et al. 2018. “A Low Energy Demand Scenario for Meeting the 1.5 °C Target and Sustainable Development Goals without Negative Emission Technologies.” Nature Energy 3 (6): 515–27.
Gunn, Madeline, and Oksana Mont. 2014. “Choice Edit-ing as a Retailers’ Tool for Sustainable Consumption.” International Journal of Retail & Distribution Management 42 (6): 464–81.
Guo, Daoyan, Hong Chen, Ruyin Long, and Shaohui Zou. 2021. “Who Avoids Being Involved in Personal Carbon Trading? An Investigation Based on the Urban Resi-dents in Eastern China.” Environmental Science and Pol-lution Research International 28 (32): 43365–81.
Gustavsson, Jenny, Christel Cederberg, Ulf Sonesson, Robert van Otterdijk, and Alexandre Meybeck. 2011. Global Food Losses and Food Waste. Rome: FAO.
Haberl, Helmut, Dominik Wiedenhofer, Doris Virág, Gerald Kalt, Barbara Plank, Paul Brockway, Tomer Fish-man, et al. 2020. “A Systematic Review of the Evidence on Decoupling of GDP, Resource Use and GHG Emis-sions, Part II: Synthesizing the Insights.” Environmental Research Letters: ERL [Web Site] 15 (6): 065003.
Halasz, Stephanie, and Rob Picheta. 2020. “Struggling Austrian Airlines Swaps Planes for Trains.” CNN. Pub-lished July 6, 2020. https://www.cnn.com/travel/article/austrian-airlines-flight-train-service-intl/index.html. Accessed September 03, 2021.
Hales, Simon, Philippa Howden-Chapman, Clare Sal-mond, Alistair Woodward, and Johan Mackenbach. 1999. “National Infant Mortality Rates in Relation to Gross National Product and Distribution of Income.” The Lancet 354 (9195): 2047.
Hallström, E., A. Carlsson-Kanyama, and P. Börjesson. 2015. “Environmental Impact of Dietary Change: A Systematic Review.” Journal of Cleaner Production 91 (March): 1–11.
Hargreaves, Katy, Ian Preston, Vicki White, and Josh-ua Thumim. 2013. “The Distribution of Household CO₂ Emissions in Great Britain.” Centre for Sustainable Energy 2013. https://www.jrf.org.uk/report/distribu-tion-household-co2-emissions-great-britain.
Hashemi, Majid. 2021. “The Economic Value of Unsup-plied Electricity: Evidence from Nepal.” Energy Econom-ics 95 (C). https://ideas.repec.org/a/eee/eneeco/v95y-2021ics0140988321000293.html.
Hasselqvist, Hanna, and Mia Hesselgren. 2019. “Bridg-ing Citizen and Stakeholder Perspectives of Sustainable Mobility through Practice-Oriented Design.” Sustainabil-ity: Science Practice and Policy 15 (1): 1–14.
Heinonen, Jukka, and Seppo Junnila. 2014. “Residential Energy Consumption Patterns and the Overall Housing Energy Requirements of Urban and Rural Households in Finland.” Energy and Buildings 76 (June): 295–303.
Helliwell, John F., Richard Layard, Jeffrey Sachs, and Jan-Emmanuel De Neve, eds. 2020. World Happiness Re-port 2020. New York: Sustainable Development Solutions Network.
Helliwell, John F., and Robert D. Putnam. 2004. “The So-cial Context of Well-Being.” Philosophical Transactions of the Royal Society of London. Series B, Biological Sciences 359 (1449): 1435–46.
Hendry, Alexander David. 2019. “Usage Behaviour of a Personal Carbon Monitoring System.” Southern Cross University. https://doi.org/10.25918/thesis.54.
Hertwich, Edgar G. 2005. “Life Cycle Approaches to Sus-tainable Consumption: A Critical Review.” Environmen-tal Science & Technology 39 (13): 4673–84.
———. 2008. “Consumption and the Rebound Effect: An Industrial Ecology Perspective.” Journal of Industrial Ecology 9 (1-2): 85–98.
Hertwich, Edgar G., and Glen P. Peters. 2009. “Carbon Footprint of Nations: A Global, Trade-Linked Analysis.” Environmental Science & Technology 43 (16): 6414–20.
Hickel, Jason. 2020. “Quantifying National Responsibil-ity for Climate Breakdown: An Equality-Based Attribu-tion Approach for Carbon Dioxide Emissions in Excess of the Planetary Boundary.” The Lancet Planetary Health 4 (9): e399–404.
Higgins, Christopher D., Matthias N. Sweet, and Pav-los S. Kanaroglou. 2018. “All Minutes Are Not Equal: Travel Time and the Effects of Congestion on Com-mute Satisfaction in Canadian Cities.” Transportation 45 (5): 1249–68.
Hillman, Mayer, and Tina Fawcett. 2004. How We Can Save the Planet. Penguin.
Höhne, Niklas, Michel den Elzen, and Donovan Escalan-te. 2013. “Regional GHG Reduction Targets Based on Ef-fort Sharing: A Comparison of Studies.” Climate Policy 14 (1): 122–47.

134
ReferencesSection I–V
Howell, Rachel A. 2012. “Living with a Carbon Allow-ance: The Experiences of Carbon Rationing Action Groups and Implications for Policy.” Energy Policy 41 (February): 250–58.
IEA. 2020. “Global Energy Review 2020. The Impacts of the Covid-19 Crisis on Global Energy Demand and CO2 Emissions.” https://iea.blob.core.windows.net/as-sets/7e802f6a-0b30-4714-abb1-46f21a7a9530/Glob-al_Energy_Review_2020.pdf.
———. 2021. “Analytical Frameworks for Electricity Se-curity.” https://www.iea.org/reports/analytical-frame-works-for-electricity-security.
———. 2021. “Clean Energy Demand for Critical Minerals Set to Soar as the World Pursues Net Zero Goals.” Pub-lished May 5, 2021. https://www.iea.org/news/clean-en-ergy-demand-for-critical-minerals-set-to-soar-as-the-world-pursues-net-zero-goals.
IGES, Aalto University, and D-mat ltd. 2019. 1.5 Degree Lifestyles - Targets and Options for Reducing Lifestyle Carbon Footprints. Technical Report. Institute for Global Environ-mental Strategies, Hayama, Japan.
Inoue, Nozomu, and Shigeru Matsumoto. 2019. “An Exam-ination of Losses in Energy Savings after the Japanese Top Runner Program?” Energy Policy 124 (January): 312–19.
Institute for Global Prosperity. 2017. “Social Prosperity for the Future: A Proposal for Universal Basic Servic-es.” https://discovery.ucl.ac.uk/id/eprint/10080175/1/universal_basic_services_-_the_institute_for_global_prosperity_.pdf.
IPBES. 2019. Global Assessment Report on Biodiversity and Ecosystem Services of the Intergovernmental Science-Policy Platform on Biodiversity and Ecosystem Services. Edited by E. S. Brondizio, J. J. Settele, S. Díaz, and H. T. Ngo. IPBES secretariat, Bonn, Germany.
IPCC. 2012. Managing the Risks of Extreme Events and Dis-asters to Advance Climate Change Adaptation. A Special Re-port of Working Groups I and II of the Intergovernmental Pan-el on Climate Change. Edited by C. B. Field, V. Barros, T. F. Stocker, D. Qin, D. J. Dokken, K. L. Ebi, Mastrandrea, et al. Cambridge, UK: Cambridge University Press.
———. 2018. “Summary for Policymakers.” In Global Warm-ing of 1.5 °C: An IPCC Special Report on the Impacts of Global Warming of 1.5 °C above Pre-Industrial Levels and Related Global Greenhouse Gas Emissions Pathways, in the Context of Strength-ening the Global Response to the Threat of Climate Change, Sus-tainable Development, and Efforts to Eradicate Poverty.
———. 2021a. Climate Change 2021: The Physical Science Ba-sis. Contribution of Working Group I to the Sixth Assessment Report of the Intergovernmental Panel on Climate Change. Edited by V. Masson-Delmotte, P. Zhai, A. Pirani, S. L. Connors, C. Péan, S. Berger, N. Caud, et al. Cambridge University Press. In Press.
———. 2021b. Summary for Policymakers. In Summary for Policymakers. In: Climate Change 2021: The Physical Sci-ence Basis. Contribution of Working Group I to the Sixth As-sessment Report of the Intergovernmental Panel on Climate Change. Edited by V. Masson-Delmotte, P. Zhai, A. Pira-ni, S. L. Connors, C. Péan, S. Berger, N. Caud, et al. Cam-bridge University Press. In Press.
Ivanova, Diana, Konstantin Stadler, Kjartan Steen-Ols-en, Richard Wood, Gibran Vita, Arnold Tukker, and Ed-gar G. Hertwich. 2016. “Environmental Impact Assess-ment of Household Consumption.” Journal of Industrial Ecology 20 (3): 526–36.
Ivanova, Diana, and Richard Wood. 2020. “The Unequal Distribution of Household Carbon Footprints in Europe and Its Link to Sustainability.” Global Sustainability 3.
Jayasuriya, Kanishka. 2006. Statecraft, Welfare and the Politics of Inclusion. Palgrave MacMillan, UK.
Jones, Christopher M., and Daniel M. Kammen. 2011. “Quantifying Carbon Footprint Reduction Opportuni-ties for U.S. Households and Communities.” Environ-mental Science & Technology 45 (9): 4088–95.
Jones, Kate E., Nikkita G. Patel, Marc A. Levy, Adam Sto-reygard, Deborah Balk, John L. Gittleman, and Peter Daszak. 2008. “Global Trends in Emerging Infectious Diseases.” Nature 451 (7181): 990–93.
Joyner Armstrong, Cosette M., Kim Y. Hiller Connell, Chunmin Lang, Mary Ruppert-Stroescu, and Melody L. A. LeHew. 2016. “Educating for Sustainable Fashion: Us-ing Clothing Acquisition Abstinence to Explore Sustain-able Consumption and Life Beyond Growth.” Journal of Consumer Policy 39 (4): 417–39.
Kartha, Sivan, Eric Kemp-Benedict, Eminly Ghosh, An-isha Nazaretg, and Tim Gore. 2020. “The Carbon Ine-quality Era. An Assessment of the Global Distribution of Consumption Emissions among Individuals from 1990 to 2015 and beyond.” JOINT RESEARCH REPORT, Septem-ber. https://cdn.sei.org/wp-content/uploads/2020/09/research-report-carbon-inequality-era.pdf.
Kasser, Tim. 2003. The High Price of Materialism. 9th ed. A Bradford Book.

135
ReferencesSection I–V
Kenner, Dario. 2019. Carbon Inequality. The Role of the Richest in Climate Change. Routledge.
Kenner, Dario, and Richard Heede. 2021. “White Knights, or Horsemen of the Apocalypse? Prospects for Big Oil to Align Emissions with a 1.5°C Pathway.” Energy Research & Social Science 79 (September): 102049.
Klocker, Natascha, Chris Gibson, and Erin Borger. 2016. “The Environmental Implications of Multigenerational Living: Are Larger Households Also Greener Households?” In Multigenerational Family Living, 174–91. Routledge.
Knight, Kyle, Eugene A. Rosa, and Juliet B. Schor. 2012. “Reducing Growth to Achieve Environmental Sustainabil-ity: The Role of Work Hours.” Political Economy Research In-stitute 304 (November). https://citeseerx.ist.psu.edu/view-doc/download?doi=10.1.1.590.5456&rep=rep1&type=pdf.
Knight, Kyle W., Juliet B. Schor, and Andrew K. Jorgen-son. 2017. “Wealth Inequality and Carbon Emissions in High-Income Countries.” Social Currents 4 (5): 403–12.
Knobelsdorff, M. von. 2008. “Public Acceptability of Per-sonal Carbon Trading.” Unpublished MSc Thesis. Uni-versity of Cambridge. Cambridge, UK.
Koide, Ryu, Michael Lettenmeier, Satoshi Kojima, Viivi Toivio, Aryanie Amellina, and Lewis Akenji. 2019. “Car-bon Footprints and Consumer Lifestyles: An Analysis of Lifestyle Factors and Gap Analysis by Consumer Seg-ment in Japan.” Sustainability: Science Practice and Policy 11 (21): 1–25.
Kondo, Naoki, Grace Sembajwe, Ichiro Kawachi, Rob M. van Dam, S. V. Subramanian, and Zentaro Yamaga-ta. 2009. “Income Inequality, Mortality, and Self Rated Health: Meta-Analysis of Multilevel Studies.” BMJ 339 (November).
Kossek, Ellen Ernst, Monique Valcour, and Pamela Lirio. 2014. “The Sustainable Workforce: Organizational Strat-egies for Promoting Work-Life Balance and Wellbeing.” In Work and Wellbeing, edited by P. Y. Chen and C-L Cooper, 495: 295–318. Hoboken, NJ, US: Wiley Blackwell.
Kotakorpi, Elli, Satu Lähteenoja, and Michael Lettenmei-er. 2008. Household MIPS - Natural Resource Consumption of Finnish Households and Its Deduction. THE FINNINSH EN-VIRONMENT 43en. Ministry of the Environment.
Kuhnhenn, Kai, Luis Costa, Eva Mahnke, Linda Schnei-der, and Steffen Lange. 2020. “A Societal Transforma-tion Scenario for Staying Below 1.5°C.” Publication Series Economic & Social Issues 23 (100).
Kumar, Bipul, and Nikhilesh Dholakia. 2020. “Firms Enabling Responsible Consumption: A Netnographic Approach.” Marketing Intelligence & Planning (ahead-of-print). https://doi.org/10.1108/MIP-09-2018-0387.
Kumm, Mattias. 2015. “Ein Imperium Des Kapitals? Der Trans- Atlantische Investitionsschutz Als Schutz Illegitimer Investorenprivilegien.” WZB-Mitteilungen 148: 10–13.
Kuokkanen, Anna, Markus Sihvonen, Ville Uusitalo, An-na Huttunen, Tuuli Ronkainen, and Helena Kahiluoto. 2020. “A Proposal for a Novel Urban Mobility Policy: Per-sonal Carbon Trade Experiment in Lahti City.” Utilities Policy 62 (February): 100997.
Laine, Jani, Jukka Heinonen, and Seppo Junnila. 2020. “Pathways to Carbon-Neutral Cities Prior to a National Policy.” Sustainability: Science Practice and Policy 12 (6): 2445.
Lamb, William F., Giulio Mattioli, Sebastian Levi, J. Timmons Roberts, Stuart Capstick, Felix Creutzig, Jan C. Minx, Finn Müller-Hansen, Trevor Culhane, and Ju-lia K. Steinberger. 2020. “Discourses of Climate Delay.” Global Sustainability 3.
Lamb, William F., Thomas Wiedmann, Julia Pongratz, Robbie Andrew, Monica Crippa, Jos G. J. Olivier, Dominik Wiedenhofer, et al. 2021. “A Review of Trends and Driv-ers of Greenhouse Gas Emissions by Sector from 1990 to 2018.” Environmental Research Letters: ERL [Web Site] 16 (7): 073005.
Lancee, Bram, and Herman G. Van de Werfhorst. 2012. “Income Inequality and Participation: A Comparison of 24 European Countries.” Social Science Research 41 (5): 1166–78.
Larkin, Alice, Jaise Kuriakose, Maria Sharmina, and Kevin Anderson. 2018. “What If Negative Emission Technologies Fail at Scale? Implications of the Paris Agreement for Big Emitting Nations.” Climate Policy 18 (6): 690–714.
Larsson, Jörgen, Simon Matti, and Jonas Nässén. 2020. “Public Support for Aviation Policy Measures in Swe-den.” Climate Policy 20 (10): 1305–21.
Lettenmeier, Michael, Senja Laakso, and Viivi Toivio. 2017. “Future Households: Smaller Footprint, Better Life.” In Boosting Resource Productivity by Adopting the Cir-cular Economy, edited by Christian Ludwig and Cecilia Matasci, 293–97. Villigen: Paul Scherrer Institut.

136
ReferencesSection I–V
Lettenmeier, Michael, Christa Liedtke, and Holger Rohn. 2014. “Eight Tons of Material Footprint—Suggestion for a Resource Cap for Household Consumption in Finland.” Resources 3 (3): 488–515.
Levy, Jonathan I., Jonathan J. Buonocore, and Kather-ine von Stackelberg. 2010. “Evaluation of the Public Health Impacts of Traffic Congestion: A Health Risk As-sessment.” Environmental Health: A Global Access Science Source 9 (October): 65.
Lockwood, Matthew. 2010. “The Economics of Personal Carbon Trading.” Climate Policy 10 (4): 447–61.
Lorek, Sylvia, and Joachim H. Spangenberg. 2014. “Sus-tainable Consumption within a Sustainable Economy – beyond Green Growth and Green Economies.” Journal of Cleaner Production 63 (January): 33–44.
Lunau, Thorsten, Clare Bambra, Terje A. Eikemo, Kjetil A. van der Wel, and Nico Dragano. 2014. “A Balancing Act? Work–life Balance, Health and Well-Being in European Wel-fare States.” European Journal of Public Health 24 (3): 422–27.
Lustig, Nora, Valentina Martinez Pabon, Federico Sanz, and Stephen D. Younger. 2020. “The Impact of COV-ID-19 Lockdowns and Expanded Social Assistance on Inequality, Poverty and Mobility in Argentina, Brazil, Colombia and Mexico.” Covid Economics, no. 46 (Septem-ber). https://cepr.org/content/covid-economics-vet-ted-and-real-time-papers-0.
Lynch, Kathleen, and Manolis Kalaitzake. 2020. “Affec-tive and Calculative Solidarity: The Impact of Individ-ualism and Neoliberal Capitalism.” European Journal of Social Theory 23 (2): 238–57.
Macintyre, Anna, Daniel Ferris, Briana Gonçalves, and Neil Quinn. 2018. “What Has Economics Got to Do with It? The Impact of Socioeconomic Factors on Mental Health and the Case for Collective Action.” Palgrave Com-munications 4 (1): 1–5.
Maniates, Michael. 2010. “Editing out Unsustainable Be-havior.” In Worldwatch Institute, State of the World 2010, New York: W.W. Norton. 119–27.
Marckmann, Bella, Kirsten Gram-Hanssen, and Toke Haunstrup Christensen. 2012. “Sustainable Living and Co-Housing: Evidence from a Case Study of Eco-Villag-es.” Built Environment 38 (3).
Marisi, Flavia. 2020. “Environmental Interests in Invest-ment Arbitration: Challenges and Directions.” ICSID Re-view - Foreign Investment Law Journal.
Marsden, Greg, Caroline Mullen, Ian Bache, Ian Bartle, and Matt Flinders. 2014. “Carbon Reduction and Trav-el Behaviour: Discourses, Disputes and Contradictions in Governance.” Transport Policy 35 (September): 71–78.
Martínez-Alier, Joan. 2002. “Ecological Debt and Prop-erty Rights on Carbon Sinks and Reservoirs.” Capitalism Nature Socialism 13 (1): 115–19.
Martin, Sarah, and Bharath Jairaj. 2016. “The Rise of the Ur-ban Energy ‘Prosumer.’” World Resources Institute. https://www.wri.org/insights/rise-urban-energy-prosumer.
Max-Neef, Manfred A. 1991. Human Scale Development: Conception, Application and Further Reflections. New York: Apex Press.
Mellier, Claire, and Rich Wilson. 2020. “Getting Cli-mate Citizens’ Assemblies Right.” Carnegie Europe. Published November 5, 2020. https://carnegieeurope.eu/2020/11/05/getting-climate-citizens-assem-blies-right-pub-83133. Accessed September 06, 2021
Messenger, Steffan. 2021. “Climate Change: New Targets to Eliminate Wales’ Gases.” BBC. Published February 9, 2021. https://www.bbc.com/news/uk-wales-55985367. Accessed September 03, 2021.
Meyer, Aubrey. 2000. Contraction & Convergence: The Glob-al Solution to Climate Change. Green Books.
Michaelis, Laurie, and Sylvia Lorek. 2004. “Consump-tion and the Environment in Europe — Trends and Fu-tures.” In Danish Environmental Protection Agency, Environ-mental Project No. 904 2004. http://citeseerx.ist.psu.edu/viewdoc/summary?doi=10.1.1.614.7501.
Miller, Sarah Clark. 2012. The Ethics of Need: Agency, Dig-nity, and Obligation. Routledge.
Millward-Hopkins, Joel, Julia K. Steinberger, Narasim-ha D. Rao, and Yannick Oswald. 2020. “Providing Decent Living with Minimum Energy: A Global Scenario.” Glob-al Environmental Change: Human and Policy Dimensions 65 (November): 102168.
Moore, Jennie, Meidad Kissinger, and William E. Rees. 2013. “An Urban Metabolism and Ecological Footprint Assessment of Metro Vancouver.” Journal of Environmen-tal Management 124 (July): 51–61.
Moore, J. L. 2013. “Getting Serious about Sustainabili-ty: Exploring the Potential for One-Planet Living in Van-couver.” https://open.library.ubc.ca/collections/ubcthe-ses/24/items/1.0074187.

137
ReferencesSection I–V
Morris, Steven. 2020. “Bristol Declares Ecological Emer-gency over Loss of Wildlife.” The Guardian. Published February 4, 2020. http://www.theguardian.com/uk-news/2020/feb/04/bristol-declares-ecological-emergen-cy-over-loss-of-wildlife. Accessed September 03, 2021.
Murphy, Richard. 2015. The Joy of Tax. First Edition. Ban-tam Press.
NégaWatt. 2003. “MANIFESTE négaWatt Pour Un Avenir énergétique Sobre, Efficace et Renouvelable.” Association négaWatt. https://negawatt.org/IMG/pdf/2003_mani-feste_negawatt_pour_un_avenir_energetique_sobre_efficace_et_renouvelable.pdf.
Nelldal, Bo-Lennart, and Evert Andersson. 2012. “Mode Shift as a Measure to Reduce Greenhouse Gas Emis-sions.” Procedia - Social and Behavioral Sciences 48 (Jan-uary): 3187–97.
Nelson, Erik J., Peter Kareiva, Mary Ruckelshaus, Katie Arkema, Gary Geller, Evan Girvetz, Dave Goodrich, et al. 2013. “Climate Change’s Impact on Key Ecosystem Services and the Human Well-being They Support in the US.” Frontiers in Ecology and the Environment 11 (9): 483–893.
Newell, Peter, Freddie Daley, and Michelle Twena. n.d. “Changing Our Ways? Behaviour Change and the Cli-mate Crisis.” Cambridge Sustainability Comission.
Newton, Peter, Denny Meyer, and Stephen Glackin. 2017. “Becoming Urban: Exploring the Transformative Capacity for a Suburban-to-Urban Transition in Aus-tralia’s Low-Density Cities.” Sustainability: Science Prac-tice and Policy 9 (10): 1718.
Niemeier, D., Gregory Gould, Alex Karner, Mark Hixson, Brooke Bachmann, Carrie Okma, Ziv Lang, and David Heres Del Valle. 2008. “Rethinking Downstream Regu-lation: California’s Opportunity to Engage Households in Reducing Greenhouse Gases.” Energy Policy 36 (9): 3436–47.
Nissinen, Ari, Juha Grönroos, Eva Heiskanen, Asmo Honkanen, Juha-Matti Katajajuuri, Sirpa Kurppa, Timo Mäkinen, et al. 2007. “Developing Benchmarks for Con-sumer-Oriented Life Cycle Assessment-Based Envi-ronmental Information on Products, Services and Con-sumption Patterns.” Journal of Cleaner Production 15 (6): 538–49.
Nordhaus, William. 2015. “Climate Clubs: Overcoming Free-Riding in International Climate Policy.” The Amer-ican Economic Review 105 (4): 1339–70.
Nussbaum, Martha C. 2001. Women and Human Develop-ment. Cambridge University Press.
Nykvist, Björn, Åsa Persson, Fredrik Moberg, Linn Persson, Sarah Cornell, and Johan Rockström. 2013. “A Study for the Swedish Environmental Protection Agen-cy.” https://www.naturvardsverket.se/Documents/pub-likationer6400/978-91-620-6576-8.pdf.
O’Callaghan, Brian J., and Em Murdock Smith. 2021. “Are We Building Back Better? Evidence from 2020 and Path-ways to Inclusive Green Recovery Spending.” https://we-docs.unep.org/bitstream/handle/20.500.11822/35281/AWBBB.pdf.
OECD. 2002. “Towards Sustainable Household Con-sumption? Trends and Policies in OECD Countries. Pol-icy Brief. Organisation for Economic Co-operation and Development.” https://www.oecd.org/env/consump-tion-innovation/2089523.pdf.
———. n.d. “Greenhouse Gas Emissions.” OECD.Stat. https://stats.oecd.org/Index.aspx?DataSetCode=AIR_GHG. Accessed September 5, 2021.
Office for National Statistics. 2016. “How Does UK Healthcare Spending Compare Internationally?” Pub-lished November 1, 2016. https://www.ons.gov.uk/peoplepopulationandcommunity/healthandsocial-care/healthcaresystem/articles/howdoesukhealth-carespendingcompareinternationally/2016-11-01. Ac-cessed September 5, 2021.
Opschoor, Hans, and Lucas Reijnders. 1991. “Towards Sustainable Development Indicators.” In In Search of In-dicators of Sustainable Development, edited by Onno Kuik and Harmen Verbruggen, 7–27. Dordrecht: Springer Netherlands.
Opschoor, J. 1987. “Duurzaamheid En Verandering: Over Ecologische Inpasbaarheid van Economische Ontwikkelinge [Sustainability and Change: About the Environmental Suitability of Economic Developments].” Amsterdam: Free University Press (in Dutch).
Ottelin, Juudit, Jukka Heinonen, and Seppo Junnila. 2017. “Rebound Effects for Reduced Car Ownership and Driving.” In Nordic Experiences of Sustainable Plan-ning: Policy and Practice. Routledge.
———. 2018. “Carbon and Material Footprints of a Wel-fare State: Why and How Governments Should Enhance Green Investments.” Environmental Science & Policy 86 (August): 1–10.

138
ReferencesSection I–V
Owen, Anne, Kjartan Steen-Olsen, John Barrett, Thom-as Wiedmann, and Manfred Lenzen. 2014. “A Structural Decomposition Approach to Comparing MRIO Databas-es.” Economic Systems Research 26 (3): 262–83.
Owen, L., L. Edgar, S. Prince, and C. Doble. 2008. “Per-sonal Carbon Trading: Public Acceptability: A Report to the Department for Environment, Food and Rural Af-fairs.” Opinion Leader & Enviros Consulting. Defra, Lon-don. https://www.darkoptimism.org/PublicAccepta-bility.pdf.
Oxfam. 2015. “Extreme Carbon Inequality. Why the Par-is Climate Deal Must Put the Poorest, Lowest Emitting and Most Vulnerable People First.” Oxfam Media Brief-ing, December. https://oi-files-d8-prod.s3.eu-west-2.amazonaws.com/s3fs-public/file_attachments/mb-ex-treme-carbon-inequality-021215-en.pdf.
———. 2017. “An Economy For The 99%. It’s Time to Build a Human Economy That Benefits Everyone, Not Just the Privileged Few.” OXFAM BRIEFING PAPER, January. https://s3.amazonaws.com/oxfam-us/www/static/me-dia/files/bp-economy-for-99-percent-160117-en.pdf.
———. 2020. “Confronting Carbon Inequality in the Eu-ropean Union.” December 7, 2020. https://www.oxfam.org/en/research/confronting-carbon-inequality-euro-pean-union.
Pan, An, Qi Sun, Adam M. Bernstein, Matthias B. Schul-ze, Joann E. Manson, Walter C. Willett, and Frank B. Hu. 2011. “Red Meat Consumption and Risk of Type 2 Diabe-tes: 3 Cohorts of US Adults and an Updated Meta-Anal-ysis.” The American Journal of Clinical Nutrition 94 (4): 1088–96.
Parag, Yael, Stuart Capstick, and Wouter Poortinga. 2011. “Policy Attribute Framing: A Comparison between Three Policy Instruments for Personal Emissions Re-duction.” Journal of Policy Analysis and Management: [the Journal of the Association for Public Policy Analysis and Man-agement] 30 (4): 889–905.
Parbhoo, Omar, Katy Davis, Robert Reynolds, Piyush Tantia, Pranav Trewn, and Sarah Welch. 2018. “Best of Intentions. Using Behavioral Design to Unlock Chari-table Giving.” http://www.ideas42.org/wp-content/up-loads/2018/08/ideas42-Best-of-Intentions_Charita-ble-Giving.pdf.
Parolin, Zachary, Megan Curran, Jordan Matsudaira, Jane Waldfogel, and Christopher Wimer. 2020. “Monthly Poverty Rates in the United States during the COVID-19 Pandemic.” Published October 15, 2020. https://static1.squarespace.com/static/5743308460b5e922a25a6d-c7/t/5f87c59e4cd0011fabd38973/1602733471158/COVID-Projecting-Poverty-Monthly-CPSP-2020.pdf.
Paskov, Marii, and Caroline Dewilde. 2012. “Income Ine-quality and Solidarity in Europe.” Research in Social Strat-ification and Mobility 30 (4): 415–32.
Peters, Glen P., and Edgar G. Hertwich. 2008. “Post-Kyo-to Greenhouse Gas Inventories: Production Versus Con-sumption.” Climatic Change 86 (1): 51–66.
Pichler, Peter-Paul, Ingram S. Jaccard, Ulli Weisz, and Helga Weisz. 2019. “International Comparison of Health Care Carbon Footprints.” Environmental Research Letters: ERL [Web Site] 14 (6): 064004.
Pickett, Kate E., and Richard G. Wilkinson. 2015. “In-come Inequality and Health: A Causal Review.” Social Sci-ence & Medicine 128 (March): 316–26.
Pihl, Erik, Eva Alfredsson, Magnus Bengtsson, Kathryn J. Bowen, Vanesa Cástan Broto, Kuei Tien Chou, Helen Cleugh, et al. 2021. “Ten New Insights in Climate Sci-ence 2020 – a Horizon Scan.” Global Sustainability 4. https://doi.org/10.1017/sus.2021.2.
Piketty, Thomas. 2014. Capital in the Twenty-First Century. Harvard University Press.
Pörtner, H. O., R. J. Scholes, J. Agard, E. Archer, A. Arneth, X. Bai, D. Barnes, et al. 2021. “Biodiversity and Climate Change.” IPBES-IPCC Co-Sponsored Workshop Report on Bi-odiversity and Climate Change; IPBES and IPCC. https://doi.org/10.5281/zenodo.4782538.
Princen, Thomas. 2003. “Principles for Sustainability: From Cooperation and Efficiency to Sufficiency.” Global Environmental Politics 3 (1): 33–50.
Ranger, N., L. K. Gohar, J. A. Lowe, S. C. B. Raper, A. Bow-en, and R. E. Ward. 2012. “Is It Possible to Limit Global Warming to No More than 1.5°C?” Climatic Change 111 (3-4): 973–81.
Rao, Narasimha D., and Jihoon Min. 2018. “Decent Liv-ing Standards: Material Prerequisites for Human Well-being.” Social Indicators Research 138 (1): 225–44.

139
ReferencesSection I–V
Rao, Narasimha D., Jihoon Min, and Alessio Mastrucci. 2019. “Energy Requirements for Decent Living in India, Brazil and South Africa.” Nature Energy 4 (12): 1025–32.
Ravallion, Martin. 2010. “The Developing World’s Bulg-ing (but Vulnerable) Middle Class.” World Development 38 (4): 445–54.
Raworth, Kate. 2017. “A Doughnut for the Anthropocene: Humanity’s Compass in the 21st Century.” The Lancet. Planetary Health 1 (2): e48–49.
Redding, David W., Peter M. Atkinson, Andrew A. Cun-ningham, Gianni Lo Iacono, Lina M. Moses, James L. N. Wood, and Kate E. Jones. 2019. “Impacts of Environ-mental and Socio-Economic Factors on Emergence and Epidemic Potential of Ebola in Africa.” Nature Communi-cations 10 (1): 1–11.
Requia, Weeberb J., Christopher D. Higgins, Matthew D. Adams, Moataz Mohamed, and Petros Koutrakis. 2018. “The Health Impacts of Weekday Traffic: A Health Risk Assessment of PM2.5 Emissions during Congested Peri-ods.” Environment International 111 (February): 164–76.
Reuters. 2021. “VW to End Sales of Combustion En-gines in Europe by 2035.” Published June 26, 2021. https://www.reuters.com/business/sustainable-busi-ness/vw-end-sales-combustion-engines-europe-by-2035-2021-06-26/. Accessed September 04, 2021
Riedy, Chris, Laura Wynne, Kylie McKenna, and Mat-thew Daly. 2019. “‘It’s a Great Idea for Other People’: Cohousing as a Housing Option for Older Australians.” Urban Policy and Research 37 (2): 227–42.
Rockström, Johan, Owen Gaffney, Joeri Rogelj, Malte Meinshausen, Nebojsa Nakicenovic, and Hans Joachim Schellnhuber. 2017. “A Roadmap for Rapid Decarboni-zation.” Science 355 (6331): 1269–71.
Rogelj, Joeri, William Hare, Jason Lowe, Detlef P. van Vuuren, Keywan Riahi, Ben Matthews, Tatsuya Hanao-ka, Kejun Jiang, and Malte Meinshausen. 2011. “Emis-sion Pathways Consistent with a 2 °C Global Tempera-ture Limit.” Nature Climate Change 1 (8): 413–18.
Rogelj, Joeri, Gunnar Luderer, Robert C. Pietzcker, El-mar Kriegler, Michiel Schaeffer, Volker Krey, and Key-wan Riahi. 2015. “Energy System Transformations for Limiting End-of-Century Warming to below 1.5 °C.” Na-ture Climate Change 5 (6): 519–27.
Roodhouse, Mark. 2017. “Rationing Returns: A Solution to Global Warming?” History & Policy, March.
Roodhuyzen, D. M. A., P. A. Luning, V. Fogliano, and L. P. A. Steenbekkers. 2017. “Putting Together the Puz-zle of Consumer Food Waste: Towards an Integral Per-spective.” Trends in Food Science & Technology 68 (Octo-ber): 37–50.
Sachs, Wolfgang. 1993. “Die Vier E’s. Merkposten Für Einen Maß-Vollen Wirtschaftsstil.” Politische Ökologie 11 (33): 69–72.
Sahakian, Marlyne D., and Julia K. Steinberger. 2011. “Energy Reduction through a Deeper Understanding of Household Consumption.” Journal of Industrial Ecol-ogy 15 (1): 31–48.
Salo, Marja, and Ari Nissinen. 2017. “Consump-tion Choices to Decrease Personal Carbon Foot-prints of Finns.” https://helda.helsinki.fi/bitstream/handle/10138/225779/SYKEre_30_2017.pdf ?se-quence=1&isAllowed=y.
Sandberg, Maria. 2018. “Downsizing of Housing: Nego-tiating Sufficiency and Spatial Norms.” Journal of Macro-marketing 38 (2): 154–67.
Sandow, Erika, Olle Westerlund, and Urban Lindgren. 2014. “Is Your Commute Killing You? On the Mortali-ty Risks of Long-Distance Commuting.” Environment & Planning A 46 (6): 1496–1516.
Sanne, Christer. 2002. “Willing Consumers—or Locked-in? Policies for a Sustainable Consumption.” Ecological Economics: The Journal of the International Society for Eco-logical Economics 42 (1): 273–87.
Schanes, Karin, Stefan Giljum, and Edgar Hertwich. 2016. “Low Carbon Lifestyles: A Framework to Structure Consumption Strategies and Options to Reduce Carbon Footprints.” Journal of Cleaner Production 139 (Decem-ber): 1033–43.
Schmidt-Bleek, Friedrich. 1993. “Wieviel Umwelt Braucht Der Mensch—MIPS, Das Maß Für Ökologisches Wirtschaften.” Verlag Birkhäuser, Basel, Boston, Berlin.
———. 2008. “Factor 10: The Future of Stuff.” Sustainabil-ity: Science Practice and Policy 4 (1): 1–4.
Schütz, Helmut, Stephan Moll, and Stefan Bringezu. 2003. “Globalisierung und die Verlagerung von Umwelt-belastungen: Die Stoffströme des Handels der Europäis-chen Union.” 134. Wuppertal Papers. https://www.econ-stor.eu/handle/10419/49105.

140
ReferencesSection I–V
SEI, IISD, ODI, Climate Analytics, CICERO, and UNEP. 2019. “The Production Gap: The Discrepancy between Countries’ Planned Fossil Fuel Production and Global Production Levels Consistent with Limiting Warming to 1.5°C or 2°C.” https://productiongap.org/wp-content/uploads/2019/11/Production-Gap-Report-2019.pdf.
Seppälä, Jyri, Ilmo Mäenpää, Sirkka Koskela, Tuomas Mattila, Ari Nissinen, Juha-Matti Katajajuuri, Tiina Härmä, Marja-Riitta Korhonen, Merja Saarinen, and Yr-jö Virtanen. 2011. “An Assessment of Greenhouse Gas Emissions and Material Flows Caused by the Finnish Economy Using the ENVIMAT Model.” Journal of Cleaner Production 19 (16): 1833–41.
Seto, Karen C., Steven J. Davis, Ronald B. Mitchell, Elea-nor C. Stokes, Gregory Unruh, and Diana Ürge-Vorsatz. 2016. “Carbon Lock-In: Types, Causes, and Policy Im-plications.” Annual Review of Environment and Resources 41 (1): 425–52.
Shaheb, Yamina, and et al. n.d. “Sufficiency: The Over-looked Climate Mitigation Strategy.” In Preparation.
Shan, Yuli, Jiamin Ou, Daoping Wang, Zhao Zeng, Shao-hui Zhang, Dabo Guan, and Klaus Hubacek. 2020. “Im-pacts of COVID-19 and Fiscal Stimuli on Global Emis-sions and the Paris Agreement.” Nature Climate Change 11 (3): 200–206.
Shi, Ge, Hong Yan, Wenchao Zhang, John Dodson, Henk Heijnis, and Mark Burrows. 2021. “Rapid Warming Has Resulted in More Wildfires in Northeastern Australia.” The Science of the Total Environment 771 (June): 144888.
Shove. 2012. “The Dynamics of Social Practice,” Feb-ruary. https://www.sagepub.com/sites/default/files/upm-binaries/47628_Shove.pdf.
SITRA. 2020. “Shift 1.5.” Published October 30, 2020. https://www.sitra.fi/en/projects/shift-1-5/.
Solt, Frederick. 2008. “Economic Inequality and Dem-ocratic Political Engagement.” American Journal of Polit-ical Science 52 (1): 48–60.
———. 2010. “Does Economic Inequality Depress Elec-toral Participation? Testing the Schattschneider Hy-pothesis.” Political Behavior 32 (2): 285–301.
Sorrell, Steve. 2007. “The Rebound Effect: An Assess-ment of the Evidence for Economy-Wide Energy Savings from Improved Energy Efficiency.” https://www.seman-ticscholar.org/paper/8e5260a35163402b6ada126bad-dc023966252618.
———. 2010. “An Upstream Alternative to Personal Car-bon Trading.” Climate Policy 10 (4): 481–86.
———. 2012. “Mapping Rebound Effects from Sus-tainable Behaviours: Key Concepts and Literature Review.” https://www.semanticscholar.org/paper/bf706ab48431824338aa1e5030b9c73203bdc788.
Spangenberg, Joachim H. 2002. “Environmental Space and the Prism of Sustainability: Frameworks for Indi-cators Measuring Sustainable Development.” Ecological Indicators 2 (3): 295–309.
———. 2014. “Institutional Change for Strong Sustain-able Consumption: Sustainable Consumption and the Degrowth Economy.” Sustainability: Science Practice and Policy 10 (1): 62–77.
Stam, J. V., and J. Gerdes. 2021. “Draagvlak Voor Een Per-soonlijk Emissiehandelssysteem: Resultaten van Een Vragenlijstonderzoek.” https://repository.tudelft.nl/is-landora/object/uuid%3Ada75e381-d64f-45d3-ab34-4e8bc691ecc3.
Starkey, Richard. 2012. “Personal Carbon Trading: A Critical Survey: Part 1: Equity.” Ecological Economics: The Journal of the International Society for Ecological Economics 73 (January): 7–18.
Statista. 2021a. “Global Waste Trade.” Statista. Pub-lished May 27, 2021. https://www.statista.com/top-ics/7943/global-waste-trade/.
———. 2021b. “Value of COVID-19 Stimulus Packages in the G20 as Share of GDP 2021.” Statista. Published May 20, 2021. https://www.statista.com/statistics/1107572/covid-19-value-g20-stimulus-packages-share-gdp/.
Steen-Olsen, Kjartan, Anne Owen, Edgar G. Hertwich, and Manfred Lenzen. 2014. “Effects of Sector Aggrega-tion on CO2 Multipliers in Multiregional Input–Output Analyses.” Economic Systems Research 26 (3): 284–302.
Steffen, Will, Katherine Richardson, Johan Rockström, Sarah E. Cornell, Ingo Fetzer, Elena M. Bennett, Reinette Biggs, et al. 2015. “Sustainability. Planetary Boundaries: Guiding Human Development on a Changing Planet.” Science 347 (6223): 1259855.
Stenberg, Karin, Henrik Axelson, Peter Sheehan, Ian Anderson, A. Metin Gülmezoglu, Marleen Temmerman, Elizabeth Mason, et al. 2014. “Advancing Social and Eco-nomic Development by Investing in Women’s and Chil-dren’s Health: A New Global Investment Framework.” The Lancet 383 (9925): 1333–54.

141
ReferencesSection I–V
Stephan, André, Robert H. Crawford, and Kristel de Myt-tenaere. 2013. “Multi-Scale Life Cycle Energy Analysis of a Low-Density Suburban Neighbourhood in Melbourne, Australia.” Building and Environment 68 (October): 35–49.
Stoddard, Isak, Kevin Anderson, Stuart Capstick, Wim Carton, Joanna Depledge, Keri Facer, Clair Gough, et al. 2021. “Three Decades of Climate Mitigation: Why Hav-en’t We Bent the Global Emissions Curve?” Annual Re-view of Environment and Resources, October. https://doi.org/10.1146/annurev-environ-012220-011104.
Sustainable Consumption Roundtable. 2006. “I Will If You Will: Towards Sustainable Consumption.” Sustaina-ble Development Commission. https://research-repository.st-andrews.ac.uk/handle/10023/2312.
Szaszi, Barnabas, Anna Palinkas, Bence Palfi, Aba Szol-losi, and Balazs Aczel. 2018. “A Systematic Scoping Re-view of the Choice Architecture Movement: Toward Un-derstanding When and Why Nudges Work.” Journal of Behavioral Decision Making 31 (3): 355–66.
Taylor, Steven. 2020. “Anxiety Disorders, Climate Change, and the Challenges Ahead: Introduction to the Special Issue.” Journal of Anxiety Disorders 76 (Decem-ber): 102313.
Terlau, Wiltrud, and Darya Hirsch. 2015. “Sustainable Consumption and the Attitude-Behaviour-Gap Phe-nomenon - Causes and Measurements Towards a Sus-tainable Development.” International Journal on Food Sys-tem Dynamics 6 (3): 159–74.
The Social Guarantee. n.d. “Examples.” The Social Guar-antee. https://www.socialguarantee.org/examples. Ac-cessed September 3, 2021.
Thiagarajah, Krisha, and Victoria M. Getty. 2013. “Im-pact on Plate Waste of Switching from a Tray to a Tray-less Delivery System in a University Dining Hall and Em-ployee Response to the Switch.” Journal of the Academy of Nutrition and Dietetics 113 (1): 141–45.
Transport for London. n.d. “Congestion Charge.” Trans-port for London. n.d. https://tfl.gov.uk/modes/driving/congestion-charge.
Tukker, Arnold, Maurie J. Cohen, Klaus Hubacek, and Oksana Mont. 2010. “The Impacts of Household Con-sumption and Options for Change.” Journal of Industrial Ecology 14 (1): 13–30.
Tukker, Arnold, Gjalt Huppes, Jeroen Guinée, Reinout Heijungs, A. de Koning, Lauran Oers, Sangwon Suh, et al. 2006. “Environmental Impact of Products (EIPRO) Analysis of the Life Cycle Environmental Impacts Re-lated to the Final Consumption of the EU-25.” Technical Report Series, EUR 22284 EN, 1 - 136 (2006), January.
UNCTAD United Nations Conference on Trade and De-velopment. 2021. “A European Union Carbon Border Adjustment Mechanism: Implications for Developing Countries,” July. https://unctad.org/system/files/offi-cial-document/osginf2021d2_en.pdf.
UNEP. 2016. The Emissions Gap Report 2016. Nairobi: Unit-ed Nations Environment Programme.
———. 2017. “The Emission Gap Report 2017.” Nairobi: United Nations Environment Programme.
———. 2018. The Emissions Gap Report 2018. Nairobi: Unit-ed Nations Environment Programme.
———. 2020. Emissions Gap Report 2020. Nairobi: United Nations Environment Programme.
UNICEF. 2021. The Climate Crisis Is a Child Rights Crisis: In-troducing the Children’s Climate Risk Index. New York: Unit-ed Nations Children’s Fund.
United Nations. 1992. “United Nations Framework Convention on Climate Change.” https://unfccc.int/re-source/docs/convkp/conveng.pdf.
———. 2015. “Paris Agreement.” https://unfccc.int/sites/default/files/english_paris_agreement.pdf.
———. 2017. “World Population Prospects: The 2017 Revision.” June 21, 2017. https://www.un.org/devel-opment/desa/publications/world-population-pros-pects-the-2017-revision.html.
———. 2018. “Household Consumption Patterns and the Sectoral Composition of Growing Economies: A Review of the Interlinkages.” Inclusive and Sustainable Industri-al Development Working Paper Series. https://www.unido.org/api/opentext/documents/download/10166980/un-ido-file-10166980.
———. 2020. “World Economic Situation and Prospects. Statistical Annex.” https://www.un.org/development/desa/dpad/wp-content/uploads/sites/45/WESP2020_Annex.pdf.
Unruh, Gregory C. 2000. “Understanding Carbon Lock-In.” Energy Policy 28 (12): 817–30.
142
ReferencesSection I–V
Vadén, T., V. Lähde, A. Majava, P. Järvensivu, T. Toiva-nen, and J. T. Eronen. 2021. “Raising the Bar: On the Type, Size and Timeline of a ‘Successful’ Decoupling.” Environmental Politics 30 (3): 462–76.
Vandenbergh, Michael P., Jack Barkenbus, and Jona-than M. Gilligan. 2008. “Individual Carbon Emissions: The Low-Hanging Fruit.” https://papers.ssrn.com/ab-stract=1161143.
Verbist, Gerlinde, Michael Förster, and Maria Vaalavuo. 2012. “The Impact of Publicly Provided Services on the Distribution of Resources: Review of New Results and Methods,” January.
Victoria Transport Public Institute. n.d. “Victoria Trans-port Policy Institute: Online TDM Encyclopedia.” Ac-cessed September 4, 2021. https://www.vtpi.org/tdm/.
Vita, Gibran, Diana Ivanova, Adina Dumitru, Ricar-do García-Mira, Giuseppe Carrus, Konstantin Stadler, Karen Krause, Richard Wood, and Edgar G. Hertwich. 2020. “Happier with Less? Members of European Envi-ronmental Grassroots Initiatives Reconcile Lower Car-bon Footprints with Higher Life Satisfaction and Income Increases.” Energy Research & Social Science 60 (February): 101329.
Vital Water Graphics. 2009. “Increasing Price with Vol-ume.” 2009. https://www.grida.no/resources/5598.
VR Group Ltd. 2020. Vuosiraportti 2020 [Responsibili-ty Report].” Published April 1, 2020. https://2020.vr-groupraportti.fi/fi/vuosiraportti-2020/.
Vuuren, Detlef P. van, Elke Stehfest, David E. H. Gernaat, Maarten van den Berg, David L. Bijl, Harmen Sytze de Boer, Vassilis Daioglou, et al. 2018. “Alternative Pathways to the 1.5 °C Target Reduce the Need for Negative Emis-sion Technologies.” Nature Climate Change 8 (5): 391–97.
Wadud, Zia, and Phani Kumar Chintakayala. 2019. “Per-sonal Carbon Trading: Trade-off and Complementari-ty Between In-Home and Transport Related Emissions Reduction.” Ecological Economics: The Journal of the Inter-national Society for Ecological Economics 156 (C): 397–408.
Wahl, Daniel Christian. 2018. “Sustainability Is Not Enough: We Need Regenerative Cultures.” Published May 23, 2018. https://www.resilience.org/stories/2018-05-23/sustainability-is-not-enough-we-need-regenera-tive-cultures/.
WEAll. 2020. “Home - Wellbeing Economy Alliance.” Published June 11, 2020. https://weall.org/.
Webb, Gary, Alex Hendry, Bruce Armstrong, Robyn Mc-Dermott, Boyd Swinburn, and Egger Garry. 2014. “Ex-ploring the Effects of Personal Carbon Trading (PCT) System on Carbon Emission and Health Issues: A Pre-liminary Study on the Norfolk Island.” The International Technology Management Review 4 (1): 1.
Webb, Gary James. 2018. “Assessment of Person-al Carbon Goals for Reducing Obesity-Related Be-haviour and Carbon Emissions in a Remote Island Community : The Norfolk Island Carbon and Health Evaluation Study.” Southern Cross University. https://researchportal.scu.edu.au/view/delivery/61SCU_INST/1266812890002368/1367376100002368.
Webb, Gary James, and Garry Egger. 2014. “Obesity and Climate Change: Can We Link the Two and Can We Deal With Both Together?” American Journal of Lifestyle Medi-cine 8 (3): 200–204.
Weizsacker, E. von, K. Hargroves, M. Smith, C. Desha, and P. Stasinopoulos. 2010. Factor Five: Transforming the Global Economy through 80% Improvements in Resource Pro-ductivity. London: Earthscan.
Wernet, Gregor, Christian Bauer, Bernhard Steubing, Jürgen Reinhard, Emilia Moreno-Ruiz, and Bo Weide-ma. 2016. “The Ecoinvent Database Version 3 (part I): Overview and Methodology.” International Journal of Life Cycle Assessment 21 (9): 1218–30.
Weston, Phoebe, and Jonathan Watts. 2021. “Highest Recorded Temperature of 48.8C in Europe Apparent-ly Logged in Sicily.” The Guardian. Published August 11, 2021. http://www.theguardian.com/world/2021/aug/11/sicily-logs-488c-temperature-possibly-highest-ev-er-recorded-for-europe.
Weterings, Rapm, and J. B. Opschoor. 1992. “The Envi-ronmental Capacity as a Challenge to Technology Devel-opment.” RMNO (Advisory Council for Research on Nature and Environment), Rijswijk, The Netherlands.
White, Vicki, and Joshua Thumim. 2009. “Moderating the Distributional Impacts of Personal Carbon Trad-ing.” Centre for Sustainable Energy. https://www.cse.org.uk/downloads/reports-and-publications/policy/en-ergy-justice/Moderating_the_distributional_impacts_of_PCT_aug09.pdf.
Wilde, Lawrence. 2013. Global Solidarity. 1st ed. Edin-burgh University Press.

143
ReferencesSection I–V
Wilkinson, Richard, and Kate Pickett. 2009. The Spirit Level: Why Greater Equality Makes Societies Stronger. Pen-guing Books, UK.
———. 2011. “The Spirit Level: Why Greater Equality Makes Society Stronger.” Review of Social Economy 69 (2): 239–43.
Willett, Walter, Johan Rockström, Brent Loken, Marco Springmann, Tim Lang, Sonja Vermeulen, Tara Garnett, et al. 2019. “Food in the Anthropocene: The EAT–Lan-cet Commission on Healthy Diets from Sustainable Food Systems.” The Lancet 393 (10170): 447–92.
Williams, Jo. 2008. “Predicting an American Future for Cohousing.” Futures 40 (3): 268–86.
Wilson, Alex, and Jessica Boehland. 2008. “Small Is Beautiful: U.S. House Size, Resource Use, and the En-vironment.” Journal of Industrial Ecology 9 (1-2): 277–87.
Wilson, C., A. Grubler, N. Bento, S. Healey, S. De Stercke, and C. Zimm. 2020. “Granular Technologies to Acceler-ate Decarbonization.” Science, April.
Woods, Hiatt. 2020. “How Billionaires Saw Their Net Worth Increase by Half a Trillion Dollars Dur-ing the Pandemic.” Business Insider. Published October 30, 2020. https://www.businessinsider.com/billion-aires-net-worth-increases-coronavirus-pandem-ic-2020-7.
World Bank Group. 2020. “Poverty & Equity Brief. India.” Published April 2020. https://databank.worldbank.org/data/download/poverty/33EF03BB-9722-4AE2-ABC7-AA2972D68AFE/Global_POVEQ_IND.pdf.
WSP. 2021. “Personal Carbon Tracking System.” WSP. Published June 29, 2021. https://www.wsp.com/en-GL/projects/personal-carbon-tracking-system.
Wu, Judy, Gaelen Snell, and Hasina Samji. 2020. “Cli-mate Anxiety in Young People: A Call to Action.” The Lan-cet Planetary Health 4 (10): e435–36.
Wynes, Seth, and Kimberly A. Nicholas. 2017. “The Cli-mate Mitigation Gap: Education and Government Rec-ommendations Miss the Most Effective Individual Ac-tions.” Environmental Research Letters: ERL [Web Site] 12 (7): 074024.
X-Rates. 2021. “Currency Exchange Table (US Dollar - USD).” X-Rates. Published July 16, 2021. https://ww-w.x-rates.com/table/?from=USD&amount=1. Accessed September 1, 2021.
Xu, Chi, Timothy A. Kohler, Timothy M. Lenton, Jens-Christian Svenning, and Marten Scheffer. 2020. “Future of the Human Climate Niche.” Proceedings of the National Academy of Sciences of the United States of America 117 (21): 11350–55.
Zhang, Kai, Stuart Batterman, and François Dion. 2011. “Vehicle Emissions in Congestion: Comparison of Work Zone, Rush Hour and Free-Flow Conditions.” Atmospher-ic Environment 45 (11): 1929–39.
Zweiniger-Bargielowska, Ina. 2000. Austerity in Britain: Rationing, Controls, and Consumption, 1939-1955. 1st ed. Oxford University Press.

144
Annex B
Annex B. Country-specific Results
B.1. Country-specific lifestyle carbon footprints: major components and hotspots
Country-specific lifestyle carbon footprints are com-pared for the three domains—food, housing and per-sonal transport—as they contribute the most (81±10%) to total lifestyle carbon footprints in countries studied. Other domains (consumer goods and leisure and servic-es) generally account for a small proportion of the total lifestyle carbon footprint (10±5%, 8±6%, respectively), with Canada and Finland as an exception, and are com-pared for all countries but with less attention due to the limited data for some of the case countries and smaller impact on total lifestyle carbon footprint.
1. Food
Canada – The average Canadian has a food carbon footprint of 2,270 kg (CO₂e per year), of which meat products comprise 61%. The highest contributor to this is beef, which, despite contributing only one-third of the total meat consumption, has a high car-bon intensity contributing 72% to the footprint of meat. Dairy products are the second highest contrib-utor to the footprint (15%), mostly due to the high share of cheese and milk consumption. Beverages produce nearly a tenth (8%) of the footprint due to the relatively high total consumption (18% of the to-tal food consumption in kilograms) of beverages and the relatively high carbon-intensity of coffee and beer. Consumption of cereals, vegetables, beans and nuts, fruits, and other food products account for nearly half (49%) of the physical amount of food consumed but the share of the total footprint is just 13%. On the contrary, animal products represent only one third of the physical amounts consumed but have a huge im-pact (79%) on the carbon footprint, much higher than plant-based foodstuffs.
Finland – The food carbon footprint of the average Finn is 1,830 kg (CO₂e per year). The composition of this foot-print follows the same pattern as in Canada. For the Finns too, meat products account for over one third (37%) of the footprint due to the high carbon-intensi-ty of meat. Beef consumption accounts for only a quar-ter (24%) of the total meat consumption compared to pork (39%) and chicken (33%), but the intensity for pork and chicken is notably lower. Another third (30%) of the footprint comes from dairy products due to the high consumption of cheese and milk (14% and 60% of the dairy consumption, respectively). Cheese especially has a high carbon intensity compared to other dairy prod-ucts. Beverages represent a seventh of the footprint and total consumption (12% and 14%, respectively) due to the consumption of high intensity coffee and beer. The summed share of cereals, vegetables and fruits account for nearly half (44%) of the total consumption but they comprise 9% of the footprint. Similar to Canada, animal products have the highest impact on food carbon foot-print despite the lower share of consumption.
United Kingdom – The average person’s food footprint in the United Kingdom is 1,590 kg (CO₂e per year). For-ty-four percent of the footprint is meat, due to consump-tion of high intensity beef, which contributes 60% of the meat footprint. Consumption of pork and other meat products and chicken is higher (38% and 35%, respec-tively), but carbon intensity for both is three to eight times lower compared to beef. Dairy consumption in the United Kingdom is high, and this contributes almost a quarter (23%) to the food footprint. Eggs and fish con-tribute only 2–3% of the food footprint, likewise the con-sumption amounts. Division between animal products and cereals, vegetables, beans and nuts, and fruits fol-lows the same pattern as in Canada and Finland—con-sumption of plant-based products is much higher but the impact on the food footprint is notably lower com-pared to meat products.

145
Annex B
Japan – The food carbon footprint of the average Japa-nese is 1,410 kg (CO₂e per year). For the Japanese too, meat products are a key contributor at nearly a quarter of this footprint (24%) due to their high carbon intensi-ty, especially beef. Thirteen percent of the footprint is caused by dairy products, the carbon intensity of which highly varies (e.g., butter is 13 times higher than milk). Fish consumption causes 7% of the footprint, and has a relatively high intensity. Cereals represent nearly a fifth of the footprint, and beverages and vegetables a tenth each, but their carbon intensity is relatively low. The carbon intensity of cereals is higher in Japan because of the higher intensity of rice than other cereal crops. Alco-holic beverages are over six times more carbon-intense than non-alcoholic beverages. The intensity of “Others” is also relatively high due to processed or lightweight products such as oils and spices.
China – The average Chinese has an annual food foot-print of 1,320 kg (CO₂e per year). Similar to the previ-ous countries, the impact of meat consumption is high, at 39% of an average person’s food footprint, with one-third (33%) of this caused by high intensity beef. Pork is responsible for the highest share (63%) of meat con-sumption, but with relatively lower carbon intensity the impact remains low. Cereals contribute a fifth (20%) to both footprint and consumption amount, due to the rel-atively high carbon intensity and consumption of rice. Although the share of vegetables of the total consump-tion amount is nearly half (46%), they only account for a seventh (14%) of the footprint, due to the low carbon intensity. Other plant-based products (beans and nuts, and fruits) account for 6%. Fish accounts for 8% of the food footprint and eggs even less (4%). Consumption of dairy products is very low, compared to previously in-troduced high-income countries and their share is only 3% of the footprint.
South Africa – The average South African has a food foot-print of 1,700 kg (CO₂e per year). Again, animal-based products account for only a quarter (25%) of the to-tal consumption but they contribute over three-quar-ters (77%) to the total footprint. Meat in particular con-tributes heavily to the food footprint (72%), due to the relatively high share of beef (30%) of the total meat consumption and notably carbon intensive livestock farming compared to other countries. Nevertheless, overall meat consumption per capita is relatively mod-erate (65 kg) compared to Canada (157 kg) and Finland (80 kg), for example. Over a third (35%) of the food con-sumption is cereals but they account for just 8% to the food footprint due to their low carbon intensity. Vegeta-bles, beverages, and other products (such as oils) togeth-er account for more than a third (13%, 13% and 11%, respectively) of total consumption but their aggregate
impact to the total food footprint is only 14%, due to the relatively low carbon intensity, especially compared to beef.
Turkey – The food carbon footprint for an average Turk is 1,220 kg (CO₂e per year). As for all industrialised coun-tries above, meat consumption is responsible for the greatest share (33%) of the footprint. Total meat con-sumption is notably lower compared to previous coun-tries but the share of beef in total meat consumption is higher, nearly half (45%). Also the share of chicken consumption is higher (51%) compared to previous countries, which is explained by the high share (99%) of Muslims (European Commission 2021) that refrain from eating pork. Dairy products have the second larg-est contribution to the footprint (26%). Cereals, vegeta-bles, and other products all contribute approximately one-tenth each to the footprint (12%, 11% and 9%, re-spectively). Vegetables have the highest consumption amount (32%), but have one of the lowest carbon inten-sity together with fruits (less than 0.5 kgCO₂e/kg). Al-so consumption of beverages is very low, so beverages are responsible only for a fraction (2%) of the footprint.
Brazil – The food footprint of the average Brazilian is 1,890 kg (CO₂e per year). For the average Brazilian too, meat products contribute over a half (59%) to the food footprint, though their consumption accounts for be-low a sixth (13%) of the total consumption. Carbon in-tensity of beef is relatively higher in Brazil compared to most other countries due to high intensity livestock farming, similar to South Africa. Plant-based products account nearly half (46%) of the total consumption but only 12% of the footprint. Their carbon intensity is low-er compared to many other countries, for instance due to the self-sufficient production of fruits and many veg-etables (Paulo et al. n.d.). Dairy consumption accounts for 18% of the total consumption and the total amount is quite similar to Finland. Nevertheless, consumption da-ta from Brazil does not distinguish whether consumed milk is used for cheese production or consumed as liq-uids. Therefore the carbon intensity for dairy products remains lower and the consumption amount higher as the data for the share of high intensity cheese consump-tion is not available.
India – The food footprint for an average Indian is one of the lowest, 790 kg (CO₂e per year). The overall small-er consumption and the composition of consumed food products differ from the previous countries. Consump-tion of animal based products account for only 23% of the total consumption and are mainly (92%) dairy prod-ucts. Meat consumption is very low, only 4 kg per per-son. Different consumption habits of food products are due to religious reasons. Approximately 80% of the pop-
146
Annex B
ulation are Hindus (Census India 2011) and eat main-ly vegetarian food. Half of the food consumption is due to cereals and vegetables (34% and 21%, respectively). Cereals are responsible for over a half (54%) of the food footprint due to the high share of carbon-intensive rice consumption.
Indonesia – The average Indonesian has a food foot-print of 800 kg (CO₂e per year). Consumption habits fol-low a similar pattern to India, low consumption of ani-mal products and high share of cereals and vegetables in the diet. Animal-based products account for a third (28%) to the footprint but only one-sixth (12%) to the total consumption. Share of fish product consumption (7%) is one of the highest among the countries and it ac-counts for nearly a seventh (13%) to the food footprint. High consumption of high intensity rice is reflected in the footprint, as cereals account for more than half (52%) of the food footprint.
2. Housing
Canada – The average Canadian lives in housing with a floor space of 58 m² and uses 11,480 kWh of energy per year, which produces an annual footprint of 3,060 kg-CO₂e and intensity of 52 kgCO₂e/m². Over four-fifths of a person’s annual carbon footprint for housing is rep-resented by direct energy consumption (83%), over half of which is other energy, meaning heating. Other en-ergy is mainly (73%) from natural gas, followed by re-newable sources (wood: 19%). High intensity oil prod-ucts account for 6% of the other energy consumption but account for more than one third (34%) of the other energy footprint. Grid electricity is mainly (65%) from renewable sources (hydro, tidal, solar and wind power). Non-renewable grid electricity accounts for the higher share (53%) of the footprint due to the relatively high share (43%) of high intensity coal and petroleum (Gov-ernment of Canada 2017).
Finland – The average Finn lives in housing with a floor space of 41 m² and uses 11,320 kWh of energy, which produces an annual footprint of 1,550 kgCO₂e and an in-tensity of 38 kgCO₂e/m². Heating demand is high due to the long winters and relatively large living space. Elec-tricity accounts for two fifths (38%) of each person’s an-nual housing footprint, including its use as a main heat-ing source (46% of the electricity consumption). Half (52%) of the electricity production comes from renew-able sources, such as hydro, wind and solar power and wood based biomass). District heating covers one-third (30%) of the heating demand and housing footprint. The fuels used for district heating production, from highest to lowest share, are wood and other biomass, coal, peat,
natural gas, oil and waste (Official Statistics of Finland 2020d). Despite the relatively low share (15%) of peat used for district heating production, it is responsible for nearly two-fifths (39%) of the district heating emissions. The share of heat pumps is nearly a tenth (8%) of the total heating demand, but the footprint is relatively low due to the low intensity.
United Kingdom – The average person in the United Kingdom lives in housing with a floor space of 39 m² and uses 7,190 kWh of energy, which gives an annual foot-print of 1,880 kgCO₂e and an intensity of 48 kgCO₂e/m². Four-fifths (80%) of the housing footprint is represent-ed by direct energy consumption of which two thirds (66%) is natural gas. One-fifth (22%) of the direct ener-gy consumption is grid electricity, of which 63% is pro-duced with non-renewable sources (coal, oil, natural gas, and nuclear power). Non-renewable grid electrici-ty accounts for 92% of the housing footprint.
Japan – The average Japanese lives in housing with a floor space of 40m² and uses 4,200 kWh energy per year, which results in an annual footprint of 2,430 kgCO₂e and an intensity of 61 kgCO₂e/m². Nearly four-fifths of a Jap-anese’s annual carbon footprint is represented by direct energy consumption (77%), over half of which is elec-tricity. Grid electricity is mainly (84%) from coal, oil and LNG, with hydropower and other renewables producing only 15% (Agency for Natural Resources and Energy, Ja-pan 2018b). The direct energy supplied to households is comprised equally of electricity and other energy (mainly non-renewables, such as kerosene for heating, and LPG and city gas for cooking and heating), with on-ly 8% from renewables.
China – The average Chinese has a housing floor space of 41 m² and uses 1,870 kWh of energy, which results in an annual footprint of 1,190 kgCO₂e and intensity of 29 kgCO₂e/m². Grid electricity consumption is responsible for the biggest share (48%) of the annual housing foot-print. Twenty-six percent of the grid electricity is pro-duced with renewable sources. Non-renewable sources are mainly fossil fuel-based (71%) and therefore are re-sponsible for the greatest share (98%) of the grid elec-tricity related footprint. Other energy sources used in households are only fossil fuel based—coal, natural gas, and LPG.
South Africa – The average South African lives in hous-ing with a floor space of 23 m² and uses 1,100 kWh of energy, which results in an annual footprint of 1,050 kgCO₂e and intensity of 46 kgCO₂e/m². Three-quarters (76%) of the annual footprint comes from grid electricity consumption that is heavily non-renewable-based: 94% of the electricity-based footprint comes from coal. Over-

147
Annex B
all, the energy demand in South Africa is lower com-pared to the previously introduced countries due to its southern location. Also half (50%) of the other energy consumption is based on non-renewable energy sourc-es, such as coal and oil.
Turkey – The average Turk lives in housing with a floor space of 32 m² and uses 1,890 kWh of energy, which re-sults in an annual footprint of 1,700 kgCO₂e and inten-sity of 52 kg(CO₂e/m². Four-fifths (80%) of a person’s annual carbon footprint is represented by energy con-sumption, over half (54%) of which is other energy than grid electricity. These other energy sources are main-ly (48%) oil products, 31% natural gas and 15% other non-renewable sources such as heat and waste-based energy. Just 6%) comes from renewable sources. Grid electricity is mainly (68%) from coal and natural gas. One-third is from renewables, which is mainly (61%) from hydropower.
Brazil – The average Brazilian lives in housing with a floor space of 28 m²—similar to South Africa—and uses 1,480 kWh of energy, which results in an annual foot-print of 510 kgCO₂e and intensity of 18 kg(CO₂e/m². Over half (58%) of the moderate housing footprint results from the relatively carbon-intense living space. Both grid electricity and other energy consumption contrib-ute approximately a fifth (18% and 20%, respectively) due to low overall consumption and high share of re-newable energy. Over three-fifths (65%) of grid elec-tricity is based on renewable hydropower and the over-all share of renewables of grid electricity is 82%. Other energy consumption is divided quite evenly between renewable wood-based energy (49%) and natural gas (48%), though natural gas contributes 90% to the other energy related footprint.
India – The average Indian lives in housing with a floor space of 10 m² and uses 540 kWh of energy, which re-sults in an annual footprint of 440 kgCO2e and inten-sity of 43 kgCO₂e/m². Nearly half (49%) of the footprint comes from grid electricity due to the high share of coal-based energy and other non-renewable sources. The to-tal consumption of other energy forms is higher but the carbon intensity is lower compared to coal-based ener-gy. LPG and natural gas are the main sources for other energy consumed by households.
Indonesia – The average Indonesian lives in housing with a floor space of 19 m² and uses 1,120 kWh of ener-gy, which results in an annual footprint of 590 kgCO₂e and intensity of 31 kgCO₂e/m². The housing footprint is divided quite evenly between living space, grid electric-ity and other energy consumption (32%, 31% and 24%, respectively). Only 13% of the grid electricity comes
from renewable sources, such as hydropower and ge-othermal sources. Also other energy relies heavily on non-renewable sources (77%), kerosene and LPG being the main energy sources in households.
3. Personal transport
Canada – For the average Canadian, transport con-tributes 35%, or 5,000 kg (CO₂e) of their annual car-bon footprint, nearly three quarters of which is caused by heavy car use (15,500 km) and its high carbon in-tensity. Half (49%) of the car kilometers are travelled by light trucks (including light-duty vehicles, such as pickup trucks and minivans) and half (51%) by regu-lar passenger cars. Canadians also travel a lot by bus (3,400 km, or 15% of the transport demand) and by air (3,100 km, or 14% of the transport demand). Bus transport comprises nearly all (99%) land-based pub-lic transport demand and has the highest carbon in-tensity of all public transportation modes. Air travel has the highest carbon intensity of all travel modes and it contributes the second highest share (21%) to the carbon footprint. Low intensity trains account for less than 1% of the transport demand.
Finland – For the average Finn, transport contributes a third (38%), or 3,650 kg (CO₂e) of their carbon foot-print and they travel 17,500 km in a year. Half (55%) of the footprint results from heavy car use (10,400 km in a year) and 35% from air travel (3,800 km in a year), and their high carbon intensity. Land-based public trans-portation accounts for 12% (or 2,140 km) of the total transport demand—over half (56%) of which is bus, two-fifths trains (38%) and less than a tenth (7%) tram or metro. Passenger trains, trams, and metros run mainly on renewable energy (VR Group Ltd. 2020), which re-sults in a very low intensity of 0.01 kgCO₂e per km. They also travel 690 km, or 1.9 km per day, on motorcycles, scooters, snowmobiles, quad bikes, and so on, and cycle and walk little (260 km and 350 km, respectively, or less than 1km per day for both).
United Kingdom – Average person’s transport-related footprint in the United Kingdom is nearly two-fifths (38%, or 3,250 kgCO₂e) of the annual lifestyle carbon footprint. Half of the footprint is due to the high share of high intensity car and air travel (50% and 44%, re-spectively). Annual transport demand is 14,700 km per person, of which car travel comprises 55%, or 8,100 km, and air travel 29%, or 4,200 km. High carbon intensity of car transport is due to the high share of fossil-fuel use and low occupancy rate. The share of public trans-portation of the total transport demand is low, only 11% (1,700 km). Share of trains is 70% (1,200 km), of which

148
Annex B
85% is surface rail and 15% is underground. Cycling ac-counts for only 90 km or 0.25 km a day and walking 490 km or 1.3 km a day.
Japan – For the average Japanese, transport contributes nearly a quarter, or 1,970 (kgCO₂e) of their carbon foot-print and they travel 11,000 km a year, including walk-ing. Nearly two-thirds of their transport footprint comes from cars, which, while representing less than half their annual km travelled (5,000 km), incurs a high carbon in-tensity, partly due to the low occupancy rate, high share of fossil-fuel use, and low use of electric vehicles. Tax-is have even higher carbon intensity due to their rela-tively low occupancy rate. Air travel contributes a little over a third of the carbon footprint, which while less than cars adds up due to relatively long trips (approx. 600 km domestic, 1,000 km international) and high carbon in-tensity. Trains are also used a lot—3,100 of the 3,600 km land-based public transport demand (with the remain-der being buses)—and have a very low carbon intensity of 0.02 kg per km. Cycling accounts for only 270 km, or 0.7 km a day.
China – For the average Chinese, transport contributes 1,200 kg (CO₂e), with a total annual transport demand of 9,300 km per person. Almost two fifth (37%) of the footprint is due to car use and nearly a quarter (23%) is due to the heavy use of motorcycles. The share of public transportation is 22%, over two-thirds (69%) of which is bus transport. Air travel is the third largest contribu-tor to the footprint (17%). The transport demand for air travel (600 km) is notably lower than for car, motorcy-cle and public transportation (2,300 km, 1,700 km, 3,100 km, respectively).
South Africa – For the average South African, transport contributes a quarter (25%, or 1,200 kgCO₂e) to the total lifestyle carbon footprint. South Africans travel an aver-age of 7,200 km a year, mainly by public transportation (50% of the annual demand) and by car (42%). Public transportation is divided between train and bus trans-port (65% and 35%, respectively). They both contribute approximately a sixth (15% and 12%, respectively) to the transport footprint. Cars account for 60% of the an-nual transport footprint due to high share of fossil fuel use and low occupancy rate. Air travel accounts for only 7% of transport demand.
Turkey – The average Turk has a transport footprint of 1,000 kg (CO₂e), half (52%) of which comes from cars, due to their low occupancy rate, low share of electric cars, and high transport demand (55%, or 2,400 km of the total transport demand). Air travel accounts for 35% of the annual footprint and 23% (1,000 km) of annual transport demand (4,400 km). Land-based public trans-
portation contributes 7% (310 km) of annual transport demand. Instead, motorcycles account for 15% (640 km) of the annual transport demand and a tenth of the total annual transport footprint.
Brazil – For the average Brazilian, transport contributes 20%, or 640 kg (CO₂e) of their carbon footprint and they travel 4,600 km in a year. Land-based public transpor-tation has the highest transport demand (48%, or 2,200 km), followed by cars (25%, or 1,200 km) and air travel (14%, or 670 km). Carbon-intensive flying contributes the highest share (36%) to the transport footprint, fol-lowed by bus (33%) due to the heavy use of bus trans-port. Cars account for only 23% of the transport foot-print due to one of the highest share of flex fuel cars (Empresa de Pesquisa Energética - EPE 2013) within the case countries. Cycling accounts for only 20 km or 0.06 km a day and walking 360 km or 1.0 km a day.
India – Mobility contributes over a half (58%), or 1,730 kg (CO₂e) of a average person’s footprint in India, due to the high transport demand (16,400 km) and high share of relatively carbon intense travel by motorcycle and car (73% and 15% of the total transport demand, respectively). Motorcycling (including two, three and four wheelers) produce over three-fifths (68%) and car driving one-fifth (20%) of the transport footprint. Use of public transportation is low, only a tenth (10%) of the transport demand.
Indonesia – For the average Indonesian, transport con-tributes a quarter (26%), or 570 kg (CO₂e) of their annual footprint. Transport demand is relatively low (3,300 km) and is mainly fulfilled by motorcycle (60%, or 2,000 km), followed by public transportation (18%, or 590 km) and car (14%, or 450 km). Motorcycling is also the greatest contributor to the transport footprint, as it covers over half (55%) of it. Both cars and airplanes contribute a fifth (18%) to the footprint due to their high carbon intensity.
4. Other domains (consumer goods, leisure, and services)
Canada – Consumer goods comprise 18% (2,510 kg-CO₂e) of the annual lifestyle carbon footprint of the av-erage Canadian. Clothes account for the greatest share (37%, 930 kg) of the consumer goods footprint, fol-lowed by furniture/room covering (17%) due to over-all high consumer spending but also due to the highest carbon intensities (0.91 and 0.88 kgCO₂e/USD, respec-tively) among consumer goods. The average per-capi-ta consumer spending for other goods, such as durable goods and jewelry covers 16% of the overall consum-er goods related spendings, but the carbon intensity

149
Annex B
is nearly one-fifth smaller compared to clothes’ car-bon intensity.
Leisure services consumed outside the home ac-count for 680 kg (CO₂e per capita), or 5% of the average person’s lifestyle carbon footprint in Canada. Other lei-sure services, such as games of chance and pets, are the largest contributor at 55% (380 kgCO₂e) to the leisure related footprint.
Services account for 5% (720 kg) of the total lifestyle carbon footprint. Finance and insurance comprise over half of the services-related consumption and carbon footprint (62%).
Finland – The carbon footprint of consumer goods is 1,410 kg (CO₂e) for an average Finn, which is 15% of Finland’s average lifestyle carbon footprint. Clothes and furniture/room covering account for the greatest shares (37% and 26%, respectively) of the consumer goods footprint, followed by other goods (18%, or 250 kg), electronics (11%, or 160 kg) and sanitation/medi-cine (7%, or 100 kg). Appliances are a minor contribu-tor (2%, or 30 kg).
Leisure services account for 6% (540 kgCO₂e) of the lifestyle carbon footprint, of which over half (55%) comes from the hotels and restaurant services. Nearly one-fourth (23%) of the footprint is related to cultural services and 11% each to sport services and summer cottages (constructed space, electricity, and other en-ergy consumption).
Services account for 690 kg (CO₂e), which is 7% of the average annual lifestyle carbon footprint. Welfare/medical and finance/insurance services, account for the greatest share (28% each) of the footprint and over half (29% and 28%, respectively) of total consumer spend-ing. Other services, including such as postal and pub-lishing services, account for 41% of the footprint, and 19% of total consumer spending.
Though the average per-capita spending for con-sumer goods is less than for services, the overall foot-print is highest among all three domains, reflecting relatively high carbon intensity. The average carbon in-tensity of leisure and services are nearly half (0.17–0.21 kgCO₂e/USD) of the consumer goods related intensity (0.40 kgCO₂e/USD).
United Kingdom – Consumer goods, leisure, and servic-es together account for 21% (1,750 kgCO₂e) of the av-erage person’s annual lifestyle carbon footprint. Aver-age per-capita consumer spending is distributed quite evenly between all three domains: 34% for consumer goods, 29% for leisure, and 37% for services.
Of consumer goods, clothing is the largest contrib-utor to this footprint at 360 kg, or 37%, followed by the other goods (including such as paints, paper products, rubber, plastic and metal products) at 260 kg, or 27%.
Electronics and sanitation/medicine cover 17% and 14% respectively.
Leisure services cover 4% of the lifestyle carbon foot-print. Nearly half (49%) of the leisure footprint is related to the high consumption of food and beverage serving services. Remaining footprint and consumption is dis-tributed relatively evenly between cultural, sport, and other leisure services (14–22% and 11–18%, respec-tively).
The footprint of services is similar to leisure, as it accounts for 5% of the lifestyle carbon footprint. Thir-ty-five percent of the leisure footprint comes from the high consumption of other services (including such as veterinary, other personal and postal services), followed by finance/insurance (29%) and education and welfare/medical services (14% for each). Average per-capita consumer spending follows a similar pattern, reflect-ing relatively even carbon intensities within the service domain (0.09–0.11 kgCO₂e/USD). Overall, the carbon in-tensity of leisure and services are more than half (0.09–0.10 kgCO₂e/USD) of the consumer goods related inten-sity (0.23 kgCO₂e/USD).
Japan – Consumer goods account for 1,030 kg (CO₂e/capita), or 13% of the average person’s lifestyle carbon footprint in Japan. Other goods (such as tobacco, jew-elry, batteries, miscellaneous small household goods, and decoratives) is the largest contributor to footprint at 240 kg, or 23%, with clothing and electronics second at 220 kg and 200 kg, respectively. Home appliances and sanitation/medicine contribute 12% (or 120 kg for both) and furniture/room covering is responsible for only 4% of the footprint.
Leisure services consumed outside the home ac-count for 580 kg (CO₂e/capita) of the lifestyle carbon footprint, with 43% coming from restaurants and 22% coming from hotels. The monetary equivalent carbon intensity for hotel and restaurant services, including the footprint induced from food ingredients, is approx-imately 0.35 kgCO₂e/USD, the highest among leisure items. Cultural services account for 22% (130 kg) of the footprint and the rest of the 70 kg footprint is account-ed for by sports, and outdoor leisure including movies, theatre plays, sports facilities, and outdoor parks, which have relatively low carbon intensities per monetary val-ue of under 0.27 kg per USD. Access to these leisure fa-cilities is accounted for in the transport domain.
China – Detailed data or product lists concerning total amounts of individual products and services was not available for China. Lifestyle carbon footprint estimated for consumer goods, leisure, and services are based on average per-capita consumer spending of aggregated product/service groups by the National Bureau of Sta-tistics of China (2020).

150
Annex B
Consumer goods account for 8% (410 kgCO₂e) of the average Chinese’s lifestyle carbon footprint. Consum-er goods are divided between clothes and household goods, which contribute 61% and 39% to the footprint, respectively. The leisure related footprint is just 3% of the lifestyle carbon footprint and only includes cul-tural and recreational leisure services. Over half (58%) of the service related footprint is due to welfare/medi-cal services. The rest is divided between other educa-tion and other services (20% and 23%, respectively). The average per-capita consumer spending of servic-es follows the same pattern as the footprint: 47% to welfare/medical services, 31% to education, and 22% to other services.
South Africa – Consumer goods, leisure, and servic-es together account for 19% (940 kgCO₂e) of the av-erage person’s annual carbon footprint. Despite the relatively small per-capita consumer spending, con-sumer goods have the highest impact on the footprint (15%) due to high average carbon intensity (3.17 kg-CO₂e/USD) compared to leisure and services (0.63 kgCO₂e/USD and 0.29 kgCO₂e/USD, respectively). Clothing accounts for the largest share of the aver-age per-capita consumer spending and carbon foot-print (42% and 68%, respectively) in the domain of consumer goods.
Leisure accounts for only a fraction (1%) of the total footprint. Two-fifths (41%) of the leisure footprint is re-lated to the consumption of cultural services. Services have the highest per-capita consumer spending but due to overall low carbon intensity services are responsible for only 3% of the lifestyle footprint.
Turkey – Consumer goods account for 630 kg (CO₂e), or 13% of the average person’s annual carbon foot-print. The average per-capita consumer spending of consumer goods is quite evenly divided between fur-niture/room covering (34%), other goods (33%), and clothes (32%). Furnishing/room covering has the highest carbon intensity (0.70 kgCO₂e/USD) and it ac-counts for the highest share (49%) of the consumer goods related footprint.
Leisure and services each account for less than tenth (6% and 3%, respectively) of the total carbon footprint. Over half (59%) of the leisure related consumption comes from hotels and restaurants and the rest (41%) from cultural services. Hotels and restaurant services have relatively higher carbon intensity and they account for 75% of the leisure footprint.
Welfare and medical services account for nearly half (45%) of the services footprint due to their high carbon intensity (0.53 kgCO₂e/USD) within the domain and rel-atively high share of the consumer spending (32% of the service related consumption).
Brazil – Consumer goods account for only 130 kg (CO₂e), or 4%, of the average person’s annual carbon footprint. The average Brazilian spends 310 USD on consumer goods and the consumption is mainly focusing on elec-tronics, other goods (such as paper products and pesti-cides), and clothes (32%, 30% and 14% of the total con-sumption, respectively). Electronics and other goods have a relatively low carbon intensity (0.40 and 0.33 kgCO₂e/USD, respectively), but due to their high con-sumption share they account for approximately a quar-ter (29% and 25%, respectively) of the footprint.
Leisure and other services account for only 3% of the annual footprint. The average per-capita consumer spending is relatively similar to consumer goods (280 and 410 USD, respectively), but the carbon intensity is much lower for leisure and services (0.14 kgCO₂e/USD and 0.12 kgCO₂e/USD, respectively), compared to con-sumer goods (0.42 kgCO₂e/USD). Cultural services con-tribute the largest share (77%) to the leisure footprint and other services, such as maintenance services for household appliances and public administration collec-tive services (76%) to the services footprint.
India – Consumer goods, leisure, and services con-tribute less than one percent (0.5%) to the average person’s annual lifestyle carbon footprint. The over-all consumer spending in India is notably lower com-pared to most of the developed countries and the in-tensity per Indian rupee is very low. The consumer spending is mainly focused on clothes (52% of the consumer goods), entertainment services (100% of the leisure services) and welfare and medical servic-es (42% of the services). In addition to low consump-tion, a small part of the consumer goods (2%) are sec-ondhand items, which have a lower carbon intensity compared to those bought as new.
Indonesia – Similar to Brazil, consumer goods, leisure, and services account for only 11% of the average per-son’s carbon footprint in Indonesia. The overall per-cap-ita consumer spending is mainly focused on consum-er goods (46% of total per-capita consumer spending) and services (48%). Durable goods and goods other than clothes are the main contributor (88%) to the consumer goods footprint, followed by clothing (12%). Nearly half (46%) of the service footprint comes from welfare and medical services, and education. Parties and ceremo-nies cover the entire leisure category, with an annual footprint of 10 kg (CO₂e).

151
Annex B
B.2. Supplementary table of results
The detailed estimation results of lifestyle carbon foot-prints in case countries are given in Table B.1. (com-parison among case countries) and Table B.2-11 (coun-try-specific results).
Table B.1. Current annual lifestyle carbon footprint per capita in case countries
Domains Canada Finland United Kingdom Japan China
CF (kg) % CF (kg) % CF (kg) % CF (kg) % CF (kg) %
Food 2,270 16% 1,830 19% 1,590 19% 1,400 17% 1,330 27%
Housing 3,050 21% 1,570 16% 1,890 22% 2,430 30% 1,190 24%
Transport 4,990 35% 3,650 38% 3,250 38% 1,970 24% 1,200 24%
Total (3 domains) 10,310 73% 7,050 73% 6,730 79% 5,800 72% 3,720 75%
Consumer goods 2,510 18% 1,410 15% 970 11% 1,030 13% 410 8%
Total (4 domains) 12,820 90% 8,460 87% 7,700 91% 6,830 85% 4,130 83%
Other (leisure & services) 1,390 10% 1,240 13% 770 9% 1,230 15% 840 17%
Total (all domains) 14,220 100% 9,700 100% 8,470 100% 8,060 100% 4,970 100%
Domains South Africa Turkey Brazil India Indonesia
CF (kg) % CF (kg) % CF (kg) % CF (kg) % CF (kg) %
Food 1,710 35% 1,210 25% 1,880 58% 790 27% 800 36%
Housing 1,050 21% 1,690 35% 500 15% 430 15% 590 27%
Transport 1,200 24% 1,010 21% 640 20% 1,730 58% 570 26%
Total (3 domains) 3,960 81% 3,910 80% 3,030 93% 2,950 100% 1,960 89%
Consumer goods 730 15% 630 13% 130 4% 10 0.5% 140 6%
Total (4 domains) 4,690 96% 4,540 93% 3,160 97% 2,960 100% 2,100 95%
Other (leisure & services) 210 4% 320 7% 90 3% 3 0.1% 100 5%
Total (all domains) 4,890 100% 4,860 100% 3,240 100% 2,960 100% 2,200 100%

152
Annex B
Table B.2. Current annual lifestyle carbon footprint per capita in Canada (rounded values)
Domains and components CF (kg-CO₂e) CF (%) Amount (total) Amount (%)Food 2,270 16% 910 kg Cereals 60 3% 70 kg 8%Vegetables (incl. potatoes) 70 3% 150 kg 17%Beans/nuts 10 0.5% 10 kg 1%Dairy 340 15% 110 kg 12%Eggs 40 2% 20 kg 2%Fish 20 1% 10 kg 1%Meat 1,390 61% 160 kg 18%Fruits 40 2% 130 kg 14%Beverages 190 8% 160 kg 18%Other 110 5% 90 kg 10%Housing 3,050 21% 58 m² Construction/maintenance 520 17% 58 m2 Electricity 1,450 47% 4,610 kWh Renewable grid electricity 680 47% 3,010 kWh 65% Non-renewable grid electricity 760 52% 9,20 kWh 20% Nuclear grid electricity 10 1% 680 kWh 15%Other energy 1,070 35% 6,870 kWh Oil 360 34% 420 kWh 6% Gas 540 51% 5,010 kWh 73% Other (non-renewable) 150 14% 140 kWh 2% Other (renewable) 10 1% 1,300 kWh 19%Water consumption 20 1% 80 m3 Transport 4,990 35% 22,180 km Airplane 1,060 21% 3,100 km 14%Car 3,540 71% 15,540 km 70%Train 5 0.1% 40 km >0.5%Bus 370 8% 3,390 km 15%Motorcycle 20 >0.5% 100 km >0.5%Consumer goods 2,510 18% 4,810 CAD Appliances 390 16% 1,080 CAD 22%Electronics 110 4% 400 CAD 8%Furniture/room covering 430 17% 640 CAD 13%Clothes 930 37% 1,350 CAD 28%Sanitation/medicine 0 0.1% 20 CAD >0.5%Hobby 220 9% 550 CAD 11%Other goods 410 16% 700 CAD 14%Repair 30 1% 70 CAD 2%Leisure 680 5% 1,420 CAD Hotels/travels 160 24% 360 CAD 26%Cultural 40 6% 120 CAD 9%Sports 100 15% 340 CAD 24%Other leisure 380 55% 590 CAD 42%Services 730 5% 5,660 CAD Education 20 3% 550 CAD 10%Welfare/medical 110 15% 1,110 CAD 20%Finance/insurance 450 62% 2,790 CAD 49%Communication 70 9% 660 CAD 12%Other services 80 11% 550 CAD 10%Sub-total 3 domain 10,310 73% Goods 2,510 18% 4,820 CAD Leisure 680 5% 1,420 CAD Services 720 5% 5,660 CAD Grand Total (6 domains) 14,220 100%

153
Annex B
Table B.3. Current annual lifestyle carbon footprint per capita in Finland (rounded values)
Domains and components CF (kg-CO₂e) CF (%) Amount (total) Amount (%)Food 1,830 19% 790 kg Cereals 70 4% 80 kg 10%Vegetables (incl. potatoes) 50 3% 130 kg 16%Beans/nuts 10 0.5% 3 kg >0.5%Dairy 550 30% 180 kg 22%Eggs 30 2% 10 kg 2%Fish 40 2% 15 kg 2%Meat 680 37% 80 kg 10%Fruits 50 3% 140 kg 18%Beverages 210 12% 110 kg 14%Other 140 8% 40 kg 5%Housing 1,570 16% 41 m² Construction/maintenance 230 15% 41 m2 Electricity 590 38% 3,930 kWh Renewable grid electricity 80 13% 2,060 kWh 52% Non-renewable grid electricity 510 86% 540 kWh 14% Nuclear grid electricity 10 2% 1,330 kWh 34%Other energy 720 46% 7,380 kWh Oil 130 18% 530 kWh 7% Gas 10 2% 70 kWh 1% Other (Non-renewable) 540 75% 4,440 kWh 60% Other (Renewable) 30 5% 2,350 kWh 32%Water consumption 10 1% 40 m3 Transport 3,650 38% 17,490 km Airplane 1,290 35% 3,790 km 22%Car 2,020 55% 10,420 km 60%Other private transportation 0 0% 20 km 0.1%Train 10 >0.5% 680 km 4%Bus 90 3% 850 km 5%Ferry 130 3% 450 km 3%Motorcycle 110 3% 670 km 4%Bicycle 3 0.1% 260 km 2%Walking 0 0% 350 km 2%Consumer goods 1,410 15% 3,180 € Appliances 30 2% 90 € 3%Electronics 160 11% 560 € 18%Furniture/room covering 360 26% 580 € 18%Clothes 520 37% 1040 € 33%Sanitation/medicine 100 7% 280 € 9%Other goods 250 17% 630 € 20%Leisure 540 6% 2,410 € Hotels/travels 300 55% 1,670 € 69%Cultural 130 23% 510 € 21%Sports 60 11% 240 € 10%Summer cottage 60 11% 5 m2 Services 690 7% 3,480 € Education 30 4% 119 € 3%Welfare/medical 190 28% 994 € 29%Finance/insurance 200 28% 974 € 28%Communication 90 13% 478 € 14%Personal care 50 7% 257 € 7%Other services 140 20% 658 € 19%Sub-total 3 domain 7,040 73% Goods 1,410 15% 3,180 € Leisure 540 6% 2,410 € Services 690 7% 3,480 € Grand Total (6 domains) 9,700 100%

154
Annex B
Table B.4. Current annual lifestyle carbon footprint per capita in United Kingdom (rounded values)
Domains and components CF (kg-CO2e) CF (%) Amount (total) Amount (%)Food 1,590 19% 850 kg Cereals 100 6% 130 kg 15%Vegetables (incl. potatoes) 50 3% 150 kg 18%Beans/nuts 10 1% 10 kg 1%Dairy 370 23% 210 kg 25%Eggs 30 2% 10 kg 1%Fish 40 3% 20 kg 2%Meat 690 44% 80 kg 9%Fruits 20 1% 80 kg 9%Beverages 140 9% 100 kg 11%Other 140 9% 70 kg 8%Housing 1,890 22% 39 m² Construction/maintenance 350 19% 39 m2 Electricity 390 21% 1,550 kWh Renewable grid electricity 30 7% 580 kWh 37% Non-renewable grid electricity 360 92% 710 kWh 46% Nuclear grid electricity 2 0.5% 270 kWh 17%Other energy 1,120 60% 5,640 kWh Oil 120 11% 440 kWh 8% Gas 930 82% 4,640 kWh 82% Other (non-renewable) 40 4% 130 kWh 2% Other (renewable) 30 3% 430 kWh 8%Water consumption 20 1% 50 m3 Transport 3,250 38% 14,740 km Airplane 1,440 44% 4,220 km 29%Car 1,640 51% 8,060 km 55%Other private transportation 20 1% 170 km 1%Train 90 3% 1,180 km 8%Bus 50 1% 430 km 3%Motorcycle 5 0.1% 30 km >0.5%Other public transportation 10 >0.5% 70 km 0.5%Bicycle 1 >0.1% 90 km 1%Walking 0 0% 490 km 3%Consumer goods 970 11% 3,290 £ Electronics 160 17% 610 £ 19%Furniture/room covering 60 6% 200 £ 6%Clothes 360 37% 1,210 £ 37%Sanitation/medicine 130 14% 450 £ 14%Other goods 260 27% 790 £ 24%Repair 5 >0.5% 30 £ 1%Leisure 360 4% 2,810 £ Restaurants 180 49% 1,600 £ 57%Cultural 80 22% 390 £ 14%Sports 50 14% 510 £ 18%Other leisure 50 15% 320 £ 11%Services 420 5% 3,660 £ Education 60 14% 390 £ 11%Welfare/medical 60 14% 490 £ 13%Finance/insurance 120 29% 1,160 £ 32%Communication 30 8% 290 £ 8%Other services 150 35% 1,320 £ 36%Sub-total 3 domain 6,720 79% Goods 970 11% 3,290 £ Leisure 360 4% 2,810 £ Services 420 5% 3,660 £ Grand Total (6 domains) 8,470 100%

155
Annex B
Table B.5. Current annual lifestyle carbon footprint per capita in Japan (rounded values)
Domains and components CF (kg-CO₂e) CF (%) Amount (total) Amount (%)Food 1,400 17% 800 kg Cereals 270 19% 160 kg 20%Vegetables (incl. potatoes) 140 10% 150 kg 19%Beans/nuts 30 2% 20 kg 3%Dairy 180 13% 50 kg 6%Eggs 30 2% 20 kg 2%Fish 100 7% 30 kg 4 %Meat 330 23% 40 kg 5%Fruits 60 4% 50 kg 6%Beverages 140 10% 230 kg 29%Other 130 9% 50 kg 7%Housing 2,430 30% 40 m² Construction/maintenance 480 20% 40 m2 Electricity 1,330 55% 2,120 kWh Renewable grid electricity 10 1% 310 kWh 15% Non-renewable grid electricity 1,320 99% 1,780 kWh 84% Nuclear grid electricity 1.0 0.1% 40 kWh 2%Other energy 530 22% 2,070 kWh Oil 190 35% 730 kWh 35% Gas 340 64% 1,320 kWh 64% Other (non-renewable) 0.6 0.1% 0 kWh 0.1% Other (renewable) 1.5 >0.5% 20 kWh 1%Water consumption 90 4% 212 m3 Transport 1,970 24% 10,970 km Airplane 570 29% 1,660 km 15%Car 1,250 63% 5,000 km 46%Train 80 4% 3,120 km 28%Bus 40 2% 490 km 4%Ferry 10 1% 20 km >0.5%Motorcycle 10 1% 90 km 1%Bicycle 10 >0.5% 270 km 2%Walking 0 0% 310 km 3%Consumer goods 1,030 13% 3,590 00 JPY Appliances 120 12% 380 00 JPY 11%Electronics 200 20% 730 00 JPY 20%Furniture/room covering 40 4% 140 00 JPY 4%Clothes 220 21% 730 00 JPY 20%Sanitation/medicine 120 12% 400 00 JPY 11%Hobby 80 8% 320 00 JPY 9%Other goods 240 23% 880 00 JPY 24%Leisure 580 7% 2,200 00 JPY Restaurants 250 43% 940 00 JPY 43%Hotels/travels 130 23% 420 00 JPY 19%Cultural 130 22% 520 00 JPY 24%Sports 30 4% 140 00 JPY 7%Other leisure 40 8% 180 00 JPY 8%Services 650 8% 4,440 00 JPY Education 110 17% 800 00 JPY 18%Welfare/medical 130 20% 720 00 JPY 16%Finance/insurance 80 12% 930 00 JPY 21%Communication 90 14% 810 00 JPY 18%Personal care 60 9% 310 00 JPY 7%Other services 190 29% 870 00 JPY 20%Sub-total 3 domain 5,800 72% Goods 1,030 13% 3,590 00 JPY Leisure 580 7% 2,200 00 JPY Services 650 8% 4,440 00 JPY Grand Total (6 domains) 8,060 100%

156
Annex B
Table B.6. Current annual lifestyle carbon footprint per capita in China (rounded values)
Domains and components CF (kg-CO₂e) CF (%) Amount (total) Amount (%)Food 1,330 27% 940 kg Cereals 260 20% 190 kg 21%Vegetables (incl. potatoes) 190 15% 430 kg 45%Beans/nuts 30 2% 10 kg 2%Dairy 40 3% 20 kg 2%Eggs 50 4% 20 kg 2%Fish 100 7% 40 kg 4%Meat 520 39% 70 kg 7%Fruits 30 2% 100 kg 11%Beverages 50 4% 40 kg 4%Other 50 4% 20 kg 2%Housing 1,190 24% 41 m² Construction/maintenance 370 31% 41 m2 Electricity 570 48% 650 kWh Renewable grid electricity 10 1% 170 kWh 26% Non-renewable grid electricity 560 99% 460 kWh 70% Nuclear grid electricity 0.3 0.1% 30 kWh 4%Other energy 230 20% 1,210 kWh Gas 110 49% 670 kWh 55% Other (non-renewable) 120 51% 550 kWh 45%Water consumption 20 1% 55 m3 Transport 1,200 24% 9,310 km Airplane 200 17% 600 km 6%Car 450 37% 2,300 km 25%Train 80 6% 990 km 11%Bus 180 15% 2,130 km 23%Motorcycle 280 23% 1,740 km 19%Bicycle 10 1% 1,070 km 11%Walking 0 0% 480 km 5%Consumer goods 410 8% 2,240 CNY Clothes 250 61% 1,340 CNY 60%Other goods 160 39% 900 CNY 40%Leisure 140 3% 1,260 CNY Other leisure 140 100% 1,260 CNY 100%Services 710 14% 4,060 CNY Education 140 19% 1,260 CNY 31%Welfare/medical 410 58% 1,900 CNY 47%Other services 160 23% 900 CNY 22%Sub-total 3 domain 3,720 75% Goods 410 8% 2,240 CNY Leisure 140 3% 1,260 CNY Services 710 14% 4,060 CNY Grand Total (6 domains) 4,970 100%

157
Annex B
Table B.7. Current annual lifestyle carbon footprint per capita in South Africa (rounded values)
Domains and components CF (kg-CO₂e) CF (%) Amount (total) Amount (%)Food 1,700 35% 560 kg Cereals 130 7% 190 kg 34%Vegetables (incl. potatoes) 80 4% 70 kg 13%Beans/nuts 10 0.5% 5 kg 1%Dairy 60 4% 50 kg 10%Eggs 20 1% 10 kg 1%Fish 10 1% 10 kg 1%Meat 1,230 72% 70 kg 12%Fruits 5 >0.5% 20 kg 4%Beverages 90 6% 70 kg 13%Other 70 4% 60 kg 11%Housing 1,050 21% 23 m² Construction/maintenance 200 19% 23 m2 Electricity 790 75% 830 kWh Renewable grid electricity 1 0.1% 20 kWh 2% Non-renewable grid electricity 790 100% 770 kWh 93% Nuclear grid electricity >0.5 >0.01% 40 kWh 5%Other energy 30 3% 270 kWh Oil 10 33% 60 kWh 21%
Gas 0.1 >0.5% 1 kWh >0.5% Other (non-renewable) 20 61% 80 kWh 29% Other (renewable) 1.5 5% 140 kWh 50%Water consumption 30 3% 90 m3 Transport 1,200 25% 7,160 km Airplane 160 13% 470 km 7%Car 720 60% 3,040 km 42%Train 180 15% 2,290 km 32%Bus 140 12% 1,260 km 18%Walking 0 0% 100 km 1%Consumer goods 730 15% 3,320 ZAR Appliances 10 1% 200 ZAR 6%Furniture/room covering 80 11% 380 ZAR 11%Clothes 510 70% 1500 ZAR 45%Other goods 60 8% 250 ZAR 8%Repair 70 9% 1000 ZAR 30%Leisure 70 1% 1,680 ZAR Restaurants 10 16% 470 ZAR 28%Hotels/travels 10 9% 240 ZAR 14%Cultural 20 31% 540 ZAR 32%Other leisure 30 44% 430 ZAR 25%Services 140 3% 6,710 ZAR Education 19 14% 770 ZAR 11%Welfare/medical 21 15% 280 ZAR 4%Finance/insurance 14 11% 2,980 ZAR 44%Communication 40 30% 1,060 ZAR 16%Personal care 21 15% 600 ZAR 9%Other services 20 15% 1,010 ZAR 15%Sub-total 3 domain 3,950 81% Goods 730 15% 3,320 ZAR Leisure 70 1% 1,680 ZAR Services 140 3% 6,710 ZAR Grand Total (6 domains) 4,890 100%

158
Annex B
Table B.8. Current annual lifestyle carbon footprint per capita in Turkey (rounded values)
Domains and components CF (kg-CO2e) CF (%) Amount (total) Amount (%)Food 1,210 25% 940 kg Cereals 140 12% 180 kg 19%Vegetables (incl. potatoes) 130 11% 300 kg 32%Beans/nuts 20 2% 20 kg 3%Dairy 320 26% 180 kg 19%Eggs 20 2% 10 kg 1%Fish 10 1% 5 kg 1%Meat 400 33% 40 kg 4%Fruits 40 3% 130 kg 14%Beverages 30 2% 20 kg 2%Other 110 9% 50 kg 6%Housing 1,690 35% 32 m² Construction/maintenance 290 17% 32 m2 Electricity 460 27% 790 kWh Renewable grid electricity 10 2% 250 kWh 32% Non-renewable grid electricity 450 98% 530 kWh 68%Other energy 920 54% 1,100 kWh Oil 550 60% 530 kWh 48% Gas 190 21% 340 kWh 31% Other (non-renewable) 170 19% 160 kWh 14% Other (renewable) 3 0.5% 70 kWh 7%Water consumption 30 2% 80 m3 Transport 1,010 21% 4,400 km Airplane 350 35% 1,030 km 23%Car 530 52% 2,420 km 55%Train 10 1% 170 km 4%Bus 10 1% 140 km 3%Motorcycle 100 10% 640 km 15%Consumer goods 630 13% 7,180 TRY Furniture/room covering 310 49% 2,470 TRY 34%Clothes 200 32% 2,310 TRY 32%Other goods 120 20% 2,400 TRY 33%Leisure 180 4% 4,650 TRY Hotels/travels1 110 61% 2,680 TRY 58%Cultural 70 39% 1,970 TRY 42%Services 130 3% 2,070 TRY Education 20 12% 490 TRY 24%Welfare/medical 60 48% 670 TRY 32%Communication 50 40% 910 TRY 44%Sub-total 3 domain 3,910 81% Goods 630 13% 7,180 TRY Leisure 180 4% 4,850 TRY Services 130 3% 2,070 TRY Grand Total (6 domains) 4,860 100%
1 Restaurants are included to hotels/travels.

159
Annex B
Table B.9. Current annual lifestyle carbon footprint per capita in Brazil (rounded values)
Domains and components CF (kg-CO2e) CF (%) Amount (total) Amount (%)Food 1,890 58% 790 kg Cereals 140 7% 130 kg 17%Vegetables (incl. potatoes) 40 2% 100 kg 13%Beans/nuts 20 1% 30 kg 4%Dairy 240 13% 140 kg 18%Eggs 30 2% 10 kg 1%Fish 20 1% 10 kg 1%Meat 1,110 59% 100 kg 13%Fruits 20 1% 100 kg 13%Beverages 110 6% 70 kg 9%Other 160 9% 90 kg 12%Housing 500 16% 28 m² Construction/maintenance 290 58% 28 m2 Electricity 90 18% 680 kWh Renewable grid electricity 20 23% 560 kWh 82% Non-renewable grid electricity 70 81% 100 kWh 15% Nuclear grid electricity 0.1 0.1% 20 kWh 3%Other energy 100 20% 800 kWh Gas 90 92% 380 kWh 48% Other (non-renewable) 10 10% 20 kWh 3% Other (renewable) 10 10% 390 kWh 49%Water consumption 30 6% 40 m3 Transport 640 20% 4,640 km Airplane 230 36% 670 km 14%Car 150 23% 1,180 km 25%Train 20 3% 290 km 6%Bus 210 33% 1,930 km 42%Motorcycle 30 5% 190 km 4%Bicycle 0.3 >0.1% 20 km 0.5%Walking 0 0% 360 km 8%Consumer goods 130 4% 1,220 BRL Appliances 10 8% 130 BRL 11%Electronics 40 31% 390 BRL 32%Furniture/room covering 10 8% 80 BRL 7%Clothes 20 16% 170 BRL 14%Sanitation/medicine 10 8% 80 BRL 7%Other goods 30 24% 360 BRL 30%Leisure 40 1% 1,120 BRL Hotels/travels 10 18% 200 BRL 18%Cultural 30 82% 910 BRL 82%Services 50 2% 1,620 BRL Education 7 12% 150 BRL 9%Welfare/medical 1 2% 20 BRL 1%Finance/insurance 1 1% 20 BRL 1%Communication 4 7% 340 BRL 21%Other services 40 77% 1,080 BRL 67%Sub-total 3 domain 3,020 93% Goods 130 4% 1,220 BRL Leisure 40 1% 1,120 BRL Services 50 2% 1,620 BRL Grand Total (6 domains) 3,240 100%

160
Annex B
Table B.10. Current annual lifestyle carbon footprint per capita in India (rounded values)
Domains and components CF (kg-CO₂e) CF (%) Amount (total) Amount (%)Food 780 26% 530 kg Cereals 420 53% 180 kg 35%Vegetables (incl. potatoes) 50 6% 110 kg 21%Beans/nuts 20 2% 30 kg 5%Dairy 180 23% 110 kg 20%Eggs 10 1% 3 kg 1%Fish 20 2% 10 kg 1%Meat 30 4% 4 kg 1%Fruits 10 2% 60 kg 11%Beverages 3 >0.5% 3 kg 1%Other 50 7% 30 kg 5%Housing 440 15% 10 m² Construction/maintenance 100 23% 10 m2 Electricity 210 48% 210 kWh Renewable grid electricity 20 9% 80 kWh 37% Non-renewable grid electricity 190 91% 130 kWh 62% Nuclear grid electricity >0.1 >0.1% 4 kWh 2%Other energy 70 15% 330 kWh Oil 10 14% 30 kWh 10% Gas 60 86% 300 kWh 90%Water consumption 60 13% 40 m3 Transport 1,730 58% 16,370 km Airplane 40 2% 120 km 1%Car 340 20% 2,490 km 15%Train 70 4% 880 km 5%Bus 100 6% 880 km 5%Motorcycle 1,180 69% 12,000 km 73%Consumer goods 10 >0.5% 320 INR Appliances 2 18% 70 INR 23%Clothes 7 55% 160 INR 50%Sanitation/medicine 2 15% 30 INR 10%Other goods 2 12% 50 INR 16%Leisure 1 >0.1% 40 INR Cultural 1 100% 40 INR 100%Services 2 >0.1% 320 INR Education >0.5 8% 70 INR 21%Welfare/medical 1 47% 130 INR 42%Finance/insurance >0.5 13% 40 INR 13%Other services 0.6 31% 80 INR 24%Sub-total 3 domain 2,950 100% Goods 10 >0.5% 320 INR Leisure 1 >0.1% 40 INR Services 2 0.1% 320 INR Grand Total (6 domains) 2,960 100%

161
Annex B
Table B.11. Current annual lifestyle carbon footprint per capita in Indonesia (rounded values)
Domains and components CF (kg-CO₂e) CF (%) Amount (total) Amount (%)Food 800 36% 570 kg Cereals 410 52% 280 kg 49%Vegetables (incl. potatoes) 60 7% 100 kg 17%Beans/nuts 30 4% 30 kg 5%Dairy 10 2% 10 kg 1%Eggs 20 2% 10 kg 1%Fish 100 13% 40 kg 8%Meat 90 11% 10 kg 2%Fruits 20 2% 60 kg 11%Beverages 3 >0.5% 1 kg >0.5%Other 60 7% 30 kg 6%Housing 590 27% 19 m² Construction/maintenance 190 33% 19 m2 Electricity 180 30% 390 kWh Renewable grid electricity 3 2% 50 kWh 12% Non-renewable grid electricity 180 98% 350 kWh 88%Other energy 140 23% 730 kWh Oil 60 40% 210 kWh 29% Gas 80 58% 350 kWh 47% Other (renewable) 2 1% 170 kWh 24%Water consumption 80 13% 50 m3 Transport 570 26% 3,270 km Airplane 100 17% 280 km 9%Car 100 18% 450 km 14%Train 10 1% 110 km 3%Motorcycle 310 55% 1,950 km 60%Other public transportation 50 9% 480 km 15%Consumer goods 140 7% 2,000 000 IDR Clothes 20 12% 420 000 IDR 21%Non-organic waste 130 88% 1,570 000 IDR 79%Leisure 10 >0.5% 260 000 IDR Other leisure 10 100% 260 000 IDR 100%Services 100 4% 2,080 000 IDR Education 16 17% 430 000 IDR 21%Welfare/medical 27 28% 360 000 IDR 17%Finance/insurance 5 5% 420 000 IDR 20%Other services 50 50% 870 000 IDR 42%Sub-total 3 domain 1,950 89% Goods 140 7% 2,000 000 IDR Leisure 10 >0.5% 260 000 IDR Services 100 4% 2,080 000 IDR Grand Total (6 domains) 2,200 100%

162
ReferencesAnnex B
ReferencesANNEX B
Empresa de Pesquisa Energética - EPE. 2013. “Assess-ment of the Behavior of Users of Flex Fuel Vehicles in Fuel Consumption in Brazil. [Avaliação Do Comporta-mento Do Usuários de Veículos Flex Fuel No Consumo de Combustíveis No Brasil].” https://www.epe.gov.br/sites-pt/publicacoes-dados-abertos/publicacoes/Publi-cacoesArquivos/publicacao-250/topico-296/EPE-DPG-SDB-001-2013-r0%5b1%5d.pdf.
European Commission. 2021. “Turkey. Population: De-mographic Situation, Languages and Religions.” Pub-lished January 13, 2021. https://eacea.ec.europa.eu/national-policies/eurydice/content/population-demo-graphic-situation-languages-and-religions-103_en.
Government of Canada. 2017. “Electricity Facts.” https://www.nrcan.gc.ca/science-data/data-anal-ysis/energy-data-analysis/energy-facts/electrici-ty-facts/20068#L3.
Official Statistics of Finland (OSF). 2020. “Production of electricity and heat [e-publication]. ISSN=1798-5099. 2019, Appendix table 1. Electricity and heat production by production mode and fuel in 2019.” Helsinki: Statis-tics Finland. http://www.stat.fi/til/salatuo/2019/salat-uo_2019_2020-11-03_tau_001_en.html. Referred Jan-uary 13, 2021.
Paulo, Faveret Filho, José Geraldo Pacheco Ormond, and Sergio Roberto Lima de Paula. n.d. “Brazilian Fruit Production: In Search of an Export Model.” https://www.bndes.gov.br/SiteBNDES/export/sites/default/bndes_en/Galerias/Download/studies/fruit.pdf. Accessed Ju-ly 2, 2021.
VR Group Ltd. 2020. Vuosiraportti 2020 [Responsibil-ity Report].” VR Group Ltd. Published April 1, 2020. https://2020.vrgroupraportti.fi/fi/vuosiraportti-2020/.

163

164
ReferencesAnnex A–D
© Hot or Cool Institute, Berlin. October 2021.
T his report uses a science-based approach to link concrete changes in lifestyles to measurable impacts on climate change in order to achieve the 1.5-degree aspirational target of the
Paris Agreement on climate change. The report also fills the knowledge gap arising from most prevailing climate scenarios that underplay the potential contributions of lifestyle changes to climate change mitigation and focus on developing new technologies as well as on changes in production. For each country in the report, the footprint gap between current and sustainable target levels are determined for the years 2030, 2040, and 2050. To bridge these emissions gaps, options for reducing footprints in each country are introduced, estimating potential impacts from various adoption rates in each country. The report introduces policies that could transform lifestyles and socio-technical systems in sustainable directions. Finally, two scenarios are developed for each country, one focused on systems change and another on behaviour change, showing indicative pathways for achieving footprint targets for 2030.
Club of Rome • D-mat • IEEP • IGES • Hot or Cool Institute KR Foundation • ClimateWorks Foundation • Sitra