15 trends for 2015
TRANSCRIPT

115 for 15
1515FORThe Numbers ThaT maTTered iN 2014. The TreNds To WaTch iN 2015

2 15 for 15
04 1306
2014 in numbers:Digital timeline
re-engineering auDience research
how 2014’s big stories will Drive 2015’s big trenDs
CONTENTS
315 for 15
2519
33e34 • Generation Ve40 • Tablet Fatigue?e46 • The New Tech elitee52 • Facebook Gets Passivee58 • TV.come64 • china risinge70 • The slow death of searche76 • Wearable Tech Gets mainstreame84 • android excelse90 • riP sms?e96 • The shared internet102 • The battle for content108 • multi-Networking114 • Game on in asia118 • Track me if You can
2014 in numbers:social networks anD messaging apps
2014 in numbers:worlD cup
15 for 15:the trenDs to watch in the Year aheaD

4 15 for 15
Tom Smith , CEO GlobalWebIndex
Re-engineeRingaudience ReseaRch

515 for 15
i founded globalwebindex with the goal of it becoming ‘The Global Standard for Digital Audience Insight’. As an experienced agency professional, I knew the limitations of existing data and had seen first-hand the problems of legacy providers – as well as analytics and industry tracking – simply not being fit for purpose in the digital age. Worse, they were (and still are) selling the digital marketing potential of the internet and its users massively short. As our white paper The Missing Billion sets out, this remains a huge problem today: there are a billion people – mainly in emerging markets – who are currently being wiped off the digital map.
To achieve our goal, I knew we would have to re-engineer how audience research works. It meant providing data on all aspects of a consumer’s digital life in one data set, delivering global reach at massive scale. It required us to publish data that was a week (rather than months or years) old, which was collected a minimum of four times a year and which covered all connected devices. And, crucially, I knew it meant going beyond simple passive behavioral metrics to explore needs, wants and – in an age of all-pervasive social media – active contributions.
I also knew it meant collecting data from people, not browsers. We had to go beyond simple demographics to cover any nuance of an audience – including attitudes, passions, motivations, work culture, home life and product purchasing. It has always amazed me that digital marketing was supposed to be a revolution in targeting, yet in the majority of cases we are reduced to reporting on age and gender.
in 2015, we will continue to push these limits. We’ll not only link GWI core data to campaigns, site visits and programmatic inventory via our GWIQ product, we’ll be enriching it with social data from Twitter and Facebook, as well as third-party digital data sources. We see this blend of actively collected market research and passive ‘big’ data as the future to audience insight and we continue to pursue this vision rigorously – providing one data set that connects strategy, implementation and reporting. We’ll also be expanding our research program to cover new markets as well as incorporating mobile-only internet users.
The other side of our goal is to make our data as accessible as possible, enabling a wide range of user types to benefit. Without doubt, 2014 has been the most important year in this journey, with the team rolling out some incredible products – including an all-new PRO Platform (which, bar none, is the best analysis tool I’ve ever used). We also launched an API, enabling clients to plug our audience data into their tools and dashboards, as well as a whole new trends function that provides incredible reports, infographics and commentary on the ever-changing digital market. You’ll find the best of this new offering inside this publication, where we showcase the trends that all digital marketers need to keep on their radar in the year ahead.
We work very hard here to deliver constant innovation and one of the reasons we’ve remained independent is that we have been free to execute and deliver to our clients on a timescale impossible in large organizations. This is a rate of change we consider fundamental in the ever-evolving world of digital behavior and marketing.
We look forward to working with you to innovate in 2015 and beyond.
to do all of these things, we’ve had to push the limits of market research. the result of our work is that we’ve had incredible traction, with revenue growth exceeding 200% in 2014 alone. today, tens of thousands of digital marketing professionals are using gwi to deliver exceptional digital marketing on a global scale. and it’s a number that grows every single day.

6 15 for 15
unlike some, we’ve not set out to “create” 15 brand-new trends that you’ve never heard of before. rather, we’ve selected 15 key areas which will be generating the biggest digital headlines, and exerting some of the strongest influences on marketing spend, in the year ahead. some of these trends will be driven by the arrival of new products, by advances in tech capabilities or by increases in audience sizes. others are the result of existing trends crossing into the mainstream, gaining a new sense of momentum or reaching crucial tipping points. but pretty much all of them have implications which stretch far beyond the end of 2015 (stop and think about it and the notion that trends have a life-span of just twelve months is utterly non-sensical; our 15 for 15 already exist now and will continue to exist in 2016 – it’s simply the right time and context for them to enjoy a particularly important year in 2015).
how 2014’s big stoRies will dRive 2015’s
big tRends
There’s one question i’m asked more frequently than any other: how do you spot a trend?
The answer is fairly simple. despite the ever-changing nature of the digital landscape, there are two fairly dependable constants to rely on here. Firstly, trends don’t simply materialize out of thin air; they have a far longer trajectory than that. secondly, only rarely are they the result of never-seen-before behaviors or impossible-to-predict circumstances; whether they grow quickly or slowly – and whether they impact a single country/region or become truly global – most digital trends are driven by a combination of ever-more sophisticated tech capabilities and ever-evolving consumer needs and wants.
it’s in this context that we’ve approached our 15 trends for 2015. by analyzing data from 32 different countries across multiple waves of research (the most recent of which was collected just a week ago), we’ve chosen our stories based on a detailed, multi-market understanding of current trends and behaviors in 2014.

715 for 15
With that in mind, let’s start by exploring the year gone-by. What do the events and numbers of the last twelve months tell us about the year ahead?
above all, 2014 was a year in which acquisitions and new landmarks were only rarely out of the spotlight. Perhaps the biggest surprise of all came back in February when – having been unsuccessful in its attempts to woo snapchat – Facebook announced its multi-billion dollar purchase of Whatsapp. but it certainly wasn’t alone in wanting a piece of the messaging action; by the time mark Zuckerberg and co were handing over $19 billion, rakuten had already added Viber to its portfolio and – subsequently – we’ve seen instagram launch bolt, Facebook force its users to migrate to messenger and Wechat develop new brand partnerships. as we write, Yahoo is rumored to be investing in snapchat while, next year, Google is expected to become the latest name to enter the fray with the launch of its very own messenger service.
Jason Mander, Head of TrendsGlobalWebIndex

8 15 for 15
That competition has quickly become so fierce within the mobile messaging space is testament to just how rapidly social networking behaviors have been evolving. but this brings clear implications for the way we’ll be communicating elsewhere in 2015, a theme we explore in our RIP SMS and Facebook Gets Passive trends.
as 2014 drew to a close, big-name (and big-money) acquisitions hit the headlines once again: amazon bought Twitch while microsoft purchased minecraft-developers mojang. indicative not only of gaming’s current value and ubiquity, it also reflects a gradual shift towards streaming (with ownership models being challenged by those based on access; see The Battle for Content). so too does it illustrate the rising importance attached to platforms. content might now be King but platforms have quickly become the King-makers – with tech giants willing to spend considerable money to gain access to the young and affluent audiences who use them. it’s also worth noting that global gaming revenues are set to swell still further in 2015; this year’s repeal of the games console ban in china opens up a huge new audience (for more on this, see Game On in Asia).
alongside acquisitions, 2014 brought its fair share of product announcements – including Facebook’s atlas ad platform, which breaks new territory in the mobile space (see Track Me If You Can) as well as Twitter’s plans to implement a “buy” button. Without doubt, though, it was apple which captured the most attention here; from its much-awaited larger-screen iPhone 6 models to its apple Watch, we can expect these devices to make waves over the next twelve months. Whether it will help the company to re-gain ground on android or push wearables into truly mainstream status will be key areas to watch (see Android Excels and Always-On Consumers for more on these topics).

915 for 15
elsewhere, 2014 heralded a number of important landmarks. it was, for example, the first year where three quarters of internet users went online via mobiles and over a third via tablets; we discuss the future prospects for both devices in our Tablet Fatigue trend. We also had Netflix passing the 50 million paid-subscriber mark (see TV.com) and Whatsapp eventually overtaking Facebook messenger to become the most popular chat app globally. and, towards the year’s end, alibaba achieved the largest ever iPo – a testament to the rising fortunes of chinese tech firms more generally (see China Rising).
For GlobalWebindex, though, the last twelve months saw a milestone of particular significance: the collection of 5 years’ worth of data on the digital consumer. across our 16 waves of research so far – spanning mid-2009 to the end of 2014 – some of the biggest shifts show just how much behaviors have changed in the 10s (and will continue to do so as we approach the middle-point of the decade). Nowhere is this clearer than in relation to dating and social networking sites; among the 30+ different types of site tracked by GWi – covering everything from search engines and price comparison services to brand/retail platforms and online encyclopedias – it’s these two categories which, over the last five years, have seen the biggest proportional increases of all in terms of visitor numbers.
between Q2 2009 and Q2 2014, there was in fact a +196% rise in the numbers visiting online dating sites each month (one of the reasons, no doubt, why iac/interactive corp – the owner of match.com and oK cupid – increased its stake in dating app Tinder back in march and then acquired howaboutWe in July). and it must be pretty telling that social networks saw the next highest increase (up by +178% over the same period); as we’ve become more and more comfortable communicating with each other online, virtual relationships really have soared. it’s why the Multi-Networking trend will flourish still further next year; we’re using a combination of sites and conversation channels, rather than limiting ourselves to just one or two of them.

10 15 for 1510
1115 for 15
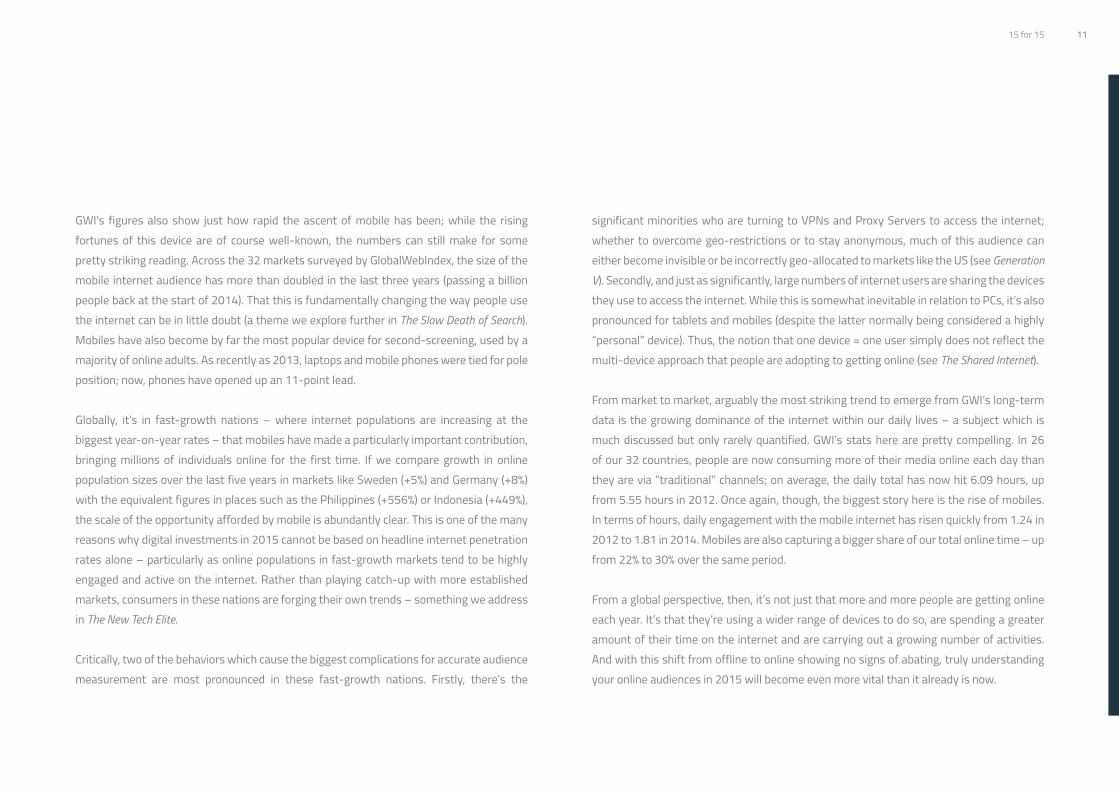
GWi’s figures also show just how rapid the ascent of mobile has been; while the rising fortunes of this device are of course well-known, the numbers can still make for some pretty striking reading. across the 32 markets surveyed by GlobalWebindex, the size of the mobile internet audience has more than doubled in the last three years (passing a billion people back at the start of 2014). That this is fundamentally changing the way people use the internet can be in little doubt (a theme we explore further in The Slow Death of Search). mobiles have also become by far the most popular device for second-screening, used by a majority of online adults. as recently as 2013, laptops and mobile phones were tied for pole position; now, phones have opened up an 11-point lead.
Globally, it’s in fast-growth nations – where internet populations are increasing at the biggest year-on-year rates – that mobiles have made a particularly important contribution, bringing millions of individuals online for the first time. if we compare growth in online population sizes over the last five years in markets like sweden (+5%) and Germany (+8%) with the equivalent figures in places such as the Philippines (+556%) or indonesia (+449%), the scale of the opportunity afforded by mobile is abundantly clear. This is one of the many reasons why digital investments in 2015 cannot be based on headline internet penetration rates alone – particularly as online populations in fast-growth markets tend to be highly engaged and active on the internet. rather than playing catch-up with more established markets, consumers in these nations are forging their own trends – something we address in The New Tech Elite.
critically, two of the behaviors which cause the biggest complications for accurate audience measurement are most pronounced in these fast-growth nations. Firstly, there’s the
significant minorities who are turning to VPNs and Proxy servers to access the internet; whether to overcome geo-restrictions or to stay anonymous, much of this audience can either become invisible or be incorrectly geo-allocated to markets like the us (see Generation V). secondly, and just as significantly, large numbers of internet users are sharing the devices they use to access the internet. While this is somewhat inevitable in relation to Pcs, it’s also pronounced for tablets and mobiles (despite the latter normally being considered a highly “personal” device). Thus, the notion that one device = one user simply does not reflect the multi-device approach that people are adopting to getting online (see The Shared Internet).
From market to market, arguably the most striking trend to emerge from GWi’s long-term data is the growing dominance of the internet within our daily lives – a subject which is much discussed but only rarely quantified. GWi’s stats here are pretty compelling. in 26 of our 32 countries, people are now consuming more of their media online each day than they are via “traditional” channels; on average, the daily total has now hit 6.09 hours, up from 5.55 hours in 2012. once again, though, the biggest story here is the rise of mobiles. in terms of hours, daily engagement with the mobile internet has risen quickly from 1.24 in 2012 to 1.81 in 2014. mobiles are also capturing a bigger share of our total online time – up from 22% to 30% over the same period.
From a global perspective, then, it’s not just that more and more people are getting online each year. it’s that they’re using a wider range of devices to do so, are spending a greater amount of their time on the internet and are carrying out a growing number of activities. and with this shift from offline to online showing no signs of abating, truly understanding your online audiences in 2015 will become even more vital than it already is now.

12 15 for 15
2014 IN NUMBERS

1315 for 15
Tracking the year’s most important digital stories and events
Digital timeline
01

14 15 for 15
Jan Feb MaRchsnapchat defends turning down facebook’s offerTop Markets for Snapchat: Total TeensUK 14% • 46%USA 14% • 42%Ireland 14% • 42%Canada 12% • 47%Australia 11% • 40%
facebook 10th anniversaryIn 2014, 82% of internet users outside of China have a Facebook account, 75% say they visit the site each month and 47% describe themselves as active users
turkey attempts to block twitter36% of Turkish internet users are now connecting to the internet via VPNs – up from 29% in Q4 2013. 62% of this group say they do this to access restricted sites like Twitter.
oscar selfie retweeted 2 million times during ceremony 10% of internet users say they have retweeted a branded microblog post in the last month
internet turns 25fastest rising internet populations in last 5 Years: Philippines • 556%Indonesia • 449%South Africa • 426%India • 240%Russia • 102%Argentina • 90%Vietnam • 85%Saudi Arabia • 83%UAE • 77%Mexico • 74%
In comparison, the Swedish internet population has grown by just 5% during the same period
rakuten buys viber8% use Viber each month – rising to a third or more in Philippines, Ireland, UAE and Vietnam
facebook buys whatsapp Usage of WhatsApp (among mobile audience):Q1 2013 • 16%Q2 2013 • 17%Q3 2013 • 19%Q4 2013 • 23%Q1 2014 • 24%Q2 2014 • 25%Outside of China, its usage has hit 39%
flickr celebrates 10th anniversary% visiting Flickr each month, by age:16 to 24 • 13%25 to 34 • 17%35 to 44 • 14%45 to 54 • 8%55 to 64 • 5%
apple mac turns 30Top 10 Markets for Apple Mac:12% • Australia12% • USA11% • Canada10% • Singapore10% • Sweden
20th anniversary of Yahoo being founded% monthly visitors to Yahoo by region:65% • Latin America62% • Asia Pacific61% • North America58% • Middle East and Africa32% • Europe
Data privacy Day56% of global internet users are “concerned about the internet eroding my personal privacy” – up from 48% in 2010
8% • Ireland8% • UK7% • Hong Kong6% • UAE6% • Netherlands

1515 for 15
aPRil MaY Juna third of internet users going online via tabletsQ1 2011 • 8%Q2 2011 • 9%Q4 2011 • 12%Q2 2012 • 17%Q4 2012 • 21%Q1 2013 • 22%
Q2 2013 • 31%Q3 2013 • 29%Q4 2013 • 30%Q1 2014 • 30%Q2 2014 • 33%Q3 2014 • 37%
amazon unveils fire phoneCurrently, the mobile handset market is dominated by Samsung (36%)
apple unveils ios 8% online adults using following mobile operating systems:Android • 55%iOS • 16%Windows Phone • 5%
vodafone reveals governments in six countries have direct links to communications on its network65% of smartphone owners are concerned about how their data is being used by companies
google glass available to buy in uk UK USA% have used wearable tech already 9% 13%% interested in doing so in the future 30% 33%
microsoft and nokia mergeIn 2014, 20% of mobile users said they had a Nokia handset. In 2009, the figure was 34%.
gmail celebrates its 10th anniversary
vic gundotra leaves google+53% of internet users now have a Google+ account, up from 42% in 2012.
microsoft stops support for Xp% using the following OS:Windows 7 • 50%Windows XP • 23%Windows 8 • 16%Windows Vista • 5%
ebay hacked, highlighting privacy issues% internet users who did the following last month:Used private browsing window • 46%Deleted cookies • 41%Used ad blocker services • 29%Used anti tracking tools • 18%
36% of internet users visit eBay each month, with Germany (71%) and the UK (65%) the top markets
wechat subject to censorship from authorities 84% of mobile internet users in China are using WeChat each month
mark Zuckerberg turns 30 - as facebook is “oldest” social platformAge profile of Facebook active users:16-24 • 25%25-34 • 29%35-44 • 22%45-54 • 15%55-64 • 9%

16 15 for 15
JulY aug sePnetflix passes 50 million paying subscribers 58% of internet users say they have subscribed to a video on-demand service such as Netflix, or are interested in doing so in the future
google ipo 10th anniversary50% of internet users are now using Google via mobile each month
orkut closes Just 4% of global internet users were actively using Orkut in 2014 – peaking at 13% in India
ipod classic withdrawn74% of mobile users say their handset has a music player – up from 65% in 2010
apple watch + iphone 6 announced 64% of online adults say they have used, or are interested in using, a piece of wearable tech such as a smart watch or wristband
alibaba flotation83% of Chinese internet users bought a product online last month – higher than in any other country
amazon buys twitch49% of online adults visit Amazon each month - with 45% of them expressing a strong interest in gaming
twitter unveils ‘buy’ button% who have purchased a product online within the last month: All Internet Users Active Twitter UsersVia Any Device 67% 75%Via PC/Laptop 62% 68%Via Mobile 38% 47%Via Tablet 17% 27%
facebook removes messaging from main app% internet users using Facebook Messenger Q4 2013 Q3 2014Australia 12% 18%Sweden 14% 22%UK 13% 26%
apple and samsung agree to end patent dispute outside of us36% own Samsung handset19% own iPhone handset
twitter sees a record 35.6 million tweets during germany’s shock 7-1 demolition of brazil in the world cup
amazon celebrates 20th anniversaryAmazon’s top 10 markets (% visiting each month)UK • 78%Germany • 76%USA • 74%Italy • 66%India • 63%Canada • 60%Japan • 60%Ireland • 59%France • 51%China • 45%
microsoft announces job cuts at nokia% who:Have owned Nokia handset • 42%Currently own Nokia handset • 15%Would consider buying a Nokia handset • 12%
mobile internet hits 75% Q1 2011 • 49%Q2 2011 • 52%Q4 2011 • 55%Q2 2012 • 57%Q4 2012 • 59%Q1 2013 • 60%
Q2 2013 • 65%Q3 2013 • 65%Q4 2013 • 66%Q1 2014 • 67%Q2 2014 • 69%Q3 2014 • 75%

1715 for 15
oct nov dec10th anniversary of first banner ad cyber monday
% in US who bought a product online last month:Via any Device • 65%Via PC/laptop • 61%Via Mobile • 24%Via Tablet • 13%
tumblr announces sponsored appsAnd overtakes Instagram to become fastest growing social network with +120% rise in active users in last six months
blackberry classic smartphones launch2.7% using BlackBerry OS by end of 2014
playstation 20th anniversary% with following consoles in their household:PS3 • 18%Wii • 16%Xbox • 14%PS4 • 7%Xbox One • 5%Wii U • 5%
10th anniversary of news aggregator Digg
apple plans to introduce new subscription offer on the beats music streaming service% of internet users who have paid for a….
Music streaming Music subscription DownloadQ1 2013 13% 22%Q3 2014 16% 22%
netflix announces the development of original films to be screened online at the same time as they arrive in the cinema57% of internet users say they watched a full-length film via a PC, mobile or tablet last month
“anti-facebook” social network ello reported to be receiving 37,000 requests to join per hour
facebook messenger reported to be introducing person-to-person payments featureGlobally, more than 50% of Messenger users say they bought a product via their mobile last month
Yahoo rumored to be investing in snapchat30% of Snapchat’s users are in the US50% still live with their parents
facebook launches tor browser version3% of internet users say they use VPNs to access the internet via Tor Browsers
snapcash and facebook at work announced
Youtube and firefox partner for search
singles Day in china
spotify royalties in europe overtake earningsvia itunes8% globally say they used Spotify last month - peaking at 39% in Sweden
snapchat funding round values it at £7.5 billionFastest growing apps in last 6 months:Snapchat • 56%Facebook Messenger • 52%Instagram • 47%

18 15 for 15
2014 IN NUMBERS

1915 for 15
during the 2014 FiFa World cup in brazil, GlobalWebindex was surveying members of its real-Time research Panels in brazil, the uK and the usa to understand viewer engagement behaviors and sponsor recog-nition levels. here are the some of the key numbers that mattered.
the worlD cup
02

20 15 for 15
coca-cola 50%mcDonald’s 49%visa 41%
nike 31%mastercard 25%samsung 19%
Consistently, more than 95% in brazil followed each of their team’s matches in some form. Engagement went Down with each match in the uk and trended upwarDs in usa as the USMNT performed well.
live tv broaDcasts dominated viewing behaviors in all 3 countries, but online streaming was much more of a force in America.
The home was the overwhelmingly favorite viewing location for World Cup games – 8 in 10 in England were watching from there.
% following matches Game 1 Game 2 Game 3
uk82%80%74%
usa57%64%67%
The most recognized sponsors by the end of the tournament were:
Brands most likely to be mistakenly picked as official partners:
Sponsorship awareness levels were much higher in Brazil – peaking at 79% for coca-cola.
all official sponsors out-performed rivals, with Coca-Cola, McDonald’s, Hyundai, Johnson & Johnson, Budweiser & Emirates being at least twice as recognizable as their closest competitors. However, Adidas (36%) was only just ahead of Nike (31%)
in braZil, virtually all sponsors saw a notable increase in recognition levels between the start and end of the World Cup - e.g. Budweiser +10%, Sony +15% and McDonald’s +20%. This did NOT happen in the UK or USA.
sPonsoRshiP behavioRs

2115 for 15

22 15 for 15

2315 for 15
facebook was the most popular social network during World Cup matches (81%)
twitter was used by more than a thirD of viewers in all countries.
4 in 10 viewers checked social networks during games to see what others were saying. a Quarter posted their own updates.
final results were the biggest talking point on social media (74%). But more than 7 in 10 talked about goals and half discussed particular players.
toP 10 twitteR tRends amoNG gwi’s Real-tiMe Panel duriNG The WorLd cuP 2014
#worldcup
brazil
england
argentina
Germany
Wimbledon
suarez
Portugal
spain
messi
toP 10 woRld cuP teaMs(bY meNTioNs/TreNdiNG) amoNG gwi’s Real-tiMe Panel
brazil
england
argentina
Germany
spain
uruguay
Portugal
costa rica
chile
Ghana
toP 10 woRld cuP PlaYeRs(bY meNTioNs/TreNdiNG) amoNG gwi’s Real-tiMe Panel
suarez
messi
Neymar
ronaldo
rooney
david Luiz
robben
James rodriguez
sanchez
Tim howard
toP 10 woRld cuP ManageRs (bY meNTioNs/TreNdiNG) amoNG gwi’s Real-tiMe Panel
Van Gaal
scolari
del bosque
herrera
capello
Fernando santos
Prandelli
Niko Kovac
roy hodgson
ottmar hitzfeld
toP 10 non-woRld cuP-reLaTed TreNds amoNG gwi’s Real-tiMe Panel
Wimbledon
ramadan
Netflix
Tumblr
4th of July
starbucks
Xbox
Transformers
happy Father’s day
woRld cuP: social tRends

24 15 for 15
2014 IN NUMBERS

2515 for 15
socialnetworks & messaging appsNumbers for the leading players
03
26 15 for 15
In the contest between the “Big 3” social platforms, Facebook has retained its crown during 2014 – and with some comfort. Excluding China, an impressive 82% of adults aged 16-64 report having an account on the service, a sign of the platform’s enduring global reach and social dominance. In fact, account membership stands at 90% in nearly half of the markets surveyed by GWI.
In line with wider social trends, Facebook usage is most widespread in fast-growth markets – with Indonesia (96%) and Mexico (95%) posting the best figures of all. Demographics are a partial driver of this; national internet penetrations in such countries are typically much lower than in mature markets, with online populations consequently being relatively young, urban and affluent. Audience sizes can still be vast, though: Indonesia has more than twice the number of Facebook members as the UK, for example. Other factors are at work too, though – not least that populations in fast-growth markets continue to attach a greater premium to internet access and a higher status to social networking.
Taking second place globally is Google+, a network which performs much more strongly in fast-growth rather than established markets. Indeed, while Google+ membership is not too far behind the equivalent for Facebook in most emerging nations (typically being around 15% lower in places like Indonesia, India, Thailand and Brazil), the gap is much more sizable in markets such as the US, UK and Australia (where it reaches 35-40%).
FacebookSTILL DOMINATES
With founder Vic Gundotra having departed the network during 2014, it’s clear that he left Google+ with much healthier usage figures than is often recognized. That membership has continued to climb slowly during the last year indicates the rising importance of the social platform as a social layer that connects Google services. Although like-for-like comparisons with Facebook are inevitable, it should be credited with achieving considerable success in establishing an alternative social model.
In third place is Twitter, a platform which has usurped Facebook’s crown in Japan to become the country’s most used network and which boasts membership levels of two thirds or more in Indonesia, Saudi Arabia, Turkey and India. It has also displaced Google+ in a handful of other markets, including Indonesia, the UK and South Korea.
Despite most international social networks being subject to official bans, it’s worth noting that (significant) minorities in China nevertheless have accounts on the three platforms, with Google+ (40%) being the most popular of all (thanks in part to Android’s popularity in the market). As we discuss later in this report, many are turning to VPNs and Proxy Servers in order to get access; typically, China in fact accounts for a much bigger share of the global social audience than many have previously supposed.

2715 for 15 27

28 15 for 15
GWI’s comment back in February that Facebook’s $19 billion purchase of WhatsApp was a smart move has been vindicated through the messaging service’s consistent growth throughout 2014. By Q2, it had overtaken Facebook’s own Messenger service to become the top global chat app, being used by 39% of the mobile audience (excluding China).
WhatsApp’s headline usage figure does, however, mask some extremely strong variations between markets – with engagement ranging from a high of 78% in South Africa to a low of 0% in Japan. But while usage is extremely modest in Facebook’s home market of the US (8%), the coverage it gives the network in several fast-growth markets – where internet populations are expanding rapidly each year – is a clear sign of why the app commanded such a serious price-tag.
Inside China, WhatsApp has a minor presence only (4%). In part, this is the result of WeChat’s absolute dominance within the Chinese market; a mighty 84% of the country’s mobile audience are now using the app and – despite the authorities clamping down on certain aspects of mobile messaging – its position now seems virtually unchallengeable. No other app comes close to having an audience of such a size within a single market, and that WeChat also has a significant following in India shows why the international prospects for the app are strong.
whatsaPPRULES THE MESSAGING SPACE
Elsewhere, one of the most headline-grabbing messaging apps of the year has been Snapchat, the service which famously rejected Facebook’s buy-out bid but which – rumor has it – is now on Yahoo’s horizon. Despite growth throughout the year, however, it’s important to note that Snapchat’s following remains modest from a global scale – lagging behind WhatsApp, Facebook Messenger, Skype, Viber, Line and WeChat with a headline figure of just 7%.
The reason it continues to capture our interest is clear, though: it’s a question of demographics. Snapchat records its best figures in some of the most scrutinized markets, led by the UK (14%), USA (14%), Ireland (14%), Canada (12%) and Australia (11%). What’s more, usage in these countries among the key teen segment is much, much higher – approaching 50% in the UK and Canada and above 40% in the other three markets. For targeting certain demographics in certain markets, then, Snapchat represents a highly attractive option. And remains a serious thorn in Facebook’s side.

2915 for 15 29

30 15 for 15

3115 for 15

32 15 for 15
15 FOR 15

3315 for 15
15 for 15The trends to watch in the year ahead.
04

34 15 for 15
#1GeNeraTioN V

3515 for 15
We’re all used to seeing ad campaigns which target Gen X, Gen Y or – increasingly – Gen Z. But there’s a new generation on the block who deserve just as much attention. Step forward Generation V: the millions of internet users across the world who are deploying Virtual Private Networks (VPNs) or Proxy Servers to get online.
For anyone unfamiliar with these tools, they allow people to bypass traditional connections and tracking methods to use the internet via a remotely located server; essentially, it’s as if people are entering the internet discretely via a side door rather than through the main entrance – with the servers in question often based in nations like the US, Ireland, Sweden or the Netherlands rather than the user’s home country.
To date, VPN usage has normally been viewed as a fairly niche behavior – something that’s largely the preserve of tech geeks. But our latest research shows that it’s already transitioned into a fairly mainstream trend; in 2014, more than a quarter (28%) of internet users globally said they’d used one. Across the 32 countries in which GWI conducts its quarterly research, that figure translates to more than 420 million people aged 16-64. Hardly niche, then. And with VPNs being readily available to download, easy to use and – often – completely free of charge, this is a number that’s only going to go in one direction.
Question: When you access the internet, do you ever do so using a VPN (virtual private network) or proxy server?Base: Internet users aged 16-64Source: GlobalWebIndex 2014

36 15 for 15
There are multiple reasons for using VPNs and Proxy Servers. Some internet users are simply looking to protect their anonymity, a trend which is particularly pronounced in some of the most mature internet nations like France and Germany. But by far the most popular motivations are the desire to access content or sites which are restricted in one’s own country (49%). It’s about using BBC iPlayer from outside of the UK, for instance. Or accessing that social network/news website which is subject to an official ban – something which explains why our data picks up significant audiences in China for sites like Facebook, and why authorities in Turkey found it so tricky to prevent access to Twitter early in 2014.
Question: Can you please tell us why you use VPNs or proxy servers when browsing the internet?Base: VPN users aged 16-64Source: GlobalWebIndex 2014

3715 for 15
Question: When you access the internet, do you ever do so using a VPN (virtual private network) or proxy server?Base: Internet users aged 16-64Source: GlobalWebIndex 2014
Across the board, GWI’s research shows that internet users in fast-growth markets are the most likely to turn to VPNs – led by Indonesia (where 41% of 16-64s say they’ve used one), Thailand (37%), Brazil (37%), China (36%) and Argentina (34%). Compare that to the US (16%), UK (15%) or Australia (14%) and the difference in engagement is pretty stark. Work out what that means in terms of VPN user numbers in a country like China (169 million) and it becomes more than a little concerning if you’re a content provider or advertiser.
Above all, VPN usage brings major implications for how we understand web traffic: lots of visitors who are traditionally geo-allocated to the US or other mature markets based on their IP addresses are actually located in fast-growth nations. In particular, our datasets show that large swaths of internet users in Asia Pacific and Latin America are essentially “going under the radar” when connecting to social networks, using search portals or consuming content / news. If we take a site like Bing.com as an example, data from passive web analytics will typically show that its traffic is dominated by American internet users. In contrast, our actively collected data shows that – while the US is still certainly an important market for Bing – the biggest share of its audience actually comes from China. Meanwhile, India, Brazil and Indonesia account for significant segments too.
37

38 15 for 15

3915 for 15
Question: Which of the following sites have you visited in the last month (via any device)? Base: Internet users aged 16-64Source: GlobalWebIndex Q1 2014
It’s a similar picture for a range of other sites, including Facebook. Very consistently, then, audiences in mature nations are being over-estimated – just as those from fast-growth markets are being dramatically under-appreciated. All this means that free or ad-supported content stores are being raided by users from other countries – a clear sign of unmet demand and of how willing people are to obtain the content they want. Arguably, though, these trends create their biggest headache for advertisers; each year, VPN usage means that billions of dollars of geo-targeted ad spend is potentially being misdirected.
For further detail on this subject, please download the following:The Missing Billion (GWI Insight Report) i VPN and Proxy Server Usage (GWI Data Pack) i VPNs and Proxy Servers: Usage Motivations (GWI Data Pack)
key implications for 2015
• VPN usage will increase, especially as knowledge of these tools becomes more widespread. As a result, using passive analytics alone will not give an accurate view of who is visiting your site – or being exposed to advertising.
• Attempting to block access to content or sites by setting geographical limitations will become more and more futile. Users will find ways to obtain what they want and, in a sense, the internet will become more and more globalized.
• There is significant, and largely unmet, demand for content among global internet users generally but among those in fast-growth nations in particular.

40 15 for 15
#2TabLeT FaTiGue?

4115 for 15
2014 heralded an important milestone for the tablet device; for the first time, Q2 saw the proportion of adults aged 16-64 using one to access the internet hit the 33% mark. That represented more than 500 million monthly tablet users across GWI’s 32 countries. So, all’s looking rosy in the tablet garden, then?
Well, not quite. Drill down into the numbers a little further and it’s clear that the rate of growth has been slowing for some time now. Between 2011 and 2012, the percentage accessing the internet via tablets nearly doubled (from 9% to 17%). By 2013, it had jumped again to reach 31%. But over the next twelve months, a very different picture emerged: tablet usage climbed by just two percentage points. Still rising, then, but hardly the type of explosive growth to which we’d become accustomed. In fact, year-on-year increases in user numbers have dropped from nearly +200% at the start of the decade to less than +15% in 2014.
So, if the boom days for tablets are over, what’s driving this? Examining the profile of current users gives us the best evidence: among early adopters, usage has either stagnated or is in decline. In contrast, it’s the groups who were initially quite slow to embrace tablets who are now driving today’s modest growth levels. Question: In the past month, from which of the following devices have you accessed the internet either through a web browser or an
application?Base: Internet users aged 16-64Source: GlobalWebIndex 2014

42 15 for 15
If we look at age, for example, it’s 25-34s who are the heaviest users (38% in 2014), followed by 35-44s and then the 16-24s. But there’s been no substantial growth in any of these three groups over the last year. It’s only among 45-54s and 55-64s – where historical usage levels have been much lower – that we’re still seeing increases.
Question: In the past month, from which of the following devices have you accessed the internet either through a web browser or an application?Base: Internet users aged 16-64Source: GlobalWebIndex 2014

4315 for 15
It’s a similar story for income. Although the popularity of tablets among the top group remains strong (over half are monthly users), there’s actually been a decrease in engagement during the last twelve months. Yes, numbers are still rising in the lower and middle quartiles but this is still a pretty crucial trend: with wealthier demographics having been the heaviest initial adopters of tablets, it suggests that long-term owners are using their devices less frequently than they once did.
Patterns at a national level add more support for this. The Chinese market is by far the biggest and most important for tablets; it was extremely quick to embrace the device, with 41% of adults now using them (corresponding to a mighty 192 million people). However, there’s been a 7% year-on-year decrease in usage. While this shouldn’t detract from the fact that the numbers are still ticking upwards in most other countries (even if rather modestly, in some places), the fact that Chinese usage is on the slide suggests – once again – that early tablet users are no longer quite as enthused with the devices as they once were.
Question: In the past month, from which of the following devices have you accessed the internet either through a web browser or an application?Base: Internet users aged 16-64Source: GlobalWebIndex 2014
43

44 15 for 15

4515 for 15
For further detail on this subject, please download the following:tablet trends (GWI Trend) i GWI Device (GWI Flagship Report)Internet Device Access (GWI Data Pack) i Tablet Activities: All Activities (GWI Data Pack) i Website Visitation - Tablet (GWI Data Pack)
key implications for 2015
• Overall tablet usage levels will continue to increase in 2015, but the period of dramatic growth is now over and future rises will be more modest. In short, we’ll still be using them but on a less frequent basis and for fewer activities.
• Mobile screens are getting larger, apps are growing more sophisticated and the general mobile web experience is becoming more user-friendly – all of which means the smartphone is getting better at mimicking the tablet (especially in the “phablet” category). While Apple’s iPhone 6+ was a long time in the coming, it has acted as a further catalyst for this trend. To date, publishers and brands have been investing heavily in tablet apps; we might expect this to be slightly less of a priority in the future.
• That tablet usage levels are comparatively low among 16-24s is a clear sign of the challenges that this device will face; with this demographic heavily wedded to mobiles, future growth rates for tablets could easily be impeded (although it’s worth noting that tablets are much better positioned to take advantage of growing online populations in the upper age groups). • Usage of PCs and laptops is not weakening. Any suggestion that we are approaching a “post-PC” era should thus be treated with caution.
We can reinforce this view by looking at tablet behaviors – i.e. what people are actually doing on their devices. Here, there’s a pretty consistent story of decline; across all but two of the 37 online activities monitored by GlobalWebIndex, the proportions of tablet users who said they’d done them in 2014 were lower than the equivalent figures from 2013. Put simply, tablet users are less likely to be using their device to do a range of things online now than they were a year ago; tablets have increasingly become a nice-to-have rather than an essential device, with many existing owners struggling to find a use for them.
Of course, some perspective is essential here. The number of owners is continuing to increase. And it’s not that tablets are being abandoned altogether; it’s still nearly two thirds
of users who are doing things like watching video clips or using webmail, for example. Rather, it’s that – after the initial novelty of having a tablet has worn off – the devices stop dominating internet activities in the way they typically do in the early period of ownership. People return to a much more multi-device approach.
But the big concern has to be this: while our love affair with tablets is no longer burning quite so brightly, it’s still going strong with smartphones (3 in 4 adults are now accessing the internet via a mobile and most behaviors on these devices are either stable or trending upwards). Clearly, then, one of the biggest future challenges for tablets will be to prevent smartphones from pushing further ahead and, in the process, diminishing the need for a tablet.

46 15 for 15
#3The NeW Tech eLiTe

4715 for 15
When you think of tech-savvy consumers with their finger on the pulse of the internet, the image that most often comes to mind is a New Yorker or Londoner. But as the entry barriers to accessing the internet have disappeared, emerging markets are now at the very forefront of new tech and internet trends; in these countries, many of which missed most of the century of infrastructure building that set the foundation for western media, populations have leapfrogged into the digital age. Instead of catching up with old fashions, these users are forging their own trends to become a New Tech Elite.
Internet users in fast-growth markets are often young, affluent and engaged. Brands connecting with consumers through the internet thus have access to huge numbers among the youngest demographics; 3 in 10 internet users from APAC and LatAm are aged 16-24, for example, while just 2% of Chinese, Indian and Malaysian users are 55-64. In comparison, the internet population of Europe is considerably older: 16% of internet users come from the top age bracket.
Base: Internet users aged 16-64Source: GlobalWebIndex 2014

48 15 for 15
These young internet users are getting online via a range of devices, with laptops, tablets and mobiles – often shared – being put to use. On average, Chinese internet users in fact use three devices to get online each month, with Hong Kong, Singapore and Turkey not far behind. Nevertheless, mobile is king: 86% of Chinese, 77% of Malaysian and 73% of Turkish internet users are connecting via this device, a jump of almost 20 points from two years ago. The proliferation of cheap smartphones has brought internet access to a generation who have not needed to invest much, if at all, in laptops or PCs. In contrast, users in developed countries remain much more wedded to their computers – only 46% of French users are surfing the web on a mobile.
Question: Do You Use A Mobile to Access The Internet?Base: Internet users aged 16-64Source: GlobalWebIndex 2014

4915 for 15
But it’s not just how people are going online that differentiates this New Tech Elite – it’s what they are doing on the internet too. More than 6 in 10 APAC internet users have watched TVoD online in the last month – only 39% of Europeans have. What’s more, while rates of TVoD watching in China have increased by almost 10 points in the last two years, rates in parts of Europe have been static or seen a small decline.
It’s also pretty telling that, despite Airbnb being founded and primarily based in America, interest levels in this type of service are (far) higher elsewhere; GWI’s data shows that Latin America, and in particular Brazil, are crucial markets for Airbnb-style offerings (32% of LatAm respondents claim to have used this type of service, compared to just 8% in America). The popularity of this new form of accommodation renting was boosted significantly by the 2014 World Cup and is on course to be a powerful force in the hospitality business by the time of the 2016 Olympics.
Question: Are You A Brand-Conscious Person?Base: Internet users aged 16-64Source: GlobalWebIndex 2014
49

50 15 for 15

5115 for 15
For further detail on this subject, please download the following:The Missing Billion (GWI Insight Report) i GWI Brand (GWI Flagship Report) i GWI Device (GWI Flagship Report) i Internet Device Access (GWI Data Pack) i Sharing Economy (GWI Trend) i Online Activities: Watched TV On Demand Online (GWI Data Pack) i Self Perceptions: All Perceptions (GWI Data Pack)
key implications for 2015
• As the economies of fast-growth markets continue to strengthen and average incomes rise, lucrative consumer bases will want the newest technology and internet services. And with each year that passes seeing millions of individuals in these countries using the internet for the first time, it’s these markets which will drive by far the biggest growth in terms of the size of the global internet population.
• Audiences are becoming more internationalized, connecting around passions and interests and meeting on social networks. The rise of truly worldwide platforms like Facebook and YouTube – as well as globalized access to information, education, entertainment and markets for selling – means that everyone can get great internet services regardless of local investment or market size. • Previously, some advertisers have typically targeted on a market-by-market basis, working with local advertiser sellers via agency networks. But in the era of the truly cross-border internet audience, global platforms and advertiser solutions are changing this and making global advertising much more viable.
Latin American internet users are also forging a path ahead of others in their support of crowd-funded projects, such as Kickstarter. While only 9% of Europeans have engaged with one of these projects, this rises to about a third in LatAm. This new model is yet to make a great impact in APAC (17%) but, with interest in such projects standing at 34% across the region, it’s clear that the prospects for Kickstarter and similar such services are strong.
Brand-relevant attitudes tend to be particularly pronounced among the New Tech Elite too. In countries such as France and Italy, just a quarter describe themselves as being brand-conscious; in contrast, two-thirds of Indonesian and Mexican internet users think of themselves in this way. And while majorities of Chinese (57%) and Indian (54%) internet users say that they tend to buy brands they see advertised, the already lower figures in North America and Europe are either stalling or falling.
Of course, audiences in “mature” markets remain vitally important, especially in terms of per-person spending power. But there are now huge tech- and brand-savvy audiences in other markets that might previously have been discounted due to low levels of overall internet usage or modest GDP rates. And, as the costs of devices and internet access continue to fall, we’re looking at a global marketplace where the barriers which used to delineate the “developed” and “developing” worlds are increasingly meaningless.

52 15 for 15
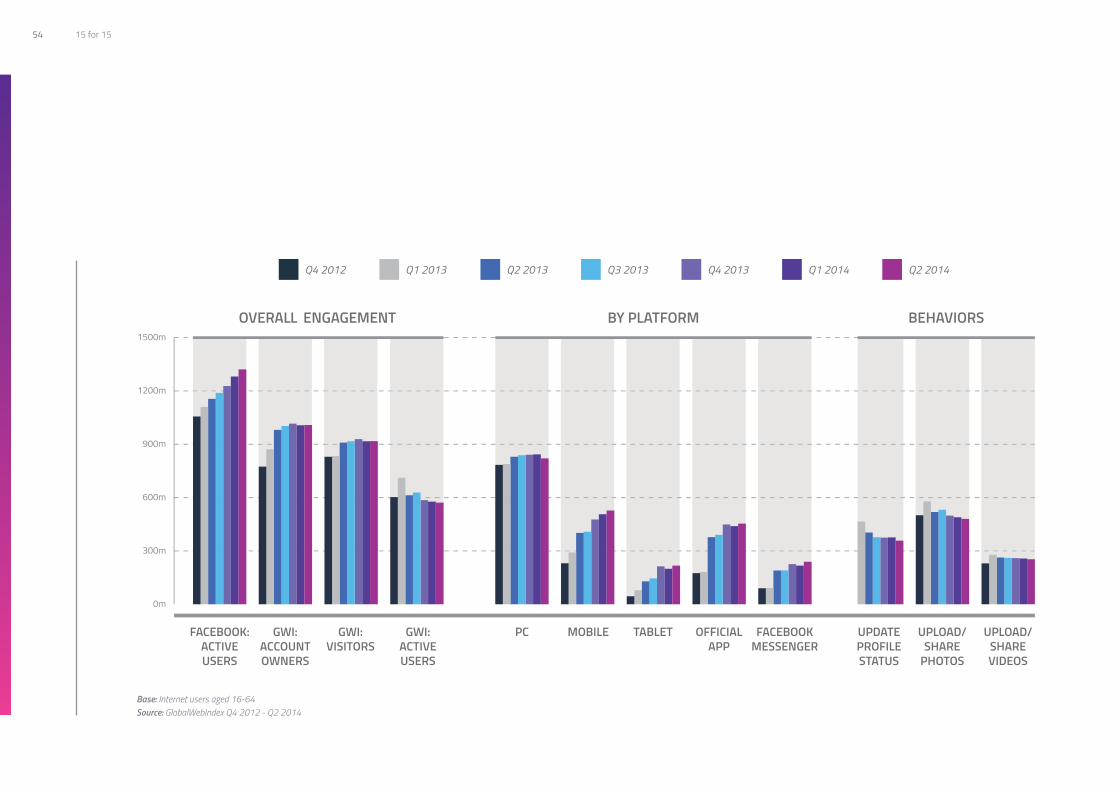
#4FACEBOOK GETS PASSIVE
5315 for 15
Facebook was once the natural go-to point for most of the things we wanted to do on social networks. But as the online space has become more crowded and competitive, the one-site-fits-all model of networking has been losing ground; messaging services as well as more specialized platforms like Instagram and Pinterest have all seen strong growth as people have turned to different services to carry out different activities (for more on this, see our Multi-Networking trend). Meanwhile, Facebook itself has been recording small declines in active usage.
While this has been happening, some have leapt at the chance to proclaim the “end” of Facebook – an almost guaranteed way to grab headlines and capture attention. But this is a serious misunderstanding of current trends. Perspective is essential here; although Facebook might have become the site that it’s no longer terribly cool for some segments to say they use or like, it’s still the number
one global service (and by quite some distance). It has more members, more visitors and more active users than any other social network. So too can Zuckerberg and co boast ownership of one of the the fastest growing networks (Instagram) and one of the biggest rising messaging services (WhatsApp).
It’s not that people are abandoning Facebook, then; rather, it’s that people are carrying out fewer actions once there. We’re still visiting it, but we’re not necessarily using it for all of the things that we once did. It’s becoming more of a general hub that connects and underlies many of our social behaviors, rather than the place that hosts them directly.
Looking at some of Facebook’s numbers from GWI’s 32 markets over the last year is perhaps the best way to illustrate this.
54 15 for 15
Base: Internet users aged 16-64Source: GlobalWebIndex Q4 2012 - Q2 2014

5515 for 15
Membership of Facebook has been trending upwards for some time now. Sure, it’s increasing at a gentle rate – and did see a very small decline in the last quarter – but the upward pattern for this measure has been a pretty consistent one. Considering that the service is now more than ten years old, that’s an impressive achievement – especially as the numbers who say they have visited the network via any device within the last month remain in the ascendancy too. In terms of overall reach, Facebook is still the giant it’s always been.
It’s only when we turn our attention to what GWI defines as active usage (those who consider themselves to be actively engaging with Facebook) that a different picture emerges; on this measure, there’s a continuing decline in evidence. That the drop is consistent across all regions strongly suggests that – while people are not leaving Facebook – they are beginning to use it a little less frequently and/or intensively than before. In a nutshell, Facebook usage is becoming more passive – a trend reflected in the shrinking numbers carrying out fundamental actions such as updating their status or uploading/sharing photos and videos. The same pattern emerges if we analyze the numbers who say they have clicked the “like” button in the past month: across 2013 and 2014, there has been a steady decrease here. Question: Thinking about Facebook, could you please tell us if you have done any of the following in the past month through any device?
Clicked the Facebook Like buttonBase: Active Facebook users aged 16-64 Source: GlobalWebIndex Q1 2013 - Q2 2014
55

56 15 for 15

5715 for 15
For further detail on this subject, please download the following:GWI Social (GWI Flagship Report) i Understanding Facebook’s User Numbers (GWI Trend) i Facebook Visitors in MENA (GWI Infographic) i WhatsApp Users (GWI Infographic) i Instagram Users (GW Infographic) i Account Ownership: Social Platforms (GWI Data Pack) i Active Usage: Social Platforms (GWI Data Pack) i Website Visitation (GWI Data Pack)
key implications for 2015
• Facebook will remain the number one global social platform, offering the greatest reach and the most members. It is so embedded within online infrastructures and networking habits that it will not be abandoned or lose its relevance. This is especially true now that it owns Instagram and WhatsApp; although both services are to remain separate from Facebook, they are part of its architecture.
• Despite Facebook’s quest to develop more innovations in-house, its track record of successful and highly on-trend purchases – together with its vast resources – make further acquisitions highly likely in 2015.
• Networking will continue to grow more specialized and mobile-centric, with usage of the bigger platforms like Facebook, Twitter and Google+ evolving as a result. Any declines in behaviors on these services will be seized upon as evidence for the “death” of social networking, but they need to be viewed within the context of wider social behaviors and the diversifying number of platforms available to internet users.
In conjunction with the rise of more specialized services, this shift from active to slightly more passive engagement on Facebook is an inevitable consequence of social networking migrating to mobile devices – a space where the newsfeed becomes key and people are more likely to be viewing updates rather than actively interacting with others. Despite its protestations otherwise, Facebook’s decision to strip the messaging functionality out of its main app and move people to using the dedicated Messenger service instead is a clear response to this; the danger for Facebook was that its mobile presence (and brand) became increasingly sidelined – especially considering that WhatsApp is positioned as a standalone service. By encouraging (or forcing) people to use Messenger, Facebook retains its relevance and presence even as mobile behaviors evolve. And it’s a tactic that has paid clear dividends; as our timeline earlier in this report demonstrates, usage in countries like the UK and Sweden jumped massively during 2014. People are still Facebooking, then, but in a new way.
What’s more, brands should not necessarily view these changing user behaviors on Facebook as a problem. Firstly, the arrival of Atlas allows Facebook to target people effectively across devices and browsers, a theme we explore in more detail in our Track Me If You Can trend. But, just as critically, the huge success of Facebook Exchange and existing mobile advertising solutions has been underpinned by the proposition of reaching specific audiences or people; for ads to be targeted accurately, people don’t need to be actively engaging with Facebook, they just need to be visiting it or have the app installed. So, as long as visitor numbers remain stable or on the rise – as they have been for a long time now – revenues will follow.

58 15 for 15
#5TV.COM

5915 for 15
We’re all used to hearing about the increasingly online nature of our daily lives as well as the shift from traditional to digital forms of media. But GWI’s long-term data shows that an important milestone has now been passed: 2014 marked the first time that, on average, younger internet users watched more than an hour of online television each day.
Of course, one (rather large) caveat is needed here: linear TV is not being abandoned. Despite consistent year-on-year rises for online viewing, traditional TV still rules the roost – accounting for the biggest share of our time each day and remaining our single biggest media activity by some distance. Globally, we still watch around 2.5 hours of linear TV each day; that represents nearly a quarter of our total media time and compares to just 0.70 hours spent on online viewing.
Base: Internet users aged 16-64Source: GlobalWebIndex 2014

60 15 for 15
Even so, the time we devote to online TV has been rising in almost every country surveyed by GlobalWebIndex – just as the number of hours spent on linear TV has typically been edging downwards very gently. The shifts might not be dramatic, but the direction of travel is clear: we’re seeing a small and gradual migration away from linear towards online, driven – among other things – by the easy availability of online catch-up and streaming services as well as the creation of online-only content from names such as Amazon, Netflix and the BBC. It also reflects growing usage of mobiles and tablets as content consumption devices.
This picture can however vary significantly at a national level. In several mature markets – including Australia, France, Japan and the Netherlands – typical daily time spent on linear TV is at least five times greater than the equivalent devoted to online forms. And it’s Americans who remain the biggest linear TV consumers of all, watching an average of some 3.40 hours per day.
Question: On a typical day, roughly how many hours do you spend on/doing the following?Base: Internet users aged 16-64Source: GlobalWebIndex 2014

6115 for 15
Question: On a typical day, roughly how many hours do you spend on/doing the following?Base: Internet users aged 16-64Source: GlobalWebIndex 2014
In contrast, internet populations in several fast-growth markets have embraced online TV more fervently. As an example, internet users in China are now watching just 1.17 hours of linear TV per day, meaning it’s in this country where online and linear viewing are closest to reaching parity (with the former now accounting for 1.03 hours per day). This, then, could be the first market where – as we’ve already seen in most countries in relation to print press – online takes the lead.
By far the most striking trends emerge if we look at television viewing behaviors by age. When the BBC announced its intention to shift its youth-oriented BBC3 channel online, there was a predictable – but nevertheless sizable – outcry from most quarters. The corporation defended the decision by asserting that “for this [younger] generation… [on-demand viewing] is a key part of the future for public service broadcasting. It’s the gateway for people who increasingly want to watch and listen to what they want, when they want it – on tablets, on mobiles as well as other screens.”
GWI’s figures confirm that it is indeed younger viewers who are engaging with online TV (and online media more generally) the most enthusiastically. Above all, it’s the rise of mobiles which is driving this; 16-24s spend the most time online overall but, while the gaps between them and other age groups are relatively small for PCs, laptops and tablets, they are sizable for mobiles (55-64s are typically spending just 0.54 hours on the mobile web each day, a figure which jumps to 2.77 hours for 16-24s).
61

62 15 for 15

6315 for 15
For further detail on this subject, please download the following:Digital vs Traditional Media Consumption (GWI Insight Report) i GWI Entertainment (GWI Flagship Report) i Time Spent Watching TV - Traditional (GWI Data Pack) i Time Spent Watching TV Online (GWI Data Pack) i Online Activities (Any Platform): Watched TV On-Demand Online (GWI Data Pack) i Online Activities (Any Platform): Streamed Live TV (GWI Data Pack)
key implications for 2015
• With digital media commanding an increasing share of our time, there are clear implications for online marketing budgets – especially as the need to validate audiences becomes more important. And this is very much a cross-market phenomenon, with consumers in fast-growth markets typically spending the most time online (despite national internet penetration rates often remaining modest).
• Traditional media still remains hugely important, especially for television; while we are certainly seeing shifts from offline to online, their scale and speed should not be over-exaggerated. Indeed, rather than traditional being replaced by digital, in many contexts it’s much more accurate to talk of them co-existing in parallel as behaviors evolve to incorporate elements of both. This requires strategies which are increasingly digital-first but which nevertheless reflect the fact that there are multiple media touchpoints for today’s internet users.
• Across the board, mobile is rising rapidly and accounting for a bigger and bigger share of the total time spent online. The days when the internet = a browser on a PC/laptop are long over. This trend is especially pronounced among younger segments – and 16-24s especially – as well as in fast-growth markets. Mobile-first content and apps must be an absolute priority.
Question: On a typical day, roughly how many hours to you spend on/doing the following?Base: Internet users aged 16-64Source: GlobalWebIndex Q4 2012 - Q2 2014
It’s also pretty telling that the amount of time spent on linear viewing rises directly in line with age whereas, for online TV, 16-24s watch four times as much per day as 55-64s. Currently, 16-24s are in fact the only age group already spending a daily average of 1 hour+ on online TV (up from 0.82 hours in 2012).
Age-based differences are even starker when these figures are converted to percentages: in the youngest group, a third of the total time spent watching television is on online forms (vs just 7% among 55-64s). Although BBC3’s fate is far from finalized, then, it’s not hard to understand the reasons why the corporation’s youth channel was selected for the move to online. Linear TV might still be the most dominant force, but younger consumers are at the very forefront of the charge towards online entertainment.

64 15 for 15
#6chiNa risiNG

6515 for 15
For some time now, economists have been debating the exact moment when China’s rapidly growing economy will overtake that of America to become the biggest in the world. But there’s one area where this reversal of positions has happened already – and that place is online.
Despite markets like the US and UK continuing to dominate the world of digital trends, the simple fact is that the size of China’s online population dwarfs the equivalent in any other nation. As our chart shows, Chinese internet users outnumber their American counterparts by a ratio of more than 2.5 to 1; across the 32 markets that GlobalWebIndex surveys each year, the country in fact accounts for just over 30% of all users. That gives China vast influence in terms of global trends and shows why, without success in this particular market, global penetration figures for particular services or websites are rather compressed.

66 15 for 15
As Alibaba prepared to float, raising its stock price in response to unprecedented levels of demand, many in the West were left a little surprised about the sheer scale and size of Alibaba’s operations. But GWI’s data shows why it’s enjoyed such huge levels of success: internet users in China are the most likely of all to purchase products online each month. The stats are in fact pretty breath-taking: a huge 84% of online adults aged 16-64 bought something online last month, a figure which – by our estimates – translates to nearly 400 million people. It’s also in China where we find some of the most developed levels of m- and t-commerce, as well as a significant minority (of c. 40%) who are using the internet to sell products.
If you’re still skeptical about these numbers, then taking a closer look at other digital areas gives further confirmation of China’s growing digital dominance. Tencent-owned WeChat has more monthly users than either WhatsApp or Facebook Messenger. It’s a trend being driven by near-blanket usage in China; more than 4 in 5 among China’s mobile internet population are using WeChat each month, giving it the type of reach that most other messaging services would kill for. But with significant (and growing) user bases in many other countries – including Singapore, India, Malaysia and Taiwan – it’s a fairly safe bet that we’ll be hearing more about WeChat in the months ahead.
Question: Which of the following things have you done online in the last month? Purchased a productBase: Internet users aged 16-64Source: GlobalWebIndex 2014

6715 for 15
It’s a similar story with social networks. If we rank all of the platforms tracked by GlobalWebIndex by their global member numbers, Chinese services account for four of the top ten – with Sina Weibo and Tencent Weibo (roughly speaking, Chinese equivalents of Twitter), Youku (comparable to YouTube) and Qzone (reminiscent of Facebook) all featuring on the list.
Question: On which of the following services do you have an account? Base: Internet users aged 16-64Source: GlobalWebIndex 2014
67

68 15 for 15

6915 for 15
For further detail on this subject, please download the following:China (GWI Market Report) i GWI Commerce (GWI Flagship Report) i Website Visitation (GWI Data Pack) i Social Networking in China (GWI Infographic)
key implications for 2015
• The continuing ascendancy of Chinese companies – as well as those from other fast-growth nations – will represent a bigger and bigger challenge to the previously dominant position of US-based names. Amazon is already out-gunned by Alibaba in terms of size but, to date, the former has been able to trade on its much greater recognition levels among consumers in established markets.
• Online buying has for some time now been an integral part of the social experience in a country like China, with internet users much more willing to make purchases outside of “traditional” e-commerce environments. International success for a company like Alibaba – which is a hub for more activities and services than we have traditionally been accustomed to in “mature” markets – could well encourage this mindset to spread. That a company like Twitter is so keen to introduce a “Buy” button is a sign that activity in this area is set to intensify.
From commerce to social, then, it’s pretty clear that Chinese companies are already global players in their own right, with audience sizes which are at least comparable to – if not bigger than – the equivalents for Western companies like Amazon, eBay, Facebook, WhatsApp, Twitter, etc. Typically, we don’t know much about them in places like the UK or US because Western companies have captured much more attention. As digital behaviors are still scrutinized much more closely in the “mature” markets, the rise of Chinese platforms has often passed unnoticed. In short, we’ve perhaps been a little guilty of assuming the West-to-Rest model is still dominant, not factoring in the possibility of it being disrupted by companies from other markets.
Certainly, names like Facebook, Twitter and Amazon do have footprints in China (as we’ve seen above, large numbers are turning to VPNs, Proxy Servers and other tools to gain access to those sites subject to official restrictions). But
they’re nevertheless at a distinct disadvantage compared to China’s home-grown players which already have vast and captive domestic audiences. In that respect, the Alibabas and WeChats of the digital world are in a pretty unique and hugely interesting position: having achieved sizable followings in China, they’re now looking outwards for further success. Meanwhile, their international competitors have considerable – and perhaps even insurmountable – ground to cover before their Chinese audiences could be anywhere near comparable.
If Alibaba does go on to thrive outside of China – and its flotation proves that there’s certainly huge interest – we’ll be looking at a truly global digital giant. Seen in this light, the notion of West-to-Rest begins to feel pretty anachronistic. And that the company achieved the biggest ever IPO valuation doesn’t seem quite so surprising.
Alibaba’s flotation is a clear sign of things to come.

70 15 for 15
#7The sLoW deaTh oF search

7115 for 15
challenge this presents for Google is not just that search is less of a fundamental behavior on this platform. It’s that mobiles have brought with them so many other ways for consumers to navigate the internet and find the information for which they are looking.
Now, let’s be clear here. Search engines are not about to disappear overnight. Nor is Google’s relevance about to be wounded fatally. Nevertheless, looking at some of the numbers for search gives a clear sign of the challenge that the internet giant faces.
With 2014 marking the 10th anniversary of Google’s IPO, it’s hard to deny the ubiquity that the search portal has in the daily lives of digital consumers; of the 150 or so web brands tracked by GlobalWebIndex, Google is the one with by far the best reach. Indeed, that 85% of adult internet users are visiting the site in some form each month is a remarkable achievement (by way of comparison, the next closest names – YouTube and Facebook – can boast visitation rates of 67% and 60% respectively).
Nevertheless, Google has a problem. And that problem is mobile. Its current dominance on the web is a result of PCs and laptops being so fundamental to the way that the internet developed. And while these devices aren’t going anywhere – with multi-device internet usage being the standard approach adopted by most users – it’s clear that mobiles are playing an increasingly important role as internet access points (with their audience increasing in size with each quarter of research that we undertake). The
Question: Which of the following sites have you visited online in the past month? A search engineBase: PC/Laptop Users aged 16-64 Source: GlobalWebIndex 2014

72 15 for 15
Firstly, overall usage of search engines is in decline. Certainly, it’s a very, very gentle decline – from 90% in 2009 to 86% in 2014 (with vertical searches within other websites playing their part here: why look for a product on Google when you can go straight to Amazon and start your search there instead?). On first glance, this very slight downward trend might not seem dramatic. However, we have to remember that the size of the global internet population has grown dramatically during this period; a 4% drop over 5 years in fact represents a huge segment of internet users who are no longer turning to search engines as the gateway to the internet.
Far more significant, though, is the strong link between Google and PCs/laptops. Look at engagement rates by device and the differences are stark: the vast majority of PC and laptop users are visiting Google on a monthly basis, whereas the equivalent figure among mobile internet users is just 50%. And even on tablets, where the experience is closer to a PC, it’s only 57% who are visiting Google. As we’ve stressed, PCs and laptops aren’t being abandoned. But it is clear – and abundantly so – that mobiles are capturing a progressively bigger share of internet time and traffic, especially in fast-growth markets.
Question: Which of the following websites / services have you visited or used in the last month? GoogleBase: Internet users aged 16-64Source: GlobalWebIndex 2014

7315 for 15
Of course, most web brands would pay a handsome premium to have a 50% reach among mobile internet users. Seen in this light, these numbers are still pretty solid for Google. But that there is such a gap between the brand’s usage on different devices is a clear sign of the fundamental changes to web behaviors that the rise of the mobile internet is causing.
We find more evidence for this evolution if we look at the sources people say they use to investigate products and services on the internet. Despite search engines being in first place – at just over 50% – it’s the sheer diversity of sources that people now use which is the most striking trend here. Search engines might be a default go-to point on the internet, but they don’t dominate our commercial behaviors in quite the way that many have supposed.
Question: Which of the following online sources are you primarily using when you are actively looking to find out more information about brands, products, or services?Base: Internet users aged 16-64Source: GlobalWebIndex 2014
73

74 15 for 15

7515 for 15
For further detail on this subject, please download the following:Teens (GWI Audience Report) i GWI Brand (GWI Flagship Report)Types of Site Visited (GWI Data Pack) i Brand Research Channels (GWI Data Pack) i Brand Discovery Touchpoints (GWI Data Pack) i Website Visitation (GWI Data Pack)
key implications for 2015
• The dominance of search will continue for some time to come, remaining the default go-to or starting point in many purchase journeys. But it’s now beyond doubt that mobile tools – and apps in particular – will play an increasingly important role here, something which brings considerable consequences for the potential effectiveness of paid search on these devices.
• While younger internet users have not abandoned traditional research channels, they are much more open to using newer avenues of exploration and tend to place a higher general premium on anything to do with mobile or social.
• From a long-term perspective, the way the internet is evolving means that visiting a stand-alone search engine will make less sense; as such, we can expect Google (and other names operating within the search space) to place considerable focus on innovating and refining their offers so that they react to changing user behaviors.
or mobile-friendly channels without visiting a search engine first. And although still in their nascent stages, we have to imagine that the growing sophistication of visual- or voice-based technologies will eventually have a similar impact on the need or desire to visit a search portal.
As we’ve noted, the scale and speed of the changes in behavior here should not be over-estimated. But that this is one further area where mobiles are having a transformative effect seems clear.
Break these figures down by age and some particularly interesting trends emerge. Among teens – defined here as 16-19s – usage of search engines is absolutely in line with the average. Yet look at the places where the youngest internet users over-index the most and it’s mobiles that come top of the list: teens are 30% more likely than average to be using apps as a research channel. They’re also ahead on other “newer” sources of discovery such as video/content sites, micro-blogs and pinboards. In a sense, then, the rise of mobile means that – in some cases – search engines are being leap-frogged; we’re going directly to familiar, popular
76 15 for 15
#8aLWaYs-oN coNsumers:WearabLe Tech GeTs maiNsTream

7715 for 15
Once upon a time, the consensus in some quarters was that wearable tech would explode on to the scene and transform the daily life of the typical digital consumer. In truth, the Wearable Revolution has been a slow burner; early adopters and tech influencers aside, new releases have been greeted with a sense of curiosity more than a burning desire to buy them.
One of reasons for this has been a failure by the industry to provide consumers with good enough reasons to use wearable tech; essentially, it’s felt as if a large number of wearable devices released thus far have been created because they could be, not because they were genuinely needed. As a result, wearable tech still inhabits the domain of a nice-to-have device, rather an essential must-have one. Google Glass – which we reviewed during 2014 – is a prime example of this; it’s a fun device that most people want to play with once, but what’s the reason for wearing it
a second time? It’s also pretty telling that the Pebble watch received a hefty price-cut towards the end of 2014; this was always part of the plan, so we were told, but a lack of marketplace enthusiasm is likely to have played a part too.
All that said, a number of signs point to 2015 being a big year for wearable tech. Firstly, the long-awaited Apple Watch has now graduated from rumor to reality. It’s far from the first smartwatch to hit the market, but the über-loyalty of Apple consumers means that its arrival is more hotly anticipated than any of its rivals. In short, many iPhone users will want to buy it because it’s an Apple product, rather than because they were in the market for a smartwatch per se. It’s also true – as Apple itself has pointed out – that the company has a proven track record of entering a sector late but then establishing a commanding position of influence.

78 15 for 15
Base: Internet users aged 16-64Source: GlobalWebIndex 2014
Elsewhere, Google Glass is widely expected to release a Consumer Edition carrying a (much) lower price-point than the Explorer version (which has priced all but the most committed out of the market). More generally, high-profile hirings of big-name fashion designers by wearable tech companies mean that the aesthetics of the devices in question continue to improve. And developers now seem to have clocked that features need to be genuinely useful rather than just cool – that they need to offer a better / more convenient / more intuitive experience than using a smartphone for the same activity.
But perhaps the most promising sign for wearable tech is the strong levels of interest it generates among consumers. As our chart shows, current levels of engagement with devices such as smart wristbands and smartwatches might be relatively modest (a fifth globally report having used one), but twice the number (two fifths) are keen to try them in the future.

7915 for 15
Despite the US being the home of Google Glass (as well as some other notable pieces of wearable tech), it is North America which posts the lowest figures of all. With the European numbers also being comparatively low, it’s clear that consumers in these markets remain more skeptical than their counterparts in other regions. However, the older average age profile of European and North American internet populations is a strong contributor here: younger consumers consistently express by far the highest levels of enthusiasm.
Question: Which of these things have you done already and which are you interested in doing in the future? Use wearable technology that connects to the internet (e.g. a smart watch, a smart wristband, Google Glass)Base: Internet users aged 16-64Source: GlobalWebIndex 2014
79

80 15 for 15

8115 for 15
For further detail on this subject, please download the following:Wearable Tech (GWI Trend)
key implications for 2015
• Wearable tech still has a number of hurdles to overcome as well as a range of consumer reservations to address – from concerns over privacy and data collection to questions about its practicality and appearance. Clearly, we are still some distance from it being a regular sight on the streets, especially as expressed levels of interest will always outpace actual, on-the-ground levels of engagement. Nevertheless, that wearable technology represents a significant future access point for the internet is something of a certainty. Today’s multi-device approach to internet usage is about to expand still further.
• The amount of time we spend on the internet is bound to increase, especially as wearable tech brings coverage to new occasions and locations. As a 24-hour, any-location type of internet access becomes more common, we will talk much less of “going online” and “logging in” and much more of “tuning in and out” from the internet. And with consumers in search of ever more convenience, it’s highly likely that certain online behaviors which have already migrated heavily to mobiles could jump once again, this time to wearable devices.
Globally, men have a lead over women and the younger age groups post much stronger figures than the older ones. But while the expense of certain wearable tech devices has traditionally meant they are associated with wealthier demographics, there is less of an income effect in evidence than might have been expected. Certainly, respondents in the top income quartile do show the highest levels of engagement to date (26%), but the gap between them and the middle (20%) or bottom quartiles (22%) is not substantial. Levels of future interest are also relatively even. Wearable tech can thus boast fairly universal appeal in this respect, meaning the Apple Watch and other devices are entering a marketplace in which consumers of all wealth levels are potential customers.
It might have been a relatively slow start for wearable tech, then, but 2015 should be the year when it gets much more mainstream.

82 15 for 15
Google Glass remains something of an enigma. Sure, most of us have read about it and seen videos of it in action. But very few of us have actually worn a pair; essentially, it’s the idea of Google Glass that has shaped most of our views to date, not the reality.
With little or no hands-on experience of Google Glass, it’s easy to subscribe to the view that the device is the White Elephant of the wearable tech world. But its current rarity is also its biggest trump card: attempt to find anyone with an interest in tech who isn’t at least a bit keen to try a pair out for themselves and you’ll have a long old search.
So, leaving all preconceptions and Glasshole references at the door, GlobalWebIndex spent some time in 2014 playing with wearable tech’s most famous creation to give a view on that most crucial of questions: will people continue to use Google Glass once the initial novelty fades?
Now, Google has been pretty clear that the Explorer Edition made available to purchase in the US and UK markets was very much a beta work-in-progress; the device is still at the beginning of its journey and Google is keen for initial users to help shape its future. But with a price-tag of $1500/£1000, Explorers are (rightly) going to expect to get a lot for their money. And herein lies the major problem for Google Glass in its current iteration: the Explorer Edition comes with some fairly chaotic juxtapositions. It’s a device where possibility
meets frustration, where neat features sit side-by-side with rather irksome ones, and where the user experience veers between the cool and the slightly awkward. It is fun, but it’s not yet useful enough.
Let’s start with some positives. Firstly, it’s nowhere near as cumbersome, clunky or unstylish as sometimes stated. Quite the opposite, in fact: it’s pretty light and comfortable, it’s not too intrusive on your vision and you become used to wearing it remarkably soon after putting it on. And while it will need a lot of changes before it’s anything approaching a discreet device – no-one is going to miss the fact that you’re wearing it in its current version, that’s for sure – it does have a certain elegance and simplicity (something which is equally true for the unboxing experience: retrieving Google Glass from its packaging for the first time is pretty satisfying).
In terms of capabilities and features, even the most skeptical of users out there would be hard-pressed to deny that some of them are pretty useful. While not perfect – especially outside – the voice recognition works better than several other comparable systems, particularly for searches. The app range, although currently limited, contains most of the big names that you would want, Google Now is as cool as ever and it’s obvious to see how the directions and other location-based features will prove useful. It’s also pleasingly quick and easy to capture videos and photos.
google glass Reviewed:hit oR hYPe?

8315 for 15
That said, many of these potential strengths are not quite realized in the best way in the current iteration of Glass. One of the most obvious instances of Google developing a feature because it could, rather than because it would be truly wanted, is the ability to take a photo by winking one of your eyes (the alternative being to use voice command, which takes a little longer). This is one place where wearable tech should – and does – have an obvious advantage over a smartphone; instant capturing means no photo opps are missed while you rummage for your mobile and fire up its camera. But after you’ve had a little fun “calibrating” Glass to your eyes and winking cheekily at colleagues to capture a photo of them, the idea of doing this while out and about is (for this user at least) incredibly unappealing. In fact, most people are still pretty nervous when they see you’re wearing Google Glass: the perception remains that everyone who uses the device is capturing footage on a constant basis.
This touches on a wider problem which cuts across the whole Glass experience: you get the sense that developers have spent so much time concentrating on the appearance of the device itself that they’ve forgotten about how the user behind the Glass will look (or want to look). Too often, interacting with Google Glass makes you look thoroughly distracted. Or, worse, a little stupid. It’s just too obvious when a user is looking at the screen, something which undermines how stylish the device itself can be in isolation. Similar frustrations emerge in relation to the “OK Glass” command; it’s fine at first but the device’s need for constant confirmation quickly becomes frustrating. There’s also far too heavy an emphasis on connecting to Google+, while the battery life simply has to get better.
None of these issues represents a fatal blow for the device, however. As we’ve noted, this is still the beta version and a few tweaks here and there would transform the user experience. If the gesture for capturing a photo was changed from a wink to something slightly more acceptable, for example, then you’ve suddenly got an amazing – and genuinely useful – feature that no smartphone would be able to replicate. And this is exactly where Google needs to go on the attack: so many of the activities that we currently carry out on our phones could easily migrate to Glass and become extremely intuitive, quick and – crucially – hands-free.
There can be little doubt that Google Glass is a device which has the potential to be genuinely game-changing in a future incarnation. Sure, capabilities need to evolve, public perceptions need to shift, the price-tag needs to fall and Google needs to give us better reasons to use it. But all of these hurdles are perfectly jumpable. It’s still legitimate to question whether “typical” consumers will be using it on the streets any time soon, but its potential applications in more specialized contexts are already immense (it’s not hard to picture subsequent versions being used by health professionals, inside industry or in military environments, for example). And the glimpse it gives us into just how much more connected and internet-integrated our lives could soon become is genuinely exciting.
For the moment, though, we should just enjoy Google Glass for what it is: a fun novelty with some seriously cool – if not yet fully refined – capabilities.

84 15 for 15
#9ANDROID EXCELS

8515 for 15
Within the digital community, few events create quite such a buzz as the release of a new iPhone handset. For many, it remains the smartphone par excellence – and the one for which apps are almost always developed first.
Look at the numbers, though, and this enduring Apple-first mindset becomes a bit questionable. At a global level, Android is now in a truly dominant – and almost unchallengeable – position; while a mighty 69% of mobile users have the Android operating system, just a fifth are running Apple’s iOS for iPhone.
That Android is in first position is not a new development; it’s enjoyed a lead over iOS in each of GWI’s research waves from 2011 onwards. What has changed is the size of the gap separating the two.
Question: What operating system runs on your mobile? Base: Mobile users aged 16-64Source: GlobalWebIndex 2014
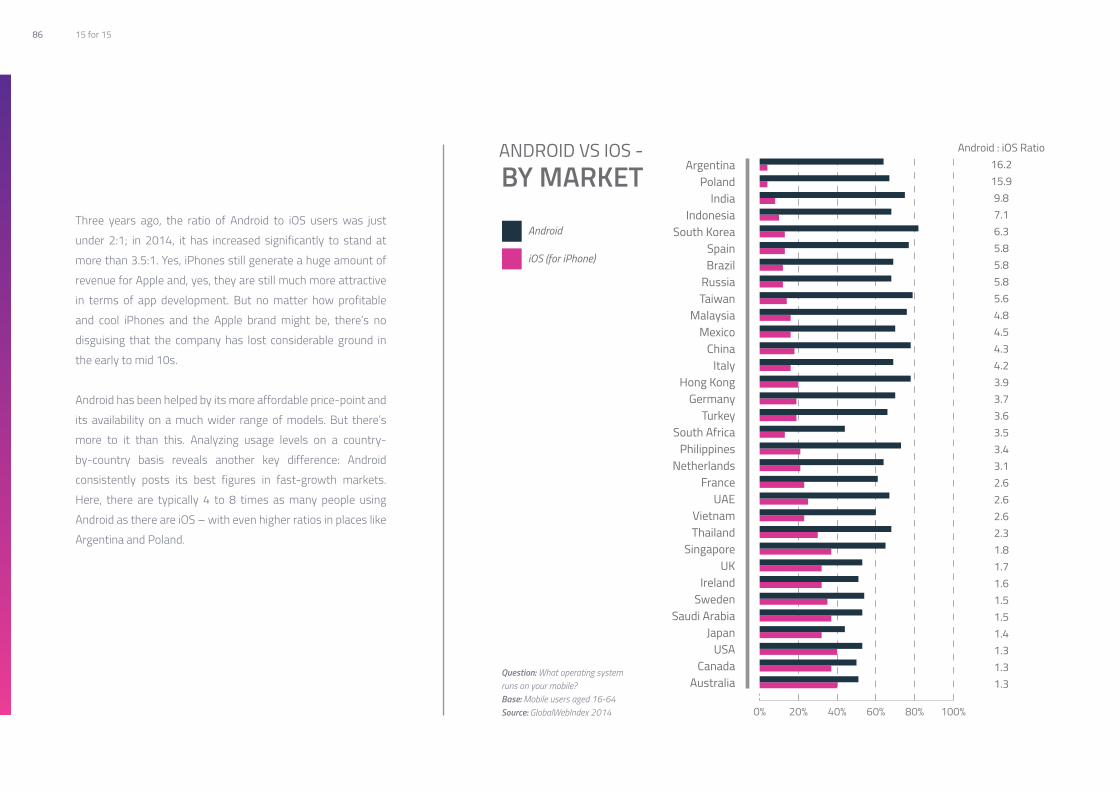
86 15 for 15
Question: What operating system runs on your mobile? Base: Mobile users aged 16-64Source: GlobalWebIndex 2014
Three years ago, the ratio of Android to iOS users was just under 2:1; in 2014, it has increased significantly to stand at more than 3.5:1. Yes, iPhones still generate a huge amount of revenue for Apple and, yes, they are still much more attractive in terms of app development. But no matter how profitable and cool iPhones and the Apple brand might be, there’s no disguising that the company has lost considerable ground in the early to mid 10s.
Android has been helped by its more affordable price-point and its availability on a much wider range of models. But there’s more to it than this. Analyzing usage levels on a country-by-country basis reveals another key difference: Android consistently posts its best figures in fast-growth markets. Here, there are typically 4 to 8 times as many people using Android as there are iOS – with even higher ratios in places like Argentina and Poland.

8715 for 15
Question: What operating system runs on your mobile? Base: Mobile users aged 16-64Source: GlobalWebIndex 2014
87

88 15 for 15

8915 for 15
For further detail on this subject, please download the following:GWI Device (GWI Flagship Report) i Operating Systems: Mobile (GWI Data Pack) i Operating Systems: Tablet (GWI Data Pack)
key implications for 2015
• The Apple-first mindset in terms of app development and the more general mobile web experience is unlikely to weaken. But optimizing for Apple before any other operating system will bring very different results depending on the demographic and market in question. In no country will it provide reach of over 40% in terms of the mobile population; in some cases, the figure will be much lower than this.
• Android must not be an afterthought. Certainly, this OS presents its fair share of challenges for publishers – with the wide range of devices on which it runs creating obvious hurdles in terms of app development. Nevertheless, its position in some quarters as the poor relation of iOS is a serious disservice to global trends; quite simply, Android has a much bigger audience already and its reach is growing at the quicker rate. Failing to provide apps and other tech infrastructure for these users risks excluding a huge segment of the mobile audience.
In short, Apple has failed to demonstrate its appeal in the majority of emerging markets. But these countries are hugely important for any mobile brand: their online populations are growing at rapid year-on-year rates, with mobiles representing a particularly important internet gateway. A lack of engagement now is an obvious issue, but it’s one which will get more and more serious in future years: if Apple can’t begin winning users in these markets, the gap separating it from Android at a global level will only get bigger. It’s also pretty telling that Android is ahead of iOS in every single market surveyed by GlobalWebIndex; while Android is used by more than 50% of the mobile audience in 30 of GWI’s 32 countries, iOS hits the 40% mark in just two nations.
There are some positives for Apple, though. It enjoys its best engagement rates in a number of key, mature markets such as Australia, Canada, the US and Japan – a trend which, incidentally, helps to explain the buzz that Apple always generates: we tend to hear far more about digital behaviors in these markets (which are seen by many as a bellwether for what’s happening at a global level).
One of its other strengths emerges when we look at the demographics of mobile users. Compared to Android, it can claim that its users have a wealthier profile (usage of iOS increases in line with income, whereas the equivalent Android figures fall slightly).
This, then, is the key tension for marketers to contend with in 2015 and beyond: does Apple’s stronger performance among higher income consumers and in the markets usually considered to be the most “important” outweigh Android’s soaring popularity at a global level?

90 15 for 15
#10riP sms?

9115 for 15
While 2014 was a big year for acquisitions and new product launches, we also waved goodbye to a number of once-notable or dominant names in the digital space.
Following the transformation of Dutch networking site Hyves into a gaming platform in late 2013, September saw Google’s Orkut platform shutting its doors for the final time – a move which highlighted the continuing difficulties that local social networks are having in the face of competitors which can boast truly global audiences (Orkut had relatively impressive memberships levels in markets like Brazil and India but had failed to make much of an impact in the majority of GWI’s countries).
Elsewhere, Apple’s announcement that the iPod Classic was being withdrawn was a clear sign of the times; it’s still one of the company’s most iconic products, but the shift towards listening to music via a mobile had long diminished the iPod’s relevance. Microsoft ended support for Windows XP and Office 2003, the plug was pulled on MSN Messenger in its final market (China), Facebook all but killed off its unsuccessful “Gifts” trial
Question: Which of the following have you done on your mobile phone in the past month? Sent an SMS / Sent an MMSBase: Mobile Internet Users aged 16-64Source: GlobalWebIndex 2014

92 15 for 15
Question: Can you please tell us the extent to which you agree or disagree with the following statements?Base: 500 WhatsApp users in the UK, aged 16-64Source: GlobalWebIndex 2014
to concentrate on a “Buy” button and Pantech put itself up for sale, having long struggled to compete with fellow Korean tech giants LG and Samsung. We also saw BlackBerry re-focusing its efforts on the business market, essentially conceding that its fight to win a decent share of consumer sales was at an end.
But in the face of mobile messaging services gaining huge uptake, one of the biggest questions of the year was whether the humble SMS/text message was going the same way as the CD or video cassette. In short, would we soon be saying RIP SMS?
It’s certainly true that mobile behaviors – and requirements – have been evolving rapidly. Gone are the days when minutes and text messages were a central, or particularly attractive, part of a mobile package; with a wide range of services now offering consumers the chance to make calls or send messages via the internet, companies have increasingly concentrated on data allowances or handset quality.
That said, it’s important to recognize that text messaging hasn’t been rejected; more than three quarters of mobile users said that they sent one last month and, overall, more people are still communicating via text than they are via IM services. What is changing is the volume of messages being sent via SMS or MMS. After fairly consistent rises since 2009, both formats saw small declines in 2014; given that the size of the global smartphone population continues to increase each quarter, this modest drop is pretty conspicuous – especially as the growth rate had been slowing in several of the preceding quarters (in 2010 and 2011, we were typically seeing a 10%-15% quarter-on-quarter growth in the numbers sending text messages; by 2013, this has dropped to just 0%-5%).
The impact of messaging tools is pretty clear to see here: among those using such services, just a quarter reported that they now prefer sending a text message instead of using an instant messaging tool. The prospects for the MMS are even more troubled: only 16% of mobile messagers think that sending photos and videos via MMS is better than via a chat app.

9315 for 15
Question: Which of the following mobile / tablet applications have you used in the past month? (on any device)Base: Mobile internet users aged 16-64Source: GlobalWebIndex Q2 2014
93

94 15 for 15

9515 for 15
For further detail on this subject, please download the following:Mobile Messaging (GWI Trend) i GWI Device (GWI Flagship Report) i Mobile Apps: Named Apps (GWI Data Pack) i Mobile Actions (GWI Data Pack)
key implications for 2015
• Broadly speaking, all but today’s youngest adults have had to embrace mobile messaging as a new and alternative form of communication and change their habits accordingly. In stark contrast, tomorrow’s adults have grown up in a landscape where mobile IM has been a completely ingrained and “normal” behavior from the start.
• IM will not replace the SMS altogether but will account for an increasing proportion of the communication taking place via mobiles, with messaging services striving to add new features and security guarantees as they compete to become the globally favored providers. This will see networking behaviors on major social platforms becoming more passive still.
• The successful monetization of mobile messaging behaviors will be a key area of focus, especially with Facebook having vowed to keep WhatsApp as an ad-free entity. Increasingly, this trend will be about the access to audiences that IM apps provide.
Convenience and reach stand out as key drivers for this trend; two thirds say that mobile messaging services are the easiest way to send photos and videos, with a similar proportion claiming that they use them because most of their friends/family do too. Cost is also a big factor here: people like the idea that they are saving money, especially when sending messages internationally.
If we then turn our attention to attitudes among what we might call text-message loyalists – that is, people who are currently using mobile messaging tools but who still prefer sending texts – the future prospects for the messaging services look particularly bright. Those who still favor texts are influenced the most by the ability to send messages without an internet connection (68%), the availability of unlimited messages from their operator (68%) and the fact that not all of their friends are using mobile messaging apps. But we have to imagine that all of these factors will be key targets for the mobile IM operators: coverage will get progressively better, the offer of unlimited texts will get less relevant/impactful and the numbers of people using IM tools will increase. Perhaps most significantly of all, just 10% of people say they don’t trust mobile chat app companies with their conversations – which would arguably have been by
far the biggest barrier against IM tools taking further ground from text messaging.
So, as we approach the middle of the 10s decade, it seems inevitable that – while we won’t be saying a final RIP to the SMS or MMS just yet – we’ll be hearing much less about them as a greater share of communication takes place via chat apps.
What’s interesting, though, is that no single service has yet established the type of dominance that a name like Facebook has gained in the social networking space. Certainly, the audiences for WhatsApp, Skype, Facebook Messenger and WeChat are all huge, but each one of these names records usage rates of 20% or under in their less successful markets. And with 84% of mobile messagers saying that they would start using an app if their friends and family were too, it’s clear that loyalty and habits are not yet as ingrained for messaging services as they are for social networks proper.
And this, arguably, is where 2015 will see its fiercest battle; companies won’t be competing to kill off the text message, they will be sparring with each other become the truly dominant name within the mobile messaging space.

96 15 for 15
#11The shared iNTerNeT

9715 for 15
It was once claimed that the rise of mobiles and tablets would eventually sound the death-knell for more “traditional” devices such as PCs and laptops. To date, though, the reality has been quite different: far from abandoning certain internet access points in favor of others, digital consumers have been quick to embrace a multi-device approach to using the internet. Yes, the rise of smaller, portable devices has had a clear impact on how, when and where PCs and laptops are being used, but they remain vital access points. And this is highly likely to remain the case even as consumers become more accustomed to going online via an ever wider range of devices – from games consoles and smart televisions to the diverse range of appliances that could form part of the Internet of Things.
But there’s one other myth surrounding mobile and tablet usage which is still being perpetuated today: that these devices are always much more personal than PCs and laptops, and hence that it’s easier to track – and understand – how an individual is behaving online.
Question: Thinking about the devices you use to access the internet, can you please tell us how many, if any, other people use each one?Base: Users of each device aged 16-64Source: GlobalWebIndex 2014
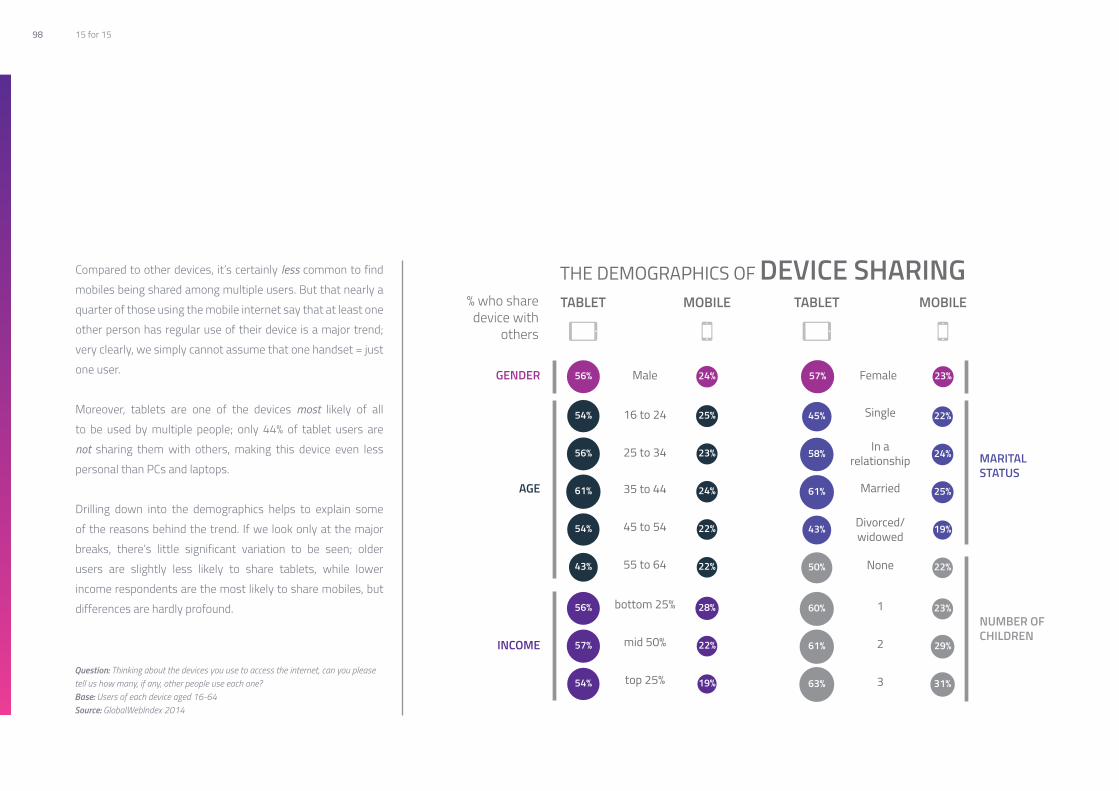
98 15 for 15
Compared to other devices, it’s certainly less common to find mobiles being shared among multiple users. But that nearly a quarter of those using the mobile internet say that at least one other person has regular use of their device is a major trend; very clearly, we simply cannot assume that one handset = just one user.
Moreover, tablets are one of the devices most likely of all to be used by multiple people; only 44% of tablet users are not sharing them with others, making this device even less personal than PCs and laptops.
Drilling down into the demographics helps to explain some of the reasons behind the trend. If we look only at the major breaks, there’s little significant variation to be seen; older users are slightly less likely to share tablets, while lower income respondents are the most likely to share mobiles, but differences are hardly profound.
Question: Thinking about the devices you use to access the internet, can you please tell us how many, if any, other people use each one?Base: Users of each device aged 16-64Source: GlobalWebIndex 2014

9915 for 15
Far more pronounced patterns emerge if we examine relationship and family status. Across both devices, it’s clear that this has a major impact: the more children someone has, the more likely they are to be sharing mobiles and tablets. Similarly, those who are married or in relationships are bigger sharers than those who are single. Within households, then, tablets in particular are seen very much as shared rather than wholly personal devices.
Significantly, levels of sharing are also subject to variation by country. Here, it’s users in emerging internet nations who are some of the most likely to share devices with others, particularly when it comes to mobiles. In part, this has been catalyzed by the less important role that PCs and laptops have historically played as internet access points in these nations; many individuals in fast-growth markets have “leapfrogged” PCs/laptops to see mobiles become their major (or in cases, only) access point. That this makes these devices more susceptible to being shared is an inevitable consequence of this.
At a global level, the main implication here is that large audiences are going uncounted. For mobiles, for example, about 1 billion people across GWI’s 32 countries are currently using them to connect to the internet. But of this group, about 750 million are the sole users of their device, while a further 250 million are sharing them with other users. If we work out a total audience size which includes all of these shared users, the potential size of the overall mobile audience rises by nearly 500 million people – from about 1 billion to 1.5 billion. That’s a huge increase, and one that highlights the perils of linking mobile browsers to unique users. It also demonstrates why the potential reach and audience size of a website might be much bigger than often thought.
Question: Thinking about the devices you use to access the internet, can you please tell us how many, if any, other people use each one?Base: Users of each device aged 16-64Source: GlobalWebIndex 2014
99

100 15 for 15

10115 for 15
For further detail on this subject, please download the following:The Missing Billion (GWI Insight Report) i GWI Device (GWI Flagship Report) i Device Sharing (GWI Data Pack)
key implications for 2015
• Mobiles remain one of the fastest rising internet access points; if this is an issue already, it’s one that will be amplified in the years ahead.
• Our research shows that there are significant minorities of internet users who only use a shared device – that is, they do not have a single internet access point which is not shared with other people. This trend is most pronounced in fast-growth markets and represents a huge segment of potentially invisible users.
• We cannot always assume that a person logged-in to a particular service is the same as the individual using the device in question at any given time; with so many people automatically logged-in to sites like Facebook on a near permanent basis, it’s perfectly possible for there to be mis-matches even here. Only by using a combination of actively and passively collected datasets can a true picture emerge.
In 2015, this is a trend with particular momentum. The era of the “smart” home means that games consoles and smart televisions are poised to become much more important internet devices – and yet, as our chart shows, they are the most likely of all to be shared among multiple users. In short, tracking internet users is about to get more difficult still and, in turn, any lingering idea that one machine = one person will become even more anachronistic.
Question: Thinking about the devices you use to access the internet, can you please tell us how many, if any, other people use each device?Base: Users of each device aged 16-64Source: GlobalWebIndex 2014

102 15 for 15
#12The baTTLe For coNTeNT:sTreamiNG Vs doWNLoads

10315 for 15
Media formats are always searching for alpha status. CDs killed off cassettes, DVDs outshone VHS and digital downloads rendered shiny-sided plastic discs largely redundant.
But for the film and music industries – which have spent considerable time, money and energy encouraging people towards legal rather than pirated downloads – a crucial question now looms: are streaming services like Spotify and Netflix becoming the more dominant force in terms of media distribution?
Globally, almost two thirds of GWI’s 2014 respondents indicated an interest in music or film. And people are still willing to pay for this entertainment – in the last month, one third of global internet users have spent money on music or film content in some form.
Nevertheless, the writing may be on the wall for digital downloads; with ever increasing broadband speeds as well as the promise (or reality) of 4G in many countries, streaming is becoming seamless and consumers appear to be migrating away from downloads.
Question: Which Of These Have You Paid For In The Last Month?Base: Internet users aged 16-64Source: GlobalWebIndex 2014

104 15 for 15
Across GWI’s 32 countries, rates of paying for music downloads peaked at 25% in Q2 2013; they have been falling – albeit gradually – ever since. Just as importantly, the proportion who say they would consider paying for music downloads has been declining steadily too – down by 1 percentage point each quarter since Q4 2012 (to sit at 25% in 2014). It’s a similar pattern when it comes to paid-for TV and film downloads; they peaked in the middle of 2013 but have since been on a gentle downwards trend.
Simultaneously, the numbers who say they have paid for a music streaming service within the last month have been rising (to reach 16%). And there’s been a year-on-year increase in the size of the audience saying they’ve paid for a TV or film stream too – little wonder, then, that 2014 was the year that Netflix announced it had passed the 50 million mark in terms of paying subscribers.
Question: Via Which Device Have You Listened To Music On A Music Streaming Website?Base: Internet users aged 16-64Source: GlobalWebIndex 2014

10515 for 15
It’s also worth noting that an impressive 81% of internet users report having watched a full-length film on a PC, tablet or mobile. In fact, evolving device usage is having a clear impact on how we’re consuming content: the numbers streaming tracks via their phones have been showing fairly consistent quarter-on-quarter rises in 2013 and 2014 (although the headline percentage has risen only slightly, it’s important to note that the size of the internet population has grown over the period in question – meaning a small percentage increase can translate into tens of millions of extra people). Meanwhile, the equivalent audience doing this via PCs has been contracting very slightly in recent quarters; although PCs still remain by far the most common device for streaming at the moment, this is a behavior in gentle decline. Mobiles are rapidly closing the gap.
Question: Which of the following have you done already, and which are you interested in doing in the future? Subscribe to a video-on-demand service such as Netflix, HBO GO, Amazon Prime or Vudu so that I can watch films and TV shows whenever / wherever I wantBase: Internet users aged 16-64Source: GlobalWebIndex 2014
105

106 15 for 15

10715 for 15
For further detail on this subject, please download the following:GWI Entertainment (GWI Flagship Report) i GWI Device (GWI Flagship Report) i On-Demand Services (GWI Trend) i Online Content: Have Paid For (GWI Data Pack) i Online Activities: Used Music Streaming Service (GWI Data Pack) i Interest in Emerging Services: Video on Demand (GWI Data Pack) i Self Perceptions: Rather Subscribe Than Purchase (GWI Data Pack)
key implications for 2015
• Although the transition will be sure-and-steady rather than dramatic, streaming has the potential to become the primary way that consumers access music. Mobiles will be a key driver, here; freed by high-speed mobile internet, it’s easy to see how the smartphone could become an integral device for music in particular, but for content more generally too.
• Devices such as mobiles and tablets are capturing an increasing share of the time we devote to TV/film viewing, a trend which is changing the ways and places in which we consume content. Although live-viewing remains important – especially for must-see “event” TV – fixed schedules will inevitably come to play a less and less central role within our viewing habits.
• As Netflix, Amazon, Yahoo and other big tech names look to make original content as a way to attract further users, the notion that things should air first on traditional TV channels comes under pressure, just as “binge-viewing” – watching multiple episodes in quick succession – will grow more common.
At a general level, close to a quarter of internet users now say that they have paid for a subscription to an online video on-demand service such as Netflix or Hulu (with North America, the home of so many of the services in question, scoring by far the best figures). Just as significantly, though, a further 35% express interest in doing this in the future (peaking in APAC). And it must be pretty telling that only 10% of GWI’s respondents say they have not heard of VoD services; on-demand providers have quickly become a widely recognized part of the digital landscape. Streaming is becoming more and more normalized.
Of course, streaming will never have universal appeal – some music lovers will always want to assemble vast collections of records. Even so, it’s clear that attitudes towards traditional purchase models are changing, with many modern consumers now comfortable with the idea of paying to have access to, rather than ownership of, their media content. Almost half of those surveyed by GWI in fact said that they would prefer to sign up for a membership to a product/service rather than own it.
All this considered, downloads really could be the next media format to wind up in the digital graveyard.

108 15 for 15
#13muLTi-NeTWorKiNG

10915 for 15
When Google+ launched back it 2011, it was hard to avoid the widespread debate about how the newest social network on the block would fare against Facebook. Would Google+ edge out the established leader? Would Facebook simply crush the new upstart? Which one would ultimately “win” the battle of the social networks? Fast-forward to 2014 and the launch of Ello – described by the media as the anti-Facebook – has prompted a flurry of similar questions (in particular, how many people are leaving Facebook for it).
While these comparisons have always been – and will no doubt continue to be – somewhat inevitable, the truth is that social networking is far more sophisticated and multi-layered than these questions acknowledge. Clearly, the reach and relevance of each network is hugely important, but to see the world of social networking as a black-and-white space in which there’s a simple linear battle between the key players – with one taking ground directly from another – fails to understand the ways in which networking behaviors have evolved. Typically, internet users do not limit themselves to just one service; rather, they have accounts on a combination of different social platforms – turning to each one for different reasons at different times.
Let’s start with some numbers. By 2014, an impressive 92% of internet users aged 16-64 said that they had an account on at least one of the 40 distinct social networks tracked by GlobalWebIndex (some of them being local platforms limited to certain regions or countries, others being truly global forces with digital footprints in all 32 markets). On average, people now have accounts on 5.07 networks (rising to 5.9 among 16-24s); in conjunction with social networking being one of the fastest growing behaviors on the internet over the last five years, that’s clear testament to just how expansive this activity’s reach has become.
Within our survey, we also track levels of active usage (defined across all 40 of the networks in question as people who have used or contributed to them within the last month); as we might expect, figures are a little lower here but that just over two thirds of internet users are engaging with at least one network each month is impressive nonetheless. As is the fact that – on average – people are actively engaging with 2.26 networks (climbing to 2.5 for 16-24s).
Of course, some countries are much more “social” than others. Indonesia tops the list, being a market in which a staggering 98% of internet users have a social network account and four fifths are active users; in comparison, online populations in Japan and parts of Europe are much less enthused with this activity. Even so, the majority of internet users in 27 of our 32 markets count as active users – something which offers clear pause for thought next time you hear a claim that the social networking bubble has burst.
Once the sheer extent of social networking is recognized, the next problem to overcome is the idea that a Facebooker cannot be a Tweeter, that an Instagrammer is necessarily different to a Google+ member and that there is no room for overlap between services such as Pinterest, LinkedIn and Tumblr. Or, in the closely related mobile messaging space, that a WhatsApper is always a different person to a Snapchatter. Digital behaviors simply do not follow such neat patterns, especially when – in most cases – each network can boast something unique in terms of its offering. Outside of China, our research shows that nearly 50% of internet users are in fact members of both Facebook and Twitter. And nearly 40% have accounts on all of the “Big 3” (Facebook, Twitter and Google+). Looking at cross-network membership on the ten biggest social sites is perhaps the best way to illustrate this.

110 15 for 15
Broadly speaking, active users on both Twitter and Google+ are about 1.5 times more likely than average to have accounts on the rest of the top 10 social networks, and about 2.5 times as likely to be actively using them. Crucially, then, it’s not just that being on one social network makes you more likely to be a member of another, it’s that it makes you proportionally much more likely to be actively engaging with other networks. Some 95% of Twitter’s members have an account on Facebook, for example – with the vast majority (87%) being active Facebook users. Similarly, about two thirds of active Google+ members are engaging with Twitter each month.
While the equivalent numbers on Facebook are lower – a result of the platform having by far the biggest reach – the same patterns are nevertheless apparent here too: Facebookers are 1.15 times as likely to have an account on another social network and 1.67 times as likely to be actively using it. Shift the focus to China, where a range of local platforms still capture the biggest audiences, and it’s a similar story once again: active users on the number one service, Sina Weibo, are more likely to be using the rest of the top five social networks too.
Question: On which of the following services do you have an account? Which of the following services have you used or contributed to in the past month using any type of device? e.g. PC/Laptop, Mobile phone, tablet, etc Base: Internet users aged 16-64Source: GlobalWebIndex 2014

11115 for 15
One of the biggest reasons for this move towards multi-networking is the growing specialization and sophistication of social behaviors. As we saw earlier in the Facebook Gets Passive trend, people are visiting different sites to carry out different activities and, potentially, to engage with different audiences. Mobile messaging services might be one of the most obvious examples of this – with much of the communication that used to be hosted on social networks proper having shifted to dedicated apps – but the same principle applies for areas like photos (Instagram) and videos (YouTube, Vine).
Question: On which of the following services do you have an account? Which of the following services have you used or contributed to in the past month using any type of device? e.g. PC/Laptop, Mobile phone, tablet, etc.Base: Internet users aged 16-64, exc. ChinaSource: GlobalWebIndex 2014
111

112 15 for 15
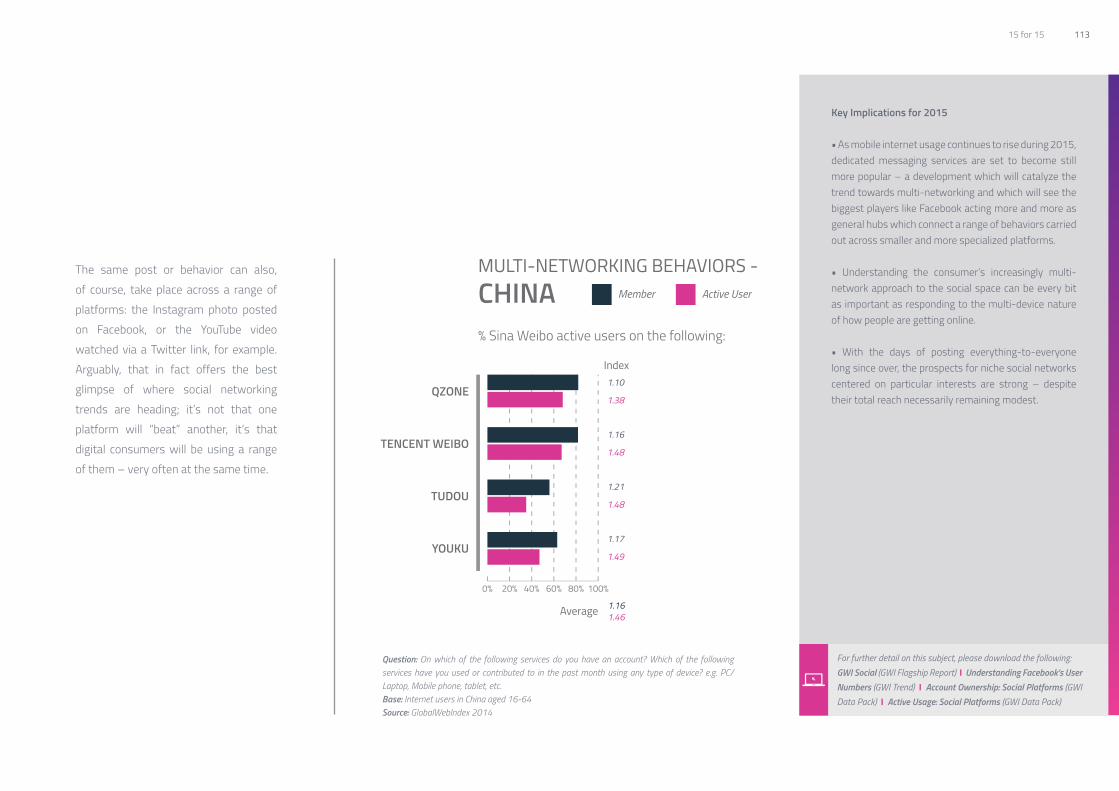
11315 for 15
For further detail on this subject, please download the following:GWI Social (GWI Flagship Report) i Understanding Facebook’s User Numbers (GWI Trend) i Account Ownership: Social Platforms (GWI Data Pack) i Active Usage: Social Platforms (GWI Data Pack)
key implications for 2015
• As mobile internet usage continues to rise during 2015, dedicated messaging services are set to become still more popular – a development which will catalyze the trend towards multi-networking and which will see the biggest players like Facebook acting more and more as general hubs which connect a range of behaviors carried out across smaller and more specialized platforms.
• Understanding the consumer’s increasingly multi-network approach to the social space can be every bit as important as responding to the multi-device nature of how people are getting online.
• With the days of posting everything-to-everyone long since over, the prospects for niche social networks centered on particular interests are strong – despite their total reach necessarily remaining modest.
The same post or behavior can also, of course, take place across a range of platforms: the Instagram photo posted on Facebook, or the YouTube video watched via a Twitter link, for example. Arguably, that in fact offers the best glimpse of where social networking trends are heading; it’s not that one platform will “beat” another, it’s that digital consumers will be using a range of them – very often at the same time.
Question: On which of the following services do you have an account? Which of the following services have you used or contributed to in the past month using any type of device? e.g. PC/Laptop, Mobile phone, tablet, etc.Base: Internet users in China aged 16-64Source: GlobalWebIndex 2014

114 15 for 15
#14Game oN iN asia

11515 for 15
Despite gaming being big business in China, the ban on the sale of games consoles introduced back in 2000 has ensured that PC and mobile gaming have become the dominant forces within the Chinese market.
But all this could be about to change; with the restriction being lifted earlier this year and consoles beginning to appear in the Chinese market – most notably, Microsoft’s Xbox One launched in September – will Chinese gamers migrate to consoles?
GWI’s 2014 data shows that PC and mobile gaming are ubiquitous in China. More than 6 in 10 Chinese internet users have played some form of online game on their PC in the last month. Furthermore, 65% are playing mobile games, a figure which means that about a third of all mobile gamers globally are in China. Clearly, then, interest in gaming is robust. But, having lost 14 years of opportunity, will consoles have the cultural heft to change habits among the gamer audience?
Question: Which Of The Following Have You Done In The Last Month?Base: 8033 Internet Users aged 16-64 in ChinaSource: GlobalWebIndex 2014

116 15 for 15
Microsoft, Sony and Nintendo are certainly hoping so; foreign consoles are now being produced and distributed in partnership with Chinese firms, Xbox One’s launch was strong even with a price-tag of $699 and Sony has already secured a deal with a Chinese firm to ensure the launch of its PlayStation 4. Chinese companies are also getting in on the game: telecoms firm ZTE and game developer The9 have partnered to launch the Fun Box, while Huawei is selling its Tron console. Significantly, these home-grown machines are more affordable than the foreign consoles – something which may resonate with Chinese gamers who, accustomed to free mobile games and PC gaming in internet cafes, could well baulk at the idea of paying thousands of Yuan to own a console.
However, GWI’s data shows that a market for international consoles does exist in China. In 2014, 18% of Chinese internet users reported that they played console games, many of which were likely acquired from the black market. If even a small portion of this trade moves to the legal sphere then a huge amount of revenue is up for grabs. Furthermore, with 1 in 5 of Chinese internet users falling into the top income quartile, the relatively high price of foreign consoles may not be a deal-breaker.
Base: 8033 Internet Users aged 16-64 in ChinaSource: GlobalWebIndex 2014

11715 for 15
For further detail on this subject, please download the following:Console and Mobile Gamers (GWI Audience Report) i Internet Device Access (GWI Data Pack) i Time Spent Playing on a Games Console (GWI Data Pack) i Gaming Behaviors (GWI Data Pack)
key implications for 2015
• As more consoles, both expensive and affordable, are launched in China, the numbers of console gamers in the country will expand and opportunities for manufacturers, game developers and advertisers will follow accordingly.
• That said, not all content will have an easy route into the market. Already, the Chinese government has prohibited the sale of Call of Duty: Advanced Warfare, Destiny and Halo. Just as the film industry found before it, the gaming industry will need to tailor its content specifically for China’s cultural landscape.
• Although still a niche access point, nearly 1 in 10 internet users worldwide are currently going online via games consoles each month. Greater uptake in China could see this figure swell significantly.
Question: Which Of The Following Have You Done In The Last Month?Base: Internet Users aged 16-64 Source: GlobalWebIndex 2014
Asia is already a strong territory for console gaming. Japan remains the second-largest console market behind the USA, while 22% of GWI’s respondents in India, as well as more than a quarter in Indonesia, report that they use consoles. If these levels can be reached in China, then tens of millions of console gamers would enter the market and China would be accelerated along its path to becoming the largest games market in the world. It would also cement APAC’s position of dominance for this activity still further.

118 15 for 15
#15TracK me iF You caN:The deaTh oF cooKies

11915 for 15
From eBay’s passwords being compromised to the attack on Apple’s iCloud, 2014 has generated its fair share of privacy-related headlines. But while isolated issues tend to have relatively little impact on usage of a particular site – how many people actually leave Facebook each time its privacy credentials are called into question, for example? – it’s certainly true that general levels of concern about online security and tracking have been rising over the last few years.
Globally, 58% of the online population now agree that they are concerned about the internet eroding their personal privacy (up from 48% in 2010). And, perhaps just as significantly, only 17% of internet users disagree with the statement. What’s more, this is an attitude which cuts across demographics, being felt by virtually all groups in equal measure; if we take age as an example, there were just three percentage points separating the most and least concerned groups in 2014.
Question: To what extent do you agree/disagree with the statements below on your outlook of the web? I am concerned about the internet eroding my personal privacy.Base: Internet users aged 16-64 Source: GlobalWebIndex 2014

120 15 for 15
That this sentiment is now majoritarian is pretty important, especially as just over half (52%) of online adults globally say they “prefer to be anonymous when using the internet”. It’s also clear that significant minorities are taking pro-active and evasive actions to protect their privacy and avoid being tracked. As we noted in Generation V, over a quarter of internet users say they’ve gone online using a VPN or Proxy Server – with nearly 3 in 10 of these individuals turning to them in order to “keep my anonymity while browsing”.
But there are plenty of other privacy-driven avenues that people are following too. Nearly half of the internet users we survey say that they’ve used a private browsing window. More than three quarters say that – at some point – they have deleted cookies from their computer so that websites will not remember them. Meanwhile, 3 in 10 have used an ad blocking service in the last month, and 2 in 10 have deployed anti-tracking tools. Clearly, significant segments of internet users are a lot savvier surrounding their online privacy than is often acknowledged.
Question: Can you please tell us why you use VPNs or proxy servers when browsing the internet? To keep my anonymity while browsing Base: VPN Users aged 16-64Source: GlobalWebIndex 2014

12115 for 15
While none of these tools is (yet) mainstream, it’s still the case that a weighty chunk of the online population is becoming – and wants to become – increasingly hidden from view; they’re the “forgotten” internet users determined to shield their details and activities from media providers and advertisers alike. For any brand or marketer out there, that makes it extremely difficult to capture a full and accurate view of their audience.
It’s in this context that Atlas, Facebook’s new advertising platform, makes its entrance. Not only can Atlas use the information it knows about you from Facebook to target you while you’re on other websites or in third-party apps, it overcomes the problems of being reliant on cookies. It thus represents a significant leap-forward in terms of mobile tracking in particular, an area where 3rd party cookies have been made redundant through restrictions at the operating-system level, such as those on iOS devices among others.
Question: Which of the following things apply to you when you access the internet from your main computer?Base: Internet users aged 16-64Source: GlobalWebIndex 2014

122 15 for 15
If we bear in mind that more than 4 in 5 adult internet users outside of China currently have a Facebook account – and hence have handed over basic demographic information about themselves as well as a degree of behavioral data derived from their usage habits – the potential reach and accuracy of Atlas is pretty impressive. Sure, some of the most determined users will opt out of the functionality but – as we’ve already seen in relation to the other anti-tracking measures discussed above – it’s likely to be a relatively small minority who do this. So, subtract this group from Facebook’s membership base and Atlas’ potential reach is still vast. No wonder it’s been seen by many as a direct challenge to Google’s DoubleClick platform as well as one of the best solutions yet to the challenge of understanding today’s multi-device internet users – able to marry up visits made in different browsers/apps and across different devices.
Lying at the heart of Atlas is the assumption that cookies no longer represent the future of audience measurement. Indeed, quite apart from their ineffectiveness on mobile, many PC browsers now have “Do Not Track” as the default setting. Facebook is not the only name to think this though, with 2015 being the year in which we can expect to hear a lot more about finger-printing – a cross-device tracking technique which uses information such as browsing behaviors, IP addresses and other ISP data to identify the same user across different locations and devices. But while finger-printing will certainly present a strong challenge for cookie-based techniques in the short- to medium-term future, the problem for both is that anti-tracking tools are already able to block them. This is one of the reasons why universal
device ID technology might be favored by some. Using probabilistic methodology, the technique focuses on a constantly updated behavioral profile; as new IDs are generated each time a user is seen, records have the advantage of being temporary but up-to-date rather than permanent and inaccurate. Plus, the entire conversation – from which the user can opt out if they choose – takes place between consumer and marketer, without data being stored on the device in question.
Whichever of these solutions gains traction, Atlas presents two problems for Facebook. Firstly, it still uses cookies for a wide range of purposes, including the collection of “Unique Identifiers (identifiers associated with a specific browser or device or derived from a user’s Facebook ID) and to track “User interactions with ads, websites, and apps (ad views, clicks, page visits, etc)”. Secondly, and arguably more seriously, Atlas relies on highly personal information from Facebook to target consumers – just the type of data that cookies and finger-printing employ too, but which consumers are increasingly reluctant for companies to use. In the UK, for example, a significant three quarters of Facebook users believe that “Facebook has no right to use my personal information to sell advertising” (with half agreeing strongly – a ratio far higher than normal).
In a sense, the challenge facing Facebook is typified by Ello. Dubbed the “anti-Facebook” by journalists – who were quick to pounce on the fact that, at one point, it was reportedly receiving 37,000 requests to join per hour – the service itself is unlikely to trouble the social networking giant to any great extent.

12315 for 15
124 15 for 15

12515 for 15
It certainly succeeded in being a source of interest, but the masses of Ello-related comments on Facebook itself is testament to the fact that we didn’t exactly see a mass exodus to the newest network on-the-block. In today’s multi-networking world, it has a better chance of becoming another service that people might use, rather than a direct alternative.
The hype Ello generated does, however, expose some rather more serious issues. That so many Facebook members were so keen to check out an alternative platform should trigger some alarm bells; while even the most contented user base might be curious to have a look at a new network, serious numbers of the comments posted online about Ello were united in their dislike of Facebook. Sizable segments now appear to be using Facebook not out of any fondness but because they feel they have to – it’s where their friends and family are, or they feel they have too much accumulated history on the site to say goodbye to it. They might not be planning to leave, but they’re hardly singing Facebook’s praises, either. For many, it’s become a loveless relationship of convenience.
What’s more, it was remarkably easy for Ello to caricature Facebook as little more than an ad platform (while distinguishing
itself as a genuine social network). Visit the Ello website and you were immediately told that “Your social network is owned by advertisers. Every post you share, every friend you make and every link you follow is tracked, recorded and converted into data. Advertisers buy your data so they can show you more ads. You are the product that’s bought and sold.”
For proof that this was a pretty smart positioning, just look at how easily everyone accepted the idea that Facebook was disliked and that its members might want to leave to embrace something better. In short, Facebook has changed and evolved so much – and become so focused on its numbers and ad performance – it’s almost forgotten that it’s still supposed to be a social network.
Of course, Facebook doesn’t need its members to love it. But it would certainly do well to stem the current tide of anti-Facebook sentiment and to prevent users from beginning to hate it. While the industry is clearly excited about Atlas – as demonstrated by the names which have already signed up – we shouldn’t be ignoring the attitudes of consumers on-the-ground who are decidedly uncomfortable about their personal information being used in this way. In 2015, Facebook needs to stop being so visibly commercial and get back to being a little more social.
For further detail on this subject, please download the following:The Fight for Online Privacy (GWI Trend) i VPN and Proxy Server Usage (GWI Data Pack) i VPNs and Proxy Servers: Usage Motivations (GWI Data Pack) i Outlook on the World: Worried About Online Privacy (GWI Data Pack)
key implications for 2015
• There will always be a certain disconnect between what internet users say and what they actually do as a result; expressed concerns about online privacy and data protection will not always translate into any reactionary day-to-day behaviors. Nevertheless, with security concerns rising from a long-term perspective, the prevailing view here is clear.
• Facebook is one of a wide range of companies operating free data-driven services that need to do a (much) better job of educating internet users about why usage of their data is essential. People need to understand that there’s a trade-off involved, and feel reassured that their information is being anonymized.
• Cookies are not facing an imminent death and remain one of the most viable options for the short-term future. It’s their long-term feasibility which is at question, with both finger-printing and universal device ID options likely to gain ground during the year ahead.

126 15 for 15

12715 for 15
www.globalwebindex.netT. +44 20 7731 1614 • a. bedford house, 69-79 Fulham high street, London, sW6 3JW, england

128 15 for 15