18 november 2020 | 10:57am gmt
TRANSCRIPT

While the vaccine presents tactical upside, the pandemic itself represents a
structural shift. Over the past decade the GSCI is down c.60%, erasing 3 decades of gains. We believe this streak of poor returns has reached an end in the aftermath of the Covid crisis. Of course, negative oil prices are hard to top, and it’s easy – and largely accurate – to present the 2021 commodity outlook as a V-shaped vaccine trade. What we think is key, however, is that this recovery in commodity prices will actually be the beginning of a much longer structural bull market for commodities driven by three key themes.
Revenge of the old economy. Structural under-investment in the old economy 1.
due to a decade of poor returns, particularly in energy where ESG issues have further reduced investment, was accelerated during 2020 in response to Covid, leaving inadequate production capacity to meet a V-shaped vaccine driven demand recovery. Investment decisions are at a historical trough, taking 7.9 mn bld of oil out of 2025 expected supply. In our view, this will spell the end of non-OPEC growth in 2021.
REV’ing demand through social need. Covid is already ushering in a new era 2.
of policies aimed at social need instead of financial stability. This will likely create cyclically stronger, more commodity-intensive economic growth that should create the elusive cyclical upswing in demand. Three global initiatives have the potential to REV the global demand for commodities: Redistributional policies, Environmental policies and Versatile supply chain initiatives. From China’s new 5YP to Europe’s Green Deal or Biden’s stimulus plan, policymakers are looking to REV demand after a decade of policies aimed at financial stability.
Revaluation and reflation. Covid has led to a massive rise in government 3.
spending, particularly in the US where the dollar was already facing headwinds. Although the dollar got a boost from a flight to safety at the beginning of the crisis, this support is likely to fade in 2021 and beyond, creating a positive feedback loop similar to what it did during the 1970s and 2000s when oil and gold reached historical highs. In addition, inflation tails risks are greater than at any other time since the 1970s due to the REV policies above.
Jeffrey Currie +44(20)7552-7410 | [email protected] Goldman Sachs International
Damien Courvalin +1(212)902-3307 | [email protected] Goldman Sachs & Co. LLC
Samantha Dart +1(212)357-9428 | [email protected] Goldman Sachs & Co. LLC
Nicholas Snowdon +44(20)7774-5436 | [email protected] Goldman Sachs International
Michael Hinds +1(212)357-7528 | [email protected] Goldman Sachs & Co. LLC
Alison Li +852-2978-6088 | [email protected] Goldman Sachs (Asia) L.L.C.
Mikhail Sprogis +44(20)7774-2535 | [email protected] Goldman Sachs International
Callum Bruce +1(212)902-3053 | [email protected] Goldman Sachs & Co. LLC
Huan Wei +1(212)357-2353 | [email protected] Goldman Sachs & Co. LLC
Daniel Sharp +44(20)7774-1875 | [email protected] Goldman Sachs International
2021 Commodity Outlook
REVing up a structural bull market
18 November 2020 | 10:57AM GMT
Investors should consider this report as only a single factor in making their investment decision. For Reg AC certification and other important disclosures, see the Disclosure Appendix, or go to www.gs.com/research/hedge.html.
For t
he e
xclu
sive
use
of J
OSEP
H.ST
EIN@
GS.C
OM
7f10
0ca8
95df
11e0
bb43
0021
5ace
2648

The mid-cycle trap, not supply, created the lost decade. It is tempting to blame supply for the poor performance of commodities over the past decade, particularly given the technological innovations in shale, NPI and smart farming, to name a few. However, there is little evidence for it. In oil, OPEC+ in the spirit of ‘market stability’ offset shale increases, or in metals Chinese ‘supply-side reforms’ did the same. In our view, it was the inevitable consequence of global policy focused on financial-stability following the financial crisis. Such policies, by definition, took risk out of the system, and along with it many of the drivers of strong demand growth that would potentially have created inflation, a commodity bull market and, more importantly, the rising tide of wages and income that lifts all boats. This left the global economy stuck in a mid-cycle holding pattern with asset price inflation that benefited high-income households that are far fewer in number and don’t volumetrically consume many goods.
Social need policies help escape the mid-cycle trap. The financial crisis was a crisis of financial instability whereas the Covid pandemic is a crisis of social need, the need to deal with political issues that can no longer be ignored such as inequality, climate change and structural unemployment in key sectors and demographics. Policies aimed at social need benefit lower-income households that are larger in number and volumetrically consume more goods. Stimulus aimed at social need creates far more growth than stimulus aimed at fixing a financial crisis. And more importantly, it can create a cyclical upswing in demand to finally reach escape velocity to solidly enter a period of above capacity growth, helping commodities and the old economy out of the mid-cycle trap they have been in for the past decade which lies at the core of the poor performance. Even the US Fed in announcing its new framework, acknowledges a cyclically strong economy helps solve many of these social issues.
A structural bull market on par with the 2000s. Looking at the 2020s, we believe that similar structural forces to those which drove commodities in the 2000s could be at play. Not only can the green capex increase be as big as BRIC’s investment 20 years ago, but the redistributative push in DMs, and in China this time, is likely to lead to a large boost to consumer spending, comparable to the lending-fuelled consumption increase in the 2000s. Finally, similar to 2000s, there is structural under-investment in supply of almost all commodities, against a weak dollar backdrop.
But inflation risks like the late 1960s. In the 1960s, the last time social need was escalated to the top of the policy agenda, the focus was the need to project power during the Cold War (today’s policy challenges are against Covid, and the effects of US trade war with China) and the need to fight the War on Poverty to calm social unrest (today’s is against minority unemployment and income inequality). The US government embarked on an unprecedented spending program and did not raise taxes accordingly, the central bank kept rates low, as inflation had been near 1.5% and unemployment below 5%, and the bond market kept borrowing rates low, driven by well-anchored inflation expectations, setting the stage for the 1970s.
Commodities are the best inflation hedge. While our economists are forecasting 1.7% inflation in the US next year, using oil forwards at $48/bbl (as per the ECB and Fed), should our $65/bbl forecast materialize, this inflation number jumps to 2.5%. This is significant in the context of an average IG bond portfolio yielding less than 1.95%. This
18 November 2020 2
Goldman Sachs 2021 Commodity Outlook
For t
he e
xclu
sive
use
of J
OSEP
H.ST
EIN@
GS.C
OM
7f10
0ca8
95df
11e0
bb43
0021
5ace
2648

also illustrates an important point about levels, that it is the level of inflation that matters as opposed to the change in inflation. Macroeconomists typically care about the change in inflation, and how far from target the economy is. Portfolio managers typically care about the level of inflation and whether that target could change. History shows there is a longer-term super cycle to the inflation target, just as there is for commodity prices, and that politics dictates when that target can change. Macro inflation is a political dynamic, as opposed to an economic dynamic, which underscores the political risks to asset managers.
Late-cycle markets in ags, gas and metals while oil lags. In the near term, the longer the current crisis drags on, the larger the social need and policy response; however, once the normalization begins (whether that is in 2H21 as our economists are forecasting, or later, should vaccines disappoint), a V-shaped recovery in demand will almost certainly face tight supply across all markets. As we have emphasized over the past month, nearly every commodity is in a deficit, including oil today, despite lockdowns. Such broad-based deficits are usually only seen late in the business cycle.
Winter lockdowns appear only a speed bump for oil. Any tactical downside in crude will likely be temporary, in our view, pushing back our $65/bbl Brent target into late 2021. We expect the winter Covid wave to delay, but not derail, the oil market rebalancing, with normalized OECD stocks, OPEC+ spare capacity returning to 1Q20 levels, and finally, shale production growth all occurring by 4Q21.
Base metals and agriculture have more near-term upside than oil. Indeed, China has destocked the West just as its demand recovery begins. This year China’s base and bulk imports have surged, underpinned by robust onshore end-user demand from infra and construction, shortages in scrap and strategic stockpiling. Across aluminium, copper and iron ore China has substantially offset Western Covid surpluses, generating deficits from Q3, copper in particular. Moreover China’s domestic markets show no signs of gluts developing. In agriculture, 20/21 has been a record-breaking year of US corn, soy and pork exports, largely driven by increased Chinese buying to combat rising domestic food prices and low state reserves of all three commodities.
Reflation and renewables will pull precious metals higher. Similar to after the GFC, gold markets will likely be pulled higher as reflation concerns grow with the recovery and investors look to buy the currency of last resort. Our economists believe near-term breakeven inflation has further room to run, supporting our $2300 gold forecast. Silver’s demand will also rise as policymakers REV the economy with a 9% increase in solar installation demand alone.
Watch out for the weather amid a secular demand boom. As La Nina strengthens over the East Pacific, near-term risks to agricultural commodity supply is growing, from US winter wheat to Argentinean corn and Colombian coffee. As a result of La Nina we see additional price volatility in soybeans, corn, coffee and coking coal going in to 2021. More importantly, however, this near-term supply risk comes at the start of a boom in grains demand, as renewable diesel, China’s strategic restocking and the growth of its hog herd tighten the outlook for US balances going forward.
18 November 2020 3
Goldman Sachs 2021 Commodity Outlook
For t
he e
xclu
sive
use
of J
OSEP
H.ST
EIN@
GS.C
OM
7f10
0ca8
95df
11e0
bb43
0021
5ace
2648

GS Commodity Views
Exhibit 1: Bloomberg Commodity Index Forecasts
2018 2019 2020 YTD„ 3m 6m 12m
BCOM 100.0 -11.2 7.7 -8.4 4.7 7.8 9.3Energy 23.6 -12.7 11.8 -45.3 4.2 14.1 19.7Industrial Metals 18.9 -19.5 7.0 10.7 -0.4 0.3 1.4Precious Metals 20.5 -4.6 17.0 23.8 20.6 20.1 19.2Grains 24.8 -5.5 -1.1 7.0 0.8 1.5 -0.6Softs 7.2 -22.3 4.3 -1.7 -6.3 -4.8 1.3Livestock 5.1 -1.7 -6.0 -27.1 -2.9 5.1 10.5
„ YTD returns through Nov 16, 2020
BCOM Index Dollar Weight
Historical Performance Forecast
Source: Goldman Sachs Global Investment Research.
Exhibit 2: S&P GSCI Forecasts
2018 2019 2020 YTD„ 3m 6m 12m
S&P GSCI 100.0 -12.9 17.4 -27.9 3.4 9.4 26.8Energy 62.6 -13.9 28.5 -45.7 4.6 12.7 40.1Industrial Metals 11.2 -18.0 2.8 9.4 -0.1 1.5 3.0Precious Metals 4.1 -3.6 17.7 22.6 20.7 20.2 19.2Agriculture 15.4 -7.0 -1.6 3.8 -0.7 0.3 -1.0Livestock 6.7 -2.2 -5.4 -26.0 -2.9 5.4 10.6
„ YTD returns through Nov 16, 2020
GSCI Commodity Index Dollar Weight
GS ForecastHistorical Performance
Source: Goldman Sachs Global Investment Research.
Exhibit 3: Key Commodity Price Forecasts
4Q20E 1Q21E 2Q21E 3Q21E 4Q21E 2020E 2021E 3m 6m 12mEnergy
WTI $/bbl 40.0 45.0 49.0 56.5 60.5 38.7 52.8 45.0 49.0 60.5Brent $/bbl 42.0 47.0 51.0 59.0 63.0 42.4 55.0 47.0 51.0 63.0
Nat Gas $/mmBtu 3.00 3.50 3.25 3.25 2.92 2.17 3.23 3.00 3.50 3.25IndustrialAluminum $/mt 1,950 2,000 2,050 2,100 2,100 1,712 2,063 2,000 2,050 2,100
Copper $/mt 6,750 7,000 7,250 7,500 7,500 6,067 7,313 7,000 7,250 7,500Nickel $/mt 16,000 16,500 16,000 16,000 16,000 13,797 16,125 16,500 16,000 16,000Zinc $/mt 2,500 2,550 2,475 2,450 2,400 2,233 2,469 2,550 2,475 2,400
PreciousGold $/t oz 2,300 2,300 2,300 2,300 2,300 1,977 1,977 2,300 2,300 2,300Silver $/t oz 30 30 30 30 30 23 30 30 30 30
Source: Goldman Sachs Global Investment Research.
18 November 2020 4
Goldman Sachs 2021 Commodity Outlook
For t
he e
xclu
sive
use
of J
OSEP
H.ST
EIN@
GS.C
OM
7f10
0ca8
95df
11e0
bb43
0021
5ace
2648

Focus: Vaccine presents tactical upside; the pandemic itself represents a structural shift in 2021
Commodity performance, along with other parts of the old economy, has been unprecedentedly weak over the past decade with the GSCI down 61%, erasing nearly three decades of gains. We believe this streak of poor returns has reached an end in the aftermath of the Covid crisis. Of course, negative oil prices are hard to top, and it’s easy – and largely accurate – to present the 2021 commodity outlook as a V-shaped vaccine trade. What we think is key, however, is that this recovery in commodity prices will actually be the beginning of a much longer structural bull market for commodities driven by three key themes.
Revenge of the old economy. Structural under-investment in the old economy due 1.
to a decade of poor returns, particularly in energy where ESG issues have further reduced investment, was accelerated during 2020 in response to covid, leaving inadequate production capacity to meet a V-shaped vaccine driven demand recovery. Investment decisions are at a historical trough, taking 7.9 mn bld of oil out of 2025 expected supply. In our view, this will spell the end of non-OPEC growth in 2021.
REVing commodity demand growth. Covid is already ushering in a new era of 2.
policies aimed at social need instead of financial stability. This will likely create cyclically stronger, more commodity-intensive economic growth that should create a cyclical upswing in demand, helping commodities and the old economy to finally reach escape velocity, pushing these sectors out of the mid-cycle trap they have been in for the past decade. Three global policy initiatives have the potential to REV the global demand for commodities: Redistributional policies, Environmental policies and Versatile supply chain initiatives. Moreover, redistributional policies have a long-lasting tail effect, as growing wages drive a consumption-wage growth multiplier across the economy, creating a secular upward trend in demand over the coming decade.
Revaluation and reflation. Covid has led to a massive rise in government spending, 3.
particularly in the US where the dollar was already facing headwinds. Although the dollar got a boost from a flight to safety at the beginning of the crisis, this support is likely to fade in 2021 and beyond, creating a positive feedback loop similar to what it did during the 1970s and 2000s when oil and gold reached historical highs. In addition, inflation tails risks are greater than at any other time since the 1970s due to the REV policies laid out above.
18 November 2020 5
Goldman Sachs 2021 Commodity Outlook
For t
he e
xclu
sive
use
of J
OSEP
H.ST
EIN@
GS.C
OM
7f10
0ca8
95df
11e0
bb43
0021
5ace
2648

Exhibit 4: New economy outperformance attracts capital away from the old economy... Equity return index, 1980 = 100
Exhibit 5: ...creating sustained declines in old economy capex in 2021
0
2000
4000
6000
8000
10000
12000
14000
80 82 84 86 88 90 92 94 96 98 00 02 04 06 08 10 12 14 16 18
Old Economy New Economy
-30%-25%-20%-15%-10%
-5%0%5%
10%15%20%25%
2020E 2021E (2019 basis)
Old economy capex will remain below 2019
Source: Reuters, Goldman Sachs Global Investment Research
Source: Company data, Goldman Sachs Global Investment Research
Exhibit 6: Redistributional policies are associated with commodity price inflation... 100% Commodity equal weighted index, 5-year rolling return, % an, Growth in Government Social Benefits to Persons, % an (rhs)
Exhibit 7: ...while environmental policies will drive a capex boom on par with the 2000s
0%
20%
40%
60%
80%
100%
120%
140%
160%
-100%
0%
100%
200%
300%
400%
500%
1960 1965 1971 1977 1983 1989 1995 2000 2006 2012 2018100% Commodities (Equally-weighted Index*)Government Social Benefit Payments to Persons
0.0
0.2
0.4
0.6
0.8
1.0
1.2
1.4
1.6
1.8
23%
24%
25%
26%
27%
28%
29%
30%
1965 1970 1975 1980 1985 1990 1995 2000 2005 2010 2015 2020
Capex share of world GDP
Real metal prices
Capital intensity needed to achieve 70% CO2 reduction by 2050
Source: AQR, Goldman Sachs Global Investment Research, Bloomberg.
Source: Goldman Sachs Global Investment Research, Maddison Project.
Exhibit 8: Weaker US dollar helps push commodity prices higher in 2020
Exhibit 9: ...while higher prices help drive up the $-value of global trade, weakening the dollar
0.0076
0.0078
0.008
0.0082
0.0084
0.0086
0.0088
0.009
0.0092
45
50
55
60
65
70
75
80
85
Nov-19 Jan-20 Mar-20 May-20 Jul-20 Sep-20
Bloomberg Commodity Index USD TWI (inv, rhs)
80
85
90
95
100
105
110
115
120
-10
10
30
50
70
90
110
130
150
2006 2008 2010 2012 2014 2016 2018 2020
Brent Price Index of global trade in USD (rhs)
$/bbl
Source: Bloomberg, Goldman Sachs Global Investment Research
Source: CPB, Goldman Sachs Global Investment Research, Bloomberg
18 November 2020 6
Goldman Sachs 2021 Commodity Outlook
For t
he e
xclu
sive
use
of J
OSEP
H.ST
EIN@
GS.C
OM
7f10
0ca8
95df
11e0
bb43
0021
5ace
2648
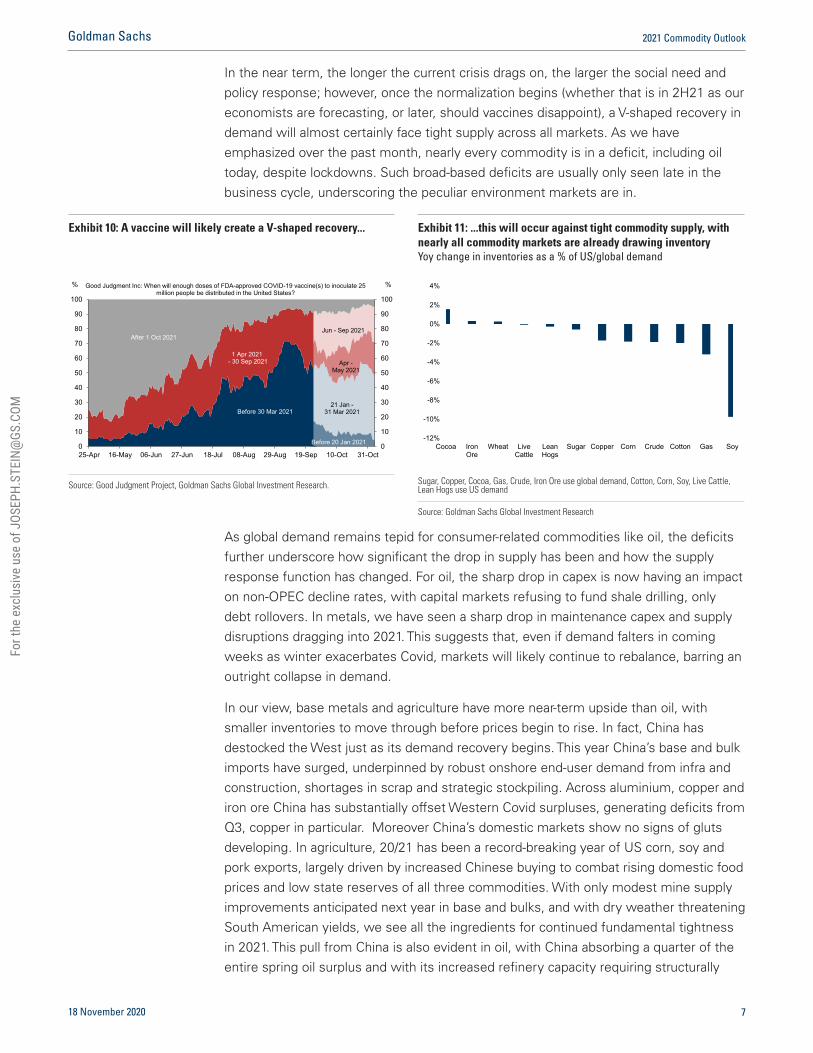
In the near term, the longer the current crisis drags on, the larger the social need and policy response; however, once the normalization begins (whether that is in 2H21 as our economists are forecasting, or later, should vaccines disappoint), a V-shaped recovery in demand will almost certainly face tight supply across all markets. As we have emphasized over the past month, nearly every commodity is in a deficit, including oil today, despite lockdowns. Such broad-based deficits are usually only seen late in the business cycle, underscoring the peculiar environment markets are in.
As global demand remains tepid for consumer-related commodities like oil, the deficits further underscore how significant the drop in supply has been and how the supply response function has changed. For oil, the sharp drop in capex is now having an impact on non-OPEC decline rates, with capital markets refusing to fund shale drilling, only debt rollovers. In metals, we have seen a sharp drop in maintenance capex and supply disruptions dragging into 2021. This suggests that, even if demand falters in coming weeks as winter exacerbates Covid, markets will likely continue to rebalance, barring an outright collapse in demand.
In our view, base metals and agriculture have more near-term upside than oil, with smaller inventories to move through before prices begin to rise. In fact, China has destocked the West just as its demand recovery begins. This year China’s base and bulk imports have surged, underpinned by robust onshore end-user demand from infra and construction, shortages in scrap and strategic stockpiling. Across aluminium, copper and iron ore China has substantially offset Western Covid surpluses, generating deficits from Q3, copper in particular. Moreover China’s domestic markets show no signs of gluts developing. In agriculture, 20/21 has been a record-breaking year of US corn, soy and pork exports, largely driven by increased Chinese buying to combat rising domestic food prices and low state reserves of all three commodities. With only modest mine supply improvements anticipated next year in base and bulks, and with dry weather threatening South American yields, we see all the ingredients for continued fundamental tightness in 2021. This pull from China is also evident in oil, with China absorbing a quarter of the entire spring oil surplus and with its increased refinery capacity requiring structurally
Exhibit 10: A vaccine will likely create a V-shaped recovery...
Exhibit 11: ...this will occur against tight commodity supply, with nearly all commodity markets are already drawing inventory Yoy change in inventories as a % of US/global demand
0
10
20
30
40
50
60
70
80
90
100
0
10
20
30
40
50
60
70
80
90
100
25-Apr 16-May 06-Jun 27-Jun 18-Jul 08-Aug 29-Aug 19-Sep 10-Oct 31-Oct
%%
Before 30 Mar 2021
1 Apr 2021- 30 Sep 2021
After 1 Oct 2021
Before 20 Jan 2021
21 Jan -31 Mar 2021
Apr -May 2021
Jun - Sep 2021
Good Judgment Inc: When will enough doses of FDA-approved COVID-19 vaccine(s) to inoculate 25 million people be distributed in the United States?
-12%
-10%
-12%
-10%
-8%
-6%
-4%
-2%
0%
2%
4%
Cocoa IronOre
Wheat LiveCattle
LeanHogs
Sugar Copper Corn Crude Cotton Gas Soy
Source: Good Judgment Project, Goldman Sachs Global Investment Research.
Sugar, Copper, Cocoa, Gas, Crude, Iron Ore use global demand, Cotton, Corn, Soy, Live Cattle, Lean Hogs use US demand
Source: Goldman Sachs Global Investment Research
18 November 2020 7
Goldman Sachs 2021 Commodity Outlook
For t
he e
xclu
sive
use
of J
OSEP
H.ST
EIN@
GS.C
OM
7f10
0ca8
95df
11e0
bb43
0021
5ace
2648

higher inventory coverage going forward.
Indeed, as demand could bounce back rapidly with the roll-out of rapid Covid testing alone, upside risks to tightening balances across all markets remain. In oil, winter lockdowns are only a speed bump: any tactical downside in crude will likely be temporary, in our view, pushing back our $65/bbl Brent target into late 2021. We expect the winter Covid wave to delay, but not derail, the oil market rebalancing, with normalized OECD stocks, OPEC+ spare capacity returning to 1Q20 levels, and finally, shale production growth all occurring by 4Q21.
Unique among all recent recessions, Covid has automatically synchronised the global business cycle, creating co-ordination of policy along the same decarbonisation channel. We believe this will spur a specifically commodity-intensive recovery, one that is broadly resistant to near-term lockdown risk. Such a sharp V-shaped recovery has created concern around our bullish gold call of $2300/toz; however, we remain convicted as gold prices off near-term real rates which are expected to remain under pressure, not longer-dated real rates which are likely to be cyclically stronger as the V-shape recovery takes hold. All of this suggests an inflection in the prices of commodities in 2021. As a result, we maintain our Overweight recommendations for commodities in 2021 and forecast a return of 30%.
Commodities 2010 to 2019: Caught in a mid-cycle trap It is tempting to blame supply for the poor performance of commodities over the past decade, particularly given the technological innovations in shale, pig iron nickel and smart farming, to name a few. However, in our view, it was the inevitable consequence of global policy focused on market- and financial-stability. The resulting lack of cyclicality in the global economy stranded commodity markets and the old economy in a mid-cycle trap that never had the ability to reach escape velocity and enter the expansion phase of the business cycle, helping commodities and the old economy out of the mid-cycle trap they have been in for the past decade that lies at the core of the poor performance. We believe that the pandemic will be the catalyst to usher in a new era in which the global policy focus is shifted from financial stability (following the financial crisis) to one of
Exhibit 12: Previous La Nina events have been associated with rising agricultural prices
Exhibit 13: Chinese copper imports have surged this year, destocking Western markets Chinese copper imports, kmt
-6
-5
-4
-3
-2
-1
0
1
2
3
4-70%
-50%
-30%
-10%
10%
30%
50%
70%
90%
1979 1983 1988 1993 1997 2002 2007 2011 2016
Annual returns, S&P GSCI Agriculture subindex ENSO (rhs, inv)
La Nina
El Nino
1,000
1,500
2,000
2,500
3,000
3,500
4,000
4,500
5,000
5,500
Source: NOAA, Bloomberg, Goldman Sachs Global Investment Research
Source: Wind, Goldman Sachs Global Investment Research
18 November 2020 8
Goldman Sachs 2021 Commodity Outlook
For t
he e
xclu
sive
use
of J
OSEP
H.ST
EIN@
GS.C
OM
7f10
0ca8
95df
11e0
bb43
0021
5ace
2648

social need, the need to deal with political issues that can no longer be ignored such as inequality, climate change and structural unemployment in key sectors and demographics. As we argue below and as recently acknowledged by the US Federal Reserve in announcing its new framework, a cyclically strong economy solves many of these problems. Accordingly, this new era will be characterised by more cyclical and commodity-intensive economic growth, increased green investment and a greater focus of governments on providing for lower-income households who have a higher propensity to consume on real assets.
After the financial crisis, the stimulus in the West simply could not create strong, late-cycle commodity demand, focussed as it was on debt sustainability, fiscal rules and austerity. Even in China, the previous five-year plan (2016 to 2020) was focused on deleveraging, supply-side reform and anti-pollution efforts, all of which all of which reduced the cyclicality global commodity demand. As a result, the global economy never got above capacity, with the exception of about 12 months starting in late 2017. However, for those 12 months commodities performed as expected with oil topping $88/bbl and the GSCI up c.30% at a time when equities had started to wane with the rapid rise in rates (Exhibit 15). However, with policy focused on macro stability, the overheating economy was immediately shut down in late 2018 and early 2019, alongside an escalating trade war. Then the Covid crisis struck, leaving concerns around an overheating economy in the distant past.
Even OPEC abandoning market stability in favour of market share again. Take oil: the sharp increases in shale output over the past decade were constantly accommodated by OPEC+, in the name of ‘market stability’, leaving global supply growth mostly in line with the benign demand environment. This benign demand and price environment, which mimicked the broader economy, incentivized central banks to pursue more QE in an attempt to reach escape velocity from the mid-cycle trap. This in turn lowered the cost of capital, allowing producers to pursue capex programs that reached levels near 130% of cash flow, reinforcing a stable environment that never had a chance of reaching escape velocity. Like the US Federal Reserve in its recent revamp, OPEC+ abandoned market stability (Exhibit 17) in March, which has created a likely
Exhibit 14: Trend oil demand has been similar to prior decades, but without the cyclicality... Yoy global crude demand growth, % an
Exhibit 15: ...as central bankers raised rates as soon as cyclicality materialised Department of Commerce US Capex Tracker, yoy growth, Fed Funds Rate (rhs)
-2%
-1%
0%
1%
2%
3%
4%
5%
1987 1990 1993 1996 1999 2002 2005 2008 2011 2014 2017
Yoy Global demand growth
Average demand growth
-10%
-8%
-6%
-4%
-2%
0%
2%
4%
6%
8%
-25
-20
-15
-10
-5
0
5
10
15
20
1992 1995 1999 2003 2007 2011 2015 2018
Capex Tracker Fed Funds Rate (rhs)yoy %
Source: IEA, Goldman Sachs Global Investment Research
Source: Haver Analytics, Goldman Sachs Global Investment Research, Department of Commerce
18 November 2020 9
Goldman Sachs 2021 Commodity Outlook
For t
he e
xclu
sive
use
of J
OSEP
H.ST
EIN@
GS.C
OM
7f10
0ca8
95df
11e0
bb43
0021
5ace
2648

lasting shift towards fiscal discipline among shale producer out of fear of another price collapse (as explicitly stated in recent earnings releases). This in turn has allowed OPEC+ to focus on better compliance near-term to lower inventories, which reinforces backwardation and reduces the ability for shale producers to hedge large capex programs.
Cycles are important to both innovation and profitability. Remember that it was the super cycle in demand from the 2000s that led to the high prices that stimulated those technological innovations (and equally the low prices that led to the collapse of the less-efficient and unprofitable producers in the early part of the decade, that dragged down industry-wide returns in the 2010s). However, the last decade removed the cyclicality from demand and prices. When demand waned, policy stimulated, and when demand surged, policy delevered. While there is a view among many that demand growth for commodities was tepid over the past decade, in reality, it was on the same trend as the previous 30 years, just without cycles. 1.66% through 1987-2007, and 1.63% through 2010-2019. And surprisingly, this was mostly true for global copper demand as well (Exhibit 14 and Exhibit 16). And the global mix of policy was not too different as China leaned on fiscal policy while the West leaned on monetary policy. The problem for commodities was that the global policy approach was risk-averse. Today, we believe policy will be the opposite – after a decade of ascendant populism, politicians the world-over know they cannot repeat the mistakes of the past when coming out of this recession.
Commodities beyond 2020: REVing demand to reach escape velocity The financial crisis was a crisis of financial instability; the Covid crisis is a crisis of social need, driven by healthcare and severe unemployment in the hardest-hit sectors. While social need was paramount after the financial crisis, the more pressing concern was the stability of the financial system itself – accordingly, policy efforts were directed toward macro stability, leaving social issues unresolved. Today, the more salient concerns are social issues, such as income inequality, minority unemployment and structural weakness in sectors severely hit by Covid. Accordingly, we expect the policy response
Exhibit 16: Stabilisation policies were global...even reducing copper demand cyclicality Yoy growth in ExChina copper demand, % an
Exhibit 17: Even OPEC pursued a market stability strategy reducing supply cyclicality Global oil supply growth yoy, OPEC and non-OPEC
7%
8%
-6%
-4%
-2%
0%
2%
4%
6%
8%
10%
12%
1985 1990 1995 2000 2005 2010 2015
Yoy ExChina Demand Growth
Average demand growth
-10%
-5%
0%
5%
10%
15%
1987 1990 1993 1996 1999 2002 2005 2008 2011 2014 2017
OPEC Crude Non-OPEC supply
Opec offset global supply swings
Source: Goldman Sachs Global Investment Research, Wood Mackenzie
Source: IEA, Goldman Sachs Global Investment Research
18 November 2020 10
Goldman Sachs 2021 Commodity Outlook
For t
he e
xclu
sive
use
of J
OSEP
H.ST
EIN@
GS.C
OM
7f10
0ca8
95df
11e0
bb43
0021
5ace
2648

today to focus more on the need to reduce social need, rather than maintaining macro stability at the expense of jobs, wages and health outcomes.
Policies aimed at financial stability, by definition, took risk out of the system, and along with it many of the drivers of strong demand growth that would potentially have created inflation, a commodity bull market and, more importantly, the rising tide of wages and income that lifts all boats (Exhibit 18). The Covid crisis has not only pushed aside efforts towards austerity, by forcing record fiscal spending, it has also exposed many of the problems these policies exacerbated, such as income inequality, minority unemployment, and the fragility of just-in-time inventory management. In contrast, policies aimed at social need will likely create cyclically stronger, more commodity-intensive economic growth that should create a cyclical upswing in demand to finally reach escape velocity, helping commodities and the old economy out of the mid-cycle trap they have been in for the past decade.
Exhibit 18: Commodities and wages both grow fastest during late cycle expansions
Bonds 12.2% Equities 19.1% Commodities 29.7% Bonds 14.3%
Equities 10.6% Bonds 4.4% Equities 15.5% Cash 5.6%
Cash 2.9% Commodities 4.0% Bonds 5.8% Commodities 3.4%
Commodities 0.0% Cash 3.0% Cash 5.1% Equities -12.4%
Lowest Income
3.0%Poorest Quintile
1.6%Poorest Quintile
3.1%Poorest Quintile
5.6%
2nd 1.7% 2nd 1.6% 2nd 1.9% 2nd 4.4%
3rd 2.4% 3rd 1.9% 3rd 1.7% 3rd 4.2%
4th 2.9% 4th 2.4% 4th 1.6% 4th 4.6%
Highest Income
3.1%Highest Income
3.6%Highest Income
4.2%Highest Income
1.6%
Core CPI 2.7% Core CPI 2.3% Core CPI 2.8% Core CPI 3.4%
Relative Ranking of Assets (average return by phase, annualized)
Quintile Income Growth
Below capacity& declining
Phase 1Contraction
Below capacity& growing
Phase 2Recovery
Above capacity& growing
Phase 3Expansion
Above capacity& declining
Phase 4Slowdown
Source: Goldman Sachs Global Investment Research.
18 November 2020 11
Goldman Sachs 2021 Commodity Outlook
For t
he e
xclu
sive
use
of J
OSEP
H.ST
EIN@
GS.C
OM
7f10
0ca8
95df
11e0
bb43
0021
5ace
2648

Reducing social need will help boost demand. In short, we believe a stimulus aimed at social need creates far more growth than a stimulus aimed at fixing a financial crisis. Since the financial crisis, markets have not been faced with an overheating global economy, something at the core of a strong commodity and cyclical backdrop, and something which only above-capacity demand growth can create. Certainly, we believe this type of demand growth was never possible with fiscal policy focused on austerity, and monetary policy focused on financial market stability, with regulations aimed at restricting credit to lower income groups. As the stimulus, ultimately, was restricted to the banking system, it was only able to create asset price inflation, mostly benefiting higher-income groups where the marginal propensity to consume out of wealth is a meager 3%. In contrast, the average propensity to consume out of permanent income (wages) among low income households has ranged from 95-105% – that is, households have dissaved to continue consuming (see Exhibit 23).
This is important: the majority of wealth is held among only a few, very rich individuals, with the majority of people having very little wealth (Exhibit 19). As a result, the lower-wealth groups substantially outnumber the higher wealth groups (Exhibit 20) and hence, volumetrically, consume more commodities and other real assets. Using data from Piketty, Zucman and Saez’s (2018) MicroData files, Exhibit 19 and Exhibit 20 show this clearly – the first shows the percentage of total wealth held by each decile of the income distribution, while the second shows the proportion of the population that holds each 10% of the US’s net wealth. As 50% of the nation’s wealth is held by a few multi-millionaires who are unconstrained in their consumption, any marginal increase in overall wealth translates to little additional demand in the economy.
A REV’ed up economy will help drive a structural bull market in commodities. Today’s Covid crisis has changed many people’s perception of the role of the state, creating a situation similar to that of the 1960s, the last time social need was escalated to the top of the policy agenda. In the 1960s, the focus was the need to project power in the Cold War (today’s fight is against Covid, and the effects of decoupling from China) and the need to fight the War on Poverty to calm social unrest (today’s is against minority unemployment and income inequality). The US government embarked on an
Exhibit 19: As the very wealthiest own most of the wealth... % of total wealth owned by wealth decile
Exhibit 20: ...the number of people who own most of the wealth is small, lowering the effectiveness of a wealth-based stimulus x-axis; deciles of national wealth, y-axis; % of the population who own that decile of wealth
-10%
0%
10%
20%
30%
40%
50%
60%
70%
80%
1stdecile
2nddecile
3rddecile
4thdecile
5thdecile
6thdecile
7thdecile
8thdecile
9thdecile
10thdecile
1962 2020
In 2020, the richest 10% owned c.70% of America's
0%
10%
20%
30%
40%
50%
60%
70%
80%
10% 20% 40% 50% 60% 70% 80% 90% 100%
1962 2020
70% of Amiercan's own only 10% of the nation's wealth
Source: Picketty, Zucman, Saez, Goldman Sachs Global Investment Research.
Source: Picketty, Seaz, Zucman (2018), Goldman Sachs Global Investment Research.
18 November 2020 12
Goldman Sachs 2021 Commodity Outlook
For t
he e
xclu
sive
use
of J
OSEP
H.ST
EIN@
GS.C
OM
7f10
0ca8
95df
11e0
bb43
0021
5ace
2648

unprecedented spending program and did not raise taxes accordingly, the central bank kept rates low, as inflation had been near 1.5% and unemployment below 5%, and the bond market kept borrowing rates low, driven by well-anchored inflation expectations.
We view today’s current policy mix, and more importantly, the strength of today’s consensus for greater macro-level spending to address specific social inequities, as far more likely to generate a commodity bull market than the policy mix following the financial crisis. While the exact policy program for the US remains heavily contingent upon cooperation between branches of government, without substantial changes, the demands to address social inequities will likely continue to rise. These trends demand increasing amounts of attention and money from government, while potentially complacent markets continue to offer cheap funding, seemingly ignoring inflation or default risks. The potential for shifting policy preferences as a result of the current political situation can already be seen in Federal Reserve statements about income distribution and inflation targeting. We believe this shift will be represented by three global policy initiatives that have the potential to REV the global demand for commodities: Redistributional policy, Environmental policy and Versatility of global supply chains (caught out twice by a trade war and the global pandemic).
Redistributional policy. While Covid-19 began as a health crisis, it quickly morphed 1.
into an economic and social crisis, which escalated the spending requirements of governments around the world, from healthcare to unemployment benefits. Total additional government spending commitments in the first two months alone rose to c.$10 trn, the highest since the 1970s. To deal with the social issues of income inequality and minority unemployment, an overheated economy is historically required: this is when the wages of the lowest incomes accelerate the most, closing the gap. While most economists (based on consensus) see these redistributional polices fading a year or two after this current crisis, history shows that it takes a new crisis to end them, just as it took the current crisis to end macro stability and austerity policies. While LBJ started similar policies in the mid-1960s, it was not until the early 1980s that they were ended for good, and it took painful inflation to create the political will to do so. Indeed, redistributive policy is becoming a centerpiece of policy-makers’ long-run agendas, from Biden’s fiscal strategy and Johnson’s ‘leveling up’ agenda in the UK, to the European multi-year funding framework and China’s 5-year plan. While COVID pressures should eventually fade, we believe redistributional policy will continue well into the 2020s.
Environmental policy. Weather events over the past two years have pushed 2.
climate change close to the top of the policy agenda. It has become a convenient need to accommodate potentially large infrastructure spending programs in policy, particularly as many investors and voters are pressing for rapid decarbonisation. Our equity research colleagues estimate that a 70% reduction in global CO2 emissions by 2050 will require a US$2 trn investment per annum. With global GDP in 2019 roughly US$87 trn, US$2 trn could boost global capital formation from 25.8% currently to 28.1%. This represents an increase in the capital intensity of the global economy comparable to the effect of the BRICs boom of the 2000s, and one which would be global, rather the constrained to the emerging markets.
18 November 2020 13
Goldman Sachs 2021 Commodity Outlook
For t
he e
xclu
sive
use
of J
OSEP
H.ST
EIN@
GS.C
OM
7f10
0ca8
95df
11e0
bb43
0021
5ace
2648

Versatile supply chain initiatives. After two years of trade war, and one year into a 3.
global pandemic, the need for supply chain resilience is paramount. This includes strategic reserves and supply chain security for the new, green and old economies, such as duplicate 5G networks (the new economy), domestic initiatives for electric and hydrogen fuel cell vehicles (green economy) and domestic manufacturing supply security such as steel production capacity (old economy). We believe this will significantly impact oil (crude), copper, corn/soybeans and palladium (CCCP), where Chinese strategic stock building has already had a substantial impact, tightening these key commodity markets in 2020.
The REV economy is global, not local. It is important to emphasize that these policy initiatives are global phenomena – from China’s new five-year plan to Europe’s Green Deal or Biden’s stimulus plan, policymakers are looking to REV their economies after a decade of policies aimed at financial stability. Specifically, the new Chinese five-year plan has three major points that capture these three themes: (1) technology standards
Exhibit 21: Redistributional policy raises commodity demand as it is more equally distributed than income... % of the total of each variable, by income decile. A steep angle is more unequal than a flat line (uniform consumption)
Exhibit 22: ...while lower income households have a higher commodity consumption intensity than rich households Total direct and indirect commodity demand from a $1 increase in standard consumption bundle, by decile on income
0%
5%
10%
15%
20%
25%
30%
35%
Lowest10
percent
Third10
percent
Fifth10
percent
Seventh10
percent
Ninth10
percent
% of total consumption
% of total post-taxincome% of raw commodityconsumption% of total commodityconsumptionEquality
Moreunequal
Moreunequal
$0.30
$0.35
$0.40
$0.45
$0.50
$0.55
Lowest10
percent
Second10
percent
Third10
percent
Fourth10
percent
Fifth10
percent
Sixth10
percent
Seventh10
percent
Eighth10
percent
Ninth10
percent
Highest10
percent
Average dirct and indirect $ commodity demand from $1 of income$ demand adjusted for MPC
Richer
More commodity intensive
Less commodity intensive
Poorer
Source: Goldman Sachs Global Investment Research., BLS, BEA
Source: Goldman Sachs Global Investment Research., BLS, BEA
Exhibit 23: ...as the wealthy spend less of their income, acting as a drag on consumption Average consumption intensity by quintile, % of income consumed each period (>1 implies net borrowing)
Exhibit 24: In addition, environmental policy will spark a capex boom similar to that of the 2000s
0.85
0.87
0.89
0.91
0.93
0.95
0.97
0.99
1.01
1.03
1.05
Bottom Quintile Second Quintile Middle Quintile Fourth Quintile Top Quintile
0.0
0.2
0.4
0.6
0.8
1.0
1.2
1.4
1.6
1.8
23%
24%
25%
26%
27%
28%
29%
30%
1965 1970 1975 1980 1985 1990 1995 2000 2005 2010 2015 2020
Capex share of world GDP
Real metal prices
Capital intensity needed to achieve 70% CO2 reduction by 2050
Source: Goldman Sachs Global Investment Research., FED
Source: Goldman Sachs Global Investment Research, Haver Analytics
18 November 2020 14
Goldman Sachs 2021 Commodity Outlook
For t
he e
xclu
sive
use
of J
OSEP
H.ST
EIN@
GS.C
OM
7f10
0ca8
95df
11e0
bb43
0021
5ace
2648

and investment to create domestic technologies; (2) a domestic green movement; and (3) dual circulation, which requires building out a middle class consumer to create domestic consumption of excess production. To achieve the latter, China has explicitly noted potential redistributive policies to the lower-income rural communities. It is important to note that these structural drivers outlast the government efforts to cyclically stimulate the economy. Beyond our economists estimate of an initial $1trn US stimulus, Biden’s climate plan targets additional $1.7trn of spending over the next 10 years. Even if a split Congress leads to a more gradual ramp up from $500bn, this remains a substantial tailwind to green capex. The same is true in Europe, where the Green Deal maps out a sequence of investment, regulation and energy market changes out until 2030.
As we believe that commodity markets are entering a structural bull market, we argue that worrying about this week’s oil or copper inventory report is far less important than understanding where we are in the broader super cycle. Over the past 10 years, global growth has had three, short-lived mini boom and bust cycles. However, it has never expanded at a fast pace for a considerable period. These mini cycles were all driven by policy stimuluses, specifically Chinese fiscal policy and US monetary policy. Every time policy support weakened, global growth slowed materially, as it did in 2010-2011, 2014-2015 and 2018-2019. Each slowdown forced the governments to add back stimulus, and led to a short-lived mini boom. Such short-term, mean-reverting cycles come in sharp contrast with the 2000s, which saw the biggest bull market in commodities since the 1970s. The difference between the 2000s and 2010s was that global growth in the 2000s was driven by long-term structural factors, such as a massive, savings-financed investment boom in China and a consumer-lending boom in the DM economies. Structural forces underpinning the 2000s commodities super cycle meant it remained uninterrupted by Chinese tightening in 2004, or US rate hikes in 2005, and was only derailed by a full-scale global crisis in 2008.
As we have emphasized in the past, the outlook for commodities prices and returns depends upon activity levels and not growth rates, as commodity market outperformance requires the level of demand to exceed the level of supply. In particular, if supply levels cannot reach demand levels, shortages persist, which keeps prices high and volatile even should growth slows (and weigh on the performance of financial anticipatory assets like equities).
Looking at the 2020s, we believe that similar structural forces to those which drove commodities in the 2000s could be at play. Huge environmental investment requirements suggest that the green capex increase could be as big as the BRICs investment 20 years ago. Additionally, the redistributative push in DMs, and in China this time, is likely to lead to large boost to consumer spending, comparable to the lending-fuelled consumption increase in the US and Europe in the 2000s (Exhibit 21 and Exhibit 22). We derive the total indirect and direct commodity demand for each decile’s consumption basket (for the exact methodology please see the Appendix). Although each rich household consumes more commodities in absolute terms (Exhibit 21), lower-income households’ consumption is inherently more commodity intensive, making wage growth in low-income households growth more bullish commodity
18 November 2020 15
Goldman Sachs 2021 Commodity Outlook
For t
he e
xclu
sive
use
of J
OSEP
H.ST
EIN@
GS.C
OM
7f10
0ca8
95df
11e0
bb43
0021
5ace
2648

demand than the equivalent growth in high-income households. Finally, similar to 2000s, there is structural under-investment in supply of almost all commodities. By contrast, the 2010s saw large supply growth of all key commodities, owing to technological innovation and a capex boom after years of strong prices. All in all, we believe the key drivers are in place for another long-term bull market in commodities.
We see green capex and broader environmental policies as bullish for energy prices, not just metals. In the case of gas, because most policies currently being proposed would increase the cost of shale supply, and potentially reduce associated gas production (if an Iran deal keeps oil prices below our constructive forecast). For oil, because we believe low deferred prices already embed a full return of Iran in 2021, and sustained weak demand – both too pessimistic in our view – with the shale supply headwinds set to offset a return of Iran production longer term. Headwinds to US oil and gas production could rise further under a Biden Administration, even if the President-Elect has struck a centrist tone, reiterating his climate plan instead of the more ambitious Green New Deal. Statements to date suggest his administration would likely introduce regulations that would: (1) increase the cost of shale production (with methane restriction and taxes potentially increasing costs by up to $5/bbl); as well as (2) reduce shale’s recoverable resources (via limitations on federal land drilling and pipeline approvals).
On the demand side, Biden’s climate priorities point to a faster deployment of renewable sources of energy than currently expected (Exhibit 25). While negative for US hydrocarbon demand over the long run, such an agenda would require new infrastructure, which alongside a likely large initial fiscal stimulus would in our view lead to higher oil demand in coming years than currently expected (with a $2 trn stimulus over 2021-22 boosting US demand by c.200 kb/d, for example). The targeted increase in renewable power generation, likely enabled through an extension of the associated tax credits, could in turn support gas burn, initially to compensate for greater intermittency in power generation as electricity demand rises, especially in the context of declining coal-fired generation capacity, until sufficient utility storage capacity is installed (Exhibit 26).
Exhibit 25: The impulse via consumer incomes and industrial activity should boost US gasoline and diesel consumption Estimated impact of proposed Biden-Harris Agenda on gasoline and distillate demand (kb/d, vs. baseline of split congress)
Exhibit 26: Rising renewable capacity can support gas burn in coming years due to declining coal capacity and rising share of intermittent generation, as visible in California this year Share of generation capacity by fuel type
0%
1%
2%
3%
4%
5%
6%
7%
4 4 4 4 4
0
50
100
150
200
250
300
Jan-
21
Mar
-21
May
-21
Jul-2
1
Sep-
21
Nov
-21
Jan-
22
Mar
-22
May
-22
Jul-2
2
Sep-
22
Nov
-22
Jan-
23
Mar
-23
May
-23
Jul-2
3
Sep-
23
Nov
-23
Jan-
24
Mar
-24
May
-24
Jul-2
4
Sep-
24
Nov
-24
Distillate impulse Gasoline impulse
0%
10%
20%
30%
40%
50%
60%
70%
Gas California Wind & Solar CaliforniaGas Rest of US Wind & Solar Rest of US
Source: Goldman Sachs Global Investment Research, Haver Analytics, IEA, EIA.
Source: VelocitySuite, California ISO, Goldman Sachs Global Investment Research
18 November 2020 16
Goldman Sachs 2021 Commodity Outlook
For t
he e
xclu
sive
use
of J
OSEP
H.ST
EIN@
GS.C
OM
7f10
0ca8
95df
11e0
bb43
0021
5ace
2648

Hedging tail risk of inflation with commodities Even inflationary risks are to the upside, in our view. While our economists are forecasting 1.7% inflation in the US next year, using oil forwards at $48/bbl (as per the ECB and Fed), should our $65/bbl forecast materialize, this inflation number jumps to 2.5%, while core inflation rises from 1.6% to 1.75%. This is significant in the context of an average bond portfolio yielding less than 1.95%. This also illustrates an important point about levels, that it is the level of inflation that matters as opposed to the change in inflation (Exhibit 28). Macroeconomists and central bankers typically care about the change in inflation, and how far from target the economy is. Portfolio managers typically care about the level of inflation and whether that target could change. History shows there is a longer-term super cycle to the inflation target, just as there is for commodity prices, and that politics dictates when that target can change. As we have argued in the past, macro inflation is a political dynamic, as opposed to an economic dynamic such as relative price moves (which is what commodities are all about). Policy makers can always shut down or create macro inflation (by using the fiscal channel as opposed to the monetary channel). Today, with policy-makers facing a political crisis, as opposed to a financial crisis, they have little choice but to use the fiscal channel.
The key point from a hedging perspective is that asset managers care about the level of inflation, not the change in inflation, and from a level perspective, inflation hedges such as commodities and equities are likely far cheaper today than in the future, when inflation could arrive. When discussing the drivers of investment demand for gold and commodities, it is important to distinguish between debasement and inflation. The key is that current debasement and debt accumulation sow the seeds of future inflationary risk despite inflationary risks remaining low today. While debasement in many cases leads to inflation, it is not always the case, as witnessed over the past decade. Debasement can occur either against a consumption basket (e.g. CPI) or a financial asset basket (equities or bonds) — gold hedges in both case. Equally, the best debasement hedge (gold) is not always the best hedge against inflation (oil). Indeed, the word debasement comes from adding base metals such as tin or copper to the precious metals that acted as hard currency; therefore, owning the pure precious metal is the
Exhibit 27: Redistribution mechanically raises consumption intensity – a driver of core inflation APC – household consumption as a % of disposable income (>1 is equivalent to dissaving)
Exhibit 28: The asset manager and central banker are looking at two different things Fed Implied Inflation Target
0.8
0.85
0.9
0.95
1
1.05
1.1
1.15
0
0.5
1
1.5
2
2.5
3
3.5
4
1995 1997 1999 2001 2003 2005 2007 2009 2011 2013 2015 2017 2019
Core Inflation Lagged APC
-4
-2
0
2
4
6
8
10
12
14
1959 1964 1970 1975 1981 1986 1992 1997 2003 2008 2014 2019
US Headline CPI Fed Inflation Target
%
The asset manager's problem
The central banker's problem
Source: Haver, Goldman Sachs Global Investment Research.
Source: Haver Analytics, Goldman Sachs Global Investment Research.
18 November 2020 17
Goldman Sachs 2021 Commodity Outlook
For t
he e
xclu
sive
use
of J
OSEP
H.ST
EIN@
GS.C
OM
7f10
0ca8
95df
11e0
bb43
0021
5ace
2648
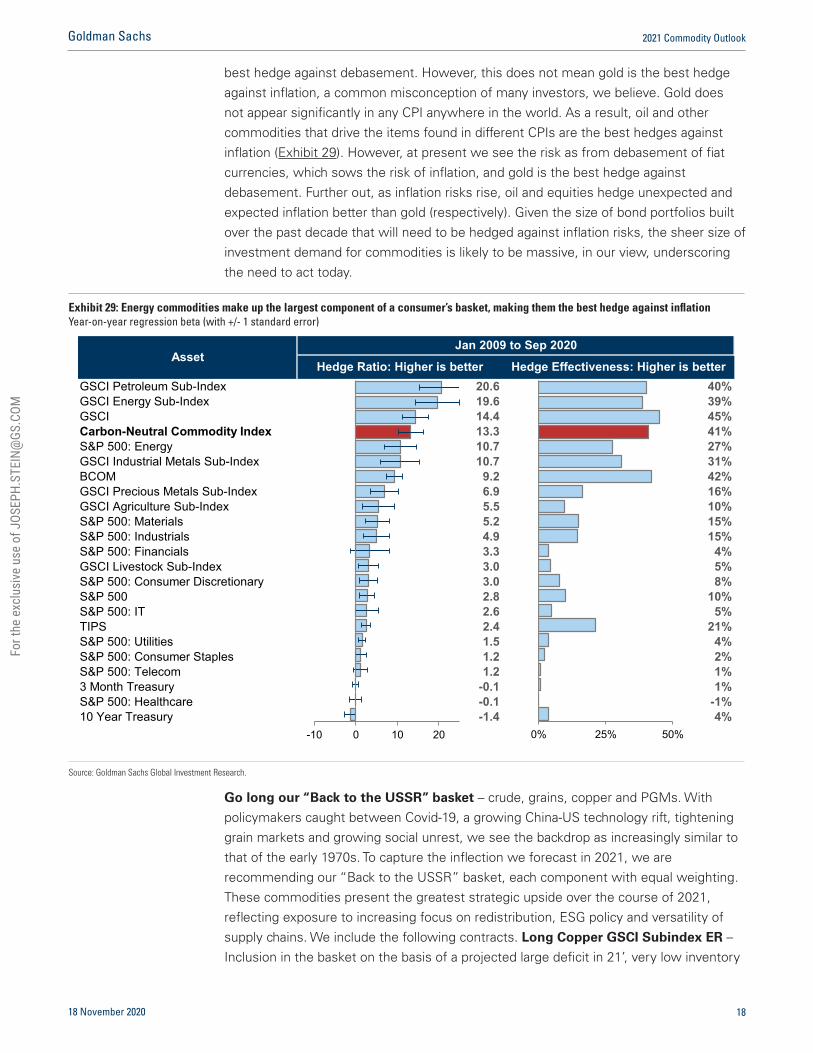
best hedge against debasement. However, this does not mean gold is the best hedge against inflation, a common misconception of many investors, we believe. Gold does not appear significantly in any CPI anywhere in the world. As a result, oil and other commodities that drive the items found in different CPIs are the best hedges against inflation (Exhibit 29). However, at present we see the risk as from debasement of fiat currencies, which sows the risk of inflation, and gold is the best hedge against debasement. Further out, as inflation risks rise, oil and equities hedge unexpected and expected inflation better than gold (respectively). Given the size of bond portfolios built over the past decade that will need to be hedged against inflation risks, the sheer size of investment demand for commodities is likely to be massive, in our view, underscoring the need to act today.
Go long our “Back to the USSR” basket – crude, grains, copper and PGMs. With policymakers caught between Covid-19, a growing China-US technology rift, tightening grain markets and growing social unrest, we see the backdrop as increasingly similar to that of the early 1970s. To capture the inflection we forecast in 2021, we are recommending our “Back to the USSR” basket, each component with equal weighting. These commodities present the greatest strategic upside over the course of 2021, reflecting exposure to increasing focus on redistribution, ESG policy and versatility of supply chains. We include the following contracts. Long Copper GSCI Subindex ER – Inclusion in the basket on the basis of a projected large deficit in 21’, very low inventory
Exhibit 29: Energy commodities make up the largest component of a consumer’s basket, making them the best hedge against inflation Year-on-year regression beta (with +/- 1 standard error)
GSCI Petroleum Sub-Index 20.6 40%GSCI Energy Sub-Index 19.6 39%GSCI 14.4 45%Carbon-Neutral Commodity Index 13.3 41%S&P 500: Energy 10.7 27%GSCI Industrial Metals Sub-Index 10.7 31%BCOM 9.2 42%GSCI Precious Metals Sub-Index 6.9 16%GSCI Agriculture Sub-Index 5.5 10%S&P 500: Materials 5.2 15%S&P 500: Industrials 4.9 15%S&P 500: Financials 3.3 4%GSCI Livestock Sub-Index 3.0 5%S&P 500: Consumer Discretionary 3.0 8%S&P 500 2.8 10%S&P 500: IT 2.6 5%TIPS 2.4 21%S&P 500: Utilities 1.5 4%S&P 500: Consumer Staples 1.2 2%S&P 500: Telecom 1.2 1%3 Month Treasury -0.1 1%S&P 500: Healthcare -0.1 -1%10 Year Treasury -1.4 4%
Jan 2009 to Sep 2020
Hedge Ratio: Higher is better Hedge Effectiveness: Higher is betterAsset
-10 0 10 20 0% 25% 50%
Source: Goldman Sachs Global Investment Research.
18 November 2020 18
Goldman Sachs 2021 Commodity Outlook
For t
he e
xclu
sive
use
of J
OSEP
H.ST
EIN@
GS.C
OM
7f10
0ca8
95df
11e0
bb43
0021
5ace
2648

ex-China after record China imports, continued China strategic stockpiling and finally, peak mine supply approaching on the horizon in 23/24’. Long Grains: 50% S&P GSCI
Corn Subindex TR, 50% S&P GSCI Soy Subindex TR – a tightening LatAm corn outlook in 20/21 will coincide with a maintained Chinese restocking cycle based on limited upside to domestic acreage and yields. Further growing soy oil demand will require higher 2022 acreage and imports, forcing up long-dated prices to incentivise planting and trade. Long S&P GSCI Brent Subindex TR – vaccine-led recovery and continued OPEC supply discipline will help maintain a market deficit and draw down inventories to pull Brent toward our year-end target of $65/bbl. Long PGMS: 50% S&P
GSCI Platinum Subindex TR, 50% S&P GSCI Palladium Subindex TR – PGMs will stand to benefit from continued recovery in global auto sales, tightening standards and continued strong Chinese imports.
Exhibit 30: We are opening our “Back to the USSR” trading recommendation
Commodity Contract Opening Price Current Price % Return
Copper S&P GSCI Subindex ER 4241 4241 0%
Brent Crude S&P GSCI Subindex ER 176 176 0%
Corn/Soybeans S&P GSCI Subindex ER 2147 2147 0%
Palladium/Platinum S&P GSCI Subindex ER 1736 1736 0%
Total Return 0%*Corn/Soy and Platnium/Palldium are pair, each taking a 12.5% weighting in the basket
Source: Goldman Sachs Global Investment Research
18 November 2020 19
Goldman Sachs 2021 Commodity Outlook
For t
he e
xclu
sive
use
of J
OSEP
H.ST
EIN@
GS.C
OM
7f10
0ca8
95df
11e0
bb43
0021
5ace
2648

Global Commodity Outlooks
Oil - Winter lockdowns simply a speed bump in the oil market rebalancing We expect a second wave of lockdowns in Europe and the US to bring the oil market’s rebalancing to a halt in the coming months. The increase in inventories that we anticipate is likely to remain modest, however, as we expect OPEC to delay its planned January ramp up by three months. Importantly, this is only a speed bump in our forecast of a sharp tightening of oil fundamentals through 2021, driven by a recovery in demand, boosted by vaccines and rapid testing, and by the collapse in upstream investment and change in the shale reaction function. Accounting for this winter Covid delay, we now expect the oil market rebalancing to occur next year, with normalized OECD stocks, OPEC+ spare capacity returning to 1Q20 levels, and shale production growth all occurring by 4Q21. Our 2022 balances point to a balanced oil market, even while now assuming a near-full return of Iranian production.
In the coming weeks, we expect the market to remain caught between vaccine issues, lockdown and US election headlines, leaving scope for further price volatility and downside risks. Thereafter, we expect Brent prices to resume their rally in 1Q21, when we forecast a Brent price average of $47/bbl, with the winter speed bump simply delaying the return to $65/bbl from the fall of 2021E to late 2021. For petroleum products, our constructive demand forecasts, along with a surprisingly quick shuttering of refining capacity, leave us bullish on 2022 margins, even though the next few months will likely prove challenging. We are most constructive on distillates that are most levered to the vaccine roll-out, given their positive impact on jet demand.
Natural Gas - A tighter forward outlook We maintain our view that US markets are transitioning into a significantly tighter 2021 balance driven by low associated gas production growth given the collapse in US oil production capex. Despite a very warm start of winter, which has weighed on
Exhibit 31: The second wave should see demand sequentially decline over the winter Demand impact of Covid-19 vs. counterfactural expected level (mb/d)
Exhibit 32: OPEC spare capacity should normalise to pre-Covid levels by 4Q21 OPEC+ spare capacity excluding Venezuela (kb/d)
-25
-20
-15
-10
-5
0
Effect of second lockdowns
New forecast (excl. second lockdowns)
Previous forecast
0
2000
4000
6000
8000
10000
12000
14000
16000
OPEC+ spare capacity (incl. Iran, Libya) Previous
Source: Google Covid-19 Community Mobility Reports https://www.google.com/covid19/mobility/ Accessed: 11/13/2020, Goldman Sachs Global Investment Research.
Source: IEA, OPEC, Goldman Sachs Global Investment Research.
18 November 2020 20
Goldman Sachs 2021 Commodity Outlook
For t
he e
xclu
sive
use
of J
OSEP
H.ST
EIN@
GS.C
OM
7f10
0ca8
95df
11e0
bb43
0021
5ace
2648

heating-related gas demand, we believe this has not been near enough to rectify this forward tightness. This is because it’s been accompanied by a sharp sell-off in the US gas curve, which we believe supports implied forward coal-to-gas (C2G) substitution by more than enough to completely offset the reduction in heating demand this month. Hence, we maintain our constructive NYMEX natural gas price view with a $3.23/mmBtu forecast for 2021, 14% above current forwards. Our US views assume forward US LNG exports normalize from the low levels observed this summer. Specifically, we expect steeper inventory draws in Europe this winter vs last to create room in storage to accommodate higher US LNG exports as well as higher Russian pipeline flows. This allows TTF to balance in 2021 by pricing against coal at our $4.70/mmBtu forecast through next summer, as opposed to pricing supply out at sub-$4 levels. Consistent with this view, we have seen the JKM and TTF forward curves move in line with our forecast over the past three months, with winter prices even moving a little above our forecasts. Accordingly, we are now more neutral relative to current JKM and TTF prices, in contrast with our still bullish US gas view.
Base Metals - Synchronised global demand surge, lean supply chain inventories set to support industrial metal higher We expect a broad tightening trend in industrial metals fundamentals through 2021, which should generate a positive bias to price dynamics. First and foremost, we believe this will be supported by a firm recovery in Western demand conditions, supported by a combination of vaccine deployment from early in the year, and continued dovish policy setting. Evidence of this has already started to emerge in the US, and particularly for aluminium-related use in autos and construction. Moreover, there is limited evidence so far that the second wave of lockdowns in Europe is denting the positive momentum in manufacturing activity. Second, there still remains strong positive momentum in China’s demand conditions, and although more policy restraint is likely ahead, only a modest sequential deceleration is anticipated by our economists. We also believe that any stimulus-restraining moves by Beijing will be tied to evidence of a sustained Western recovery, which suggests any policy adjustments will be weighted towards at least 2Q20 with an actual activity impact unlikely until well into the second half of the year.
Exhibit 33: The oil collapse earlier this year has significantly lowered our expectations of US associated gas production growth GS US gas production outlook; Bcf/d
Exhibit 34: We expect lower LNG imports in Europe this winter to help normalize storage levels through 2021 NW European gas storage, Bcm
80
82
84
86
88
90
92
94
96
98
US Production + forecasts
US Production + forecast prior to oil price collapse
0.0
10.0
20.0
30.0
40.0
50.0
60.0
Jan Feb Mar Apr May Jun Jul Aug Sep Oct Nov Dec
2019 2018 2017 2020E 2021E
Source: Goldman Sachs Global Investment Research, Wood Mackenzie
Source: Bloomberg, Goldman Sachs Global Investment Research
18 November 2020 21
Goldman Sachs 2021 Commodity Outlook
For t
he e
xclu
sive
use
of J
OSEP
H.ST
EIN@
GS.C
OM
7f10
0ca8
95df
11e0
bb43
0021
5ace
2648

Adjoining this positive demand setting is a very tight inventory environment across the metals space. The Western industrial supply chain has been heavily destocked over the course of this year, with now very-low raw material and finished good stocks. This points to raw material restocking bursts as a necessary additional demand component. At the same time, in China strategic stockpiling remains in play beyond the current year, given elevated concerns over security of supply. However, and importantly, onshore visible inventories remain only at modest levels. This should limit the extent of any seasonal destocking phases around the Chinese New Year. Finally, we expect supply conditions to be more varied across the metals, with short-cycle scrap upswings likely for most metals on higher activity and price. However, we expect a reflationary cost setting (fuelled particularly by US dollar weakness) to ultimately restrain investment responses from an already fiscally conservative mining sector. Given our respective base-case forecast peaks in global supply for zinc, aluminium and copper over the 2023-24 period, the ability to defer those supply inflections is extremely challenged. On a differing timeframe, with copper having the most bullish prospects on a near-term basis, we believe, higher prices will need to eventuate across the complex, to prevent scarcity conditions developing.
Exhibit 35: The China Metals Consumption Index is at its highest level since 2011
Exhibit 36: Recovery in Western metals demand fuelled by a resurgence in Industrial Production Capital Goods and Consumer Durables Industrial Production, US, index Jan18 = 1
-20
-10
0
10
20
30
40
50
60
2009-03 2010-10 2012-05 2013-12 2015-07 2017-02 2018-09 2020-04
MCI Median Mean 0.4
0.5
0.6
0.7
0.8
0.9
1
1.1
Jan-18 Jun-18 Nov-18 Apr-19 Sep-19 Feb-20 Jul-20
Capital goods Consumer durable
Source: Goldman Sachs Global Investment Research.
Source: Haver Analytics, Goldman Sachs Global Investment Research
18 November 2020 22
Goldman Sachs 2021 Commodity Outlook
For t
he e
xclu
sive
use
of J
OSEP
H.ST
EIN@
GS.C
OM
7f10
0ca8
95df
11e0
bb43
0021
5ace
2648

Precious Metals: Global reflation at the zero lower bound to drive precious higher Gold and silver also stand to benefit from the reflation theme. This year, the focus in precious markets has been on fiscal and monetary stimulus, and participants have largely ignored the inflation numbers (which were heavily impacted by the pandemic.) Next year, as the economy reopens, we expect the focus to shift to whether policy stimulus and aggregated savings will lead to real inflation. With our economists expecting the Fed to remain on hold until 2025, any increase in inflation expectations will likely translate into lower real rates at near- to medium-term maturities. Our rates team notes that under our economists’ inflation forecasts and our oil view, near-term real rates are expected to average -2.1% over the next five years. Currently, 5-year tips are only -1.2%, which suggests material room to fall. There will likely be less downside pressure on 10-year real rates, but we believe that the gold and silver markets will focus on shorter maturity rates. The reason for this is that gold is currently viewed primarily as a hedge against currency debasement, rather than equity market risk.
While equities tend to be driven more by longer-term real rates, currencies are more focused on nearer-term real rates. The bulk of gold purchases this year were made, in our view, because investors were concerned about the real purchasing power of the dollar vs. losses in their equity portfolios. Nearer-term real rates were also more important post the GFC, when gold was better correlated with 2- and 5-year real rates than 10-year rates. In late-2011, while longer-term real rates continued to move higher, gold did not. Instead, it was correlated with the dollar and front-end rates. For silver, we see an additional tailwind in the form of a strong rebound in industrial demand, spearheaded by a boost to global solar investment. We keep our 3/6/12m targets for gold and silver unchanged at $2,300/2,300/2,300/t oz and $30/30/30/t oz respectively.
Exhibit 37: LME inventories across the base metals are back to levels last seen in the early 2000s LME, all base metals inventories, kmt
Exhibit 38: Low US auto inventories demonstrates well the lean state of Western supply chains
0
1,000
2,000
3,000
4,000
5,000
6,000
7,000
8,000
2000 2002 2004 2006 2008 2010 2013 2015 2017 20192,000
2,500
3,000
3,500
4,000
4,500
2014 2015 2016 2017 2018 2019 2020
Source: Wind, Goldman Sachs Global Investment Research.
Source: BEA, Wards, Motor Intelligence.
18 November 2020 23
Goldman Sachs 2021 Commodity Outlook
For t
he e
xclu
sive
use
of J
OSEP
H.ST
EIN@
GS.C
OM
7f10
0ca8
95df
11e0
bb43
0021
5ace
2648

Agriculture: Focus on renewable diesel and versatility of Chinese commodity supply are creating a structural bull market in grains Agricultural markets have posted a remarkable turnaround this year, following adverse weather and a record import pull from China in recent months. While benign weather conditions and trade wars have weighed on prices in recent years, we believe this year’s reversal reflects the beginning of a multi-year structural repricing higher for crops. First, weather: recent years have posted low weather variability, as observed in the 1960s, and a reversion to long-run weather swings would add to price volatility and upside, with La Nina already a threat to South American production. Second, China is starting a multi-year import surge. The US-China trade war led to large destocking of Chinese corn and soybean inventories, now requiring a multi-year restocking cycle (this fits within its next five-year plan targets and should occur alongside the expansion of the Chinese hog herd). Third, we expect a return of a US-led biofuel demand pull in coming years, this time led by renewable diesel, which our agribusiness analysts estimate could represent an additional 1.5 bn bu of soybean use.
To meet this growing pull on US and Latin American crops US corn and soybean planting will need to rise in the coming years. These will, however, be marginal acres in terms of productivity, with farmers’ input costs set to rise with higher oil and derivative prices. This pull should not just be on US acreage, as domestic soybean oil production capacity will likely remain short of the expected renewable diesel demand pull, requiring additional imports from Argentina where acreage expansion faces the vagaries of domestic policies. As a result, we believe there will be a structural repricing higher of agriculture products in coming years, with deferred forward prices for corn, and especially soybeans, needing to rally further.
Exhibit 39: Gold is driven more by near-term real rates...
Exhibit 40: ...than by long-term real rates
0
500
1000
1500
2000
2500
-3
-2
-1
0
1
2
3
4
2004 2006 2008 2010 2012 2014 2016 2018 2020
2 year real rate inv Gold price (rhs)
0
500
1000
1500
2000
2500
-3.5
-3
-2.5
-2
-1.5
-1
-0.5
0
0.5
1
1.5
2004 2006 2008 2010 2012 2014 2016 2018 2020
10 year real rate inv Gold price (rhs)
Source: Haver, Goldman Sachs Global Investment Research.
Source: Haver, Goldman Sachs Global Investment Research.
18 November 2020 24
Goldman Sachs 2021 Commodity Outlook
For t
he e
xclu
sive
use
of J
OSEP
H.ST
EIN@
GS.C
OM
7f10
0ca8
95df
11e0
bb43
0021
5ace
2648

Commodity Trade Recommendations
Exhibit 41: Chinese state corn reserves have now depleted, driving the start of a restocking cycle
Exhibit 42: China restocking, hog herd expansion and a US renewable diesel pull should all require US acreage expansion and higher crop prices
0
100
200
300
400
500
0
100
200
300
400
500
Jan-13 Mar-14 May-15 Jul-16 Sep-17 Nov-18 Jan-20
Corn state reserve Corn state reserve days
Corn-state reserve (mnt) Reserve days
135000
140000
145000
150000
155000
160000
165000
170000
175000
180000
185000
0
50
100
150
200
250
300
350
2000
2001
2002
2003
2004
2005
2006
2007
2008
2009
2010
2011
2012
2013
2014
2015
2016
2017
2018
2019
2020
China SoyStocks
China Cornstocks
US Soystocks
US Cornstocks
CombinedUS Corn andSoy Acreage
mn mt
k.ac
Source: Wind, Goldman Sachs Global Investment Research.
Source: USDA, Wind, Goldman Sachs Global Investment Research.
Exhibit 43: Commodity Trade Recommendations
Open trades Change Profit/Loss Unit
Cross-Commodity Date Value Date Value at last close
Long Carbon Neutral Commodity Index* 2020-10-20 264.23 2020-11-18 261.39 -2.84 -2.84 %Back to the USSR Trade Basket 2020-11-17 1.02 2020-11-18 1.02 0.00 0.00 %
Relative Recovery Basket Date Value Date Value
Long GSCI Copper ER Subindex 09-Jul-20 532.10 2020-11-18 602.93 70.83 13.31% %
Energy Date Value Date Value
Long 3Q21 Nymex Gas 2020-10-05 2.82 2020-11-18 2.83 0.01 0.01 $/mmbtu
Long 2Q2021 JKM-TTF spread 2020-10-19 0.26 2020-11-18 0.37 0.11 0.11 $/mmBtu
Long Jet Regrade 2020-09-23 8.44 2020-11-18 18.43 9.99 9.99 $/bbl
Long Brent Dec21 2020-08-30 48.99 2020-11-18 45.33 -3.66 -3.66 $/bblLong Brent Jun21-Jun22 timespreads (rolled from Dec20-Dec21) 2020-08-30 -1.75 2020-11-18 -1.10 0.65 3.47 $/bbl
Short cal21 VLSFO Brent cracks 2019-09-04 11.15 2020-11-18 5.36 -5.79 5.79 $/bbl
Short cal21 VLSFO vs. NW Eur 0.1% GO 2019-09-04 -5.76 2020-11-18 0.03 5.79 -5.79 $/bbl
MetalsLong copper and short Zinc 2019-04-25 2.38 2020-11-18 2.69 0.31 0.31 %Long Silver 2020-10-08 23.96 2020-11-18 24.63 0.67 2.80% %Long December 2020 Gold 2020-03-23 1581.40 2020-11-18 1887.80 306.40 306.40 $/toz
Latest Open
CNCI:*87% weight in the S&P enhanced GSCI, 13% weight in the Dec 12 EUA
Source: Goldman Sachs Global Investment Research.
18 November 2020 25
Goldman Sachs 2021 Commodity Outlook
For t
he e
xclu
sive
use
of J
OSEP
H.ST
EIN@
GS.C
OM
7f10
0ca8
95df
11e0
bb43
0021
5ace
2648

Exhibit 44: Individual Commodity Return Forecasts
GSCI BCOM 3m 6m 12m 3m 6m 12m 3m 6m 12mWTI 8.3 17.9 45.5 -2.4 -3.3 -1.7 5.7 14.1 43.3Brent 7.3 16.4 43.8 -2.3 -2.6 -0.5 4.9 13.5 43.3Gasoline 9.2 28.8 41.7 -12.0 -13.9 -5.2 -3.8 11.0 34.6Heating Oil 7.8 18.7 47.4 -2.8 -4.2 -4.2 4.9 13.8 41.5Natural Gas 4.7 22.2 13.5 0.0 -4.5 -12.7 4.8 16.8 -0.7Aluminum 2.7 5.2 7.8 -0.5 -1.3 -3.0 2.2 3.9 4.8Copper -1.5 2.0 5.6 0.0 0.0 0.3 -1.5 2.2 6.1Nickel 3.9 0.8 0.8 -0.4 -0.7 -1.5 3.6 0.1 -0.5Zinc -4.7 -7.5 -10.3 -0.2 -0.5 -1.0 -4.8 -7.8 -10.9Gold 21.4 21.4 21.4 -0.6 -1.1 -2.1 20.8 20.2 19.1Silver 20.4 20.4 20.4 -0.3 -0.6 -1.1 20.1 19.8 19.3Wheat -1.6 -3.3 -9.1 -0.3 -0.6 -1.5 -1.9 -3.8 -10.2Corn 2.5 6.1 2.5 -0.6 -1.4 -1.4 2.0 4.7 1.3Soybeans 2.3 1.9 -0.3 -0.4 1.0 1.3 1.9 3.0 1.3Cotton 2.0 3.4 4.8 -0.9 -1.7 0.0 1.2 1.7 5.0Sugar -9.5 -12.7 -9.5 0.0 2.2 2.9 -9.5 -10.7 -6.6Coffee -5.7 1.1 13.7 -1.0 -2.0 -3.9 -6.5 -0.9 9.4Cocoa -3.5 -1.4 2.7 -0.2 -0.1 0.0 -3.6 -1.4 2.9Live Cattle 0.0 2.7 11.6 -2.7 -0.1 -1.3 -2.6 2.7 10.4Lean Hogs 1.9 25.4 9.8 -5.4 -12.1 0.8 -3.5 10.4 10.9* dollar weights as of Nov 17, 2020
6.3%4.7%
2.2%0.9%0.4%
2.2%
20.8%14.1%3.5%3.1%3.7%4.5%5.8%1.1%1.3%6.7%0.8%4.0%
1.4%
4.4%1.6%
1.5%3.2%2.5%0.0%3.4%
5.1%4.3%1.4%1.2%
10.0%4.5%7.6%3.0%3.7%
15.6%4.9%3.2%6.2%6.7%
Commodity TotalRollSpotGS Forecast Return
Dollar Weight*
Source: Goldman Sachs Global Investment Research.
18 November 2020 26
Goldman Sachs 2021 Commodity Outlook
For t
he e
xclu
sive
use
of J
OSEP
H.ST
EIN@
GS.C
OM
7f10
0ca8
95df
11e0
bb43
0021
5ace
2648
Outlook by Commodity
Energy
Oil: Winter lockdowns simply a speed bump in the oil market rebalancing The wave of Covid infections sweeping Europe has surprised in its intensity, leading to renewed lockdowns, with US restrictions likely as well. Our expected peak 3.1 mb/d associated hit to oil demand, while smaller than in April 2020 given lighter restrictions, will nonetheless bring the oil market rebalancing to a halt, on our forecasts, following the surprisingly quick return of Libyan production. After a 2.2 mb/d October deficit, we now expect a 1.0 mb/d December surplus. In the coming weeks, the market will likely remain caught between vaccine, lockdown and US election headlines, leaving scope for further price volatility and downside risks as the surplus weighs on crude timespreads. The year-end surplus we forecast, and still-high demand uncertainty, lead us to expect OPEC+ to delay by three months its January production ramp-up when it meets in four weeks, helping bring the market back to a shallow 0.9 mb/d deficit in 1Q21.
Importantly, the winter lockdowns are only a speed bump in our forecast of a sharp tightening of oil’s fundamentals through 2021. This is firstly driven by our above-consensus demand recovery forecast, boosted by vaccines and rapid testing. Sustained low oil prices are also reducing supply capacity, and are setting the stage for binding under-investment. Producers outside shale are keeping upstream capex low, with the majors shifting their capex to renewables, given growing investor focus on ESG. Based on a shrinking number of new projects, and higher expected decline rates, this should limit the recovery in non-OPEC and non-shale output. In addition, the shale reaction function has changed, with a focus on returning cash to shareholders. This should allow OPEC to start growing production at higher price levels next year, requiring a meaningful increase in prices to trigger the rebound in shale production needed to balance the global market from late-2021. Net, we expect the winter Covid wave to delay, but not derail, the oil market’s rebalancing, with normalized OECD stocks, OPEC+ spare capacity returning to 1Q20 levels and finally shale production growth all occurring by 4Q21.
Our 2022 balances point to a balanced oil market, even after now assuming a near-full return of Iranian production. As a result, we expect Brent prices to resume their rally in 1Q21, when we forecast the Brent price averaging $47/bbl, with the winter speed bump simply delaying the return to $65/bbl by year-end 2021. We forecast a large inflection in oil prices next summer, when we expect the steady deficit, declining inventory buffer and diminishing OPEC spare capacity to become apparent, calling for higher drilling activity. As a result, while our initial recommendation to go long Dec-21 Brent proved too early, this remains our preferred macro expression of oil’s rally.
18 November 2020 27
Goldman Sachs 2021 Commodity Outlook
For t
he e
xclu
sive
use
of J
OSEP
H.ST
EIN@
GS.C
OM
7f10
0ca8
95df
11e0
bb43
0021
5ace
2648
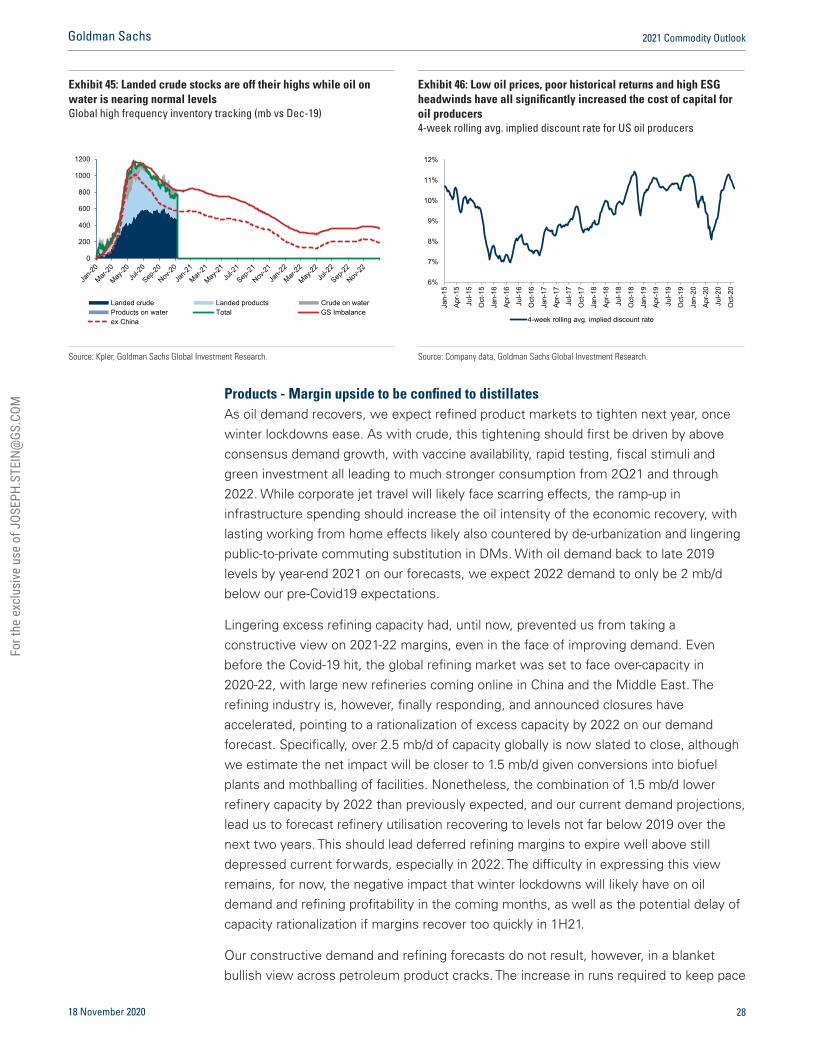
Products - Margin upside to be confined to distillates As oil demand recovers, we expect refined product markets to tighten next year, once winter lockdowns ease. As with crude, this tightening should first be driven by above consensus demand growth, with vaccine availability, rapid testing, fiscal stimuli and green investment all leading to much stronger consumption from 2Q21 and through 2022. While corporate jet travel will likely face scarring effects, the ramp-up in infrastructure spending should increase the oil intensity of the economic recovery, with lasting working from home effects likely also countered by de-urbanization and lingering public-to-private commuting substitution in DMs. With oil demand back to late 2019 levels by year-end 2021 on our forecasts, we expect 2022 demand to only be 2 mb/d below our pre-Covid19 expectations.
Lingering excess refining capacity had, until now, prevented us from taking a constructive view on 2021-22 margins, even in the face of improving demand. Even before the Covid-19 hit, the global refining market was set to face over-capacity in 2020-22, with large new refineries coming online in China and the Middle East. The refining industry is, however, finally responding, and announced closures have accelerated, pointing to a rationalization of excess capacity by 2022 on our demand forecast. Specifically, over 2.5 mb/d of capacity globally is now slated to close, although we estimate the net impact will be closer to 1.5 mb/d given conversions into biofuel plants and mothballing of facilities. Nonetheless, the combination of 1.5 mb/d lower refinery capacity by 2022 than previously expected, and our current demand projections, lead us to forecast refinery utilisation recovering to levels not far below 2019 over the next two years. This should lead deferred refining margins to expire well above still depressed current forwards, especially in 2022. The difficulty in expressing this view remains, for now, the negative impact that winter lockdowns will likely have on oil demand and refining profitability in the coming months, as well as the potential delay of capacity rationalization if margins recover too quickly in 1H21.
Our constructive demand and refining forecasts do not result, however, in a blanket bullish view across petroleum product cracks. The increase in runs required to keep pace
Exhibit 45: Landed crude stocks are off their highs while oil on water is nearing normal levels Global high frequency inventory tracking (mb vs Dec-19)
Exhibit 46: Low oil prices, poor historical returns and high ESG headwinds have all significantly increased the cost of capital for oil producers 4-week rolling avg. implied discount rate for US oil producers
0
200
400
600
800
1000
1200
Landed crude Landed products Crude on waterProducts on water Total GS Imbalanceex China
6%
7%
8%
9%
10%
11%
12%
Jan-
15
Apr-1
5
Jul-1
5
Oct
-15
Jan-
16
Apr-1
6
Jul-1
6
Oct
-16
Jan-
17
Apr-1
7
Jul-1
7
Oct
-17
Jan-
18
Apr-1
8
Jul-1
8
Oct
-18
Jan-
19
Apr-1
9
Jul-1
9
Oct
-19
Jan-
20
Apr-2
0
Jul-2
0
Oct
-20
4-week rolling avg. implied discount rate
Source: Kpler, Goldman Sachs Global Investment Research.
Source: Company data, Goldman Sachs Global Investment Research.
18 November 2020 28
Goldman Sachs 2021 Commodity Outlook
For t
he e
xclu
sive
use
of J
OSEP
H.ST
EIN@
GS.C
OM
7f10
0ca8
95df
11e0
bb43
0021
5ace
2648

with the oil demand recovery will have diverging impacts on product markets, we expect, with distillates likely to outperform gasoline. First, distillate demand is more levered to the roll-out of vaccines, given the current depressed level of international travel, with much more modest upside to gasoline demand. This boost may in fact play out through the winter, as rapid testing, inventory restocking and heating demand all support distillate and jet demand relative to gasoline, weighed down by lockdowns (especially if they spread to the US).
There is also a supply argument, as gasoline yields will need to come off substantially when runs ramp up, in order not to overwhelm stocks. As we show in Exhibit 49, relative gasoline and distillate forward cracks would lead to a much larger deficit in distillate markets (assuming runs increase in line with demand and modelled yield switching). As a result, we view deferred European distillate cracks as the preferred expression of our constructive refining view, which further benefit in 2022 from relatively depressed pricing (vs. US markets) and being more exposed to the recovery in jet fuel demand (as EU jet demand has lagged the US recovery) and jet fuel hedging (with US airlines hedging a lot less). A longer-term EU pivot to gasoline over diesel as a motor fuel (and the resultant impact on trade flows) is insufficient to explain the magnitude of the deferred discount, in our view.
Ultimately, we still expect jet cracks to outperform the products complex, a view that we have expressed with our long 2Q21 European jet regrade (jet minus diesel) trade recommendation. This is due, in large part, to recovering demand, but additionally to regrade remaining lower than required to re-segregate jet molecules from the distillate pool (achieved due to the exceptional refinery flexibility demonstrated this year). Finally, resilient shipping and power demand will likely leave bunker fuels such as VLSFO and HSFO less leveraged to the incremental stimulus of a vaccine roll-out. Hence, we believe that they will underperform as refinery runs and their supply ramp up. This may especially be the case for VLSFO, as complex US refiners ramp up from their current low utilization. Combined with improving segregation, this implies that low-sulfur bunker markets should eventually no longer need to price against distillates to source marginal supply in an IMO world. We therefore reiterate our long-held view that VLSFO cracks will gradually become negative. We believe HSFO will also face pressure from the global crude slate becoming heavier, as OPEC+ ramps back up faster than shale, although meaningful downside should be limited by scrubber uptake and HSFO’s clearing mechanism as a secondary refinery feedstock.
18 November 2020 29
Goldman Sachs 2021 Commodity Outlook
For t
he e
xclu
sive
use
of J
OSEP
H.ST
EIN@
GS.C
OM
7f10
0ca8
95df
11e0
bb43
0021
5ace
2648

Exhibit 47: OECD product to crude surplus has already normalised = margins should eventually follow Seasonally adjusted ratio of crude to product stocks (lhs) relative to refinery margins (NW Europe Brent basis, % rhs)
Exhibit 48: A bullish outlook on a V(accine)-shaped recovery and numerous refinery closures see utilisation rates almost normalise by 2022 Global refinery utilisation (%,lhs) vs refining margins (%, rhs)
-10%
-5%
0%
5%
10%
15%
20%
25%
30%
35%
40%
-0.15
-0.1
-0.05
0
0.05
0.1
Demand shock Supply shockCrude to Product stock ratio (sa, lhs) Margins (rhs)GSe % Margin
Source: IEA, Platts, ICE, Goldman Sachs Global Investment Research.
Source: IEA, IIR, Platts, ICE, Reuters, BP, Goldman Sachs Global Investment Research.
Exhibit 49: Current forward cracks do not reflect the interproduct rebalancing required Cal22 vs. Oct-20 S&D bridges for refined products given current forward heat-gas spread
Exhibit 50: Lagged NW Europe jet fuel-gasoil spread (regrade, y-axis, USD/mt) vs. US refinery jet fuel yields (x-axis, %)
-1000
0
1000
2000
3000
4000
5000
6000
Demand increase Supply fromhigher runs (in
line with demand)
Supply from yieldswitch (w/
Forward HO-RBspread)
Net supplyincrease
2022 Balance
Distillates Gasoline VLSFO HSFO
Source: IEA, Goldman Sachs Global Investment Research.
Source: EIA, Platts, Goldman Sachs Global Investment Research.
18 November 2020 30
Goldman Sachs 2021 Commodity Outlook
For t
he e
xclu
sive
use
of J
OSEP
H.ST
EIN@
GS.C
OM
7f10
0ca8
95df
11e0
bb43
0021
5ace
2648

Natural gas:
US Gas - Transition to a tighter forward outlook This year’s global gas oversupply has weighed on Henry Hub prices all summer long, as lower US LNG exports were eventually needed to solve for the global gas surplus. These headwinds have now disappeared, which we expect will remain the case in 2021 as the global gas market moves to a more balanced setting. Importantly for 2021, the catalysts for a further rally in US gas prices are domestic, owing to lower associated gas production. As a result, although weather and Covid could delay/derail the rebalancing of the global gas market, it would take an extreme set of assumptions for these to also derail a further rally in Henry Hub gas prices. As a result, we reiterate our constructive $3.23/mmBtu Cal21 Henry Hub view ($0.39 above forwards), with the market set for a sustained domestically-driven deficit, and we continue to recommend a long 3Q21 NYMEX gas trading position. We note, though, that the same strong link between global gas and US markets that softened US balances this summer can work in the other direction. For instance, should weather or lower-than-expected US gas production trigger a spike in Henry Hub prices, the US LNG export arb could shut temporarily, potentially reducing LNG supplies and tightening global gas balances as a result.
Importantly, we believe this constructive US gas outlook is robust, even with a warmer-than-average US winter. Specifically, we expect end-Oct21 storage under current forwards at nearly 780 Bcf below the bottom of the historically acceptable 3.6-3.9 Tcf range. With a one-standard-deviation warmer-than-average winter adding about 500-550 Bcf to storage, such an event would remain insufficient to balance the market ahead of the 2021/22 winter, we estimate. And although November has indeed started significantly warmer than average, we note it has been accompanied by a sharp sell-off of the US gas curve. This is important, as lower gas prices support higher implied coal-to-gas (C2G) substitution. With the scale of the recent price sell-off exacerbated by exceptionally long positioning, we would argue that, if sustained, such price levels would support C2G substitution by more than enough to compensate for this month’s decline in heating demand, therefore leaving Cal21 balances as tight if not tighter than previously.
As a result, our tighter forward outlook and price views remain intact, though we see risks to our price forecast changing from an upside skew to being more balanced, as we increase our expected end-Oct21 storage under current forecasts to 2822 Bcf from 2739 Bcf previously. This revision takes into account the latest weather forecasts and price moves, as well as a modest downward revision to power and industrial demand (on expected increased Covid restrictions), and higher expected Haynesville production on stronger realized data and recent producer commentary. Importantly, we note that our recent oil update highlights a delayed recovery in oil prices, vs. our previous expectations, suggesting a delayed recovery in associated gas production growth next year. We believe this keeps risks to our current $2.75/mmBtu 2022 NYMEX natural gas forecast skewed to the upside.
18 November 2020 31
Goldman Sachs 2021 Commodity Outlook
For t
he e
xclu
sive
use
of J
OSEP
H.ST
EIN@
GS.C
OM
7f10
0ca8
95df
11e0
bb43
0021
5ace
2648

Global Gas - A more balanced 2021 We maintain our view that the 2020 summer was the peak of the current bearish cycle in global gas markets, and that forward fundamentals point to a much better-balanced outlook in both Europe and Asia. Consistent with this view, we have seen the JKM and TTF forward curves move in line with our forecast over the past three months, with winter prices even moving a little above our forecasts. Accordingly, we are now more neutral, relative to current JKM and TTF prices, with our TTF and JKM forecasts unchanged at $4.70/mmBtu and $5.80/mmBtu for the 2020/21 winter (forwards at $5.04 and $6.41) and $4.70/mmBtu and $5.50/mmBtu for the 2021 summer (forwards at $4.65 and $5.04). Importantly, we continue to see further upside to US gas prices, where current forwards still imply a very tight 2021 balance, in our view.
To be clear, there were three main drivers that led to the extreme oversupply in global gas markets this year, namely: (1) an already oversupplied LNG market owing to strong capacity additions; (2) a warm winter across the Northern hemisphere, which weighed on heating demand for gas; and (3) severe Covid-related lockdowns around the world, which weighed heavily on industrial and power demand for gas. To balance the market and prevent a breach of storage in NW Europe, the main destination for global LNG supply residuals, global gas prices collapsed this summer to incentivize demand and trigger supply cuts, most notably from the US, the marginal LNG supplier on a variable cost basis.
Going forward, we see this year’s bearish drivers largely reversing, with: (1) global LNG capacity additions slowing markedly, not only next year but for the next four years; (2) an expected normalization of weather patterns this winter, especially as La Nina favors colder deviations in Japan and South Korea; and (3) an already visible strong rebound in Asian LNG imports from the weakness observed this past summer. Even taking into account renewed lockdown measures in Western Europe, we expect winter storage draws in the region to be significantly steeper than a year ago, leaving room in European gas storage to accommodate higher gas supplies next year. This should allow TTF to balance in 2021, by pricing against coal (currently pricing at $5.38/mmBtu and
Exhibit 51: The oil collapse earlier this year has significantly lowered our expectations of US associated gas production growth GS US gas production outlook; Bcf/d
Exhibit 52: Our 2021 storage outlook under current price forwards remains very tight US gas storage, Bcf
80
82
84
86
88
90
92
94
96
98
US Production + forecasts
US Production + forecast prior to oil price collapse 500
1000
1500
2000
2500
3000
3500
4000
4500
Jan Feb Mar Apr May Jun Jul Aug Sep Oct Nov Dec
2021
2020
2019
2018
2017
Source: Wood Mackenzie, Goldman Sachs Global Investment Research
Source: EIA, Wood Mackenzie, Platts, Goldman Sachs Global Investment Research
18 November 2020 32
Goldman Sachs 2021 Commodity Outlook
For t
he e
xclu
sive
use
of J
OSEP
H.ST
EIN@
GS.C
OM
7f10
0ca8
95df
11e0
bb43
0021
5ace
2648

$5.47/mmBtu for this winter and next summer), as opposed to pricing supply out at sub-$4 levels.
Accordingly, we maintain our winter and summer 2021 forecast at $4.70/mmBtu for TTF. We forecast JKM prices at $5.80/mmBtu and $5.50/mmBtu for next winter and summer, at a wider spread to TTF than this year, owing to a more balanced global LNG market. To express this view, we recently opened a trading recommendation to go long the 2Q21 JKM-TTF spread. We see risks to our 2021 global gas price forecasts as balanced, with winter weather as the main driver for the next several weeks.
Exhibit 53: We expect global LNG balances to tighten sequentially for the next four years
Exhibit 54: We expect lower LNG imports in Europe this winter to help normalize storage levels through 2021 NW European gas storage, Bcm
0
20
40
60
80
100
120
2015 2016 2017 2018 2019 2020 2021 2022 2023 2024 2025
Residual for Europe Price-induced shut-ins0.0
10.0
20.0
30.0
40.0
50.0
60.0
Jan Feb Mar Apr May Jun Jul Aug Sep Oct Nov Dec
2019 2018 2017 2020E 2021E
Source: Kpler, Goldman Sachs Global Investment Research.
Source: Bloomberg, Goldman Sachs Global Investment Research.
18 November 2020 33
Goldman Sachs 2021 Commodity Outlook
For t
he e
xclu
sive
use
of J
OSEP
H.ST
EIN@
GS.C
OM
7f10
0ca8
95df
11e0
bb43
0021
5ace
2648

Metals - Outlook
Industrial Metals
Copper: Sizeable metal deficit to fuel continued upside in 2021 Overall, we are firmly in the bullish camp on copper. After a year of significant ex-China destocking (due to record China copper imports), we expect a large global deficit in 2021, supported by recovering Western demand, solid China and mine supply tightness to take copper prices higher (GS 12M target $7,500/t). We project a 409kt refined metal deficit next year, which should be followed by close to balanced markets in 2022/23. The US election result has had little impact on our 2021 balance, although we have modestly adjusted our US consumption forecasts for 2022-24 on a slight increase in support for copper-intensive green sectors. We believe the critical trend in the copper market in 2021 will be ex-China metal tightness, as Western demand recovery builds on a low-inventory starting point. In this context, we continue to like exposure to this upside risk in flat copper prices but also expect the copper curve to tighten in an environment of multi-year low inventories.
The key development in the copper market in 2020 has been the surge in China’s refined metal imports. Even with sluggish Western demand, China’s record refined imports have generated a significant destock of the ex-China copper market. On year-to-date trends, we estimate that after accounting for China’s net refined metal imports, the ex-China copper market will be in a very large full-year 1Mt refined deficit. Visible inventories in the ex-China market in LME and COMEX warehouses are close to flat year-to-date, which implies the reduction in inventory has largely been in non-visible stocks (trader/supply chain inventories). We believe that this has more than halved ex-China non visible copper stocks, a significant stock reduction ahead of a prospective demand recovery in the West next year.
On the China side of the equation, a combination of strong end demand trends, tightness in scrap (supporting substitution to cathode) and some strategic stockpiling supported the record level of cathode imports. We think refined imports are likely to moderate next year, but not fall substantially: scrap supply will likely improve after the negative activity shock this year, but China’s end-demand conditions should remain healthy next year on property, infrastructure investment and new ‘green’-related demand. As such, we expect China to remain a positive influence on the copper market next year, albeit adjoined by a Western demand recovery, which together should support a material revival in global demand. Set against modest global mine supply growth, we think there will be a significant deficit in refined metal, which is not fully discounted in either flat prices or spreads currently.
18 November 2020 34
Goldman Sachs 2021 Commodity Outlook
For t
he e
xclu
sive
use
of J
OSEP
H.ST
EIN@
GS.C
OM
7f10
0ca8
95df
11e0
bb43
0021
5ace
2648

Aluminium: Upside path supported by Western demand revival, persistent China tightness We view aluminum in bullish terms, with a projected upside path for prices through the course of 2021 (3/6/12m $2,000/2,050/2,100/t). From a fundamental perspective, this constructive view is underpinned by an expected tightening trend in the global balance from a sizeable surplus (1.8Mt) this year to a negligible surplus (606kt) in 2021. The critical shift in fundamental conditions should be driven by a strong rebound in Western demand, evidence of which is already starting to emerge in the US and Europe. We also assume that support will remain from the continuation of a tight China primary market, prone to import phases, which should help to reduce the ex-China surplus. China’s aluminum supply will rise next year, on our forecasts, on new smelting capacity and higher scrap imports. However, this should be substantially offset by still healthy domestic primary demand growth and a rebound in demand related to stronger semis exports (as Western activity revives).
The most significant and in our view underappreciated trend in the aluminum market this year has been the exceptional strength of China’s primary demand. We expect China’s primary aluminum demand to increase 5% yoy in 2020. This has been underpinned by surging semis output, rising by 11% yoy year-to-date. Momentum remains very strong in this dynamic in 4Q and we expect only a modest deceleration in demand growth next year (+3% yoy). Set against a restrained rebound in scrap supply, and China hitting its capacity cap on the smelting side, we expect a continuation in tight onshore primary metal conditions. We believe that the highly regulated approval process for new capacity, reinforced by an increasing green policy focus onshore, will curtail the potential for extended surplus phases in the onshore market.
From an ex-China primary market perspective, we expect a broad growth recovery and heavily destocked Western supply chain to support sharp yoy growth in metal demand next year. Set against limited ex-China primary supply growth, this should sharply reduce the ex-China surplus and, in turn, the global surplus. This should be a supportive trend for the LME price, particularly in combination with anticipated broader macro trends (a weaker USD in particular). In terms of physical market trends, the periodic primary
Exhibit 55: Surge in China refined imports remains underpinned by end demand trends and other raw material tightness
Exhibit 56: Visible copper inventories remain near multi-year lows; China import strength has destocked the ex-China market
0
100
200
300
400
500
600
Jan Feb Mar Apr May Jun Jul Aug Sep Oct Nov Dec
kt China Refined Copper Import
2013-18 Range 2019 2020
0
100
200
300
400
500
600
700
800
900
1,000
0
100
200
300
400
500
600
700
800
900
1,000
2010 2011 2012 2013 2014 2015 2016 2017 2018 2019 2020
ktkt
LME SHFE COMEX
Copper Exchange Inventory
Source: Wind, Goldman Sachs Global Investment Research.
Source: Bloomberg, Goldman Sachs Global Investment Research.
18 November 2020 35
Goldman Sachs 2021 Commodity Outlook
For t
he e
xclu
sive
use
of J
OSEP
H.ST
EIN@
GS.C
OM
7f10
0ca8
95df
11e0
bb43
0021
5ace
2648

import phases into China will likely continue to support a gravitational pull of inventory to South East Asia. The remapping of ex-China primary metal flows tied to China’s import opportunities is an increasingly entrenched feature of the market. These dynamics are also likely to provide support to duty unpaid physical premiums in Europe, the US and Japan, as demand improves into next year, given greater incentives needed to attract units from the Asian aluminum storage hub.
Nickel: Tug of war between near-term surplus and medium-term EV demand Nickel prices have rebounded strongly since March, rising 40% and leaving it second only to copper in performance among the base metals. The recovery trend has been fueled by strong investor buying, focused on the medium-term EV-related demand story. The nickel market faces a unique balance of contrasting fundamental forces, with the prospect of near-term surpluses rooted in a highly elastic Indonesian NPI supply contrasting with medium-term supply incentive price levels tied to EV demand-led tightening effects. This leaves the nickel price dynamic in an extreme balancing act, in our view. Whilst our latest price forecasts signal relative stability (3/6/12m $16,500/16,000/16,000/t), we expect EV-related policy signals and shorter-term surplus pressures to offer trading opportunities around this level. Phases of surplus visibility are likely to generate periodic headwinds, with the potential for pullbacks towards $14,000/t based on key cost curve support levels, though we believe the upside skew in EV demand outcomes will increasingly limit the price downside as the sector expands and the balance tightens.
Our ongoing analysis of EV battery-related demand continues to point towards a material medium-term tightening risk for the nickel market. We believe there is no doubt that the increasingly front-footed green policy environment skews the risks to the upside in our base case forecasts. From 2019 to 2025, we estimate nickel demand from the sector will grow by at least 260kt (base) and by up to 500kt on a faster assumed penetration rate. At the current price level, there are enough committed type 1 projects and mine restart potential to balance the market by 2025, in our base case. However, in our view the risks are skewed towards an earlier emergence of a deficit, if EV penetration rates rise ahead of our expectation. Substantive inventories would buffer
Exhibit 57: Continued China deficit and progressively smaller ex-China surplus to generate net tightening in aluminum into 2021
Exhibit 58: China’s primary aluminum demand has been exceptionally strong in H2-20
4000
Balance check (discrepency)-2000
-1500
-1000
-500
0
500
1000
1500
2000
2500
3000
2013 2014 2015 2016 2017 2018 2019E 2020E 2021E
kt China balance Ex-China balance
Surplus ↑
Deficit ↓
1000
1500
2000
2500
3000
3500
Jan Feb Mar Apr May Jun Jul Aug Sep Oct Nov Dec
ktChina Aluminum Apparent Demand
2013-18 Range 2019 2020
Source: Goldman Sachs Global Investment Research.
Source: Wind, Goldman Sachs Global Investment Research.
18 November 2020 36
Goldman Sachs 2021 Commodity Outlook
For t
he e
xclu
sive
use
of J
OSEP
H.ST
EIN@
GS.C
OM
7f10
0ca8
95df
11e0
bb43
0021
5ace
2648

initial upside demand surprises, but a higher price environment would likely have to eventuate, given the costs of the required HPAL projects and sulphide nickel mines. Battery chemistry creates some additional risks to our demand assumptions, although our assumption remains that nickel predominates on its comparative qualities.
The softening counterweight in the nickel market relates to broader pre-existing trends. A continued surge in Indonesian NPI production has supported robust supply growth this year, just as ex-China demand has fallen sharply on the Covid-induced slowdown. Ex-China demand has been particularly impacted by a collapse in oil, gas and chemical investment, which accounts for close to 20% of end demand. Lower nickel use has been accentuated by a significant upswing in scrap availability in Western markets. Despite some offset from strong China stainless production, the global balance has swung into a very large 161kt surplus in 2020, we estimate. Into 2021/22, we expect a phase of more modest surpluses (64kt, 61Kt) as Western demand rebounds, albeit counteracted by continued Indonesian NPI supply growth. With a sizable inventory overhang and a tightening LME curve, there remains a risk of exchange deliveries, which would likely be a negative for prices, particularly with net investor positioning now clearly on the long side. Whilst we expect the nickel market fundamentals to eventually tighten towards a balanced state by mid-decade, we believe legacy surplus will remain a persistent price risk, particularly on any setbacks to the EV demand story.
Zinc: Continued metals surplus set to drive underperformance Zinc prices have recovered strongly so far in 2020, benefiting as much from the macro-led rising tide as underlying supply-demand improvements. We believe the refined zinc market has been in a large surplus this year (GSe 584kt) albeit reduced from our previous forecast (closer to 1Mt), reflecting less developed market demand contraction than previously discounted. Close to half this surplus has been visible in stock trends, with the remainder built primarily in Western off-warrant locations. We expect a more modest overall refined metal surplus in 2021 (284kt), supported primarily by a continued recovery in DM demand. Our current zinc price forecasts (3/6/12m
Exhibit 59: Indonesia NPI supply growth has been very strong
Exhibit 60: Under our Auto team’s hyper-adoption scenario, we estimate the nickel EV demand boost could be double that of their base case projections Nickel demand from batteries under our base case and hyperadoption sales scenarios, kt
0
10
20
30
40
50
60
Jan Feb Mar Apr May Jun Jul Aug Sep Oct Nov Dec
kt Indo NPI Output 2018 2019 2020
0
100
200
300
400
500
600
700
2019 2020 2021 2022 2023 2024 2025Base Hyperadoption
kt
Source: Goldman Sachs Global Investment Research.
Source: Goldman Sachs Global Investment Research.
18 November 2020 37
Goldman Sachs 2021 Commodity Outlook
For t
he e
xclu
sive
use
of J
OSEP
H.ST
EIN@
GS.C
OM
7f10
0ca8
95df
11e0
bb43
0021
5ace
2648

$2,550/2,475/2,400/t) signal that there is limited fundamental support for further upside. Whilst the broader macro climate could nonetheless offer more support, we ultimately envisage a relatively restrained price dynamic into next year for zinc, owing to continued metal surplus conditions. From this perspective, we think zinc producers should look to further near-term upside as a hedging opportunity.
The challenge to sustained zinc price upside into 2021 relates to a combination of our expected China market and mine supply trends. Regarding China, in comparison to the other base metals, zinc suffers from two channels of relative weakness. First, China’s refined zinc demand continues to trend at a materially weaker level than for other base metals. We think this reflects a combination of restrained trends from both the galvanized steel and die-casting alloy sectors, with some substitution from aluminium alloy and stainless steel noted in the construction sector. Second, China’s refined zinc production has remained relatively unrestrained versus other metals, reflecting strong concentrate imports and still profitable margins. In this context, China’s refined import requirements have remained depressed, limiting the erosion of ex-China metal surplus via strong China imports that has played out in the aluminium and copper markets this year for example. If China’s demand growth moderates next year, and onshore refined production growth remains well-supported, it is not obvious why China will play a more supportive role.
In terms of mine supply, after a heavily disrupted year due to Covid, primarily in South America, our base case points to a 7% yoy increase in global mine production in 2021. This forecast growth is supported by a number of new mine projects and expansions that have been delayed but not cancelled. The key impact should be that this mine supply significantly softens the concentrate market, taking it back into surplus after a year of destocking, in turn supporting higher spot treatment charges and incentivizing stronger refined production (particularly in China where capacity flex remains). The flip side of our mine supply outlook is that from 2022, production growth essentially depletes until new projects are approved and developed, meaning at least a 3-year period of incremental tightening. It is in this context that even after some fundamental headwinds and price moderation, we do not expect zinc prices to trade substantially into the cost curve next year.
Exhibit 61: Strongest zinc producer margins in close to 12 months
Exhibit 62: China refined zinc imports have remained depressed through 2020
0
500
1,000
1,500
2,000
2,500
3,000
3,500
4,000
0
500
1000
1500
2000
2500
3000
3500
4000
0 2000 4000 6000 8000 10000
$/t$/tZinc total cash costs Zinc spot price
0
20
40
60
80
100
120
140
Jan Feb Mar Apr May Jun Jul Aug Sep Oct Nov Dec
kt China Refined Zinc Import2013-18 Range 2019 2020
Source: Wood Mackenzie, Goldman Sachs Global Investment Research.
Source: Customs, Wind, Goldman Sachs Global Investment Research.
18 November 2020 38
Goldman Sachs 2021 Commodity Outlook
For t
he e
xclu
sive
use
of J
OSEP
H.ST
EIN@
GS.C
OM
7f10
0ca8
95df
11e0
bb43
0021
5ace
2648

Precious Metals
Gold 2020 has seen governments and central banks globally introduce very material fiscal and monetary stimulus to help support the economy through the Covid pandemic. US real rates fell as nominal rates were pushed close to their historical lows, while inflation expectations rebounded, supported by stimulus hopes. We believe that 2021 will likely see further compression in 5-year real rates, as actual inflation begins to emerge. Our economists expect US CPI to briefly accelerate above 3% under our oil price forecast. While part of this acceleration would be due to a supportive base effect, market expectations of breakeven inflation are still likely to move higher.
In this environment of accelerating inflation and falling real rates, we expect investment demand for gold to remain high, as investors focus on hedging against inflation tail risks and diversifying their fixed income portfolios. In this sense, the current situation resembles 2010-2012 when economic recovery coupled with strong commodity prices led to a strong inflation rebound and drove gold to its peak in late-2011. During this period of accelerating inflation, gold disconnected from 10-year real rates and became more correlated with the dollar and with real rates with a maturity of less than five years. We see a similar outlook, with the gold price moving higher with a weaker dollar and lower near-term real rates, even if 10-year real rates fail to move lower.
Finally, in 2021 we expect strong rebound in emerging market economies’ dollar GDP, as these economies gradually recover from the pandemic and their currencies strengthen, supported by increasing global dollar liquidity. EM demand was a material drag on gold prices in 2021, but investment demand was strong enough to fully offset this weakness. Next year, if strong investment demand is met with rebounding consumer purchases, we believe this could lead to significant gold price rally (we see supply set to remain fixed, meaning that the market will only be able to clear through higher prices). As such we maintain our 3/6/12 month forecasts of $2,300/t oz.
Exhibit 63: The correlation between gold, the dollar, and 10 year real rates
Exhibit 64: Recovery in EM gold demand should boost the gold price
-1
-0.5
0
0.5
1
1.5
1998 2002 2006 2010 2014 2018
10 year real rate Dollar
0
5
10
15
20
25
30
35
2006 2008 2010 2012 2014 2016 2018 2020
China retail sales of gold silver and jewellery SABn CNY
Source: Bloomberg, Goldman Sachs Global Investment Research.
Source: Bloomberg, Goldman Sachs Global Investment Research.
18 November 2020 39
Goldman Sachs 2021 Commodity Outlook
For t
he e
xclu
sive
use
of J
OSEP
H.ST
EIN@
GS.C
OM
7f10
0ca8
95df
11e0
bb43
0021
5ace
2648

Silver Higher investment demand for gold is likely to translate into a significant boost for silver industrial demand too. Silver sits somewhere between gold and base metals, with 55% of its demand coming from industrial uses. We are bullish on gold and base metals, given our continued concerns of dollar debasement and strong push into Green Infrastructure. As such, silver represents the best of both worlds. We find that the silver price has high correlation to both the gold price and silver industrial demand. We expect silver investment demand to remain strong into 2021, as investors aim to diversify part of their gold exposure with silver. At the same time, we see material upside to industrial demand, from an acceleration in global investment in solar. Specifically, we think that in the event that the Biden green plan is implemented, and China brings forward its renewable targets, silver’s industrial demand could receive a 9% boost from solar alone. This is unlikely to lead to material tightness, owing to a high level of on-ground stocks, and price sensitive jewellery and silverware demand. Nevertheless, historically the silver price has had a sensitivity to industrial demand of 1.1. On this basis, a 9% boost to silver industrial demand would imply 10% additional upside to our price target. For now, we keep our 3/6/12 month forecasts unchanged at $30/t oz.
Exhibit 65: Increased demand for solar panels should boost silver industrial demand Silver solar demand projections, Mtoz
Exhibit 66: Falling silver intensity in solar technology will likely attenuate this demand, however Silver intensity of solar installations, dashed line forecast, Mtoz/GW
40
60
80
100
120
140
160
2011 2012 2013 2014 2015 2016 2017 2018 2019 2020 2021 2022 2023
Base case Bull case
Mtoz
0.00
0.50
1.00
1.50
2.00
2.50
2011 2012 2013 2014 2015 2016 2017 2018 2019 2020 2021 2022 2023
Mtoz/GW
Source: Goldman Sachs Global Investment Research.
Source: Goldman Sachs Global Investment Research.
18 November 2020 40
Goldman Sachs 2021 Commodity Outlook
For t
he e
xclu
sive
use
of J
OSEP
H.ST
EIN@
GS.C
OM
7f10
0ca8
95df
11e0
bb43
0021
5ace
2648

Bulk Commodities
Iron Ore The iron ore market has been tightly balanced through 2020, with prolonged deficit phases earlier in the year now offset by a surplus phase in the current quarter. The market has been characterised by very strong China steel demand growth, set against strong supply from ex-Australia/Brazil, particularly from India, Ukraine and Chile. Into 2021, we expect a balanced market, before clearer surplus trends into 2022. The softening path will be tentative in our view, and contingent in particular on Australia avoiding any weather-related disruptions in 1Q, Vale achieving the majority of volume growth for the entire supply-side, and some deceleration in China steel demand. Given these risks, we ultimately assume only a gradual move lower in price, and it is not until 2022, on our forecasts, that surplus conditions enable prices start to trade down into the top end of the cost curve.
Chinese demand conditions have been very strong through much of 2020, with a notable re-acceleration in growth so far in 4Q, particularly from construction-related consumption. We assume a deceleration in full-year China steel demand in 2021 (+2% yoy), versus close to double that in 2020. With mill margins having now improved, and with limited evidence of a fresh steel surplus, the setting remains very supportive on the steel side into year-end. The main downside risk in this context, in our view, is the property sector, and the potential for the Three Red Lines policy to restrain developer activity over the course of next year. Whilst this policy remains at a trial phase, if it results in lower land sales to developers, and in turn new property starts, this will prove a headwind to steel demand. This is more likely a headwind to steel demand in 2H21 and into 2022, in our view, reinforcing our belief that correction pressures are likely to be limited in the near term. In line with our base metal assumptions, we also expect Western steel demand to rebound in 2021, which should also be a limiting factor on softening path.
Supply dynamics are equally fragile in terms of the path to surplus. Essentially, all the seaborne supply growth we forecast for 2021 (+63Mt) comes from Brazil, and predominantly from Vale’s operations. Whilst there are no obvious operational issues at this stage that might prevent Brazil from achieving this growth, risks from weather (in 1Q in particular) and fresh Covid outbreaks cannot be ruled out as a source of risk. Australian production is forecast essentially flat yoy in 2021 in our base case, but could also face some elevated weather risk in 1Q from La Nina-induced heavy rainfall. Finally, there is limited prospect for further growth in China’s domestic mine supply we believe, with the main potential supply increases coming if the government opens the scrap import channel. If that were to happen, we would expect at least 10-15Mt of iron ore equivalent supply over the year. Overall, the concentration of supply growth in Brazil will be a factor limiting the ease with which the market discounts a continued improvement in volumes, in our view.
18 November 2020 41
Goldman Sachs 2021 Commodity Outlook
For t
he e
xclu
sive
use
of J
OSEP
H.ST
EIN@
GS.C
OM
7f10
0ca8
95df
11e0
bb43
0021
5ace
2648

Exhibit 67: Modest softening path for the iron ore market in 2021
Exhibit 68: Reacceleration in Brazil and then Australia supply over 2021-23
-40
-20
0
20
40
60
80
2015 2016 2017 2018 2019 2020E 2021E 2022E 2023E
kmt
0
200
400
600
800
1000
1200
Australia Brazil
kmt
Source: Goldman Sachs Global Investment Research.
Source: Goldman Sachs Global Investment Research.
18 November 2020 42
Goldman Sachs 2021 Commodity Outlook
For t
he e
xclu
sive
use
of J
OSEP
H.ST
EIN@
GS.C
OM
7f10
0ca8
95df
11e0
bb43
0021
5ace
2648

Agriculture
Corn Expectations of a record 20/21 US corn carry-out were slashed in recent months by bad weather and a Chinese export surge, with the US corn balance facing its largest deficit (-293mn bu) since 2010/11. Potential downside to US, Argentina and Brazil corn production estimates, and upside risks to exports to China, leave risks of further tightening. Dry weather is delaying corn planting in South America with the majority of corn crops set to enter their critical filling phase one month late in April-May, when the persistence of La Nina will raise the likelihood of drought and depressed yields. Near-record domestic prices across China, Argentina and Brazil leaves US corn competitive on the international export market, with the US likely to pick up a large share of any La Nina-driven fall in trade flows from Latin America to China in 1H21. The large current third Covid-19 wave in the US represents only a partial offsetting risk as it weighs on US gasoline and ethanol grind in coming months.
While weather risks may prove transient, the shift in the demand picture is likely to persist in coming years in our view, underscoring the shift in the agriculture cycle after six years of benign weather and lacklustre demand. In particular, the US-China trade wars and the ASF pork epidemic in China depressed both China’s consumption and imports in recent years, something we believe is now set to reverse. The large government destocking that offset low imports has shifted to necessary restocking, with the hog herd on the rebound as well. We see total Chinese corn imports rising to 33mn mt (1.3bn bu) in 2021, and up to 55mn mt by 2023 as China’s structural deficit in corn grows. The concurrent tightening of the US and global corn and soy balances raises the prospect of acreage competition in the US between the two crops next spring, further reinforcing the upside risks to deferred corn prices. Our once-again raised forecasts of 435/c450/c435/bu over a 3/6/12m horizon are as a result mostly above the forward curve on deferred contracts (especially as input costs are expected to rise by 2022 on our above consensus oil forecast).
Exhibit 69: Chinese corn exports are expected to grow to 22mn mt over the coming 12m
Exhibit 70: Latin American corn tightness keeps US corn competitive despite rising prices
0
5000
10000
15000
20000
25000
Oct-19 Dec-19 Feb-20 Apr-20 Jun-20 Aug-20 Oct-20China exports Including current and next MY sales
kmt
USDA export forecast
Attache export forecast
100
150
200
250
300
350
400
2017 2017 2018 2019 2019 2020
US
China
Argentina
$/mt
Source: USDA, Goldman Sachs Global Investment Research.
Source: Bloomberg, Goldman Sachs Global Investment Research.
18 November 2020 43
Goldman Sachs 2021 Commodity Outlook
For t
he e
xclu
sive
use
of J
OSEP
H.ST
EIN@
GS.C
OM
7f10
0ca8
95df
11e0
bb43
0021
5ace
2648

Soy The tightening of the US soybean balance has been even more dramatic than for corn after a year of surging Chinese demand and a disappointing US harvest. Together, they point to uncomfortably low inventories heading into the 2021/22 crop year, leaving soybean prices needing to outperform corn and cotton to secure additional acreage in the US next spring. Any further tightening of the 2020/21 US balance will require prices to rise enough to either lower US crush demand and Chinese imports, or incentivise increases in Argentinean soy to the US to make up the shortfall. This leaves price risk in 1H21 not only weather-dependent but also skewed to the upside in our view, with prices potentially returning to the $12-14 trading range of 2011-14 if the Latin American harvest is poor.
Similar to corn, we see upside risks to demand and downside risks to soy supply in the coming months, also driven by La Nina weather risks and upside to Chinese imports. On the demand side, we expect Chinese imports to grow to 99mn mt in 2021, as pork producers rebuild their hog herds. While we expect the majority of this will be supplied by Brazil, current delays in the crop cycle leave upside risks to US soy exports in 1Q21, especially as a sharp currency depreciation leads Argentinian farmer to hoard stocks. Finally, we see 2021 as the start of a structural rise in domestic crush demand, as renewable diesel (largely based on soyoil) gains an increasing share of the diesel market. Our agribusiness analysts estimate c.2.1bn gal of capacity will come online by 2024, leading to c.17bn gal of total vegoil demand (in all, equivalent to c.1.47bn bu of soybeans). The tightness in supply remains dependent on weather outcomes in Latin America, although rising Chinese and US demand will both play out over the coming years, creating non-linear upside risk to soybean prices in our view. At current inventory levels, deferred prices therefore need to remain elevated to incentivise increased acreage, offsetting this year’s deficit with next year’s surplus. Accordingly, we upgrade our forecasts from ¢1,080/¢1,045/¢1,030 c/bu, to ¢1,180/¢1,175/¢1,150/bu on a 3/6/12m basis.
Exhibit 71: Very low stocks require markets to create demand destruction through exponentially rising prices Scatter plot of yoy change in soy prices (y-axis) vs. ending stocks (mn bu, x-axis)
Exhibit 72: Argentinian farmers are hoarding soy stocks owing to currency weakness
-60%
-40%
-20%
0%
20%
40%
60%
80%
100%
0 200 400 600 800 1000 12000
5000000
10000000
15000000
20000000
25000000
Jan Feb Mar Apr May Jun Jul Aug Sep Oct Nov Dec
2015
2016
2017
2018
2019
2020
mt
Source: Bloomberg, Goldman Sachs Global Investment Research.
Source: Bloomberg, Goldman Sachs Global Investment Research.
18 November 2020 44
Goldman Sachs 2021 Commodity Outlook
For t
he e
xclu
sive
use
of J
OSEP
H.ST
EIN@
GS.C
OM
7f10
0ca8
95df
11e0
bb43
0021
5ace
2648

Wheat Wheat markets also face potential tightness as dry weather in the Black Sea and US creates downside risks for winter wheat production, while corn prices create a higher/rising floor. Despite the US wheat market being projected to end the year with stocks at their lowest in six years, global wheat balances are better supplied than corn, as a strong 2019/20 harvest in Russia left carry-in stocks up 30mn mt yoy. Trend yields would therefore likely be bearish for prices and our forecast of 595c/bu is below market forwards, although weather risks should support prices for now as a third of the US winter wheat crop faces drought conditions. In addition, Black Sea wheat producers are facing their driest autumn in a decade, although plentiful rainfall in October and early November should help limit this dry spell. While the supply outlook remains mixed, we see global demand remaining healthy in 2021. Chinese imports are on track to hit our projected 6.7mn mt for 2020/21, with potential upside risks to US exports given tensions with Australia. Net, apart from winter weather, the main bullish risk we see for wheat is higher corn prices, as this could increase demand for wheat in feed. Net healthy global balances drive our forecast of c595/c585/c550/bu over the 3/6/12m horizon.
Lean Hogs Through 2021, we believe the US hog market will likely continue on a slow path of rebalancing, after the historic disruption Covid-19 brought this year. While supply has returned to near seasonal norms, frozen storage stocks have remained low as China increased its imports of pork to help offset a large domestic deficit, pointing to volatility in prices going into 2021. With Covid case growth rising across the US MidWest, further plant shutdowns are possible, though unlikely on the same scale as April.
We see the large supply rotation that began in 2H20 continuing in 2021, as China works to rebuild its hog herds (we expect them to grow 20% yoy), while the US works to reduce them after shutdowns created a backlog in 1H20. This should lower US pork competitiveness relative to domestic Chinese supply, attenuating US exports,
Exhibit 73: Winter wheat declines due to La Nina will likely be offset by growing Russian production
Source: USDA
18 November 2020 45
Goldman Sachs 2021 Commodity Outlook
For t
he e
xclu
sive
use
of J
OSEP
H.ST
EIN@
GS.C
OM
7f10
0ca8
95df
11e0
bb43
0021
5ace
2648

particularly in the second half of 2021. However, we expect Chinese supply (and hence export demand) to accelerate only gradually into 2021. This delay we forecast is driven by the use of aggressive non-traditional cross-breeding lowering the quality of the Chinese sow herd, lowering feed conversion efficiency and farrowing rates. Net, the continued rebalancing of the US herd we forecast should support a seasonally moderated upswing in prices throughout 2021. Accordingly, we change our forecasts to $65/$80/$70/cwt.
Live Cattle We see the cattle market near a stable equilibrium at the start of 2021. With producer margins remaining within their five-year range and near-term supply ample, we expect live cattle to move back to within the seasonal range by 2Q21. However, risks of feedlot margin compression under rising grains prices point to tighter supplies in 2H21. As a result, we forecast prices of $112/$115/$125/cwt over the 3/6/12m horizon.
After October’s Cattle on Feed Report surprised to the upside, we see a continuation of increased placements through into 1H21 as on-feed inventories are forecast to expand, leaving ample front-end supplies of market-ready cattle. At the start of 2021, we expect feeder margins to continue to compress alongside rising grains prices, slowing the supply of live cattle to feedlots and providing a mild tailwind to live cattle prices in 1H21. Further out, we see moderate drought risks to cattle supply in 2H21/1H22, with La Nina pointing to further dryness, with 44% of US cattle already in areas experiencing drought. Dry conditions reduce pasture availability, reducing heifer retention and lowering the following year’s calf crop (and hence 1H22 Feeder cattle supply). From a demand perspective we see international demand continuing to normalize as major buyers (including Japan and Mexico) resume beef imports, generating an additional c.2mn mt of exports a week by end 1Q21 on our forecasts. Overall, the USDA expects total exports to increase to 11.2% of production across 2021.
Exhibit 74: China’s share of exports is set to diminish in 2021
Exhibit 75: As China’s ordinary herd recovers, this year’s record export pace should soften
0%
10%
20%
30%
40%
50%
60%
0 May-20 Aug-20
Exports % to China
0%
5%
10%
15%
20%
25%
30%
35%
40%
45%
50%
0
50
100
150
200
250
300
2013 2014 2015 2016 2017 2018 2019 2020
Pork Exports Total China Pork export share
mn lbs
-40%
-30%
-20%
-10%
0%
10%
20%
30%
40%
50%
0
5
10
15
20
25
30
35
40
45
1H16
2H16
1H17
2H17
1H18
2H18
1H19
2H19
1H20
2H20
1H21
2H21
1H22
2H22
1H23
2H23
1H24
2H24
1H25
2H25
1H26
2H26
1H27
2H27
1H28
2H28
1H29
2H29
1H30
Reported sow herdForecast sow herd - 2 breed market hogForecast sow herd - 3 breed market hogForecast sow herd - ordinary sowSow herd yoy
Sow herd ( mn heads) Sow herd yoy (%)
Source: Bloomberg, Goldman Sachs Global Investment Research.
Source: Goldman Sachs Global Investment Research.
18 November 2020 46
Goldman Sachs 2021 Commodity Outlook
For t
he e
xclu
sive
use
of J
OSEP
H.ST
EIN@
GS.C
OM
7f10
0ca8
95df
11e0
bb43
0021
5ace
2648

Cocoa Cocoa demand has been largely hit by Covid-19, as a substantial portion of purchasing comes from travellers (airports, train stations and tourists). Therefore, our demand outlook for 2021 remains contingent on the widespread availability of a functional vaccine, which our global economists see as an increasingly likely prospect. We see a rebound in grindings of 3% yoy, leveraging a simple model of GDP growth, carry-in stocks and the futures curve to track year-ahead grindings (see exhibit). However, with cases rising exponentially in the US and Europe, this support will only come later in 2021, with the global supply outlook for 2021 increasingly bearish, as ample rains and sunshine aid West African crop development prior to the Dec-Mar harvest.
We therefore expect downside to prices in 1H21 until global travel resumes, reflected in our new forecast of $2350/2400/2500/t over the 3/6/12m horizon. Political risks remain, however. Recent elections in Cote d’Ivoire have seen civil unrest breakout across the country, blocking roads and restriction cocoa access to ports. While the situation remains volatile, our base case assumes a return to normality with minimum disruption to this winter’s harvest and export. Further, while there remains political pressure on the Ivorian government to increase or guarantee the Living Income Differential (LID) for farm gate prices, we assume the status quo at this time.
Exhibit 76: Cattle on Feed remain above typical levels, up 3.8% yoy
Exhibit 77: Cattle slaughter will likely remain at the upper end of production capacity to work through excess herd backlog USDA daily cattle slaughter, smooth, head
2 600
9,500
10,000
10,500
11,000
11,500
12,000
12,500
J F M A M J J A S O N D
10-Year Range 10-Year Average 2019 2020
350,000
400,000
450,000
500,000
550,000
600,000
650,000
700,000
750,000
Jan Feb Mar Apr May Jun Jul Aug Sep Oct Nov Dec
5-Year Range 5-Year Average 2019 2020
Source: IHS Markit, USDA, Goldman Sachs Global Investment Research.
Source: USDA, Goldman Sachs Global Investment Research.
18 November 2020 47
Goldman Sachs 2021 Commodity Outlook
For t
he e
xclu
sive
use
of J
OSEP
H.ST
EIN@
GS.C
OM
7f10
0ca8
95df
11e0
bb43
0021
5ace
2648

Cotton In 2020E, cotton demand fell as global apparel imports dropped across the developed world (U.S. -55% in May, the UK/EU -40%, Japan -40%). Alongside other softs, we see cotton demand growing in 2021 as global growth rebounds. Although Chinese state stockpiles are at target, our economists’ above consensus growth forecast points to a strong rebound in cotton usage, with mill use for 2020/21 projected up 12%. At the same time, we see global production falling 5% yoy to 116mn mt, pushing the world into a 3mn mt deficit for 2021. Dry weather across the US south – exacerbating by the strengthening La Nina – has pulled down cotton production to 17.1mn bales, taking projected US 20/21 ending stocks down 10% from a decade high of 8mn mt to 7.2mn mt. With the global supply outlook tightening, we see world cotton stocks being run down over the next year and a cyclical rise in prices throughout 2021. As a result we forecast ¢73/¢74/¢75 /lb over the 3/6/12m horizon.
Exhibit 78: We expect cocoa grindings to grow next year as global growth rebounds Dashed lines are GS forecasts
Exhibit 79: Lower demand leaves 21 carry-in stocks near average, despite a poor 19/20 harvest ICE Cocoa inventories
-11%
-6%
-1%
4%
9%
14%
-8%
-6%
-4%
-2%
0%
2%
4%
6%
8%
10%
12%
1982 1986 1990 1994 1998 2002 2006 2010 2014 2018
Global Grindings Growth Global GDP Growth 0
1
2
3
4
5
6
7
Jan Feb Mar Apr May Jun Jul Aug Sep Oct Nov Dec
2020
Average
Min
Max
mn bags
Source: Goldman Sachs Global Investment Research, Bloomberg.
Source: Bloomberg, Goldman Sachs Global Investment Research.
Exhibit 80: La Nina is creating drought conditions in the South West of the United States
Source: NOAA
18 November 2020 48
Goldman Sachs 2021 Commodity Outlook
For t
he e
xclu
sive
use
of J
OSEP
H.ST
EIN@
GS.C
OM
7f10
0ca8
95df
11e0
bb43
0021
5ace
2648

Coffee Coffee prices also remain sensitive to the development of a vaccine and a reduction in Western travel restrictions. Near-term, we expect demand weakness as European lockdowns bite and the risk of further restrictions in the US. While bearish, delays in getting the record Brazilian crop to market have left on-exchange stocks falling and provided support to prices. Despite this large crop, we expect prices to appreciate from 2H21 given an expected V-shaped recovery in coffee demand, at c.1.1% yoy for 2021 (after a 0.9%fall in 2020). The EU and US – core consumers of high-grade Arabica – are seeing imports rise with next year’s Brazil’s ‘off year’ in coffee production. In fact, La Nina presents upside risks to prices, as drier South central Brazilian weather is causing flowers to wilt across Minas Gerias – a leading indicator for falling yields. This presents material upside risks to our 3 and 6m forecasts of 135-145¢/lb that are above market forwards. In the long-run, we see potential for further upside given building supply threats due to Covid: worker-intensive harvesting processes have been stymied by lockdowns, allowing coffee borer to attack plants. Coffee rust is further damaging harvests in central America as low coffee prices ensure farmers do not have the funds to invest in the herbicides required to treat it. As a result we update our forecasts to 112/120/135¢/lb over the 3/6/12m horizon.
Sugar Moving into 2021, sugar prices will decline moderately as supply gains offset a moderate demand recovery. We see global production up 9% to 180mn mt despite falling Thai yields, with the market under-pricing India’s large crop and rising stockpiles. We believe a large Indian sugar export subsidy and low domestic prices will drive exports to 6mn mt. Only partially absorbing this increase in production will be recovering demand and oil prices. With a second wave building across Europe and the early signs of a third appearing in the US, we see near term risks to sugar demand exactly when excess Indian supply will be hitting the world export market. After falling for the first time in forty years, we expect global demand to rise c.1.5mn mt as lockdowns are lifted – albeit at a slower pace than pre-Covid as cinema’s, restaurants and tourism take time to recover as the vaccine becomes more widely available. Rising ethanol prices during
Exhibit 81: Covid-19 related disruption has helped drive on-exchange stocks to multi-year lows 60 kg bags
Exhibit 82: Despite near-record production in Brazil
1000000
1200000
1400000
1600000
1800000
2000000
2200000
2400000
2600000
Jan-18 May-18 Sep-18 Jan-19 May-19 Sep-19 Jan-20 May-20 Sep-20
ICE Total Coffee Stocks
20000
25000
30000
35000
40000
45000
50000
55000
60000
65000 k bags
Source: Bloomberg, Goldman Sachs Global Investment Research
Source: Conab, Goldman Sachs Global Investment Research
18 November 2020 49
Goldman Sachs 2021 Commodity Outlook
For t
he e
xclu
sive
use
of J
OSEP
H.ST
EIN@
GS.C
OM
7f10
0ca8
95df
11e0
bb43
0021
5ace
2648

Brazil’s crushing season should moderate India’s supply glut but only in 2H21. As a result, we see global sugar prices moderating downward in 1H21, stabilizing at a new equilibrium of 13.5-14c/lb.
Exhibit 83: Brazilian cane crush has risen this year South Central Brazilian sugar production
Exhibit 84: Sugar production has risen due to low ethanol prices
0
500
1000
1500
2000
2500
3000
3500
4000
Jan Mar May Jul Sep Nov
2014
2015
2016
2017
2018
2019
2020
kmt
-0.2
-0.15
-0.1
-0.05
0
0.05
0.1
0.15
0.2
Jan-18 May-18 Sep-18 Jan-19 May-19 Sep-19 Jan-20 May-20 Sep-20
Hydrous Ethanol Sugar Spread$/ltrBrazilian cursh
Source: Bloomberg, Goldman Sachs Global Investment Research
Source: Bloomberg, Goldman Sachs Global Investment Research
18 November 2020 50
Goldman Sachs 2021 Commodity Outlook
For t
he e
xclu
sive
use
of J
OSEP
H.ST
EIN@
GS.C
OM
7f10
0ca8
95df
11e0
bb43
0021
5ace
2648

Commodity Supply and Demand Models
Oil
Exhibit 85: GS Global Oil Supply kb/d
1Q2019 2Q2019 3Q2019 4Q2019 Jan-20 Feb-20 Mar-20 Apr-20 May-20 Jun-20 Jul-20 Aug-20 Sep-20 Oct-20 Nov-20 Dec-20 Jan-21 Feb-21 Mar-21 Apr-21 May-21 Jun-21 Jul-21 Aug-21 Sep-21 Oct-21 Nov-21 Dec-21 Jan-22 Feb-22 Mar-22 Apr-22 May-22 Jun-22 Jul-22 Aug-22 Sep-22 Oct-22 Nov-22 Dec-22 2019 2020E 2021E 2022E yoy 19 yoy 20E yoy 21E yoy 22ELower 48 crude 9,477 9,730 9,990 10,337 10,290 10,300 10,340 9,640 8,000 8,520 8,887 8,939 8,805 8,757 8,723 8,678 8,634 8,625 8,620 8,599 8,596 8,590 8,638 8,680 8,779 8,860 8,990 9,130 9,239 9,357 9,477 9,589 9,689 9,781 9,824 9,865 9,904 9,941 9,977 10,012 9,883 9,157 8,728 9,721 1,150 -727 -428 993Gulf of Mexico crude 1,863 1,930 1,833 1,960 1,980 1,970 1,930 1,910 1,610 1,560 1,650 1,160 1,461 1,080 1,288 1,636 1,838 1,885 1,882 1,879 1,876 1,873 1,800 1,797 1,794 1,831 1,828 1,825 1,869 1,872 1,875 1,878 1,881 1,884 1,817 1,820 1,823 1,865 1,868 1,871 1,897 1,603 1,842 1,860 142 -294 239 18Alaska crude 490 467 427 477 480 480 470 460 400 360 440 440 446 448 447 446 483 482 482 462 461 461 440 440 440 459 459 458 477 477 477 457 457 457 437 437 437 457 457 457 465 443 461 457 -13 -22 18 -3
US crude 11,830 12,127 12,250 12,773 12,750 12,750 12,740 12,010 10,010 10,440 10,977 10,539 10,712 10,285 10,458 10,760 10,955 10,993 10,984 10,939 10,933 10,924 10,878 10,917 11,012 11,151 11,277 11,414 11,585 11,706 11,830 11,924 12,027 12,122 12,078 12,122 12,164 12,264 12,303 12,340 12,245 11,203 11,031 12,039 1,279 -1,042 -171 1,007US NGL 4,663 4,807 4,823 5,000 5,150 4,970 5,250 4,930 4,740 5,200 5,370 5,333 5,229 5,192 5,214 5,200 5,147 5,128 5,180 5,173 5,169 5,189 5,186 5,186 5,172 5,170 5,209 5,196 5,214 5,245 5,272 5,296 5,296 5,329 5,343 5,349 5,345 5,316 5,289 5,283 4,823 5,148 5,175 5,298 456 325 27 123Lower 48 other 169 178 164 167 144 156 168 184 187 189 175 175 178 173 180 184 144 156 168 184 187 189 175 175 178 173 180 184 145 158 170 186 189 191 177 177 180 175 182 186 169 174 174 176 -8 5 0 2US ethanol 1,013 1,047 1,017 1,040 1,080 1,050 950 560 680 870 930 930 910 920 940 980 960 1,000 980 980 1,010 1,000 1,000 1,010 960 990 1,010 1,000 1,004 1,008 1,012 1,016 1,021 1,025 1,029 1,033 1,037 1,041 1,046 1,050 1,029 900 992 1,027 -21 -129 92 35
Total US 17,675 18,158 18,254 18,981 19,124 18,926 19,108 17,684 15,617 16,699 17,452 16,977 17,029 16,569 16,792 17,124 17,206 17,277 17,311 17,276 17,298 17,302 17,239 17,288 17,323 17,484 17,676 17,794 17,949 18,117 18,283 18,422 18,533 18,667 18,627 18,680 18,725 18,796 18,819 18,859 18,267 17,425 17,373 18,540 1,706 -842 -52 1,167Canada 5,492 5,511 5,507 5,665 5,646 5,778 5,671 5,053 4,770 5,097 5,020 5,180 5,332 5,452 5,605 5,626 5,631 5,661 5,653 5,511 5,468 5,562 5,593 5,741 5,541 5,660 5,811 5,831 5,781 5,801 5,711 5,539 5,465 5,558 5,638 5,786 5,585 5,703 5,854 5,873 5,544 5,353 5,638 5,691 137 -191 286 53Mexico 1,914 1,911 1,938 1,946 2,002 2,003 2,018 1,985 1,905 1,888 1,879 1,917 1,920 1,954 1,950 1,947 1,963 1,961 1,958 1,970 1,968 1,965 1,953 1,950 1,948 1,945 1,942 1,940 1,927 1,925 1,922 1,925 1,922 1,920 1,922 1,920 1,917 1,920 1,917 1,915 1,927 1,947 1,955 1,921 -146 20 8 -34
Total North America 25,082 25,580 25,699 26,592 26,772 26,707 26,797 24,722 22,292 23,684 24,351 24,074 24,281 23,975 24,348 24,697 24,799 24,898 24,922 24,757 24,734 24,829 24,784 24,979 24,812 25,089 25,430 25,565 25,657 25,843 25,917 25,886 25,920 26,145 26,187 26,386 26,228 26,419 26,591 26,646 25,738 24,725 24,966 26,152 1,697 -1,013 241 1,186Argentina 632 634 644 645 643 646 649 591 576 602 599 602 610 617 613 609 613 611 610 619 618 616 622 621 619 623 622 621 626 627 627 628 629 629 635 636 636 642 643 643 639 613 618 633 57 -25 5 16Brazil 2,664 2,737 3,009 3,170 3,289 3,082 3,072 3,064 2,855 3,122 3,191 3,196 2,970 3,090 3,103 3,201 3,284 3,229 3,169 3,162 3,044 3,246 3,290 3,269 3,247 3,280 3,277 3,387 3,347 3,310 3,274 3,300 3,380 3,353 3,392 3,424 3,397 3,411 3,414 3,507 2,895 3,103 3,240 3,376 182 208 137 135Colombia 899 900 884 889 891 886 864 803 739 737 742 749 779 793 803 813 827 824 822 820 818 816 814 812 809 810 808 806 800 800 799 789 788 788 772 772 771 771 770 770 893 800 816 783 20 -93 16 -33Guyana 0 0 0 5 40 60 70 70 75 75 80 90 100 120 120 120 120 120 120 120 120 120 120 120 120 120 120 120 120 120 120 140 170 200 240 280 320 320 320 320 1 85 120 223 1 84 35 103Other Latam 362 355 363 365 366 362 338 325 309 322 335 325 326 332 333 334 337 339 337 338 337 336 337 336 335 336 335 334 339 339 338 344 343 342 348 347 346 352 351 350 361 334 337 345 4 -28 3 8
Non-OPEC LatAm 4,557 4,626 4,900 5,075 5,229 5,036 4,993 4,853 4,554 4,858 4,947 4,962 4,785 4,951 4,972 5,077 5,180 5,123 5,059 5,060 4,937 5,134 5,183 5,157 5,131 5,170 5,162 5,267 5,233 5,195 5,159 5,201 5,310 5,313 5,387 5,459 5,471 5,496 5,498 5,591 4,789 4,935 5,130 5,359 265 145 196 229Norway 1,774 1,569 1,651 1,950 1,977 2,101 2,057 2,092 2,036 1,857 2,061 2,018 1,867 2,046 1,922 2,046 2,046 2,034 2,117 2,130 2,016 1,980 2,149 2,073 1,900 2,165 2,199 2,223 2,200 2,171 2,157 2,133 2,002 1,949 2,101 2,008 1,818 2,131 2,212 2,283 1,736 2,007 2,086 2,097 -114 271 80 11UK 1,204 1,142 1,075 1,120 1,172 1,199 1,059 1,173 1,055 1,117 1,069 1,055 947 1,103 1,099 1,095 1,120 1,117 1,114 1,061 1,058 1,056 953 951 948 1,056 1,053 1,051 1,054 1,073 1,072 1,021 999 1,018 882 881 860 924 923 921 1,135 1,095 1,045 969 27 -40 -50 -76Other Europe 615 592 573 557 571 582 547 530 524 573 548 551 559 572 570 568 569 567 565 543 541 540 548 546 545 565 563 561 557 555 554 531 529 527 534 533 531 550 548 547 584 558 554 541 -55 -26 -4 -13
Total Europe 3,593 3,303 3,299 3,627 3,720 3,882 3,663 3,795 3,615 3,547 3,678 3,624 3,373 3,721 3,591 3,709 3,735 3,718 3,796 3,734 3,616 3,576 3,650 3,570 3,393 3,786 3,815 3,835 3,812 3,799 3,782 3,684 3,530 3,495 3,517 3,422 3,209 3,604 3,683 3,751 3,456 3,660 3,685 3,607 -143 204 25 -78Azerbaijan 800 743 762 756 770 751 765 772 651 629 645 676 676 678 679 679 679 679 679 713 713 713 733 732 731 732 731 730 738 737 737 735 734 734 733 733 732 734 733 733 765 698 714 734 -28 -68 16 21Kazakhstan 2,002 1,830 1,937 1,999 2,021 2,050 2,023 2,017 1,819 1,679 1,680 1,722 1,682 1,713 1,715 1,715 1,715 1,715 1,715 1,796 1,796 1,796 1,876 1,876 1,876 1,876 1,876 1,876 1,957 1,957 1,957 1,957 1,957 1,957 1,945 1,945 1,944 1,957 1,957 1,957 1,942 1,820 1,816 1,954 15 -122 -4 138Russia 11,668 11,501 11,573 11,590 11,653 11,636 11,633 11,676 9,733 9,666 9,720 10,210 10,271 10,345 10,204 10,204 10,204 10,204 10,204 10,721 10,721 10,721 11,238 11,238 11,238 11,238 11,238 11,238 11,755 11,755 11,755 11,755 11,755 11,755 11,755 11,755 11,755 11,755 11,755 11,755 11,583 10,579 10,851 11,755 91 -1,004 271 905Other FSU 350 353 353 356 357 359 360 356 358 358 357 357 356 356 355 355 352 351 351 351 351 350 354 354 353 358 357 356 362 364 365 367 366 366 364 363 363 361 360 360 353 357 353 363 5 4 -4 10
Total FSU 14,820 14,428 14,624 14,701 14,801 14,796 14,781 14,821 12,561 12,332 12,402 12,965 12,985 13,092 12,954 12,953 12,950 12,950 12,949 13,581 13,580 13,580 14,202 14,201 14,199 14,204 14,203 14,201 14,812 14,814 14,814 14,813 14,812 14,811 14,797 14,796 14,794 14,807 14,806 14,805 14,643 13,454 13,733 14,807 82 -1,189 280 1,073China 3,878 3,907 3,877 3,864 3,962 3,964 3,972 3,937 3,951 4,029 3,956 4,002 4,001 3,993 3,990 3,986 3,988 3,985 4,003 4,026 4,038 4,036 4,014 4,011 4,009 4,032 4,029 4,027 4,017 4,017 4,017 4,062 4,062 4,062 4,037 4,037 4,037 4,052 4,052 4,052 3,881 3,979 4,017 4,042 36 97 38 25India 828 808 791 785 779 753 778 734 731 754 761 722 723 729 728 727 728 727 726 725 725 724 728 728 727 726 725 725 722 722 721 721 721 720 725 725 724 724 724 723 803 743 726 723 -40 -60 -17 -3Indonesia 792 780 762 756 753 755 754 744 733 735 731 731 686 710 709 708 689 689 690 680 680 680 666 666 666 657 657 657 660 661 661 666 667 667 662 662 663 656 656 657 772 729 673 662 -26 -43 -56 -11Malaysia 708 690 603 679 689 670 665 568 556 564 580 570 580 631 608 607 626 625 625 594 593 593 562 562 561 580 580 579 609 608 607 577 576 576 545 545 544 563 563 562 670 607 590 573 -44 -63 -17 -17Australia 395 439 484 514 460 430 489 500 433 472 457 499 510 504 504 505 494 494 494 467 467 467 451 451 451 451 451 451 438 438 438 426 426 426 426 426 426 426 426 426 458 480 466 429 116 22 -15 -37Vietnam 259 262 243 237 232 236 232 231 223 217 211 211 209 213 212 212 203 203 203 193 193 193 188 188 188 193 193 193 193 193 193 183 183 183 178 178 178 183 183 183 250 220 194 184 4 -30 -26 -10Rest of Asia-Pacific 796 790 774 791 769 766 765 753 741 728 707 727 712 719 717 714 721 720 718 718 717 716 683 681 680 688 687 685 678 677 676 682 680 679 669 668 667 663 662 661 788 735 701 672 -42 -53 -34 -29
Non-OPEC Asia 7,656 7,677 7,534 7,626 7,644 7,574 7,655 7,467 7,368 7,499 7,403 7,462 7,421 7,498 7,467 7,459 7,448 7,443 7,459 7,403 7,413 7,408 7,291 7,286 7,282 7,326 7,321 7,316 7,317 7,315 7,313 7,316 7,314 7,312 7,241 7,239 7,238 7,267 7,265 7,263 7,623 7,493 7,366 7,283 3 -130 -127 -83Oman 978 978 979 979 966 964 1,086 1,115 846 901 900 929 925 929 930 930 930 930 930 972 972 972 1,013 1,013 1,013 1,013 1,013 1,013 1,055 1,055 1,055 1,055 1,055 1,055 1,055 1,055 1,055 1,055 1,055 1,055 979 952 982 1,055 -7 -27 30 73Qatar 1,924 1,901 1,901 1,900 1,898 1,887 1,862 1,893 1,890 1,888 1,900 1,899 1,898 1,884 1,880 1,876 1,865 1,863 1,861 1,879 1,902 1,926 1,919 1,917 1,915 1,908 1,906 1,904 1,902 1,902 1,902 1,900 1,900 1,900 1,898 1,898 1,898 1,896 1,896 1,896 1,907 1,888 1,897 1,899 -103 -19 9 2Other Middle East 291 310 315 319 263 321 322 328 259 271 267 267 278 290 290 290 305 304 304 307 307 307 309 309 309 312 312 311 314 314 313 316 315 315 318 317 317 319 319 319 309 287 308 316 37 -22 21 8
Non-OPEC Middle East 3,193 3,189 3,195 3,199 3,127 3,172 3,270 3,336 2,995 3,060 3,067 3,095 3,101 3,103 3,101 3,097 3,100 3,098 3,096 3,158 3,181 3,204 3,241 3,239 3,237 3,233 3,231 3,229 3,271 3,271 3,270 3,271 3,271 3,270 3,271 3,270 3,270 3,271 3,270 3,270 3,194 3,127 3,187 3,271 -74 -67 60 83Egypt 641 637 630 622 622 622 605 609 605 612 599 601 599 601 600 599 585 585 585 580 580 580 580 580 580 575 575 575 556 557 557 553 554 555 556 557 558 554 554 555 633 606 580 556 -17 -27 -26 -24Ghana 198 198 200 201 182 182 182 190 191 192 186 186 187 188 188 188 183 183 182 177 177 177 177 177 177 177 177 176 167 167 167 164 164 165 163 163 163 158 159 159 199 187 178 163 10 -13 -9 -15Other Africa 624 634 605 627 611 591 599 579 609 584 585 569 588 589 589 588 605 604 604 600 599 599 595 594 594 590 589 589 589 588 588 598 597 597 606 606 606 615 615 615 623 590 597 602 14 -32 7 5
Non-OPEC Africa 1,463 1,469 1,435 1,451 1,415 1,395 1,386 1,378 1,405 1,388 1,370 1,356 1,374 1,378 1,376 1,375 1,372 1,372 1,371 1,357 1,356 1,356 1,351 1,351 1,351 1,341 1,341 1,340 1,311 1,312 1,312 1,315 1,316 1,317 1,325 1,326 1,327 1,327 1,328 1,329 1,455 1,383 1,355 1,320 6 -72 -28 -35Processing gains 2,349 2,349 2,349 2,349 2,364 2,361 2,384 2,328 2,050 2,061 2,119 2,105 2,118 2,153 2,183 2,157 2,184 2,202 2,211 2,211 2,229 2,251 2,305 2,266 2,282 2,318 2,333 2,295 2,362 2,381 2,388 2,347 2,377 2,403 2,415 2,377 2,392 2,424 2,436 2,395 2,349 2,199 2,257 2,391 27 -150 59 134Biofuels exc. US ethanol 1,246 1,907 2,203 1,695 1,190 1,209 1,223 1,598 1,872 1,959 2,162 2,063 1,972 1,847 1,677 1,473 1,321 1,298 1,376 1,761 1,997 2,146 2,226 2,227 2,222 2,088 1,839 1,556 1,417 1,411 1,491 1,879 2,117 2,268 2,350 2,354 2,351 2,220 1,974 1,692 1,763 1,687 1,838 1,960 198 -76 151 122
Total non-OPEC supply 63,958 64,529 65,239 66,313 66,262 66,132 66,152 64,298 58,712 60,388 61,499 61,706 61,410 61,720 61,669 61,997 62,090 62,103 62,239 63,022 63,044 63,484 64,233 64,276 63,909 64,556 64,675 64,605 65,190 65,341 65,448 65,712 65,968 66,334 66,491 66,629 66,280 66,834 66,850 66,743 65,010 62,662 63,520 66,152 2,062 -2,348 858 2,632Non-OPEC ex. US Lower 48 & NGL 49,818 49,992 50,426 50,977 50,822 50,862 50,562 49,728 45,972 46,668 47,242 47,434 47,376 47,771 47,732 48,118 48,309 48,349 48,439 49,251 49,279 49,705 50,410 50,411 49,958 50,525 50,476 50,279 50,738 50,739 50,699 50,827 50,982 51,223 51,324 51,416 51,032 51,577 51,583 51,448 50,303 48,357 49,616 51,132 456 -1,946 1,259 1,516
Ecuador 529 531 546 518 535 535 535 215 315 514 523 521 520 513 511 510 493 492 491 495 494 493 496 495 494 488 487 486 464 463 462 466 465 464 468 467 466 459 458 457 531 479 492 463 9 -52 13 -29Venezuela 1,107 863 753 777 840 760 660 624 558 337 345 351 383 370 360 350 347 352 357 362 367 372 377 382 387 392 397 402 407 412 417 422 427 432 437 442 447 452 457 462 875 495 375 435 -524 -380 -120 60Algeria 1,027 1,020 1,023 1,023 1,010 1,009 1,031 1,006 819 810 808 857 854 855 866 866 866 866 866 915 915 915 965 965 965 965 965 965 935 934 933 937 936 935 944 944 943 927 926 925 1,023 899 928 935 -19 -124 29 7Congo 340 347 337 307 300 302 295 293 285 298 287 286 283 290 284 284 269 269 269 267 267 267 267 267 267 267 267 267 257 257 257 252 252 252 247 247 247 242 242 242 333 291 268 250 9 -42 -23 -18Gabon 213 220 207 210 170 191 202 196 194 203 192 184 180 185 178 178 178 178 178 181 181 181 183 183 183 178 178 178 181 181 181 185 185 185 183 183 183 176 176 176 213 188 180 181 23 -25 -8 1Angola 1,430 1,430 1,347 1,350 1,380 1,387 1,402 1,313 1,275 1,223 1,186 1,218 1,246 1,230 1,293 1,293 1,280 1,274 1,269 1,249 1,244 1,238 1,223 1,218 1,213 1,188 1,183 1,178 1,122 1,121 1,121 1,105 1,104 1,104 1,093 1,093 1,092 1,071 1,071 1,070 1,389 1,287 1,230 1,097 -103 -102 -57 -132Nigeria 1,690 1,723 1,813 1,697 1,680 1,788 1,848 1,777 1,584 1,492 1,467 1,467 1,461 1,490 1,548 1,548 1,548 1,548 1,548 1,621 1,621 1,621 1,694 1,694 1,694 1,694 1,694 1,694 1,766 1,765 1,764 1,737 1,736 1,735 1,719 1,717 1,716 1,715 1,714 1,713 1,731 1,596 1,639 1,733 128 -135 43 94Equatorial Guinea 107 110 110 113 120 121 122 125 90 117 114 118 103 120 110 110 110 110 110 114 114 114 119 119 119 116 116 116 110 110 110 113 113 113 113 113 113 111 111 111 110 114 115 112 -12 4 1 -3Libya 953 1,147 1,090 1,153 780 147 91 82 80 90 107 104 156 450 900 1,000 1,050 1,100 1,110 1,120 1,130 1,140 1,150 1,160 1,170 1,180 1,190 1,200 1,210 1,220 1,230 1,240 1,250 1,260 1,270 1,280 1,290 1,300 1,310 1,320 1,086 332 1,142 1,265 123 -754 809 123Iran 2,740 2,407 2,187 2,113 2,060 2,070 2,025 1,973 1,954 1,947 1,930 1,942 1,964 2,000 2,000 2,000 2,000 2,050 2,100 2,150 2,200 2,200 2,200 2,300 2,400 2,500 2,500 2,500 2,500 2,500 2,500 2,750 3,000 3,200 3,350 3,500 3,500 3,500 3,500 3,500 2,362 1,989 2,258 3,108 -1,299 -373 270 850Iraq 4,697 4,730 4,787 4,633 4,540 4,604 4,570 4,505 4,160 3,715 3,752 3,578 3,644 3,760 3,895 3,895 3,895 3,895 3,895 4,092 4,092 4,092 4,289 4,289 4,289 4,289 4,289 4,289 4,486 4,486 4,486 4,486 4,486 4,486 4,486 4,486 4,486 4,486 4,486 4,486 4,712 4,051 4,141 4,486 145 -660 90 345Kuwait 2,713 2,680 2,650 2,683 2,670 2,672 2,880 3,118 2,198 2,085 2,161 2,285 2,292 2,300 2,300 2,300 2,300 2,300 2,300 2,432 2,432 2,432 2,564 2,564 2,564 2,564 2,564 2,564 2,697 2,697 2,697 2,697 2,697 2,697 2,697 2,697 2,697 2,697 2,697 2,697 2,682 2,438 2,465 2,697 -63 -243 27 231Saudi Arabia 10,060 9,760 9,487 9,910 9,720 9,698 9,946 11,642 8,479 7,540 8,417 8,922 8,957 9,000 9,009 9,009 9,009 9,009 9,009 9,526 9,526 9,526 10,043 10,043 10,043 10,043 10,043 10,043 10,560 10,560 10,560 10,560 10,560 10,560 10,560 10,560 10,560 10,560 10,560 10,560 9,804 9,195 9,656 10,560 -521 -609 461 905UAE 3,067 3,133 3,167 3,340 3,160 3,065 3,507 3,841 2,478 2,387 2,773 2,843 2,533 2,430 2,595 2,595 2,595 2,595 2,595 2,858 2,858 2,858 3,121 3,121 3,121 3,121 3,121 3,121 3,385 3,385 3,385 3,385 3,385 3,385 3,385 3,385 3,385 3,385 3,385 3,385 3,177 2,851 2,924 3,385 180 -326 73 461
Total OPEC Crude 30,672 30,101 29,503 29,828 28,965 28,349 29,114 30,710 24,469 22,758 24,062 24,676 24,576 24,993 25,849 25,937 25,940 26,038 26,097 27,382 27,441 27,449 28,692 28,801 28,909 28,986 28,995 29,004 30,080 30,092 30,103 30,335 30,597 30,808 30,951 31,113 31,124 31,080 31,092 31,103 30,026 26,205 27,811 30,706 -1,923 -3,821 1,606 2,895Total OPEC NGL 5,385 5,392 5,336 5,280 5,346 5,338 5,278 5,414 4,905 4,900 4,906 5,034 5,029 5,060 5,122 5,131 5,133 5,142 5,148 5,240 5,246 5,249 5,338 5,348 5,357 5,365 5,368 5,370 5,448 5,451 5,453 5,472 5,492 5,509 5,521 5,535 5,537 5,536 5,539 5,542 5,348 5,122 5,275 5,503 -127 -226 153 228Total OPEC supply 36,057 35,493 34,839 35,109 34,311 33,687 34,392 36,124 29,374 27,658 28,968 29,710 29,605 30,053 30,971 31,068 31,073 31,180 31,245 32,622 32,687 32,698 34,030 34,148 34,267 34,351 34,363 34,374 35,528 35,542 35,556 35,807 36,089 36,317 36,472 36,647 36,661 36,617 36,631 36,645 35,374 31,327 33,087 36,209 -2,050 -4,048 1,760 3,123
World supply 100,016 100,022 100,078 101,422 100,573 99,819 100,544 100,422 88,086 88,046 90,467 91,416 91,014 91,773 92,641 93,065 93,163 93,283 93,484 95,645 95,731 96,183 98,263 98,425 98,176 98,907 99,038 98,979 100,718 100,883 101,004 101,519 102,056 102,651 102,964 103,276 102,942 103,451 103,481 103,388 100,384 93,989 96,606 102,361 12 -6,396 2,618 5,755
Non
-OPE
C S
uppl
yO
PEC
Sup
ply
Source: IEA, Woodmac, EIA, National sources, OPEC, Kpler, Goldman Sachs Global Investment Research
Exhibit 86: GS Global Oil Demand kb/d
1Q2019 2Q2019 3Q2019 4Q2019 Jan-20 Feb-20 Mar-20 Apr-20 May-20 Jun-20 Jul-20 Aug-20 Sep-20 Oct-20 Nov-20 Dec-20 Jan-21 Feb-21 Mar-21 Apr-21 May-21 Jun-21 Jul-21 Aug-21 Sep-21 Oct-21 Nov-21 Dec-21 Jan-22 Feb-22 Mar-22 Apr-22 May-22 Jun-22 Jul-22 Aug-22 Sep-22 Oct-22 Nov-22 Dec-22 2019 2020E 2021E 2022E yoy 19 yoy 20E yoy 21E yoy 22EUSA 20,702 20,757 21,030 20,960 20,039 20,056 18,734 14,769 16,270 17,660 18,600 19,037 18,318 19,245 19,094 17,847 17,901 18,581 18,971 19,284 19,518 20,016 20,255 20,481 20,076 20,507 20,458 20,447 20,612 20,392 20,458 20,306 20,372 20,737 20,842 20,958 20,474 20,863 20,779 20,745 20,862 18,306 19,708 20,628 41 -2,556 1,402 920Canada 2,301 2,311 2,568 2,487 2,298 2,502 2,193 1,660 1,882 2,084 2,017 2,411 2,291 2,372 2,382 2,329 2,208 2,311 2,212 2,264 2,201 2,436 2,431 2,743 2,453 2,515 2,520 2,523 2,393 2,466 2,347 2,372 2,294 2,516 2,498 2,800 2,502 2,559 2,561 2,563 2,417 2,202 2,401 2,489 -108 -215 200 88Mexico 2,070 2,075 2,061 2,000 1,971 1,999 1,960 1,470 1,445 1,597 1,615 1,644 1,509 1,506 1,513 1,544 1,618 1,626 1,642 1,669 1,697 1,723 1,733 1,758 1,782 1,770 1,760 1,790 1,877 1,887 1,890 1,894 1,896 1,898 1,882 1,884 1,887 1,865 1,847 1,869 2,052 1,648 1,714 1,881 37 -404 67 167
North America 25,073 25,143 25,659 25,447 24,308 24,557 22,887 17,899 19,597 21,341 22,232 23,092 22,118 23,122 22,989 21,720 21,727 22,519 22,826 23,217 23,416 24,175 24,418 24,982 24,310 24,792 24,738 24,761 24,882 24,745 24,695 24,572 24,562 25,152 25,222 25,642 24,862 25,287 25,187 25,176 25,331 22,155 23,824 24,999 -30 -3,175 1,668 1,175Brazil 3,024 3,075 3,182 3,256 2,934 3,068 2,755 2,376 2,462 2,727 2,886 2,868 3,024 3,158 3,112 3,119 2,921 3,034 3,064 3,104 2,970 3,134 3,202 3,215 3,226 3,338 3,284 3,288 3,106 3,220 3,242 3,269 3,121 3,273 3,330 3,332 3,334 3,443 3,385 3,387 3,134 2,874 3,148 3,287 105 -260 274 138Chile 370 370 358 377 362 366 406 264 280 291 303 311 296 292 297 299 313 314 318 329 334 338 340 344 347 340 341 343 354 355 356 363 363 364 361 362 362 353 353 354 369 314 333 358 5 -55 20 25LatAm ex. Mexico, Brazil, Chile 3,120 3,190 3,186 3,140 3,260 3,240 3,071 2,701 2,641 2,744 2,844 2,878 2,912 2,839 2,862 2,876 2,903 2,914 2,935 3,014 3,046 3,076 3,141 3,168 3,190 3,099 3,110 3,119 3,152 3,159 3,165 3,217 3,221 3,224 3,259 3,263 3,266 3,165 3,168 3,172 3,159 2,906 3,060 3,203 -113 -253 154 143
LatAm ex. Mexico 6,514 6,635 6,726 6,773 6,556 6,674 6,232 5,342 5,383 5,762 6,033 6,056 6,232 6,290 6,270 6,294 6,137 6,262 6,317 6,448 6,349 6,549 6,683 6,727 6,763 6,777 6,735 6,750 6,611 6,735 6,762 6,849 6,705 6,861 6,951 6,957 6,962 6,960 6,906 6,912 6,662 6,094 6,541 6,848 -2 -568 448 306OECD Europe 14,032 14,200 14,682 14,095 13,438 13,920 12,698 10,346 10,895 11,996 12,668 12,818 12,573 12,301 10,824 10,867 11,957 12,224 11,933 12,798 12,540 12,789 13,742 13,515 13,708 13,597 13,377 13,084 13,457 13,686 13,204 13,675 13,243 13,361 14,181 13,849 13,967 13,814 13,562 13,250 14,252 12,112 12,939 13,604 -65 -2,140 827 666Non-OECD Europe 742 778 790 782 762 764 780 645 559 612 656 654 722 736 731 733 721 723 727 765 770 775 786 790 794 802 804 805 786 787 789 821 821 821 828 828 829 834 834 835 773 696 772 818 15 -77 76 46
Total Europe 14,774 14,978 15,472 14,877 14,200 14,684 13,478 10,991 11,454 12,608 13,324 13,472 13,295 13,037 11,555 11,600 12,678 12,947 12,660 13,563 13,310 13,564 14,527 14,305 14,502 14,399 14,181 13,889 14,244 14,474 13,993 14,496 14,064 14,183 15,008 14,677 14,795 14,648 14,396 14,085 15,025 12,808 13,710 14,422 -50 -2,217 902 712Japan 4,048 3,391 3,429 3,745 3,709 3,943 3,426 3,078 2,728 2,861 2,982 3,255 3,406 3,331 3,547 3,734 3,743 3,901 3,568 3,144 2,919 2,992 3,103 3,123 3,141 3,192 3,650 3,837 3,781 3,937 3,639 3,249 3,002 3,054 3,141 3,144 3,146 3,183 3,635 3,818 3,653 3,333 3,359 3,394 -135 -320 26 35South Korea 2,582 2,434 2,538 2,628 2,629 2,552 2,353 2,342 2,567 2,359 2,312 2,314 2,380 2,384 2,607 2,636 2,782 2,635 2,467 2,636 2,443 2,401 2,557 2,663 2,467 2,464 2,667 2,688 2,812 2,662 2,513 2,697 2,497 2,448 2,599 2,699 2,500 2,495 2,695 2,716 2,546 2,453 2,573 2,611 -22 -92 120 38Australia & New Zealand 1,354 1,342 1,343 1,386 1,310 1,361 1,298 957 982 1,218 1,206 1,230 1,132 1,154 1,165 1,171 1,156 1,163 1,179 1,192 1,212 1,231 1,274 1,289 1,301 1,328 1,334 1,338 1,320 1,324 1,326 1,322 1,325 1,327 1,353 1,355 1,357 1,378 1,380 1,382 1,356 1,182 1,250 1,346 -9 -174 68 96Israel 238 237 244 226 244 245 207 151 204 224 214 246 205 197 223 225 231 232 237 245 248 250 242 244 246 246 257 258 264 265 265 265 266 266 256 256 256 256 266 267 236 215 245 262 4 -21 29 18
OECD Asia Pacific 8,222 7,404 7,554 7,985 7,892 8,101 7,284 6,528 6,481 6,662 6,714 7,045 7,122 7,066 7,543 7,767 7,912 7,931 7,450 7,217 6,821 6,874 7,177 7,320 7,156 7,230 7,907 8,121 8,177 8,187 7,743 7,534 7,089 7,094 7,349 7,454 7,259 7,312 7,977 8,183 7,791 7,184 7,426 7,613 -161 -608 243 187China 13,740 13,586 13,901 14,400 13,688 10,238 12,790 13,724 14,910 14,759 14,961 14,913 15,315 15,195 15,093 15,087 15,088 14,438 14,890 15,224 15,210 15,259 15,161 15,113 15,415 15,295 15,393 15,387 15,638 15,338 15,240 15,774 15,560 15,809 15,411 15,363 15,665 15,395 15,643 16,037 13,907 14,223 15,156 15,573 722 316 933 417India 5,319 5,200 4,892 5,121 5,256 5,485 4,596 2,902 4,261 4,707 4,447 4,155 4,586 4,640 4,827 4,850 5,050 5,255 5,180 5,181 5,217 5,253 4,804 4,988 5,016 5,208 5,371 5,383 5,616 5,828 5,732 5,696 5,700 5,705 5,209 5,364 5,368 5,568 5,722 5,727 5,133 4,559 5,159 5,603 169 -574 600 444Other non-OECD Asia 9,218 9,248 8,945 9,209 9,154 8,935 8,634 7,805 7,833 7,975 8,331 8,198 8,324 8,568 8,623 8,653 8,826 8,851 8,901 8,878 8,953 9,026 9,100 9,161 9,213 9,465 9,489 9,508 9,666 9,681 9,693 9,613 9,620 9,626 9,636 9,643 9,650 9,879 9,886 9,893 9,155 8,419 9,114 9,707 99 -736 695 593
Total Asia 28,277 28,034 27,738 28,731 28,098 24,658 26,019 24,431 27,004 27,442 27,739 27,266 28,225 28,404 28,542 28,591 28,964 28,544 28,970 29,282 29,381 29,538 29,064 29,262 29,644 29,969 30,253 30,279 30,921 30,847 30,664 31,082 30,880 31,140 30,256 30,370 30,683 30,843 31,251 31,657 28,195 27,202 29,429 30,883 990 -993 2,228 1,454FSU 4,534 4,675 4,922 4,888 4,517 4,581 4,547 3,995 4,153 4,414 4,557 4,577 4,778 4,778 4,794 4,804 4,553 4,557 4,569 4,737 4,757 4,775 4,984 5,000 5,015 5,008 5,015 5,021 4,762 4,767 4,770 4,923 4,925 4,927 5,120 5,122 5,124 5,108 5,110 5,112 4,755 4,541 4,833 4,981 94 -214 291 148Total Middle East 8,096 8,163 8,795 8,355 8,301 7,960 7,258 7,084 7,103 7,239 7,709 7,660 7,711 7,257 7,308 7,332 7,467 7,494 7,544 7,528 7,593 7,656 8,319 8,375 8,415 7,841 7,864 7,884 7,984 7,997 8,004 7,976 7,982 7,989 8,685 8,691 8,697 8,138 8,145 8,151 8,352 7,494 7,832 8,203 41 -859 338 371Total Africa 4,332 4,317 4,170 4,288 4,402 4,414 4,285 4,162 3,365 3,726 3,776 3,848 3,794 4,006 4,029 4,048 4,200 4,208 4,222 4,176 4,205 4,232 4,120 4,145 4,167 4,373 4,383 4,392 4,557 4,565 4,571 4,503 4,506 4,509 4,366 4,369 4,371 4,568 4,571 4,573 4,277 3,988 4,235 4,502 5 -289 247 267OECD demand 47,697 47,117 48,253 47,904 46,000 46,944 43,275 35,037 37,253 40,290 41,917 43,266 42,110 42,782 41,652 40,653 41,909 42,988 42,526 43,562 43,111 44,176 45,677 46,161 45,521 45,959 46,364 46,309 46,871 46,974 45,998 46,144 45,257 45,971 47,113 47,307 46,450 46,766 47,079 46,963 47,743 41,765 44,522 46,574 -251 -5,978 2,757 2,053Non-OECD demand 52,125 52,232 52,783 53,439 52,273 48,684 48,715 45,395 47,288 48,904 50,166 49,751 51,165 51,178 51,379 51,504 51,728 51,473 52,032 52,607 52,720 53,187 53,616 53,955 54,451 54,431 54,712 54,787 55,267 55,342 55,204 55,791 55,456 55,883 55,844 55,975 56,305 56,098 56,463 56,886 52,645 49,700 53,308 55,876 1,139 -2,945 3,608 2,568
World Demand 99,822 99,349 101,036 101,343 98,273 95,628 91,991 80,432 84,541 89,194 92,083 93,017 93,275 93,961 93,031 92,156 93,638 94,461 94,558 96,169 95,831 97,363 99,292 100,116 99,973 100,390 101,076 101,096 102,138 102,316 101,201 101,935 100,714 101,854 102,957 103,282 102,755 102,864 103,543 103,850 100,388 91,465 97,830 102,451 888 -8,923 6,365 4,620
Glo
bal D
eman
d
Source: EIA, Goldman Sachs Global Investment Research, Woodmac, National Source, OPEC, IEA
Exhibit 87: GS Summary Oil Balance
Source: EIA, IEA, Goldman Sachs Global Investment Research, WoodMac, National Sources, OPEC
18 November 2020 51
Goldman Sachs 2021 Commodity Outlook
For t
he e
xclu
sive
use
of J
OSEP
H.ST
EIN@
GS.C
OM
7f10
0ca8
95df
11e0
bb43
0021
5ace
2648

Natural Gas
Exhibit 88: US Natural Gas Supply & Demand Under Forward Prices as of Nov 16, 2020 Bcf/d; storage, Bcf
ProductionNet
Canadian imports
LNG imports
Balancing term
Total supply
Net Mexican exports
LNG exports
ResComm
demand
Industrial demand
Power Demand
Vehicle fuel cons.
Lease and plant cons.
Pipeline and dist.
use
Total demand Storage
Nov-19 94.9 4.3 0.0 1.0 100.1 5.3 7.2 32.6 24.5 27.3 0.1 5.3 2.8 105.1 3,575Dec-19 94.3 4.4 0.0 2.1 100.7 4.9 7.9 39.0 25.1 28.9 0.1 5.3 3.1 114.3 3,156Jan-20 93.4 4.8 0.0 3.4 101.7 5.2 8.5 42.2 25.5 30.0 0.1 5.2 3.2 120.0 2,588Feb-20 92.7 5.3 0.0 1.9 99.9 5.2 8.6 40.6 25.2 30.3 0.1 5.2 3.2 118.3 2,055Mar-20 93.1 4.1 0.0 2.5 99.7 5.4 8.6 27.8 23.2 28.3 0.1 5.2 2.7 101.3 2,006Apr-20 92.2 3.9 0.0 1.6 97.8 4.6 8.3 20.4 21.5 25.5 0.1 5.1 2.3 87.7 2,310May-20 87.4 3.8 0.0 1.2 92.5 4.7 6.7 12.8 20.2 26.9 0.1 4.8 2.0 78.2 2,754Jun-20 86.9 3.9 0.0 1.6 92.4 5.4 4.1 8.9 20.2 34.8 0.1 4.9 2.2 80.7 3,108Jul-20 88.2 4.4 0.0 2.1 94.7 5.8 3.3 8.0 20.7 44.3 0.1 4.9 2.4 89.5 3,266Aug-20 88.3 4.8 0.0 1.8 94.9 6.0 4.0 7.8 21.1 41.3 0.1 5.0 2.4 87.6 3,493Sep-20 87.6 3.8 0.0 1.0 92.4 6.1 5.9 8.5 20.7 33.4 0.1 4.9 2.1 81.9 3,810Oct-20 87.2 4.3 0.0 -0.3 91.2 5.7 8.0 14.6 21.6 30.5 0.1 4.9 2.2 87.5 3,923Nov-20 88.8 4.8 0.0 0.1 93.7 5.6 10.1 26.8 22.7 25.2 0.1 5.0 2.5 98.0 3,793Dec-20 89.6 5.8 0.3 1.2 96.8 5.6 10.0 40.3 24.7 26.5 0.1 5.0 3.1 115.4 3,219Jan-21 90.1 5.8 0.3 2.0 98.2 5.6 10.1 47.5 26.0 27.9 0.1 5.1 3.4 125.6 2,370Feb-21 90.0 5.3 0.2 2.4 97.9 5.6 10.2 43.3 25.5 27.6 0.1 5.0 3.2 120.6 1,733Mar-21 89.6 5.1 0.0 1.8 96.4 5.7 10.3 30.8 23.7 26.2 0.1 5.0 2.7 104.6 1,480Apr-21 89.4 4.8 0.0 1.2 95.4 5.8 9.9 18.9 22.8 26.3 0.1 5.0 2.3 91.0 1,610May-21 89.4 4.8 0.0 0.5 94.7 6.0 10.0 11.4 21.7 28.8 0.1 5.0 2.1 85.2 1,903Jun-21 89.4 4.8 0.0 1.2 95.4 6.6 10.0 8.6 21.4 34.4 0.1 5.0 2.2 88.3 2,115Jul-21 89.6 4.8 0.0 1.4 95.7 6.6 10.0 7.4 21.3 39.0 0.1 5.0 2.3 91.9 2,232Aug-21 89.8 4.8 0.0 1.2 95.8 6.6 9.7 7.4 21.7 38.3 0.1 5.0 2.3 91.2 2,375Sep-21 89.8 4.8 0.0 1.1 95.7 6.4 9.7 8.2 21.7 34.2 0.1 5.0 2.1 87.4 2,624Oct-21 90.8 4.8 0.1 -0.1 95.6 6.2 10.7 13.7 22.4 28.8 0.1 5.1 2.2 89.2 2,822Nov-21 91.3 5.1 0.1 0.2 96.6 6.3 10.7 30.5 24.7 27.1 0.1 5.1 2.8 107.3 2,503Dec-21 91.8 5.8 0.3 1.2 99.0 6.1 10.7 40.3 25.4 27.1 0.1 5.2 3.1 118.1 1,912
Build/drawWinter19/20 93.7 4.6 0.0 2.2 100.4 5.2 8.1 36.4 24.7 29.0 0.1 5.2 3.0 111.8 -1,719
Summer 2020 88.3 4.1 0.0 1.3 93.7 5.5 5.8 11.6 20.8 33.8 0.1 4.9 2.2 84.7 1,917Winter 20/21 89.6 5.3 0.2 1.5 96.6 5.6 10.1 37.7 24.5 26.7 0.1 5.0 3.0 112.8 -2,443
Summer 2021 89.7 4.8 0.0 0.9 95.5 6.3 10.0 10.8 21.9 32.8 0.1 5.0 2.2 89.2 1,343End-Oct
Cal 19 90.8 4.7 0.1 1.7 97.3 5.1 5.7 23.5 23.1 30.9 0.1 5.1 2.6 96.1 3726Cal 20 89.6 4.5 0.0 1.5 95.6 5.4 7.2 21.5 22.3 31.4 0.1 5.0 2.5 95.5 3923Cal 21 90.1 5.0 0.1 1.2 96.4 6.1 10.2 22.3 23.2 30.5 0.1 5.1 2.5 100.0 2822
YOYWinter19/20 5.2 -0.3 -0.3 0.5 5.1 0.4 3.7 -4.1 -0.3 2.9 0.0 0.3 0.0 2.8
Summer 2020 -2.5 -0.4 0.0 -0.3 -3.3 0.2 0.1 0.1 -0.8 0.3 0.0 -0.2 0.0 -0.2Winter 20/21 -4.0 0.7 0.2 -0.7 -3.8 0.5 2.0 1.3 -0.2 -2.3 0.0 -0.2 0.0 1.1
Summer 2021 1.5 0.6 0.0 -0.4 1.7 0.8 4.2 -0.8 1.0 -1.0 0.0 0.1 0.0 4.5
Cal 19 7.6 -0.7 0.0 0.8 7.6 0.5 2.3 0.1 0.0 2.0 0.0 0.4 0.2 5.4Cal 20 -1.2 -0.2 -0.1 -0.2 -1.7 0.3 1.5 -1.9 -0.8 0.5 0.0 -0.1 -0.1 -0.6Cal 21 0.5 0.5 0.1 -0.3 0.7 0.7 3.0 0.8 0.9 -1.0 0.0 0.1 0.0 4.5
Source: EIA, Platts, Wood Mackenzie, Morningstar, Haver Analytics, VelocitySuite, Radiant Solution, Bloomberg, Goldman Sachs Global Investment Research
18 November 2020 52
Goldman Sachs 2021 Commodity Outlook
For t
he e
xclu
sive
use
of J
OSEP
H.ST
EIN@
GS.C
OM
7f10
0ca8
95df
11e0
bb43
0021
5ace
2648

Exhibit 89: US Natural Gas Supply & Demand Under GS Price Forecasts Bcf/d; Storage, Bcf
ProductionNet
Canadian imports
LNG imports
Balancing term
Total supply
Net Mexican exports
LNG exports
ResComm
demand
Industrial demand
Power Demand
Vehicle fuel cons.
Lease and plant cons.
Pipeline and dist.
use
Total demand Storage
Nov-19 94.9 4.3 0.0 1.0 100.1 5.3 7.2 32.6 24.5 27.3 0.1 5.3 2.8 105.1 3,575Dec-19 94.3 4.4 0.0 2.1 100.7 4.9 7.9 39.0 25.1 28.9 0.1 5.3 3.1 114.3 3,156Jan-20 93.4 4.8 0.0 3.4 101.7 5.2 8.5 42.2 25.5 30.0 0.1 5.2 3.2 120.0 2,588Feb-20 92.7 5.3 0.0 1.9 99.9 5.2 8.6 40.6 25.2 30.3 0.1 5.2 3.2 118.3 2,055Mar-20 93.1 4.1 0.0 2.5 99.7 5.4 8.6 27.8 23.2 28.3 0.1 5.2 2.7 101.3 2,006Apr-20 92.2 3.9 0.0 1.6 97.8 4.6 8.3 20.4 21.5 25.5 0.1 5.1 2.3 87.7 2,310May-20 87.4 3.8 0.0 1.2 92.5 4.7 6.7 12.8 20.2 26.9 0.1 4.8 2.0 78.2 2,754Jun-20 86.9 3.9 0.0 1.6 92.4 5.4 4.1 8.9 20.2 34.8 0.1 4.9 2.2 80.7 3,108Jul-20 88.2 4.4 0.0 2.1 94.7 5.8 3.3 8.0 20.7 44.3 0.1 4.9 2.4 89.5 3,266Aug-20 88.3 4.8 0.0 1.8 94.9 6.0 4.0 7.8 21.1 41.3 0.1 5.0 2.4 87.6 3,493Sep-20 87.6 3.8 0.0 1.0 92.4 6.1 5.9 8.5 20.7 33.4 0.1 4.9 2.1 81.9 3,810Oct-20 87.2 4.3 0.0 -0.3 91.2 5.7 8.0 14.6 21.6 30.5 0.1 4.9 2.2 87.5 3,923Nov-20 88.8 4.8 0.0 0.1 93.7 5.6 10.1 26.8 22.7 24.4 0.1 5.0 2.5 97.2 3,819Dec-20 89.6 6.7 0.3 1.2 97.7 5.6 10.0 40.3 24.7 25.0 0.1 5.0 3.0 113.8 3,321Jan-21 90.1 6.7 0.3 2.0 99.1 5.6 10.1 47.5 26.0 26.3 0.1 5.1 3.3 124.0 2,550Feb-21 90.0 6.2 0.2 2.4 98.8 5.6 10.2 43.3 25.5 25.9 0.1 5.0 3.2 118.8 1,988Mar-21 89.6 6.0 0.0 1.8 97.3 5.7 10.3 30.8 23.7 25.0 0.1 5.0 2.7 103.3 1,803Apr-21 89.7 5.7 0.0 1.2 96.5 5.8 9.9 18.9 22.8 25.0 0.1 5.0 2.2 89.7 2,005May-21 89.9 5.7 0.0 0.5 96.0 6.0 10.0 11.4 21.7 27.7 0.1 5.0 2.0 84.0 2,378Jun-21 90.0 5.7 0.0 1.2 96.9 6.6 10.0 8.6 21.4 33.4 0.1 5.1 2.1 87.3 2,665Jul-21 90.4 5.7 0.0 1.4 97.5 6.6 10.0 7.4 21.3 38.1 0.1 5.1 2.2 90.9 2,867Aug-21 90.8 5.7 0.0 1.2 97.6 6.6 9.7 7.4 21.7 37.3 0.1 5.1 2.2 90.1 3,100Sep-21 90.9 5.7 0.0 1.1 97.7 6.4 9.7 8.2 21.7 33.3 0.1 5.1 2.1 86.5 3,435Oct-21 92.1 5.7 0.1 -0.1 97.8 6.2 10.7 13.7 22.4 29.3 0.1 5.2 2.2 89.8 3,685Nov-21 92.7 5.1 0.1 0.2 98.0 6.3 10.7 30.5 24.7 27.9 0.1 5.2 2.8 108.2 3,380Dec-21 93.4 5.8 0.3 1.2 100.6 6.1 10.7 40.3 25.4 28.1 0.1 5.2 3.1 119.3 2,802
Build/drawWinter19/20 93.7 4.6 0.0 2.2 100.4 5.2 8.1 36.4 24.7 29.0 0.1 5.2 3.0 111.8 -1,719
Summer 2020 88.3 4.1 0.0 1.3 93.7 5.5 5.8 11.6 20.8 33.8 0.1 4.9 2.2 84.7 1,917Winter 20/21 89.6 6.0 0.2 1.5 97.3 5.6 10.1 37.7 24.5 25.3 0.1 5.0 2.9 111.4 -2,120
Summer 2021 90.5 5.7 0.0 0.9 97.1 6.3 10.0 10.8 21.9 32.0 0.1 5.1 2.2 88.3 1,882End-Oct
Cal 19 90.8 4.7 0.1 1.7 97.3 5.1 5.7 23.5 23.1 30.9 0.1 5.1 2.6 96.1 3726Cal 20 89.6 4.6 0.0 1.5 95.7 5.4 7.2 21.5 22.3 31.2 0.1 5.0 2.5 95.3 3923Cal 21 90.8 5.8 0.1 1.2 97.8 6.1 10.2 22.3 23.2 29.8 0.1 5.1 2.5 99.3 3685
YOYWinter19/20 5.2 -0.3 -0.3 0.5 5.1 0.4 3.7 -4.1 -0.3 2.9 0.0 0.3 0.0 2.8
Summer 2020 -2.5 -0.4 0.0 -0.3 -3.3 0.2 0.1 0.1 -0.8 0.3 0.0 -0.2 0.0 -0.2Winter 20/21 -4.0 1.5 0.2 -0.7 -3.1 0.5 2.0 1.3 -0.2 -3.7 0.0 -0.2 -0.1 -0.4
Summer 2021 2.3 1.5 0.0 -0.4 3.4 0.8 4.2 -0.8 1.0 -1.8 0.0 0.2 -0.1 3.6
Cal 19 7.6 -0.7 0.0 0.8 7.6 0.5 2.3 0.1 0.0 2.0 0.0 0.4 0.2 5.4Cal 20 -1.2 -0.1 -0.1 -0.2 -1.6 0.3 1.5 -1.9 -0.8 0.3 0.0 -0.1 -0.1 -0.8Cal 21 1.2 1.2 0.1 -0.3 2.1 0.7 3.0 0.8 0.9 -1.5 0.0 0.1 0.0 4.0
Source: EIA, Platts, Wood Mackenzie, Morningstar, Haver Analytics, VelocitySuite, Radiant Solution, Bloomberg, Goldman Sachs Global Investment Research
18 November 2020 53
Goldman Sachs 2021 Commodity Outlook
For t
he e
xclu
sive
use
of J
OSEP
H.ST
EIN@
GS.C
OM
7f10
0ca8
95df
11e0
bb43
0021
5ace
2648

Exhibit 90: NW Europe Natural Gas Supply & Demand mcm/d; storage, Bcm
UK production
Netherlands production
Norwegian pipeline imports
Net Russian pipeline imports
Net LNG imports
Total Supply
LDC demand
Industrial demand
Power demand *
Pipeline exports to Southern
Europe
Other exports
Total demand
Balancing item Storage (Bcm)
Jan-19 109 137 340 224 129 940 713 68 365 54 2 1202 -58 29.8Feb-19 105 114 335 211 126 892 586 65 324 57 3 1034 -70 23.9Mar-19 104 114 330 197 182 927 487 60 279 55 3 884 -53 23.5Apr-19 102 78 309 179 213 881 353 54 265 59 2 733 -3 27.9May-19 102 70 287 160 177 797 268 53 260 51 2 633 8 33.2Jun-19 87 54 285 150 115 691 149 50 240 54 1 493 20 39.7Jul-19 89 48 284 103 83 606 122 49 260 56 1 488 24 44.1Aug-19 84 51 237 141 68 580 119 44 236 44 1 445 32 49.3Sep-19 93 58 170 172 77 570 173 48 263 37 4 524 13 51.1Oct-19 100 69 272 199 127 768 317 51 299 58 10 736 -6 51.9Nov-19 114 117 306 222 214 974 549 65 330 26 13 983 -60 49.8Dec-19 110 122 320 222 196 970 604 63 295 22 12 995 -67 46.9Jan-20 109 117 312 155 173 865 622 65 324 56 8 1075 -79 38.0Feb-20 105 114 314 154 176 863 583 63 287 52 9 994 -81 31.8Mar-20 100 83 321 124 195 823 523 58 278 44 9 912 -43 27.7Apr-20 107 76 278 132 202 795 285 47 214 51 8 606 1 33.4May-20 106 67 246 120 185 724 214 52 215 51 9 541 10 39.4Jun-20 98 54 269 123 80 624 149 48 241 43 8 490 -9 43.2Jul-20 97 43 280 56 76 552 136 51 255 44 9 495 0 44.9Aug-20 82 41 259 111 70 563 119 45 255 35 7 461 0 48.1Sep-20 79 43 265 144 68 599 177 50 261 27 7 523 -17 49.8Oct-20 100 68 280 205 74 728 353 61 269 9 8 699 -28 49.9Nov-20 97 62 319 217 114 808 484 63 302 10 8 867 -35 47.5Dec-20 111 112 337 215 122 897 653 63 328 30 10 1083 -45 40.3Jan-21 116 107 337 220 129 910 739 66 353 50 9 1217 -59 29.0Feb-21 112 104 340 205 154 914 721 66 326 50 8 1170 -69 19.9Mar-21 111 73 333 190 154 861 536 61 307 50 8 962 -41 15.5Apr-21 109 66 270 178 160 783 328 54 278 50 8 717 2 17.5May-21 109 54 248 160 133 705 234 56 246 50 8 595 12 21.3Jun-21 94 42 257 150 129 672 151 51 234 49 8 492 9 27.0Jul-21 96 36 301 128 109 670 106 53 239 48 8 454 16 34.2Aug-21 91 39 272 140 66 607 120 47 242 44 8 461 17 39.2Sep-21 97 43 274 172 101 687 185 51 257 36 8 537 12 44.1Oct-21 104 60 300 198 177 839 310 62 283 35 9 699 -17 47.9Nov-21 109 78 338 220 144 889 508 66 331 31 9 944 -46 44.9Dec-21 111 104 339 225 100 879 623 65 333 34 10 1066 -45 37.7
End of winter 19/20 108 110 314 176 191 899 576 63 303 40 10 992 -66 27.7
summer 2020 96 56 268 127 108 655 205 51 244 37 8 545 -6 49.9winter 20/21 110 91 333 209 135 878 626 64 323 38 9 1060 -50 15.5
summer 2021 100 48 275 161 125 709 205 53 254 44 8 565 7 47.9yoy
winter 19/20 3 -11 -13 -39 56 -4 -2 -1 -16 -7 8 -18 -12 4summer 2020 2 -5 5 -30 -15 -44 -10 1 -16 -14 5 -34 -19 -2winter 20/21 2 -19 19 34 -56 -21 50 1 20 -2 -2 68 16 -12
summer 2021 5 -8 6 34 17 54 0 3 10 7 0 20 14 -2
FootnotesComponents in mcm/d; Storage in Bcm
Balance does not include heavy Norwegian maintenance in 2020, only what’s been scheduled* Power demand includes Netherland and Germany industrial demand, as well as a portion of Belgium industrial demand
Source: Bloomberg, Goldman Sachs Global Investment Research
18 November 2020 54
Goldman Sachs 2021 Commodity Outlook
For t
he e
xclu
sive
use
of J
OSEP
H.ST
EIN@
GS.C
OM
7f10
0ca8
95df
11e0
bb43
0021
5ace
2648

Exhibit 91: Global LNG Supply & Demand mtpa
2015 2016 2017 2018 2019E 2020E 2021E 2022E 2023E 2024E 2025E yoy 19 yoy20 yoy21 yoy 22 yoy 23 yoy 24 yoy 25Qatar 81 80 79 79 80 79 79 79 79 79 89 0.8 -0.5 -0.3 0.0 0.0 0.0 9.6 QatarAustralia 30 45 57 70 79 80 81 81 78 77 77 8.4 1.4 0.6 0.3 -3.1 -0.5 -0.3 AustraliaUnited States 1 3 14 23 37 49 70 74 80 84 90 14.0 12.0 21.5 3.8 6.3 3.1 6.2 United StatesRussia 11 11 11 19 30 30 30 31 31 36 44 10.9 0.2 -0.7 1.8 0.0 4.3 7.8 RussiaMalaysia 25 25 27 25 26 24 27 27 27 27 27 1.8 -2.7 2.7 0.1 0.0 0.0 0.0 MalaysiaNigeria 21 18 21 20 22 22 21 21 21 21 21 1.1 0.1 -1.0 0.0 0.0 0.0 0.1 NigeriaIndonesia 17 17 17 16 13 13 12 12 12 12 12 -3.3 0.2 -0.5 0.1 0.2 -0.1 -0.3 IndonesiaTrinidad 14 12 11 13 14 12 13 13 13 13 13 0.6 -2.0 1.4 0.0 0.0 0.0 0.0 TrinidadAlgeria 12 12 13 10 13 11 12 13 13 13 13 2.3 -1.7 1.0 0.5 0.0 0.0 0.0 AlgeriaMozambique 0 0 0 0 0 0 0 1 3 3 9 0.0 0.0 0.0 1.0 2.0 0.5 5.5 MozambiqueCanada 0 0 0 0 0 0 0 0 0 0 2 0.0 0.0 0.0 0.0 0.0 0.0 1.5 CanadaRoW Supply 41 42 46 48 52 48 49 54 55 57 60 3.8 -3.9 0.8 4.9 0.9 2.8 2.6 RoW Supply
World Supply 252 264 296 324 365 368 393 406 412 422 454 40.3 3.1 25.4 12.5 6.2 10.0 32.6 TotalAsia 180 189 215 245 251 261 280 301 316 330 346 6.4 9.6 19.6 20.8 15.2 13.5 16.2 Asia
Japan 87 84 86 86 79 76 78 81 77 76 78 -6.4 -3.0 1.9 2.4 -3.7 -0.7 1.4 JapanSouth Korea 34 34 39 46 42 43 42 40 40 42 44 -3.6 0.5 -0.7 -2.1 0.4 1.8 2.4 South KoreaChina 20 28 40 56 64 71 83 94 103 109 115 7.9 7.0 11.6 10.6 9.5 6.4 5.7 ChinaIndia 16 19 20 23 25 28 30 34 38 40 41 1.5 3.1 2.2 4.2 4.1 1.7 0.9 IndiaTaiwan 15 15 17 17 17 18 18 19 20 21 23 -0.4 1.5 0.1 0.5 1.0 1.0 1.7 TaiwanPak-Ban 1 3 5 8 12 12 14 15 15 15 15 4.6 -0.6 2.3 0.9 0.2 0.0 0.0 Pak-BanSE Asia 6 6 8 9 11 12 15 19 23 26 30 2.7 1.2 2.2 4.3 3.9 3.3 4.2 SE Asia
Middle East 10 18 16 10 7 7 7 9 11 12 13 -3.2 0.0 0.4 1.8 1.8 1.0 0.8 Middle EastOECD Europe 39 39 47 50 89 87 91 80 69 64 80 39.0 -2.6 4.2 -11.4 -10.7 -4.4 15.7 OECD EuropeSouth America 13 9 9 8 7 6 6 6 6 6 6 -1.7 -0.7 0.1 -0.3 0.0 -0.2 0.0 South AmericaCentral & North America 10 9 9 10 10 7 8 8 7 7 7 0.1 -3.3 0.8 -0.1 -0.6 -0.2 0.0 Central & North AmericaRoW Demand 0 0 0 1 0 0 1 2 3 3 3 -0.2 -0.1 0.2 1.6 0.5 0.2 0.0 RoW Demand
World Demand 252 264 296 324 365 368 393 406 412 422 454 40.3 3.1 25.4 12.5 6.2 10.0 32.6 Total
Footnote1. RoW supply = Angola, Brunei, Cameroon, Egypt, Equatorial Guinea, Norway, Oman, Papua New Guinea, Peru, UAE, Yemen, Argentina, Mauritania2. SE Asia = Malaysia, Philippines, Singapore, Thailand, Myammar, Sri Lanka, Vietnam, Hong Kong3. Middle East = Bahrain, Egypt, Israel, Jordan, Kuwait4. Row demand = Cyprus, Malta, Papua New Guinea, Russia, Ukraine, Ghana5. We use a conversion factor of 0.45 from cubic meter to mt6. Australia, Indonesia and UAE exports are now calculated net of imports
Supp
ly
Supp
ly
Dem
and
Dem
and
Source: Kpler, Goldman Sachs Global Investment Research
18 November 2020 55
Goldman Sachs 2021 Commodity Outlook
For t
he e
xclu
sive
use
of J
OSEP
H.ST
EIN@
GS.C
OM
7f10
0ca8
95df
11e0
bb43
0021
5ace
2648

Base Metals
Exhibit 92: Aluminium Supply and Demand Model kmt
Consumption - DMUS 4842 4928 5128 5391 5490 5547 5519 5382 4897 5264 5528 5594
% change y/y 11.6% 1.8% 4.0% 5.1% 1.8% 0.5% -0.5% -2.5% -9.0% 7.5% 5.0% 1.2%Europe 7995 8093 8234 8359 8606 8924 9102 8920 7939 8495 8919 9098
% change y/y 0.1% 1.2% 1.7% 1.5% 3.0% 3.7% 2.0% -2.0% -11.0% 7.0% 5.0% 2.0%Japan 2166 1997 2108 2012 2080 2154 2180 2071 1802 1928 2005 2045
% change y/y 1.3% -7.8% 5.5% -4.5% 3.4% 3.6% 1.2% -5.0% -13.0% 7.0% 4.0% 2.0%Other DM 2789 2794 2945 3010 3088 3167 3164 3069 2701 2917 3063 3096
% change y/y -0.6% 0.2% 5.4% 2.2% 2.6% 2.6% -0.1% -3.0% -12.0% 8.0% 5.0% 1.1%Sub-Total DM 17791 17812 18415 18772 19264 19792 19966 19442 17339 18604 19515 19833
% change y/y 3.0% 0.1% 3.4% 1.9% 2.6% 2.7% 0.9% -2.6% -10.8% 7.3% 4.9% 1.6%
Consumption - EMChina 21719 24282 27147 29373 31664 34419 35796 36154 37587 38509 39019 39698
% change y/y 11.5% 11.8% 11.8% 8.2% 7.8% 8.7% 4.0% 1.0% 4.0% 2.5% 1.3% 1.7%Other EM 7795 8028 8236 8592 8874 9237 9422 9233 8033 8555 9069 9422
% change y/y 3.2% 3.0% 2.6% 4.3% 3.3% 4.1% 2.0% -2.0% -13.0% 6.5% 6.0% 3.9%Sub-Total EM 29514 32310 35383 37966 40538 43656 45218 45387 45620 47065 48087 49120
% change y/y 9.2% 9.5% 9.5% 7.3% 6.8% 7.7% 3.6% 0.4% 0.5% 3.2% 2.2% 2.1%
Total Global Consumption 47305 50122 53798 56738 59802 63449 65184 64829 62959 65668 67602 68954% change y/y 6.8% 6.0% 7.3% 5.5% 5.4% 6.1% 2.7% -0.5% -2.9% 4.3% 2.9% 2.0%
Total Global ProductionChina Production 23089 25372 28623 30995 32393 36580 36002 35563 36717 38117 39017 39300
% change y/y 15.2% 9.9% 12.8% 8.3% 4.5% 12.9% -1.6% -1.2% 3.2% 3.8% 2.4% 0.7%Ex-China Production 25702 25704 25816 26213 26909 27446 27701 28077 27999 28157 28495 28793
% change y/y -2.5% 0.0% 0.4% 1.5% 2.7% 2.0% 0.9% 1.4% -0.3% 0.6% 1.2% 1.0%Total Production 48791 51075 54439 57208 59302 64026 63702 63640 64717 66274 67512 68093
% change y/y 5.2% 4.7% 6.6% 5.1% 3.7% 8.0% -0.5% -0.1% 1.7% 2.4% 1.9% 0.9%
1486 953 641 470 -499 578 -1481 -1189 1758 606 -90 -860
Cash Prices (annual average)Current Dollars ($/t) 2022 1846 1868 1662 1605 1968 2111 1775 1712 2063 2100 2100Current Dollars (c/lb) 92 84 85 75 73 89 96 81 78 94 95 95
Global Supply/Demand Balance
2020E(’000 tonnes) 2012 2013 2014 2015 2016 2017 2018 2019 2021E 2022E 2023E
Source: Wood Mackenzie, CRU, Goldman Sachs Global Investment Research
18 November 2020 56
Goldman Sachs 2021 Commodity Outlook
For t
he e
xclu
sive
use
of J
OSEP
H.ST
EIN@
GS.C
OM
7f10
0ca8
95df
11e0
bb43
0021
5ace
2648

Exhibit 93: Nickle Supply and Demand Model kmt
('000 tonnes) 2012 2013 2014 2015 2016 2017 2018 2019 2020E 2021E 2022E 2023ECONSUMPTION - Developed Markets
USA 122 121 138 127 119 136 138 144 124 134 142 147 % change y/y -0.5 -1.3 14.4 -8.3 -5.7 14.3 1.4 4.1 -14.0 8.0 6.0 4.0Japan 129 129 139 136 142 146 154 152 134 144 153 161 % change y/y -3.5 -0.1 7.5 -1.8 4.3 2.8 5.4 -1.1 -12.0 8.0 6.0 5.0Europe 345 332 331 322 330 332 339 326 284 305 320 336 % change y/y -2.5 -3.7 -0.1 -2.8 6.0 0.6 2.1 -3.8 -13.0 7.5 5.0 5.0Other DM 134 128 135 142 165 164 165 158 141 149 157 163 % change y/y -2.4 -4.8 5.4 5.7 16.0 -0.5 2.5 -4.0 -11.0 6.0 5.0 4.0Sub-Total DM 731 709 743 727 757 779 796 782 682 733 772 808 % change y/y -2.3 -2.9 4.7 -2.1 4.0 2.9 2.2 -1.7 -12.8 7.4 5.4 4.6
CONSUMPTION - Emerging MarketsChina 781 929 979 1020 1155 1183 1183 1320 1380 1422 1463 1504Indonesia 0 0 0 0 2 52 156 178 201 360 400 420
China & Indonsia 781 929 979 1020 1157 1235 1339 1498 1581 1782 1863 1924 % change y/y 6.8 19.0 5.4 4.2 13.4 6.8 8.4 11.9 5.5 12.7 4.5 3.3Other EM 134 146 138 143 165 170 158 148 135 145 155 175 % change y/y 6.5 8.9 -5.2 3.4 15.4 3.0 -7.1 -6.3 -8.8 7.4 6.9 12.7Sub-Total EM 915 1075 1117 1163 1322 1405 1497 1646 1716 1927 2018 2099 % change y/y 6.8 17.5 3.9 4.1 13.6 6.3 6.5 10.0 4.3 12.3 4.7 4.0
Total Global Consumption 1645 1784 1860 1890 2078 2184 2293 2428 2398 2660 2790 2906 % change y/y 2.5 8.5 4.3 1.6 9.9 5.1 5.0 5.9 -1.2 10.9 4.9 4.2World ex-China ex-Indonesia 865 855 881 870 922 949 954 930 817 878 927 982 % change y/y -1.1 -1.1 3.0 -1.3 5.9 3.0 0.5 -2.5 -12.2 7.4 5.6 6.0
SUPPLYGlobal Primary Production 1708 2022 2006 2012 2048 2132 2245 2421 2559 2723 2851 2953 % change 6.4 18.4 -0.8 0.3 1.8 4.1 5 8 5.7 6.4 4.7 3.6
China 447 740 698 627 615 666 714 878 843 776 773 760 % change 11.4 65.7 -5.7 -10.2 -1.8 8.3 7 23 -4.0 -7.9 -0.4 -1.7Indonesia 18 21 21 47 119 203 264 373 592 793 893 927 % change -6.7 16.2 -2.3 127.4 151.6 69.9 30 41 58.7 34.0 12.7 3.8ex-China & Indonesia 1243 1260 1287 1338 1313 1263 1267 1170 1124 1154 1185 1266 % change 5.0 1.4 2.1 4.0 -1.9 -3.9 0 -8 -3.9 2.7 2.6 6.9
Forecasted market adjustmentBALANCE 62 237 145 122 -31 -52 -48 -7 161 64 61 47
PRICESCash (annual average; $/t) 17528 15012 16889 11835 9606 10405 13200 13911 13796 16125 16000 16000Cash (annual average; c/lb) 795 681 766 537 436 472 599 631 626 731 726 726
Source: Goldman Sachs Global Investment Research
18 November 2020 57
Goldman Sachs 2021 Commodity Outlook
For t
he e
xclu
sive
use
of J
OSEP
H.ST
EIN@
GS.C
OM
7f10
0ca8
95df
11e0
bb43
0021
5ace
2648

Exhibit 94: Copper Supply and Demand Model kmt
Consumption - DMUS 2081 2117 2102 2104 2107 2113 2127 2155 1983 2112 2228 2339
% change y/y -0.3% 1.7% -0.7% 0.1% 0.1% 0.3% 0.7% 1.3% -8.0% 6.5% 5.5% 5.0%Europe 5130 5125 5186 5026 5040 5166 5259 5047 4542 4860 5079 5231
% change y/y -5.8% -0.1% 1.2% -3.1% 0.3% 2.5% 1.8% -4.0% -10.0% 7.0% 4.5% 3.0%Japan 1427 1438 1503 1433 1405 1458 1450 1392 1225 1323 1363 1404
% change y/y -2.7% 0.8% 4.5% -4.7% -2.0% 3.7% -0.6% -4.0% -12.0% 8.0% 3.0% 3.0%Other DM 2339 2361 2313 2252 2279 2328 2234 2089 1839 2004 2064 2106
% change y/y -6.2% 0.9% -2.0% -2.6% 1.2% 2.2% -4.1% -6.5% -12.0% 9.0% 3.0% 2.0%Sub- DM 10977 11041 11104 10815 10831 11065 11069 10683 9589 10299 10734 11079
% change y/y -4.5% 0.6% 0.6% -2.6% 0.1% 2.2% 0.0% -3.5% -10.2% 7.4% 4.2% 3.2%Consumption - EM
China 10650 11525 12155 12435 12816 13326 13710 13930 14209 14664 15016 15316% change y/y 5.8% 8.2% 5.5% 2.3% 3.1% 4.0% 2.9% 0.5% 2.0% 3.2% 2.4% 2.0%
Other EM 4329 4366 4522 4620 4691 4769 4883 4963 4466 4779 4946 5144% change y/y 1.6% 0.8% 3.6% 2.2% 1.5% 1.7% 2.4% 1.6% -10.0% 7.0% 3.5% 4.0%
Sub- EM 14979 15891 16677 17055 17508 18095 18593 18893 18675 19443 19962 20460% change y/y 4.5% 6.1% 4.9% 2.3% 2.7% 3.4% 2.7% 1.6% -1.2% 4.1% 2.7% 2.5%
Global Consumption 25957 26932 27781 27870 28338 29160 29662 29576 28264 29742 30695 31539Direct Global Scrap Use 6370 6207 6153 5940 5756 6106 6136 6047 5140 5962 6135 6286Refined Global Consumption 19586 20725 21628 21930 22583 23054 23526 23529 23124 23779 24560 25254
% change y/y -0.1% 5.8% 4.4% 1.4% 3.0% 2.1% 2.0% 0.0% -1.7% 2.8% 3.3% 2.8%
Global Production
Mine Production 16650 18028 18485 19231 20220 20118 20786 20929 20435 21039 22117 22705% change y/y 3.7% 8.3% 2.5% 4.0% 5.1% -0.5% 3.3% 0.7% -2.4% 3.0% 5.1% 2.7%
Refined Copper 20146 20780 21755 22031 22742 22992 23472 23377 23119 23371 24473 25273% change y/y 2.0% 3.1% 4.7% 1.3% 3.2% 1.1% 2.1% -0.4% -0.3% 1.1% 4.7% 3.3%
Global Balance 560 55 127 101 159 -62 -54 -152 -5 -409 -87 20
Cash Prices (annual average)Current Dollars ($/t) 7949 7322 6862 5494 4862 6166 6532 6000 6000 7300 7500 7500Current Dollars (c/lb) 361 332 311 249 221 280 296 272 272 331 340 340
2021E 2022E 2023E2020E(’000 tonnes) 2012 2013 2014 2015 2016 2017 2018 2019
Source: Goldman Sachs Global Investment Research, Wood, Mackenzie
18 November 2020 58
Goldman Sachs 2021 Commodity Outlook
For t
he e
xclu
sive
use
of J
OSEP
H.ST
EIN@
GS.C
OM
7f10
0ca8
95df
11e0
bb43
0021
5ace
2648

Appendix
To calculate the commodity demand intensity of a by – decile consumption bundle, we use the BEA’s Supply and Use Table for the US economy in 2012 and the BLS by-decile consumption of PCE goods from the Consumer Expenditure Survey.
From the BEA Industry Use Commodity by commodity table we draw a vector of commodity use in $ terms. We generate the inverse Leontief as below from the Industry by Industry Input Output matrix. We then generate a mapping from the BEA industries to the PCE consumption goods using the BLS codebook and production weighting.
The methodology is as follows:
Exhibit 95: Zinc Supply and Demand Model kmt
(’000 tonnes) 2012 2013 2014 2015 2016 2017 2018 2019 2020E 2021E 2022E 2023EGlobal Production
Mine Supply 12901 13014 12929 13230 12372 12819 13337 13727 13042 13973 14353 14209 % change 1.2 0.9 -0.7 2.3 -6.5 3.6 4.0 2.9 -5.0 7.1 2.7 -1.0Refined Production (incl DLA) 13020 13250 13700 13820 13900 13700 13593 13947 14110 14406 14691 14700 % change 2.4 1.8 3.4 0.9 0.6 -1.4 -0.8 2.6 1.2 2.1 2.0 0.1
DM ConsumptionUS 1071 1073 1113 1064 1077 1078 1079 1088 1001 1061 1082 1101 % change y/y 6.2 0.1 3.8 -4.4 1.2 0.1 0.1 0.8 -8.0 6.0 2.0 1.8Japan 478 475 494 461 450 452 445 439 395 427 431 435 % change y/y -3.8 -0.6 3.9 -6.7 -2.2 0.3 -1.5 -1.4 -10.0 8.0 1.0 1.0Western Europe 1811 1821 1871 1909 1932 1956 1920 1892 1702 1839 1879 1911 % change y/y -7.5 0.5 2.8 2.0 1.3 1.2 -1.8 -1.5 -10.0 8.0 2.2 1.7Other OECD 1443 1458 1499 1490 1502 1524 1493 1468 1321 1427 1453 1473 % change y/y 0.6 1.0 2.8 -0.6 0.8 0.8 -2.0 -1.7 -10.0 8.0 1.8 1.4DM 4803 4826 4977 4923 4961 5010 4938 4886 4420 4753 4845 4921 % change y/y -1.9 0.5 3.1 -1.1 0.8 1.0 -1.4 -1.0 -9.6 7.5 1.9 1.6
EM ConsumptionChina 5457 5948 6305 6431 6624 6750 6786 6736 6891 6979 7153 7313 % change y/y 7.0 9.0 6.0 2.0 3.0 1.9 0.5 -0.7 2.3 1.3 2.5 2.2India 612 639 649 666 691 720 720 725 652 711 757 814 % change y/y 2.5 4.5 1.5 2.6 3.8 4.2 0.0 0.7 -10.0 9.0 6.5 7.5Russia 226 220 206 185 185 186 187 189 185 191 194 196 % change y/y 6.9 -2.5 -6.7 -10.0 -0.3 0.6 0.8 1.0 -2.0 3.0 1.5 1.4Brazil 268 269 244 224 230 230 227 225 203 219 225 230 % change y/y 6.2 0.2 -9.2 -8.0 2.5 -0.1 -1.3 -0.7 -10.0 8.0 2.7 2.2Other EM 1311 1345 1371 1350 1347 1345 1322 1306 1175 1269 1295 1315 % change y/y -1.8 2.6 1.9 -1.5 -0.2 -0.2 -1.7 -1.2 -10.0 8.0 2.0 1.6EM 7873 8422 8774 8856 9077 9230 9241 9181 9107 9369 9624 9868 % change y/y 5.0 7.0 4.2 0.9 2.5 1.7 0.1 -0.7 -0.8 2.9 2.7 2.5
Global Consumption 12677 13248 13751 13780 14038 14239 14180 14067 13526 14122 14469 14789 % change y/y 2.3 4.5 3.8 0.2 1.9 1.4 -0.4 -0.8 -3.8 4.4 2.5 2.2 Of which, ex-China 7220 7300 7446 7349 7414 7489 7394 7331 6635 7143 7315 7476 % change y/y -1.0 1.1 2.0 -1.3 0.9 1.0 -1.3 -0.8 -9.5 7.7 2.4 2.2 DM as % of global 37.9 36.4 36.2 35.7 35.3 35.2 34.8 34.7 32.7 33.7 33.5 33.3 EM as % of global 62.1 63.6 63.8 64.3 64.7 64.8 65.2 65.3 67.3 66.3 66.5 66.7
Global Supply / Demand Balance 343 2 -51 40 -138 -539 -587 -120 584 284 222 -89Total Inventory 1960 1605 1831 1641 1556 1166 1049 964 1548 1832 2054 1965Reported stocks (Weeks cons.) 56 44 49 43 40 30 27 25 42 47 52 49
PricesCash (annual average; US$/tonne) 1948 1909 2163 1928 2094 2893 2921 2552 2226 2469 2400 2400Cash (annual average; USc/lb) 88 87 98 87 95 131 132 116 101 112 109 109
Source: Wood Mackenzie, Goldman Sachs Global Investment Research
18 November 2020 59
Goldman Sachs 2021 Commodity Outlook
For t
he e
xclu
sive
use
of J
OSEP
H.ST
EIN@
GS.C
OM
7f10
0ca8
95df
11e0
bb43
0021
5ace
2648

Exhibit 96: Commodities underlying commodity demand intensity chart
BIC Code Process Commodity1111A0 Oilseed farming Soybeans1111B0 Grain farming Corn and Wheat
1121A0Beef cattle ranching and farming,
including feedlots and dual-purpose ranching and farming
Beef
211000 Oil and gas extraction Crude and Gas212100 Coal mining Met Coal
212230 Copper, nickel, lead, and zinc mining Base Metals
2122A0 Iron, gold, silver, and other metal ore mining Bulk and Precious
331110 Iron and steel mills and ferroalloy manufacturing Steel
331313 Alumina refining and primary aluminum production Aluminia
33131B Aluminum product manufacturing from purchased aluminum Aluminium
Source: Goldman Sachs Global Investment Research
18 November 2020 60
Goldman Sachs 2021 Commodity Outlook
For t
he e
xclu
sive
use
of J
OSEP
H.ST
EIN@
GS.C
OM
7f10
0ca8
95df
11e0
bb43
0021
5ace
2648

Disclosure Appendix
Reg AC We, Jeffrey Currie, Damien Courvalin, Samantha Dart, Nicholas Snowdon, Michael Hinds, Alison Li, Mikhail Sprogis, Callum Bruce, Huan Wei and Daniel Sharp, hereby certify that all of the views expressed in this report accurately reflect our personal views, which have not been influenced by considerations of the firm’s business or client relationships.
Unless otherwise stated, the individuals listed on the cover page of this report are analysts in Goldman Sachs’ Global Investment Research division.
Disclosures Regulatory disclosures Disclosures required by United States laws and regulations See company-specific regulatory disclosures above for any of the following disclosures required as to companies referred to in this report: manager or co-manager in a pending transaction; 1% or other ownership; compensation for certain services; types of client relationships; managed/co-managed public offerings in prior periods; directorships; for equity securities, market making and/or specialist role. Goldman Sachs trades or may trade as a principal in debt securities (or in related derivatives) of issuers discussed in this report.
The following are additional required disclosures: Ownership and material conflicts of interest: Goldman Sachs policy prohibits its analysts, professionals reporting to analysts and members of their households from owning securities of any company in the analyst’s area of coverage. Analyst compensation: Analysts are paid in part based on the profitability of Goldman Sachs, which includes investment banking revenues. Analyst as officer or director: Goldman Sachs policy generally prohibits its analysts, persons reporting to analysts or members of their households from serving as an officer, director or advisor of any company in the analyst’s area of coverage. Non-U.S. Analysts: Non-U.S. analysts may not be associated persons of Goldman Sachs & Co. LLC and therefore may not be subject to FINRA Rule 2241 or FINRA Rule 2242 restrictions on communications with subject company, public appearances and trading securities held by the analysts.
Additional disclosures required under the laws and regulations of jurisdictions other than the United States The following disclosures are those required by the jurisdiction indicated, except to the extent already made above pursuant to United States laws and regulations. Australia: Goldman Sachs Australia Pty Ltd and its affiliates are not authorised deposit-taking institutions (as that term is defined in the Banking Act 1959 (Cth)) in Australia and do not provide banking services, nor carry on a banking business, in Australia. This research, and any access to it, is intended only for “wholesale clients” within the meaning of the Australian Corporations Act, unless otherwise agreed by Goldman Sachs. In producing research reports, members of the Global Investment Research Division of Goldman Sachs Australia may attend site visits and other meetings hosted by the companies and other entities which are the subject of its research reports. In some instances the costs of such site visits or meetings may be met in part or in whole by the issuers concerned if Goldman Sachs Australia considers it is appropriate and reasonable in the specific circumstances relating to the site visit or meeting. To the extent that the contents of this document contains any financial product advice, it is general advice only and has been prepared by Goldman Sachs without taking into account a client’s objectives, financial situation or needs. A client should, before acting on any such advice, consider the appropriateness of the advice having regard to the client’s own objectives, financial situation and needs. A copy of certain Goldman Sachs Australia and New Zealand disclosure of interests and a copy of Goldman Sachs’ Australian Sell-Side Research Independence Policy Statement are available at: https://www.goldmansachs.com/disclosures/australia-new-zealand/index.html. Brazil: Disclosure information in relation to CVM Instruction 598 is available at https://www.gs.com/worldwide/brazil/area/gir/index.html. Where applicable, the Brazil-registered analyst primarily responsible for the content of this research report, as defined in Article 20 of CVM Instruction 598, is the first author named at the beginning of this report, unless indicated otherwise at the end of the text. Canada: Goldman Sachs Canada Inc. is an affiliate of The Goldman Sachs Group Inc. and therefore is included in the company specific disclosures relating to Goldman Sachs (as defined above). Goldman Sachs Canada Inc. has approved of, and agreed to take responsibility for, this research report in Canada if and to the extent that Goldman Sachs Canada Inc. disseminates this research report to its clients. Hong Kong: Further information on the securities of covered companies referred to in this research may be obtained on request from Goldman Sachs (Asia) L.L.C. India: Further information on the subject company or companies referred to in this research may be obtained from Goldman Sachs (India) Securities Private Limited, Research Analyst - SEBI Registration Number INH000001493, 951-A, Rational House, Appasaheb Marathe Marg, Prabhadevi, Mumbai 400 025, India, Corporate Identity Number U74140MH2006FTC160634, Phone +91 22 6616 9000, Fax +91 22 6616 9001. Goldman Sachs may beneficially own 1% or more of the securities (as such term is defined in clause 2 (h) the Indian Securities Contracts (Regulation) Act, 1956) of the subject company or companies referred to in this research report. Japan: See below. Korea: This research, and any access to it, is intended only for “professional investors” within the meaning of the Financial Services and Capital Markets Act, unless otherwise agreed by Goldman Sachs. Further information on the subject company or companies referred to in this research may be obtained from Goldman Sachs (Asia) L.L.C., Seoul Branch. New Zealand: Goldman Sachs New Zealand Limited and its affiliates are neither “registered banks” nor “deposit takers” (as defined in the Reserve Bank of New Zealand Act 1989) in New Zealand. This research, and any access to it, is intended for “wholesale clients” (as defined in the Financial Advisers Act 2008) unless otherwise agreed by Goldman Sachs. A copy of certain Goldman Sachs Australia and New Zealand disclosure of interests is available at: https://www.goldmansachs.com/disclosures/australia-new-zealand/index.html. Russia: Research reports distributed in the Russian Federation are not advertising as defined in the Russian legislation, but are information and analysis not having product promotion as their main purpose and do not provide appraisal within the meaning of the Russian legislation on appraisal activity. Research reports do not constitute a personalized investment recommendation as defined in Russian laws and regulations, are not addressed to a specific client, and are prepared without analyzing the financial circumstances, investment profiles or risk profiles of clients. Goldman Sachs assumes no responsibility for any investment decisions that may be taken by a client or any other person based on this research report. Singapore: Goldman Sachs (Singapore) Pte. (Company Number: 198602165W), which is regulated by the Monetary Authority of Singapore, accepts legal responsibility for this research, and should be contacted with respect to any matters arising from, or in connection with, this research. Taiwan: This material is for reference only and must not be reprinted without permission. Investors should carefully consider their own investment risk. Investment results are the responsibility of the individual investor. United Kingdom: Persons who would be categorized as retail clients in the United Kingdom, as such term is defined in the rules of the Financial Conduct Authority, should read this research in conjunction with prior Goldman Sachs research on the covered companies referred to herein and should refer to the risk warnings that have been sent to them by Goldman Sachs International. A copy of these risks warnings, and a glossary of certain financial terms used in this report, are available from Goldman Sachs International on request.
European Union: Disclosure information in relation to Article 6 (2) of the European Commission Delegated Regulation (EU) (2016/958) supplementing Regulation (EU) No 596/2014 of the European Parliament and of the Council with regard to regulatory technical standards for the technical arrangements for objective presentation of investment recommendations or other information recommending or suggesting an investment strategy and for disclosure of particular interests or indications of conflicts of interest is available at https://www.gs.com/disclosures/europeanpolicy.html which states the European Policy for Managing Conflicts of Interest in Connection with Investment Research.
Japan: Goldman Sachs Japan Co., Ltd. is a Financial Instrument Dealer registered with the Kanto Financial Bureau under registration number Kinsho 69, and a member of Japan Securities Dealers Association, Financial Futures Association of Japan and Type II Financial Instruments Firms Association.
18 November 2020 61
Goldman Sachs 2021 Commodity Outlook
For t
he e
xclu
sive
use
of J
OSEP
H.ST
EIN@
GS.C
OM
7f10
0ca8
95df
11e0
bb43
0021
5ace
2648

Sales and purchase of equities are subject to commission pre-determined with clients plus consumption tax. See company-specific disclosures as to any applicable disclosures required by Japanese stock exchanges, the Japanese Securities Dealers Association or the Japanese Securities Finance Company.
Global product; distributing entities The Global Investment Research Division of Goldman Sachs produces and distributes research products for clients of Goldman Sachs on a global basis. Analysts based in Goldman Sachs offices around the world produce research on industries and companies, and research on macroeconomics, currencies, commodities and portfolio strategy. This research is disseminated in Australia by Goldman Sachs Australia Pty Ltd (ABN 21 006 797 897); in Brazil by Goldman Sachs do Brasil Corretora de Títulos e Valores Mobiliários S.A.; Ombudsman Goldman Sachs Brazil: 0800 727 5764 and / or [email protected]. Available Weekdays (except holidays), from 9am to 6pm. Ouvidoria Goldman Sachs Brasil: 0800 727 5764 e/ou [email protected]. Horário de funcionamento: segunda-feira à sexta-feira (exceto feriados), das 9h às 18h; in Canada by either Goldman Sachs Canada Inc. or Goldman Sachs & Co. LLC; in Hong Kong by Goldman Sachs (Asia) L.L.C.; in India by Goldman Sachs (India) Securities Private Ltd.; in Japan by Goldman Sachs Japan Co., Ltd.; in the Republic of Korea by Goldman Sachs (Asia) L.L.C., Seoul Branch; in New Zealand by Goldman Sachs New Zealand Limited; in Russia by OOO Goldman Sachs; in Singapore by Goldman Sachs (Singapore) Pte. (Company Number: 198602165W); and in the United States of America by Goldman Sachs & Co. LLC. Goldman Sachs International has approved this research in connection with its distribution in the United Kingdom and European Union.
European Union: Goldman Sachs International authorised by the Prudential Regulation Authority and regulated by the Financial Conduct Authority and the Prudential Regulation Authority, has approved this research in connection with its distribution in the European Union and United Kingdom.
General disclosures This research is for our clients only. Other than disclosures relating to Goldman Sachs, this research is based on current public information that we consider reliable, but we do not represent it is accurate or complete, and it should not be relied on as such. The information, opinions, estimates and forecasts contained herein are as of the date hereof and are subject to change without prior notification. We seek to update our research as appropriate, but various regulations may prevent us from doing so. Other than certain industry reports published on a periodic basis, the large majority of reports are published at irregular intervals as appropriate in the analyst’s judgment.
Goldman Sachs conducts a global full-service, integrated investment banking, investment management, and brokerage business. We have investment banking and other business relationships with a substantial percentage of the companies covered by our Global Investment Research Division. Goldman Sachs & Co. LLC, the United States broker dealer, is a member of SIPC (https://www.sipc.org).
Our salespeople, traders, and other professionals may provide oral or written market commentary or trading strategies to our clients and principal trading desks that reflect opinions that are contrary to the opinions expressed in this research. Our asset management area, principal trading desks and investing businesses may make investment decisions that are inconsistent with the recommendations or views expressed in this research.
We and our affiliates, officers, directors, and employees, will from time to time have long or short positions in, act as principal in, and buy or sell, the securities or derivatives, if any, referred to in this research, unless otherwise prohibited by regulation or Goldman Sachs policy.
The views attributed to third party presenters at Goldman Sachs arranged conferences, including individuals from other parts of Goldman Sachs, do not necessarily reflect those of Global Investment Research and are not an official view of Goldman Sachs.
Any third party referenced herein, including any salespeople, traders and other professionals or members of their household, may have positions in the products mentioned that are inconsistent with the views expressed by analysts named in this report.
This research is focused on investment themes across markets, industries and sectors. It does not attempt to distinguish between the prospects or performance of, or provide analysis of, individual companies within any industry or sector we describe.
Any trading recommendation in this research relating to an equity or credit security or securities within an industry or sector is reflective of the investment theme being discussed and is not a recommendation of any such security in isolation.
This research is not an offer to sell or the solicitation of an offer to buy any security in any jurisdiction where such an offer or solicitation would be illegal. It does not constitute a personal recommendation or take into account the particular investment objectives, financial situations, or needs of individual clients. Clients should consider whether any advice or recommendation in this research is suitable for their particular circumstances and, if appropriate, seek professional advice, including tax advice. The price and value of investments referred to in this research and the income from them may fluctuate. Past performance is not a guide to future performance, future returns are not guaranteed, and a loss of original capital may occur. Fluctuations in exchange rates could have adverse effects on the value or price of, or income derived from, certain investments.
Certain transactions, including those involving futures, options, and other derivatives, give rise to substantial risk and are not suitable for all investors. Investors should review current options and futures disclosure documents which are available from Goldman Sachs sales representatives or at https://www.theocc.com/about/publications/character-risks.jsp and https://www.fiadocumentation.org/fia/regulatory-disclosures_1/fia-uniform-futures-and-options-on-futures-risk-disclosures-booklet-pdf-version-2018. Transaction costs may be significant in option strategies calling for multiple purchase and sales of options such as spreads. Supporting documentation will be supplied upon request.
Differing Levels of Service provided by Global Investment Research: The level and types of services provided to you by the Global Investment Research division of GS may vary as compared to that provided to internal and other external clients of GS, depending on various factors including your individual preferences as to the frequency and manner of receiving communication, your risk profile and investment focus and perspective (e.g., marketwide, sector specific, long term, short term), the size and scope of your overall client relationship with GS, and legal and regulatory constraints. As an example, certain clients may request to receive notifications when research on specific securities is published, and certain clients may request that specific data underlying analysts’ fundamental analysis available on our internal client websites be delivered to them electronically through data feeds or otherwise. No change to an analyst’s fundamental research views (e.g., ratings, price targets, or material changes to earnings estimates for equity securities), will be communicated to any client prior to inclusion of such information in a research report broadly disseminated through electronic publication to our internal client websites or through other means, as necessary, to all clients who are entitled to receive such reports.
All research reports are disseminated and available to all clients simultaneously through electronic publication to our internal client websites. Not all research content is redistributed to our clients or available to third-party aggregators, nor is Goldman Sachs responsible for the redistribution of our research by third party aggregators. For research, models or other data related to one or more securities, markets or asset classes (including related services) that may be available to you, please contact your GS representative or go to https://research.gs.com.
Disclosure information is also available at https://www.gs.com/research/hedge.html or from Research Compliance, 200 West Street, New York, NY 10282.
© 2020 Goldman Sachs.
18 November 2020 62
Goldman Sachs 2021 Commodity Outlook
For t
he e
xclu
sive
use
of J
OSEP
H.ST
EIN@
GS.C
OM
7f10
0ca8
95df
11e0
bb43
0021
5ace
2648

No part of this material may be (i) copied, photocopied or duplicated in any form by any means or (ii) redistributed without the prior written consent of The Goldman Sachs Group, Inc.
18 November 2020 63
Goldman Sachs 2021 Commodity Outlook
For t
he e
xclu
sive
use
of J
OSEP
H.ST
EIN@
GS.C
OM
7f10
0ca8
95df
11e0
bb43
0021
5ace
2648