1843391775
TRANSCRIPT

8/12/2019 1843391775
http://slidepdf.com/reader/full/1843391775 1/230

8/12/2019 1843391775
http://slidepdf.com/reader/full/1843391775 2/230
The Price of Water

8/12/2019 1843391775
http://slidepdf.com/reader/full/1843391775 3/230
For which their mouths gaped like the cracks of earth
When dried to summer dust. Till taught by pain,
Men really know not what good water’s worth.
If you had been in Turkey or in Spain,
Or with a famished boat’s crew had your berth,
Or in the desert heard the camel’s bell,
Lord Byron, Don Juan
And the same night there fell a shower of rain,
You’d wish yourself where truth is-in a well.

8/12/2019 1843391775
http://slidepdf.com/reader/full/1843391775 4/230

8/12/2019 1843391775
http://slidepdf.com/reader/full/1843391775 5/230
Published by IWA Publishing, Alliance House, 12 Caxton Street, London SW1H 0QS, UK
Telephone: 44 (0) 20 7654 5500; Fax: 44 (0) 20 7654 5555; Email: [email protected]: www.iwapublishing.com
Apart from any fair dealing for the purposes of research or private study, or criticism orreview, as permitted under the UK Copyright, Designs and Patents Act (1998), no part of thispublication may be reproduced, stored or transmitted in any form or by any means, without theprior permission in writing of the publisher, or, in the case of photographic reproduction, inaccordance with the terms of licences issued by the Copyright Licensing Agency in the UK, or
in accordance with the terms of licenses issued by the appropriate reproduction rightsorganization outside the UK. Enquiries concerning reproduction outside the terms statedhere should be sent to IWA Publishing at the address printed above.
The publisher makes no representation, express or implied, with regard to the accuracy of theinformation contained in this book and cannot accept any legal responsibility or liability forerrors or omissions that may be made.
Disclaimer The information provided and the opinions given in this publication are not necessarily thoseof IWA or of the authors, and should not be acted upon without independent considerationand professional advice. IWA and the authors will not accept responsibility for any loss ordamage suffered by any person acting or refraining from acting upon any material contained
in this publication.
British Library Cataloguing in Publication Data A CIP catalogue record for this book is available from the British Library
Library of Congress Cataloging- in-Publication Data A catalog record for this book is available from the Library of Congress
ISBN 1 84339 177 5ISBN 13: 978 1 84339 177 7
© 2007 IWA PublishingFirst published 2007
Typeset by Aptara Inc., New Delhi, India
Printed by Lightning Source
Cover design by www.designforpublishing.co.uk
Cover image is of the Contemporary Art Quilt “Spheres of Influence’’courtesy of
Alicia Merrett http://www.tufpark.demon.co.uk/

8/12/2019 1843391775
http://slidepdf.com/reader/full/1843391775 6/230
Contents
Preface x
1 Introduction: getting to grips with water 11.1 Instream and outstream 11.2 Reuse and recycling 21.3 Catchment and region 21.4 Four interpretations of demand 21.5 Pricing the resource 3
1.6 Studies of household water use and the willingness-to-pay for water 4
1.7 Tearing up water and floating on water-rights? 51.8 Catchment water deficits 51.9 The virtual water controversy 71.10 Final remarks 8
2 The regional water balance statement: a new tool for
water resources planning 92.1 Introduction 92.2 The rules of the game 10
2.3 The supply categories 132.4 Water storage 142.5 The use categories 152.6 The change statement 162.7 The uses of regional statements 182.8 Conclusions 19
3 Integrated water resources management and the
hydrosocial balance 203.1 Introduction 20
v

8/12/2019 1843391775
http://slidepdf.com/reader/full/1843391775 7/230
vi Contents
3.2 A new implement for the IWRM toolbox 203.3 The bridge between quantity and quality 213.4 The physical geography and hydrology of Jersey 243.5 Water supply in Jersey 243.6 Water use in Jersey
273.7 Water quality in Jersey 283.8 Conclusions 34
4 Sharing the benefits of the river basin’s water economy 374.1 Introduction 374.2 Benefits of the water economy 374.3 Basin water productivity 414.4 Sharing the benefits 414.5 Conclusions: negotiating the benefits 42
5 Farm-level drought management: an irrigation
case-study from the UK 435.1 Introduction 435.2 The Anglian Region 445.3 Silver Birches plc 455.4 Drought management: the infrastructural strategy 475. Drought management: the informational strategy 51
Conclusion 56
6 The potential role for economic instruments in drought
management 586.1 Introduction 58
6.2 The water economy 596.3 The Anglian Region 596.4 The Region’s water economy 606.5 The Agency’s drought plan 626.6 Anglian water services’ drought plan 636.7 Drought plans and the water economy 646.8 Economic instruments 656.9 Conclusions 67
7 ‘Virtual water’ and Occam’s razor 687.1 Introduction 687.2 A water deficit resolved
697.3 A critique of the virtual water thesis 707.4 Occam’s razor 717.5 Conclusion 71
8 Virtual water and the Kyoto consensus 728.1 The use of metaphor 728.2 Crops, crop water and water deficits 738.3 The Kyoto consensus 74
5.65

8/12/2019 1843391775
http://slidepdf.com/reader/full/1843391775 8/230
Contents vii
9 The urban market for farmers’ water-rights 779.1 Introduction 779.2 The urban actors’ demand function 789.3 The farmers’ supply function 809.4 The limits to theory 809.5 Conclusions 85
10 The demand for water: four interpretations 8610.1 Introduction 8610.2 The use of water 8710.3 The consumption of water 8810.4 The need for water 8810.5 The economic demand for water 8810.6 Supply-side leakage and evaporation 8910.7 Conclusions 90
11 The political economy of water abstraction charges 9111.1 Introduction 9111.2 Abstraction charges and the theory of rent 9211.3 A charge-setting taxonomy 9311.4 Abstraction charges and sustainable catchment management 9611.5 The impact on users 9811.6 Final remarks 99
12 Twelve theses on the cost and use of irrigation water 10112.1 Thesis 1 10112.2 Thesis 2 101
12.3 Thesis 3 10112.4 Thesis 4 10212.5 Thesis 5 10212.6 Thesis 6 10212.7 Thesis 7 10212.8 Thesis 8 10212.9 Thesis 9 10312.10 Thesis 10 10312.11 Thesis 11 10312.12 Thesis 12 103
13 Behavioural studies of the domestic demand for water
services in Africa 10413.1 A methodological revolution 10413.2 Market networks for water 10613.3 The uses of water 10813.4 Objects or subjects? 11013.5 The discrete choice model 11313.6 Conclusions 114

8/12/2019 1843391775
http://slidepdf.com/reader/full/1843391775 9/230
viii Contents
14 Deconstructing households’ willingness-to-pay for water
in low-income countries 11614.1 Introduction 11614.2 Survey methods 11714.3 Sign and behaviour
11814.4 Demand theory and survey practice 11914.5 The affordability question 12014.6 The treatment of substitutes 12114.7 Sign and sanction 12314.8 Private agendas 12414.9 Anchor prices 12614.10 Conclusion 128
15 Industrial effluent policy: economic instruments and
environmental regulation 13015.1 Introduction 130
15.2 The generation and regulation of industrial effluent 13115.3 The objectives of disposal charges 13215.4 The demand for waste water services 13315.5 The measurement of pollution 13515.6 The design of disposal charges: the utilities 13615.7 The design of disposal charges: the environmental regulator 13715.8 Conclusions 138
16 Nitrate pollution on the Island of Jersey: managing
water quality within European community directives 14016.1 Introduction 140
16.2 Nitrate pollution of groundwater and surface waters 14116.3 Water quality management by the Department of Agriculture and Fisheries 143
16.4 Water quality management by the JNWWC 14416.5 Water quality management of domestic
abstractions: the Department of Environmental Health 14716.6 Water quality management of waste water
discharges: the Environment and PublicServices Department 148
16.7 The benefits of nitrate pollution management 14916.8 Conclusions 155
17 Catchment water deficits in the twenty-first century 15817.1 Introduction 15817.2 The Dwyer catchment 16017.3 Redemptive options (I) 16117.4 Redemptive options (II) 16317.5 From surplus to deficit 16417.6 Framework, theory and empirical studies 16517.7 Conclusion 166

8/12/2019 1843391775
http://slidepdf.com/reader/full/1843391775 10/230
Contents ix
18 Catchment water deficits: an application to Zambia’s
Kafue river basin 16718.1 Introduction: the general hypothesis 16718.2 The Kafue River Basin 16818.3 Groundwater abstraction
17018.4 The economic demand for water 17118.5 The supply of food 17218.6 Environmental needs 17218.7 Conclusions 173
19 The Thames catchment: a River Basin at the tipping point 17819.1 Introduction 17819.2 The Kafue catchment 17919.3 The analysis of densities 17919.4 The Thames River Basin 18119.5 The Thames in water deficit? 185
19.6 Density analysis of the Thames River Basin 18619.7 Tipping deeper into deficit 18819.8 Conclusion 189
20 Water resource impacts of new housebuilding in the
Thames Region: 2006–2025 19120.1 Introduction 19120.2 The baseline situation 19220.3 The increase in homes 2006–2025 19420.4 Addition and subtraction 19420.5 Choices 196
21 Beneficial impacts for the Thames River Basin of water
company leakage reduction 2006–2025 19821.1 Introduction 19821.2 Leakage in the Thames Region: some basic facts 19921.3 Forecasting the reduction in total leakage 20021.4 Conclusions 203
Bibliography 205Index 214

8/12/2019 1843391775
http://slidepdf.com/reader/full/1843391775 11/230
Preface
On the evening of September 22nd 1994, I received a telephone call from a Danishmanagement consultancy asking me if I would be free to work in Latvia for a monthon the economics of a local water utility. My reply was positive, but I was compelledto add that I knew absolutely nothing about water or water utilities. The consultantreplied that a couple of months would elapse prior to the project’s start-date; fromprevious contact he was sure that if I applied myself to the subject-area during thoseeight weeks, all would be well. The deal was struck. I raised my eyes to the heavens(well, the ceiling of my flat) and said: “Let it be water’’.The next morning (!) I began
writing a book – an ‘introduction to the economics of water resources’, later published
under that title.During the previous thirty years, my entire working life had been spent carrying
out economic research in a variety of applied fields. These included: higher educationand student finance, the production of fertilizers, the British civil space programme,international trade and capital flows, housing construction and finance, and land-useplanning.
Taking early retirement from University College London in 1994, I decided to re-invent myself as an environmental consultant. My two daughters’persuasive arts, andmy lifelong love of the natural world, were the roots of this choice. But environmentalresearch embraces an extraordinary variety of subjects; so it was that chance telephonecall from Denmark that made water resources my focus. By February 1995 I was on
the River Daugava in Daugavpils, Latvia’s second city, carrying out an affordabilitystudy of price increases for the town’s water and waste water services.In my view, the oldest and still the most important production activities of
humankind are securing food and water, building and maintaining housing, makingclothing, and providing health care and education. These activities can be thought of as forms of reproductive production. Each is simultaneously a form of human labour as
well as a direct and necessary condition for the reproduction of the species. The factthat more than half my working life had passed in the study of the economics of edu-cation and the economics of housing made the shift into the study of water resourcesthat much easier.
x
8/12/2019 1843391775
http://slidepdf.com/reader/full/1843391775 12/230

8/12/2019 1843391775
http://slidepdf.com/reader/full/1843391775 13/230
2 The Price of Water
economic instruments and environmental regulation with respect to water treatmentand waste water discharges, address policy development.
1.2 REUSE AND RECYCLING
The fundamental distinction between instream and outstream water is complementedby the related distinction between the reuse of water and the recycling of water. Reuseand recycling are two concepts repeatedly drawn on in this volume as well as in my twobooks on water resources economics and management (Merrett 1997, Merrett 2002a).
Reused water is waste water and irrigation drainage that, prior to its return to
the instream resource, is captured and used again (perhaps repeatedly). Reuse cantake place within a single institution (such as a sugar-mill) or it can occur between
institutions as when urban waste water is reused for irrigation purposes. Reuse mayhave real advantages, such as lowering abstraction costs or by reducing waste watertreatment costs.
Recycling refers to water that is abstracted, used by households, industry etc., andthen the fraction that is not consumed as evapotranspiration flows back to the catch-ment’s rivers, aquifers and lakes. The importance of recycling to hydroeconomists isthat it augments the hydrological resource from the point at which the recycling occurs.The negative characteristic is that recycled flows may pollute the resource. The pro-portion of water used that is consumed, and therefore is unavailable for recycling,
varies between categories of use.
1.3 CATCHMENT AND REGION
Water resources research is carried out either at the catchment scale or at the regionalscale, where ‘region’ refers to any area with a defined boundary. The beauty of work-
ing at the catchment (river basin) scale is seen to be the unity of its hydrologicalflows – precipitation, evapotranspiration, run-off and groundwater recharge. How-ever, groundwater boundaries may not fall within the catchment boundary. Moreover,hydrosocial flows such as the import of water from another catchment or the exportof waste water beyond the catchment also undermine the supposed unity of flows.
The attraction of regional analysis is its flexibility. It can be applied to a singledwelling, a village, a city, a province, a country, an island – or what you will. However,a region will usually be part of a river basin, or overlap two basins, or contain severalbasins, so that the linkage of hydrological and hydrosocial flows becomes extremelycomplex. The hydrological unity of the single river basin is lost.
In 1996 the author began developing a method concept now referred to as ‘the
hydrosocial balance’,which is applicable at the catchment or at the regional scale. It isa planning tool that appears in many of this volume’s papers, for example in chapterthree, Table 1. My own fieldwork in applying the concept has been carried out for asingle house in southern Spain, the island of Jersey, Gaza, the West Bank of Palestine,the Thames catchment in England and a farm in the Anglian Region. As is argued inchapter three, the hydrosocial balance offers excellent potential for the regional-scaleplanning of water’s civil engineering infrastructures and their capital financing.
1.4 FOUR INTERPRETATIONS OF DEMAND
During the years that the author worked on Palestinian water resource challenges, one
of the draft outputs – co-written with my colleague Eng. Khalil Saleh – was a review

8/12/2019 1843391775
http://slidepdf.com/reader/full/1843391775 14/230
Introduction: getting to grips with water 3
of a number of documents assessing the future water demand of the Palestinians. Inthe course of this work it became clear that the term ‘the demand for water’ is used
with a confusing variety of meanings. For an economist with an unslaked thirst forthe philosophy of science, the subject seemed to be worth pursuing – for the mostpractical of reasons. The outcome was a short paper entitled ‘The demand for water:four interpretations’, published as chapter ten in this volume.
The core of the argument is that ‘the demand for water’ may refer to:
i) the use of water;ii) the consumption of water, that is, evapotranspiration during use;
iii) the need for water;iv) the economic demand for water, represented by the economist’s trusty ‘demand
function’ that relates quantity purchased and unit price.
This confusion of meanings, one with another, has consequences. To take demand tomean both use and consumption neglects the truth that a given volume used can be
associated with wide variations in the volume consumed. This difference is at the coreof much current debate in the field of irrigation engineering as the discussion listsshow. To take demand to mean both use and need obscures the shortfall of use againstneed for more than half the world’s population. To take demand to mean both use andthe economic demand for water confuses the use of water with one of its determinants,
wherever costs borne by the user vary with the volume used.In the hydrosocial balance, the categories of supply include the leakage and evap-
oration losses that occur between the point at which human society appropriates out-stream water and the point of delivery of water to user properties. Curiously suchlosses are almost always treated in the current literature as a form of ‘demand’. Theresult is that consultants’ forecasts of growth in ‘demand’ include (as unaccounted-for-water - UFW) supply-side leakage and evaporation. Furthermore the reduction of
these losses in abstraction, storage and distribution prior to the delivery of water to theuser is said to be a form of ‘demand management’.This does not seem helpful. A man-ufacturer of refined sugar, when considering losses from output because of pilfering,or contamination while in the warehouse or destruction in a road or rail accident enroute to the supermarket, would never regard this as a demand for sugar, a bizarre actof use by a consumer whom the sugar never reaches. The manufacturer would regardall of these as storage or distribution losses in the supply chain. So should it be withthe supply of water.
There is a more general point here. Water resource management is now widelyseen as principally a form of ‘demand management’. To me such an approach seemsnonsensical. This is especially the case when so much ‘demand-management’, as with
reuse and the reduction of losses, turns out to be made up of supply-side initiatives.With outstream water we should always integrate in our thinking and our practice bothdemand-side and supply-side strategies.
1.5 PRICING THE RESOURCE
When a household, firm or farmer wishes to access water, the costs incurred by theuser can take a variety of forms. The first form, the joy and delight of the economist,is that of a price paid to the supplier (such as a water utility) per unit quantity. Forpolicy-makers committed to demand management in England, for example, a most
encouraging development in the last two decades is the increase in the proportion of

8/12/2019 1843391775
http://slidepdf.com/reader/full/1843391775 15/230
4 The Price of Water
households that are on a priced, metered supply – from about two per cent of the totalnumber of households to more than twenty per cent.
The second form again directly relates volume received to cost incurred by theuser. But in this case it is because the user is also the supplier of the water. This canbe called the own-supply case. Karin Kemper, for example, describes the situation inthe Curu catchment of Brazil where farmers use electric motors to pump irrigation
water from the river. She describes the importance of electricity tariffs to irrigators’costs (Kemper 1996).
The third form in which users incur costs for access to water is where there is only anindirect link to volume used. For example, in Archangel in northern Russia where theauthor was working in 2004, household payments for water used are based on a fixedtariff in roubles/m3 and on the assumption that households use 225 litres per capitaper day (lcd) – almost a quarter of a tonne! This charge per person is then multipliedby the number of family members registered as living at a given address. In fact, no one
knows what is the volume of use per person. 225 lcd may be wildly inaccurate. Howeverthe variation of the tariff paid with the number of family members clearly does have
an indirect relation to volume used.The fourth form of cost-use relation is where the payment made is a fixed charge
for the user, invariant with volume. In England’s districts, in cases where householdsare not metered, they pay a water and waste water charge based on the value of theproperty in which they live.
In this volume a number of the papers deal with charging for water. Chapter five hasa case-study of the price of water charged by an English regional water utility to a localfarmer and the alternative costs of water incurred were he to begin abstraction from alocal drainage channel – the own-supply case. Chapter six is a market-clearing proposalfor raising water prices and fixed charges in the management of regional drought. The political feasibility of introducing such a management tool turns on i) the proportion of households that have metered use and ii) the protection of low-income families. This isthe first time that water pricing has been suggested for drought management alongsidethe familiar informational, infrastructural and regulatory instruments. Chapter elevenreviews alternative methods of designing abstraction charges. Chapter twelve sets outtwelve theses on the interrelation of the cost of irrigation water to farmers and the
volume of water used. Chapter fifteen discusses the design of waste water charges forsewage collection, treatment and disposal. Chapter sixteen, authored together with mygreat friend Nick Walton (hydrochemist extraordinaire) applies economic analysis thatshows how wasteful can be the setting of water quality targets that have little relationto human health.
1.6 STUDIES OF HOUSEHOLD WATER USE AND THE
WILLINGNESS-TO-PAY FOR WATER
A fascinating area of research in low-income countries in the past 25 years, indeliblyassociated with the names of Dale Whittington and his colleagues, is that of detailedcase-studies of families’water use behaviour and their observed ability and willingness-to-pay for water. The first strength of the water demand school is its demonstrationof how socially complex the networks of access and distribution can be. The secondstrength is the detailed examination of the dynamic and competitive markets in water

8/12/2019 1843391775
http://slidepdf.com/reader/full/1843391775 16/230
Introduction: getting to grips with water 5
that exist in many of Africa’svillages and towns.The third strength of the water demandschool is its success in estimating the proportion of domestic income absorbed by
water purchases. At the same time, there are major weaknesses of the water demandschool’s work. The principal one is that the authors take a naturalistic standpointin which the research into these communities’ behaviour is limited to the actions of silent men, women and children, moving across a landscape like so many ants in anatural-historical study of a savannah colony. Household members are not treated asintelligent, resourceful, purposive and reflexive citizens. These arguments are madein chapter thirteen of this volume.
Chapter fourteen critically reviews the deployment of the willingness-to-pay con-cept in eleven studies published by Whittington and his fellow workers in the years1988–98. The countries visited were Haiti, Ghana, Nigeria, Pakistan, the Philippinesand Uganda. The critique is drawn from the branch of philosophy known as semioticsand it ends with an alternative approach to field research into households’ economicdemand for water. The paper includes the contrasts I drew between the ‘official ver-sion’ and the ‘true story’ of the price of water paid by a family in Yerevan, Armenia;
this is a norm-based system like the one in Archangel already referred to.
1.7 TEARING UP WATER AND FLOATING ON
WATER-RIGHTS?
Water is a collection of molecules, each of which consists of two atoms of hydrogenbonded to one atom of oxygen. A water-right is a legal claim to abstract or otherwiseaccess water. You can float on water but not on a water-right. You can abrogate a
water-right but not water. Chapter nine is the only paper in this volume that addresses water-rights markets rather than water markets. It begins with pure theory on how
urban actors’ demand function for abstraction-rights intersects with farmers’ supplyfunction and thereby produces an equilibrium price and quantity traded. An accountis given on how each function is determined. A number of real-life complications, suchas part-sales and transaction costs, are examined and shown to be well-handled by neo-classical theory. But the empirical material suggests the modest relevance of the modelto actual sales of water-rights where the absolutely predominant form of transaction isthe bilateral deal. The conclusion is that, with respect to research method, fieldworkshould be orientated to asymmetric power and information in the tradition of newinstitutional economics.
1.8 CATCHMENT WATER DEFICITS
It is likely that the papers destined to have the greatest professional impact on theory,fieldwork and policy development are chapters 17 to 21. The theme of catchment
water deficits in the 21 st century is now my favourite child. Chapter 17’sobjective is toprovide a general theory of how the water resources of a river basin shift from surplusto deficit and the means by which water resource institutions can manage or reversethis shift.
The article bites the bullet of defining surplus and deficit in the following way. A catchment water surplus is a situation in which, throughout the course of a spec-

8/12/2019 1843391775
http://slidepdf.com/reader/full/1843391775 17/230
6 The Price of Water
ified year, total precipitation in the basin is sufficient to simultaneously satisfy fourconditions:
i) Abstraction from the aquifer is maintained at a sustainable rate.ii) Outstream water fully meets the economic demand for water from households,
agriculture, mining, manufacturing, construction and the services sectors.iii) The basin population’s economic demand for food is fully met from domestic
rainfed and irrigated farming or from domestic fisheries or from food importsfinanced by the basin’s commodity and service exports.
iv) The river’s instream flows do not fall below defined minima.
When a catchment water surplus does not exist, the river basin is in deficit.The analysis in chapter seventeen proceeds by illustrating the argument with a
fictitious catchment called the Dwyer, which in the base-year is in surplus and in which total population increases by one-third every 25 years, that is, about 1.15% perannum. Moreover, output per capita is also rising. This combination of growth bothin population and economic productivity, associated with the rise of world capitalism,
is the source of deep unease amongst the professional staff of the Dwyer Catchment Authority. The Authority estimates the catchment’s economic output in 2025. Afterassuming that theratio of outstreamwateruse to basin outputis constant, theAuthoritythereby derives an estimate of total water use in 2025. The Authority anticipates that,for the first time in its history, in 2025 the catchment will move into a water deficit;one or more of the four necessary conditions for surplus will have been breached.
The paper then reviews twelve redemptive options. Six of these moderate the situ-ation but do not prevent entry into water deficit; examples are importing water fromanother catchment, and the extension of water reuse. Six other options do prevententry into water deficit; examples are reducing the rate of growth of population, andincreasing water’s productivity in terms of value added per cubic metre of water con-
sumed.Chapter 17 re-states the implications for a river basin of finding itself in waterdeficit. These are one or more of the following situations:
i) The basin is pumping its groundwater at an unsustainable rate.ii) There is insufficient outstream water to meet the economic demand for it.
iii) The population has to import water, or food that it is unable to pay for from itsexports of goods and services.
iv) The basin’scitizens must accept the economic and environmental losses followingfrom its river diminishing in volume.
The nightmare scenario is a river basin in which groundwater is being exhausted,households, farmers and other actors cannot purchase the water they require, food
imports cannot be paid for, making the basin dependent on powerful allies, and theriver has been destroyed.
The article ends with suggestions for catchment research projects that establish whether or not any single river basin is in deficit and, if so, what are the causes andthe policy options.
Chapters 18–21 have all been written since 2005. They provide empirical analysisthat shows that the Kafue River Basin is in surplus and that the Thames River Basinis tipping into deficit. Importantly, chapter 19 sets out the five variables that determine
whether or not a river basin is in deficit or surplus and goes on to measure the value of these variables for the Thames basin. The final two chapters continue the theme by i)

8/12/2019 1843391775
http://slidepdf.com/reader/full/1843391775 18/230
Introduction: getting to grips with water 7
demonstrating that new housebuilding in the Thames region will drive the river basindeep into deficit, and ii) reviews the likelihood that leakage reductions by the basin’s
water utilities will weaken the move into deficit.
1.9 THE VIRTUAL WATER CONTROVERSY
In the previous section, one of the criteria for surplus at the river basin scale is that thebasin population’s economic demand for food is fully met from domestic rainfed andirrigated farming, or from domestic fisheries, or from food imports financed by thebasin’s commodity and service exports. The nightmare scenario for a deficit catchmentincludes a situationwhere food imports cannotbe paid for, makingthe basin dependenton powerful allies; the relation between Egypt and the USA is an example. In fact,it was Tony Allan’s work on the hydropolitics of the Middle East that first led me toinclude the water needs of domestic food production in the definition of water surplus(Allan 2001).
During the 1990s (and even prior to that decade) Allan had developed a conceptthat he now refers to as ‘virtual water’. Virtual water is defined as the water needed toproduce agricultural commodities, particularly in a context where they are exported.The concept is now widely used in the discussion of the need for water in food pro-duction, particularly in the arid, low-income nations.
Chapters seven and eight of this volume develop a strong critique of the virtual water concept, making the case that it be abandoned. The core of Allan’s argumentis that when a Region A discovers that the crop water requirements of food self-sufficiency are impossible to satisfy, the consequent water deficit can be resolved bythe import of virtual water from Region B. To indicate the scale of these virtual waterimports, we can take the example of wheat. One tonne of exported wheat requires
about one thousand tonnes of virtual water (Allan 2001: 106, 126). Less than 0.1 percent of the virtual water is physically embedded in the food grains themselves. Duringcultivation in Region B, more than 99.9 per cent of the virtual water returns to theirrigation cycle as farmland drainage or is lost in evapotranspiration. As Allan writes(2001:106):
“At the 1000 tonnes (cubic metres) of water per tonne of grain estimate of watercontent the [MENA] regional imports of virtual water by the mid-1980s were equiva-lent to the annual flow of the Nile into the Egyptian agricultural sector.’’
My critique is four-fold. First, the term is redundant; virtual water is nothing more or less than the water
needed to produce agricultural commodities.Secondly, there is absolutely nothing virtual about virtual water.
Thirdly, when one approaches agriculture from the perspective of water resourcesthere is a danger that the experience of farming is seen largely with respect to its crop
water requirements. As a result, a more rounded vision is lacking, one that understandsthat the water theme is only one amongst many, such as soil characteristics, land rights,labour skills, pest control, farm budgets and product markets. Consequently, if we usethe term ‘the import of food’, this opens up major questions rendered invisible by ‘theimport of virtual water’.Have food imports led to higher population birth rates in waterdeficit regions than would have occurred in their absence? Do food imports weakenthe farm sector of the importing country? Do food imports open the importing countryto political control from the exporting country? Will the importing country be able to

8/12/2019 1843391775
http://slidepdf.com/reader/full/1843391775 19/230
8 The Price of Water
maintain its foreign exchange expenditure on food imports in the long run? Finally,if food imports are subsidized when they are shipped from the European Union andNorth America, will these subsidies be maintained in the long term?
Fourthly, the confusion of water with food that accompanies the term “virtual water’’fosters analytic errors such as that food grain purchases are transported water and thatimported food brings “total water self-sufficiency’’ for the importing region (Allan2003: Figure 3). The greatest weakness of Allan’s concept is that it repeatedly confuses
crop outputs with the water required to produce them. If, as Allan suggests, Hoekstra andHung (2002) conclude that 695 km3 of virtual water is traded each year, why have noneof us seen the boats within which it is carried? Why are they not causing gridlock inthe world’s sea channels? Virtual water, as defined by Allan, is real water; if it is indeedtraded it needs to be transported to the new owner. In fact, no such trade ever takesplace in the case of food exports. Hoekstra and Hung, outstripping Allan, commit a695 km3 error.
In fact, the huge economic,political andsocialprocesses that areaddressed by Allanin terms of ‘virtual water’can be reset in a world where arid and semi-arid regions (and
others) do not have the capacity to feed their populations and so import food. Theseimports mean that less food production and therefore less water is required in theseregions’ irrigated agriculture. Where the region’s exports are insufficient to financefood imports, regional politicians may deflect attention from such dependence; theavailability of imported food allows them to postpone new water supply initiatives, todelay difficult decisions about the demand management of their water resources andto neglect the issues of birth control.
1.10 FINAL REMARKS
The author is convinced that, in human if not in financial terms, the most valuableareas of research in the 21 st century will include humankind’s understanding andmanagement of water resources. Economists have a part to play here, alongside those
who work in the fields of agriculture, development studies, engineering, environmentalscience, geography, hydrology and hydrogeology, law, planning, political science andsociology.
Of course, the greatest difficulty in getting to grips with water is that it slips through your fingers. Nevertheless, our work as researchers should be bold, honest, shouldrespect the labour of disciplines other than our own, and should seek to capture theglittering diamond of method, theory, fieldwork and policy development. The authorbelieves that the century before us will witness water deficits on an unparalleled scale.He hopes that this collection of papers helps his colleagues in the global catchment
to prepare for the challenges that will confront our species and the world-wide web of other life forms.

8/12/2019 1843391775
http://slidepdf.com/reader/full/1843391775 20/230
9
2
The regional water balancestatement: a new tool for water
resources planning
The king … proceeded to make use of the multitudes whom he had brought with
him from the conquered countries … partly to dig the numerous canals with which
the whole of Egypt is intersected … The king ’ s object was to supply Nile water to the
inhabitants of the towns situated in the mid-country, and not lying upon the river; for
previously they had been obliged, after the subsidence of the fl oods, to drink a brack-
ish water which they obtained from wells.
Herodotus c. 430 B.C.
2.1 INTRODUCTION
It is widely accepted that the effective planning of water resources becomes moreurgent with each passing year. Some would argue that this need is driven by theincreasing size and density of human populations at the catchment and urban scale.Others point out that exponential growth in economic output and consumption pro-duces ever higher volumes of waste water (Lundqvist et al. 1985: 1). More recently, itis also asserted that global climate change will require every society to develop strat-
egies capable of dealing with regional shifts in the mean and variance of hydrological variables such as precipitation.
In Introduction to the Economics of Water Resources: An International Perspective Ihave proposed that such planning should take place within a framework determinedby the quest for a sustainable society, and that strategy for the water sector should bebalanced by programmes on both the supply- and the demand-side (Merrett 1997:187). Moreover, while our developing understanding of the hydrological cycle
C 2007 IWA Publishing. ThePrice of Water: Studies in Water ResourceEconomicsand Management
2nd Edition by Stephen Merrett. ISBN: 9781843391777. Published by IWA Publishing, London, UK.

8/12/2019 1843391775
http://slidepdf.com/reader/full/1843391775 21/230
provides the vital natural science input to strategy, it must be the hydrosocial
cycle – illustrated in Figure 2.1 – which sources the language of supply and demandprogrammes. At this level, the key intellectual inputs come from politics, law, civilengineering, human geography, environmental studies and political economy.
The objective of this paper is ambitious. Derived from the hydrosocial cycleperspective on supply and demand, the paper seeks to develop a quantitative tool for water resource planning which within a decade could be used across the globe forstrategy development in respect of abstracted fresh water for outstream uses. Thistool is the regional water balance statement and its derivative, the change statement.
2.2 THE RULES OF THE GAME
The paradigm formulation of the regional water balance statement is presented inTable 2.1. Before looking at the individual entries in this template, some rules of the
game are required. First, the statement relates to any defined geographic space; theterm ‘region’ is used advisedly because of its inherent ambiguity. A region could be acontinent, a country, a province, a catchment, an irrigation district, a city, a village,the site of a manufacturing firm such as a sugar mill, or, indeed, a water servicescompany located in a defined area.
Secondly, the statement is always applicable to a defined time-period. For con- venience of exposition it is assumed here that the time-period is the year 1999. Alternatively it could be for the 5 years from 1995 to 1999, for example, or for themonth of August averaged over the 10-year period 1990–99. Regional water balancestatements for past or present time are referred to as baseline statements; those forfuture time are scenario statements.
The statement has four columns: the first two are the categories of supply and thequantity supplied per unit period of time; the second two are the categories of useand the quantity used per unit period of time. The quantitative measure of flow willbe chosen on pragmatic grounds; it is assumed in Table 2.1 that we refer to flows inmegalitres per day, averaged over the year.
The boundary between supply flow and use flow should also be chosen on prac-tical grounds – this paper is not intended to be a visionary text. Such a boundarymight be the point where the user first possesses or has a right to the use of the water.Here, total use includes the leakage, evaporation and wastage which occurs on userproperties, as well as beneficial use.
The calculation of flows in the regional water balance statement requires a proced-ure I shall call double-entry water accounting. The approach is taken from the double-entry book-keeping first developed in medieval Italy, and now universally used inmodern financial accounting (Dyson 1994: 42–45). Within this routine, the companyaccountant has a large number of separate accounts such as a bank account, a cred-itors account, a debtors account, a cash account, a sales account and so on and soforth. Within the full set of a company’s accounts, each transaction is recorded twice.In the account deemed to provide funds for the transaction, the transaction isrecorded as a credit item. In the account deemed to receive the funds, the same trans-action is recorded as a debit item. For example, the transaction of paying cash intothe bank will be recorded as a credit in the cash account and as a debit in the bankaccount; the transaction of a cash receipt for the sale of goods is recorded as a debit
10 The Price of Water

8/12/2019 1843391775
http://slidepdf.com/reader/full/1843391775 22/230
The regional water balance statement: a new tool 11
F r e s h w a t e r s
o u r c e s
S a l t w a t e r s o u r c e s
A b s t r a c t i o n
S t o r a g
e
F r e s h w a t e r
t r e a t m e
n t
D i s t r i b u t i o n
E v a p o t r a n s p
i r a t i o n
I n s t r e a m u s e
s a n d a g r i c u l t u r a l r e t u r n f l o w s
L e a k a g e
U s e
I n t e r n a l r e u s e
e n g i n e e r i n g
R
e c y c l i n g
S t o r m w a t e r
S t o r m w a t e r
c o l l e c t i o n
F
o u l w a t e r
c o l l e c t i o n
W a s t e w a t e r
t r e a t m e n t
D i s p o s a l
U s e o f s o l i d s
E x t e r n a l r e u s e
e n g i n e e r i n g
F i g u r e 2 . 1 A
s i m p l e m o d e l o f t h e h y d r o s o c i a
l c y c l e .

8/12/2019 1843391775
http://slidepdf.com/reader/full/1843391775 23/230
12 The price of water
T a b l e 2 . 1
R e g i o n a l w a t e r b a
l a n c e s t a t e m e n t f o r t h e y e a r 1 9 9 9 .
C a t e g o r i e s o f s u p p l y
M e g a l i t r e s / d a y
C a t e g o r i e s o f u s e *
M e g a l i t r e s / d a y
1 . R a i n w a t e r c o l l e c t i o n
A
1 4 .
H o u s e h o l d s
S
2 .
B
1 5 .
A g r i c u l t u r e
T
3 . G r o u n d w a t e r a b s t r a c t i o n : r e c y c l e d s o u r c e s
C
1 6 .
M i n i n g
U
4 . S u r f a c e w a t e r a b s t r a c t i o n : fi r s t t i m e t h r o u g h
D
1 7 .
M a n u f a c t u r i n g
V
5 . S u r f a c e w a t e r a b s t r a c t i o n : r e c y c l e d s o u r c e s
E
1 8 .
P u b l i c s e r v i c e s
W
6 . D e s a l i n a t i o n o f s a l t o r b r a c k i s h w a t e r s
F
1 9 .
C o m m e r c i a l s e c t o r s
X
7 . I m p o r t o f w a t e r f r o m a n o t h e r r e g i o n
G
2 0 .
I n s t r e a m a p p l i c a t i o n s
Y
8 . I n t e r n a l r e - u s e o f w a s t e w a t e r
H
2 1 .
O t h e r u s e s
Z
9 . E x t e r n a l r e - u s e o f w a s t e
w a t e r
J
2 2 .
T o t a l u s e
S T
…
Y
Z
1 0 . L e s s : s u p p l y l e a k a g e a n d
e v a p o r a t i o n
K
1 1 . L e s s : e x p o r t o f w a t e r t o a n o t h e r r e g i o n
L
1 2 . F a l l o r r i s e o f v o l u m e o f
s t o r e d w a t e r
M
1 3 .
T o t a l n e t s u p p l y
A
B
…
J
K
L
M
* I n c l u d e s b e n e fi c i a l u s e , r e - u s e v o l u m e s , a n d l e a k a g e , e v a p o r a t i o n a n
d w a s t a g e o n u s e r p r o p e r t y .
G r o u n d w a t e r a b s t r a c t i o n : fi r s t t i m e t h r o u g h

8/12/2019 1843391775
http://slidepdf.com/reader/full/1843391775 24/230
item in the cash account and as a credit item in the sales account. In the process of ‘balancing the books’, because of this double-entry approach, the aggregate of allcredit items in the separate accounts must equal the aggregate of all the debit items.Should this not happen, the accounts contain one or more errors of recording.
The application of financial accounting practice to the regional water balancestatement must now be described. The statement is treated as a single ledger contain-ing all the appropriate entries either as supply items on the left-hand side or as useitems on the right-hand side. For any flow of water to be recorded in the statement, itmust qualify as some hydrosocial category of input to the regional system. Theseinput flows will be referred to as red molecule flows. In Table 2.1, flows 1–9 are redmolecule flows. Such flows are parallel to the credit items described above and areentered on the left hand side of the water accounts ledger.
Once so entered, each molecule must be assigned to one of the hydrosocial outputflows. These output flows are referred to as blue molecule flows. In Table 2.1, flows 10and 11 and 14–21 are blue molecule flows. Such flows are parallel to the debit itemsdescribed above and are entered either as negative values under the supply column or
as positive values under the use column.Using these two colours, red and blue, in writing and printing any specific state-
ment has a heuristic value – water accounting throws up some puzzling questions.Because each red molecule from the supply side is re-entered as a blue molecule(negatively under supply or positively under use) total net supply is mathematicallyidentical to total use. In the water accounts ledger, with comprehensive and accuraterecords, the statement always balances.
It goes almost without saying that it is only as a thought-experiment that we canidentify every input molecule and trace it through to its metamorphosis as a blue mol-ecule. One hundred per cent tracing is not the point here. The crux of the techniqueis that, in principle, every drop of water supplied in the region in 1999 can be allo-
cated to either supply-side losses to the region or to regional use. A single set of mol-ecules is being categorized in two different ways, on entrance to the set of accountsand on exit from it, and this is why the mathematical identity of total net supply andtotal use holds true.
2.3 THE SUPPLY CATEGORIES
Let us now consider in turn each of the categories of supply in Table 2.1. Category 1is rainwater collection. This needs no gloss; it is found from the hamlets of theCaribbean island of Providencia to the site of the Millennium Dome in Greenwich.Rainwater collection always was and always will be with us.
Categories 2–5 refer to the abstraction of groundwater and surface water; each of these two sources is sub-divided into ‘first time through’ supply and ‘recycled’ supply.The use here of the term recycling requires clarification. The hydrosocial cycle of Figure 2.1 includes the collection of storm water and foul water and (after any treat-ment they receive) their routing back to rivers, lakes and aquifers. This and only thisI call recycling. The term does not embrace disposal to the sea.
Where regional abstraction takes place downstream of recycling points, suchabstraction flows can be decomposed into two parts: the abstraction of first-time water and the abstraction of recycled water. The quantitative ratio of these two flows
The regional water balance statement: a new tool 13

8/12/2019 1843391775
http://slidepdf.com/reader/full/1843391775 25/230
can be taken to be equal to the ratio of fresh water to recycled water in the streamflow at the abstraction point. Table 2.1 incorporates the distinction by breaking downinto two parts each of the red molecule abstraction flows. But note that the recycledflow into the fresh water source is neither a red nor a blue molecule flow. Recycled
water is recorded in the statement only when it is abstracted.In some regions, it may be right to ignore this break-down because it has no policyinterest, no relevance to foreseeable infrastructural investment. But where sustain-able water resource planning seeks to protect the hydrological cycle by the use of properly-treated recycled water, the distinction may be vital and measurement justi-fied. Recycling adds to effective rainfall as a source of water for abstraction, as can beseen from the planning documentation of the Thames catchment (NRA 1994). The water flows of the Thames are among the most intensively used in the world.
Categories 6 and 7 add the two red molecule flows: desalination of salt or brackish water, and the import of water from another region. This is big-time supply-fi x terri-tory, this is the western USA, this is California. Also added, for the sake of symmetryin water transfers, is the blue molecule flow of water exported to another region,
supply category 11.In addition to recycling, Figure 2.1 also includes two further green loops: internal
and external reuse. Internal reuse occurs when a household or a factory or any otherorganization reuses its own waste water. The water volume of internal reuse is setequal to each cubic metre of fresh water supplied to the user multiplied by the aver-age number of times it is reused. External reuse occurs when the waste water of oneorganization or group of households is reused by a separate body, as in the reuse of treated waste water by agriculture. These loops are included in Table 2.1 as the redmolecule flows of supply categories 8 and 9. The same volumes are entered as blue mol-
ecule fl ows in the categories of use. In this way, the fundamental mathematical identityis retained. Total net supply including reuse supply is equal to total use including its
reuse flows.My remarks above on the policy relevance of measuring recycled water apply also
to reuse. Note that the distinction between recycled and reused water is that the for-mer is water returned after its first use to river, lake and aquifer whilst the latter goesfor reuse before disposal to fresh or salt water sinks.
Supply category 10 is (like 11) a blue molecule flow; these leakages and evapor-ation in the supply system between the points of abstraction and the supply/useboundary are deducted in the calculation of total net supply.
2.4 WATER STORAGE
Up to this point, the balancing of the water accounts ledger has derived from thenotion that each and every molecule of water recorded as an input to the regional sys-tem in a given year, as part of a red molecule flow, is then recorded as an output fromthe system in that year as part of a blue molecule flow. The question then arises: doesthe existence of water storage infrastructures destroy the accounting balance? Ourunderstanding of this issue will be strengthened if we imagine the region’s storagecapacity as composed of just three reservoirs, one black, one gold and one green.
The black reservoir is dedicated to the storage of water abstracted in 1999 that inthe same year is distributed in its entirety to users or lost to leakage and evaporation.
14 The Price of Water

8/12/2019 1843391775
http://slidepdf.com/reader/full/1843391775 26/230
Clearly, storage of these pass-through molecules in the black reservoir does notchange the systemic balance for 1999.
The gold reservoir contains stored water abstracted during time-periods prior to1999. These molecules are, so to speak, a gift from the past to the present. In 1999
some of the stored water is lost to supply leakage and net evaporation, some may bedelivered as water exports to another region, and some is distributed to users. The fallin the quantity of water stored in the gold reservoir during 1999 is expressed in mega-litres per day and is deemed to be a red molecule flow. Once again, the identity of total net supply and total use is maintained.
The green reservoir is dedicated to the receipt of water abstracted during 1999, which will be stored for distribution from 2000 onwards, a gift from the present to thefuture. The increase in the volume stored in the green reservoir during 1999 isexpressed in megalitres per day and is deemed to be a blue molecule flow. This flowprecisely matches the abstraction flow pumped to the reservoir and, for the thirdtime, the mathematical identity holds.
In practice, of course, each reservoir in a real regional system combines the
functions of all three reservoirs described above. What we observe is only the net out-come of the component processes, that is, either no change in 1999 in the volume of stored water, or a fall or a rise. Thus, with respect to the value of M in Table 2.1,no change in the total volume of stored water gives a value of zero; a fall is expressedat its daily rate and is recorded as a red molecule flow; and a rise in storage isexpressed at its daily rate and is recorded as a blue molecule, negatively-valued flow.The analysis here of reservoir storage applies with equal force to aquifer storage andrecovery.
2.5 THE USE CATEGORIES
The use categories 14–21 of Table 2.1 can be swiftly dealt with. The categorization isdesigned to group together similar types of use so that use forecasting is facilitated. Ithas already been noted that the term use includes beneficial use, reuse, and the leak-age, evaporation and wastage occurring on user properties. In planning for any realregion categories 14–21 would be redesigned in the manner most effective for strat-egy development in that area.
Only category 20 requires further comment. It is already stated above that theregional water balance statement is a tool for strategy development in respect of abstracted fresh water for outstream uses. The statement does not, in general,address instream uses of water for nature conservation, leisure pursuits, fishing andnavigation. These uses are not of a kind that makes double-entry water accountingrelevant. However, instream flows are sometimes supplemented by abstraction. Forexample, in England and Wales British Waterways pumps groundwater to maintainthe necessary volumetric flows in its canals without which navigation and boating ishindered. Similarly, the Royal Society for the Protection of Birds in the UK may use water service company water supplies for application to the wetlands it manages inorder to maintain their environmental quality at times when rainfall and river flowsare deficient. Where red molecule flows are allocated in this way, these applicationsmust be recorded in category 20 in order to retain the necessary equivalence of totalnet supply and total use.
The regional water balance statement: a new tool 15

8/12/2019 1843391775
http://slidepdf.com/reader/full/1843391775 27/230
2.6 THE CHANGE STATEMENT
Regional water balance statements, as already indicated above, may be baseline state-ments for the past or present or they may be scenario statements for the future. When the
baseline and the scenario statement have the same structure, we can subtract the entriesof the former from the entries of the latter to give a regional water balance change state-ment. This result is illustrated in Table 2.2, where lower-case letters are used to indicate we are dealing with differences in values. Ten rules for the change statement are worthsetting out; they are all derived from a single arithmetic rule of subtraction of baseline(positive, zero and negative) values from scenario (positive, zero and negative) values.
• Where the value of a cell is unchanged between the baseline and the scenariostatements, the change value is zero.
• In the case of each of the red molecule flows from rainwater collection to externalreuse, if the value in the scenario year exceeds that of the baseline year, thechange value is positive.
• In the case of each of the red molecule flows from rainwater collection to externalreuse, if the value in the scenario year falls short of that of the baseline year, thechange value is negative.
• In the case of each of the blue molecule flows from household use to other uses, if the value in the scenario year exceeds that of the baseline year, the change value ispositive.
• In the case of each of the blue molecule flows from household use to other uses, if the value in the scenario year falls short of that of the baseline year, the change value is negative.
• In the case of each of the supply-side blue molecule flows (supply leakage/ evaporation and export of water to another region), if the absolute value in the
scenario year exceeds that of the baseline year, the change value is negative. Forexample, if we have a shift from a base year value of 7 Ml/d exported water to ascenario year value of 11Ml/d, the value of the letter l is 4Ml/d.
• In the case of each of the supply-side blue molecule flows (supply leakage/evapo-ration and export of water to another region), if the absolute value in the scenario year falls short of that of the baseline year, the change value is positive.
• In the case of stored water, the value of m is positive when a fall in the scenario year exceeds a fall in the baseline year or when a rise in the baseline year issucceeded by a fall in the scenario year.
• In the case of stored water, the value of m is negative when a fall in the scenario year falls short of a fall in the baseline year or when a fall in the baseline year issucceeded by a rise in the scenario year.
From these rules we can see that any single lower-case value may be positive, zero ornegative. In the change statement the total change in net supply is equal to the sum of entries a to m. Similarly, the total change in use is equal to the sum of entries s to z.
A final rule of great importance can be established. Since total net supply and totaluse in the baseline year are identically equal, and since total net supply and total usein the scenario year are identically equal, it follows like the night the day that thechange between the 2 years are identically equal. So, in the regional water balancechange statement, Merrett’s law states:
• Total change in net supply is mathematically identical with total change in use.
16 The Price of Water

8/12/2019 1843391775
http://slidepdf.com/reader/full/1843391775 28/230
The regional water balance statement: a new tool 17
T a b l e 2 . 2
A r e g i o n a l w a t e r
b a l a n c e c h a n g e s t a t e m e n t f o r t h e
1 0 - y e a r p e r i o d b e t w e e n 1 9 9 9 a n d 2 0 0 9 .
C a t e g o r i e s o f s u p p l y
C h a n g e s i n
C a t e g o r i e s o f u s e *
C h a n g
e s i n
m e g a l i t r e s / d a y
m e g a l i t r e s / d a y
1 . R a i n w a t e r c o l l e c t i o n
a
1 4 . H o u
s e h o l d s
s
2 . G r o u n d w a t e r a b s t r a c t i o
n : fi r s t t i m e t h r o u g h
b
1 5 . A g r i c u l t u r e
t
3 . G r o u n d w a t e r a b s t r a c t i o
n : r e c y c l e d s o u r c e s
c
1 6 . M i n
i n g
u
4 . S u r f a c e w a t e r a b s t r a c t i o
n : fi r s t t i m e t h r o u g h
d
1 7 . M a n u f a c t u r i n g
v
5 . S u r f a c e w a t e r a b s t r a c t i o
n : r e c y c l e d s o u r c e s
e
1 8 . P u b
l i c s e r v i c e s
w
6 . D e s a l i n a t i o n o f s a l t o r b
r a c k i s h w a t e r s
f
1 9 . C o m
m e r c i a l s e c t o r s
x
7 . I m p o r t o f w a t e r f r o m a n
o t h e r r e g i o n
g
2 0 . I n s t r e a m a p p l i c a t i o n s
y
8 . I n t e r n a l r e - u s e o f w a s t e
w a t e r
h
2 1 . O t h
e r u s e s
z
9 . E x t e r n a l r e - u s e o f w a s t e
w a t e r
j
2 2 .
T o t a l C h a n g e i n U s e
s t
…
y
z
1 0 . L e s s : s u p p l y l e a k a g e a n d e v a p o r a t i o n
k
1 1 . L e s s : e x p o r t o f w a t e r t o
a n o t h e r r e g i o n
l
1 2 . F a l l o r r i s e o f v o l u m e o f
s t o r e d w a t e r
m
1 3 .
T o t a l C h a n g e s i n N e t S u
p p l y
a b
…
l m
* I n c l u d e s b e n e fi c i a l u s e , r e - u s e
v o l u m e s , a n d l e a k a g e , e v a p o r a t i o n a n d w a s t a g e o n u s e r p r o p e r t y .

8/12/2019 1843391775
http://slidepdf.com/reader/full/1843391775 29/230

8/12/2019 1843391775
http://slidepdf.com/reader/full/1843391775 30/230
publication is one of UNESCO’s studies and reports in hydrology and was written as acontribution to the International Hydrological Programme. Not surprisingly, theauthors’ approach to flows, stocks and balances is essentially hydrological, nothydrosocial. Their Chapter 4 is entitled Basic theoretical principles for processing a
water resources balance. It suggests that the core component of any water resourcesmaster plan is the water resources management balance (WRMB). However, in agraphic illustrating the water resources balance approach, the supply-side variablesare predominantly hydrological and the uses of water are not represented at all.Moreover the terms of the general WRMB equation for a given area in a given time-period embraces a mixture of hydrological variables (such as rainfall and aquiferflows) and engineering variables (such as artificial water conduit flows and dischargesby water users). The general equation and the specific equations derived from it sim-ply do not seek to report the balance between how human society in a given area gainsaccess to its water and how it uses it. So the WRMB, however necessary, is strikinglydifferent from the regional water balance statement presented in this paper.
My third and last example of the received wisdom is the Assessment of water
resources and water availability in the world authored by I.A. Shiklomanov and pub-lished by the World Meteorological Organization (WMO) in 1997. Chapters 1–4 areentirely hydrological in their orientation to resource availability, with a special stresson river runoff. Chapter 5 (Water resources use) and Chapter 6 (Water availability and
water resources de fi cit in the world) contain valuable synoptic material on patterns of water consumption but the supply-side concept never moves beyond either thegeneric term ‘ water withdrawal’ or the two-fold breakdown of supply into surface water and groundwater sources. Once again the approach is unaware of the richnessof the concept of supply when it is located within the hydrosocial rather than thehydrological paradigm, with the huge relevance this has to catchment planning; andat no point does the WMO text set up a regional water balance statement conceived
as a mathematical identity.
2.8 CONCLUSIONS
I have argued that a regional water balance statement of the type presented inTable 2.1 and the change statement of Table 2.2 make a radical break with existingapproaches, in fact complement them, and that the new tool has a strong relevance to water resource planning practice. But it is a mistake to gild the lily. The limitations of the statement must also be recognized: it is a quantitative technique that embodies nohydrological or meteorological variables; for all practical purposes it does not address
instream uses; and it makes no reference to water quality. Thus the regional waterbalance statement should be seen only as one of the many, interdependent approachesand techniques necessary for effective water resource management.
The regional water balance statement: a new tool 19
The material in this chapter originally appeared in: The regional water balance statement: a newtool for water resources planning. Water International, 24(3): 268–274, 1999.

8/12/2019 1843391775
http://slidepdf.com/reader/full/1843391775 31/230
20
3
Integrated water resourcesmanagement and the
hydrosocial balance
To see a world in a grain of sand…
William Blake (1803)
3.1 INTRODUCTION
Integrated water resources management (IWRM) seeks to integrate in many differ-ent ways: the social sciences with the natural sciences, planning with implementation,and groundwater with surface water, to mention just three such ways. The first object-ive of this paper is briefl y to introduce a planning method, the hydrosocial balance,and to show how it integrates: (i) outstream water quantities supplied and used, and(ii) the present with the future. The paper then shows how the hydrosocial balancecan be developed to integrate water qualities with water quantities. The paper’s thirdand final objective is to apply this management tool to a case-study from the island of Jersey in the English Channel.
3.2 A NEW IMPLEMENT FOR THE IWRM TOOLBOX
This section recapitulates the main features of a new water resources managementtool, the hydrosocial balance, developed over several years. It is a tool that until nowhas been limited to the analysis only of water quantities (Merrett 1997: 15–22; 1999:268–74; 2002: 148–53).
C 2007 IWA Publishing. ThePrice of Water: Studies in Water ResourceEconomicsand Management
2nd Edition by Stephen Merrett. ISBN: 9781843391777. Published by IWA Publishing, London, UK.

8/12/2019 1843391775
http://slidepdf.com/reader/full/1843391775 32/230
The hydrosocial balance is a quantitative water resources planning method applic-able in principle to any space with a defined boundary. This might be a house on thecoast of Andalucía, Wembley football stadium, the island of Gorgona, the catchmentof the Yangtse, the State of California, or the continent of Africa. Such spaces are
referred to here generically as ‘regions’ and are not required to be related to trad-itional ‘catchment’ areas. The hydrosocial balance’s principal distinctiveness from the‘ water balance’ familiar to hydrologists is that the former incorporates (almost with-out exception) only outstream, hydrosocial flows, and never the hydrological flows of precipitation, groundwater recharge, run-off and rivers. The water flows that it placesat the centre of analysis and measurement are those directly created by human soci-ety; the idea of a hydrosocial balance is derived from the concept of the hydrosocialcycle (Merrett 1997: 6–7). A hydrosocial flow represents a human activity. So thehydrosocial balance, composed as it is of many hydrosocial flows, is understood pri-marily through the social sciences. In contrast, the hydrological balance representsnatural flows and is understood primarily through the natural sciences.
To summarize, hydrological flows are of a type that exists in a state of nature, prior
to the recent appearance of Homo sapiens. Hydrosocial flows, in contrast, are specificto human society. In recent centuries these two types of flow have become ever morepowerfully interdependent with the growth of world population and its economicactivities of production and consumption. The water balance of an area and thatarea’s hydrosocial balance should be estimated separately prior to considering theirquantitative and qualitative interdependence.
The generic form of the hydrosocial balance for a specified region is given in Table 3.1. A baseline balance is for a past time-period, such as the year 2001. A scenario balanceis for a future time-period such as the year 2007. The shift in the quantity in millionsof cubic metres (Mcm) of any one category of supply or use between the baseline yearand the scenario year can be represented both as an absolute change, vide column 4 of
Table 3.1, as well as an annual rate of growth or decline, vide column 5.The baseline balance provides a comprehensive, synoptic account both of the scale
and composition of the supply sources of water as well as their use in the region itcovers. Where measurement is accurate and comprehensive, the total net supply is alwaysequal to total use. Scenario balances provide options for the future, based on the fore-cast need for outstream water in different uses and the possible allocation conflicts thatmay be foreseen. Once again, total net supply must be planned to equal total use. Theabsolute difference of supply, and of use, between the base year and any specific scen-ario year, together with the associated annual rate of change, provide the basic input tothe planning of infrastructural investment, capitalfinancing and demand management.
3.3 THE BRIDGE BETWEEN QUANTITY AND QUALITY
The previous section focused entirely on quantity. In this section a bridge is built thatlinks quantity to quality. Table 3.1, for a given base year or scenario year, has morethan a dozen supply-side and demand-side flows. All these flows, plus the post-useflows of waste water (including irrigation drainage), can be reclassified into the fi vegroups set out in Table 3.2. Note that in a region where there is no treatment of the water supply, or of waste water, one has only groups one, three and four: the supplyflow, the use flow and the waste water flow.

8/12/2019 1843391775
http://slidepdf.com/reader/full/1843391775 33/230
T a b l e 3 . 1
T h e h y d r o s o c i a l b
a l a n c e f o r a s p e c i fi e d r e g i o n i n a
b a s e y e a r a n d a s c e n a r i o y e a r ( i n m i l l i o n s o f c u b i c m e t r e s , m c m ) .
B a s e y e a r
S c e n a r i o y e a r
S c e n a r i o y e a r
m i n u s
A n n u a l c o m p o u n d r a t e o f
b a s e y e a r ( o r )
g r o w t h f r o m t h e b a s e y e a r
t o t h e s c e n a r i o y e a r (
% ) (
o r )
C a t e g o r i e s o f S u p p l y
R a i n w a t e r c o l l e c t i o n
A 1
A 2
A 2
A 1
G a
G r o u n d w a t e r a b s t r a c t i o n
B 1
B 2
B 2
B 1
G b
S u r f a c e w a t e r a b s t r a c t i o n
C 1
C 2
C 2
C 1
G c
D e s a l i n a t i o n
D 1
D 2
D 2
D 1
G d
I m p o r t o f w a t e r f r o m o t h e r r
e g i o n s
E 1
E 2
E 2
E 1
G e
I n t e r n a l r e u s e o f w a s t e w a t e r
F 1
F 2
F 2
F 1
G f
E x t e r n a l r e u s e o f w a s t e w a t e r
G 1
G 2
G 2
G 1
G g
T o t a l G r o s s S u p p l y
H 1
H 2
H 2
H 1
G h
S u p p l y l e a k a g e a n d e v a p o r a t i o n
J 1
J 2
( J 2 )
( J 1 )
G j
E x p o r t o f w a t e r t o o t h e r r e g i o n s
K 1
K
2
( K 2 )
( K
1 )
G k
F a l l ( ) o r r i s e ( ) i n v o l u m
e o f w a t e r
a b s t r a c t e d a n d s t o r e d
L 1
L
2
( L 2 )
( L
1 )
–
T o t a l N e t S u p p l y
M 1
M 2
M 2
M 1
G m
C a t e g o r i e s o f U s e
H o u s e h o l d s
S 1
S 2
S 2
S 1
G s
A g r i c u l t u r e
T 1
T 2
T 2
T 1
G t
M i n i n g
U 1
U 2
U 2
U 1
G u
M a n u f a c t u r i n g
V 1
V 2
V 2
V 1
G v
P u b l i c s e r v i c e s
W 1
W 2
W 2
W 1
G w
P r i v a t e s e r v i c e s
X 1
X 2
X 2
X 1
G x
O t h e r u s e s
Y 1
Y 2
Y 2
Y 1
G y
T o t a l U s e
Z 1
Z 2
Z 2
Z 1
G z
N o t e : G j a n d G k a r e c a l c u l a t e d u s i n g a b s o l u t e v a l u e s o f l e a k a g e a n d e x p o r t s . G l i s n o t c a l c u l a t e d b e c a u s e o f t h e p o s s i b l e c h a n g e o f s i g n .
S o u r c e : A d a p t e d f r o m M e r r e t t ( 2 0 0 2 a ) , T a b l e s 7 . 1 a n d 7 . 2 .

8/12/2019 1843391775
http://slidepdf.com/reader/full/1843391775 34/230
For any of the flows of Table 3.2, its complex quality can be assessed provided thata water institution has the skilled professionals and the laboratories to carry out thenecessary analysis. At the most general level, a flow’s quality can be measured byapplying four criteria to samples taken from the flow:
1. The individual inorganics present in the samples (such as arsenic, lead and zinc).2. The individual organics present (such as atrazine, malathion and 2,4-D).3. The microbiological content of the samples (in terms such as faecal coliforms,
pathogenic staphylococci and salmonella).4. Other indicator measures (such as biochemical oxygen demand, total suspended
solids and pH).
However, if one considers the hundreds of individual characteristics that can begenerated by these four criteria, it would require a prodigious hydrochemical infra-structure to process comprehensively even a single sample from a single flow. Someasurement must always be targeted, principally by considering the ‘fit for purpose’needs of the analysis. That is to say, one reviews what the water flow under assess-
ment is to be used for, or to which location it is to be discharged. So, at the most elem-entary level, if the water that is sampled has to meet drinking water standards, as it will be pumped to domestic premises, then the water quality assessment is quite dif-ferent from that for water one plans to discharge to coastal waters. Moreover, the twoflows will be governed by different legislation and standards.
In summary, the bridge linking the quantities of the hydrosocial balance to theirqualities is built in the following manner. One recognizes first that the quantities of the hydrosocial balance fall into the flow types of Table 3.2; second that each flow’squality can be assessed in terms of the four criteria listed above; and third that thespecification of the assessment should be based on the resources available to carryit out, the legislative requirements to meet prescribed standards, and the fit-for-purpose requirements of the hydrosocial balance flows themselves.
This suggests a new term is required. When one has a cross-tabulation for a spe-cific hydrosocial flow with: (i) rows that refer to that flow’s qualitative characteristics,and (ii) columns setting out the number of samples made and the measured concen-tration per litre or measured value of each characteristic, this will be referred to as a quality matrix.
Up to this point the text is at a high order of generality. Sections 3.4–3.7 record anattempt to apply this analytic framework, or meta-theory, to the island of Jersey.Beginning with the geographical and hydrological background, the paper moves onto cover the supply-side of the hydrosocial balance, then the use of water in Jersey,and finally the complex issues of water quality. The case-study benefits from recent
Table 3.2 Flow types in the hydrosocial cycle.
Supply-side flows Use-flows Waste water flows
1 2 3 4 5
Prior to After At the point Prior to Aftertreatment treatment of use treatment treatment
Note. The supply-side flows include supply leakage. The waste water flows include irrigationdrainage. Different levels of treatment produce different quality products at different costs with different implications for users and the environment.

8/12/2019 1843391775
http://slidepdf.com/reader/full/1843391775 35/230
hydrogeological publications of great quality, as well as a series of interviews with keypersonnel.
3.4 THE PHYSICAL GEOGRAPHY AND HYDROLOGYOF JERSEY
The island of Jersey is located in the English Channel, some 60 km north of theFrench coastal town of St Malo. It has an area of 117 km2 and in 2001 had a residentpopulation of about 85,000 persons, giving a density of 726 persons/km2. As Robins(2000: 2–3) points out, the island comprises a plateau lying at an elevation of 60–120 m divided by a series of valleys running from north to south. The bedrockbeneath Jersey mostly consists of ancient metamorphosed shales of Precambrian ageintruded by younger igneous rocks. Unconsolidated deposits of Quaternary age par-tially cover the bedrock, whilst post-glacial peat, alluvium and sand are also present in
valleys and low-lying coastal areas.Westerly and south-westerly winds bring moisture from the Atlantic. Long-term
average rainfall for the island is 877mm, annually varying from 600 to 1100mm in thepast decade. Mean annual potential evapotranspiration ranges from 648 to 784mm.The 136-year monthly average rainfall shows that the bulk of precipitation occurs inthe 7 months September–March (Jersey New Waterworks Company 2002: 4).
Flow along the valley streams is north to south and, in the absence of a dry winter,takes place throughout the year. Groundwater discharges both to these streams andat the coast. During prolonged dry weather, saline intrusion may occur locally.Robins writes (2000: 8): ‘There is a notable variation in run-off and infiltration from year to year. Poor winter rains had a marked effect on values for the notorious dry
years 1975/76, and the periods 1989 to 1992 and 1995/96. These dry years are signifi-cant, as it is these years of water stress that the Island needs to be able to cope with interms of surface water storage capacity and conjunctive abstraction of groundwater.’
Robins also shows that the island’s base flow index has an estimated value of 0.58,indicating that 58% of streamflow is derived from the groundwater baseflow (Robins2000: Table 1; Blackie et al. 1996). This quantity will be of importance in the discus-sion of water quality in Section 3.7.
3.5 WATER SUPPLY IN JERSEY
At this point one can begin to review the principal actors in Jersey that supply waterand that use it. As this is done, the jigsaw of Jersey’s hydrosocial balance is assembledin Table 3.3.
There can be no question that the principal supply-side provider is the Jersey NewWaterworks Company (JNWWC). This is the island’s only water utility. However, waste water collection, treatment and discharge are the responsibility of the States of Jersey’s Public Services Department (PSD).
The JNWWC is a water undertaking incorporated in 1882 and its principal activ-ities are the supply and treatment of water for domestic use and other purposes on theisland. The States of Jersey, the island’s government, holds 100% of the issued ‘ A ’

8/12/2019 1843391775
http://slidepdf.com/reader/full/1843391775 36/230
Table 3.3 The hydrosocial balance of the states of Jersey in 2001.
Row Categories of supply Mcm
3 Surface water and groundwater abstraction
by the JNWWC 6.24 Desalination by the JNWWC 1.15 Groundwater abstraction by farmers, households, etc. 3.66 Surface water abstraction by farmers not known7 Rainwater collection net of evaporation 0.18 Internal reuse 0.19 External reuse 0.1
10 Imports from other regions 0.011 Total Gross Supply 10.9
12 Less: exports to other regions 0.013 Less: supply leakage and evaporation 0.714 Change in volume of water abstracted and stored 0.1
15 Total Net Supply 10.216 Categories of Use Mcm17 Sourced by the JNWWC18 Households 4.519 Agriculture 0.120 Manufacturing 0.121 Public services 0.622 Private services 1.323 Other uses 0.124 Sub-Total 6.5
25 Sourced by groundwater pumped by farmers,households, etc.
26 Households 0.927 Agriculture 1.428 Industry 0.129 Hotels and hospitals 0.130 Leisure 0.831 Other 0.332 Sub-Total 3.6
33 Irrigation water use sourced by farmers’ surface waterabstraction not known
34 Irrigation water use sourced by rainwater collection 0.135 Error term 0.136 Total Use 10.2
ordinary shares. However, the utility acts like a private company. It has a desalinationplant, six reservoirs, an extensive network of raw water mains, two treatment plantsand a distribution infrastructure to the island’s users. The total length of the trunkmains is 70 km and of the service mains 415 km. In 2001 the company had a turnoverof £11.0 million, it employed 112 persons and the balance sheet shows that its fi xedassets, excluding landholdings, were valued at £47.7 million (JNWWC 2002).
Of the annual volume of water abstracted by the JNWWC, the overwhelmingshare is from its surface water reservoirs. Total abstraction in 2001 was 6.2 Mcm to

8/12/2019 1843391775
http://slidepdf.com/reader/full/1843391775 37/230
which one should add 1.1 Mcm output from the desalination plant at La Rosière. Thisis shown in Table 3.3, rows 3 and 4. Note that, for management purposes, there is agood deal of switching of surface water between reservoirs, but from the perspectiveof the island as a whole, this can be ignored in calculating the abstraction total. The
low reliance on groundwater as a primary source of supply, in contrast to surface water, may be because the prime costs of bulk surface water abstraction are lowerthan for groundwater, given that the main aquifers are of only poor to moderatetransmissivity. Another explanation is that the company believes groundwater qualityto be inferior to that of surface water in Jersey (see Section 3.7 below).
If the JNWWC is the principal supply-side provider, the second most significantsupply source is a group made up of individual farmers and households. Agriculture’sneeds for water are met largely from supply points on the farms themselves. Theseare either boreholes or ponds fed by small streams. The financial costs of pumpingfrom these boreholes and ponds are borne by the farmer. At the present time, bore-holes are neither registered nor licensed nor metered, nor is any abstraction chargelevied by the States. The same holds true for abstraction from farm ponds; in this case
farmers usually have mobile diesel engines to pump the water from pond to field or tofarm buildings (Vint, pers. comm.).
About 15% of the island’s resident households are unconnected to the JNWWCnetwork and about 17% have no link to the PSD’s sewerage. There is a large overlapbetween these two groups of the more isolated households. Families off the water sup-ply network use boreholes and wells for their domestic supplies. Once again these indi- vidual supply points are unregistered, unlicensed, unmetered and there is no chargefor their abstraction. One can say that access to the aquifer by these individual farmersand households is outside the sphere of the States’ management of the island’s waterresources.
This unmeasured and unmanaged characteristic of surface water and groundwater
abstraction by most farmers and a minority of households raises obvious dif ficulties inestimating Jersey’s hydrosocial balance. However, estimates of groundwater abstrac-tion and springflow interception were made for the dry years 1989–91, when boreholemeters were installed following the State of Emergency powers granted during the 1989drought (Robins 2000: 15). The number of supply sources at that time were: 500 in agri-culture, 4000 in the domestic sector, 50 in the leisure sector and about 80 others. Robinssuggests that the average use of groundwater remained generally stable during the1990s and is likely to be little changed ‘to this day’. This gives an annual rate of ground- water abstraction by private actors of approximately 3.6Mcm in Table 3.3, row 5.
Rainwater collection is now considered. It is known that some householders notconnected to the mains supply collect water on their roofs and route it to a cistern.The scale of this is believed to be small. More important is the greenhouse sector.This includes polytunnels and glasshouses. Some farmers have very large glasshousesfor the commercial production of flowers, vegetables and soft fruit. They capture run-off from the roofs by channelling it along the roof-gutters and through downpipes to water tanks. The Jersey Department of Agriculture and Fisheries (DAF) suggest thatthe total area of glasshouse roofs is some 51,000m2. Net of evaporative loss, rainfallon these roofs was 537 mm in 2001, giving rainwater collection in this case of about27,000m3; this also is recorded in Table 3.3, row 7. The evaporative loss is low becauserainfall is channelled quickly and directly to the collection tanks.
Internal and external reuse in Table 3.3 now needs to be considered. Reuse refersto water resource flows that, after abstraction, are first used in the domestic, industrial
8/12/2019 1843391775
http://slidepdf.com/reader/full/1843391775 38/230
or irrigation sectors and then are used for a second time or, indeed, time and timeagain prior to recycling back to lake, river and aquifer (Merrett 2002a: 8). Internalreuse occurs when the repeated use is by the same institution where the water wasfirst used. This is familiar in the industrial sector, and increasingly in the domestic
sector where grey water is reused to irrigate gardens and to flush toilets. Externalreuse takes place when the repeated use is by a different institution, such as the use of waste water from the cities for the irrigation of farmland; the cases of Ghana andIsrael can be cited here. The importance of internal and external reuse to the hydro-economist is that it multiplies the productivity of a given volume of water appropriatedas a base flow. The water quality of the ef fluent reused and the degree of treatment(if any) that it undergoes are critical issues. In response to questions on this subject toa number of water resource professionals in Jersey there was a common answer: casesof reuse can be found but the aggregate scale on the island is negligibly small. Themost common case is one of internal reuse: households that use their kitchen water toirrigate their gardens.
The last entry under total gross supply in Table 3.3 is the bulk import of water to
Jersey. This simply does not take place.One can now estimate the total gross supply; the figure is 10.9Mcm for the year
2001. However, this total excludes the volume of one non-negligible entry for whichno estimate exists: surface water abstraction by farmers from the ponds and pools ontheir land that are fed by small streams. In future the Water Resources (Jersey) Lawthat has recently been drafted will address this.
To move from total gross supply to total net supply, three adjustments have to bemade: for exports, losses and storage change. Exports of bulk water by Jersey to otherregions, as with imports, are zero. However, supply-side leakage and evaporation of abstracted water between the point of abstraction up to the boundary of users’ prop-erties is of real importance. The JNWWC has a number of staff who work to keep
losses down to an economic level. The company estimates that in 2001 their losses were 6% of gross supply, an extraordinarily low figure by British and world standards.In the complete absence of other data, the same percentage is also used here forgroundwater abstraction by farmers, households and others. This gives an entry inTable 3.3, row 13 of 0.7Mcm.
Lastly, row 14 in Table 3.3 refers to changes in the volume of water abstracted andstored. The logical place of this category in the hydrosocial balance is described atlength elsewhere (Merrett 2002a: 150–1). It is suf ficient to say here that the entry refersonly to changes in the volume of stored water that has already been captured, appro-priated or abstracted in some way. It does not refer to hydrological changes in the vol-ume of water in a lake or behind a barrage resulting from variation in a catchment’sriver flows. In the case of Jersey, the volume of abstracted water in storage in this senseis quite small at any point in time, so that changes in its volume over the course of a yearare negligibly small and can be ignored. The end result is that, for the time being, thebest estimate of total net supply in Jersey for the year 2001 is 10.2 million cubic metres.
3.6 WATER USE IN JERSEY
This section addresses water use on Jersey in the baseline year of 2001. The use datain Table 3.3 can be seen to fall into two principal blocks: uses sourced by the JNWWC

8/12/2019 1843391775
http://slidepdf.com/reader/full/1843391775 39/230
and those sourced by private abstraction of groundwater. Examination of the table’scategories of use and the volumes known to be used lead to a clear conclusion: 88%of the known total is made up by just three groups of users. In descending order theseare: households, private services and agriculture.
Use by households is the largest category by far, totalling 5.4Mcm. In the year2001, the resident population of Jersey was about 85,000. There are individual housesand villages all over the island but the largest population concentration is on thesouth coast, particularly in Jersey’s capital, St Helier. Dividing use by resident popu-lation gives a figure of 174 litres per head per day (lhd) for domestic use. This israther high compared with the UK average of 147 lhd, which in any case is (mis-takenly) inclusive of supply-side losses (Environment Agency 2002). Of the 5.4 milliontotal, 4.1 Mcm is used by JNWWC customers who are not metered. Their domestic water supply charges are based on the capital value of their property. So there existsno price signal to encourage demand management in these cases. This may explain,partially at least, the high domestic use average.
Private services rank second among the users of water in Table 3.3. The JNWWC’s
water demand staff provide a useful breakdown of this category. It includes, in descend-ing order of volume: hotels and guest houses; of fices, banks and shops; public houses;restaurants; sports facilities; stores, garages and car parks; clubs, parish halls and daycentres; laundries; and hair and beauty salons. The two dominant economic contribu-tors to Jersey’s gross domestic product are the financial services sector and tourism; thisexplains the salience of private services as a user of water. At the height of the summerthere are around 35,000 tourists on the island; this generates a strong summer surge indemand. All commercial properties are metered. However, there is no metering of tourists’ and visitors’ individual water use within their hotels and lodging houses.
Even excluding the irrigation water pumped from on-farm ponds, agriculture is thethird largest user of water. Uses include net irrigation requirements, livestock water-
ing, cleansing of farm buildings and machinery, and product washing. Traditionally theJersey economy has been regarded as quintessentially agricultural (Frigot 2001). Evenin 2001, farmland constituted 49.6% of the island’s area, with 352 farmholdings. Theprincipal outputs from the sector are ‘Jersey Royal’ potatoes, tomatoes, and the dairyproducts of the island’s 4550 Jersey cows and heifers (DAF 2002). Jersey soils areinherently low in organic matter and in most cases multi-cropping requires the add-ition of fertilizer.
Returning to Table 3.3, one sees sub-totals of 5.4 Mcm for household use (rows 18and 26), 2.1 Mcm for private services (22 and 30) and 1.4 Mcm for agriculture (19 and27). Adding in the remaining uses specified, as well as an error term of 0.1Mcm tooffset the difference between estimated total net supply and total recorded use, givestotal use of 10.2 Mcm.
3.7 WATER QUALITY IN JERSEY
The water quality of Jersey is a large subject. Here the discussion is limited to fi vehydrosocial flows selected because of their particular interest for water resourcesmanagement. These fi ve flows are the irrigation returns of farm use, the abstractionof groundwater by households unconnected to the JNWWC’s water supply, thedomestic waste water from households unconnected to the PSD’s sewerage, the

8/12/2019 1843391775
http://slidepdf.com/reader/full/1843391775 40/230
JNWWC’s distribution to households, private and public services, etc. and the PSD’sdischarges to coastal waters. Quality matrices will be deployed below for the last twoof these fi ve flows, to illustrate the link of quality to quantity.
3.7.1 Irrigation returns
The water requirements of Jersey’s crops are met both by rainfall and by irrigation, asis the case with the water needs of its parks and golf courses. Part of this joint flow isconsumed as evapotranspiration. The remainder flows by gravity as field drainage,either as run-off to local streams or by percolating down to the aquifer. At present, no water quality analysis is directly made of agricultural drainage in the island on aregular basis. However, a number of studies exist that are relevant to linkage betweenfarmland drainage and groundwater quality. Robins & Smedley (1998) have pre-sented the evidence in great detail. Jersey’s farmers do not stint in their use of fertil-izers, particularly for early potatoes. These include the traditional 20–10–10 NPK product as well as livestock slurry, the manure of grazing cattle and, now on a
much-reduced scale in comparison with the past, vraic – the local term for seaweedcollected from the beaches. These inputs contain inter alia nitrates, phosphorus andpotassium. Robins (2000: 26), reporting on work by Lott et al. (1999), states: ‘… thecontinued zealous use of nitrate fertilizer and application of farm slurry remainslargely above recommended levels for the UK …’. Chilton & Bird (1994) did carryout research specifically into the pore water below farmers’ fields. They noted corre-lations with fertilizer use not only of nitrates but also of the other common fertilizerions of ammonium, chloride and sulphate. Since Lott’s report, the Department of Agriculture and Fisheries, in a personal communication, writes that there isincreasing evidence that a majority of the farming industry has now adopted changedpractices.
Farmers also use herbicides and fungicides, and their residues and metabolitesexist in farmland drainage. Until it was banned in Jersey in 1998, the pesticidechlorthal dimethyl was an ingredient in pesticides applied to brassicas and soft fruits. A principal degradation product, the metabolite chlorthal, is environmentally persist-ent. Matthews & Carter (1999) modelled its movements and concluded that by 2002farmland drainage would in all cases have concentrations less than the critical level of 0.1 micrograms per litre. However, by October 2002 it was still well above the criticallevel in surface water and groundwater (G. Jackson, pers. comm.).
Certainly there exists a Water Pollution Law (PSD 2000) to safeguard surface water and groundwater from contamination. This is targeted principally at pointsources but Articles 12–16 can tackle diffuse pollution issues. The DAF also has anagriculture–environment scheme that aims at the better management of slurry,reduced fertilizer use and increased care in the use of biocides. The Water PollutionLaw will also be used to introduce water management areas and these areas maythemselves stimulate action to reduce the contamination that originates from farm-land drainage. Such drainage is said to be the origin of some 75% of the nitrate con-tamination of the island’s groundwater (JNWWC 2002: 5).
In the case of this first flow, farmland drainage sourced by irrigation returns andrainfall, there is a strong case for wishing to examine its current quality matrix, but nosuch matrix appears to exist.

8/12/2019 1843391775
http://slidepdf.com/reader/full/1843391775 41/230
3.7.2 Groundwater abstracted by households for their domestic needs
We have already seen that about 15% of the island’s households have no water supplyconnection to the JNWWC. They rely on their own wells and boreholes and are therebyexposed to the raw state of the aquifer and thereby to the diffuse contamination of groundwater by farming practice. There are believed to be approximately 5200 domesticpremises dependent on groundwater sources. Robins and Smedley write: ‘Under the UK Environment Agency’s classification, all aquifers in Jersey would be classified as “highly vulnerable” because of the importance of fracturing (by-pass flow), lack of impermeablecover and the shallow depth to the water table’ (Robins & Smedley 1998: 17).
To reduce their exposure to groundwater contaminants some households haveinvested in private treatment systems. The public health aspects of domestic boreholesupply lies with the Department of Environmental Health. A sample of 52 boreholes and wells across the island are monitored in May and November of each year for inorganics,16 of which are further analysed for pesticides and microbiological contamination.
3.7.3 Discharges by households of their own waste water
This is the second case of households unconnected to the island’s dominant infra-structures. It is said that about 17% of households have no access to the PSD’s sewer-age. The special position of this group lies in the quality of its domestic waste waterdischarges. In fact, the PSD reports (2000: 1) ‘Sewage pollution of water from mal-functioning private drainage systems is common…’. Robins & Smedley (1998: 13)suggest that the average daily discharge per household is about 600 litres. An analysisof the Val de la Mare catchment’s nitrogen export coef ficients by Lott et al. (1999)showed that 10% of the nitrogen was sourced by domestic water from septic tanksand soakaways, which was as much as the contamination by livestock.
The Water Pollution (Jersey) Law 2000 requires that owners of septic tanks, tighttanks, soakaways or private sewage treatment plants have a discharge permit only where such discharges result in or are likely to result in the contamination of controlled waters. Gass et al. (1996: 45) recommend that all soakaways and septic tanks should betaken out of use and sewerage extended to the whole island population. However, theydo not say why effective private treatment by households should be eliminated, nor dothey estimate the economic costs of extending the PSD’s sewerage network.
3.7.4 The JNWWC’s supply to its customers
In earlier sections of this paper it has been shown that the JNWWC supplies two-thirdsof Jersey’s total gross supply, excluding surface abstraction by farmers. The qualitativeassessment of its treated water supply is detailed and appears in Table 3.4. The qualitymatrices published by the JNWWC (2002: 28–30) cover altogether 33 characteristics of the treated water supply, two of which are for microbiological standards. In the case of the other three quality categories – individual inorganics, individual organics and othermeasures – four or fi ve examples from each are selected, including all those cases whereone or more samples exceed the maximum admissible concentration (MAC).
Table 3.4 is a baseline statement of quantities in respect of 16 separate qualitativecharacteristics of a hydrosocial flow. Just as the hydrosocial balance can be assigned ascenario balance, so too can a quality matrix be assigned a scenario matrix. Theparallel between the hydrosocial balance and the quality matrix is strong here and

8/12/2019 1843391775
http://slidepdf.com/reader/full/1843391775 42/230
T a b l e 3 . 4
A q u a l i t y m a t r i x f o r t h e J N W W C ’ S t r e a t e d w a t e r s u p p l y i n J e r s e y i n 2 0 0 1 .
C o n c e n t r a t i o n
M a x i m u m a d m i s s i b l e
M i n i m u m
M e a n
M a
x i m u m
N u m b e r o f
% o f
c o n c e n t r a t i o n o r
s a m p l e s
s a m p l e s
M A C
v a l u e ( M A C ) 2
t a k e n
I n d i v i d u a l I n o r g a n i c s
N i t r a t e
5 0 m i l l i g r a m s N O 3 / l i t r e
2 8 . 5
4 6 . 7
6 9 . 0
1 5 7
3 1
N i t r i t e
0 . 1 m i l l i g r a m s N O 2 / l i t r e
0 . 0 0 1
0 . 0 3 7
0 . 2 1 9
1 5 5
1 2
C h l o r i d e
4 0 0 m i l l i g r a m s C l / l i t r e
5 4
7 3
9 0
1 5 5
0
M a n g a n e s e
5 0 m i c r o g r a m s M n / l i t r e
2 0
2 0
6 5
1 5 7
1
L e a d
5 0 m i c r o g r a m s P b / l i t r e
1
5
5 3
7 4
1
I n d i v i d u a l O r g a n i c s
A t r a z i n e
0 . 1 m i c r o g r a m s / l i t r e
0 . 0 1
0 . 0 1
0 . 0 1 3
1 0
0
S i m a z i n e
0 . 1 m i c r o g r a m s / l i t r e
0 . 0 1
0 . 0 1
0 . 0 1 2
1 0
0
C y a n a z i n e
0 . 1 m i c r o g r a m s / l i t r e
0 . 0 1
0 . 0 2
0 . 1 2
5 2
1
M e c o p r o p
0 . 1 m i c r o g r a m s / l i t r e
0 . 0 1
0 . 0 1
0 . 0 2
5 0
0
D a l a p o n
0 . 1 m i c r o g r a m s / l i t r e
0 . 0 1
0 . 0 1
0 . 0 2
9
0
M i c r o b i o l o g i c a l S t a n d a r d s
T o t a l c o l i f o r m s 1
5 2 3
1
F a e c a l c o l i f o r m s 1
5 2 3
0
O t h e r M e a s u r e s
p H
6 . 5 – 9 . 5
7 . 2
7 . 4
8 . 3
2 2 9
0
T u r b i d i t y ( s u s p e n d e d s o l i d s )
4 N . T . U .
0 . 0 8
0 . 2 7
1 . 5
1 5 4
0
C o l o u r
2 0 H a z e n u n i t s
0 . 5
4 . 3
5 . 0
1 5 5
0
D i s s o l v e d s o l i d s
1 5 0 0 m i l l i g r a m s / l i t r e
2 3 0
3 8 9
4 8 5
1 5 3
0
N o t e s : 1 Z o n e 1 –
E a s t . R a n d o m
c o n s u m e r t a p s a n d fi x e d p o i n t s . 2 T h e s e a l l a p p e a r t o b e E U v a l u e s b u t t h e s o u r c e d o e s n o t m a k e t h i s c l e a r .
S o u r c e : J N W W C ( 2 0 0 2 ) : 2 8 – 3 0 .

8/12/2019 1843391775
http://slidepdf.com/reader/full/1843391775 43/230
shows that, in an IWRM context, both the balance and the matrix can be treated inparallel ways, and can have a baseline table calculated and a scenario table set as atarget for water resource managers. The principal difference between balance andmatrix is that a region has only a single baseline hydrosocial balance but it has a base-
line quality matrix for every hydrosocial flow that the water management authority wishes to measure and to plan for.In this paper only one of the rows of Table 3.4 is examined, that for nitrate.
Nitrate’s principal point of entry into Jersey’s hydrological and hydrosocial flows hasalready been discussed above in Section 3.7.1. The downstream outcome is that in2001 some 31% of the treated water supply to the island’s population exceeded theEuropean Union’s MAC of 50 milligrams of NO3 per litre (mg/l). During the first9 months of 2002, there was no case of the MAC being exceeded.
Here it should be pointed out that the measure of nitrogen present in waterbecause of nitrate contamination may take two forms:
1. The measured mass of the complete nitrate ion in the water, referred to as
milligrams of NO3 /litre.2. The mass of nitrogen in the water that is locked into the measured mass of thenitrate ion, referred to as milligrams of NO3-N/litre.
For a given sample, the ratio of (1) to (2) is 4.42 to 1. Therefore, it is absolutelyessential that any document or discussion of nitrate contamination makes clear whichof these two alternative measures is being used. Here the data and the EuropeanUnion (EU) MAC are expressed in terms of (1) above.
Why in the past did the government of Jersey permit nitrate contamination of theisland’s drinking water supplies? Politically, it was because government was not will-ing to introduce measures that would be contrary to the farming interest. Farmers, infact, made up more than their proportionate share of Jersey’s political class. This is
now changing fast. Some of the measures introduced or about to be introduced, which promise an amelioration of the current contamination of groundwater, havealready been referred to above.
With specific reference to samples in excess of the nitrate MAC (see above), the for-mal defence is made on the basis of an argument that cannot lightly be dismissed. In thepast, World Health Organization standards for drinking water were to ‘recommend’less than 50mg/l and to regard as ‘acceptable’ 50–100mg/l. But in 1996 the WHO fellinto line with the EU’s criterion, first introduced in 1980, of 50mg/l. The States of Jersey are not a member of the EU and are under no legal or constitutional obligationto comply with its water quality directives. Moreover, to do so in respect of 6.2 millioncubic metres of water distributed per year (Table 3.3) would be costly. The JNWWCalready desalinates water at some expense in order to blend it with surface waterabstracted so that the mean concentration of NO3 drops below 50 mg/l (see Table 3.4).The health argument advanced by the States is based on the views of medical experts inthe UK. The Joint Committee on the Medical Aspects of Water Quality appointed bythe Department of the Environment and the Department of Health and Social Servicesstated that ‘There is no compelling evidence to suggest that significant risks to healthare encountered when water containing between 50 and 100mg/l nitrate is supplied tothe public’ (Gass et al. 1996: 35–36; JNWWC 2002: 29; Robins 2000: 15–17).
In Table 3.4 the MAC is also exceeded with respect to nitrite and, by a small mar-gin, with manganese, lead, cyanazine, and total coliforms in the east of the island. It isnoteworthy that the EU, on health evidence, plans to reduce the MAC for lead from

8/12/2019 1843391775
http://slidepdf.com/reader/full/1843391775 44/230

8/12/2019 1843391775
http://slidepdf.com/reader/full/1843391775 45/230

8/12/2019 1843391775
http://slidepdf.com/reader/full/1843391775 46/230
With respect to use, the data are available separately for the two dominant sourcesof supply, i.e. the JNWWC and private actors. From both an analytic and a policy pointof view this has its advantages. Unfortunately, the classification of types of use differsbetween the sources, creating an adding-up problem. The researcher’s choice of sup-
ply and use categories should always reflect the particularities of the region in whichthe work takes place as well as its planning focus. It was surprising to discover that ‘pri- vate services’ has the second largest recorded use after ‘households’. This is explainedby the vital role of tourism and financial services in the island as well as by the fact that(outside the polytunnel and glasshouse sector) irrigation is supplementary to theisland’s (877 mm average) rainfall. The main weakness of the use data is that for pri- vate actors it is an estimate based on a sample last made in 1989–91. The lack of regis-tration, licensing and metering of private groundwater abstraction in Jersey deservesto be reviewed by the States’ government. In fact the Water Resources (Jersey) Law tocontrol abstraction and impoundment will be presented to the States in 2003.
The final comment on Table 3.3 is that an error term of 0.1 Mcm was added tototal use to give equality with the total net supply figure of 10.2Mcm. Properly
defined and accurately and comprehensively measured, total net supply is mathemat-ically identical to total use. In practice, any real-life calculation will always contain adisparity as water measurements are never exact. Unfortunately, with respect toTable 3.3, one cannot conclude that the error is only of the order of 1% (0.1/10.2).This is because the table is sure to contain mutually-cancelling errors.
3.8.2 Quality matrices
The principal methodological objective of this paper is to integrate quality with quan-tity, that is, to bring together quality matrices with the hydrosocial balance. In deploy-ing matrices in the field the biggest challenge is to specify which of the potentiallyinnumerable flows should be measured, given the high overhead and prime costs of quality assessment. Key guidelines to such a choice are:
• The importance of any specific flow’s quality in understanding how other down-stream flows are polluted.
• The impact of any specific flow’s quality on the environmental health of theregion’s population.
• The significance of a specific flow’s quality on the natural environment.
• The requirements of the governing legislation, standards and guidelines for thatflow.
Using Tables 3.2 and 3.3, just fi ve flows were selected for discussion in the Jerseycase-study. The first is irrigation returns with its recognized wide externalities. Here itis immediately clear that the hydrosocial flow has to be combined with farmland
drainage sourced by rainfall; the two are not separable. Much is available on thesources of contamination of farm drainage and the relative importance of such con-tamination island-wide. However, there appears to be no up-to-date quality matrix for this specific flow. Jersey’s planners may wish to take action here, particularly inthe light of the EU’s nitrate-sensitive areas designations.
The second selected flow is groundwater abstraction by households for theirdomestic needs, because they are unconnected to the JNWWC’s water supply net- work. These families are exposed to the aquifer in its polluted condition. This flow ismonitored twice per year for its quality.
The third flow is households’ discharge of their own waste water via septic tanksand soakaways and concerns households unconnected to the PSD’s sewerage network.

8/12/2019 1843391775
http://slidepdf.com/reader/full/1843391775 47/230
They may thereby pollute groundwater, for example with ammonia, detergent residuesand faecal coli.
The fourth and fifth flows are the JNWWC’s water supply and the PSD’s dischargeof waste water and stormwater to the sea. These are the dominant hydrosocial flows
of the island and are discussed at greater length in this paper. In both cases the qual-ity matrices are detailed and informative. Currently, the main policy issues are thenitrate content of the water utility’s output and the move towards more stringentmaximum admissible concentrations for the sewage treatment works at Bellozanne.
With these comments on the practical construction of the hydrosocial balance andthe quality matrices of some of its flows, this paper is now complete. It is hoped thatthe research may be of practical use to the people and institutions of Jersey as well assuggesting, to professional colleagues, new ways of integrating water resources man-agement in respect of the relationship between the quantity and quality of outstream,hydrosocial flows.
The material in this chapter originally appeared in: Integrated water resources management andthe hydrosocial balance. Water International, 29(2): 148–157, 2004.

8/12/2019 1843391775
http://slidepdf.com/reader/full/1843391775 48/230
4
Sharing the benefits of the riverbasin’s water economy
4.1 INTRODUCTION
Water is essential to all forms of life as well as to all the activities of human society. Butif we limit ourselves to the part it plays within a specified economy, we can distinguish
just three broad sectors. First, there are the rainfed areas of farming, forestry andpastoralism. Secondly, there is the instream sector with its navigation, fishing and
hydroelectric power production, as well as its conservation, recreation and tourismservices. Thirdly, we have the outstream sector where water meets the needs not onlyof households but also those of agriculture, mining, manufacturing, construction, as
well as public and private services. In this paper the term ‘the water economy’ is usedto refer to a river basin’s economy – its production of goods and services – from thepoint of view of the dependence of output on water flows in the rainfed, instream andoutstream sectors.
4.2 BENEFITS OF THE WATER ECONOMY
In the rainfed sector , the benefits of the water economy can be estimated as the totaloutput value of rainfed farms, forestry and pastoralism (see Table 4.1). If it is useful,
we can deduct from total output value the measured costs of production, giving the value of net output. Of course, it is not suggested here that water is the only input toproduction, just that it is a necessary condition of production – like land and humanlabour.
C 2007 IWA Publishing. ThePriceof Water: Studies in Water ResourceEconomicsand Management
2nd Edition by Stephen Merrett. ISBN: 9781843391777. Published by IWA Publishing, London, UK.
37

8/12/2019 1843391775
http://slidepdf.com/reader/full/1843391775 49/230
38 The Price of Water
Table 4.1 Catchment’s rainfed water economy
Categories of production Total output (£)
Rainfed farming
Rainfed forestryPastoralismTotal production
Table 4.2 A catchment’s instream water economy
Categories of production Total output (£)
River navigationRiver fishingHydroelectric power productionRiver conservation, recreation
and tourism servicesTotal production
The outputs of the instream sector can be similarly estimated in terms of the totaloutput value of river navigation, the basin’s fishing industry, hydroelectric power pro-duction and the flow of services from riverine conservation, recreation and tourism(see Table 4.2). As with the rainfed sector, the value of net output can also be estimated.
Turning to the outstream sector we can use the hydrosocial balance. This is a quanti-tative water resources planning tool applicable in principle to any space with a defined
boundary. This might be a house on the coast of Andalucıa, Wembley football stadium,the island of Gorgona, the Thames Estuary, the catchment of the Yangtse, the Stateof California, or the continent of Africa. Such spaces are referred to here genericallyas ‘areas’ or ’regions’.In this specific case, where we consider the water economy of ariver basin, the area or region is defined as the basin itself.
The distinction of the ‘hydrosocial balance’ from the ’water balance’ familiar tohydrologists is that the former incorporates only outstream, hydrosocial flows, andnever the hydrological flows of precipitation, groundwater recharge and run-off. The
water flows that it places at the centre of analysis and measurement are those directlycreated by human society; theidea of a hydrosocial balance is derived from the conceptof the hydrosocial cycle (Merrett 1997: 6-7). A hydrosocial flow represents a humanactivity. So the hydrosocial balance, composed as it is of many hydrosocial flows, is
understood primarily through the social sciences. In contrast, the hydrological balancerepresents natural flows and is understood primarily through the natural sciences.
To summarize, hydrological flows are of a type that exist in a state of nature.Hydrosocial flows, in contrast, are specific to human society. In recent centuries thesetwo types of flow have become ever more powerfully interdependent with the growth of
world population and its economic activities of production and use. The hydrologicalbalance of an area and that area’s hydrosocial balance should be estimated separatelyprior to considering their quantitative and qualitative interdependence.
The generic form of the hydrosocial balance for a specified catchment is given inTable 4.3. A baseline balanceis for a past time-period, such as the year 2004.A scenario

8/12/2019 1843391775
http://slidepdf.com/reader/full/1843391775 50/230
Sharing the benefits of the river basin’s water economy 39
Table 4.3 A catchment’s hydrosocial balance
Base year volumes
Categories of supply (positive)
Rainwater collection aGroundwater abstraction bSurface water abstraction cDesalination of sea water dImports of water from other areas eInternal reuse of wastewater f External reuse of wastewater gNet fall in water abstracted and stored hTotal supply i
Categories of supply (negative)Supply-side evapotranspiration losses jSupply-side leakage k
Exports of water to other areas lNet rise in water abstracted and stored mTotal negative values (supply) n
Total net supply i-n
Categories of use (positive)Households o
Agriculture (including irrigation requirements) pMining qManufacturing rConstruction sPublic services tPrivate services uOther uses v
Total use wCategories of use (negative)Evaporation losses on users’ p roperties x Leakage on users’ properties yTotal negative values (use) z
Total net use w-z
balance is for a future time-period such as the year 2010. The shift in the quantity in
millions of cubic metres of any one category of supply or use between the baseline year and the scenario year can be represented either as an absolute change or as anannual rate of growth (see Table 4.4).
The baseline balance provides a comprehensive, synoptic account both of the scaleand composition of the supply sources of water as well as their use in the regionit covers. Where measurement is accurate and comprehensive, total net supply isalways equal to total use. Scenario balances provide options for the future, based onthe forecast need for outstream water in different uses and the possible allocationconflicts that may be foreseen. Once again, total net supply must be planned to equaltotal use. The absolute difference of supply, and of use, between the base year and any

8/12/2019 1843391775
http://slidepdf.com/reader/full/1843391775 51/230
40 The Price of Water
Table 4.4 The hydrosocial balance for a specified region in a base year and ascenario year
In millions of cubic metres
Annual compoundrate of growth
Scenario year from the base yearBase Scenario minus base to the scenario year
year year year (+ or −) (%)(+ or −)
Categories of supply
Rainwater collection A1 A2 A2–A1 Ga
Groundwater abstraction B1 B2 B2–B1 Gb
Surface water abstraction C1 C2 C2–C1 Gc
Desalination D1 D2 D2–D1 Gd
Import of water from other
regions
E1 E2 E2–E1 Ge
Internal reuse of wastewater F1 F2 F2–F1 Gf External reuse of wastewater G1 G2 G2–G1 Gg
Total gross supply H1 H2 H2–H1 Gh
Supply leakage and
evaporation
−J1 −J2 (−J2)−(−J1) Gj
Export of water to other
regions
−K1 −K2 (−K2)−(−K1) Gk
Fall (+) or rise (−) in volume
of water abstracted and
stored
+/−L1 +/−L2 (+/−L2)− −
(+/−L1)
Total net supply M1 M2 M2-M1 Gm
Categories of use
Households S1 S2 S2–S1 Gs Agriculture T1 T2 T2–T1 Gt
Mining U1 U2 U2–U1 Gu
Manufacturing V1 V2 V2–V1 Gv
Public services W1 W2 W2–W1 Gw
Private services X1 X2 X2–X1 Gx
Other uses Y1 Y2 Y2–Y1 Gy
Total use Z1 Z2 Z2–Z1 Gz
Note: Gj and Gk are calculated using absolute values of leakage and exports. Gl is notcalculated because of the possible change of sign.
specific scenario year, together with the associated annual rate of change, provide thebasic input to the planning of infrastructural investment, capital financing and demandmanagement.
We have already seen in Tables 4.1 and 4.2 that the value of total output in therainfed sector and the instream sector can be calculated by sub-sector. Of course, wecan do the same thing for the use categories of the hydrosocial balance (see Table 4.5).In this case we have not only output by type of use, such as the agriculture and miningsectors, we also have output per cubic metre of water used.
There is one characteristic of the hydrosocial balance that should be made explicitin estimating the water economy of a river basin. If our interest in sharing the waters
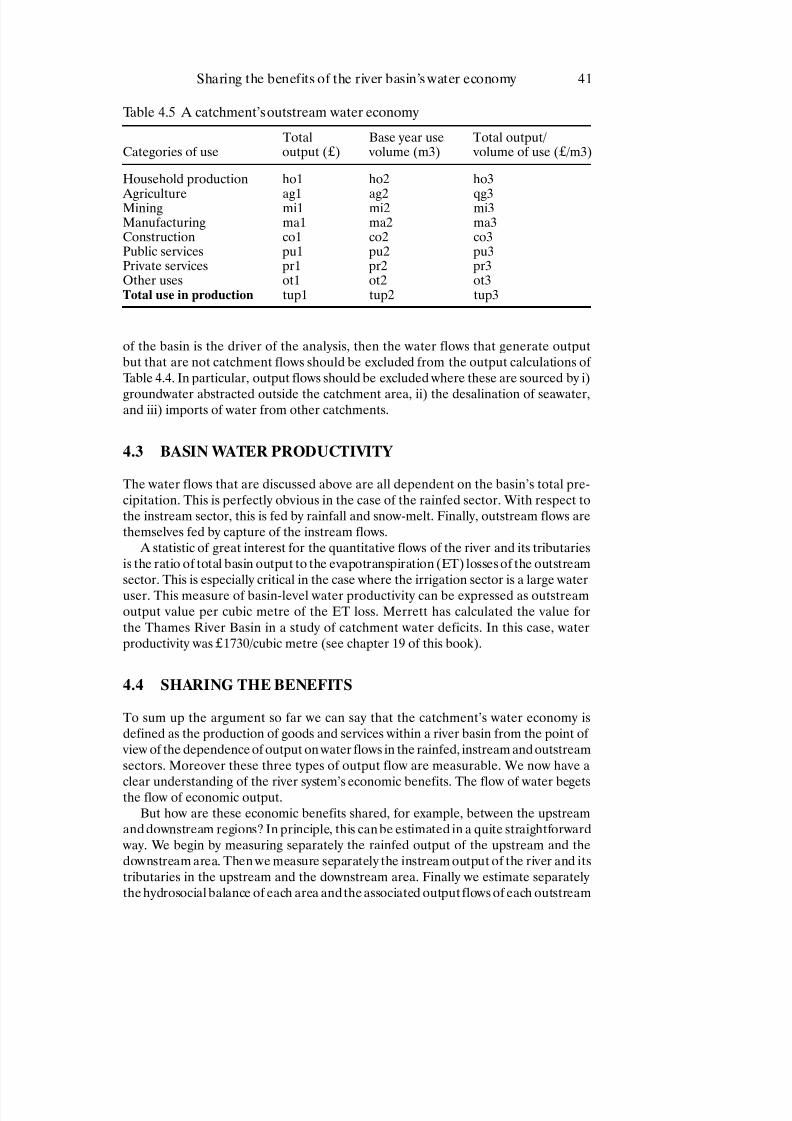
8/12/2019 1843391775
http://slidepdf.com/reader/full/1843391775 52/230
Sharing the benefits of the river basin’s water economy 41
Table 4.5 A catchment’s outstream water economy
Total Base year use Total output/ Categories of use output (£) volume (m3) volume of use (£ /m3)
Household production ho1 ho2 ho3 Agriculture ag1 ag2 qg3Mining mi1 mi2 mi3Manufacturing ma1 ma2 ma3Construction co1 co2 co3Public services pu1 pu2 pu3Private services pr1 pr2 pr3Other uses ot1 ot2 ot3Total use in production tup1 tup2 tup3
of the basin is the driver of the analysis, then the water flows that generate output
but that are not catchment flows should be excluded from the output calculations of Table 4.4. In particular, output flows should be excluded where these are sourced by i)groundwater abstracted outside the catchment area, ii) the desalination of seawater,and iii) imports of water from other catchments.
4.3 BASIN WATER PRODUCTIVITY
The water flows that are discussed above are all dependent on the basin’s total pre-cipitation. This is perfectly obvious in the case of the rainfed sector. With respect tothe instream sector, this is fed by rainfall and snow-melt. Finally, outstream flows arethemselves fed by capture of the instream flows.
A statistic of great interest for the quantitative flows of the river and its tributariesis the ratio of total basin output to the evapotranspiration (ET) losses of the outstreamsector. This is especially critical in the case where the irrigation sector is a large wateruser. This measure of basin-level water productivity can be expressed as outstreamoutput value per cubic metre of the ET loss. Merrett has calculated the value forthe Thames River Basin in a study of catchment water deficits. In this case, waterproductivity was £1730/cubic metre (see chapter 19 of this book).
4.4 SHARING THE BENEFITS
To sum up the argument so far we can say that the catchment’s water economy is
defined as the production of goods and services within a river basin from the point of view of the dependence of output on water flows in the rainfed, instream and outstreamsectors. Moreover these three types of output flow are measurable. We now have aclear understanding of the river system’s economic benefits. The flow of water begetsthe flow of economic output.
But how are these economic benefits shared, for example, between the upstreamand downstream regions? In principle, this can be estimated in a quite straightforward
way. We begin by measuring separately the rainfed output of the upstream and thedownstream area. Then we measure separately the instream output of the river and itstributaries in the upstream and the downstream area. Finally we estimate separatelythe hydrosocial balance of each area and the associated output flows of each outstream

8/12/2019 1843391775
http://slidepdf.com/reader/full/1843391775 53/230
42 The Price of Water
water economy. Note that, where appropriate, the upstream-downstream categoriescan be defined as the freshwater river basin and the river’s estuary. This is regardedas important in the case of the River Thames, for example.
At the end of this river basin survey of water flows and their dependent economicproduction flows, it will be possible to set out separately, for the upstream area and for
the downstream area, the economic benefits of its water economy in terms of the rainfed,
instream and outstream sectors’output values. Where conflicts of interest exist betweenupstream and downstream neighbours, the political process of conflict resolution willbe informed and facilitated by a clear, base-year analysis of each area’swater economy.
At the same time, a potential agreement between the upstream and downstream neigh-bours with respect to changes in the flow regime of the river can be cross-checked for afuture year on the likely consequential changes in output values in each area betweenthe base year and the scenario year.
4.5 CONCLUSIONS: NEGOTIATING THE BENEFITS
The water economy’s benefits are shared in many different ways within a single catch-ment. Tables 4.1, 4.2 and 4.5 record what the benefits are in the base year in the rainfedsector, the instream sector and the outstream sector. It has been shown too that theoutputs of these three sectors of the water economy can be broken down in terms of upstream and downstream partners. Alternatively, they can be shown for the separateriparians of the Left Bank and the Right Bank, if that is the issue.
Now, a shift over time in benefit values can be estimated for any well-defined waterresource managementinnovation.Alternative innovations will produce different shiftsin total benefit and in its three-sector and upstream-downstream spatial distribution.
Agreement between spatial groups on which one of a number of innovation alter-natives should be selected is clearly a political process. In an ideal world negotiators
would take a basin-wide perspective on the best choice, the optimum, if this can beidentified. Whittington, Wu and Sadoff (2005), for example, have recently presented‘the results of the first economic model designed to optimize the water resources of the entire Nile Basin’.
Heterodox economists would suggest a satisficing approach rather than an opti-mizing one. If it is feasible, the alternative selected should bring advantages to bothareas and be seen by negotiators as reasonably fair. However, in the case wherea water resource management innovation does not bring broadly equal advantagesto both areas, the area that gains most should financially compensate the area thatgains least. These financial transfers can be based on the water economy estimates of Tables 4.1, 4.2 and 4.5. Of considerable interest would be to see how the optimizing
model of Whittington and his colleagues could be integrated with the ‘water economy’approach of this paper.

8/12/2019 1843391775
http://slidepdf.com/reader/full/1843391775 54/230
Farm-level droughtmanagement: an irrigation
case-study from the UK
There is special providence in the fall of a sparrow. If it be now, ’ tis not to come; if it
be not to come, it will be now; if it be not now, yet it will come. The readiness is all.
William Shakespeare, Hamlet
INTRODUCTION
The farmer’s world is encompassed by risk and no risk is more devastating than a pro-longed drought. Yet, just as risk can be managed, drought can be planned for. Thepurpose of this paper is to use a case-study from the Anglian Region in England toshow the preparations being taken on a specific farm for the region’s next severedrought, and how risk analysis permitted an evaluation of two alternative, farm-leveldrought management strategies.
The broader context of the case-study is the introduction of a Water Bill into theUK Parliament in February 2003. The Bill, once enacted, promises a more effective water resources planning system and specifically creates an obligation on water com-
panies to develop drought plans for submission to the Environment Agency (Houseof Lords 2003 clauses 60–2). This Agency is the statutory body in England and Walesfor strategic water resources management. A key pressure to which it seeks torespond is climate change. As van Hofwegen and Svendsen (2000: 9–10) write:
The gradual warming of the earth, 1.0°C in the past 50 years, is leading to gla-cial recession, declining snow cover, and rising sea levels. Precipitation patterns
5
5.1
43
C 2007 IWA Publishing. ThePrice of Water: Studies in Water ResourceEconomicsand Management
2nd Edition by Stephen Merrett. ISBN: 9781843391777. Published by IWA Publishing, London, UK.

8/12/2019 1843391775
http://slidepdf.com/reader/full/1843391775 55/230
are likely to alter, reducing water availability in some regions and increasing itin others. Increased variability in precipitation patterns will accompany thisshift with a huge impact on both irrigated and non-irrigated agriculture.Precipitation patterns will include a greater proportion of extreme events, leading
to higher and more frequent flooding and lower dry season flows in rivers.Within this ‘broader context’ referred to above, it is important in the UK to under-stand how farmers themselves will manage drought risk in a water company’s droughtplan area.
The structure of the paper is straightforward. It begins with a brief description of the Anglian Region itself, followed by a general overview of the farm’s activities.Thereafter an ‘infrastructural strategy’ for drought years is compared with an ‘infor-mational strategy’ based on long-term rainfall data; the alternatives are evaluated interms of relative cost. The paper ends with a brief summary and conclusions.
THE ANGLIAN REGION
The Environment Agency is divided into eight regions, one of which is Anglian. Thisregion stretches from the Humber Estuary in the north to the River Thames in thesouth, from the Norfolk coast in the east to Northampton in the west. It covers27,000 km2 and fi ve million people live in the area. The region has extensive, sparselypopulated rural areas, particularly in the north and east, a long coastline and inter-spersed urban centres around which industry has developed. As communication linkscontinue to improve (especially with London) it is likely to be one of the highest pop-ulation growth areas in the country.
The Anglian Region has 58% of the most productive agricultural land in Englandand Wales and agriculture has considerable influence on the rural economy and com-munities. The sustainable use of water is crucial given the competing demands for it,particularly because this region is the driest in the UK. Low flows in late summer andincreased demand especially for agriculture and garden use are likely, say theEnvironment Agency, to cause stress ( www.environment-agency.gov.uk/ ) In somesummers, irrigation can make up 50% of total use.
The second principal actor in water resources management in the region is AnglianWater Services Limited (AWS), which serves the needs of over fi ve million industrial,commercial and domestic consumers ( www.anglianwater.co.uk/ ). It is this companythat will have to submit its drought plan to the Environment Agency once the WaterBill is enacted by the UK Parliament. In fact already in the spring of 2003 the companyhad submitted an Anglian Water Services Drought Plan March 2003 to the Environment Agency.
AWS is the regional utility and its principal activities are the provision of drinking water and the treatment of waste water. The company employs 3700 full-time equiv-alent persons and in 2002 had a turnover of £724 million (AWS 2002). Its principalinfrastructural assets are mains and sewers, impounding and pumped raw water stor-age reservoirs, dams, sludge pipelines and sea outfalls. The company’s capital invest-ment plan in the 5 years through 2004/5 is equal to £1.5 billion and covers furtherimprovements to drinking water, bathing and river water quality, as well as networkimprovements to maintain serviceability and meet new demands.
.25

8/12/2019 1843391775
http://slidepdf.com/reader/full/1843391775 56/230
SILVER BIRCHES plc
In this section are reviewed the activities of the agribusiness at the centre of this case-study, an enterprise referred to here as ‘Silver Birches plc’. The farm is located in the
Ely area of the Anglian Region on soils typical of the district around Cambridge(Hodge & Seale 1966).
Silver Birches plc is 57 hectares in size. The product is container trees and thebusiness is the largest such nursery in Europe. Maximum capacity in terms of thestock at any point in time is 130,000 trees ranging from 8–10 cm girth in 45 litre potsthrough to 25–30 cm girth in 300 litre pots. The company sells trees of about 330 dif-ferent varieties in its unique, easy-to-handle, white containers. The amenity market isits customer and this includes universities, hospitals, retail, residential and of ficedevelopments, town centres, golf clubs and football grounds.
In order to understand the farm’s access to and use of irrigation water, the planning
adaptation for the specific case of Silver Birches plc. Beginning with the positive cate-
The hydrosocial balance for a specified area in a base year.
Base year volumes (mcm)
Categories of Supply (Positive)Rainwater collection aGroundwater abstraction bSurface water abstraction cDesalination d
Imports of water from other areas eInternal reuse of wastewater f External reuse of wastewater gNet fall in water abstracted and stored hTotal Gross Supply j
Categories of Supply (Negative)Supply leakage and evaporation kExports of water to other regions lNet rise in water abstracted and stored mTotal Negative Values n
Total Net Supply j n
Categories of UseHouseholds s Agriculture tMining uManufacturing vPublic services wPrivate services x Other uses yTotal Use z
Note. A net fall (rise) in the storage of abstracted water has a positive (negative) value.
5.3
Table 5.1
concept of the hydrosocial balance is set out in Table 5.1. This requires considerable
Source: Adapted from Merrett (2002a) Tables 7.1 and 7.2.

8/12/2019 1843391775
http://slidepdf.com/reader/full/1843391775 57/230
no groundwater or surface water abstraction, no desalination and no reuse of waste
Silver Birches plc on-farm storage of purchased mains water is suf ficient only for 48 hoursuse. This is necessary in case of a brief failure in the mains supply, but any change in stor-age over the course of a whole year is negligibly small. Two days storage is only 215 m3.The absolutely dominant supply source is mains water purchases from Anglian WaterServices. AWS has a 12-inch main running close to the farm and off this a link is made toa 3-inch and a 6-inch pipe; the latter runs like a spinal cord down the centre of the farm.
With respect to the negative categories of supply, on-farm losses of mains water
are monitored using the 3-inch meter at the connection to the utility’s main, as well asthe meters and pressure gauges inside each of the farm’s four pump-houses. In mostcases on-farm supply pipes are electrowelded and Silver Birches plc has two skilledindustrial plumbers on its staff who are on-call on a 24/7 basis. There are no exportsof water. As a result, total net supply was about 39,000m3.
In principle, total net supply is mathematically identical to total use (Merrett
Farm management has not developed a split of use into different species of tree ordifferent locations of tree or different container sizes. Such a division of use is not(at present) considered to have any value in the management process. Ninety-eight percent of containers at the farm are divided roughly equally between the 45- and 85-litresizes. The enterprise deploys a Netafim pressure compensating non-leakage (CNL)
The hydrosocial balance for Silver Birches plc in 2002.
Row Quantity (cubic metres)
5 Categories of Supply (Positive)
6 Rainwater collection 07 Groundwater abstraction 08 Surface water abstraction 09 Desalination 0
10 Mains water 39,31511 Internal reuse of wastewater 012 External reuse of wastewater 013 Net fall in water abstracted and stored Negligible14 Total Gross Supply 39,3151516 Categories of Supply (Negative)17 Supply leakage and evaporation 400
18 Exports of water to other regions 019 Net rise in water abstracted and stored Negligible20 Total Negative Values 4002122 Total Net Supply 38,9152324 Categories of Use25 Buildings 35026 Irrigation 38,56527 Total Use 38,915
Table 5.2
gories of supply, Table 5.2 shows that in the year 2002 there was no rainwater collection,
water. Moreover, with respect to Table 5.1’s categories of net fall or rise in storage, at
are low: 1% is the current estimate and this is entered in row 17 of Table 5.2. Losses
2002: 150). As Table 5.2 shows, use is simply divided into buildings and irrigation.

8/12/2019 1843391775
http://slidepdf.com/reader/full/1843391775 58/230

8/12/2019 1843391775
http://slidepdf.com/reader/full/1843391775 59/230
S u p p l y p l a n n i n g a t S i l v e r B i r c h e s p l c w i t h a n 1 8 , 0 0 0 m 3 s a f e g u a r d a g a i n s t d r o u g h t .
Y e a r
S t o c k a n d fl o w ( m 3 )
S e p t e m b e r
O c t o b e r
N o v e m b e r
D e c e m b e r
J a n u a r y
F e b r u a r y
M a r c h
A p r i l
M a y
J u n e
J u
l y
A u g u s t
Y e a r 1
A b s t r a c t i o n t o
0
0
0
0
1 2 , 0 0 0
1 2 , 0 0 0
1 2 , 0 0 0
0
0
0
0
0
2 0 0 3 – 4
r e s e r v o i r b y e n d
o f m o n t h
I r r i g a t i o n s u p p l y
0
0
0
0
0
4 0
2 3 0
3 7 2 0
4 7 0 0
7 3 4 0 1
9 7 0
0
f r o m n o n - d r o u g h t
s t o r a g e
I r r i g a t i o n s u p p l y
6 5 7 0
3 3 5 0
1 5 0
8 0
2 0
0
0
0
0
0 4
6 9 0
5 8 4 0
f r o m A n g l i a n
W a t e r
T o t a l i r r i g a t i o n
6 5 7 0
3 3 5 0
1 5 0
8 0
2 0
4 0
2 3 0
3 7 2 0
4 7 0 0
7 3 4 0 6
6 6 0
5 8 4 0
s u p p l y
D r o u g h t s t o r a g e
0
0
0
0
1 2 , 0 0 0
1 8 , 0 0 0
1 8 , 0 0 0
1 8 , 0 0 0
1 8 , 0 0 0 1 8 , 0 0 0 1 8
, 0 0 0
1 8 , 0 0 0
b y e n d o f m o n t h
N o n - d r o u g h t
0
0
0
0
0
5 9 6 0
1 7 , 7 3 0
1 4 , 0 1 0
9 3 1 0
1 9 7 0
0
0
s t o r a g e b y e n d
o f m o n t h
T o t a l s t o r a g e
0
0
0
0
1 2 , 0 0 0
2 3 , 9 6 0
3 5 , 7 3 0
3 2 , 0 1 0
2 7 , 3 1 0 1 9 , 9 7 0 1 8
, 0 0 0
1 8 , 0 0 0
T a b l e 5 . 4

8/12/2019 1843391775
http://slidepdf.com/reader/full/1843391775 60/230
Y e a r 2
A b s t r a c t i o n t o
0
0
7 2 0 0
7 2 0 0
3 8 5 0
4 0
2 3 0
0
0
0
0
0
2 0 0 4 – 5
r e s e r v o i r b y e n d
o f m o n t h
I r r i g a t i o n s u p p l y
0
0
1 5 0
8 0
2 0
4 0
2 3 0
3 7 2 0
4 7 0 0
7 3 4 0 2
2 4 0
0
f r o m n o n - d r o u g h t
s t o r a g e
I r r i g a t i o n s u p p l y
6 5 7 0
3 3 5 0
0
0
0
0
0
0
0
0
4
4 2 0
5 8 4 0
f r o m A n g l i a n
W a t e r
T o t a l i r r i g a t i o n
6 5 7 0
3 3 5 0
1 5 0
8 0
2 0
4 0
2 3 0
3 7 2 0
4 7 0 0
7 3 4 0 6
6 6 0
5 8 4 0
s u p p l y
D r o u g h t s t o r a g e
1 8 , 0 0 0
1 8 , 0 0 0
1 8 , 0 0 0
1 8 , 0 0 0
1 8 , 0 0 0
1 8 , 0 0 0
1 8 , 0 0 0
1 8 , 0 0 0
1 8 , 0 0 0 1 8 , 0 0 0 1 8
, 0 0 0
1 8 , 0 0 0
b y e n d o f m o n t h
N o n - d r o u g h t
0
0
7 0 5 0
1 4 , 1 7 0
1 8 , 0 0 0
1 8 , 0 0 0
1 8 , 0 0 0
1 4 , 2 8 0
9 5 8 0
2 2 4 0
0
0
s t o r a g e b y e n d
o f m o n t h
T o t a l s t o r a g e
1 8 , 0 0 0
1 8 , 0 0 0
2 5 , 0 5 0
3 2 , 1 7 0
3 6 , 0 0 0
3 6 , 0 0 0
3 6 , 0 0 0
3 2 , 2 8 0
2 7 , 5 8 0 2 0 , 2 4 0 1 8
, 0 0 0
1 8 , 0 0 0
Y e a r 3
A s f o r 2 0 0 4 – 5
2 0 0 5 – 6
t o 2 0 2 2 – 2 3
8/12/2019 1843391775
http://slidepdf.com/reader/full/1843391775 61/230
extended drought might have on the business. A young tree in a 45- or 85-litre con-tainer rapidly becomes stressed without irrigation, so much so that in the absence of water for 15 days it is irreparably damaged.
MD’s concern is not directly linked to a regional drought because, as we have seen,
at Silver Birches plc it is mains water that sources the soil moisture required by thegrowing trees. However, the risk exists that a severe drought would lead AWS to cutits supplies to the farm. In a conflict over access to scarce water, the order of sectorsin the UK in terms of relative political strength is probably households, public ser- vices, industry, private services and, finally, the agricultural sector. MD’s judgement isthat the National Farmers Union in the Anglian Region does not have the muscleadequately to defend the agricultural sector from mains supply reductions.
In these circumstances MD realized that conjunctive supply could play a role infarm-level drought management. The Anglian Region is famouslyflat and land drainageis a matter of great importance (Merrett 2002a: 105–12, Talbot & Whiteman 1996). As a result the landscape is criss-crossed with innumerable unlined, surface drains.One such drain makes up the farm’s northern boundary. MD secured an abstraction
licence for this drain from the Environment Agency. It gives Silver Birches plc theright to abstract during the fi ve winter months from 1 November to 31 March. Theduration of the right is from May 2002 through March 2027. The licensed means of abstraction is a centrifugal pump of a maximum output not exceeding 29 litres/second.The maximum quantity permitted to be abstracted is 100m3 /hour, 1000m3 /day and36,000m3 during the fi ve winter months. Low flow provisions exist to protect the envi-ronment of the downstream South Level system. These are that the abstraction rightis suspended when the combined flow of the Ely Ouse river and the cut-off channel atthe Denver Sluices does not exceed 318,226m3 /day (1 November–28 February) or113,652m3 /day (1 March–31 March).
The abstraction flow will go straight into a winter storage reservoir on the farm.
The contract for this has now been signed and the reservoir should be ready to receivethe off-take water from January 2004. It will have a storage capacity of 36,000m3. Thenew infrastructure will combine the reservoir, pump station and sand filtration.
ply in meeting the business’s crop water requirements over the 20 farming yearsSeptember 2003 through August 2023. This is here called the infrastructural strategy.Key assumptions in developing the model are:
• Monthly crop water requirements are equal to those of the adjusted monthly vol-
• Abstraction during the winter months is spread equally over the months when itis permitted (in 2003–4 it begins only in January when the reservoir has beencompleted).
• Abstraction to the reservoir does not take place when the reservoir is full.
• Half the reservoir’s capacity (18,000m3) is held back as an irrigation source shouldthere be a cut-off in the mains supply. This is ‘drought storage’.
• Irrigation supply from the reservoir begins only after the reservoir has reached itsdrought storage level.
• Irrigation supply from AWS is used only when there is no non-drought storage inthe reservoir.
• The final assumption is that, in fact, there turns out to be no drought so severeover the twenty years that the ‘drought storage’ is required.
Table 5.4 models the relative role of the winter storage supply and the mains sup-
ume from Table 5.3.

8/12/2019 1843391775
http://slidepdf.com/reader/full/1843391775 62/230
DROUGHT MANAGEMENT: THE INFORMATIONAL
STRATEGY
There are two problems with the infrastructural strategy. First, it permanently dedi-cates half the capacity of the winter storage reservoir to drought storage when thesevere and prolonged drought event that it protects against is extremely rare. Second,it reduces the irrigation supply that can be sourced from winter storage and thereforeincreases the irrigation supply sourced from AWS. The additional prime cost (mar-ginal cost) of the AWS supply is £0.59/m3 whereas from winter storage it is only£0.15/m3. In the UK farmers pay only £0.15 per litre of diesel fuel.
• Monthly crop water requirements are equal to those of the adjusted monthly
• Abstraction during the winter months is spread equally over the months when it
is permitted (in 2003–4 it begins only in January when the reservoir has beencompleted).
• Abstraction to the reservoir does not take place when the reservoir is full.
• There is no provision in this model for drought storage.
• Irrigation supply from AWS is used only when there is no storage in the reservoir.
• The final assumption is that, in fact, there turns out to be no drought so severeover the 20 years that the ‘drought storage’ is required.
No delivery contracts or other legal mechanisms invalidate the “key assumptions”
implications.The total excess of water purchases from AWS with the infrastructural strategy
in comparison with the informational strategy is 347,000m3 over the 20 years2003/4–2022/23. In terms of expenditure this makes the infrastructural strategy moreexpensive by a sum of £153,000. Discounting the stream of differential expenditureat the interest rate charged on Silver Birches plc’s overdraft – base rate plus 2%i.e. 5.75% – we have a discounted sum of £88,000. In financial terms there is no doubtof the relative attraction of the informational strategy.
However, the reader will surely have noted a drawback of the informational strategy:thus far it has no provision for drought planning! In the remainder of this section it isshown how such planning is possible and why this leads me to call the secondapproach the ‘informational strategy’.
We have already seen that low rainfall currently provides no direct threat to SilverBirches plc’s farming practice. Virtually all of its crop water requirements are metfrom the mains supply. The drought risk takes the form of a possible reduction in the AWS supply. The firm’s MD believes that this would most likely be during a dry sum-mer that succeeded a dry winter, each of great severity.
So it made sense to review rainfall records for the area, kindly provided by theEnvironment Agency for the Isleham Pumping Station. The calendar year data showthat the driest year since 1963 was in 1996 with total rainfall equal to 391mm com-pared to the 1963–2002 average of 548mm. Yet in 1996 AWS imposed no restrictions of
any kind on the mains supply to its customers.
5.5
Table 5.5 models the informational strategy. Its key assumptions are:
volume from Table 5.3.
purchases from AWS. Table 5.6 shows these volumetric differences and their cost
referred to above. The central difference between Tables 5.4 and 5.5 is of course thatin Table 5.5 the whole of winter storage is applied for irrigation, thereby reducing

8/12/2019 1843391775
http://slidepdf.com/reader/full/1843391775 63/230
S u p p l y p l a n n i n g a t S i l v e r B i r c h e s p l c w i t h n o fi x e d
s a f e g u a r d a g a i n s t d r o u g h t .
Y e a r
S t o c k a n d fl o w ( m 3 )
S e p t e m b e r O c t o b e r
N o v e m b e r
D e c e m b e r J a n u a r y
F e b r u a r y
M a r c h
A p r i l
M a y
J u n e
J u l y
A u g u s t
Y e a r 1
A b s t r a c t i o n t o
0
0
0
0
1 2 , 0 0 0
1 2 , 0 0 0
1 2 , 0 0 0
0
0
0
0
0
2 0 0 3 – 4
r e s e r v o i r b y e n d
o f m o n t h
I r r i g a t i o n s u p p l y
0
0
0
0
2 0
4 0
2 3 0
3 7 2 0
4 7 0 0
7 3 4 0
6 6 6 0 5 8 4 0
f r o m n o n - d r o u g h t
s t o r a g e
I r r i g a t i o n s u p p l y
6 5 7 0
3 3 5 0
1 5 0
8 0
0
0
0
0
0
0
0
0
f r o m A n g l i a n W a t e r
T o t a l i r r i g a t i o n
6 5 7 0
3 3 5 0
1 5 0
8 0
2 0
4 0
2 3 0
3 7 2 0
4 7 0 0
7 3 4 0
6 6 6 0 5 8 4 0
s u p p l y
D r o u g h t s t o r a g e
0
0
0
0
0
0
0
0
0
0
0
0
b y e n d o f m o n t h
N o n - d r o u g h t s t o r a g e
0
0
0
0
1 1 , 9 8 0
2 3 , 9 4 0
3 5 , 7 1 0
3 1 , 9 9 0
2 7 , 2 9 0
1 9 , 9 5 0 1
3 , 2 9 0 7 4 5 0
b y e n d o f m o n t h
T o t a l s t o r a g e
0
0
0
0
1 1 , 9 8 0
2 3 , 9 4 0
3 5 , 7 1 0
3 1 , 9 9 0
2 7 , 2 9 0
1 9 , 9 5 0 1
3 , 2 9 0 7 4 5 0
Y e a r 2
A b s t r a c t i o n t o
0
0
7 2 0 0
7 2 0 0
7 2 0 0
7 2 0 0
7 2 0 0
0
0
0
0
0
2 0 0 4 – 5
r e s e r v o i r b y e n d
o f m o n t h
I r r i g a t i o n s u p p l y
6 5 7 0
8 8 0
1 5 0
8 0
2 0
4 0
2 3 0
3 7 2 0
4 7 0 0
7 3 4 0
6 6 6 0 5 8 4 0
f r o m n o n - d r o u g h t
s t o r a g e
I r r i g a t i o n s u p p l y
0
2 4 7 0
0
0
0
0
0
0
0
0
0
0
f r o m A n g l i a n W a t e r
T a b l e 5 . 5

8/12/2019 1843391775
http://slidepdf.com/reader/full/1843391775 64/230
T o t a l i r r i g a t i o n
6 5 7 0
3 3 5 0
1 5 0
8 0
2 0
4 0
2 3 0
3 7 2 0
4 7 0 0
7 3 4 0
6 6 6 0 5 8 4 0
s u p p l y
D r o u g h t s t o r a g e
0
0
0
0
0
0
0
0
0
0
0
0
b y e n d o f m o n t h
N o n - d r o u g h t s t o r a g e
8 8 0
0
7 0 5 0
1 4 , 1 7 0
2 1 , 3 5 0
2 8 , 5 1 0
3 5 , 4 8 0
3 1 , 7 6 0
2 7 , 0 6 0
1 9 , 7 2 0 1 3 , 0 6 0 7 2 2 0
b y e n d o f m o n t h
T o t a l s t o r a g e
8 8 0
0
7 0 5 0
1 4 , 1 7 0
2 1 , 3 5 0
2 8 , 5 1 0
3 5 , 4 8 0
3 1 , 7 6 0
2 7 , 0 6 0
1 9 , 7 2 0 1 3 , 0 6 0 7 2 2 0
Y e a r 3
A b s t r a c t i o n t o
0
0
7 2 0 0
7 2 0 0
7 2 0 0
7 2 0 0
7 2 0 0
0
0
0
0
0
2 0 0 5 – 6
r e s e r v o i r b y e n d
o f m o n t h
I r r i g a t i o n s u p p l y
6 5 7 0
6 5 0
1 5 0
8 0
2 0
4 0
2 3 0
3 7 2 0
4 7 0 0
7 3 4 0
6 6 6 0 5 8 4 0
f r o m n o n - d r o u g h t
s t o r a g e
I r r i g a t i o n s u p p l y
0
2 7 0 0
0
0
0
0
0
0
0
0
0
0
f r o m A n g l i a n W a t e r
T o t a l i r r i g a t i o n
6 5 7 0
3 3 5 0
1 5 0
8 0
2 0
4 0
2 3 0
3 7 2 0
4 7 0 0
7 3 4 0
6 6 6 0 5 8 4 0
s u p p l y
D r o u g h t s t o r a g e b y
0
0
0
0
0
0
0
0
0
0
0
0
e n d o f m o n t h
N o n - d r o u g h t s t o r a g e
6 5 0
0
7 0 5 0
1 4 , 1 7 0
2 1 , 3 5 0
2 8 , 5 1 0
3 5 , 4 8 0
3 1 , 7 6 0
2 7 , 0 6 0
1 9 , 7 2 0 1 3 , 0 6 0 7 2 2 0
b y e n d o f m o n t h
T o t a l s t o r a g e
6 5 0
0
7 0 5 0
1 4 , 1 7 0
2 1 , 3 5 0
2 8 , 5 1 0
3 5 , 4 8 0
3 1 , 7 6 0
2 7 , 0 6 0
1 9 , 7 2 0 1 3 , 0 6 0 7 2 2 0
Y e a r 4
A s f o r 2 0 0 5 – 6
2 0 0 6 – 7
t o 2 0 2 2 – 2 3

8/12/2019 1843391775
http://slidepdf.com/reader/full/1843391775 65/230
P u r c h a s e s o f i r r i g a t i o n w a t e r f r o m A n g l i a n W a t e r S e r v i c e s u n d e r t w o a l t e r n a t i v e s t r a t e g i e s .
Y e a r
I r r i g a t i o n w a t e r p u r c h a s e s
S e p t e m b e r O c t o b e r N o v e m b e r D e c e m b e r
J a n u a r y
F e b r u
a r y
M a r c h
A p r i l
M a y
J u n e
J u l y
A u g u s t
Y e a r 1
I n f r a s t r u c t u r e s t r a t e g y
( m 3 )
6 5 7 0
3 3 5 0
1 5 0
8 0
2 0
0
0
0
0
0
4 6 9 0
5 8 4 0
2 0 0 3 – 4
I n f o r m a t i o n s t r a t e g y ( m 3 )
6 5 7 0
3 3 5 0
1 5 0
8 0
0
0
0
0
0
0
0
0
M a r g i n a l c o s t e x c e s s o
f
0 . 4 4
0 . 4 4
0 . 4 4
0 . 4 4
0 . 4 4
0 . 4 4
0 . 4 4
0 . 4 4
0 . 4 4
0 . 4 4
0 . 4 4
0 . 4 4
A W S s u p p l y o v e r w i n t e r
s t o r a g e s u p p l y ( £ / m 3 )
C o s t s a v i n g s o f
0
0
0
0
9
0
0
0
0
0
2 0 6 4
2 5 7 0
i n f o r m a t i o n s t r a t e g y ( £ )
Y e a r 2
I n f r a s t r u c t u r e s t r a t e g y
( m 3 )
6 5 7 0
3 3 5 0
0
0
0
0
0
0
0
0
4 4 2 0
5 8 4 0
2 0 0 4 – 5
I n f o r m a t i o n s t r a t e g y ( m 3 )
0
2 4 7 0
0
0
0
0
0
0
0
0
0
0
M a r g i n a l c o s t e x c e s s o
f A W S
0 . 4 4
0 . 4 4
0 . 4 4
0 . 4 4
0 . 4 4
0 . 4 4
0 . 4 4
0 . 4 4
0 . 4 4
0 . 4 4
0 . 4 4
0 . 4 4
s u p p l y o v e r w i n t e r s
t o r a g e
s u p p l y ( £ / m 3 )
C o s t s a v i n g s o f i n f o r m
a t i o n
2 8 9 1
3 8 7
0
0
0
0
0
0
0
0
1 9 4 5
2 5 7 0
s t r a t e g y ( £ )
Y e a r 3
I n f r a s t r u c t u r e s t r a t e g y
( m 3 )
6 5 7 0
3 3 5 0
0
0
0
0
0
0
0
0
4 4 2 0
5 8 4 0
2 0 0 5 – 6
I n f o r m a t i o n s t r a t e g y ( m 3 )
0
2 7 0 0
0
0
0
0
0
0
0
0
0
0
M a r g i n a l c o s t e x c e s s o
f A W S
0 . 4 4
0 . 4 4
0 . 4 4
0 . 4 4
0 . 4 4
0 . 4 4
0 . 4 4
0 . 4 4
0 . 4 4
0 . 4 4
0 . 4 4
0 . 4 4
s u p p l y o v e r w i n t e r s
t o r a g e
s u p p l y ( £ / m 3 )
C o s t s a v i n g s o f i n f o r m
a t i o n
2 8 9 1
2 8 6
0
0
0
0
0
0
0
0
1 9 4 5
2 5 7 0
s t r a t e g y ( £ )
Y e a r 4
A s f o r 2 0 0 5 – 6
2 0 0 6 – 7
t o 2 0 2 2 – 2 3
T a b l e 5 . 6

8/12/2019 1843391775
http://slidepdf.com/reader/full/1843391775 66/230
S i l v e r B i r c h e s p l c : d r o u g h t w a r n i n g c h a r t 2 0 0 3 – 4 .
R o w
S e p t e m b e r O c t o b e r
N o v e m b e r D e c e m b e r J a n u a r y F e b r u a r y M a r c h
A p r i l M a y J u n e
J u l y A u g u s t
4
R e q u i r e d m i n i m u m c o m b
i n e d fl o w E l y
3 1 9
3 1 9
3 1 9
3 1 9
1 1 4
5
O u s e a n d D e n v e r S l u i c
e s ( ’ 0 0 0 m 3 )
6
R e q u i r e d m i n i m u m c o m b
i n e d fl o w
3 5 1
3 5 1
3 5 1
3 5 1
1 2 5
7
E l y O u s e a n d D e n v e r S
l u i c e s
1 0 %
8
( ’ 0 0 0 m 3 )
9
A c t u a l c o m b i n e d fl o w E l y
O u s e p l u s
t b i
t b i
t b i
t b i
t b i
t b
i
t b i
t b i
t b i
t b i
t b i
t b i
1 0
D e n v e r S l u i c e s ( ’ 0 0 0 m 3 )
1 1
1 9 9 6 r a i n f a l l ( m m )
3 9 1
3 9 1
3 9 1
3 9 1
3 9 1
3 9 1
3 9 1
3 9 1
3 9 1
3 9 1
3 9 1
3 9 1
1 2
1 9 9 6 r a i n f a l l
1 0 % ( m m
)
4 3 0
4 3 0
4 3 0
4 3 0
4 3 0
4 3 0
4 3 0
4 3 0
4 3 0
4 3 0
4 3 0
4 3 0
1 3
A c t u a l r a i n f a l l d u r i n g l a s t 1 2 m o n t h s
t b i
t b i
t b i
t b i
t b i
t b
i
t b i
t b i
t b i
t b i
t b i
t b i
1 4
i n c l u s i v e o f c u r r e n t m o n t h ( m m )
N o t e : r a i n f a l l d a t a s h o u l d b e f o r
t h e w h o l e o f t h e A n g l i a n R e g i o n . t b i : t o b e i n s e r t e d .
T a b l e 5 . 7

8/12/2019 1843391775
http://slidepdf.com/reader/full/1843391775 67/230
Next a drought warning chart was prepared for Silver Birches plc and this is set out
the most important. If the actual values of row 6 prior to the ‘pumping season’(November–March) fall short of 351,000m3 (10% higher than the minimum required
for pumping to take place), management action is necessary. The consultant recom-mended that the rate of pumping to storage should be as early and as high as permit-ted and practical from 1 November onwards in order to secure the 36,000m3 quantitypermitted under the licence. If on 1 November the actual combined flow is below theEnvironment Agency’s required minimum of 319,000m3, then the farm would haveto await the time when pumping is permitted. In the meantime in any monthsbetween November and March when the Agency prohibits abstraction to the reser- voir, the mains supply must carry the maximum burden of 520 m3 irrigation over
In respect of rainfall, rows 11 and 12 are the most important. Row 12 (like row 6) isintended as a trigger mechanism for the farm’s adaptive management. When actualrainfall falls short of 430mm, it warns management that the Anglian Region’s rainfall in
the preceding 12 months has been only 10% in excess of the lowest level in the past 40 years. The management team should then decide whether to stay with the conjunctive
mains cut-off. If the latter decision is made, then the team should specify at what levelof actual precipitation to take action and for what maximum length of duration of thecut-off they should prepare. Let us suppose that if the row 12 datum sinks below411mm (1996 5%), Silver Birches plc management takes action to guard against a2-month mains cut-off. What it must then do is immediately to purchase suf ficient water from AWS add to the existing stock of water in the winter storage reservoir sothat there is suf ficient water in storage to cover the entire irrigation requirements of thenext 2 months. In this case, provided that any cut-off is indeed less than 2 months, the
irrigation supply will remain unaffected by the drought. In that year, the annualadvantage in AWS water purchased of the informational strategy over the infrastructuralstrategy will be reduced. Between 1963 and 2002 there were only two calendar years when rainfall fell below 411 mm; these were 1972 (409mm) and 1996 itself (391mm).
CONCLUSION
The purpose of this paper has been to show that drought management is not onlya responsibility of public-sector water policy but can also be carried through byagribusiness itself with respect to net irrigation requirements. Farm-level planning of this kind becomes more important as climate change brings with it a greater propor-tion of extreme events and more frequent low dry season flows.
The case-study is set in the Anglian Region of the England and Wales Environment Agency, where 58% of the two countries’ most productive agricultural land is found.This region is also the driest in the UK. The farm that is the focus of the paper is thelargest producer of container trees in Europe. The growth of its trees in their con-tainers is currently almost entirely dependent on irrigation water sourced from themains supply of AWS, the private regional water utility.
Silver Birches plc has some 94,000 trees. An interruption of the mains supply dur-ing a drought would irreparably damage the entire stock within 15 days. Although
those 5 months (see Table 5.5 for the year 2005–6).
in Table 5.7. In respect of pumping to the winter storage reservoir, rows 5 and 6 are
supply balance of Table 5.5 or whether to prepare for that most unlikely event – a
5.6

8/12/2019 1843391775
http://slidepdf.com/reader/full/1843391775 68/230

8/12/2019 1843391775
http://slidepdf.com/reader/full/1843391775 69/230
The potential role for economicinstruments in drought
management
‘ And thus the whirligig of time brings in his revenges.’
William Shakespeare, Twelfth Night
INTRODUCTION
It is now widely accepted that human society generates greenhouse gases on such asubstantial and increasing scale that climate change and global warming in the future will be of the greatest importance in our lives as well as in the lives of succeeding gen-erations (Watson et al. 2001). Climate change, it is believed, will have marked impactson water stocks and flows and this in turn will require innovations in the managementof coastal and estuarine defence, drought, flooding, irrigated farming, nature conser- vation, storm and waste water systems, and water resources (Willows & Connell 2003:Table 3.1). In particular, the mean and variance of climate variables in the future maybe associated with shorter return periods of climate extremes than in the past, forexample of frost days or heavy rainfall events.
The focus of this paper is on drought management and it recognizes the risk thatthe return frequency of drought may rise during the 21st century (van Hofwegen &Svendsen 2000: 9–10). Drought is here defined as a sustained and regionally extensiveoccurrence of below average precipitation. The article’s focus is sharpened by nar-rowing attention primarily to the economic instruments of drought management within the context of the economic impacts of drought events.
6
6.1
58
C 2007 IWA Publishing. ThePrice of Water: Studies in Water ResourceEconomicsand Management
2nd Edition by Stephen Merrett. ISBN: 9781843391777. Published by IWA Publishing, London, UK.

8/12/2019 1843391775
http://slidepdf.com/reader/full/1843391775 70/230
THE WATER ECONOMY
Water is essential to all forms of life, of course, as well as to all the activities of humansociety. But if we limit ourselves only to the part it plays within a specified economy,
we can distinguish just three broad sectors. First, there are the rainfed areas of farm-ing, forestry and pastoralism. Secondly, there is the instream sector with its naviga-tion, fishing, conservation, recreation, tourism services and hydroelectric powerproduction. Thirdly, we have the outstream sector where water meets the needs notonly of households but also those of agriculture, mining, manufacturing, construc-tion, public and private services.
In this paper the author will use the term ‘the water economy’ to refer to a regionor country’s economy, i.e. its production of goods and services, from the point of view of the dependence of output on water stocks and flows in the rainfed, instream and out-stream sectors. The article in fact focuses only on the outstream sector. The impact of a drought on the outstream water economy can be twofold. It may be that there is an
increase in the economic demand for water. This is true in the case of the irrigationsector, for example, as well as households’ use of hosepipes and sprinklers. However,drought may simultaneously lead to restrictions on water supplies from the local utility with sharp negative impacts on companies’ sales and on households’ welfare.
So the orientation of what follows is to explore:
1. Drought management’s degree of understanding of the impacts of drought onthe outstream water economy.
2. How drought managers might in the future deploy the economic instrument of water charges to achieve their objectives.
The paper illustrates its principal theses from England’s Anglian Region.
THE ANGLIAN REGION
For environmental policy purposes, England and Wales has a public sector bodyknown as the Environment Agency, with its head of fice in Bristol. The Agency oper-ates through eight regions, one of which is Anglian. The Environment Agency AnglianRegion (EAAR) stretches from the Humber Estuary in the north to the RiverThames in the south, from the Norfolk coast in the east to Northampton in the west.It covers 27,000km2 and fi ve million people live in the area. The region has extensive,sparsely populated rural areas, particularly in the north and east, a long coastline andinterspersed urban centres around which industry has developed. As communicationlinks continue to improve (especially with London) it is likely to be one of the highestpopulation growth areas in the country.
The hydrology of the region is of considerable interest. Annual average rainfall is595 mm compared with a national average for England and Wales of 897mm.Effective rainfall is only a quarter of the total at 147 mm and long, dry summers dur-ing which evaporation exceeds rainfall are a normal part of the region’s climate.Plotting the cumulative difference between rainfall and potential evapotranspiration,the Agency shows that in the 100 years beginning in 1899, there were 32 years exhibitinga rainfall deficit (EAAR 2003: Fig. 3.6).
6.2
6.3
8/12/2019 1843391775
http://slidepdf.com/reader/full/1843391775 71/230
Twenty per cent of the area lies below sea level, including the extensive area of theFens with slow-flowing or ponded rivers and extensive washlands. The main aquifersare the chalk underlying large parts of the east, limestones in the west and sandstonesin parts of the centre and east (ibid. 20–2).
The Anglian Region has 58% of the most productive agricultural land in Englandand Wales and agriculture has considerable influence on the rural economy and com-munities. The sustainable use of water is crucial given the competing demands for it,particularly because this region is the driest in the UK. Low flows in late summer andincreased demand especially for agriculture and garden use are likely, says the Envir-onment Agency, to cause stress ( www.environment-agency.gov.uk/ ). In some sum-mers, irrigation can make up 50% of total use.
Alongside the Environment Agency, the second principal actor in water resourcesmanagement in the region is Anglian Water Services Limited (AWS), which servesthe needs of over fi ve million industrial, commercial and domestic consumers( www.anglianwater.co.uk/ ). AWS is the main regional utility and its principal activ-ities are the provision of drinking water and the treatment of waste water. The com-
pany employs 3700 full-time equivalent persons and in 2002 had a turnover of £724million (AWS 2002). Its principal infrastructural assets are mains and sewers,impounding and pumped raw water storage reservoirs, dams, sludge pipelines andsea outfalls. The company’s capital investment plan in the 5 years through 2004/5 isequal to £1.5 billion and covers further improvements to drinking water, bathing andriver water quality, as well as network improvements to maintain serviceability andmeet new demands.
In addition to AWS there are four other small water utilities in the region. Theyare Cambridge Water Company, Essex and Suffolk Water, Tendring Hundred WaterServices, and Three Valleys Water. Overall, for these fi ve utilities, 40% of public water supplies are provided from groundwater, mainly from the chalk and limestone
aquifers, and 60% from surface water.
THE REGION’S WATER ECONOMY
The water economy of the region with respect to its outstream flows is best under-stood by examining its principal components.
Households
Anglian region has a population of some fi ve millions persons. At the end of the1990s, public water supply leakage and losses were one-fifth of the total public supply.With respect to use net of these losses, households took two-thirds of the total.Private domestic abstraction also exists, particularly in rural Norfolk. There is a sig-nificant difference in estimated use in litres per head per day (lhd) between meteredand unmetered customers. In 1997–98 the data were 145 and 163 lhd, respectively
down between microcomponents as personal washing (33%), toilet (25%), clothes washing (14%), miscellaneous (13%), dish washing (8%), garden watering (6%), andcar washing (1%) (ibid. Fig. A3.1).
6.4
6.4.1
(EAAR 2001: Fig. 6.3). National data for household use show the rounded break-

8/12/2019 1843391775
http://slidepdf.com/reader/full/1843391775 72/230

8/12/2019 1843391775
http://slidepdf.com/reader/full/1843391775 73/230
THE AGENCY ’S DROUGHT PLAN
The Environment Agency’s Anglian Region staff are, of course, familiar with the riskof drought in their area. Droughts may take the form of hot, dry summers or of alonger period of low rainfall and dry winters, as in 1989–92. Extended dry periodsaffect rivers quickly but flows are maintained by groundwater baseflow and wetlands. As these sources are exhausted river flows drop to very low levels, their temperature
increases, there is less dilution of ef fluent and oxygen levels fall. Fish spawninggrounds may be damaged and water supplies are threatened at the same time as irri-gation needs are increasing greatly. The return of rainfall does not end the low flowsfor the dry soil soaks up the rain and many weeks may pass before there is a sustainedrise in river and groundwater levels.
The Agency has pointed out the strong relation between climate change and aregional drought.
Changes in climate will … change groundwater and river flow regimes andtherefore the availability of water for abstraction. Current estimates of climatechange suggest that by the 2020s throughout the Anglian Region there will be,on average, more winter rainfall and less summer rainfall. Effectively, thismeans that the climate will be less predictable, with both more dry years andmore wet years. This in turn means that low flows will probably occur moreoften. Evidence of the possibility of longer droughts is unclear; the best avail-able view appears to be that increased variability makes drought that lasts overseveral years slightly less likely. However, it is important to note that the under-standing of changes in extreme events is more limited than that of changes inaverage climate. (Environment Agency Anglian Region 2001: 47)
The Environment Agency Anglian Region published its drought plan as recently asMay 2003 (EAAR 2003). Drought plans are required as part of the Agency’s statutory
Other sectors’ use of water in 1998 in the Anglian Region.
Sector Public water supply Direct abstraction(%) (%)
Retail 32 0Food and drink 21 34Machinery 16 1Chemicals 8 19Education and health 8 0Hotels 7 0Other* 5 4Transport 3 0Extractive 0 38Construction 0 4
Total 100 100
* Includes paper, metals, textiles and utilities. Source: EAAR 2001: Figure 3.12.
Table 6.2
6.5

8/12/2019 1843391775
http://slidepdf.com/reader/full/1843391775 74/230
duty to secure the proper use of water resources. The plan’s chapter heads are: (i)drought management teams, (ii) drought monitoring arrangements, (iii) actions andmitigation, (iv) corporate affairs, and (v) reporting. Careful reading of the text showsthat the Agency’s principal policy instruments in drought management are infor-
mational, infrastructural and regulatory. These include, for example, public relationsmedia releases, regional transfer schemes such as the Ely Ouse-Essex Scheme, andabstraction limitations.
There are no economic instruments for drought management of any kind. Indeedthe Plan specifically states (ibid. 14):
Abstraction charges are set at a higher rate than would be merited by moderateto wet conditions to ensure surplus money is available for financing the oper-ation of [transfer schemes] during dry years. This avoids large increases in ratesthat would be required when a drought occurs.
With respect to this paper’s interest in assessment of the water economy, there are
many indications of the Agency’s concern for specific sectors. This builds on theRegion’s excellent 2001 Water Resources for the Future: a Strategy for Anglian Region .There is an evident wish to provide timely warnings, particularly for spray irrigatorsin relation to the likely need for implementation of restrictions on the use of theirlicences under Section 57 of the Water Resources Act 1991. A leaflet ‘Prospects forSpray Irrigation’ sets out the communication channels and procedures for introdu-cing irrigation restrictions. The importance of communications between Agency staff and the farming community is highlighted and, when drought occurs, local meetings will allow the Agency to discuss directly with abstractors how best to instigate sprayirrigation restrictions to minimize impact on the farming community (EAAR 2003:27, 41). Restrictions from surface water often take the form of each licensee beingable to use his/her daily quantity on alternate days. Night-time irrigation is encour-aged. ‘The Agency also expects those irrigators with summer licences and a winterstorage reservoir to stop summer abstractions and use their stored winter water’.Moreover, trialling of a new cost-benefit method for assessing spray irrigation restric-tions has been conducted on susceptible sites across the region.
Water companies such as Anglian Water Services are also permitted to seekauthorization to increase their rate of abstraction prior to a likely drought event. The Agency also states that it ‘… is committed to encouraging Water Companies to adoptmeasures for demand management and ef ficient use of water’ (ibid. 24).
The drought plan makes only the briefest reference to other groups of abstractors.However, it is pointed out that many have been previously targeted to be more ef fi-cient with their water use. Local authority Environmental Health Of ficers contact
households with non-licensable domestic sources in rural areas where the possibilityof dry wells exists. Overall the Agency sees itself as ‘balancing demand for a limitedsupply from various quarters, while being viewed publicly as arbitrators on behalf of the environment’ (ibid. 45).
ANGLIAN WATER SERVICES’ DROUGHT PLAN
AWS published its drought plan in March 2003 (AWS 2003). AWS is required by theUK government’s Department of Environment, Food and Rural Affairs (DEFRA) to
6.6

8/12/2019 1843391775
http://slidepdf.com/reader/full/1843391775 75/230
agree updated drought plans with the Environment Agency. Water company droughtplans have become a statutory requirement in the Water Bill 2003. The Plan’s sectionheads are: (i) introduction, (ii) background to previous droughts, (iii) water resourcesplanning for a drought, (iv) drought management (surface water and groundwater),
(v) demand-side management, (vi) supply-side management, (vii) mitigation of envir-onmental impact and (viii) summary. Careful reading of the text shows that the AWS’s principal policy instruments in drought management, just as with the Agency,are informational, infrastructural and regulatory. These include, for example, publi-city campaigns, the construction of pumped, surface water storage reservoirs withlong retention periods, and hosepipe bans.
There are no economic instruments for drought management of any kind. This isin spite of the fact that AWS is clearly convinced of the general effectiveness of themanagement of economic demand. Between 1989 and 2003 the population of the AWS area increased by 400,000 persons, and 20,000 new properties have been con-nected each year. However the total quantity put into supply for customers has shownno upward (or downward) trend. In part this is due to the extension of household
metering; 50% of AWS households now pay on the basis of volume used.With respect to this paper’s interest in assessment of the water economy, it is
remarkable that (unlike the Agency) the AWS drought plan gives no indication of itsconcern for specific sectors. This is true even though the plan briefl y refers to thepossibility of ‘the introduction of demand restrictions on surface water supplies in theevent that reservoirs are drawn down to control curves’ (ibid. 7).
In the preparation of its drought plan, the AWS was required to use the Drought PlanGuideline published at the national level by the Environment Agency (EA 2002).This Guideline in fact makes no reference to economic instruments of drought man-agement nor does it suggest that utilities should review the economic impact on theircustomers of regulatory action.
DROUGHT PLANS AND THE WATER ECONOMY
Two principal institutions lie at the heart of this analysis, the Environment Agency Anglian Region and AWS. The Agency is the statutory body with a duty for strategic water resources planning. Its role is to protect the long-term future of the waterenvironment while encouraging sustainable development. Its vision for water resourcesin the next 25 years is abstraction of water that is environmentally and economicallysustainable, providing the right amount of water for people, agriculture, commerce andindustry, and an improved water-related environment (EAAR 2001: 13). In contrast, AWS is a private limited company that supplies water and waste water services to itscustomers within the area of its operation and thereby earns profits for its shareholders.
Despite this immense difference in roles between the two institutions, we cansee certain characteristics common to their separate drought plans. In the first place we have a clear commitment by each to cooperate with the other in drought man-agement. Secondly, in managing a drought event both institutions deploy policyinstruments that are informational, infrastructural and regulatory. Thirdly, neitherinstitution deploys an economic instrument in the management process. Fourthly,both institutions discriminate between user types in reducing the volume of waterused. The Agency may permit AWS to increase its abstractions prior to a likely
6.7

8/12/2019 1843391775
http://slidepdf.com/reader/full/1843391775 76/230
drought event; and spray irrigators may encounter restrictions on the use of theirlicences. AWS may institute hosepipe and sprinkler bans (at the request of the Agency) as well as bans on ‘non-essential use’ such as ‘ vehicle washing, irrigation of ornamental gardens, etc.’ (EAAR 2003: 24). Finally, the drought plans of neither
institution seek to demonstrate that their selection of specific actors for regulatoryrestriction is demonstrably the optimal solution or a satisficing arrangement that, insome sense, minimizes the aggregate welfare loss of such restrictions.
ECONOMIC INSTRUMENTS
In this section I propose that the three principal national institutions for waterresources management should review and evaluate the feasibility, costs, benefits, risksand uncertainties of replacing the regulatory instruments of drought management byeconomic instruments. These three institutions are DEFRA, the Environment
Agency and the Of fice of Water Services (Ofwat).The final sections of this paper will provide a preliminary overview of six key issues
that are likely to arise in the review/evaluation for which I call.
Legislation
In this context ‘economic instrument’ refers to any one of three ways in which theEAAR or AWS (as well as the four other regional water utilities) require outstream water users to pay for their water supplies. These forms of payment are:
• A charge for abstraction, based on the metered volume withdrawn.
• A price per cubic metre of metered mains water supplied to users.
• A charge for unmetered mains water supplied to a household’s house or flat, where the charge is based on the capital value of their dwelling.
The proposal here is that, in comparison with the non-drought situation, these threeforms of payment, which are already practically universal in England and Wales, would
be successively raised at what the Environment Agency calls the potential drought stage,
then again at the established drought stage and fi nally again at the severe drought stage
(EAAR 2003: Table 1). The charge increases would be removed as soon as the post-drought wind-down is declared. Authority for the Environment Agency and the waterutilities to take such action would require fresh legislation in the British parliament as well as new powers for the Of fice of Water Services in Birmingham.
Technical issues: time
The charges of types 1 and 2 above are based on metered flows. They can be intro-duced only where it is technically feasible to measure the volume of water supplied tousers during each of the three drought phases referred to above (potential, estab-lished, severe). This requires meters capable of providing the volumetric flow on eachday of the month. A variety of such ‘real-time’ meters are available on the market.For charge-type 3 above, which at present applies to 50% of Anglian Region households,the additional charge would be based on the number of days that fell within the three
6.8
6.8.1
6.8.2

8/12/2019 1843391775
http://slidepdf.com/reader/full/1843391775 77/230
drought stages during the billing period. It has to be said that the economic manage-ment of demand is always more dif ficult in the absence of metered supplies (Merrett2002b). Therefore, with an unmetered supply, there exists no economic incentive forthe household to moderate the quantity used during a drought, even though the daily
charge is raised.
Technical issues: place
In England and Wales the location of each abstraction point for surface water orgroundwater is precisely known. It is also true that a feature of droughts is that they vary in severity and environmental impact across any given region as well as varying inseverity and impact with source type. For example, for water resource managementpurposes the Agency divides the Anglian Region into 183 surface water catchmentsand 64 groundwater units (EAAR 2003: 15–17). It would be both possible and desir-able, therefore, to vary the increase in charge-type 1 above with the location of the
point of abstraction.
Economic: rationale
The basic principle is that the regulatory instrument of rationing specific user-types(such as spray irrigators or households with gardens) be abolished and replaced bythe economic instrument. Environment Agency and water company decisions on whoshould bear the brunt of supply shortfalls during a drought would be replaced by aninstrument whereby those who are most willing and able to pay for the reduced volume supplied would receive it. Regulatory fiat would be replaced by users’ deci-sions. However, it is essential that households do not face a price or charge increase
for their ‘lifeline’ supply.
Economic: demand response
Deployment of the economic instrument would permit the EAAR and the AWS to varythe water prices and charges it sets throughout the drought’s duration and across theregion’s surface water catchments and groundwater units. The change in volume of water purchased following a change in price of the metered supply is described by econ-omists as the elasticity of demand (Merrett 2002a: 23–5). Both the Agency and the utili-ties would wish to carry out new research into the economic demand for water in theregion by different users so as to be able to estimate the price rises they would apply ateach stage of the drought. The main actors should be able to vary their volumetric pricesand charges within a high upper bound set jointly by the Environment Agency andOfwat. Morris and his colleagues at Cranfield University’s Institute of Water and Envi-ronment have recently shown that in England’s irrigated agriculture ‘although increased water charges can reduce demand in low value applications, very large increases incharges are needed to reduce water demand where the financial returns to water arehigh, resulting in large decreases in farm incomes … before consumption significantly
nomically devastating regulatory action would be for a specific Anglian farm during adrought, as well as the climate adaptation options that farm management can pursue.
6.8.3
6.8.4
changes’ (Morris et al. 2003: 623). Meanwhile, Chapter 4 in this book shows how eco-
6.8.5

8/12/2019 1843391775
http://slidepdf.com/reader/full/1843391775 78/230
Political
Is this proposal likely to be acceptable to the people of England and Wales? I believethat the shift of power from regulator to user will be welcome. However, two issues of particular importance would have to be addressed. First, the price paid by householdsfor their lifeline supply should be unchanged, for social reasons. Secondly, what is areasonable but effective way to handle unmetered users? The importance of thisfades the more successful is national government in increasing the proportion of households that are metered. As David King, Director of Water Management of theEnvironment Agency, writes in response to the first draft of this paper: ‘You are rightin thinking that at present drought management makes little use of economic incen-tives to control demands. For households far more meter penetration would be nec-essary before this became a viable option. However, we will keep this under reviewand we will consider all options that can help with effective water resources manage-ment’ (pers. com. 3/12/2003). George Day, Head of Supply/Demand Balance at Ofwatexpresses a similar opinion in a letter to me.
CONCLUSIONS
Climate change will likely be associated in the future with shorter return periods of cli-mate extremes, including drought. So effective drought management is set to becomeeven more necessary in the future than it is already. This in turn demands a review of the current instruments of policy that we deploy as well as a better understanding of their impact, not only on the rainfed and instream sectors, but also on the outstream water economy. The argument of this paper is developed for England’s Anglian region,particularly with respect to the roles of the Environment Agency and of AWS.
Review of these two institutions’ drought plans shows that their instruments of policy are informational, infrastructural and regulatory. There are no economicinstruments of any kind. Moreover, the Environment Agency at the national level inits drought plan guideline makes reference neither to utilities deploying economicinstruments in demand management nor to a need for utilities to review the impacton their customers of regulatory action.
Yet both the Environment Agency at the regional level as well as the AWS dis-criminate between user types in reducing the volume of water used. But neither insti-tution seeks to demonstrate that its selection of specific actors for regulatory restrictionis demonstrably the optimal solution or a satisficing arrangement that, in some sense,minimizes the aggregate welfare loss of such restrictions.
With respect to outstream water, the author concludes that the three principalnational institutions for water resources management, DEFRA, the Environment Agency and Ofwat, should review and evaluate the feasibility, costs, benefits, risksand uncertainties of replacing the regulatory instruments of drought management byeconomic instruments. If that review and evaluation opts for economic instruments,they would shape both the location of abstraction as well as the relative sharesbetween outstream water users, based on the responsiveness to charge and pricechanges for the abstraction and use of water.
The material in this chapter originally appeared in: The potential role for economic instrumentsin drought management. Irrigation and Drainage, 53: 1–9, 2004.
6.8.6
6.9

8/12/2019 1843391775
http://slidepdf.com/reader/full/1843391775 79/230
‘Virtual water’ and Occam’s razor
Until then I had thought each book spoke of the things, human or divine, that lie
outside books. Now I realized that not infrequently books speak of books: it is as if
they spoke among themselves.
Umberto Eco, The Name of the Rose
INTRODUCTION
In 2001 Professor Tony Allan of the University of London’s School of Oriental and
African Studies saw published his magnum opus entitled The Middle East Water Question: Hydropolitics and the Global Economy. The book marks the final step in hislong march from geography to the politics of water resources. It also provides themost complete statement of his views on the rôle of virtual water in linking regions of water scarcity with regions rich in water. In fact, his main interest is the Middle Eastand North Africa (MENA). The concept of ‘ virtual water’, virtually synonymous with Allan’s name, has been taken up increasingly widely in recent years and the time isripe for a critical review of its relevance to our understanding of the manner in whichthe water needs of semi-arid countries are met. Such a review is the object of this
Before getting under way it is worth noting that the disciplinary foundationof this paper is philosophy. So a useful philosophical convention will be used.Whenever I am discussing a concept, the word will be placed in single invertedcommas. For example: “Spinoza tells us that the concept ‘dog’ cannot bark”.Whenever I refer to the thing or activity to which a concept such as ‘dog’ refers,there are no inverted commas. For example: “Hagrid’s dog Fluffy barked withoutceasing”.
7
7.1
paper. Section 7.2 provides a résumé of the main propositions of the virtual water
Section 7.5 presents my conclusion.thesis. Section 7.3 deploys the main critique. Section 7.4 introduces Occam’s razor.
68
C 2007 IWA Publishing. ThePrice of Water: Studies in Water ResourceEconomicsand Management
2nd Edition by Stephen Merrett. ISBN: 9781843391777. Published by IWA Publishing, London, UK.

8/12/2019 1843391775
http://slidepdf.com/reader/full/1843391775 80/230
Two other features of a philosophical paper are worth noting. First, philosophers within the English tradition are primarily concerned with the relation between lan-guage and truth, so they commonly write in a dense and compact style where the textneeds to be read at a measured pace to be understood. Second, non-philosophers may
take the view that philosophy is merely rhetorical quibbling, nothing but words, words, words. My view is different. Water resources management has traditionallybeen founded on engineering and hydrology – with a history of immense achieve-ments. But we now recognize that social and environmental scientists should allythemselves with the hydrologist and the engineer in the challenges that the futureholds for us all. This requires that political scientists and economists, for example,develop an appropriate language for their work. They are now in the stage wheresuch a language is still in the furnace. The role of philosophy is to assist in the forgingof this new language, in which the objects of criticism may be water ‘ef ficiency’ in irri-gation or water ‘demand’ in urban planning or ‘ virtual water’ in global trade or the‘contingent value’ of a buttercup. In a nutshell, the successful advance of science iscritically dependent on progress in its language.
A WATER DEFICIT RESOLVED
A brief, neutral statement of the virtual water thesis is set out in this section, begin-ning with Allan’s concept of a region’s ‘ water deficit’. ‘Region’ here refers to any rel-evant geographic area including a country, a province or a catchment.
For any region it is possible to estimate whether or not it suffers from a waterdeficit in the sense that ‘there is not enough surface water, ground water and soil water to meet the domestic, industrial, municipal and food needs of its population’
(T. Allan pers. comm.). In the specific case of what will be referred to as Region A, itssurface water, groundwater and soil water are insuf ficient to meet the needsdescribed above. This shortfall of supply with respect to need is Region A ’s waterdeficit (Allan 2001: 30).
In fact the needs of households and industry can and are comfortably met byregional supply. It is the crop water requirements of food self-suf ficiency that areimpossible to satisfy. As a consequence the water deficit is resolved by the import of virtual water from Region B. ‘Virtual water’ refers to the soil water sourced by pre-cipitation and irrigation that meets the crop water requirements of the food grown inRegion B that is subsequently exported to Region A. Region A ’s imports of such foodare suf ficient, alongside domestic production, to meet entirely the food needs of its
population.To indicate the scale of these virtual water imports, we can take the example of wheat. One tonne of exported wheat requires about one thousand tonnes of virtual water (Allan 2001: 106, 126). Less than 0.1% of the virtual water is physically embed-ded in the food grains themselves. During cultivation in Region B, more than 99.9%of the virtual water returns to the irrigation cycle as farmland drainage or is lost inevapotranspiration. As Allan writes (2001: 106):
At the 1000 tonnes (cubic metres) of water per tonne of grain estimate of watercontent the [MENA] regional imports of virtual water by the mid-1980s wereequivalent to the annual flow of the Nile into the Egyptian agricultural sector.
7.2

8/12/2019 1843391775
http://slidepdf.com/reader/full/1843391775 81/230
A CRITIQUE OF THE VIRTUAL WATER THESIS
Allan’s thesis summarized in section two is, I suggest, flawed in a number of ways.The critique will be set out with respect to the use of the term ‘ virtual water’, the
import of virtual water and, finally, the farm sectors of Regions A and B.Virtual water . In everyday English we use the word ‘ virtual’ (as in ‘ virtual reality’)
to mean something parallel to or imitative of a real-life entity or process. But Allan’s ‘ virtual water’ does not do this. This is because virtual water is real water; itis the soil water of Region B used in meeting the crop water requirements ofthat Region’s food exports. This neglect of a well-established linguistic routinehas the result that the central concept of the argument, ‘ virtual water’, is not virtualin any sense. It is not good science to build theory on terms that are inherentlymisleading.
The import of virtual waterIn The Middle East Water Question: Hydropolitics and the Global Economy we repeat-edly read that virtual water is imported into the MENA region. So one expects to seeeach single ship carrying a full cargo of wheat, maize or rice imported from the wide world and heading for the sunlit harbours of the Mediterranean and the Red Sea to befollowed by one thousand additional ships each carrying in its hold a full cargo of the virtual water used for the imports’ crop water requirements. A magnificent sight – butone we are unlikely to witness in our time. It is as if, having identified a water deficitin Region A, virtual water must be imported to eliminate it. It may be that Allan doesnot wish us to believe literally that this happens. Clearly propositions of the type“ water security for the MENA region is achieved by virtual water imports” are false,
and as misleading as the tabulation of 40 billion cubic metres of cost-free water trans-ported into the region each year (Allan 2001: Table 2.1). But if such statements are,indeed, merely metaphorical, they cannot at the same time be read as part of a scien-tific argument on international trade in food and water.
Farming in Regions A and B
When one approaches agriculture from the perspective of water resources there is adanger that the experience of farming is seen largely with respect to its crop waterand net irrigation requirements. As a result, a more rounded vision is lacking, onethat understands that the water theme is only one amongst many, such as soil charac-teristics, land rights, labour skills, pest control, farm budgets and product markets.Consequently, if we use the term ‘the import of food’, this opens up major questionsrendered invisible by ‘the import of virtual water’. Have food imports led to higherpopulation birth rates in water deficit regions than would have occurred in theirabsence? Do food imports weaken the farm sector of the importing country? Do foodimports open the importing country to political control from the exporting country?Will the importing country be able to maintain its foreign exchange expenditureon food imports in the long run? Finally, if food imports are subsidized when theyare shipped from the European Union and North America, will these subsidies bemaintained in the long term?
7.3
7.3.1
7.3.2

8/12/2019 1843391775
http://slidepdf.com/reader/full/1843391775 82/230
OCCAM’S RAZOR
So we come to William of Occam, a Franciscan scholar and Aristotelian philosopher who lived between circa 1295 and 1349, the year of the Black Death. He took part
forcefully in the great debates of his time on the poverty of the clergy and on transub-stantiation and was excommunicated by Pope John XXII in 1328. Bertrand Russell writes of him:
Occam is best known for a maxim which is not to be found in his works, but hasacquired the name of ‘Occam’s razor’. This maxim says: ‘Entities are not to bemultiplied without necessity.’ Although he did not say this, he said something which has much the same effect, namely: ‘It is vain to do with more what can bedone with fewer.’ That is to say, if everything in some science can be inter-preted without assuming this or that hypothetical entity, there is no ground forassuming it. I have myself found this a most fruitful principle in logical analysis.(Russell 1996: 462–3)
I now wish to explore whether Occam’s razor can properly be applied in excising twoof Allan’s core concepts: ‘ virtual water’ and ‘the import of virtual water’.
‘Virtual water ’. This term can be replaced by ‘the crop water requirements of foodexports’.
‘The import of virtual water ’ can be replaced by ‘the import of food’.More generally, the huge economic, political and social processes that are
addressed by Allan in the terminology already described can be reset in a world where semi-arid (and other) regions do not have the capacity to feed their popula-tions and so import food. These imports mean that less production and therefore less water is required in these regions’ irrigated agriculture. Regional politicians maydeflect attention from such dependence; the availability of imported food allows
them both to postpone new water supply initiatives and to delay dif ficult decisionsabout the demand management of their water resources.
CONCLUSION
In this paper it is argued that:
• ‘Virtual water’ refers to real water – there is nothing virtual about it. It denotes thecrop water requirements of food exports.
• ‘The import of virtual water’ is a metaphorical term, not a scientific one, and its
use leads to statements that are plainly false. It denotes the import of food.• In its policy applications, ‘the import of virtual water’ leads to a neglect of the cur-
rent and future status of the agricultural sectors of the countries importing andexporting food.
My conclusion is that water resource researchers and policy-makers should applyOccam’s razor to the virtual water thesis.
The material in this chapter originally appeared in: Virtual water and Occam’s razor. Water
International, 28(1): 103–105, 2003.
7.4
7.5

8/12/2019 1843391775
http://slidepdf.com/reader/full/1843391775 83/230
Virtual water and theKyoto consensus
A man may imagine things that are false, but he can only understand things that
are true.
Isaac Newton, Theological Manuscripts
THE USE OF METAPHOR
Three papers were published in the March 2003 edition of Water International thatsought to clarify and evaluate the use of the concept ‘ virtual water’ in our under-standing of water resources management in water-deficit catchments, regions andcountries (Allan 2003, Lant 2003, Merrett 2003). In the following discussion note thisauthor seeks to capture the main points of his continuing differences with Tony Allan.
Allan and I are in complete agreement that phrases such as ‘the import of virtual water’ are metaphors, not propositions that can be simply said to be true or false.Moreover, we now have a clear definition to work with. ‘Virtual water is the waterneeded to produce agricultural commodities’ (Allan 2003: 107). It follows that Allanaccepts that there is absolutely nothing ‘ virtual’ about virtual water. Virtual water isreal water. It is, first, the water needs of livestock. Second, it is the soil water required
to grow crops. Soil water is sourced by rainfall, irrigation practices and seasonalflooding such as that of the River Nile (Allan 1995: Table 1, Merrett 2002: Table 3.1).In the original paper I suggested that water resources management is increasingly
becoming a field in which social scientists play a part, alongside our colleagues fromengineering and hydrology for example. The language we use to understand thatmost simple, yet complex of entities – water – is still being forged; and the successfuladvance of science is critically dependent on progress in its language.
8
8.1
72
C 2007 IWA Publishing. ThePrice of Water: Studies in Water ResourceEconomicsand Management
2nd Edition by Stephen Merrett. ISBN: 9781843391777. Published by IWA Publishing, London, UK.

8/12/2019 1843391775
http://slidepdf.com/reader/full/1843391775 84/230
Here we come to the crux of the argument. I believe of course that there is a place formetaphor and other linguistic tricks in published papers and books as a means to enter-tain, lighten the text and communicate in a telling manner. This paper itself containsa number of metaphors. The question is, do we advance our capacity to understand
water resources by introducing a new term when we already have a perfectly good one?If we can speak of the ‘ water requirements’ of agricultural commodities, why do we need‘ virtual water’? Moreover, can it be wise to base our analysis on a single, powerfulmetaphor – that virtual water is imported?
CROPS, CROP WATER AND WATER DEFICITS
But there is a second arrow to my bow. ‘Virtual water’, as a central and constantlyreiterated concept in the discussion of arid and semi-arid countries water require-ments, can mislead us, create serious errors of analysis. I illustrated this in my March
2003 paper by pointing out that Allan in his book The Middle East Water Question: Hydropolitics and the Global Economy (2001: Table 2.1) includes in his ‘typology of Middle East and North African waters’ 40 billion m3 per year of transported water inthe form of virtual water, alongside the flows of pipelines, tankers and bags. His useof the ‘ virtual water’ concept led directly to a 40 billion cubic metre error. This isbecause the 40 billion cubic metres to which he refers are the crop water require-ments (primarily of foodgrains) sourced by rainfall and irrigation in the foodgrain-exporting areas such as Australia, Canada, the European Union and the USA.Clearly these are not ‘Middle East and North African waters’ and they are not ‘trans-ported’ to the MENA region. Allan confuses crops with crop water; it is the formerthat are transported not the latter.
This inbuilt propensity to error appears in a new form in Allan’s 2003 paper, as Ishall show. We would all of us probably accept that there is some usefulness in theidea of a region or country suffering from a water deficit. This is defined by Allan, forexample, as a situation in which there is not enough surface water, ground water andsoil water to meet the domestic, industrial, municipal and food needs of its popula-tion (Merrett 2003: 104).
Many of us would say that one course of action, given such a present deficit, is toimport food. For example, the London region has done this successfully for 2000 years. For Allan, this misses the point. In his 2003 paper he suggests that access to vir-tual water remedies water de fi cits and, with freshwater and desalinated water, achieves
water security.
… 10 percent or so of water needed for drinking, domestic, industrial, and serviceuses must come from freshwater or from manufactured sources. The 90 percent of water need for food and other agricultural production can come from freshwater,from soil water or it can be accessed in effect via food imports. Virtual water andmanufactured water are the very successful means by which water deficiteconomies can remedy their deficits. (Allan 2003: 108)
Once again we see a dangerous crossover between talking about food imports as if they were water imports. In matter of fact, food imports tend to increase a region’s waterdeficit. This is of great importance in semi-arid countries with dense populations. Thegrowth in the water deficit arises from the faster rate of growth of population that
8.2

8/12/2019 1843391775
http://slidepdf.com/reader/full/1843391775 85/230
imported food permits. In addition, lower levels of national production of food followfrom the lowering of food prices brought about by imports. This is particularly true when imported food is subsidized and when the importing country’s exchange rate isover-valued, making imports even cheaper.
In summary, I believe we should dispense entirely with the term ‘ virtual water’.This is for fi ve reasons:
1. The term is redundant; virtual water is nothing more or less than the waterneeded to produce agricultural commodities.
2. There is nothing virtual about virtual water.3. The use of the term leads in particular to a neglect of the impact of food imports
on a country’s agricultural sector, because food imports are falsely representedas water imports.
4. The confusion of water with food that accompanies the term ‘ virtual water’ like adark shadow fosters analytic errors such as that food grain purchases are trans-ported water, that food imports remedy water deficits in the importing countries
and that imported food brings ‘total water self-suf ficiency’ for the importingregion (Allan 2003: Figure 3). The greatest weakness of Allan’ s concept is that it
repeatedly confuses crop outputs with the water required to produce them. If, as Allan suggests, Hoekstra & Hung (2002) conclude that 695 km3 of virtual wateris traded each year, why have none of us seen the boats within which it is carried?Why are they not causing gridlock in the world’s sea channels? Virtual water isreal water; if it is indeed traded it needs to be transported to the new owner. Infact, no such trade ever takes place in the case of food exports. Hoekstra andHung, outstripping Allan, commit a 695km3 error.
5. Social science, if it is constructed on a metaphor, is built on sand.
THE KYOTO CONSENSUS
The final issue raised here is whether or not ‘ virtual water’ has now entered theemerging consensus shaping current approaches to water resources management sig-nalled in the World Water Forum in Kyoto, the ‘Kyoto consensus’ as I shall call it. Keyfeatures are that big dams are bad whereas small dams are good; that water resourcesmanagement should be carried out on the catchment scale; that irrigation projectsshould be turned over to water user associations; that public water utilities are ripefor privatization; that water resources management should focus on demand man-agement; and that water use should everywhere be priced. A thoroughly modernschema set, unfortunately, in a post-modernist world.
The Kyoto consensus is best understood as the waterish extension of theWashington consensus. What follows bears comparison with Christopher Lant’sinsightful paper, both his suggestion that ‘ virtual water’ refers to a water resourcesmanagement strategy and his comments on the economic linkage between theMENA region and the dominant grain-exporting regions (Lant 2003: 113–15).
The reasoning is this. The Washington consensus is that human society throughoutthe globe should, in its economic activities, be organized around free markets in whichthe dominant players are private companies with governments playing only a limited,regulatory role. Those free markets should include the export and import of goods andservices between countries. The hegemonic political and economic power in all of this
8.3
8/12/2019 1843391775
http://slidepdf.com/reader/full/1843391775 86/230
is to be wielded by the dominant classes of the USA and the European Union andtheir institutions, in particular the International Monetary Fund and the World Bank.Grain exports from Australia, Canada, Europe and the USA should be encouraged inthis context, particularly to semi-arid countries with dense populations.
Two major problems arise from this specific agenda. First, as indicated earlier inthis rejoinder, food imports by the South weaken the domestic sector that producesfood by driving down the market price of grain output. The decline of agriculturedrives down rural incomes and stimulates rural-urban migration. Second, where theSouth has the capacity to export services and manufactured goods on a substantialscale, food imports can be financed out of export earnings. But if the South cannotpay for its imported food in this way, it becomes dependent on North America andEurope for subsidy of these imported foodgrains. This means that, along with otherforms of financial and military dependence, the future of these countries is shaped bythe North. In this case such countries, far from looking to a future of total water self-suf ficiency as the ‘ virtual water’ theorists argue, face an indefinite journey of eco-nomic dependence. Here we find confirmation that the most important characteristic
of economic systems is the complex forms that exist of the interdependence of supplyand demand.
The material in this chapter originally appeared in: Virtual water and the Kyoto consensus.Water International 28(4): 540–542, 2003.

8/12/2019 1843391775
http://slidepdf.com/reader/full/1843391775 87/230

8/12/2019 1843391775
http://slidepdf.com/reader/full/1843391775 88/230
9
The urban market for farmers’ water-rights
9.1 INTRODUCTION
In the field of water resources management a widely held belief exists that allocationstress is to be found in many parts of the world and is set to become more intense inthe future because of global population growth and climate change (Meinzen-Dick &Rosegrant 2001a). Allocation stress refers to access conflicts between the agricul-
tural, domestic, industrial, urban service and environmental uses of outstream andinstream water flows. If the belief that allocation stress will intensify is well foundedthen, because of the dominant role of irrigation water use at the global level, it isimperative to explore the possibilities of reducing farmers’ use of water or, at the veryleast, of slowing its growth (Merrett 2002a).
One process by which the scale of irrigation is reduced occurs when farmerschoose to sell their abstraction rights (or other rights to access water) in perpetuity toactors that apply these released flows in towns and cities for household, manufactur-ing and urban service uses. It is this market that is the subject of the present paper andthe term ‘market’ is used here to refer to those institutions that provide the context forthe purchase and sale of commodities. A beneficial allocation multiplier exists here; if
water supply for irrigation and for urban purposes divides in the ratio 70:30, forexample, then a 15% transfer of agriculture’s total creates a 35% increase in the urbantotal. Note that the paper does not address environmental and hydropower needs orthe transfer of abstraction rights between farmers. Neither does the paper review thebroad-ranging arguments for and against re-allocating water from farming to theurban sphere ( vide Merrett 2002a: 148–82, Rosegrant & Ringler 1998).
77
C 2007 IWA Publishing. ThePrice of Water: Studies in Water ResourceEconomicsand Management
2nd Edition by Stephen Merrett. ISBN: 9781843391777. Published by IWA Publishing, London, UK.
8/12/2019 1843391775
http://slidepdf.com/reader/full/1843391775 89/230
The objectives of the paper can now be stated. These are: first, to set out an orthodox microeconomic account of a water-rights market in equilibrium; second, to ascertain whether that approach can deal with a number of empirical complexities in real-lifetrading.
The final introductory comment concerns the conceptual distinction between water and water-rights. Water is a collection of molecules, each of which consists of two atoms of hydrogen bonded to one atom of oxygen. A water-right is a legal claimto abstract or otherwise access water. You can float on water but not on a water-right.You can abrogate a water-right but not water. This paper addresses water-rights mar-kets, not water markets.
9.2 THE URBAN ACTORS’ DEMAND FUNCTION
We begin with a defined region composed of a metropolitan area located within an
agricultural landscape in which farmers abstract surface water and pump ground- water for irrigation purposes. Abstraction takes place within a framework of rights thatare formalized in national laws, or are recognized by customary practice, or exist insituations of legal pluralism (Bruns & Meinzen-Dick 2001: 1).
The city already accesses water from a variety of sources, as the hydrosocial bal-ance shows. These sources include:
1. Rainwater harvesting in cisterns by households.2. Groundwater and surface water abstraction by the metropolitan water utility,
urban developers and by manufacturing industry.3. The utility’s import of water from a neighbouring region.4. The manufacturing sector’s reuse of its own waste water.
The population, gross domestic product, income and size of the city are allgrowing – as is the demand for water. Consequently the metropolitan water utility as well as the enterprises that capture their own water needs (together the urban actors)are seeking to expand their separate water supply capacities. In particular, the water util-ity knows that supply expansion requires capital finance and infrastructural construc-tion. This will push up the firm’s overhead costs and prime costs and thereby totalcosts (Merrett 1997: 32–5). But the utility is sure that if the average total cost percubic metre of water delivered remains close to its existing level, the price charged tocustomers will be one that they are willing and able to pay.
The utility and those companies self-supplying their own water requirementsbegin to take an interest in the abstraction rights enjoyed by farmers in the surround-ing countryside. They know that these rights can legally be transferred to urbanactors. For any single project the urban actor would have to pay a lump sum to thefarmer for the transfer of the abstraction right, as well as meeting accompanyingtransaction costs. In addition, the urban actors would have to make capital invest-ments in headwork and network infrastructures in order to capture the water they arenow permitted to abstract and to deliver it to the city. The quality of water from anyspecific abstraction point would likely impact on headwork treatment costs, particu-larly with respect to the water’s potability.
So what is the maximum payment an urban actor would be willing to pay to thefarmer for the transfer of his abstraction right, that is to say, what is the urban actor’s

8/12/2019 1843391775
http://slidepdf.com/reader/full/1843391775 90/230
maximum bid price? One answer is that it would be equal to a cash sum that when addedto transaction costs and to the accompanying capital expenditure on infrastructure would generate an average total cost per cubic metre of the same order as the existinglevel of average total cost. A second answer, a stronger response, is that the maximum
bid price plus the other capital spending would not produce an average total cost percubic metre higher than the average total cost of the best alternative supply scheme(Kemper & Olson 2000: 352). For example, such alternatives might be an increasedcapacity of the utility to import supplies from another region or the expansion of amanufacturing company’s waste water reuse facility. In the calculation of averagetotal cost, the volume used as the divisor should be that delivered to the customer. Inthis way storage and distribution losses are properly accounted for. This point ismade strongly by Schif fler (1997: 368).
There may also exist urban institutions requiring abstraction rights for whom nofeasible alternative supply source exists. In this case the maximum bid price would bethat which, after the capital payments associated with the rights transfer, still leavesthe investment project with an acceptable financial rate of return. As an alternative tosupply expansion, the utility could also consider a tariff rise.
In any given year there are a number of urban actors each with one or more poten-tial abstraction rights purchases in preparation but in which the final purchase pricehas not yet been legally agreed. For urban actors as a group, a function of the typerepresented in Figure 9.1 can be conceived to exist. The vertical axis measures, forurban actors, their maximum bid price per cubic metre in 2003. The horizontal axismeasures the abstraction rights volume purchased. We have a standard demand curve.For a modest addition to the urban actors’ abstraction capacity, high prices are bid.This is because such additions are necessary to meet clearly identified needs over, forexample, the years 2004–2008 (Rosegrant & Binswanger 1994: 1617). Much lower
Demand function(urban actors)
Supply function(farmers)
Z
Y
X
E
A b s t r a c t i o n r i g h t s p r i c e ( $ / m 3 )
Abstraction rights volume (m3)
Figure 9.1 Demand and supply functions for farmers’ water-rights.

8/12/2019 1843391775
http://slidepdf.com/reader/full/1843391775 91/230

8/12/2019 1843391775
http://slidepdf.com/reader/full/1843391775 92/230
muddy these crystal waters with real-life impurities if our market theory is to haveapplication to actual transactions.
9.4.1 Time-scaleThe analytic exposition is based on the trade of water-rights ‘in perpetuity’. However,Rosegrant & Meinzen-Dick point out:
While tradable water rights should be permanent, or very long term, to ensuresecurity of the right, transfer of water rights need not be permanent: waterrights can be leased for a season, a year, or many years. (Rosegrant & Meinzen-Dick 1996: 47)The present paper does limit itself to long-term or permanent trading. In the case
of the transfer of water-rights, the shorter the lease, the closer one approximates amarket in water itself. Rosegrant & Gazmuri Schleyer (1996: 276–7) give examplesfrom Mexico both of a one crop season transfer in Monterrey and a 50-year trade in
Guanajuato. The Mexican Comisión Nacional del Agua permits concessions andgrants for periods from 5 to 50 years, with terms exceeding 30 years the norm, ‘toensure security of the water right’ (ibid. 269).
It is not wise to present the theoretical approach above as a basis for all trades andtransfers, whatever their length. From the point of view of both the farmer and theurban actor a one-year lease, for example, is an asset utterly different from a perman-ent sale. Only in the latter case does the farmer give up for all time the use of thisflow of water for irrigation; and only in this case does the urban actor secure for theindefinite future its water source.
However, it must be admitted that the short term may be the prelude to the longterm. Haddad (2000: 95–116) has described a fallowing agreement in respect of about
118 million cubic metres of water per year for the 2 years ending in July 1994 betweenthe Palo Verde Irrigation District and the Metropolitan Water District of SouthernCalifornia. In 2002 the two parties were negotiating a contract to fallow up to 29% of the irrigated farmland for a 35-year period (A. Quist, pers. comm.).
9.4.2 Concessions
The general theory is framed in terms of a market in abstraction rights. But the use of water by farmers is also made possible when they enjoy a legal right to access waterflows from an organization that itself is the abstractor. The obvious case is where apublic irrigation authority assigns farmers the right to draw off water from a canal.
The model of Sections 9.2 and 9.3 can incorporate such ‘concessions’ (as they aresometimes called) without amendment and permits me to refer to it as a theory of themarket in tradeable water-rights rather than one limited to trades in abstraction-rights. Trading in the surface water concessions of a public authority may also oftenfall within a leasing model (see Section 9.4.1 above).
9.4.3 Part-sales
Here we consider the situation where the farmer sells only a fraction of his water-rights, retaining the rest for irrigation on a smaller scale. The theory incorporates this

8/12/2019 1843391775
http://slidepdf.com/reader/full/1843391775 93/230

8/12/2019 1843391775
http://slidepdf.com/reader/full/1843391775 94/230
suit or through a government ban. In fact, Bruns & Meinzen-Dick (2001: 3) suggest that‘… industries rely on their economic and political power to obtain water from farmers,legitimately and illegitimately. Institutional frameworks for carrying out reallocationthrough voluntary agreements among users are usually non-existent’. They suggest a
dual approach to providing a legal basis for trade. Where transactions are likely to besparse, the framework would simply enable transfers to be negotiated and allow chal-lenges by those who feel they may be harmed. In other cases laws and agencies wouldestablish a cadastre, introduce requirements for public notice, provide expert assess-ment of third-party impacts (see below) and assist the less educated and powerful in thetrading process (Bruns & Meinzen-Dick 2000). In this context it is suggested that:
… the establishment of markets in tradable property rights does not imply freemarkets in water. Rather, the system would be one of managed trade, withinstitutions in place to protect against third-party effects and possible negativeenvironmental effects … (Meinzen-Dick & Rosegrant 1997: 317)
9.4.6 Third party effects
When a farmer irrigates, some proportion of the water used is recycled downstream orback to the aquifer. Shiklomanov (2000, Table 5) estimates at the global scale that 70% of agricultural withdrawals are consumed and the remaining 30% are recycled. Followingthe sale of an abstraction right or a concession to an urban actor, the water is physicallytransferred to the water utility, to a residential developer or to an industrial enterprise. As a result the recycling (at an increased but perhaps polluted volume) takes place down-stream of the new users – households, manufacturing or urban service companies. Theupshot is that the third party interests of farmers and other actors downstream of theoriginal point of irrigation are affected. They lose the recycled flow they had enjoyedprior to the inter-sectoral transfer. But note that some farmers may experience greaterrecycled flows if the city in question is upstream of the farm selling its water-rights.
A third party effect also exists when an urban actor purchases a water right not util-ized fully by the farmer and then exploits that right 100%. The downstream flow iscorrespondingly reduced. As Kemper (2001) writes:
… [the downstream neighbours] may go to court to prevent the sale, therebycausing high transaction costs, or courts may not be available and they will haveto accept the loss. A mechanism is therefore needed to either negate third-party interests or to mitigate the impacts of water trading on the differentstakeholders, including an effective conflict resolution system.
So the approach to the return flows issue can stand at two extremes. In one case,there are no private rights to return flows; government retains them. Here the sale of a water-right by a farmer to an urban actor that results in a diminution of return flowscannot be challenged by the downstream party. This has long been the case, forexample in Chile, in Mexico and in the Northern Colorado Water ConservancyDistrict of the USA. At the other extreme farmers and other instream water beneficiarieshave a right to the return flows they receive and therefore can seek to block a develop-ment that reduces these flows or, at least, to be compensated for their loss. The transac-tion costs that must be met in agreeing a water-rights transfer are consequently higher(Rosegrant & Binswanger 1994: 1619, Gazmuri Schleyer & Rosegrant 1996: 37).

8/12/2019 1843391775
http://slidepdf.com/reader/full/1843391775 95/230
There is another source of third-party effects. In section one it is stated that thispaper does not review the broad-ranging arguments for and against re-allocating water from farming to the urban sphere. However, it is clear that a large-volumereduction of irrigation flows can have powerful, negative impacts on a rural economy
in which farming and agriculture-based services, manufacturing and transport aremajor employers. Water-rights trades can ‘dry up’ the economy itself. In New Mexico,for example, some acequí as have gone to court to block sales because they threatenthe community and local livelihoods (Meinzen-Dick, pers. comm.).
9.4.7 The market
The next real life complexity reviewed here concerns the market within which inter-sectoral trades take place. A physical market-place (such as a particular caf é) mayexist, or transactions simultaneously involving a number of farmers and urban actorsmay occur through an open, printed or digital form. Here potential buyers and sellers
can meet and gather information on the rights that are in trade.In the absence of such a market, deal-making is likely to be on a bilateral basis. A
specific urban actor seeks out a farmer who may be willing to sell his water-rights andthey conclude an agreement in the partial or complete absence of information aboutother potential purchasers and vendors. Here there is a strong likelihood of asym-metric information with the urban actor better informed about the farmer’s negoti-ation position than vice versa. The haggling process tips in favour of the water utility orthe urban enterprise. Karin Kemper writes (2001):
Socio-economic asymmetries need to be considered because of the differenttypes of water users, who will vary in their educational background, culture,and economic power. When water rights were allocated and made tradable in
Chile, electricity companies bought up a large number of them to be held forfuture use, to the detriment of smaller users who at the outset did not under-stand the implications of their selling the rights.
In regions where bilateral deals are dominant there is neither a market nor an equi-
librium price. Hearne & Easter’s valuable study on Chilean water rights marketsclearly indicate that the number of intersectoral transfers was low. This was true of the upper Maipo valley, the Azapa valley and the Elqui valley. In the Limarí valley‘transactions are fairly frequent’, but the text suggests these are predominantly trans-fers within agriculture (1995: 32–6, 50–3). In contrast a study of the water register of Santiago County in Chile for 1993–4 indicated there were some 500 permanent,agriculture-urban trades. They equalled only about 0.1% of the total water rights held
in the area (Gazmuri Schleyer & Rosegrant 1996: 42–3). In fact the best quantitativeexpression for the importance of water-rights trading, past and present, to the waterrequirements of a city is the volume of water comprised in such trades over timedivided by the total volume of water the city receives in the current year.
9.4.8 Transaction costs
These have already been referred to several times and are fully incorporated into thegeneral theory. The legal context strongly influences the transaction cost associated with any rights transfer. The greater the cost, the less likely it is that a deal will be

8/12/2019 1843391775
http://slidepdf.com/reader/full/1843391775 96/230
struck. Transaction costs include the time and money expended on searching for abuyer or seller of water-rights, negotiating and legalizing a contract, validating thelegal ownership of the water-rights, payment of any government tax on transfers, andenforcing the contract. In his Rivers of Gold Haddad (2000) makes clear in a set of
fascinating and detailed case studies from California that the management of risk liesat the heart of transaction costs. Note that these costs are those incurred in the trans-fer of water-rights, not those incurred in the physical capture and distribution of water. The latter is a commonplace supply cost (Merrett 1997: 5–40).
9.5 CONCLUSIONS
Allocation stress and the policy responses to the dilemmas it poses will be a primesource of debate in the field of water resources management during the next decades.In the broad sweep of world history, the transfer of water-rights from farmers to urban
actors has been one form in which allocation stress has been managed. This has takenplace through the sale of such rights or their seizure by force majeure; in both casessuch sales have frequently been accompanied by the sale or seizure of riparian land.
This paper set out to accomplish two objectives. The first was to set out an ortho-dox microeconomic account of a water-rights market in equilibrium. This was doneby representing urban actors’ requirements for farmers’ water-rights as a demandfunction based on each urban actor’s individual maximum bid price. The ruralresponse was represented as a supply function based on each farmer’s individual min-imum release price. The second objective was to ascertain whether this neo-classicalapproach could deal with a number of empirical complexities in real-life trading.
The conclusions are that the theory capably handles not only abstraction rights but
also concessions, part-sales, accompanying sales of land, and transaction costs.However, the theory’s applicability requires a strong enabling condition: that thelegal system fully incorporates such transfers (including a clear stance on third partyrights) and that an open, well-informed market exists.
But the empirical material cited shows that the absolutely predominant form of transaction is the bilateral deal. Bilateral transactions predominate because the totalnumber of annual sales in a defined market area is usually small, eliminating the pos-sibility of a thriving market process involving multiple sellers and multiple buyers.Rather than a competitive and open market we typically see only one or a small num-bers of sellers, that is, a rural monopoly or oligopoly. Similarly we find only one or asmall number of purchasers, a monopsony or oligopsony. The conclusion is that atheory of the neoclassical type does not well represent actual social processes. To
understand these processes, research is required into one-off, scattered, fragmentary,arcane deals, often of dubious legality and marked by information asymmetries.
However, it seems that the concepts of a farmer’s minimum release price and anurban actor’s maximum bid price are still appropriate, as is the account of how theseprices are shaped. Similarly, a rural monopoly–urban monopsony approach can alsodeal not only with abstraction rights but also concessions, as well as part-sales, landsales and the transaction costs structured by formal rights, customary practice or legalpluralism.
The material in this chapter originally appeared in: The urban market for farmers’ water rights. Irrigation and Drainage 52(4): 319–326, 2003.

8/12/2019 1843391775
http://slidepdf.com/reader/full/1843391775 97/230
10
The demand for water: fourinterpretations
In Geometry (which is the only science that it hath pleased God hitherto to bestow
on mankind) men begin at settling the signi fi cations of their words; which … they
call De fi nitions.
Thomas Hobbes, Leviathan, 1651
10.1 INTRODUCTION
An extraordinary characteristic of the current management of global water resourcesis the breadth of disciplines on which it draws. To name but a few one can cite agron-omy, civil and hydraulic engineering, economics, environmental science, geology,human and physical geography, hydrology, land-use planning, meteorology, politicalscience and sociology. Most readers of this paper will have received a professionaltraining in at least one of these subjects.
Each of these disciplines has its own language and not even a Darwin, a Keynes ora Newton could dream of mastering all of them. Yet every historian of science recog-nizes how critical is the language of a discipline to its success and how vital thedevelopment of the language of science is to science’s progress (Kuhn 1970). As Dow writes (2002: 5) ‘It is normal in scientific thought for terms to change meaning
over time’. A feature of water resource debates at the present time is the wide application of
the term ‘demand’. It may be that civil engineers first gave it real weight in waterresource planning. Civil engineers saw themselves above all as responsible for watersupply and therefore (this is an hypothesis) assigned the term ‘demand’ to refer tothose outstream flows that began at the point where engineers put into supply the water they had abstracted from lake, river and aquifer.
86
C 2007 IWA Publishing. ThePrice of Water: Studies in Water ResourceEconomicsand Management
2nd Edition by Stephen Merrett. ISBN: 9781843391777. Published by IWA Publishing, London, UK.

8/12/2019 1843391775
http://slidepdf.com/reader/full/1843391775 98/230
What is not in doubt is that ‘demand’ is a concept applied by professionals andpolicy-makers from many disciplines. It is the objective of this technical note first toshow that the word has a number of quite distinct meanings that it is unhelpful toconfuse, and second to show that distinguishing these meanings from one another
will strengthen planning practice.
10.2 THE USE OF WATER
The thesis presented here is that there are four demand-side concepts with respect tooutstream water: use, consumption, need, and economic demand. Water use is the
Table 10.1 The hydrosocial balance for a defined region in 2003.
Row Title Base year volumes (Mcm)
4 Categories of Supply5 Rainwater collection a6 Groundwater abstraction b7 Surface water abstraction c8 Desalination d9 Imports of water from other areas e
10 Internal reuse of wastewater f 11 External reuse of wastewater g12 Net fall in water abstracted and stored h13 Total Gross Supply j1415 Categories of Supply (Negative)16 Supply leakage and evaporation k
17 Exports of water to other regions l18 Net rise in water abstracted and stored1 m19 Total Negative Values n2021 Total Net Supply j n2223 Categories of Use24 Households o25 Agriculture p26 Mining q27 Manufacturing r28 Public services s29 Private services t
30 Other uses u31 Total Gross Use v3233 Categories of Use (Negative)34 Leakage and evaporation during use w35 Net rise in water received and stored1 x 36 Total Negative Values y3738 Total Net Use v y
Note: 1 A net fall (rise) in storage of water has a positive (negative) value.Source: Adapted from Merrett (2002a) Tables 8.1 and 8.2.

8/12/2019 1843391775
http://slidepdf.com/reader/full/1843391775 99/230
first and easiest concept to grasp. A generic way of tabulating the regional users of outstream water is in terms of households, agriculture, mining, manufacturing, publicservices, private services, and other uses. In each case we are referring to the quanti-tative flow per unit time of water arriving at a user’s property (a dwelling, a farm, a
mine, a factory, a hospital, an of fice block, etc.). That flow may be used beneficially orit may be wasted in various ways. Directly or indirectly, water use is the basis of human life and it makes up one of the two building blocks of the hydrosocial balancein a base year (such as 2003) or in a future scenario year. The generic form of thebalance is set out in Table 10.1.
10.3 THE CONSUMPTION OF WATER
During the course of using water, some part of it returns to the hydrological cyclethrough evapotranspiration; this is the second concept of interest to us – water
consumed. What is left after the use process is complete is waste water and irrigationreturns. These flows are reused internally or externally by user groups, or recycle asrun-off to surface water, or recharge groundwater.
The consumption of water is of particular interest because the ratio of consump-tion to waste water plus returns varies significantly between types of use (Shiklomanov2000). To take an example, a Colombian sugar-mill in the Cauca Valley that internallyreuses its own waste water to avoid abstraction charges seeks a low level of consump-tion. In contrast, an English farm in the Anglian region irrigating containerized treeshas 100% consumption – all its water is evaporated or transpired. The ratio of con-sumption to returns has generated a major debate on irrigation ef ficiency (Perry 1996).
10.4 THE NEED FOR WATER
The third of our concepts is water need. For households water need is a social, culturaland health-related concept; it refers to desirable or recommended levels of use fordrinking, cooking, personal washing, disposal of urine and faeces, cleaning and wash-ing in the house and watering of a kitchen garden. In the farm sector water needrefers to net irrigation requirements. For mining, manufacturing and the services sec-tors, their need for water is technically and institutionally determined. So the centraldifference between water use and water need is that the former represents an actualflow to users whereas the latter represents a desired or recommended flow.
Returning to the hydrosocial balance, estimated water need in a baseline year can becompared with water use, possibly leading to recognition of unmet need. For a scenario year, water need can provide the starting-point for planning an expansion in supply.
10.5 THE ECONOMIC DEMAND FOR WATER
The fourth concept is the economic demand for water . For economists the concept of ‘demand’ refers to the relationship, at a given time and within a defined market,

8/12/2019 1843391775
http://slidepdf.com/reader/full/1843391775 100/230
between price per unit of any product or service and the quantity in each time periodthat users are willing to purchase at each price. The demand function is convention-ally represented graphically with price on the vertical axis and quantity on the hori-zontal axis, showing the difference in quantity purchased at each price (e.g. Merrett
The cultural and economic context of any demand function is referred to as theconditions of demand. The first of these conditions is the tastes and habits of users.The second is the price, quality and availability of commodities that users consider tobe substitutes for the product. These two together should account for the users’ will-ingness to purchase. The third condition is the incomes, assets and access to credit of users, which account for the ability to purchase.
Where the conditions of demand are stable, the graphical function can be used torepresent not only price and quantity differences within a given time-period, as above,but also price and quantity changes in successive time-periods. This is legitimate onlyif expectations about the future are stable. Almost invariably, under these conditions,higher prices are associated with lower quantities and so the demand function slopes
downward from left to right. A matter of great interest in analyzing the economic demand for water is users’
responsiveness to price differences. With any given difference (or change) in price, isthe response large or small in terms of quantity purchased? One measure of this con-cept of responsiveness is called the price elasticity of demand and is equal to the pro-portionate difference in quantity purchased divided by the proportionate differencein price paid. In applying the concept of the economic demand for water, it is neces-sary for users to face a volumetric price or cost in accessing their supply. For example,on the Palestinian West Bank water utilities such as the Jerusalem Water Under-taking meter their supplies to households, to industry and to urban services. Moreover,rural households and farmers, although not on a networked supply, still face costs
varying with volume when they pump groundwater.
10.6 SUPPLY-SIDE LEAKAGE AND EVAPORATION
In Table 10.1 the categories of supply include in row 16 leakage and evaporationlosses that occur between the point at which human society appropriates outstream water and the point of delivery of water to user properties. Curiously such losses arealmost always treated in the current literature as a form of ‘demand’. The result isthat consultants’ forecasts of growth in ‘demand’ include (as unaccounted-for-water)supply-side leakage and evaporation. Furthermore the reduction of these losses inabstraction, storage and distribution prior to the delivery of water to the user is saidto be a form of ‘demand management’. This does not seem helpful. A manufacturerof refined sugar, when considering losses from output because of pilfering, or con-tamination while in the warehouse or destruction in a road or rail accident en route tothe supermarket, would never regard this as a demand for sugar, a bizarre act of useby a consumer whom the sugar never reaches. The manufacturer would regard all of these as storage or distribution losses in the supply chain. So should it be with thesupply of water.
There is a more general point here. Water resource management is now widelyseen as principally a form of ‘demand management’. To me such an approach seems
1997: Fig. 4.1).

8/12/2019 1843391775
http://slidepdf.com/reader/full/1843391775 101/230

8/12/2019 1843391775
http://slidepdf.com/reader/full/1843391775 102/230
11
The political economy of waterabstraction charges
11.1 INTRODUCTION
Fresh water is a fundamental necessity for human society – for the individual citizen,for households and for all those sectors which contribute to the economy’s output of goods and services. The principal sources of this water are threefold: first, directlyfrom precipitation itself, most obviously in forestry and agriculture; secondly, the
abstraction of surface water, that is, fresh water from rivers and lakes; thirdly, theabstraction of ground water, that is, from subterranean aquifers. Note that the desalin-ation of sea water, at the global level, contributes only a small proportion of total sup-ply (McDonald & Kay 1988: 8–34).
The focus of this article is the charges levied by government on individuals andinstitutions for the right to abstract surface and ground water. One objective is to pro- vide a general economic analysis of the subject capable of international application tospecific case studies. The second objective is to recommend the most appropriatebasis for government abstraction tariffs.
The scope of abstraction charging includes water consumers abstracting directlyfor their own use, such as farmers, mining companies and manufacturers. One also
includes water service companies that abstract not for their own use, but in order toprovide the public water supply. In the Thames catchment in the UK, for example,the largest abstraction permissions provided by the Environment Agency are for six statutory water companies, plus a number of industrial users, such as Didcot powerstation, that are direct abstractors. Excluding precipitation itself, direct abstraction isalso the main source of water for agriculture in the Thames Valley (Merrett 1997:15–22).
91
C 2007 IWA Publishing. ThePrice of Water: Studies in Water ResourceEconomicsand Management
2nd Edition by Stephen Merrett. ISBN: 9781843391777. Published by IWA Publishing, London, UK.

8/12/2019 1843391775
http://slidepdf.com/reader/full/1843391775 103/230
The instream users of water are not addressed here, such as fishing, navigationand leisure, where no abstraction of water is required for such use. Nor does thepaper deal with tradeable abstraction rights, such as those in Australia and Chile,because these constitute market transactions between private parties, with govern-
ment merely setting a regulatory framework (Pigram et al. 1992, Hearne & Easter1995).
11.2 ABSTRACTION CHARGES AND THE THEORY OF RENT
A useful analytic starting point is to establish that abstraction charges are a form of economic rent. The modern theory of rent was first developed in the early nineteenthcentury (Robinson & Eatwell 1974: 11–17). Its application was to British agricultureand the common situation where capitalist farmers used land owned by the aristo-cracy and the gentry, and paid rent for that right. At that time, agriculture contributed
about one-third of Britain’s total output. The classical school argued that the appro-priation of land has the consequent effect of the creation of rent. Thus, Ricardo writes: ‘Rent is that portion of the produce of the earth, which is paid to the landlordfor the use of the original and indestructible powers of the soil’ (Ricardo 1821: 67).
It is true that we may now doubt that any power of the soil is indestructible.Nevertheless, since Ricardo’s time, economists have used rent theory whenever theyare dealing with a natural resource of economic value, which can be privately appro-priated, and which is in restricted supply. Clearly this makes rent theory applicable tonatural supplies of fresh water. These flows are of economic value. Rights in theirabstraction can be privately appropriated. Lastly, surface and ground water is inrestricted supply in any given year. Winpenny (1994: 54–67) provides examples of
rental markets for water in India and the USA.However, the supposed inelasticity of raw water supply deserves closer scrutiny.
Within a catchment, short-term elasticity is perversely high, where substantial stocksare held in a catchment’s reservoirs or where aquifer stocks are high and ground water pumping capacity is not fully utilized. But it is the elasticity of the planning sup-ply function of raw water over the medium- to long-term which is at issue here. It iscertainly true that total rainfall in the catchment less evaporation sets a hydrologicalconstraint on long-term catchment abstraction, as Dubourg suggests (1993: 3). Butthe recycling and reuse of water weakens this natural barrier whilst the desalinationof sea water, and abstracted water imports from another catchment can smash it. Theproblem is that the wider one casts the net for additional supply, the greater are itsunit costs. It is the exponential character of this planning function which maintainsthe truth of the statement that in the majority of the world’s catchments with sub-stantial populations, abstracted water is indeed in restricted supply (Turner &Dubourg 1993: 5).
Let us now return to the classical theory of differential rent. This assumed thatcompetition existed between farmers for access to land, and between landowners insupplying land. In such a situation, it is theorized that land rent on the least fertile tractof land worth cultivating would be zero, and here the farmer would earn the going rateof profit on capital for the the private sectors of the economy as a whole. Land which was more fertile (or better located) would bring the owner a higher flow of rentalreceipts such that the farmer, after paying this higher rent, would still receive only the

8/12/2019 1843391775
http://slidepdf.com/reader/full/1843391775 104/230
going rate of profit. Rent could therefore be seen as the transformation of the surplusprofits of capital, driven by the competition for land of differential fertility.
Ricardo had only a limited interest in non-competitive markets in the supply of land for rent, albeit he did describe a case where monopoly rent, rather than differ-
ential rent, is paid (Merrett & Sharp 1991: 303). As a consequence, his theory isessentially demand-driven. This neglect of the supply-side determinants of land rentrestricts the scope of differential rent theory in its application to abstraction chargeslevied by government. Such charges exist typically where an agency of the statelicences abstraction to specified individuals and institutions, and where no propertyright exists to abstract ground and surface water without such a licence. Here, prop-erty rights on the supply side are assigned by a state monopoly.
Thus with government abstraction charges, analysis certainly requires an under-standing of the effective demand for water by water service companies and directabstractors. Differential rent theory is unquestionably valuable here. But analysis alsoneeds a means to interpret the legislative practice of charge-setting by state institu-tions in different catchments, regions or countries.
11.3 A CHARGE-SETTING TAXONOMY
Having argued that abstraction charges are a form of economic rent, but that differ-ential rent theory does not provide a basis to explain charge-setting by the state, thebest way to proceed may be by developing a taxonomy of charge-setting principles.Such principles can then provide the basis for interpretive empirical work in specificcatchments, as well as a starting point for policy review of existing legislative practice.Eight charge-setting principles are set out below and each is glossed in turn.
No charge. This is the lower limiting case. In the majority of the world’s countries,government abstraction charges simply do not exist. In some cases the argument is that,since surface and ground water are a gift of Nature or of God, the state has no businessin taxing it. This may explain the situation in Scotland, for example (Fowler 1995: 17–8).In other cases, what is lacking is the administrative capacity to levy the tax.
A revenue-maximizing charge. This is the upper limiting case. The long-term effect-ive demand curve for water is probably cubic, reflecting the absolute necessity for thegood, so in principle government could raise all its revenue requirements from thissingle tax (Merrett 1997: 53–8). In practice, of course, such a principle is neverapplied.
A market-clearing charge. In countries and regions which are arid, or where levelsof water consumption are high in relation to effective rainfall, users may wish to gainaccess to more water than is available, at least in the absence of inter-catchmenttransfers. In this case, government may put in place a demand-management policy in which a general abstraction charge is applied which, although it is not revenue-maximizing, does just match the demand by abstractors to the annual flows available.No pure examples exist of this, the closest being the public auction of tickets for fi xedtime and flow in the centuries-old water market of Alicante in Spain (Winpenny 1994:55–7). The adoption of demand-management policies, including water resourcepricing of various types, is gaining ground on a global scale. For example, Schif flerand his colleagues at the German Development Institute have shown for the case of Jordan that supply-fi x policies are under considerable pressure and that a demand-

8/12/2019 1843391775
http://slidepdf.com/reader/full/1843391775 105/230
management philosophy is taking shape (Schif fler et al. 1994: 13–6). Politically, it isimpossible at the present time in Jordan to tax water abstracted for use by farmers,but an abstraction tax on industry has been introduced there. Winpenny argues thatone of the world’s longest established and most successful water markets is in the
Colorado-Big Thompson scheme, where the Northern Colorado Water ConservationDistrict since the mid-fifties has used water pricing to transfer abstraction suppliesfrom agricultural to urban uses, thereby raising allocative ef ficiency (1994: 59–61).
An environmental regulation charge. In this case one is considering a country whichhas a well-developed national policy for water resource management. The necessityfor a regulator of the fresh water environment is accepted and abstraction charges arelevied and hypothecated to finance the costs of regulation. (‘Hypothecation’ is a term widely used in the UK to refer to cases where government income from a defined tax is reserved for a specific expenditure category.) A clear example here is theEnvironment Agency for England and Wales. This institution’s riverine managementcosts on current account are specifically recovered by charges made on licensedabstractors under a scheme of abstraction charges approved by the Secretary of State
for the Environment (National Rivers Authority, 1993: 7–8, 1995). The Agency mayrevoke or revise licences but funds for compensation have to be found from itsregional water resources budget (Rees & Williams 1993: 25–6).
An average total cost charge. In addition to regulation costs, the state may bearother costs in making fresh water resources available in a catchment. The abstractionof fresh water can require infrastructures provided by the state, sometimes on a con-siderable scale, as was the case in Early Mesopotamia. In such cases, a charge may belevied per cubic metre of water abstracted in order to defray in whole or in part theaverage total cost of these infrastructures. An example here is the abstraction chargeslevied on farmers in the Goulburn-Murray Irrigation District of Victoria in Australia(Pigram et al. 1992: 91–120). Another cost is the compensation it may be necessary to
pay to existing holders of abstraction rights, when a catchment authority wishesto modify or rescind such rights in order to achieve the objectives of its catchmentmanagement plan. An average total cost charge is equal to total financial costs ofregulation, infrastructural investment, compensation payments and any othermiscellaneous items, divided by the total volume of water abstracted during the year.Its introduction would have many opponents amongst water users and water sup-pliers, despite the clear feasibility of such a charge being fiscally neutral. Moreover, inthe opening up of new areas for irrigation as part of a regional development strategy,a charge on users reflecting the full cost of the water supplied to them would deal the coup de gr â ce to any such ambition. An interesting account of successful full recoveryof deep tube-well installation and maintenance costs from farmers through abstrac-tion charging is the Barind Multipurpose Development Authority’s experience inBangladesh since 1985 (Zaman 1996).
A marginal cost charge. Some writers working within the orthodox paradigm, suchas Dubourg (1995), have considered the appropriateness of an abstraction charge which reflects marginal cost. There are two serious problems with such proposals.First, it has to be said that catchment authorities frequently have little or no interestin marginal additions to abstraction capacity. Marginal change is not the point, it isnon-marginal changes in capacity that we need to address, as Dubourg himself pointsout (1995: 8). This moves the discussion, for example, to average cost per cubic metreof additional water abstracted and to the traditional utility price analysis dilemmain which large surpluses are generated when average additional cost exceeds the

8/12/2019 1843391775
http://slidepdf.com/reader/full/1843391775 106/230

8/12/2019 1843391775
http://slidepdf.com/reader/full/1843391775 107/230
licensing in Latin America indicate that installation fees are common and arehypothecated.
• A charge per unit volume. This may be invariable with total volume consumed. Alternatively, it may rise with the volume drawn off. The total charge payable maybe based either on the licensed volume or the actual volume abstracted. As Schif fler
et al. (1994: 15) point out, a significant drawback of a rising block tariff is that it hitshardest those abstractors requiring large volumes simply because of the size of thefarm or factory. It should also be observed that abstraction charging is neverimposed where the installation’s capacity falls below a minimum level set by govern-ment. The effect of this is that direct abstraction by households to meet their needsfor drinking, washing, cooking and sanitation are outside the regulatory system.
• A charge reduction for the quantity of water directly returned to surface watersafter use. To take the example of Didcot power station again, this has a licence toabstract 142 million litres of water per day. The licence requires 50–66% of the water abstracted to be returned to the river, depending on flow conditions. Unitprice is lower because of this ‘non-consumptive’ use. In contrast, spray irrigation
provides virtually no return flow to river or aquifer and so is undiscounted.• A charge which is greater for higher quality water. This is found in Germany, for water drawn from deep aquifers, where the average total cost per cubic metreabstracted is inevitably higher.
• A charge which varies with the seasons. The volumetric rate is higher in thosemonths when effective demand is greater and higher too when precipitationis less.
• A charge which is greater for certain locations. These include upstream sources,because the length of the river exposed to abstraction impacts is greater; rivers,lakes and aquifers most threatened by past or present overdraft; and regions withlower effective rainfall.
11.4 ABSTRACTION CHARGES AND SUSTAINABLE
CATCHMENT MANAGEMENT
In this section, the subject of abstraction charging is related to the debate on sustain-ability, beginning with the approach of Richard Dubourg (1993, 1995), whose contri-butions to the study of hydroeconomics are within the neoclassical framework andare widely influential within the UK. Dubourg suggests that aggregate sustainability isa situation where natural capital as well as non-natural capital are non-declining andspecifically where ‘critical capital’ such as water, within the natural capital category, isnon-declining. From these definitions he deduces impeccably that aggregate sustain-ability is consistent with catchment management policies in which abstraction of sur-face and ground water is equal to effective rainfall, that is, the entire hydrologicalflowknown as runoff, defined by hydrologists as total precipitation in a catchment less evap-oration (McDonald & Kay 1988: 8–19). It has to be said that the adoption of such adefinition of sustainable abstraction is extraordinarily dangerous. Abstraction at arate equal to runoff is certainly capable of leaving surface and ground water stocksunchanged over the course of a year – the critical capital stock is, indeed, maintained.But a rate of abstraction at this maximum rate would have the effect of capturingthe entire river flow at some point or points in the catchment. In effect, Dubourg’s

8/12/2019 1843391775
http://slidepdf.com/reader/full/1843391775 108/230

8/12/2019 1843391775
http://slidepdf.com/reader/full/1843391775 109/230
Secondly, where the full cost abstraction tariff still leaves an excess of demand forabstracted water over its licensed supply, the charge should be raised so that marketclearing takes place.
Thirdly, specification of the components of the abstraction charge should provide
incentives for abstraction behaviour that is economically ef ficient and that avoids envir-onmental degradation. Price per unit volume should be invariant with total volumeabstracted, unless there are countervailing economic or environmental arguments.Here, one accepts the argument in section three above by Schif fler et al. against a ris-ing block tariff. Price should be discounted where abstractors recycle their off-take tosurface or ground water sources. (Discharge fees should be used to handle the waterquality aspects of recycled water.) Charges should be higher for abstracted water of higher quality. Seasonal variations in effective rainfall and economic demand shouldbe dealt with through the licensed volume provisions laid down by the regulator and bythe market clearing criterion. Charges should be higher for upstream sources and forabstraction in locations where species and habitats are more threatened by abstrac-tion. Charges should be higher in parts of the catchment (or region) where water-
related infrastructural costs borne by the state are higher and should be higher toreflect the greater infrastructural costs generated to meet peak demands.
11.5 THE IMPACT ON USERS
What can one say about the impact of full incentive charging on the purchase of abstracted water? Here the analysis is best conducted in terms of the big battalions – water companies, industry and agriculture.
Water companies with a statutory responsibility to provide the public water supply
would readily acknowledge that the current abstraction charges they face are passedon to final consumers. In any case, such charges make up only a small part of totalannual costs. The annual expenditures of a water company are dominated by the costof capital, staff wages and salaries, electric power and materials such as chlorine(Merrett 1997: 128–34). So even a two- or fi ve-fold increase in the abstraction chargeper cubic metre of water would have little effect on the price to consumers of the pub-lic water supply. The principal response to a change in the charge is likely to be areview by the company of the cost effectiveness of reducing the leakage rate in itsproduction and distribution systems. The response of consumers and of the watercompany would, nevertheless, reduce the quantity the company seeks to abstract.Unfortunately, no empirically based estimation of the elasticity of demand for waterabstracted by statutory companies exists, as far as I am aware. Of course, in countriessuch as the UK where most households pay a fi xed charge for water consumed, nota price per unit volume, there would be no demand response whatsoever.
Now let us consider the case of direct abstraction by industry, such as in powergeneration, mining, construction, manufacturing and the services sectors. As a gen-eral rule one can say that where industrial companies use only small quantities of water, their reduction of quantity purchased in response to full incentive pricing islikely to be negligible. Rees et al. (1993: 17, 40) have suggested that the costs of waterto UK manufacturers are usually a maximum of 0.2% of total costs and that industryexhibits a very low level of knowledge of water’s volumetric price even whenpurchased from water companies. However, where industrial processes require large

8/12/2019 1843391775
http://slidepdf.com/reader/full/1843391775 110/230
volumes of water, there may be a strong interest in water reuse within the company, with a consequentially large fall in the quantity which needs to be abstracted. Reusealso has the advantage of cutting firms’ fees for the discharge of industrial ef fluent.
Throughout the world, water is also directly abstracted by individual farmers or by
organizations acting for them. Water for irrigated agriculture constitutes more than90% of total consumption in a large group of low-income countries (Kinnersley 1994:181). In these cases, full incentive charging may have a powerful impact on farmers’budgets. Where farmers’ incomes are low and full incentive charging would make water unaffordable for them, and where government or a delegated agency wishes tocontinue to subsidize the agricultural sector, such subsidies should be transparent.Where full incentive charging is applied, it is likely to stimulate husbandry in theapplication of water as well as the production of crops with high water productivities,as Schif fler et al. (1994) and Gleick et al. (1995) have shown for Jordan andCalifornia respectively.
11.6 FINAL REMARKS
I wish to end this paper by suggesting the institutional framework which would bemost appropriate for full incentive charging. These ideas have been strongly influ-enced by Karin Kemper’s The cost of free water (1996). The basic approach is a nego-tiation model in which there exists a public sector catchment agency that, through anegotiating forum, develops its policies with the advice of water companies, directabstractors, environmental organizations and water user associations representingthe domestic sector, irrigated agriculture, mining and manufacturing, etc. The ori-ginal prototype for such negotiation models is the French water parliaments
(Tuddenham 1995). Central government retains the statutory right to determine which public and private institutions may enjoy the right to abstract water, on whatscale, in what locations, at what time of year, at what price – but it delegates suchrights to the catchment agency.
The agency, with the assistance of its partners in the negotiating forum and with afull understanding of existing customary rights, then assigns formal abstraction rightson a time-limited basis to specific abstractors. The time limit would be 10 years, let ussay, rolled over each year except where the agency allows the licence to expire. Wherethese 10-year rights need to be modified or rescinded for hydrological, environmentalor economic reasons, compensation would be payable to the abstractor so affected.Rules would also exist to address Third Party impacts. Abstraction rights assigned toabstractors could be freely traded between abstractors provided the agency hadapproved such transfers in the light of their environmental impacts.
Full incentive charging would be the basis of the price paid by abstractors for their water and has the objectives of underpinning environmental regulation with ahypothecated income source, of requiring abstractors (and therefore final users) tocover the full costs of regulation and state infrastructural provision, of bringing thequantity of water demanded by abstractors into line with regulatory limits, and of giv-ing price signals which promote both allocative ef ficiency as well as abstraction prac-tices which avoid damage to riverine eco-systems. No charge would be made forabstractions below a minimum scale; the transaction costs of such charges would behigh relative to the volumes abstracted.

8/12/2019 1843391775
http://slidepdf.com/reader/full/1843391775 111/230
Abstraction infrastructures would be constantly reviewed. Where they requirerehabilitation or new investment, this may be carried out either by the agency or theabstractors themselves. In the former case, the financial costs would be reflected inthe agency’s charges, as already indicated. Arrangements would be made to monitor
abstraction with respect to its location, time and quantity, as well as to invoiceabstractors, to collect the charges owed and to enforce all agreements. Such transac-tion costs would be included in the full costing tariff of abstraction charges. The cre-ation of this institutional framework imposes social, economic and political costs onthe parties concerned, that is, structural costs of change both real and financial intheir nature. Therefore the negotiating forum may agree that it is sensible for fullincentive charging to be phased in gradually.
One final issue is briefl y considered here. It is argued above that regulatory con-trol is the context within which abstraction charging is deployed. This may suggestthat the environmental constraints are designed and specified and only thereafter isthe incentive tariff formulated. In practice, work on both should proceed simultan-eously and dialectically, because regulation and environmental pricing are interde-
pendent activities within a single planning process.
The material in this chapter originally appeared in: The political economy of water abstractioncharges. Review of Political Economy, 11(4), 1999.

8/12/2019 1843391775
http://slidepdf.com/reader/full/1843391775 112/230
12
Twelve theses on the cost and useof irrigation water
12.1 THESIS 1
In the field of water resource management a widely held belief exists that allocationstress is found in many parts of the world and is set to become more intense in thefuture both because of climate change as well as global growth in population andincome. Allocation stress refers to access conflicts between the agricultural, domestic,industrial, urban service and environmental uses of outstream and instream waterflows. If the belief that allocation stress will intensify is well founded then, because of
the dominant role of irrigation water use at the global level, it is worthwhile exploringthe possibility of slowing the growth of farmers’ use of such water.
12.2 THESIS 2
To some degree the deceleration of irrigation water use can be achieved by raising thecost of water to farmers. The higher cost may lead them to reduce the cultivated areaunder irrigation, or to favour crops that use less irrigation water, or to apply watermore productively, or some combination of these three actions.
12.3 THESIS 3
Raising the cost of water to farmers is unfavourable to them as a class. It is likely toreduce their gross margins, or require investment in water-saving technology, or reducethe market value of their holdings, or in some cases drive them out of business.Farmers can be expected to resist the new cost policy more-or-less forcefully.
101
C 2007 IWA Publishing. ThePrice of Water: Studies in Water ResourceEconomicsand Management
2nd Edition by Stephen Merrett. ISBN: 9781843391777. Published by IWA Publishing, London, UK.

8/12/2019 1843391775
http://slidepdf.com/reader/full/1843391775 113/230
12.4 THESIS 4
In all cases, today and since the dawn of irrigation in Mesopotamia, farmers’ costs of irrigation water have taken one of four forms: own-supply cost, volumetric price, indir-
ect fee or revenue-only fee. Hybrid types also can be found. Own-supply cost refers toany case where the farmer provides (at a cost) his own supply of irrigation water, suchas in the case of building and maintaining his own well. Volumetric price refers tothose cases where a farmer purchases irrigation water at a price per unit volume.Indirect fee indicates the many and varied cases where a farmer pays for his waterunder rules in which the cost he bears has an indirect relation with the volume used.Revenue-only fee indicates cases where a farmer pays for his water but where no rela-tion exists between the payment and the volume of irrigation water used.
12.5 THESIS 5
Own-supply costs, certainly with respect to their prime cost component, vary with the volume of water used by the farmer, that is, the farming family’s or agribusiness’s fieldsupply. This binding of cost and volume may be loosened by implicit subsidies, particu-larly cheap energy. Here the cost of irrigation water to farmers can be raised by reducingenergy subsidies. It can also be increased by the introduction of abstraction charges.
12.6 THESIS 6
Volumetric price also binds cost and volume. But the price may fall short of the full-cost of the field supply. Indeed it may fall short of operation, maintenance and man-agement costs. Here the cost of irrigation water to farmers can be raised by increasingtariffs. However, the introduction of volumetric pricing faces grave dif ficulties: flowmeters require delivery through a pipe resulting in head loss that may reduce wateravailability at the farm level; and the cost of installing meters, monitoring them andcollecting fees from smallholders may be prohibitive.
12.7 THESIS 7
Indirect fees are charges for irrigation water that have an indirect binding of cost and volume. They include charges that vary with the farmer’s irrigable area, or for a water
turn of given time duration, or with crop composition where ‘ wet crops’ incur heaviercharges than ‘dry crops’. Indirect fees are often accompanied by a quota regime. Hereagain the cost of irrigation water to farmers can be increased by raising tariffs.
12.8 THESIS 8
Revenue-only fees are those that do not meet the binding principle but merely act toraise income for an irrigation authority. They can be used to reduce irrigation wateruse only by driving farmers out of business.

8/12/2019 1843391775
http://slidepdf.com/reader/full/1843391775 114/230
12.9 THESIS 9
Where the binding principle operates (see Thesis 5) the possibility exists that anincrease in irrigation water costs may lead to a deceleration in the growth of use (or a
fall in use) in comparison with the no-cost-increase alternative.
12.10 THESIS 10
A policy to decelerate significantly irrigation water use by raising its cost to farmersrequires that a minimum absolute value of the elasticity of demand exists, for examplea value of 0.5. Such a minimum value requires some combination of the followingconditions:
• The binding principle operates.
• The farmer exercises control over the field supply volume.• Irrigation water costs are a visible component of prime costs to the farmer.
• The farmer understands that a proportion of the water applied with the currenttechnology (and at specific stages of the crop year) enjoys a low return in terms of crop yield.
• The farmer understands that new techniques are available that will improve theproductivity of water applied, such as its gross margin ef ficiency.
• The farmer understands that reducing the volume of irrigation water used doesnot materially increase the risks s/he faces.
• The farmer understands that the losses of non-crop returns from irrigation waterreduction are not large.
•Crops are not ‘feed crops’, that is, they are not cultivated for the farming families’
subsistence, or for feeding to their livestock, nor are crops grown by agribusinessas an input to its own manufacturing processes.
• Under conditions of general (even if modest) inflation, the cost of water to thefarmer must outstrip the wholesale price of the crop.
12.11 THESIS 11
At the basin level the good sense of water management policies tackling allocationstress by reducing abstraction for irrigation holds only if the water thereby releasedactually becomes available for domestic, industrial, urban service of environmental uses.
12.12 THESIS 12
The reduction of the base supply to the irrigation sector reduces the return flows of water to farmland, river, lake and aquifer. In some cases these lost returns conse-quent on diminished abstraction can wipe out the advantages of reallocation.
The material in this chapter originally appeared in: Twelve theses on the cost and use of irrigation water. Irrigation and Drainage, 51(3): 265–268, 2002.

8/12/2019 1843391775
http://slidepdf.com/reader/full/1843391775 115/230
13
Behavioural studies of thedomestic demand for water
services in Africa
… there is no such entity as a distinctive type of ‘ structural explanation’ in the social
sciences; all explanations will involve at least implicit reference both to the purpos-
ive, reasoning behaviour of agents and to its intersection with constraining and
enabling features of the social and material contexts of that behaviour.
Anthony Giddens, The Constitution of Society, 1984
13.1 A METHODOLOGICAL REVOLUTION
The purpose of this paper is to contribute to the modern history of hydroeconomics.From the mid-1980s a very small group of university academics, and professionalsfrom the international banks, launched a methodological revolution in the study of domestic water and waste water services in the low-income countries. This revolutionresulted in a permanent transformation of the way the water resource professionsapproach the household sector there. Here I wish critically to review this literature inorder to strengthen future research. The paper does not cover techniques for fore-
casting future price and volume outcomes based on willingness-to-pay field work; it islimited to the study of existing behaviour. Willingness-to-pay surveys are the subjectof a future article.
The three principal authors of this change were Dale Whittington from both theUniversity of North Carolina at Chapel Hill and the World Bank, Xinming Mu of the Asian Development Bank, and Donald T. Lauria, also from the University of NorthCarolina. Other authors were Briscoe, Roche and Wright of the World Bank, Choe,Hughes, Okun and Swarna all at Chapel Hill, Okorafor and Okore at the University
104
C 2007 IWA Publishing. ThePrice of Water: Studies in Water ResourceEconomicsand Management
2nd Edition by Stephen Merrett. ISBN: 9781843391777. Published by IWA Publishing, London, UK.

8/12/2019 1843391775
http://slidepdf.com/reader/full/1843391775 116/230
of Nigeria, Liu and Smith at North Carolina State University, and McPhail at JohnsHopkins University. The key publications are listed in Table 13.1. As can be seen, thefield work was carried out in the period 1986–9 in Africa, and the papers were pub-lished in the period 1989–93. Four areas were researched: Ukunda in Kenya, Nsukkadistrict in Nigeria, Onitsha in Nigeria and Kumasi in Ghana. The focus in these firstthree areas is water services; in the fourth it is waste water services.
Whittington and his colleagues show a strong interest in policy, suggesting that thelow-income countries in general have suffered from repeated failures in programmesdevoted to domestic water and sanitation needs. ‘There are simply too many leakingtaps, abandoned water systems, and defunct village water committees for anyone to
be sanguine about the current rate of progress’ (Mu et al. 1990: 521).It is forcefully argued that these weaknesses flow from traditional approaches that
are ‘out of touch with present demographic and financial realities’ (Whittington et al.1993: 733) in which ‘designs for new systems are generally made and projects con-structed with little understanding of household water demand behaviour’ (Whittingtonet al. 1991: 179). Master plans of sewers and treatment plants as well as engineer-dominated supply-side philosophies are criticized for their neglect of the demands of beneficiaries. The view, ascribed to van Damme & White (1984) that design specifica-tions should not require households to pay more than 3–5% of their income on waterand waste water services repeatedly comes in for attack. In fact the setting of watercharges within the 3–5% bracket goes back at least as far as 1975 (World Bank 1975).
As a consequence, the authors argue that the way forward is to undertake detailedcase studies of families’ actual water use behaviour and their observed ability and willingness to pay for water services. This information can provide a well-groundedbasis for estimating the uptake of new programmes (Whittington et al. 1989, 1990a).In their first Nigerian study, Whittington et al. conclude (1991: 194): ‘Most people inOnitsha are already paying high prices for water from the vending system for service which is inferior to that which could be provided by a well-run piped distribution sys-tem’; and the local water and sewerage authority should view itself ‘as a regulatedutility, not as an agency providing a social service’.
In what follows, I consider first the principal insights of these valuable contributionsby Whittington et al. and their colleagues and then develop a critique of some aspects
Table 13.1 Seven behavioural studies of African domestic water services.
Authors Case study Year of Year of location field work publication
Whittington, Lauria, Okun, Mu Ukunda, Kenya 1986 1989Whittington, Mu, Roche Ukunda, Kenya 1986 1990Mu, Whittington, Briscoe Ukunda, Kenya 1986 1990Whittington, Lauria, Mu Onitsha, Nigeria 1987 1991Whittington, Okorafor, Okore, Nsukka, Nigeria 1989 1990
McPhailWhittington, Smith, Okorafor, Nsukka, Nigeria 1989 1992
Okore, Liu, McPhailWhittington, Lauria, Choe, Hughes, Kumasi, Ghana 1989 1993
Swarna, Wright
Source: see references.

8/12/2019 1843391775
http://slidepdf.com/reader/full/1843391775 117/230
of their work. Two tables that may be useful for future studies are proposed: an AttributeMatrix and a check-list of some information requirements for household surveys.
13.2 MARKET NETWORKS FOR WATER
The water services in any region can be represented as a three-layer cake. The bot-tom layer is the forms of access to fresh water; the middle layer is the modes of distri-bution of the volumes initially generated; and the top layer is the pattern of uses of water. Taking all categories of use together, the total access volume less evaporationand leakage provides a net supply mathematically identical to the total volume dis-tributed which, after again deducting losses, is identical to the total volume used.These identities provide the type of internal accounting checks I have employed indeveloping the concept of the hydrosocial balance (Merrett 1997, 1999, 2002).
The fi rst strength of the water demand school that has been introduced above is its
demonstration of how socially complex these networks of access and distribution canbe. The 1986 study of the village of Ukunda with its population of 5000 demonstratesthis well. Some households queue to collect their water directly from local wells andhand-pumps, performing all three roles of abstractor, distributor and user. In otherinstances a very small number of households have piped water to their homes sourcedby the local water utility. In the third case kiosk owners receive a piped supply whichis then sold directly to households who carry it back to their dwellings in 20-litre jer-rycans. In the fourth case kiosk owners sell on the water to retailing vendors whothemselves then distribute it to households’ front doors, using carts or bicycles tocarry the jerrycans (Whittington et al. 1989). The water demand school’s work on thecities of Kumasi and Onitsha, with their populations of 600,000 and 700,000, respect-
ively, showed each had its own distinctive access-distribution-use system. In these twourban cases, water tankers played a major role. In demonstrating these social com-plexities, Whittington and his colleagues also contribute greatly to our understandingof the economics of the supply processes.
The second strength of these research studies is their detailed examination of thedynamic and competitive markets in water that exist in many of Africa’s villages andtowns. In the Ukunda and Onitsha case studies it was possible to draw a chart of theaccess and distribution network to households, to collect data on the unit pricefor each branch of the network, to estimate the volumetric flows of abstraction anddistribution and therefore to calculate the turnover along that branch.
Table 13.2 illustrates the case of Onitsha. With respect to households there are 11relevant access/distribution branches. The variation of volumetric flow betweenbranches is high. For example, the lowest dry season branch flow (shallow well collec-tion by doorstep vendors) is a mere 10,000 imperial gallons per day (2200 litres/day),only 0.3% of the highest flow (private borehole sales to tanker trucks) at 3 million g/d(660,000l/d).
Unit prices are also marked by their high variance. Shallow well collection incursno monetary charge, although the collection time (the time spent queuing, drawing water and the journey to and from the well) can be lengthy and exhausting. Even limit-ing our scope to priced supplies, there is still a marked divergence. For example, theunit price of the public piped supply at 0.003 naira/gallon (0.0007n/l) is only 2.4% of the price charged by doorstep vendors to households at 0.127n/g (0.028n/l).

8/12/2019 1843391775
http://slidepdf.com/reader/full/1843391775 118/230
The most extraordinary aspect of the monetary data, for those unfamiliar with African water markets, is that the proportion of water supplied to households by the
public sector Anambra State Water Corporation in the 1987 dry season was 32% of the total but its share of total turnover was only 4%.
In Onitsha, Whittington et al. also note the powerful effects on the market of thechanging seasons, dry and wet. The main difference is that in the rainy season house-holds manage to capture 2.3 million g/d (10.5 million l/d) of rainwater with the effectthat their purchases from the water vending system fall to about half the dry seasontotal. Rainy season prices are lower, of course, with the downward shift in the demandschedule. Seasonal variation in the structure of the market is also observed in Ukunda, where rainy season prices are half those of the dry season, as well as Nsukka district.
The third strength of the water demand school is their success in estimating theproportion of domestic income absorbed by water purchases. In Ukunda annual percapita income is put at US$350 in 1986, annual domestic expenditure on water perhead is about US$30, giving a per capita outlay/income ratio of some nine per cent.‘Those who use vendors enjoy a high level of service; good quality water is deliveredto their doorstep on demand. Although vending does not provide a level of servicecomparable to house connections from a well-run piped distribution system, it isfar superior to that available in most rural communities in Kenya. This high level of service is, however, expensive’ (Whittington et al. 1989: 164).
In Onitsha in 1987, average annual household income was about US$1600, althoughabout 25% of households received less than US$600. Average household size was six to seven people. Whittington et al. do not present a single value for the outlay/incomeratio over the whole year and for all income classes, but their published information
Table 13.2 Water and money flows in Onitsha – 1987 dry season.
Access/distribution branch Water volume Unit price Turnover(million gallons (naira/gallon)2 (naira)per day)1
Household collection from private 0.30 0.027 8000boreholes
Private borehole sales to tanker trucks 3.00 0.003 10000Truck sales to households 1.00 0.020 20000Truck sales to shops 1.70 0.020 34000Shop sales to households 1.55 0.050 78000Shop sales to doorstep vendors 0.05 0.040 2000Private borehole sales to doorstep 0.05 0.020 1000
vendorsShallow well collection by doorstep 0.01 0.000 0
vendors
Doorstep vendor sales to households 0.11 0.127 14000Shallow well collection by households 0.30 0.000 0Public piped supply to households 1.50 0.003 5000Total or weighted average3 9.57 0.018 172000
Source: Whittington et al. 1991, Figure 1.Notes: 1One imperial gallon 4.546 litres.2In 1987 the rate of exchange of the US$ to the naira was 1:4.3.3Tables of this branch type inherently embody double-counting. The total supply tohouseholds is 4.76 million g/d and total turnover from sales to households is 125,000 naira.

8/12/2019 1843391775
http://slidepdf.com/reader/full/1843391775 119/230
allows this to be estimated at about 12% in the dry season, 5% in the rainy season with an annual average of about 8% (Whittington et al. 1991). What is also clear isthat the poor pay a far higher proportion of their income on water: 18% in the dryseason and 8% in the rainy season. In this case the income elasticity of demand for
water services is positive but less than one. ‘In the past, it has been commonlyassumed that households could only afford to pay 3–5% of their income for improved water services …’ (ibid. 189). But, the data from Ukunda and Onitsha, as well as stud-ies by Linn (1983) in Ethiopia, by Fass (1988) in Haiti, and by Cairncross and Kinnearin Sudan (1991, 1992) refute this assumption completely.
For Nsukka district and Kumasi the treatment of the outlay/income ratio is muchslimmer. In the former case, annual water purchases from vendors are probably between6% and 10% of household income, but the estimate is judged to be ‘highly specula-tive’ (Whittington et al. 1990, 1903). In the latter case, average household expend-iture on water and sanitation combined is about 3% of average household income butabout 10% of households spend more than 8%.
Abraham Maslow’s lexicographic approach to a fi ve-level hierarchy in human
need satisfaction receives confirmation here: life-or-death need for the service, highservice cost and low household income combine to give a staggering proportion of income devoted to water and waste water services (Maslow 1954).
This conveniently brings us to the fourth strength of these authors’ research: aninnovative application of the access/distribution chart (see above) specifically to sani-tation (Whittington et al. 1993). Kumasi’s 600,000 persons are estimated to fall intofi ve groups: those using public latrines (38%), those using bucket latrines (25%),those with access to a WC emptying into a septic tank (25%), those using traditionalpit latrines (7%) and those who urinate and defecate on open ground (5%).
The monthly total of this feculent mass is some 25,000m3, which goes to openstreet drains, streams, neighbourhood dumps and landfill. Unit costs are estimated
for the use of alternative sanitary facilities as well as the flow of funds to sanitationactors, including rent payments to the local Committees for the Defence of theRevolution.
The authors conclude (ibid. 745):
Our survey of sanitation conditions in Kumasi revealed an appalling and, froma public health perspective, dangerous situation. Households are currently gen-erating about 25,000m3 of human waste per month (including flush water forWCs), but only about 10% of it is removed from the city. The rest, 90%, is leftin the urban environment until it decomposes, is carried away by small streamsor drainage ditches, or dries and becomes airborne.
13.3 THE USES OF WATER
Above I have reviewed the principal strengths of the water demand school in thesestudies published in 1989–93. What follows is a critique of some aspects of theirmethodology, beginning with the treatment of water consumption.
In terms of economic theory the demand for a product (or service) can be definedas the relationship, at a given time and within a defined market, between price perunit of the product and the quantity in each time period that consumers are estimated

8/12/2019 1843391775
http://slidepdf.com/reader/full/1843391775 120/230

8/12/2019 1843391775
http://slidepdf.com/reader/full/1843391775 121/230
or their survey respondents in particular, use water. Simply put, to understand thedemand for water requires, as a necessary condition, that the researcher knows how itis used. Whittington and his colleagues fail to meet this condition.
13.4 OBJECTS OR SUBJECTS?
The water demand school is open to a second methodological attack, related to butseparate from their neglect of water consumption. I shall call this their naturalisticbias. Given their policy interests, Whittington et al. need to understand why it is thathouseholds make specific decisions on the sources from which they choose to gainaccess to water, the volumes they purchase, and (as above) how water is used. A use-ful technique in such explanation would be an attribute matrix of the type set out inTable 13.3, but such a matrix is never employed. Their approach is to collect a largedataset that covers, for each household, social variables (such as the number of adults
and children in the household), economic variables (such as the household’s totalmonthly cash income) and water practice variables (such as the volume of wateraccessed from each alternative source). These classificatory and quantitative data-sets are then used as inputs to econometric modelling. Table 13.4 provides a possibletemplate for such information requirements, including coverage of the uses of water.
An alternative approach, that would itself have provided the basis for designing anattribute matrix and designing an econometric model, would have been set within theframework of academics such as Veblen (1919) and Simon (1959, 1992). Peter Earl(1995) provides an excellent review of this paradigm. This approach would regard water access and use decisions by households as a process of problem-solving during which their views of the world and their wants may undergo considerable evolution,
yet where at the date of any cross-section survey domestic behaviour takes the formof routinised, habitual action (Hodgson 1994). The door to the household’s mind-setand actions in this regard would have been through semi-structured interviews withits members in which Africans speak for themselves, they voice the constraints theymay face, they articulate their own accounts of what their routines are and why theysatisfy a family’s needs (and change with the seasons) rather than alternative habitualactions. Household members, in this case, are regarded as active, intelligent,resourceful, purposive, reflexive subjects, not merely as objects exhibiting quantifi-able behavioural patterns.
A quotation from Earl’s critique of orthodox economics applies with full force tothe water demand school (1995: 61): ‘Neoclassical economists working on consumerbehaviour have preferred to steer well clear of this approach … Instead, they havetended to confine themselves to studies of choice in relation to characteristics that areeasy to measure in supposedly objective terms.’
Anthony Giddens in The Constitution of Society (1984) captures the method of authors like Whittington to submit it to a higher level of ontological critique. He sug-gests that social scientists who use frameworks that treat human subjects as objectsare committing a naturalistic error. They turn their back on ‘the active, reflexive char-acter of human conduct’. Giddens also rejects orthodox social theory’s vision of ‘human behaviour as the result of forces that actors neither control nor comprehend’.He defines the naturalistic standpoint as that which looks to the natural sciences,including biology, as a model for social science.

8/12/2019 1843391775
http://slidepdf.com/reader/full/1843391775 122/230
T a b l e 1 3 . 3
A n a t t r i b u t e m a t r i x f o r h o u s e h o l d w a t e r s e r v i c e s .
A t t r i b u t e
S o u r c e
P r i c e p e r
P a y m e n t
C
o l l e c t i o n
O d o u r
T u r b i d i t y
O t h e r
P r e s s u r e
S e r v i c e
S e r v i c e
l i t r e
a r r a n g e m e n t s 1 a
n d q u e u i n g
q u a l i t i e s
t i m e s
r e l i a b i l i t y
t
i m e p e r t r i p
H o u s e h o l d c o l l e c t s r a i n w a t e r
H o u s e h o l d c o l l e c t s f r o m
h o u s e w e l l
H o u s e h o l d c o l l e c t s f r o m
o t h e r w e l l
H o u s e h o l d c o l l e c t s f r o m
s t a n d p i p e o r p u m p
P u r c h a s e f r o m d o o r s t e p
v e n d o r
P u r c h a s e f r o m d o o r s t e p
t a n k e r
P u r c h a s e f r o m s h o p o r k i o s k
P i p e d s u p p l y t o h o u s e
1 S u c h a s a fi x e d m o n t h l y c h a r g e
o r v o l u m e t r i c p r i c e c o l l e c t e d a t t h e t i m e o f s a l e .

8/12/2019 1843391775
http://slidepdf.com/reader/full/1843391775 123/230
Table 13.4 Water and waste water services for households: informationrequirements.
The Survey AreaMap including residential locations and water sourcing points (wells, kiosks, etc.)
Number of resident personsNumber of resident householdsBrief review of the survey area’s economic base, its social character and its transport
links to external areas of employment Annual rainfallSeasonal rainfall Note: in cases of strong seasonal differences, data will be required separately for each
season
Household and Water Use InformationDate/time/place of interviewPosition in family of person(s) interviewedHousehold size
Gender and age composition of householdGender and age of persons collecting waterEducation level of the household headOccupation of all adults in householdTotal household income per week (alternatively: total weekly expenditure)Total weekly expenditure on water services Address/location within the survey areaOwnership of water-using fi xtures: bath, shower, WC, sink, dish-washer, washing
machine, garden-watering itemsVolume of abstracted water used in litres per head per day (lhd)Composition of use (%): cooking and drinking; bathing, showers and personal washing; washing of clothes, house, vehicles, etc.; sanitation; garden; other
Types of use that are specific to types of source (if any)Information on water reuse: waste water source to type of second use; no. of cycles, volume of reuse as multiple of initial use
Water storage: type of storage by volume
Attribute Matrix for Water ServicesSee Table 13.3
Waste WaterType of service: water closet with piped connection to sewer; own latrine; communal
latrine; septic tank; open areasType of treatment at point of serviceMeans of removal of urine and faeces: flushing to sewer or septic tank; collection
from latrine; direct to lake or river; other
Charges for: service, collection, treatment and disposalTotal weekly expenditure on waste water services
Other InformationOwners/managers of water sources and waste water services Action taken by owners/managers in event of non-paymentWater and waste water tariffs and billing arrangements established by source
owners/managersType of dwelling, including storey height in case of flatsNumber of roomsTotal weekly expenditure on power (gas, electricity, other fuels).

8/12/2019 1843391775
http://slidepdf.com/reader/full/1843391775 124/230
13.5 THE DISCRETE CHOICE MODEL
We have already seen that in Ukunda and Onitsha a considerable volume of quanti-tative data had been collected from households and market institutions. Modelling
household behaviour could have been carried out by designing the equations in thelight of social theoretical, semi-structured household interviews – a subject-orientedapproach. Whittington and his collaborators’ neglect of the reflexive character of household members did not permit a design of the model in this way. In practice theyrejected multiple regression equations and opted for a conditional multinomial logitmodel where the dependent variable is the probability that any specific water sourceof several available is chosen by the household. This probability is expressed as afunction of the price of water from each source, its collection time, its taste, house-hold income, education of the household head and the number of women in thehousehold. The model was used in the Ukunda study where water’s price and collec-tion time were both highly significant (Mu et al. 1990).
On first sight, the approach seems useful. But on careful consideration it appearsto rely on the assumption that households choose only one of the alternatives avail-able. This does not square with the fact of use of multiple sources by each household,amply illustrated in the Nsukka district. Nor does it address the volume of watertaken from one or other source, the traditional dependent variable in modellinghousehold water demand. Nor (as we saw above) is it based on an understanding of water use, the dog that does not bark in Whittington’s world.
The rationale for the orientation to a discrete choice model is clearly policy-based:
“… in an African village the first element in a water demand model must be adescription of the likelihood, under different conditions, that a consumer would choose to use an improved source rather than continue to use the exist-
ing traditional source(s)” (ibid. 521).The decision to use the discrete choice model, containing as it does no quantity-
price relation, also has the regrettable outcome that Mu et al. cannot pursue main-stream interests such as the nature of the demand function for water (linear,exponential, constant elasticity, or cubic?) and the values of the demand elasticities.
The principal challenge offered by multi-sourced water, where cash price per litrecan be traded off against collection time per litre, is how to incorporate subjectiveperspectives into a modelling framework that seeks to explain price and volume dataand recognises explicitly:
• the multi-source environment;
•the simultaneous use by households of more than one source;
• water quality differences;
• the proportion of household members who are adult women;
• the female labour force participation rate in the survey area;
• the average hourly income for women from wage-labour or self-employment inthe local market economy.
There is a further dif ficulty with the water demand school’s approach and this canbe illustrated by a quotation from their first publication (Whittington et al. 1989: 165):
information on the water vending system can serve as a useful indicator ofa community’s ability and willingness to pay for a piped distribution system.

8/12/2019 1843391775
http://slidepdf.com/reader/full/1843391775 125/230
The fact that yard taps do not already exist throughout Ukunda indicates aninability on the part of the community or water authority to mobilize resources,not an inability or unwillingness of the population to pay for the cost of theimproved service.
But such a conclusion is hazardous. Whittington and his collaborators here fail torecognise the force of two key economic characteristics of the system they describe:
• The tariff for water in every case is volumetric, whether the cost is in collectiontime or in Kenyan shillings.
• The penalty for unwillingness or inability to meet these costs is an immediate cut-off in supply.
Only in the most unlikely case that a piped system is metered and where billingsanctions are draconian could a smooth transition from the existing multi-source sys-tem to a piped network be guaranteed. In the absence of these necessary conditions,one would expect a simultaneous fall in turnover, and a surge in volume consumed –
if service levels are capable of meeting the demand. It is only in their 1990 publicationon Nsukka district that the critical importance of volumetric pricing is recognized,following trenchant criticism of the performance of the Anambra State Water Cor-poration’s cost recovery practice.
13.6 CONCLUSIONS
This paper provides a critical review of the early publications of what I call the waterdemand school with respect to their behavioural studies of the domestic demand for water and waste water services in Ukunda (Kenya), Onitsha and Nsukka district
(Nigeria) and Kumasi (Ghana). The school’s work has resulted in a permanent trans-formation of the way the water resource professions approach the domestic sector inthe developing countries and has had a major impact on policy formation in institu-tions such as the World Bank.
The strengths of the work of Whittington et al. and their collaborators are four-fold. They demonstrate how socially complex are the access/distribution networks inthe villages and towns of Africa. They give a rich account of volumetric flows, unitprices and turnover along each branch of the network and indicate the dynamism andcompetitiveness of local water markets. They provide data on the ratio of water ser- vice outlays to household income which knock out expectations that these ratios shouldnot exceed an affordability quotient of 5%. They extend their source/distribution net- work analysis with great success to waste water disposal with respect to volume, unitprice and turnover.
The weaknesses of the water demand school are also four-fold. First, to under-stand the domestic demand for water we need to know how it is used in the house-hold; but these seven studies give little account of how their survey respondentsconsume the water they access at such great cost relative to their incomes. Secondly,the authors take a naturalistic standpoint in which the research into these commu-nities’ behaviour is limited to the actions of silent men, women and children, movingacross a landscape like so many ants in a natural-historical study of a savannahcolony. Household members are not treated as intelligent, resourceful, purposive andreflexive citizens. Thirdly, the conditional multinomial logit cabbala chosen for the

8/12/2019 1843391775
http://slidepdf.com/reader/full/1843391775 126/230
econometric work is hardly transparent, side-steps traditional and justifiable interestin demand functions and their elasticities, and abstracts completely from the uses of water. Fourthly, in their policy work in Ukunda, Onitsha and Kumasi, the waterdemand school seems to forget that amongst the fundamental attributes of the sys-
tems they describe are: costs to the user which are volumetrically determined, andimmediate closure of access to water in the case of a household which is unwilling orcannot meet those supply costs.
The principal conclusions of this paper are that behavioural studies into thedomestic demand for water and waste water services in the low-income countriesshould be set within the complex access/distribution networks of a quantitative, whittingtonian type and the price information that these embody; this researchshould be based on semi-structured interviews, usually with adult females, seekingfrom these reflexive subjects their account of the origins and character of their service-access routines; the investigation should incorporate the scale and composition of useand reuse and their relation to the quality of water; and the econometric work shouldact as a servant to this methodological approach.
The material in this chapter originally appeared in: Behavioural studies of the domestic demandfor water services in Africa. Water Policy, 4(1): 69–81, 2002.

8/12/2019 1843391775
http://slidepdf.com/reader/full/1843391775 127/230
14
Deconstructing households’ willingness-to-pay for water in
low-income countries
14.1 INTRODUCTION
During the early 1980s growing disquiet began to be expressed over the outcomesof publicly-funded water and sanitation programmes for households living in low-income countries. Many systems had fallen into disrepair and had been abandoned;others were used by only a small part of the original target population; the proportionof costs recovered was low; and expansion to meet the needs of growing populations was too slow (MacRae & Whittington 1988: 247).
As time passed, a new paradigm was broached and then developed by what has beencalled the water demand school. It suggested that embodying the expressed preferencesof individual households is critical to successful project design. It rejected the view thathouseholds can afford to pay no more than 3–5% of their income on fresh and waste water services. The new approach highlighted the widespread existence of complex and vigorous water markets. A disciplinary shift took place away from sanitary engineering with its supply-side emphasis to the economic analysis of the demand for water. Finally,
the new paradigm suggested that domestic supply programmes could be sustained andreplicated only if they responded to the potential market for water services.
The mood of the time is well-illustrated in the following quotation (Whittington et al.1990a: 294):
If rural water projects are to be both sustainable and replicable, an improved plan-ning methodology is required that includes a procedure for eliciting information
116
C 2007 IWA Publishing. ThePrice of Water: Studies in Water ResourceEconomicsand Management
2nd Edition by Stephen Merrett. ISBN: 9781843391777. Published by IWA Publishing, London, UK.

8/12/2019 1843391775
http://slidepdf.com/reader/full/1843391775 128/230
on the value placed on different levels of service, and tariffs must be designed sothat at least operation and maintenance costs (and preferably capital costs) can berecovered. A key concept in such an improved planning methodology is that of ‘ willingness to pay’. If people are willing to pay for the full costs of a particular ser-
vice, then it is a clear indication that the service is valued (and therefore will mostlikely be used and maintained) and that it will be possible to generate the fundsrequired to sustain and even replicate the project.
The purpose of the present paper is to critically review the willingness-to-pay concept’suse in the 11 studies listed in Table 14.1 and thereafter to set out the research and pol-icy implications of this critique. As the table shows, the case studies were carried out inthe Caribbean, Africa and Asia over the 9-year period from 1986 through 1994 and pub-lished in various academic journals in 1988 through 1998. What they have in common,in addition to addressing households’ willingness-to-pay for water services in the lowincome countries, is that Dale Whittington of the University of North Carolina is one of the joint authors in every case. Without a shadow of doubt Whittington is the doyen of
this branch of scholarship and so these eleven studies provide a comprehensive accountof the new paradigm, making them an appropriate subject for critical review.
14.2 SURVEY METHODS
Before initiating the main argument, it is useful here to sketch the lineaments of the willingness-to-pay surveys carried out in Laurent, Onitsha, the Punjab, Nsukka,Kumasi, Davao, Calamba and Lugazi (see Table 14.1). The pre-requisites of a surveyare a budget, the professional staff to plan and carry out the work, identification of the study area, the recruitment and training of local staff as enumerators, and secur-
ing whatever institutional support is necessary for the research to go forward. Withthe team in place, the interview questionnaire is designed and pre-tested, usually
Table 14.1 Eleven studies of the willingness-to-pay for domestic water.
Authors Case study Year of Year of location field work publication
MacRae, Whittington Laurent, Haiti 1986 1988Whittington, Briscoe, Mu, Barron Laurent, Haiti 1986 1990Whittington, Lauria, Mu Onitsha, Nigeria 1987 1991 Altaf, Whittington, Jamal, Smith Punjab, Pakistan 1988 1993
Whittington, Okorafor, Okore, Nsukka, Nigeria 1989 1990McPhailWhittington, Smith, Okorafor, Nsukka, Nigeria 1989 1992
Okore, Liu, McPhailWhittington, Lauria, Wright, Choe, Kumasi, Ghana 1989 1993
Hughes, SwarnaChoe, Whittington, Lauria Davao, Philippines 1992 1996Whittington, Choe, Lauria Calamba, Philippines 1992 1997Davis, Whittington Lugazi, Uganda 1994 1998Whittington, Davis, McClelland Lugazi, Uganda 1994 1998
Source: see bibliography.

8/12/2019 1843391775
http://slidepdf.com/reader/full/1843391775 129/230
drawing on discussions with local families or community leaders. The sampling tech-nique is explored and selected; this is always ad hoc because the statistical universe of households is never known. Inevitably, the sample does not conform to the rigorousdemands of statistical theory. However, the view is rightly taken that it is better to
have surveyed imperfectly than never to have surveyed at all.The individual interview may be a once-for-all event; or an initial interview can befollowed a day or two later by the collection of answers to specific questions where thehousehold is given time to think more carefully about their response; or the interview isfollowed up later to give respondents the chance to revise their first reply to key ques-tions. Close supervision of the enumerators is advisable. In Lugazi the survey was fol-lowed by a community meeting to discuss the issues raised in the questionnaire (Davis &Whittington 1998). Fieldwork duration varied widely: from as little as two weeks inOnitsha and Lugazi to fi ve months in Kumasi. The number of households interviewedranged from 170 in Laurent to 1200 in Kumasi. The population size of the survey areas was as little as 1500 persons in Laurent, up to 700,000 in Onitsha where the‘rapid recon-naissance’ survey period was 10 days (Whittington et al. 1991: 180–2). In a World Bank
review of techniques for systematic client consultation, based on a background paper byWhittington and Davis, 2–4 weeks’ fieldwork is recommended (Owen 1994: 16).
The survey questionnaires differed between case studies, of course, but their con-tent can be considered to fall into six categories. First is the date of the interview andthe address of the household or its location in the study area. Secondly, we have theage, gender and household status of the respondent. Thirdly, household information would be collected such as the number of persons and their age/gender, their health,education and occupation, and household income, expenditure and assets. Fourthly,data are collected on the quality of the dwelling, whether it is owned or rented, and itscosts. Fifthly comes the sources of the water used in the dwelling, its quality (but notits quantity), conflicts over access, seasonality of supply and demand, the price or
charge payable for each separate fresh or waste water source used, household expend-iture on water per time period, water storage facilities in the dwelling, current sanita-tion facilities, the uses to which fresh water is applied, and the degree of satisfaction with the existing service. Sixthly, a ‘bidding game’ (or a referendum technique) wouldbe used to establish the household’s willingness-to-pay for alternative water or sanita-tion projects and this would require some kind of description of the new scenario.
14.3 SIGN AND BEHAVIOUR
The deconstruction of the ‘ willingness-to-pay’ can now get under way. The principalpropositions to establish immediately concern critical ontological features of the work reviewed, that is, the 11 studies of Table 14.1. The (im)precise meaning of the willingness-to-pay will be addressed in Section 14.4. But whatever sense is agreedupon, it should be clear that the willingness-to-pay captured by Whittington and hiscolleagues in their fieldwork is a sign, or rather, a collection of signs. These are: theoral reply or replies given by the respondent during the bidding game; the writtenrecord of these replies noted down by the enumerator on his answer sheet; the digitalinformation stored on the professional’s laptop which becomes manifest on his screen,after transcription from the answer sheet; and the printed information produced inthe team’s reports and any subsequent publications.

8/12/2019 1843391775
http://slidepdf.com/reader/full/1843391775 130/230
At a quite separate ontological level we have the behaviour of the household inaccessing water or in using sanitation facilities at some later date in those cases wherethe project scenario set out in the original interview is implemented. Our specificinterest is in the actual payments made by households for those realised projects’
fresh and waste water services.So we have sign and behaviour. I believe that the most interesting and importantrelationship in this policy field is the degree of consonance which exists between the willingness-to-pay and market behaviour in those cases where scenario projects are infact implemented. The remainder of this paper explores the conditions which must bemet for such sign-behaviour consonance to exist.
14.4 DEMAND THEORY AND SURVEY PRACTICE
The first condition for consonance between sign and behaviour, word matched by
deed, is that the willingness-to-pay for a projected fresh or waste water service is botha meaningful concept from a social science perspective and that the survey respondentunderstands that meaning. In economic analysis, whether of the institutional school(within which this paper is located) or the neo-classical school, the demand for a water service can be defined as the relationship, at a given time and within a definedmarket, between price per unit of the service and the quantity in each time periodthat consumers would purchase at each price. Demand is, of course, conventionallyrepresented graphically with price on the vertical axis and quantity on the horizontalaxis, showing the difference in quantity purchased at each price. Almost invariablyhigher prices are associated with lower quantities and so the demand function slopesdownwards from left to right; it can be represented as a linear, log-linear, exponentialor cubic function. The cultural and economic context of demand can be analysed
under three rubrics. The first of these is the tastes and habits of consumers, that is,the nature of need for the service or product. The second is the price, quality andavailability of services and commodities that consumers consider to be substitutes.These two together should account for the consumers’ willingness-to-purchase. Thethird rubric is the incomes, assets and access to credit of consumers, which accountfor the ability-to-purchase (Robinson & Eatwell 1974: 149, Merrett 1997: 53–8).
There are a number of serious problems in the application of demand theory tothe survey practice of Whittington and his colleagues. These are: the use of a max-
imum willingness-to-pay price (wtpmax ), the lack of clarity in the way affordability isdealt with, the treatment of substitutes, and the relevance of sanctions in the case of non-payment of water service bills. I shall deal with each of these in turn.
In all of the studies listed in Table 14.1, it quickly becomes clear that the object of the bidding game section of the questionnaire is not to elicit an answer to a questionof the sort:
‘In the case of project X going ahead, would you be willing to pay price Y per drumfor the water supplied?’
In fact, what the bidding game elicits is an answer to a question such as:
‘In the case of project X going ahead, what is the maximum price you would be willing to pay per drum for the water supplied?’
So the entire approach seeks data on wtpmax .

8/12/2019 1843391775
http://slidepdf.com/reader/full/1843391775 131/230
There is a puzzle here which, to solve, requires us to distinguish between two funda-mental ways in which water service payments can be made. The first is by means of a unitprice, that is, a payment based on the quantity of water received, or (say) for each visit toa public latrine. The second is by means of a fi xed charge per unit time period for access
to a service, such as a yard tap connection to a public supply network. In the first case amaximum price simply has no meaning; the household adjusts downwards the quantitypurchased the higher the price. In the second case, however, there certainly will be amaximum charge above which the user declines the use of the service. This crucialdistinction is not discussed by Whittington and his colleagues with reference to wtpmax ;moreover, Whittington neglects the distinction in his behavioural studies of householddemand in African settlements (Merrett 2001). It would also be theoretically meaning-ful to ask what would be the maximum unit price a household would pay per month for a speci fi c volume of water received. But the water demand school never does this.
As a consequence, wtpmax is not a meaningful concept from a social science per-spective if it is applied to water demand analysis of projects where payment is basedon unit prices. Even in the case of projects based on a fi xed charge, where wtpmax is
meaningful, the questionnaire design must elicit answers in terms of a fi xed charge,not a unit price. Moreover, if the baseline payment mode is of a unit price type, andthe scenario payment is a fi xed charge, the capacity of the respondent to respond tothe wtpmax questions in the bidding game will be diminished because of the unfamili-arity of that payment mode for water services (see also Owen 1994: 16).
It is unsurprising then that the World Bank Water Demand Research team states(1993: 49):
… it was hard to convey the notion of what was meant by the maximum an individ-ual would be willing to pay. A respondent in Haiti asked an enumerator, ‘What do you mean the maximum I would be willing to pay? You mean when someone has agun to my head?’.
Elsewhere Whittington himself has made the same point (1998: 22).It is worth noting with respect to both the baseline and the scenario situations, that the
willingness-to-pay literature shows that a key advantage of unit price payments is that theyalone give the household a degree of control over its water service expenditure during thecourse of the year, by means of varying their daily consumption. Such control can be valu-able to families whose incomes are low and variable (Whittington et al . 1990b: 1907). It isa curious feature of the water demand school’s work that, whilst it has a fascination for theprice of water, it says virtually nothing about the quantity purchased by individual house-holds nor how it is used (Whittington & Swarna 1994: 32, 60, Merrett 2001).
14.5 THE AFFORDABILITY QUESTION
The previous section pointed to the conventional distinction between the willingness-to-pay for a commodity and the ability-to-pay for it. Of course, this is familiar to the waterdemand school (Whittington 1998: Table 1). However, the distinction is only once madeexplicit to the households interviewed in the surveys listed in Table 14.1. In practice, theconcept of the willingness-to-pay is used by the water demand researchers to mean both
willingness- and ability-to-pay; the separate concepts are rolled up in one.Unfortunately this opens the real possibility that some respondents will under-
stand willingness-to-pay as inclusive of affordability, and others to take it as exclusive.

8/12/2019 1843391775
http://slidepdf.com/reader/full/1843391775 132/230
So their responses become ambiguous, we do not know quite what they mean. In a 1994report to the Asian Development Bank, Whittington and Swarna admitted as muchin their discussion of field methods that use a question of the type: ‘What is the max-imum amount of money you would be willing to pay (for a specified good or service)?’
They write (Whittington & Swarna 1994: 50):If respondents could always provide accurate, reliable answers to such a question,this clearly would be the preferred question format. Unfortunately, for a variety of reasons, this often seems not to be the case. It is often dif ficult to convey the notionof the ‘most’ (or the maximum) that one would be (freely) willing to pay, that is,able to pay if willing to do so. Some respondents misinterpret direct, open-endedquestions to mean ‘What is the most you would like to pay?’ or ‘What is the most you think you should pay’. Both of these nuances are clearly not what is meant to beconveyed.
With clarification like this, who needs confusion?In the field, the research method seems to have been as follows:
• Laurent: an explicit reference to affordability in the bidding game’s last question.
• Onitsha, Punjab, Nsukka: no reference to affordability.
• Kumasi, Davao, Calamba, Lugazi: no explicit reference to affordability, butstrongly implicit.
14.6 THE TREATMENT OF SUBSTITUTES
In Section 14.4 it was suggested that the first condition for consonance between signand behaviour requires that the respondent understands the meaning of the wtpmax
question. It was also pointed out that in demand theory the willingness-to-pay fora service or product is shaped by the price, quality and availability of services andcommodities that consumers consider to be substitutes.
In fact, in the low income countries there is often a rich variety of means of accessto water services for households. This is illustrated in Table 14.2 for the case of
Table 14.2 Water and money flows in Onitsha – 1987 dry season.
Access branch Water volume Unit price Turnover(million gallons (naira/gallon) (naira)per day) (1) (2)
Household collection from private 0.30 0.027 8000boreholesTruck sales to households 1.00 0.020 20000Shop sales to households 1.55 0.050 78000Doorstep vendor sales to households 0.11 0.127 14000Shallow well collection by households 0.30 0.000 0Public piped supply to households 1.50 0.003 5000Total or weighted average 4.76 0.026 125000
Source: Whittington et al. 1991, Figure 1.Notes: 1. One imperial gallon 4.546 litres.
2. In 1987 the rate of exchange of the US$ to the naira was 1:4.3.

8/12/2019 1843391775
http://slidepdf.com/reader/full/1843391775 133/230
T a b l e 1 4 . 3
A n a t t r i b u t e m a t r i x f o r h o u s e h o l d w a t e r s e r v i c
e s .
S o u r c e
P r i c e
P a y m e n t 1
C o l l e c t i o n
O d o u r
T u r b i d i t y
O t h e r
P r e s s u r e
S e r v i c e S e r v i c e
p e r l i t r e
a r r a n g e m e n t s a n d
q u e u i n g
q u a l i t i e s
t i m e s
r e
l i a b i l i t y
t i m e
p e r t r i p
H o u s e h o l d c o l l e c t s
r a i n w a t e r
H o u s e h o l d c o l l e c t s f r o m
h o u s e w e l l
H o u s e h o l d c o l l e c t s f r o m
o t h e r w e l l
H o u s e h o l d c o l l e c t s f r o m
s t a n d p i p e o r p u m p
P u r c h a s e f r o m d o o r s t e p
v e n d o r
P u r c h a s e f r o m d o o r s t e p
t a n k e r
P u r c h a s e f r o m s h o p o r
k i o s k
P i p e d s u p p l y t o h o u s e
1 S u c h a s a fi x e d m o n t h l y c h a r g e o r v o l u m e t r i c p r i c e c o l l e c t e d a t t h
e t i m e o f s a l e .

8/12/2019 1843391775
http://slidepdf.com/reader/full/1843391775 134/230
Onitsha. There are six means of access for the city’s households. Volume used variesfrom as little as 0.11 millions of gallons per day (0.5 millions of litres per day) indoorstep vendor sales to 1.55 million (7.05 million litres) in shop sales. The priceshouseholds are willing and able to pay vary from as little as zero naira/gallon (n/g) for
shallow well collection by households, through 0.003n/g (0.0007n/l) for the publicpiped supply up to 0.127n/g (0.028n/l) for doorstep vendor sales, a variation of 1:42in terms of the positive price range.
This creates some dif ficulty for the wtpmax question. The project to which the ques-tion refers can certainly be clearly described using attributes of the type set out inTable 14.3. But the research team is never certain that the project will be delivered
with the attributes the team describes to the household; and the team is never able toprovide an attributes matrix for the substitutes for that project’s service.
As a result the respondent household cannot know at the time of the interview thenature of the real choice that will become available to it. It cannot therefore make thekind of commitment necessary for consonance between word and deed. So the ‘truepreferences’ that the water demand school explicitly seeks in response to the wtpmax
question do not exist (Davis & Whittington 1998: 7, Whittington & Choe 1992: 57,Whittington et al. 1992: 212, 1993: 1544).
14.7 SIGN AND SANCTION
There is a special case concerning the meaning of the commitment by a household topay the wtpmax . A household may wish to enjoy a service, be able to afford it and be willing to pay for it, yet when push comes to shove, the household does not pay for it.This occurs in many, many countries and in my own field experience is widespread in,for example, Armenia, Bangladesh and Peru. The phenomenon is found where there
is no sanction for non-payment of the water bill. It invariably takes place only wherethe service is provided by a public sector institution; private companies that cannotcollect on their invoices go out of business.
The optimum conditions for this species of non-consonance to breed and multiplyexist: where economic life is hard so that households need to take the greatest careover their domestic expenditure; where there is a widely-held view that certain publicservices should be free; where persons or parties in political life give their support tonon-payment; where the quality of the public service is poor; where the government isso manifestly corrupt that payments for public services are known to line the pocketsof the power elite; and where neither the government nor the public water utility is willing to exercise sanctions against non-payment because of the likely politicaland/or public health consequences.
Two examples are worth citing from the work of the water demand school. Inthe Nsukka district of Nigeria, the Anambra State Water Corporation had financedborehole drilling but was unable to recover even the operations and maintenancecosts of borehole pumping (Whittington et al. 1990b: 1905). In the Punjab non-payment of the flat monthly charge was estimated at 40% but ‘Households that donot pay are seldom disconnected from the system’ (Altaf et al . 1993: 1905).
In Yerevan, the capital of Armenia with a population greater than one million per-sons, survey research that I reviewed in 1999 indicates that about 85% of householdsdo not pay their monthly bill to the public sector Yerevan Water and Sewerage Enter-prise. Box 14.1 gives a real-life account of the situation of one family I interviewed.

8/12/2019 1843391775
http://slidepdf.com/reader/full/1843391775 135/230

8/12/2019 1843391775
http://slidepdf.com/reader/full/1843391775 136/230
He is likely to refuse the interview, or give an unreasonably low bid price. Cynicismmay be specifically directed at government institutions and their performance ratherthan a sweeping condemnation of all humanity.
The presence of the cynic has been identified by Whittington and his colleagues.
For example, the 1986 study of Laurent had a 14% non-response to interview ques-tions on the wtpmax for standposts and 25% non-response for private connections(Whittington et al. 1990a: 302). Many of these were probably cynics. In the 1989Nsukka district study one half of the sample was re-interviewed one day after theirfirst interview in order to see whether they wished to revise their bid. Almost one-fifthdid do so, mostly downwards, and these downward revisions lay in the range of a53–80% cut in the wtpmax . The research team took the view that this was due to a lackof trust by respondents in the government water utility to deliver and maintain theproject. Indeed, there was an abandoned elevated storage tank and a capped boreholein one of the villages where interviews took place, bearing witness to public sectorincompetence (Whittington et al. 1990b: 1906–7, 1992: 219–20). In the 1992 work inCalamba, the researchers suggested that the perceived ineffectiveness of government
programmes in the Philippines led respondents to give a higher wtpmax for projects with a lower scope (Whittington et al. 1997: 232).
The strategist takes the view that her or his wtpmax response carries a commitment tothe project and is likely to influence its outcome. She determines that her responseshould be one most favouring the interests of her family and (perhaps) the local com-munity. Most commonly there is a bias to low prices in these cases, where the aim is tohold down the tariff the water utility will eventually set. However, respondents may also veer to high prices if they believe this is the best way to ensure the project goes ahead.
My reading of the Laurent case study is that downward strategic bias was present:the survey offered a standposts project with no risks for individual households, and they were happy to respond positively to this but offered a low wtpmax to keep down
the tariff. Similarly in Onitsha, where the scenario was based on volumetric pricing,the wtpmax was about 0.2 n/g for the rainy season, less than one-sixth of the pricecharged by distributing vendors (Whittington et al. 1991: 196). In Nsukka, the time-to-think opportunities brought lower bids; there, strategic behaviour was recognisedby the research team as one possible explanation, the others being the search for a just price or the sobering effects of time to consider (Whittington et al. 1992: 220).
The diplomat is aware that behind the enumerator lies a group of highly-paid pro-fessionals who have flown in perhaps from North America or Europe and who havethe support of local bigwigs and the state government. These are people makingoffers it is unwise to refuse. So the diplomat gives answers which he (or she) believesto be those the enumerator wants and where any hint of what might be a favouredresponse is rapidly accepted by the interviewee.
The clearest examples of diplomat bias come from surveys in Indonesia(Whittington 1998: 8). Referendum techniques for determining wtpmax are especiallylikely to give evidence of diplomacy. When a referendum elicitation procedure isused, respondents themselves do not need to be asked a question about the maximumthey would be willing to pay for a proposed good or service. Instead, split-sampletechniques with variation between the samples in the referendum price quoted to theinterviewee can be utilised to randomly selected respondents (ibid. 22). The statisticaldistribution of ‘ yes’ answers over the price range can give ‘fat tails’, that is, animplausibly high number of persons who say that they are willing to pay the higherprices.

8/12/2019 1843391775
http://slidepdf.com/reader/full/1843391775 137/230

8/12/2019 1843391775
http://slidepdf.com/reader/full/1843391775 138/230

8/12/2019 1843391775
http://slidepdf.com/reader/full/1843391775 139/230
research generates questions eliciting a single, quantitative answer, when the subjectdemands a complex textual response. In order to successfully elicit a coherent set of signs from the sampled population, the researcher provides the interviewees withanchor prices.
It may be that it was recognition of the leading question character of anchor pricesthat led some willingness-to-pay studies to try the referendum approach referred toin Section 14.8. The severe drawbacks of the referendum method in low-incomecountries are exposure to diplomat bias, loss of confidence by respondents andenumerators in the procedure when posing extreme values in the interview, and con-fusion and even anger in tight-knit communities when different families are assigned widely-varying prices (Whittington 1998: 4–6).
Whittington & Swarna (1994: 8) have written:
… the project analyst does not actually have to know why an individual values aproject, or even which of the many consequences or effects of the water projectthat an individual cares about most. It is enough to have a measure of the strength
of the individual’s preferences for the project; it is assumed that the individualknows his (or her) own interests and is the best judge of what the project is worthto him (or her).
If this is true, why is it necessary to provide ‘him (or her)’ with an anchor price?
14.10 CONCLUSION
This review of eleven studies in the willingness-to-pay literature is now complete.Next I shall present my own positive views on the demand-side applications of eco-
nomics to the water resource challenges facing developing country NGOs and gov-ernments. In spite of the critical nature of this paper, the policy prescriptions set outbelow, for the design of fresh and waste water projects aimed at the household sector,do not mark a clean break with ‘the new paradigm’ described in Section 14.1. Rather,they are a contribution to the evolutionary development of that paradigm.
In the fi rst place, the design and development of water and sanitation projects in alocal area need to be based upon a good understanding of the existing local market forthese services. The water demand school, particularly Dale Whittington, have made agreat contribution here to our comprehension of these hydrosocial processes from thepoint of abstraction to the moment of water purchase by the household. This now needsto be complemented by an attempt to grasp how much water is used by the family,by whom and to what purpose (Merrett 2001). Without this baseline behaviouralgroundwork, projects in the scenario year are exposed to a greater risk of failure.
Secondly, our understanding of future household behaviour requires semi-structured interviews primarily with families’ female adults. It is women who play theprimary role in the collection and purchase of water, as well as its internal use incooking, washing and cleaning. For this reason alone, the professional team shouldinclude a female sociologist or socio-economist. In large surveys the bulk of the datacollection will be done by trained enumerators (ideally women). But the profession-als in the research team should play the central part in at least a sub-sample of theinterviews. This also calls for national professionals to form part of the research team.Surveys where enumeration is the sole responsibility of local secondary-school gradu-
8/12/2019 1843391775
http://slidepdf.com/reader/full/1843391775 140/230
ates, but where data analysis and report writing is the preserve only of internationalstaff, should be strictly avoided. Furthermore, respondents should be recognised notas objects sourcing numerical signs but as intelligent, purposive, reflexive subjects,rich in their textual accounts of their neighbourhood and their region. One should
also appreciate that respondents are made up of persons with a variety of privateagendas: cynics, strategists, diplomats and idealists.Thirdly, the scenario project option(s) can be developed prior to the survey or,
with the sampled population, by the research team itself. In either case the expressedpreferences of the targetted groups are vital, as the ‘new paradigm’ insists so elo-quently. The project option should be costed in terms of capital investment as well asongoing outlays. The use of wtpmax in the survey questionnaire and the employmentof anchor prices would cease, to be replaced by a question of the type:
We have explained our work and described the proposed project, including themeans that households would pay for it. To cover its full costs the project wouldrequire a price of x naira/gallon. Can you now tell us whether your family would be
willing to pay and able to afford x naira/gallon?Where appropriate, ‘a monthly fi xed charge of y naira per family’ would replace ‘a priceof x naira/gallon’. If the project would be financed and approved only on the basis of a full-cost tariff, the survey respondent would be informed of this. This approach would face the same dif ficulties as the current paradigm in characterizing scenariosubstitutes ( vide Section 14.6). The final report would stress that the project is likelyto succeed financially only if there are penalties for the non-payment of water bills.Points 1–3 suggest the professional team for this twilight zone would be composed of a statistician/data analyst, a female socio-economist and a public health engineer.
The material in this chapter originally appeared in: Deconstructing households ’ willingness-topay for water in low-income countries. Water Policy, 4(2): 157–172, 2002.

8/12/2019 1843391775
http://slidepdf.com/reader/full/1843391775 141/230
15
Industrial ef fluent policy:economic instruments and
environmental regulation
Falstaff: Sirrah, you giant, what says the doctor to my water?
Page: He said, sir, the water itself was a good healthy water; but, for the party
that owed it, he might have more diseases than he knew for.
William Shakespeare, Henry IV , Part Two, Ii
15.1 INTRODUCTION
The uses of outstream water in human society can be classified into three grand orders:by households for domestic purposes; by farmers for the irrigation of land; and by‘industry’ in the widest sense of the term. The industrial uses of water include heatingand cooling processes, steam production, washing and cleaning, factory-scale cook-ing, incorporation in the product itself as in beer manufacture, the drinking water of animals in factory farming, the life-medium of fish as in trout farming, hot water dis-infection, dyeing, transporting inputs, products and waste within industrial premises,and fire-fighting.
These industrial uses in manufacturing, livestock factories, hospitals, commerce,of fices, mining, petroleum refining, power generation, railway companies etc. inevitablygenerate industrial ef fluent, that is, aqueous waste. In the 250 years since the IndustrialRevolution, such waste has been disposed of predominantly by dumping it untreatedinto rivers, lakes, the sea and even underground. The environmental impact of the usein this way of the natural world as a sink has been to destroy animal and plant species,degrade habitats and spread illness and death within human populations.
130
C 2007 IWA Publishing. ThePrice of Water: Studies in Water ResourceEconomicsand Management
2nd Edition by Stephen Merrett. ISBN: 9781843391777. Published by IWA Publishing, London, UK.
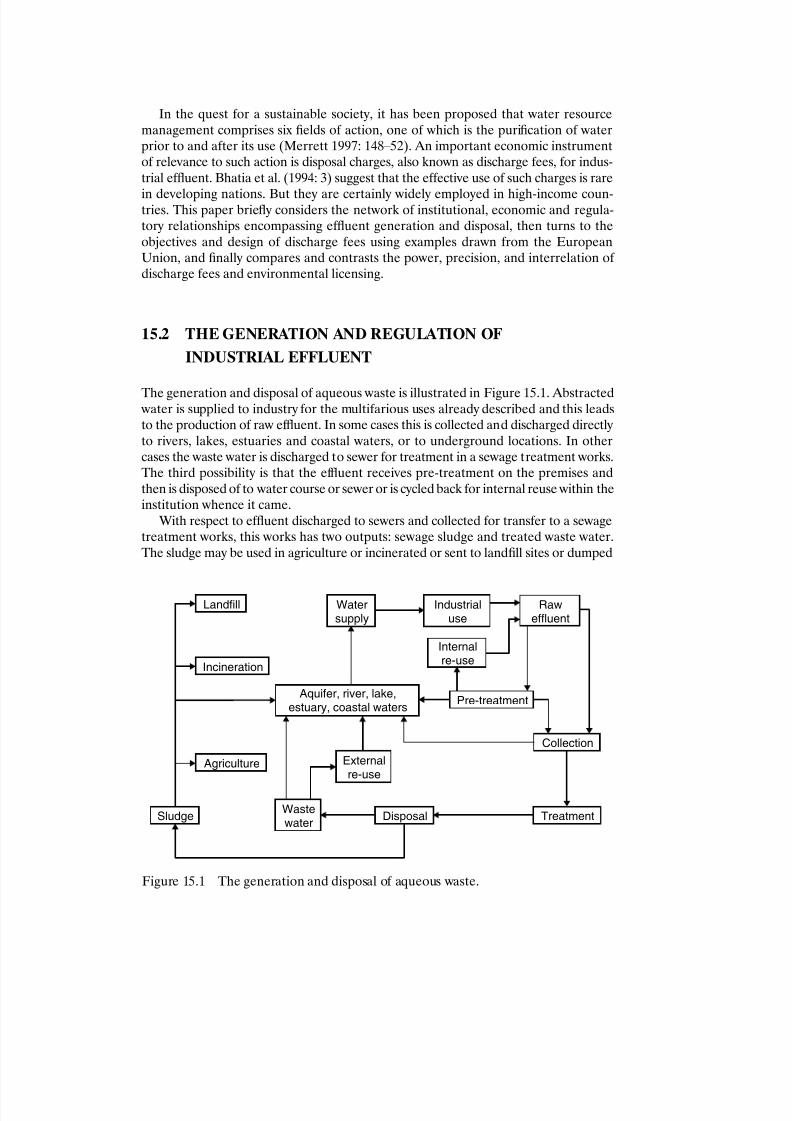
8/12/2019 1843391775
http://slidepdf.com/reader/full/1843391775 142/230
In the quest for a sustainable society, it has been proposed that water resourcemanagement comprises six fields of action, one of which is the purification of waterprior to and after its use (Merrett 1997: 148–52). An important economic instrumentof relevance to such action is disposal charges, also known as discharge fees, for indus-
trial ef fluent. Bhatia et al. (1994: 3) suggest that the effective use of such charges is rarein developing nations. But they are certainly widely employed in high-income coun-tries. This paper briefl y considers the network of institutional, economic and regula-tory relationships encompassing ef fluent generation and disposal, then turns to theobjectives and design of discharge fees using examples drawn from the EuropeanUnion, and finally compares and contrasts the power, precision, and interrelation of discharge fees and environmental licensing.
15.2 THE GENERATION AND REGULATION OF
INDUSTRIAL EFFLUENT
The generation and disposal of aqueous waste is illustrated in Figure 15.1. Abstracted water is supplied to industry for the multifarious uses already described and this leadsto the production of raw ef fluent. In some cases this is collected and discharged directlyto rivers, lakes, estuaries and coastal waters, or to underground locations. In othercases the waste water is discharged to sewer for treatment in a sewage treatment works.The third possibility is that the ef fluent receives pre-treatment on the premises andthen is disposed of to water course or sewer or is cycled back for internal reuse within theinstitution whence it came.
With respect to ef fluent discharged to sewers and collected for transfer to a sewagetreatment works, this works has two outputs: sewage sludge and treated waste water.
The sludge may be used in agriculture or incinerated or sent to landfill sites or dumped
Aquifer, river, lake,estuary, coastal waters
Watersupply
Industrialuse
Raweffluent
Pre-treatment
Internalre-use
Collection
TreatmentDisposal
Externalre-use
Wastewater
Sludge
Agriculture
Incineration
Landfill
Figure 15.1 The generation and disposal of aqueous waste.

8/12/2019 1843391775
http://slidepdf.com/reader/full/1843391775 143/230
into water courses. Waste water is disposed of to surface waters and the sea. Alterna-tively it is reused externally in other industrial organizations or as irrigation water.
In the European Union, North America and other regions of the globe, environ-mental regulators control the disposal of raw ef fluent, sewage sludge and treated waste
water. As already suggested, the polluting content of these solid and liquid wastes hasthe potential to damage the natural environment and bring illness and disease tourban and rural populations. For example, this is true of complex ef fluents containingphenols, ammonia, chlorine, heavy metals and organo-phosphates. The government’sregulatory agency imposes a ban on some toxins. In other cases it limits their max-imum level by means of consent conditions.
Specifically with respect to the European Union, the 1991 Urban Waste WaterTreatment Directive lays down uniform emission standards for sewage treatment forall sewage treatment works serving populations of two thousand or more. The Directivealso covers industry’s direct disposal of ef fluent. In the UK, the most dangerous sub-stances which can be found in industrial ef fluent and domestic sewage are on theEnvironment Agency’s Red List.
Environmental regulation raises the cost of pre-treatment by industry and the costof waste water treatment by water service companies. Industrial companies may there-fore oppose the introduction of pollution legislation or may attempt to evade it whenit is in place. As a result, the regulator requires systematic monitoring of the chemicalcomposition of discharges to water courses and sewers.
The prohibitions and consent conditions imposed on water company dischargesin turn may lead the company to set quality standards on industrial discharges to itssewers. This is because specific industrial ef fluents can raise sewage treatment workscosts substantially, within a defined regulatory framework, or disable some treatmentprocesses. The water service company needs to shield its assets from damage, protectits operatives, keep its production costs as low as possible and ensure its treated waste
water discharge and sludge output meets the regulator’s standards. As John Hillspoints out in his valuable book, Cutting Water and Ef fluent Costs, a water service com-pany ban on complex ef fluents in turn places pressure on industry for strengthenedon-site pre-treatment facilities (Hills 1995).
The interdependence of industry, water utility and environmental regulator is read-ily illustrated. The bulk of sewage sludge in the UK is used on farmland, but heavymetals in the sludge can make it unacceptable for agricultural purposes. Conventionaltreatment of ef fluent does not remove these pollutants. As a result, the Environment Agency and the water utilities impose strict limits on the heavy metal content of dis-charges to water courses and sewers, for example by the electroplating and photo-graphic film processing industries (Hills 1995: 26–7).
So we can see that the introduction of vigorous environmental regulation of indus-trial ef fluent disposal to fresh and salt water sinks places new technological demandsboth on water utility treatment of aqueous waste as well as on the pre-treatment of itsef fluent by industry itself.
15.3 THE OBJECTIVES OF DISPOSAL CHARGES
A discharge fee on industrial ef fluent can be defined as a payment levied on an industrialorganization by a government regulator or by a water utility in respect of the volume

8/12/2019 1843391775
http://slidepdf.com/reader/full/1843391775 144/230
of ef fluent and/or the pollutant mass it discharges to sewer, aquifer, river, lake,estuary or coastal waters.
To understand the objectives of the institutions which set and collect disposalcharges, a vital analytic distinction is necessary based on the flow chart of Figure 15.1.
Two types of organization impose discharge fees:1. Water service companies levy charges on industrial organizations (as well as domes-
tic consumers) which discharge their ef fluent to the companies’ sewers; and2. the environmental regulator levies charges on industrial organizations, including
water service companies, which discharge their ef fluent to water courses.
In the first case above, the utility provides a waste water service which embracesthe collection of ef fluent through the sewerage network, its treatment, and the dis-posal of waste water and sewage sludge. The objective of the utility in setting the dis-posal charge is to cover the prime and overhead costs of providing this sanitationservice (Merrett 1997: Figure 3.2). Disposal fees of this type are universally referredto as sewage charges. In 1999 a typical charge in the UK is of the order of US $0.80per cubic metre of waste water.
In the second case, that of the environmental regulator, the objectives are morecomplex. The control of industrial ef fluent discharges to water courses imposes a var-iety of financial costs on the regulatory authority, such as for research, policy-making,the preparation of discharge licences, and monitoring adherence to the standards set.Hötte et al. (1995: 220) indicate that the original objective of the levy on discharges tosurface waters in the Netherlands was ‘fund-raising for water quality management bygovernment authorities’. We can call this the hypothecation objective. Such a goal isprobably the origin of discharge fees in every regional or catchment authority in the world, where regulatory charges are collected. The parallel here with fee paymentsfor abstraction licences is evident (Merrett 1999a).
But another goal for discharge fees seems to have developed in an evolutionarymanner from the hypothecation charge. At the most general level, the objective of regulatory standards on industrial ef fluents has been to reduce industrial pollution of the natural environment. This has benefits not only of an environmental nature butalso can increase gross domestic product: by reducing the costs of instream waterusers such as in fishing, leisure pursuits and other ecosystem activities; and by cuttingthe costs of downstream water abstractors. In applying hypothecation fees, it becameevident to regulatory authorities that industry was cutting back on the ef fluent mass itdischarged in order to reduce its exposure to these now internalized costs. Onceagain, the case of the Netherlands is instructive here. So the charge raised to financethe command and control system was now acting independently as an economic
instrument in achieving the prime goal of regulation itself. As a consequence, withthe passage of time, the second objective of discharge fees, pollution reduction,became established.
15.4 THE DEMAND FOR WASTE WATER SERVICES
Waste water services are a public good, that is, where the benefit derived from the goodby one consumer does not diminish the benefit derived by consumers in general. Thestandard textbook example is a country’s armed forces (Sandmo 1987). In a laissez-faire

8/12/2019 1843391775
http://slidepdf.com/reader/full/1843391775 145/230
economy, it is impossible to price or to sell services for the treatment and subsequentdisposal of industrial ef fluent, for no purchaser of such services privately appropri-ates their benefits.
Where the state intervenes to defend the public realm against industrial pollution,
a space is opened up by environmental legislation within which sewerage utilities (pri- vate or municipal) can operate. As we have seen, sewage charges payable to the util-ity and discharge fees levied by the regulator for the use of water courses as a sink,create a response from industry.
Organizations confronted by disposal charges on the volume of their ef fluent and/oron the pollutant mass will investigate ways of cutting the charge payable, providedthat the fees are not negligibly low. This requires operational research combiningmanagerial, engineering and economic skills. The relation between charge and indus-trial action can be measured by the elasticity of response of the pollutant mass/ discharge fee function (see below).
One method is to reduce the total volume of abstracted water consumed or thetotal mass of a specific chemical used for the production process. For example, a site
survey can be used to calculate the organization’s own ‘regional’ water balance state-ment, to revise water need calculations and to check the functioning of the water dis-tribution system so as to cut internal water supply volumes and reduce on-site leakage(Merrett 1999b). Another example, from the leather industry, is advances in the tech-nology of the tanning process which permitted a fall in chromium use because of anincreased percentage uptake in the hides.
A second method for industry to reduce its disposal charges is pre-treatment bythe institution of its own ef fluent so as to diminish the pollutant mass discharged tosewer or to water course. Pre-treatment includes air flotation for fats, special separatorsfor oil, and bacterial processes for organic ef fluents. Pre-treatment is likely to be intro-duced only if the financial rate of return is attractive when its costs are assessed against
the reduced bills for disposal. A potentially beneficial spin-off from pre-treatment isby-product manufacture for sale to niche markets, such as the production of animalfeed in ef fluent treatment by whisky distillers.
The third method for cutting discharge fees is for industry to reuse its water and/or itsprocess chemicals. Often this demands pre-treatment as a first step. The impact on water volumes of internal reuse is both to cut its water intake requirements, with an associatedfall in water supply costs, as well as to reduce its ef fluent volume, thereby diminishing itsdisposal charges. These opportunities frequently occur in process washing where, asHills points out (1995: 85): ‘the cleanest water washes the nearly clean product and thereused water washes the dirty incoming product’. With respect to a process chemicalsexample, equipment exists to handle the rinse waters from chrome and nickel electro-plating drag-out tanks, enabling the plating chemicals to be returned to the plating bath.
The effect of disposal charges on industrial firms’ behaviour is illustrated inFigure 15.2. The vertical axis measures the pollutant mass discharged per unit timeperiod, that is, the variable M of equation (1) below. The horizontal axis measures theindependent variable P , the price charged as a disposal fee per unit of pollutant mass.The shape of the function is that of a quadratic equation:
M aP 2 bP c (1)
where a, b and c are the equation’s parameters and a is negative.Figure 15.2 embodies the hypothesis that at low prices the mass discharged is vir-
tually unaffected by price differences. Here managers take no interest in the invoices

8/12/2019 1843391775
http://slidepdf.com/reader/full/1843391775 146/230
they receive from the environmental regulator or the water utility. In a higher pricerange, the discharge fee really bites and the slope of the curve is steeper. At very highprices, pollutant discharge ceases as the industrial institution is forced for financialreasons either to change its technology or discontinue production. The price at which M falls to zero has the same outcome as that where a regulatory agency places a com-plete ban on the pollutant’s discharge.
15.5 THE MEASUREMENT OF POLLUTION
Before an understanding of the design of discharge fees is possible, it is necessary toexamine how pollutant flows are calculated. One can only price what one can measure.Clearly, the starting point is the flow volume of industrial ef fluent, for example incubic metres discharged per day. A second measure is the concentration of pollutantsin the ef fluent. This can be measured as the mass of a speci fi c pollutant per unit vol-
ume, for example measured in grams per cubic metre, equal to milligrams per litre.This gives:
M V C (2)
where M is here measured in grams/day, V is ef fluent volume and C is pollution con-centration.
However, pollutant-specific fees entail high transaction costs because of the tech-nical dif ficulties of measuring the pollutant concentration and monitoring how itchanges over time (Green 1990: 9). Ef fluent is a complex waste. In the steel city of Jamshedpur in India, for example, Bhatia et al. (1994: 10–11) showed that untreated
0
200
400
600
800
1000
1200
121086420
Disposal price per kilogram
P o l l u t a n t m a s s i n k i l o g r a m s
Figure 15.2 The effective demand for pollutant disposal services.

8/12/2019 1843391775
http://slidepdf.com/reader/full/1843391775 147/230
industrial discharges into the Subernarekha River contained phenols, oil, grease,ammoniacal nitrogen, cyanide, chromic and other acids, and hexavalent chromium.The discharge volume is so high that in the low flow month of April the ratio of theef fluent volume to the river flow is 1:3.75.
These inquinating cocktails need grouping categories to facilitate the measurementand pricing routines, such as biological oxygen demand (BOD), chemical oxygendemand (COD) and suspended solids, all quantifiable in grams/cubic metre. BODand COD are directly related to dissolved oxygen, the principal measure of waterquality in terms of its ability to sustain plants, fish and other biota.
In France, Tuddenham (1995: 201–2) reports that pollution charges are based onthe quantity of pollution generated on an ordinary day in the month of maximum dis-charge. There are eight grouping categories: suspended solids, oxidizable substances,soluble salts, nitrogen, phosphorus, organohalogenated compounds, metals and met-alloids, and toxins. The first seven are measured in grams and the eighth in toxic units.In the Netherlands, the principal measures are COD and the heavy metal pollutantscadmium, mercury, arsenic, copper, nickel, zinc and lead (Hötte et al. 1995: 221–2).
15.6 THE DESIGN OF DISPOSAL CHARGES: THE UTILITIES
Discharge fees should be designed to achieve the objectives pursued in setting them.For that reason, one must deal separately with the water service company and theenvironmental regulator.
The water utility seeks to cover the costs of providing its sewerage service to indus-try, such costs defined in a broad sense to include the cost of capital. Its prime costsper unit output comprise wages, salaries, power, materials, spare parts and other con-
sumables. The gross margin per unit output meets overhead costs and net profit.Overheads are made up by the rent of land and buildings, leasing costs, payments todirectors, interest on loans and amortization. Net profit is split between taxes, divi-dends and retained profits.
Pricing strategy is likely to be based on average cost, as Lee (1994) proposes.I have suggested elsewhere that the most appropriate average cost model for the waste water industry is mark-up pricing. In this case average prime cost per cubic metre of industrial ef fluent at normal capacity is calculated and a mark-up added (Merrett1997: 59–61). The mark-up may be in cents per cubic metre or it may be a percentageaddition to prime cost. Where prices are controlled by a regulator, these too will beaverage cost based.
There is no space here for prices set at short-run marginal cost nor should therebe. Similarly, there is no role for the average total cost of new investment in networkand headwork infrastructures, otherwise known as long-run marginal cost. Short-runmarginal cost is negligibly low and pricing on this basis would ruin the utility. Theaverage total cost of additional capacity as a price determinant would generate hugelosses (or surpluses) wherever average total cost was substantially lower (or higher)than the average total cost of existing capacity. Marginal cost pricing, if combined with a standing charge, discriminates against small-scale users of the sewerage system.This approach to cost recovery pricing in the collection and treatment of waste water, embracing both prime and overhead costs, is embodied in the EuropeanUnion’s Water Framework Directive, which also requires the design of the most cost

8/12/2019 1843391775
http://slidepdf.com/reader/full/1843391775 148/230
effective measures to achieve local reductions of substances prioritized on the basisof risk (Bjerregaard 1998: 78–80).
The starting-point for industrial disposal charge setting will be the average costper cubic metre of collection, treatment and disposal of all sewage. Where the con-
centration of pollutants from specific organizations is calculated to be higher than theaverage and where this difference gives rise to higher treatment or disposal costs, ahigher price should be set, such that the resulting price difference matches the highercost, on the basis of cost engineers’ calculations.
An example of such customary practice is the modern Mogden formula (Mogdenis the largest sewage treatment works in London):
K R Q B(Ot / O s) S(St / S s) (3)
where K is the charge per cubic metre; R are the costs for conveyance through sewers;Q is the volumetric treatment cost covering screening, primary settlement, tertiarytreatment, and outfalls of treated sewage; B is the cost of biological treatment plus aproportion of secondary sludge treatment and sludge disposal; S is the cost of treat-
ment and disposal of primary sludges; Ot / O s is the COD in milligrams per litre after1 hour’s settlement at pH 7 of the company’s industrial ef fluent divided by the regionalaverage of the same measure; and St /S s is the suspended solids in milligrams per litreafter 1 hour’s of settlement at pH 7, again of the company’s industrial ef fluent dividedby the regional average of the same measure. Here, then, the multipliers are based onthe concentration of chemical oxygen demand and suspended solids. In the UK,Stewart has successfully developed a logarithmic model of the functional expenditureof large sewage treatment works that shows clear economies of scale and uses separ-ate terms for maximum BOD and ammonia consents (Ofwat 1994).
15.7 THE DESIGN OF DISPOSAL CHARGES: THE
ENVIRONMENTAL REGULATOR
The regulator’s two objectives in charge-setting, discussed in Section 15.3 above, arehypothecatory and pollution-reducing. These will be reviewed in turn. But first it isnecessary to make a simple point, often neglected, with great bearing on the regula-tor’s charges. At the simplest level, industrial ef fluent is composed of two parts: waterand pollutants. The ratio of the first to the second is large. For example, Tuddenhamproduces data that show that in France the mass of pollutants produced per inhab-itant per day is 166 grams (1995: 203). The volume of water used per inhabitant perday is of the order of 150 litres. Therefore the ratio of the total mass of pollutant to themass of water is about 1:900. The discharge of water to river, lake and estuary imposesno costs on the environment. Indeed, it is a welcome addition within the hydrosocialcycle to the catchment’s effective rainfall. In contrast, pollutants do impose such costs.Thus the regulator’s golden rule should be to levy disposal fees only on the pollutantmass, never on the water volume.
The hypothecatory objective requires that total receipts from the discharge feeslevied on industry should equal the total costs of the regulation of industrial ef fluent.In practice, these two variables are interdependent. The first determines the second which determines the first. To understand the contingencies of their relation requiresan economic history of the catchment and an account of its environmental politics.

8/12/2019 1843391775
http://slidepdf.com/reader/full/1843391775 149/230
The French basin agencies provide a clear case of the hypothecatory principle(Tuddenham 1995).
The pollution-reducing objective implies that the fee per unit measure of pollu-tion (see Section 15.5) should vary with the environmental cost it is assessed to impose.
In some cases it may be possible to measure the financial cost suffered by in-streamuses such as navigation, recreation and fishing, or by organizations abstracting waterfor subsequent use. However, I know of no case where such measured financial costhas in fact shaped the discharge tariff. In any case, the principal harm done by pollu-tion is perceived to be environmental, rather than GDP-reducing. In my view suchimpacts cannot usefully be measured in dollar terms (Merrett 1997: 168–70). In suchcases the design of the components of the tariff is best carried out on the basis of environmental impact assessments. Such impacts vary with pollutant type, the eco-logy of the water course at the point of disposal and downstream thereof, the qualityand volume of the river flow at the point of disposal, the season, and the concentra-tion of pollutants within the ef fluent discharged.
Finally, in this section, it is appropriate to refer briefl y to a pricing mechanism for
the release of pollutants to water course sinks which environmental regulators may wish to consider. This is the introduction of tradeable disposal rights, a parallel con-cept to tradeable abstraction rights. Such an arrangement would see the regulatorauction permits to pollute to the highest bidder. Such rights would be recognized, forexample, for 5 or 10 years and would state the maximum mass of pollutants permittedto be discharged. They would be tradeable between organizations.
Unfortunately, the polluting institutions of industry each has a pollutant mass they wish to discharge annually which differs in total mass, pollutant composition, timingof discharge and location of disposal. Thus it would be impossible for a regulator todesign a permit with a known environmental impact which would be of value as a com-modity, for it could not be of commercial interest to more than one institution.
As Bhatia et al. write: ‘ef fluent permit trading schemes have been implemented … onlyrarely for water pollution’ (1994: 7).
15.8 CONCLUSIONS
On the basis of the preceding discussion of the disposal of industrial ef fluent to watercourses, there seem to be eleven conclusions an environmental agency might draw onthe inter-relation of environmental regulation and economic instruments in the questfor a sustainable society.
1. In terms only of ef fluent discharged, disposal fees in the course of time can havethe same broad outcome as regulatory limits or bans.
2. Both regulation and discharge fees stimulate pre-treatment and reuse withinindustry, the regulation of industrial discharges to sewer by the water servicecompanies, and specific forms of sewage treatment by those same utilities.
3. Both regulation and disposal charges engender substantial transaction costs forthe environmental agency in monitoring industry and waste water utility behav-iour. This is because waste water treatment and the disposal of its products arecostly public goods. Grouping categories for the measurement of industrial pol-lution, such as biological oxygen demand, help reduce these transaction costs forboth approaches.
8/12/2019 1843391775
http://slidepdf.com/reader/full/1843391775 150/230
4. For both command and control as well as economic instruments, the golden rulemust be to target pollutant mass, or its derivatives such as chemical oxygendemand, never the volume of industrial ef fluent, in order to reduce pollution without diminishing the recycling of water.
5. The design of regulatory proscriptions and consents, as well as of discharge fees,should be based on environmental impact assessment, not on vain attempts togive a meaning to the dollar valuation of environmental costs.
6. Disposal charges generate a hypothecated income for the environmental agency.Regulation does not.
7. Regulation has precision, speed, directness and forcefulness unmatched by dis-charge fees.
8. The prime and overhead costs of the collection, treatment and disposal of indus-trial ef fluents can be prodigious and should be carefully reviewed before regula-tory bans and consents are set (Briscoe 1995).
9. Disposal charges permit a flexibility of response by industry unmatched by regu-lation. This flexibility can be manipulated by the agency so that the industrial
costs of conforming to required standards are minimized.10. The objective of regulation has always been to reduce the industrial pollution of
the environment, whereas the objective of discharge fees has been hypothecatory.However, in the course of time, discharge fees have evolved so as also to serve apollution-reducing objective.
11. Regulation works best where draconian and absolute action is required. Econo-mic instruments work best where partial restrictions shared amongst a group of stakeholders are appropriate. and where limits on pollution behaviour are morecostly to society if undertaken by some organizations rather than by others.Under these assumptions, economic instruments can allocate the permissionpartially to pollute in the most ef ficient manner.
In conclusion, my judgment is that both approaches are valuable and should comple-ment each other, provided that they are introduced in a society where the design of rules and of prices are appropriate to their objectives, where it is possible to imple-ment regulation effectively, and where disposal charges can be correctly assessed andare actually paid.
The material in this chapter originally appeared in: Industrial ef fluent policy: economic instrumentsand environmental regulation. Water Policy, 2, 201–211, 2000.

8/12/2019 1843391775
http://slidepdf.com/reader/full/1843391775 151/230
16
Nitrate pollution on the Island of Jersey: managing water quality
within European communitydirectives
‘‘We must have some comradeship with imperfection.’’George Eliot (1876)
This paper was co-authored with my friend Nick Walton
16.1 INTRODUCTION
The objectives of this paper are two-fold. First, the authors wish to review the anthro-pogenic processes by which the Island of Jersey’sgroundwater and surface waters havebeen polluted by nitrates over a broad span of time. Secondly, the costs and benefitsare assessed of the principal management innovations by the government sector toreduce nitrate pollution.
Jersey is an island in the English Channel and is situated off the north-west coastof France, only 23 kilometres from the Normandy coast. Its political relationship toEngland, France and the European Community (EC) is complex for historical reasons.Prior to the Norman Conquest in 1066, Jersey and the other Channel Islands werepart of the territory of the Duchy of Normandy. But when continental Normandy wasfreed from English rule in 1204, Jersey retained its allegiance to the King of England.
C 2007 IWA Publishing. ThePrice of Water: Studies in Water ResourceEconomicsand Management
2nd Edition by Stephen Merrett. ISBN: 9781843391777. Published by IWA Publishing, London, UK.
140

8/12/2019 1843391775
http://slidepdf.com/reader/full/1843391775 152/230

8/12/2019 1843391775
http://slidepdf.com/reader/full/1843391775 153/230
142 The Price of Water
concentration (MAC) in all member countries’ legislation. The epidemiological andscientific reasoning behind this change from an ‘acceptable level’ of 100 mg/l to aMAC of 50 mg/l has long been contested. In any case, the EC directive, along withthe 91/676/EC Nitrates Directive, has necessitated EC states investing substantially incostly nitrate reduction measures and nitrate removal plants.
The nitrate problem is complex, and many studies have shown that simple leach-ing of applied nitrate fertiliser is only a part of the problem. The leaching process islocation-dependent in terms of climate, soil type, bedrock geology, drainage charac-teristics and vegetation. On top of this are the anthropogenic factors such as farmingpractices, cropping type and intensity, fertiliser application rates and timings etc., as
well as inputs from the septic soakaway systems of non-sewered dwellings.The two principal driving forces behind nitrate leaching are the extreme solubility
of nitrates, and the clear relationship between applications of nitrate fertiliser andincreased crop yields that, in a modern capitalist market economy, means the dif-ference between economic survival and extinction for the farming community. Thereare well-researched Government guidelines for determining the optimal level of N-
fertiliser to apply for each crop, and these can be refined with local field soil-nitrogenknowledge. However, the complex, climate-driven, biogeochemicalreactions that bothstore and release nitrogen from the soil zone, and the unpredictable timing and effectsof rainfall, all combine to make prediction of N-leaching difficult. In fact, the gener-ally thin, clay-poor soils over hard-rock basement throughout Jersey mean that theirleaching potential and aquifer vulnerability are both high.
One of the earlier papers addressing the Jersey nitrate problem identified theexcessive use of artificial fertilisers, especially on the many smaller farms, as being asignificant contributor to the elevated nitrate levels being experienced within most sur-face and ground waters in Jersey (Foster et al. 1989). Farming studies have shown thatboth potato cropping and grassland dairying require some of the highest rates of fer-tiliser application for optimum/maximum yields (Holmes 1979). Moreover, optimumcropping methods tend to promote high leaching rates, especially in thin, clay-poorsoils.
Thiscombinationofsoil,geology,climate,croppingandfarmingpractice,asappliedto the Jersey situation where potatoes and dairying historically dominated the agri-cultural sector, produced conditions for maximum nitrate generation and leaching. Itshould therefore be no surprise that Jersey has suffered from perennially high nitratelevels in all its water bodies, especially as over-fertilisation of crops by up to 60% of farmers has been historically practised (Foster et al. 1989).
Lott et al. (1999) state that if Jersey’s fertiliser application rates were to be reducedto the levels jointly recommended by the UK’s Ministry of Agriculture, Food andFisheries (MAFF) and the Agricultural Development Advisory Service (ADAS) (and
now by DEFRA – the Department of the Environment, Food and Rural Affairs),then nitrate levels in Jersey’s waters could fall by up to 34% (DEFRA 2000). Addi-tionally, establishing water catchment controls, Nitrate Vulnerable Zones and incor-porating non-spreading buffer zones along watercourses to prevent direct leachingand support natural denitrifying activity, could all help to resolve Jersey’s nitrateproblem.
Although agricultural drainage is the predominant route for nitrate leaching intoJersey’s surface and groundwater bodies, there is also a small input from the 5,000or so rural unsewered dwellings, the septic tanks of which discharge organic nitrogenand ammonium into the shallow soil zone, which then oxidises to nitrate and adds to

8/12/2019 1843391775
http://slidepdf.com/reader/full/1843391775 154/230
Nitrate pollution on the Island of Jersey 143
the nitrate concentrations in groundwater. Although ground waters supply less than3% of the public water supply from the Jersey New Waterworks Company (JNWWC),base flow from Jersey’s shallow aquifers provides some 58% of annual average flowsin Jersey’s surface waters that are then combined into reservoir storage for JNWWC
water supplies.However, Lott et al. (1999), using a simple model based on nitrogen export coeffi-
cients, found less than 10% of the total nitrogen loading to be derived from domestic waste water and livestock. This was supported in the study of Green et al. in 1998 whoused nitrogen isotopes to characterise the different sources of nitrogen inputs, andfound only a small input from these non-agricultural sources. Finally, there are alwayspoint source leakages of nitrate from broken sewers, silage clamps, farmyard drainageand storage areas etc. These can be minimised by good planning, inspection and main-tenance programmes, but never completely eliminated. Under the EC-driven UK legislation on Nitrate Vulnerable Zones, improvement grants are available to farmersto re-locate, upgrade and improve all farm areas where nitrate leaching could be aproblem; this includes farmyard drainage, silage clamps, silos etc.
16.3 WATER QUALITY MANAGEMENT BY THE
DEPARTMENT OF AGRICULTURE AND FISHERIES
The preceding section shows that the principal processes of nitrate pollution in Jerseytake place in the agricultural sector. In the last five years the Water Pollution (Jersey)Law 2000 has provided the legal basis for new forms of water quality management.The Law contains pollution prevention provisions and Article 17 makes it an offenceto cause or knowingly permit pollution of any controlled waters, unless it is done under
the conditions of a discharge permit. ‘Controlled waters’ refers to the territorial seaadjacent to the Island, coastal waters, inland waters and ground waters. With respectto agriculture, farmers and employees and contractors can be prosecuted for causingpollution, with a maximum penalty of an unlimitedfine and/ortwoyearsimprisonment.
In the case of a prosecution, a farmer can defend himself by showing due diligencein his operations. A due diligence defence can be based on the 2004Code of Good Agri-
cultural Practice for the Protection of Water . This ‘Water Code’ sets out recommendedpractices that, if followed, will reduce nitrate and other forms of water pollution. Table1 shows the Water Code’s sections and for each of these an example of its content. Asthe Water Code states (p.7) ‘You are therefore strongly recommended to comply withthis Code of Practice especially in view of the Article 18(5) of the Law in relation tothe defence of due diligence.’
In brief, the 2004 Code of Good Agricultural Practice for the Protection of Water hasteeth. If it is not complied with, a farmer who pollutes controlled waters can be finedand/or sent to prison. The Water Code is fifty pages long and contains a wide varietyof recommended practices that have direct relevance to the nitrate pollution of con-trolled waters. With respect to nitrates the most important recommendations are to befound in Section 2 (Farmmanure and waste management planning), Section 3 (Slurry),Section 5 (Solid manure), Section 10 (Liquid fertiliser) and Section 11 (Nitrate andphosphorus). Appendix 1 of the Code includes nitrogen compounds as amongstthe high-risk substances of the second schedule of Water Pollution (Jersey) Law2000.

8/12/2019 1843391775
http://slidepdf.com/reader/full/1843391775 155/230
144 The Price of Water
It is worth mentioning that the Department of Agriculture and Fisheries hasceased to exist since January 1st 2004. The technical and scientific part of its work
was transferred to the Environment and Public Services Department on that date. Inthis way, the agricultural activities of Jersey’sgovernment institutions have been drawncloser to their environmental responsibilities.
By 2005 it had become clear that Jersey’s long battle to redeem the quality of itssurface and groundwater flows was beginning to record clear successes. Changingagricultural practices through the 1990s with a greater number of better-managed,larger farms, reductions in potato and dairy farming, and the gradual introduction of optimised ploughing, plant-rotation and cover-cropping practices have together hada positive effect on the nitrate levels in Jersey’s waters in recent years.
Implementing the 2000 Water Pollution Law was always going to be easier for pointsource infractions than for diffuse pollution, because of the greater visibility of theformer. Two farmers have been taken to court over silage spills under the Law but nonefor non-point source breaches of the Law. However, the combination of the regulatorythreat and the government’s successes with friendly persuasion on nitrate applications
began to take effect. Nitrate use has been falling for 5–6 years and there has been a25% fall in the potato area between 1999 and 2004. All the available evidence in 2005suggests a decline in the nitrate content of surface and groundwater. Borehole testsprovide the evidence on groundwater. Moreover, a quinquennial review of Jersey’sflowing water based on macro-invertebrate populations showed striking advances inquality between 1997–98 and 2002–04. For example, ‘bad quality’ incidence fell from37% to 8% (Langley & Kett 2005).
16.4 WATER QUALITY MANAGEMENT BY THE JNWWC
a) The water utility
The Jersey New Waterworks Company Ltd. (JNWWC) is the oldest registered com-pany in Jersey (founded 1882), although the States of Jersey took a major shareholdingin 1981 to guarantee a public voice in the essential supply of piped water to over 85%of the island population.
Water from all JNWWC stream, spring, borehole and desalination sources is col-lected and stored in six reservoirs prior to pumping for treatment at one of the twocentrally-situated water treatment works at Handois and Augres. Treatment at bothplants consists of the basic standard water works practice of clarification, filtrationand chlorination, prior to distribution to customers via some 400 km of service mains(JNWWC, 1998).
By these practices, the varying qualities of the different water sources are blended-out and the water quality output from both treatment plants is generally very similar,giving a broadly uniform water quality throughout most of the public supply network.
The quality of water supplied by JNWWC aims to comply with the EC criteriafor public supply drinking waters, although it has always had problems meeting the50 mg/l NO3MAC, with up to 30% of samples exceeding this limit in 2001 (JNWWC,2002). Since Jersey is not a member of the EC there has, until recently, been no legalrequirement to keep to this MAC. However, a recent (2004) amendment to the JerseyWater (1972) Law has incorporated the UK Water Quality (2000) regulations, whichimplements the EC potable water quality standards, including the 50 mg/l MAC for

8/12/2019 1843391775
http://slidepdf.com/reader/full/1843391775 156/230
Nitrate pollution on the Island of Jersey 145
nitrate. However, the States, recognising the extent of the nitrate problem in Jersey,has allowed dispensations until 2008 for up to 33% of samples annually to exceed thenitrate MAC, as long as they are less than 70mg/l NO3.This pragmatic measure givesthe JNWWC time to plan for ways in which it can blend-in low nitrate water sources toreduce the nitrate concentration in all its piped supplies to below the 50 mg/l MAC bythe end of 2008. Other JNWWC water quality problems are few and minor, involvingoccasional minor excedences for nitrite, lead, manganese, cyanazine, coliforms andchlorthal (JNWWC Annual Reports).
b) Seawater desalination
Jersey is not particularly short of water in any absolute sense, since total abstractionsare only around 25% of the average annual effective rainfall of the island. However,its typical island limitations and the annual summer influx of tourists, which can swellthe population by up to 50%, mean that its six storage reservoirs (holding up to 30%
of annual public demand) can become seriously stressed during successive dry yearsor drought conditions like 1975/76, 1989/92 and 1995/96 (Robins 2000).
Prior to the JNWWC commissioning the UK’s first seawater desalination plantin 1970, drought conditions, like 1959, had necessitated severe water rationing forthe island’s population. There were also optimistic forecasts of growth in the Island’spopulation and its economy. The 6,000 m3 /d multi-stage flash (MSF) distillation plant,commissioned in 1970 at La Rosiere in the south-west of the island, was designed inthe context of this optimism as well as to alleviate occasional drought situations and,although it operated only on a demand-only basis for some 1000 days over its 28 yearexistence, it became a life-saver at those particularly dry times.
MSF distillation technology of the 1960’s was energy intensive and inefficient by
modern standards and also environmentally polluting due to the burning of some45,000 litres/day of heavy grade fuel oil and the consequent emissions of 2.2 tonnes/dayof sulphur dioxide (Howard 1999). In 1997 a decision was taken by the JNWWCto demolish this old MSF plant and replace it with a much more energy efficient,less polluting and cheaper reverse osmosis (RO) desalination plant, which producesa similar volume of around 6000 m3 /d of freshwater for approximately 50% of therunning costs of the old MSF plant.
The new RO plant desalinates filtered and chemically pre-conditioned seawater bya pressure-driven membrane process which uses electrical pumping energy, at some65 bars pressure, to force pure water molecules through a semi-permeable membraneleaving the concentrated brine salts to be rejected and disposed of back into the sea.The system uses modern, high efficiency, thin film composite (TFC) membranes in
a spiral wound configuration that operate at a 45% recovery rate. Additional energyefficiency is gained by recovering pressure from the reject brine stream through anenergy recovery turbine (Howard 1999).
The new RO plant uses the same seawater intake, pipelines and holding reservoiras the old MSF plant, but requires additional pre-filtration and chemical conditioningstages prior to feeding the seawater into the sensitive RO membranes to prevent mem-brane fouling. The plant contains four independent RO trains, so has great flexibilityin its operation, cleaning and stand-by modes.
Overall, the advantages of the new RO plant over the old MSF process are lowerenergy requirements, no fuel-handling operations, short start-up and shut-down times,

8/12/2019 1843391775
http://slidepdf.com/reader/full/1843391775 157/230
146 The Price of Water
operational flexibility, lower maintenance requirements, lower operational cost andno atmospheric pollution.
The flexibility of the RO plant now enabled its output to be used for blendingpurposes by pumping variable quantities of desalinated fresh water into the Val de laMare storage reservoir, significantly decreasing the final mixed water’snitrate contentat a time when nitrate levels were beginning to rise above the EC’s potable waterquality standard of 50 mg/l.
Since the desalination plant can produce up to one quarter of the summer peakdaily demand forpotable water from the JNWWC, running this plant with its near-zeronitrate concentration could, theoretically, reduce all of the JNWWC water supplies tobelow the EC’s MAC of 50 mg/l NO3. (In practice this would occur primarily only inthe western part, due to the pipe-network’s delivery of all the desalinated water intothe Val de la Mare storage reservoir in the west where the Handois water treatmentplant is located. Desalinated water can be routed to the Augres water treatment plantin the east of the Island, but there the nitrate levels are, in any case, lower.)
Running the desalination plant at full capacity would mean an expensive, uneco-
nomic production of a surplus of potable water. However it has now become possibleto arrive at a compromise position whereby the desalination plant is run for certainperiods of time, like seasonably high nitrate peaks, in a nitrate-reduction ‘blending’mode, rather than just an emergency water production mode in drought times.
c) Costs of RO Desalinated Water
Continued advances in membrane technology and energy recovery systems havebrought a substantial decrease in the total costs of RO desalinated seawater inter-nationally from around $2/m3 in the late 1980’s to around $0.7/m3 currently. Costing
is complex because it depends upon fluctuating energy costs, the degree of energyrecovery possible, manpower costs, the economies of scale achieved by continuousrunning of the plant, and the capital amortisation rate. In Jersey, the island situationrequires the import of all energy and consumables that, together with high manpowercosts and the intermittent running of a relatively small plant, all push towards highercosts than those achieved internationally.
The capital cost of the 6000 m3 /day RO plant was £5.1 million. Amortised over10 years, this implies £1400/day or 23 pence per cubic metre (p/m3) of product waterat full capacity output. Running costs are approximately £3600/day or 60 p/m3 of product water. Average total cost of desalinated water is thus approximately 83 p/m3
when the plant runs at full capacity. This compares unfavourably with the approximateaverage total cost of 15 p/m3 for the main surface water supplies from the JNWWC.
These, of course, suffer from some degree of nitrate pollution.Thus, although desalinated water appears relatively expensive, this price becomes
acceptable in the event of drought conditions. Since the capital and labour costs areeffectively fixed, the marginal cost in running the plant at other times to produce zero-nitrate water for blending purposes, is only the 33 p/m3 due to consumables (mainlyelectrical energy) costs. Recent improvements in energy recovery technologies – if retrofitted to the reverse osmosis plant – could reduce this energy cost significantly.
The most recent developments have been very positive. In the year 2004 it was not
necessary to run the desalination plant at all, either for drought functions or for theblending function. This is ascribed partly to the decline in nitrate levels in Jersey’s

8/12/2019 1843391775
http://slidepdf.com/reader/full/1843391775 158/230

8/12/2019 1843391775
http://slidepdf.com/reader/full/1843391775 159/230
148 The Price of Water
Households that are not connected to the mains supply install and operate theirown water treatment systems. Prior to 2004, the public health aspects were dealt
with by the Department of Environmental Health (DEH) through its monitoringprogramme of domestic wells and boreholes. Every year, in May and November, theDEH took a sample of 52 boreholes and wells across the island. These were monitoredfor inorganic pollution, including nitrates. A further 16 from the sample were alsoanalysed for pesticides and microbiological contamination. This routine programme
was terminatedat the beginning of 2004 when departmentalpriorities were re-assessed.Currently, DEH assess the water quality of such abstractions whenever a householdrequests them to do so. A charge is made for the service.
Individual households can also monitor their own water quality by making use of private analytical laboratories, and some have subsequently invested in private house-hold treatment systems. Such treatment systems are usually filters, of varying types,used mainly to remove particulate matter, although those incorporating charcoal, sil-
ver, or membranes can sometimes remove additional contaminants if kept clean and well maintained. However, none of these domestic filters can remove nitrates, and will
not effect any significant changes to the overall inorganic quality of the water.It follows that it is only the EPSD’sactivities through the ‘Water Code’(see section 3
above) that provides any protection from nitrate pollution for the Island’s householdsunconnected to the mains supply.
16.6 WATER QUALITY MANAGEMENT OF WASTE WATER
DISCHARGES: THE ENVIRONMENT AND PUBLIC
SERVICES DEPARTMENT
a) Domestic discharges
Section two above showed that domestic waste water discharges are a small but sig-nificant source of the nitrate pollution of water on the island. In 1996 Gass, Robinsand MacDonald recommended that all soakaways and septic tanks should be takenout of use and sewerage extended to the whole island population. However, theydid not say why effective private treatment by households should be eliminated, theydid not estimate the economic costs of extending the sewerage network to every ruraldwelling, and they did not clarify the relative importance of such discharges as a sourceof nitrates. This was a clear case of a policy recommendation that lacked any sense of the costs and benefits of the proposal.
The Water Pollution (Jersey) Law 2000 requires that owners of septic tanks, tighttanks, soakaways, or private sewage treatment plants have a discharge permit only
where such discharges result in or are likely to result in the contamination of controlled waters. As Parkinson et al. (2001: 14) have pointed out, the efficiency of soakawaysand septic tanks has been found to vary with maintenance input and with loading. Bythe end of 2004, the Water Resources Section of the EPSD had issued about 700 suchpermits (out of a possible total in excess of 4,000). These are written in a generic form,as resources do not allow for regular testing of effluent quality etc. If pollution occursfrom a private system and there is a risk to human health, the Water Resources Section
would work closely with its colleagues in Health Protection.

8/12/2019 1843391775
http://slidepdf.com/reader/full/1843391775 160/230
Nitrate pollution on the Island of Jersey 149
b) Waste water treatment plant discharges
Earlier in this paper reference has been made to Article 17 of the Water Pollution(Jersey) Law 2000 and its concern (amongst other issues) with discharges to coastal
waters. Internationally, the flow of nitrates into coastal waters has been associated with eutrophication.One potential source of such pollution is the discharge of sewage at the coast.
Jersey’s collection, treatment and discharge of waste water are predominantly carriedout by the EPSD itself. The volume of such discharges (including stormwater) in 2004
was some 12 million cubic metres. There are two sewage treatment plants (STPs),one major plant at Bellozanne in the south of the island and a second, small satelliteplant recently commissioned on the north coast at Bonne Nuit Bay. The main plant atBellozanne consists of twoinlet 3 mm step screens, fat/grit separation at theinlet works,four primary clarifiers, an activated sludge treatment plant, 12 final clarifiers and atertiary ultraviolet disinfection system. Discharges from the two plants are regulated
within the terms and conditions of a discharge certificatethat requires regular sampling
to monitor compliance levels for the effluent leaving the works.The conditions in the discharge certificate for the Bellozanne STP are based on the
requirements of the EC’s Urban Waste Water Treatment Directive (91/271/EC) butprior to 2003 these conditions were less stringent than those set out in the Directive.The STP by the end of 2004 had undergone conversion to a ‘Pegazur’system, at a costof £7.2 million, in order to reduce nitrogen inputs into the nearby St. Aubin’s Bay inaddition to the other benefits of waste water treatment. The 2004 Jersey maximumadmissible concentrations of waste water contaminants are given in Table 16.2. From2003, the EPSD had added total nitrogen to biochemical oxygen demand, chemicaloxygen demand and suspended solids as the criteria of the quality matrix for waste
water and stormwater discharges. The total nitrogen target at Bellozanne, just north
of St. Aubin’s Bay – a favourite bathing beach – was introduced in order to reduceeutrophication. There had been limited evidence both in surface and coastal waters of eutrophication in the past with the appearance, for example, of excessive green algaeand sea lettuce in the late summer.
The JNWWC and the EPSD are by far the largest government spenders on nitratepollution management. The water utility’s costs of producing blending water werereported in section four above. With respect to the EPSD, its total budget in 2004 wasabout £500,000, of which nearly £400,000 was on staff costs. However, the proportionof this first figure that was aimed directly at nitrate management was less than 5%.
16.7 THE BENEFITS OF NITRATE POLLUTIONMANAGEMENT
Up to this point the paper’s content has embraced the processes by which nitratespollute groundwater andsurface waters, the means by which such pollution is managedby various Jersey institutions, and the costs of nitrate pollution management. Thisoverview is pulled together in Table 16.3.
The time has now come to assess the benefits of water quality management. Theoutcomes of environmental management consist in the first place of what one cancall ‘intermediate objectives’. Many specific examples spring to mind from the Jersey
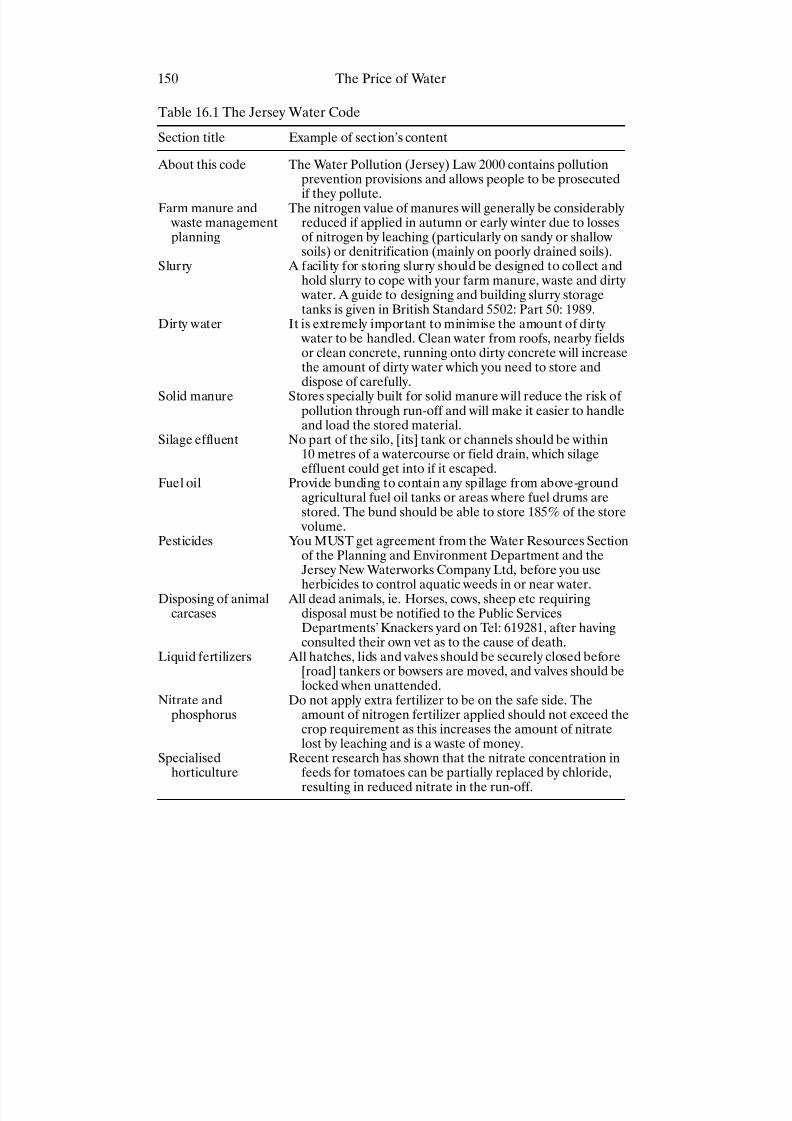
8/12/2019 1843391775
http://slidepdf.com/reader/full/1843391775 161/230
150 The Price of Water
Table 16.1 The Jersey Water Code
Section title Example of section’s content
About this code The Water Pollution (Jersey) Law 2000 contains pollution
prevention provisions and allows people to be prosecutedif they pollute.Farm manure and
waste managementplanning
The nitrogen value of manures will generally be considerablyreduced if applied in autumn or early winter due to lossesof nitrogen by leaching (particularly on sandy or shallowsoils) or denitrification (mainly on poorly drained soils).
Slurry A facility for storing slurry should be designed to collect andhold slurry to cope with your farm manure, waste and dirty
water. A guide to designing and building slurry storagetanks is given in British Standard 5502: Part 50: 1989.
Dirty water It is extremely important to minimise the amount of dirty water to be handled. Clean water from roofs, nearby fieldsor clean concrete, running onto dirty concrete will increase
the amount of dirty water which you need to store anddispose of carefully.
Solid manure Stores specially built for solid manure will reduce the risk of pollution through run-off and will make it easier to handleand load the stored material.
Silage effluent No part of the silo, [its] tank or channels should be within10 metres of a watercourse or field drain, which silageeffluent could get into if it escaped.
Fuel oil Provide bunding to contain any spillage from above-groundagricultural fuel oil tanks or areas where fuel drums arestored. The bund should be able to store 185% of the store
volume.
Pesticides You MUST get agreement from the Water Resources Sectionof the Planning and Environment Department and theJersey New Waterworks Company Ltd, before you useherbicides to control aquatic weeds in or near water.
Disposing of animalcarcases
All dead animals, ie. Horses, cows, sheep etc requiringdisposal must be notified to the Public ServicesDepartments’ Knackers yard on Tel: 619281, after havingconsulted their own vet as to the cause of death.
Liquid fertilizers All hatches, lids and valves should be securely closed before[road] tankers or bowsers are moved, and valves should belocked when unattended.
Nitrate andphosphorus
Do not apply extra fertilizer to be on the safe side. Theamount of nitrogen fertilizer applied should not exceed the
crop requirement as this increases the amount of nitratelost by leaching and is a waste of money.Specialised
horticultureRecent research has shown that the nitrate concentration in
feeds for tomatoes can be partially replaced by chloride,resulting in reduced nitrate in the run-off.

8/12/2019 1843391775
http://slidepdf.com/reader/full/1843391775 162/230
T a b l e 1 6 . 2 A q u a l i t y m a t r i x f o r t h e E P S D ’ s W a s t e w a t e r d i s c h a r g e s t o J e r s e y ’ s C o a s t a l W a t e r s i n 2 0 0 4
C o n c e n t r a t i o n
M e a s u r e
M A C
i n 2 0
0 2
M A C
i n 2 0 0 3
M A C
i n 2 0 0 4
A c t u
a l 2 0 0 4
M i n i m u m
A c t u a l 2 0 0 4
M e a n
A c t u a l 2 0 0 4
M a x i m u m
B i o c h e m i c a l o x y g e n
d e m a n d
m i l l i g r a m s p e r l i t r e
5 0
2 5
2 5
n o t a v a i l a b l e
n o t a v a i l a b l e
n o t a
v a i l a b l e
C h e m i c a l o x y g e n
d e m a n d
m i l l i g r a m s p e r l i t r e
2 5 0
1 2 5
1 2 5
n o t a v a i l a b l e
n o t a v a i l a b l e
n o t a
v a i l a b l e
S u s p e n d e d s o l i d s
m i l l i g r a m s p e r l i t r e
1 5 0
4 5
3 5
n o t a v a i l a b l e
n o t a v a i l a b l e
n o t a
v a i l a b l e
T o t a l n i t r o g e n
m i l l i g r a m s p e r l i t r e
n o n e
2 0
1 5
n o t a v a i l a b l e
n o t a v a i l a b l e
n o t a
v a i l a b l e
S o u r c e : P S D p e r s . c o m
m .

8/12/2019 1843391775
http://slidepdf.com/reader/full/1843391775 163/230
T a b l e 1 6 . 3 N i t r a t e P o l l u t i o n M a n a g e m e n t o n J e r s e y i n 2 0
0 5
P o l l u t i o n
s o u r c e
I n s t i t u t i o n a l m a n a g e r
P o l i c y i n s t r u m e n t s ( 1 )
C o s t t y p e
B e n
e f i t t y p e
J e r s e y N e w
W a t e r w o r k s
C o m p a n y
A g r i c u l t u r a l
f e r t i l i z e r s
O n e d e s a l i n a t i o n p l a n t a n d o n e
d e - n i t r i f i c a t i o
n p l a n t p r o d u c i n g b l e n d i n g
w a t e r .
I n f r a s t r u c t u r e c o s t s p l u s
m a i n t e n a n c e a n d
o p e r a t i o n .
H u m
a n h e a l t h
E n v i r o n m e n t a n d
P u b l i c S e r v i c e s
D e p a r t m e n t
A g r i c u l t u r a l
f e r t i l i z e r s
W a t e r P o l l u t i o n
( J e r s e y ) L a w 2 0 0 0 , A r t i c l e s
1 7 & 1 8 . 2 0 0 4 ‘ W a t e r C o d e ’ .
A d v i s o r y s e r v i c e s ,
m o n i t o r i n g , l e g a l
a c t i o n .
E n v i r o n m e n t a l
q u a l i t y a n d
h u m a n h e a l t h
E n v i r o n m e n t a n d
P u b l i c S e r v i c e s
D e p a r t m e n t
A g r i c u l t u r a l
f e r t i l i z e r s
‘ P e g a z u r ’ s e w a g e t r e a t m e n t p l a n t r e d u c i n g
t o t a l n i t r o g e n
i n w a s t e w a t e r d i s c h a r g e s .
I n f r a s t r u c t u r e c o s t s p l u s
m a i n t e n a n c e ,
o p e r a t i o n a n d
m o n i t o r i n g .
E n v i r o n m e n t a l
q u a l i t y .
E n v i r o n m e n t a n d
P u b l i c S e r v i c e s
D e p a r t m e n t
U n s e w e r e d
d o m e s t i c
p r o p e r t i e s
W a t e r P o l l u t i o n
( J e r s e y ) L a w 2 0 0 0 .
D i s c h a r g e p e r m i t s w h e r e d e e m e d
a p p r o p r i a t e .
M o n i t o r i n g .
E n v i r o n m e n t a l
q u a l i t y a n d
h u m a n h e a l t h
D e p a r t m e n t o f
E n v i r o n m e n t a l
H e a l t h
A g r i c u l t u r a l
f e r t i l i z e r s
M o n i t o r i n g o f d
o m e s t i c w e l l s a n d b o r e h o l e s
o n r e q u e s t . I n
a d d i t i o n , h o u s e h o l d s i n s t a l l
w a t e r t r e a t m e
n t s y s t e m s .
M o n i t o r i n g p l u s
h o u s e h o l d
e x p e n d i t u r e o n
t r e a t m e n t s y s t e m s .
H u m
a n h e a l t h
1 . N o t e t h a t t h e s e i n s t r u m e n
t s f a l l i n t o t h r e e c a t e g o r i e s o n l y : r
e g u l a t o r y , i n f r a s t r u c t u r a l , a n d p r o g r a m m e s o f f r i e n d l y p e r s u a s i o n . N o e c o n o m i c
i n s t r u m e n t s a r e u s e d t h a t m
i g h t r e d u c e n i t r a t e f e r t i l i z e r u s e
, s u c h a s a t a x o n i m p o r t e d f e r t i l i z e r s . T h e t r a d i t i o n a l p o l i t i c a l s t r e n g t h o f t h e
f a r m e r l o b b y w o u l d h a v e m a d e t h i s d i f f i c u l t t o r e c e i v e a p p r o v
a l b y t h e I s l a n d ’ s l e g i s l a t i v e b o d i e s . F i n a l l y , w a t e r p r i c i n g i n t h e h o u s e h o l d s e c t o r
w o u l d r e d u c e f a m i l i e s ’ w a t e
r u s e , f o r e x a m p l e o n g a r d e n i n g ,
a n d t h e r e f o r e r e d u c e t h e n e e d f o
r b l e n d i n g w a t e r p r o d u c t i o n .

8/12/2019 1843391775
http://slidepdf.com/reader/full/1843391775 164/230
Nitrate pollution on the Island of Jersey 153
case-study. The Department of Agriculture and Fisheries’ efforts leads to the con-struction of more facilities for storing slurry that are based on British Standard 5502(see Table 16.1). The Jersey New Waterworks Company reduces the nitrate content of the water supply by blending in the desalinated water output of La Rosiere. A Depart-ment of Environmental Health’stest identifies nitrate pollution of a family well and thehousehold ceases to use it for drinking water and for cooking. The Environment andPublic Services Department’smonitoring programme leads to the repair of a defectiveseptic tank and the same Department’sconversion of the Bellozanne sewagetreatment
works to the Pegazur system reduces total nitrogen inputs into St. Aubin’s Bay.But there is no sense in shouldering the economic costs of water quality manage-
ment for its own sake. Intermediate objectives, from the micro-scale of a repairedseptic tank through to the macro-scale of reducing total nitrogen inputs to the sea,are nothing more than means to an end. That end we can call ‘final benefits’. Thefinal benefits of water quality management are three-fold: enhanced environmentalquality, improved human health, and any additional economic benefits not covered bythe health and environment categories. We shall consider these three benefit groups
in turn with specific reference to the management and reduction of nitrogen pollutionof the controlled waters of Jersey, i.e. the territorial sea adjacent to the Island as wellas its coastal waters, inland waters and ground waters. In the case of neither the envi-ronmental nor the human health benefits have we assigned them monetary values.This is because such estimates require the use of contingent value surveys, which weconsider invalid for reasons expressed at length in other publications (see Merrett1997: 168-175 and paper 14).
Environmental benefits
First, the lower nitrate content of groundwater and of streamflow is considered by
ecologists to have benefits in terms of providing increased bio-diversity for all formsof aquatic life. The delivery of these benefits, specifically with respect to macro-invertebrates, has been strongly supported by the work of Langley and Kett (2005).Secondly, the production of desalinated seawater reduces the necessary volumesabstracted from the island’sground and surface waters, thereby increasing streamflow,especially in the summer’slow-flow conditions. However, Merrett’s work suggests thatover a full year desalination output is considerably less than 10 per cent of the total
water supply (See paper 3, Table 3.3). We have already seen that in 2004 there wasno desalination output. Thirdly, the reduced flow of nitrates to inland and coastal
water has reduced eutrophication, both in the Island’sstreams as well as in the bathing waters of St. Aubin’s Bay. Specific future research to assess these benefits in their
own terms, rather than via money values, will help the people of Jersey understandbetter the advantages of the measures taken to reduce nitrate pollution. <anchorrole=”section” id=”c01c01” label=””/>
Human health benefits
Our focus here is the likely human health benefits of Jersey’s attempts to improvedrinking water quality by cutting the maximum permitted nitrate level in such waterfrom 100 mg/l to 50 mg/l.

8/12/2019 1843391775
http://slidepdf.com/reader/full/1843391775 165/230
154 The Price of Water
The general position is that a high concentration of nitrate in the diet is linkedto methaemoglobinemia in babies under six months and to stomach cancer in adults(Lott et al. 1999: 7–9). No such link exists where the concentration is low. It is neverargued that nitrate should be completely excluded from our diets. For example, theconsumption of vegetables is a source of nitrate in the human diet, as is drinking water.It is necessary, therefore, that public health legislation secures a country’s populationfrom the ingestion of NO3 only at concentrations that endanger health. Such legisla-tion requires in its turn a definition of the maximum admissible concentration in thedrinking water supply.
We have already seen in section 2 above that the MAC of nitrate in drinking water was originally set by the WHO in 1970 at an acceptable level of 100 mg/l butthat EC legislation in 1980 reduced that level to 50 mg/l. In section 4 it is notedthat Jersey has been under no legal requirement to comply with this standard andhas struggled to do so. Only by 2008 at the earliest is it likely that Jersey will beable to fully comply with the 50 mg/l standard. Excluding waste water discharges,all the costs of nitrate pollution management in the last 25 years have been politi-
cally driven by the EC’s 1980 shift to a lower acceptable level of nitrates in drinking water.
Once again, we need to ask: what have been the consequential health benefits of the shift from 100 mg/l to 50 mg/l? In fact medical experts in the UK were askedto address this specific issue. A Joint Committee on the Medical Aspects of WaterQuality appointed by the Department of the Environment and the Department of Health and Social Services stated that ‘There is no compelling evidence to suggestthat significant risks to health are encountered when water containing between 50 and100 mg/l nitrate is supplied to the public’ (Gass et al. 1996: 35-36; JNWWC 2002: 29;Robins 2000: 15-17). If the Joint Committee’s views are still a true reflection of theepidemiological evidence, then there have been no health benefits from the shift froma 100 mg/l standard to a 50 mg/l standard.
What is striking about the standard shift in 1980 from 100 units to 50 units is thatthe level was simply halved. Our working hypothesis is that the persons responsiblefor changing the standard had no clear evidence for change and that it was the pre-cautionary principle that drove the decision rather than scientific research. O’Riordan(1995: 9) suggests that at its simplest the concept of precaution has four meanings. Therelevant meaning here is: ‘Thoughtful action in advance of scientific proof of causeand effect based on the principles of wise management and cost effectiveness, namelybetter to pay a little now than possibly an awful lot later. In this sense, precaution is areceipt for action over inaction where there is a reasonable threat of irreversibility orof serious damage to life-support systems.’ But in the case of the 1980 standard shift,thoughtful action based on scientific evidence had already been taken prior to 1980
and the shift itself entailed paying ‘an awful lot’ earlier as against not paying it at all.The only benefit of the shift that is absolutely clear is the growth in the productionand sales of the water treatment and bottled water industries.
In fact, epidemiological evidence on the standard shift is possible to collect andanalyse in Jersey. We have seen that about 15% of the population are off the mainssupply and therefore access tap water from sources that are completely untreated.Even if treated, these supplies have none of their nitrate content removed (see section5). Here is potential evidence for any possible links between ill-health and nitratestandards in excess of the 50 mg/l prescription. But at the end of 2003, the ‘threat’ was

8/12/2019 1843391775
http://slidepdf.com/reader/full/1843391775 166/230
Nitrate pollution on the Island of Jersey 155
considered to be so slight that the Department of Environmental Health terminatedits routine sampling of wells’ and boreholes’ nitrate levels.
Economic benefits
An active (and well-publicised) role of the States of Jersey in environmental protectionmight have some additional economic benefits to the Island by securing greater touristnumbers than would otherwise be the case. In fact, Jersey – because of the nitrate indrinking water issue – has had a bad press in the last two decades in this respect. No-one knows or ever will know how much greater (if any) tourist numbers would havebeen in the absence of this critical coverage in the media. In any case, a reduction intourism on Jersey would have brought an increase in tourism elsewhere, on Guernseyfor example, with no net benefit to tourists or the European tourism industry.
16.8 CONCLUSIONS
The paper’s objectives were first, to review the anthropogenic processes by which theIsland of Jersey’s waters have been polluted by nitrates over a broad span of time and secondly, to assess the costs and benefits of the institutional management of nitratepollution within a framework ultimately shaped by the European Community.
On an island where potatoes and dairy farming have been historically dominant,Jersey has in the past suffered from perennially high nitrate levels in all its waterbodies, a syndrome exacerbated by soil, geology, climate, cropping and farming prac-tices, especially excessive fertiliser use. A minor addition to the nitrate load originates
from rural, unsewered dwellings. Nitrate pollution of water bodies, above certain lev-els, undoubtedly creates potential threats to human health as well as environmentaleutrophication.
The management of nitrate pollution on the Island in 2005 is principally the respon-sibility of two institutions. These are the Jersey New Waterworks Company Ltd. andthe Environment and Public Services Department. With respect to the role of theJNWWC, the water utility in which the States of Jersey have a majority shareholding,the States in 2005 permits up to 33% of its annual samples of distributed water toexceed the 50 mg/l MAC provided they are less than 70 mg/l. The utility can reducethe nitrate content of its abstracted water by blending in desalinated water, which has anear-zero nitrate content. The Island’sfirst desalination plant was installed in 1970 todeal with drought years, especially in the summer months when the tourist population
is high. In 1997 the old plant was demolished and replaced with a Reverse Osmo-sis plant with a capacity of 6000 m3 /day, using electrical pumping energy. Since thedesalination plant is required for drought conditions, the supply of water for blendingpurposes can be costed simply on its use of consumables (mainly electric power at acost per cubic metre of 33p), a little more than double the average total cost of the mainsurface water supplies and substantially more than the marginal cost of surface water.By 2004 the redefinition of the required nitrate standard and the successes of nitratepollution management in the farm sector resulted in no requirement for desalinated
water’s use in blending, which now may become a thing of the past.

8/12/2019 1843391775
http://slidepdf.com/reader/full/1843391775 167/230
156 The Price of Water
The JNWWC also operates a 2,000 m3 /day denitrification plant on the north-westof the Island where some of the highest nitrate concentrations in stream water areto be found. It is unclear to the authors of this paper why this plant was built. Thebasis was either to add a new surface water source to the utility’s abstraction choices or it was to provide a second source of nitrate-free water for blending purposes. Theplant’soverhead costs are about £330/day but the marginal costs are only 10 pence percubic metre. For the year 2004 its average daily output was not available to us but wasprobably lowandthereforeits average total cost percubic metre would have been high.
With respect to the agricultural role of the EPSD, it is the Water Pollution (Jersey)Law 2000 that makes it an offence to cause or knowingly permit pollution of controlled
waters. In case of prosecution, a farmer can defend himself by showing due diligenceunder the 2004 Code of Good Agricultural Practice for the Protection of Water. TheWater Pollution Law and the Water Code together provide the States of Jersey withteeth in reducing agricultural pollution. By 2005 there was a growing body of evidencethat the EPSD (and the Department of Agriculture and Fisheries prior to 2004) were
winning the war against nitrate pollution with the stick of the Water Pollution Law
and the carrot of environmental education and friendly persuasion. At the same time,changes in the management of farms and in the size of the potato crop were havingpositive effects in reducing diffuse nitrate pollution.
The Environment and Public Services Department also monitors septic tanks, tighttanks, soakaways and private sewage treatment plants. These provide only a smallproportion of the Island’snitrate pollution. In addition, the Department is responsiblefor the waste water treatment plants at Bellozanne and at Bonne Nuit Bay. Since 2003,the Bellozanne plant has been converted to the ‘Pegazur’ system in order to reducethe total nitrogen content of discharges into St.Aubin’sBay to a maximum admissibleconcentration of 15 mg/l. The impact on coastal eutrophication has been positive.
Having reviewed the costs of nitrogen pollution management, the paper moves on
to the benefits of such management. A distinction is drawn between the intermediateobjectives of water quality management and its final benefits. The latter compriseenhanced environmental quality, improved human health, and any additional eco-nomic benefits not covered by the health and environment categories.
Taking these in reverse order,there is no evidence that nitrogen pollution of Jersey’scontrolled waters has reduced its tourism income, although such a reduction may haveexisted in the past – to the economic advantage of other tourism centres.
With respect to human health benefits we should note that the Island’s judicialsystems areindependent of the English courts and at no time has Jerseybeen subjectedto the administrative systems of the United Kingdom government or the EuropeanCommunity. However, the Island’s government has taken a series of actions since1980 to bring Jersey into line with the EC’s reduction of the maximum admissible
concentration of nitrate in drinking water from 100 mg/l to 50 mg/l, that is, 50 partsper million. However, a UK Joint Committee on the Medical Aspects of Water Qualityhas reported that there is no compelling evidence of significant risks to human health
when water containing between 50 and 100 mg/l nitrate is supplied to the public. If theJoint Committee’sviews are still a true reflection of the epidemiologicalevidence,thenthere have been no human health benefits from the shift from a 100 mg/l standardto a 50 mg/l standard in Jersey or anywhere else. In that case, the only financialbeneficiaries of these unwarranted costs have been the water engineering and bottled
water industries.

8/12/2019 1843391775
http://slidepdf.com/reader/full/1843391775 168/230
Nitrate pollution on the Island of Jersey 157
With respect to enhanced environmental quality, therate of reproduction of macro-invertebrate populations has already been referred to; indeed it is used as a measure of
water quality. Secondly, the production of desalinated seawater – when it takes place –modestly reduces the necessary volumes abstracted from the island’s ground and sur-face waters, increasing streamflow. Thirdly, the reduced flow of nitrates to inland andcoastal waters has reduced eutrophication and its green algae and sea lettuce man-ifestations. No estimates in money terms have been made of these certain benefits,nor do the authors consider such estimates useful. However, a systematic record of the environmental advantages of nitrate pollution management may be considered
valuable in showing the citizens of Jersey what benefits arise from the management of nitrate pollution.
* The authors are grateful to Gerry Jackson (EPSD), Iain Norris (EPSD),Howard Snowden (JNWWC) and Dr Duncan Nicholson (Department of Environmental Health) for detailed discussion with us in the course of prepar-
ing this paper.

8/12/2019 1843391775
http://slidepdf.com/reader/full/1843391775 169/230
Catchment water deficits in thetwenty-first century
Ye can discern the face of the sky; but can ye not discern the signs of the times?
St Matthew ch. 16, v. 3
The objective of this paper is to provide a general theory of the manner in which the
water resources of a catchment shift from surplus to deficit, and the means by which water resource institutions can manage or reverse this shift. The text requires theclarification of some key concepts and this is done as the argument proceeds. Notethat ‘catchment’ and ‘river basin’ are used interchangeably. The term ‘ watershed’ isavoided because it has rival and inconsistent definitions.
The broad hydrological framework here is perfectly conventional. Total precipita-tion in a catchment, where the principal river flows to the ocean, is consumed in partas evapotranspiration; the residual is referred to as effective precipitation. This latterflow recharges the basin’s aquifers, the boundaries of which fall within the catchment.Effective precipitation also sources run-off, most strikingly in the case of the mainriver itself. The aquifers supply base-flow to the river system as well as discharging assprings. Finally, both surface water and groundwater discharge at the coast.
flows. Outstream water is that which is abstracted by human society from lakes, rivers
ply and use may have negative as well as positive entries. Total net supply is mathemat-ically identical to total use; this is empirically confirmed only if all the supply and useentries are comprehensively assessed and accurately measured. The evapotranspirationof outstream (or instream) water is hereafter referred to as water consumption.
The broad hydrosocial framework is set out in Table 17.1. It represents only outstream
and aquifers, to be stored and channelled for human use. As Table 17.1 shows, both sup-
17
17.1 INTRODUCTION
158
C 2007 IWA Publishing. ThePrice of Water: Studies in Water ResourceEconomicsand Management
2nd Edition by Stephen Merrett. ISBN: 9781843391777. Published by IWA Publishing, London, UK.

8/12/2019 1843391775
http://slidepdf.com/reader/full/1843391775 170/230
It has already been stated that the paper addresses river basin surpluses anddeficits. Therefore, these two concepts require definition. A catchment water surplusis a situation in which, throughout the course of a specified year, total precipitation inthe basin is suf ficient to simultaneously satisfy four conditions:
1. Abstraction from the aquifer is maintained at a sustainable rate.2. Outstream water fully meets the economic demand for water from households,
agriculture, mining, manufacturing, construction and the services sectors.
Row Title Base year volumes
4 Categories of Supply (Positive)
5 Rainwater collection a6 Groundwater abstraction b7 Surface water abstraction c8 Desalination of sea water d9 Imports of water from other areas e
10 Internal reuse of wastewater f 11 External reuse of wastewater g12 Net fall in water abstracted and stored h13 Total Supply i1415 Categories of Supply (Negative)16 Supply-side evapotranspiration losses j
17 Supply-side leakage k18 Exports of water to other regions l19 Net rise in water abstracted and stored m20 Total Negative Values (Supply) n2122 Total Net Supply in2324 Categories of Use (Positive)25 Households o26 Agriculture, including irrigation requirements p27 Mining q28 Manufacturing r29 Construction s
30 Public services t31 Private services u32 Other uses v33 Total Use w 3435 Categories of Use (Negative)36 Evaporation losses on users’ properties x 37 Leakage on users’ properties y38 Total Negative Values (Use) z3940 Total Net Use w z
Source: Adapted from Merrett (2002a) Table 7.1.
Table 17.1 A catchment’s hydrosocial balance.

8/12/2019 1843391775
http://slidepdf.com/reader/full/1843391775 171/230

8/12/2019 1843391775
http://slidepdf.com/reader/full/1843391775 172/230
It has already been seen that the catchment’s population is increasing. Output percapita is also rising. This combination of growth both in population and economicproductivity, associated with the rise of world capitalism, is the source of deep uneaseamongst the professional staff of the Dwyer Catchment Authority. The Authority has
mate the catchment’s economic output in 2025. After assuming that the ratio of out-stream water use to basin output is constant, the Authority also has a derived
The Authority anticipates that, for the first time in its history, the catchment will
move into a water deficit; one or more of the four necessary conditions for surplus will have been breached.
The Dwyer Catchment Authority responds by considering and starting to implementredemptive options that moderate the situation but that do not prevent entry into water
de fi cit. There are six such adaptive measures.The first option is to amend the 1847 Act so as to lower the measure of environ-
mental needs below the 33% floor. The decline in environmental flow (and the eco-logical and economic effects that ensue) is accepted by the catchment authority (if not by the environmental movement) as ‘a price worth paying’ to maintain the growthof population, economic productivity and total output.
The second option is to promote the reuse of abstracted water as a means to cutthe rate of abstraction. Reuse can take place within a single institution (such as asugarmill) or it can occur between institutions as when urban waste water is reusedfor irrigation purposes. Reuse may have real advantages, such as lowering abstractioncosts or by reducing waste water treatment costs. But there is no reason to believethat reuse reduces the consumption of water supplied to and used by households,firms, etc. One can take a small sugar mill as an example. In the absence of reuse it
Rate of growth of population in per cent per year
Rate of growth of output 0 1 2 3 4 5
per head in per cent per year
0 1.000 1.010 1.020 1.030 1.040 1.0501 1.010 1.020 1.030 1.040 1.050 1.0612 1.020 1.030 1.040 1.051 1.061 1.0713 1.030 1.040 1.051 1.061 1.071 1.0824 1.040 1.050 1.061 1.071 1.082 1.0925 1.050 1.061 1.071 1.082 1.092 1.103
Note: The statistics above, lying between 1.000 and 1.103, can be used as multipliers to showhow output changes between any two successive years. The decimals give the rate of change of output. For example, 1.051 implies a rise of 5.1 per cent in output between any two years. Atthis rate of growth, output would double in 14 years.
Table 17.2 Population, productivity and output change over time.
used Table 17.2, and data from the Ministry of the Economy and Population, to esti-
estimate of total water use in 2025 (row 33 of Table 17.1 for the scenario year 2025).
17.3 REDEMPTIVE OPTIONS (I)

8/12/2019 1843391775
http://slidepdf.com/reader/full/1843391775 173/230
abstracts 1000m3 per week, 150m3 of which is consumed in evaporative losses leaving850m3 returned to the river. In the case of reuse only 500m3 are abstracted onMonday and by Wednesday 75 m3 are consumed and replaced from storage. BySaturday the reuse stage is complete and a further 75m3 consumed, once again to be
replaced from storage. The reuse option has abstracted less than in the absence of reuse (650m3 including storage recharge), but there is no difference in total con-sumption. Since reuse has not brought with it a fall in consumption it has not servedto protect the instream flow.
The third option is rainwater harvesting. These projects can be successful at thelocal level; they are specific forms of water capture closely related to surface waterabstraction. As with reuse, there is no fall in consumption and no protection of theinstream flow.
The fourth option is to import water from another catchment. This permits thesustainable management of the Basin’s aquifers, suf ficient outstream supply to matchthe economic demand for water, satisfaction of the economic demand for food andcontinued protection of the Dwyer’s environmental flows.
The fifth option is the desalination of sea water and other saline waters. Thepower requirements are considerable but recent falls in the factory-gate price percubic metre make this option an interesting one for the Dwyer Catchment Authority.The use of sea water itself, requiring dual supply infrastructures, is also of interest tothe Authority in some sectors. Hong Kong sets an example in this respect.
The last of the six options that the Authority may take to win hearts and minds asthe entry to water deficit begins is to import food. This permits administrative or legalrestrictions on the scale of irrigated agriculture such that there is now suf ficient waterfor all other economic demands. A beneficial allocation multiplier exists here. If wateruse for irrigation and for urban purposes divides in the ratio 70:30 (Shiklomanov 2000:Table 5), then a 15% transfer of agriculture’s total creates a 35% increase in the urban
total. The consumption multiplier is even greater. If, water consumption by the irriga-tion sector and the urban sectors divides in the ratio 93:7 (ibid.), then a mere 5% transferof agriculture’s total permits a 66% increase in the urban total.
Each of these six options above needs to be reviewed. The first redemptive optionreduces environmental flows below what had been considered the minimum accept-
welcomed on economic grounds but makes no contribution whatsoever to defendingthe basin’s water surplus. Nor does the third option. The fourth measure placesreliance on the precipitation of other catchments rather than precipitation in theDwyer River Basin. Parallels spring to mind with Israeli pumping of Lake Tiberias, theplans to divert water from the Ebro River to south-east Spain, and the south–northtransfer in China (Pearce 2003). The fifth measure is noteworthy but, like option four,only compensates for a shortfall in the Dwyer’s precipitation. The sixth option is inbreach of condition 2 for water surplus. Moreover, if the basin’s exports are insuf fi-cient to finance food imports, condition 3 is breached. The Dwyer places reliance onother catchments’ food production and, indirectly, their precipitation.
It is worth noting that the argument above relies (implicitly) on a distinctionbetween the terms ‘reuse’ and ‘recycling’. Reused water is waste water and irrigationdrainage that, prior to its return to the hydrological resource, is captured and used again
Recycling refers to water that is abstracted, on the supply side of the hydrosocialbalance, used by households, industry etc., and then the fraction that is not consumed
able, breaching condition 4 for water surplus (see Section 17.1). The second option is
(perhaps repeatedly) for the uses listed in Table 17.1.

8/12/2019 1843391775
http://slidepdf.com/reader/full/1843391775 174/230
flows directly back to the catchment’s rivers, aquifers and lakes. The importance of recycling to hydroeconomists is that it augments the hydrological resource from thepoint at which the recycling occurs. The negative characteristic is that recycled flowsmay pollute the resource. The proportion of water used that is consumed, and there-
fore is unavailable for recycling, varies between categories of use. Therefore the rela-
for a given volume of use. The example above of the beneficial multiplier illustrates this.
The Catchment Authority continues by considering redemptive options that do pre- vent entry into water deficit. Once again, there are six such adaptive measures. Theyare numbered 7–12 to maintain continuity with redemptive options (I).
The seventh option is to reduce the rate of growth of population. Other things
being equal, this will reduce the rate of growth of output and thereby the rate of growth in outstream water use. A fall in demographic increase within the DwyerRiver Basin would be achievable if its women become more powerful in the determi-nation of the number of children conceived, if access to contraception is facilitated, if social provision for elderly persons is strengthened, and if limits are placed on netinward migration. China’s population policy since 1949 has contributed enormouslyto the impact its society has on the available water resource, in comparison with thepopulation totals it would now have in the absence of that policy.
The eighth option is to reduce the rate of growth in output per person and therebythe rate of growth in output and outstream water use. In the Dwyer River Basin this would be dif ficult to defend because there is extensive poverty in the catchment.
In basins with higher per capita incomes it would require a fundamental change incultural values and economic organization, a farewell to capitalism’s relentless searchfor output growth founded on market expansion.
In the case of options seven and eight one sees that these require action thatclearly falls outside the field of water resources management. But this is not true of our final four options. The ninth adaptive measure is to increase outstream water’sproductivity in terms of value-added (in US$) per cubic metre of water consumed. Itis consumption, not use, which reduces the volumetric flow of the Dwyer. Water prod-uctivity augmentation is a subject of discussion, research and implementationthroughout the catchment with respect to all the outstream users. The greater is water’s productivity, the lower the volume of water consumed for any given level of future output. It has already been seen above that at the global scale 93% of all con-sumption of water withdrawals takes place within the irrigated sector. In the DwyerCatchment it is irrigation yields (in terms of output per hectare, output per cubicmetre of water used and output per cubic metre of water consumed) that are con-sidered as the key variables in respect of option nine. The positive link between foodprices and crop yields is of especial interest (Berkoff 2003).
The tenth option relates to the economic demand for water use under condition 2for water surplus. The economic demand for water is analysed by economists as afunctional relationship between the price of water (money charged per unit volume)and the total volume users wish to purchase at that price. A higher price is usuallyassociated with a lower volume purchased. If it is possible to extend water pricing in
tive shift of use between Table 17.1’s categories of use will change water consumption
17.4 REDEMPTIVE OPTIONS (II)

8/12/2019 1843391775
http://slidepdf.com/reader/full/1843391775 175/230
the Dwyer River Basin as well as to raise the current level of prices, then the volumeof water purchased by households, farmers, companies and other institutions willdiminish.
Differential pricing for users that recycle a high proportion of their supply helps
reduce water consumption. The introduction of pricing, particularly in the irrigationsector, can be immensely dif ficult (Merrett 2002b). A subsidiary arrangement underoption ten is to facilitate an urban market in farmers’ water-rights, taking advantageof the allocation multiplier.
A positive spin-off from pricing is the stimulus it gives to higher water productivity. A negative spin-off would be a contraction of irrigation output leading to foodimports that the Dwyer population is unable to finance out of non-farm exports.Water pricing can also be deployed to moderate abstraction and use on a seasonalbasis; this can be of value when precipitation, evaporation and river flows varystrongly during the course of the year, as is the case with the Dwyer catchment.
The eleventh option is to reduce the evaporation from dams and reservoirs. A deep dam has an advantage here over several shallow dams with the same total
storage capacity. Artificial aquifer recharge, substituting for surface storage, is of great relevance in those areas of the Dwyer River Basin where the rate of evapor-ation is high because of heat, wind and low humidity.
The twelfth and last option, for society as a whole, is to establish water resourceinstitutions (public, private and cooperative) that have an effective leadership, areproperly resourced, of considerable expertise, strongly committed to the agenda of asustainable society and, in the case of the Dwyer Catchment Authority, with the neces-sary regulatory powers (Abernethy 2003; Merrett 1997: 143–62).
At this point it is necessary to consider whether or not it is important that one catch-ment is in deficit and whether or not it is of any significance that a second catchmentis moving from water surplus towards water deficit. The issue can be approached byre-stating the implications for a river basin of finding itself in water deficit. These areone or all of the following:
1. The basin is pumping its groundwater at an unsustainable rate.2. There is insuf ficient outstream water to meet economic demand.3. The population has to import water, or food that it is unable to pay for from its
exports of goods and services.
4. The basin’s citizens must accept the economic and environmental losses follow-ing from its river diminishing in volume.
The nightmare scenario is a basin in which groundwater is being exhausted, house-holds, farmers and other actors cannot purchase the water they require, food importscannot be paid for, making the basin dependent on powerful allies, and the river hasbeen destroyed.
Consider too the global catchment – the set of all the world’s river basins. As the world’s population increases from six billions in 1999 to some eight billions in about2025, and as world economic growth maintains an even higher rate of expansion, is itnot the case that the global catchment itself, whilst still in surplus, will embrace ever
17.5 FROM SURPLUS TO DEFICIT

8/12/2019 1843391775
http://slidepdf.com/reader/full/1843391775 176/230
more individual river basins that are in deficit? As the global catchment’s surplusdiminishes, will not the situation of specific catchments in deficit become ever moreprecarious? Moreover, since water flows uphill to wealth and power, will not thesocial classes that have neither wealth nor power feel these deficits most intensely?
It is this prospect that is the basis of the importance of water deficits and the signifi-cance of the shift of river basins from water surplus to deficit (Lundqvist 1998).
It may be that this approach to catchment deficits and surpluses will be of interest tothe international community of researchers working on water resources and theirmanagement. If that is so, the analytic framework requires testable hypotheses. The general hypothesis is: ‘Catchment X is in water deficit’, where ‘Catchment X’ is thespecific river basin to be researched.
To test the general hypothesis, the most basic information on the catchment that isrequired for a catchment in a specific year is:
• Total precipitation.
• Effective precipitation.
• Net precipitation.
• The sustainable rate of abstraction of groundwater.
• The actual rate of abstraction of groundwater.
• The performance of water suppliers in meeting the economic demand for waterfrom households, agriculture, mining, manufacturing, construction and the ser- vices sectors. The hydrosocial balance of the catchment will prove useful here.
•The ability of consumers to exercise their economic demand for food. Where such
food is imported, are these imports purchased at the international market priceand is this financed from the catchment’s foreign exchange earnings?
• The quantitative flow of the river at the point of measurement of its discharge tothe ocean.
• A statement of the defined minima for the river’s instream flows and the actualflows that correspond to these environmental standards. If no environmental stand-ards are in place, the Dwyer’s one-third rule may be used as a substitute.
In the light of this information, if the four conditions for water surplus of sectionone are met, and if this is possible without reliance on desalination or water imports,then the general hypothesis is falsified and the catchment is in surplus. If not all fourconditions are met, but only as a consequence of water exports, the catchment againis in surplus, although it may suffer the symptoms of deficit. The Jordan River Basinmay be an example.
Where the general hypothesis is veri fi ed, an appraisal of redemptive options 7–12is overdue. Where a catchment is in deficit, one can hypothesize that, in comparison with basins in surplus, net precipitation per head is low, or output per head is high or water productivity is low – the causal hypothesis.
Finally, if a number of Ph.D. students, professional researchers and institutionsadopt this approach, test the hypotheses and appraise the redemptive options, asplendid panorama opens for interchange in respect of framework, theory, andempirical studies.
17.6 FRAMEWORK, THEORY AND EMPIRICAL STUDIES

8/12/2019 1843391775
http://slidepdf.com/reader/full/1843391775 177/230
The paper introduces the concepts of catchment water surplus and catchment waterdeficit. It describes how a shift from surplus to deficit can take place as population
and output per head in the catchment increase. Twelve redemptive water policyoptions to manage or halt this shift are set out and the significance of such shifts atthe global scale are considered. The paper ends by formulating two testable hypoth-eses derived from the general theory and invites professional colleagues to pursue, within this paradigm, investigations of specific river basins.
17.7 CONCLUSION
The material in this chapter originally appeared in the journal Water Policy, Volume 7, Number–2, 2005: pp. 141 149.

8/12/2019 1843391775
http://slidepdf.com/reader/full/1843391775 178/230
18
Catchment water deficits: anapplication to Zambia’s Kafue
river basin
18.1 INTRODUCTION: THE GENERAL HYPOTHESIS
In paper 17 above I proposed that the quantitative sufficiency of water in any given
river basin can be expressed as a ‘catchment water surplus’. This is a situation in which,throughout the course of a specified year, total precipitation in the basin simultane-ously satisfies four conditions:
1. Abstraction from the catchment’s aquifers is maintained at a sustainable rate.2. Outstream water fully meets the economic demand for water from households,
agriculture, mining, manufacturing, construction and the services sectors.3. The basin population’s economic demand for food is fully met from the domestic
rainfed and irrigation sectors, domestic fisheries and food imports financed by thebasin’s exports.
4. The river’s instream flows do not fall below defined minima.
In brief, the catchment’s precipitation is sufficient to meet the river’s environmental
needs, for groundwater to be pumped at a sustainable rate, for the economic demandfor water to be satisfied and for the population’s food requirements to be met.
Where one or more of these conditions is not met, we have a ‘catchment waterdeficit’. Paper 17 then continues by setting out 12 redemptive options that eithermoderate the situation of deficit basins or that forestall the entry into water deficit.The paper concludes by setting out two hypotheses, calling for networked internationalresearch in testing them. The general hypothesis for any basin is that ‘catchment X is
C 2007 IWA Publishing. ThePriceof Water: Studies in Water ResourceEconomicsand Management
2nd Edition by Stephen Merrett. ISBN: 9781843391777. Published by IWA Publishing, London, UK.
167

8/12/2019 1843391775
http://slidepdf.com/reader/full/1843391775 179/230
168 The Price of Water
in water deficit’ and the causal hypothesis is that deficit catchments are characterizedby low precipitation per head, high output per head and low water productivity. Withrespect to the general hypothesis, it is shown to be verified – the catchment is in waterdeficit – if any one or more of the four conditions listed above is breached.
Some time ago, the author was given access by Scott Wilson Piesold, a Britishengineering firm, to its exhaustive study of the Kafue River Basin (Scott Wilson Piesold2003). This Report had not, of course, been prepared in order to test the general andcausal hypotheses referred to in above. For example, the Report investigates not theZambezi River but one of its immense tributaries, the Kafue. Moreover, Scott WilsonPiesold’s work is primarily directed at environmental issues. However, their researchranges so extensively that it seemed likely that it could, indeed, be used in a preliminaryinvestigation of both catchment water deficit hypotheses. Moreover, an initial desk-based study, with the insights and puzzles it was likely to deliver, would also helpstructure future field research into other catchments. The appendix to this paper setsout the questions the author now believes are most useful as the starting point in anystudy of catchment water deficits and their drivers.
18.2 THE KAFUE RIVER BASIN
The Kafue River Basin is located entirely in Zambia in Africa (see Figure 18.1). It hasan area of 157,000 km2 and its length is 1,300 km. At its junction with the Zambezi itsdischarge is approximately 300 m3 /second. The Basin is conventionally divided intofour regions: the Upper Kafue, the Middle Kafue, Kafue Flats, and the Lower Kafue.The Basin has a tropical climate with two distinct seasons: a wet season betweenNovember and March and a dry season between April and October. At the end of the wet season humidity is 75% and at the end of the dry season it is 45%. Mean
daily temperatures vary from 13◦
and 20◦
Centigrade in July and between 21◦
and30◦ in November. Sunshine hours during the dry season are 13 hours per day and are7 hours per day in the wet season. The long-term average precipitation is 1,057 mm.Pan evaporation varies between 1900 mm and 2200 mm during the year. Effectiveprecipitation is 53 mm (Scott Wilson Piesold 2003, Table 3.7).
In respect of groundwater, the best aquifers are associated with i) limestone for-mations around Lusaka and at locations in the Upper Kafue, including Mpongwe,and ii) the alluvial sands and gravels of the Kafue Flats, Lukanga Swamps, and theNanzhila, Lufupa and Luswishi rivers. Groundwater potential is reported as a depthper unit area as follows: Upper Kafue 85 mm/y, Middle Kafue 75 mm/y, Kafue Flats70 mm/y, Lower Kafue 55 mm/y. Groundwater is deemed private. Water abstractionis predominantly of surface water, although there is some groundwater abstraction
for irrigation and rural domestic water supplies. Pumping water from mines for dewa-tering purposes takes place on a large scale, in order to facilitate copper produc-tion. One of the Kafue Basin’s copper mines is said to be the wettest mine in the
world.In respect of surface water, the immense discharge at the Zambezi of 300 m3 /second
is very much less than total rainfall. This is because of evaporation and transpirationfrom areas of impeded drainage and groundwater seepage zones, and because of highsolar radiation in Zambia. Amongst the flood plains, swamps and marshy areas, KafueFlats and Lukanga Swamps are the most significant. The Kafue Flats extend from

8/12/2019 1843391775
http://slidepdf.com/reader/full/1843391775 180/230
Catchment water deficits 169
Upper Kafue
Middle Kafue
Kafue
Kafue Flats
Lusaka
Mazabuka
Lake Kariba
K a f u e R i ver
Z a m b
e z i R
i v e r
25° E
25° E 26° E 27° E 28° E 29° E
26° E 27° E 28° E 29° E
12° S
13° S
14° S
15° S
16° S
12° S
13° S
14° S
15° S
16° S
Scale 1 : 3 000 000
0 1209040km
N
LukangaSwamp
Kafue Gorge
Kafue Flats
Itezhi-Tezhi
Mpongwe
Map 1: The Kafue River Basin
Lower
International boundary
Kafue Basin
Regional boundary
River
Swamp/flats
Kafue Gorge
Lake
Figure 18.1 The Kafue River Basin.

8/12/2019 1843391775
http://slidepdf.com/reader/full/1843391775 181/230
170 The Price of Water
Itezhi-Tezhi dam to the head of the Kafue Gorge, a distance of 260 km with a drop of only 6 metres. The Kafue Flats have an area of 6,500 km2 and the Lukanga Swamps’area is 2,600 km2 at peak water level. There are also numerous dambos (local shallowdepressions).
Hydroelectric power is an important regional (and national) resource. Itezhi-Tezhireservoir and dam provides regulatory storage to enhance dry season flows and ensurefirm energy availability for the downstream Kafue Gorge Upper (KGU) hydroelectricpower station. In 2002 there was no power generation at Itezhi-Tezhi, which pro-
vides a live storage capacity of 6 thousand million cubic metres with a surface area of 390 km2. Downstream, the KGU reservoir, when fully impounded, has a surface areaof some 800 km2 at 976.6 metres, and 257 km2 at 975.4 metres! The raised water levelextends as far west as Nyimba, 115 km upstream. The power station is of 750 MWcapacity and has gross and net storage of 900 million and 770 million cubic metresrespectively. KGU’s energy output is estimated to be 3673 GWh/yr.
With respect to demography, in 1990 the Basin’spopulation was 2.9 million persons,40 per cent of the Zambian total. The catchment is the most urbanised in Zambia. By
the year 2000, Zambia’s population was estimated at 10.4 million; if the catchment’sproportion remained at 40 per cent, this would have given a basin population of 4.2 million in that year. Using the basin population for 1990 and 2000 above, thereis a high estimated annual rate of growth of 3.8 percent. The rate of growth has beenstrongly impacted by immigration into a region offering many employment oppor-tunities. However, the relative importance of natural growth and in-migration is notknown.
18.3 GROUNDWATER ABSTRACTION
It is now appropriate to begin to test the hypothesis that the Kafue River Basin was indeficit in the year 2002. Considered in turn are groundwater abstraction, the economicdemand for water, the population’s food requirements, and environmental needs.
Unfortunately there is no comprehensive account of groundwater abstraction forthe Kafue River Basin. In 2002, data relating to pumping tests and borehole log-ging was not being collected. Scott Wilson Piesold comment: ‘Extensive aquifers arefound within the basin particularly in the areas of the Copperbelt and Lusaka. Limitedexploitation of these aquifers has taken place. Groundwater has been used on a localscale for urban water supply (Mazabuka and in the Copperbelt) and for rural watersupply but surface water sources have formed the predominant source of supply’(ScottWilson Piesold 2003: 3.18). In rural areas the average yield of deep wells was limitedby the capacity of hand pumps to six m3 /day, which appears to be considerably below
the minimum specific yield of most aquifers in the basin. The Scott Wilson Piesoldstudy assumed the yield of shallow wells to be 2 m3 /day. For the Basin as a whole,groundwater potential was estimated at 368 m3 /second. This compares with a totaldemand for surface water and groundwater in 1995 of 32 m3 /second.
We can now return to testing the theory of catchment water deficits set out insection one above. Condition 1 for the truth of the deficit theory is that abstractionfrom the catchment’s aquifers was not maintained at a sustainable rate. In fact theevidence shows that groundwater abstraction was sustainable. So condition 1 does not confirm the general hypothesis that the Kafue catchment was in water deficit in2002.

8/12/2019 1843391775
http://slidepdf.com/reader/full/1843391775 182/230
Catchment water deficits 171
Table 18.1 The Kafue River Basin in 2002–2003: total surface water abstractionrights by category in cubic metres/second
Mining and Domestic andSub-basin Agriculture Industrial Services Total
Upper Kafue 7.10 2.70 3.20 13.00
Middle Kafue 0.01 0.00 0.08 0.09
Kafue flats 13.20 0.00 0.20 13.40
Lower Kafue 0.90 0.30 3.80 5.00
TOTAL 21.2 3.0 7.3 31.5
Source: Scott Wilson Piesold (2003) Integrated Kafue River Basin EnvironmentalImpact Study, Ashford: SWP.
18.4 THE ECONOMIC DEMAND FOR WATER
The economic demand for water by households, agriculture, mining, manufacturing,construction and the services sector is now considered. The economic demand for
water refers to the volume of water that users are willing and able to purchase at thesuppliers’ prices or charges. Table 18.1 shows the relative distribution between sectorsof surface water abstraction rights. Agriculture is the dominant rights holder.
With respect to the industrial sectors, they eitherpurchase water from the municipal water utilities or access their required supply by surface water abstraction. The utilitiesin 2002 made charges for water but use was not metered. Industry in general did notlack access to water, nor were water charges unaffordable.
With respect to the agricultural sector, access to water was secured by farmerspumping their own surface water and groundwater requirements. These own-supplycosts were affordable.
With respect to the domestic sector, it is clear that in the Kafue River Basin in 2002there was extensive poverty in the household sector (see section five below). However,there is no evidence that the purchasers of water were not able to secure what they
were willing and able to purchase. What is striking about many of the African countriesis the variety of forms of supply to users, particularly in urban areas, as well as thehigh proportion of income that the poor allocate to water purchases (Whittingtonet al. 1991, Merrett 2007).
It is not suggested here that in some defined sense the people of the Kafue in 2002had their needs for water met in full, in terms of quality or quantity. However, the
second condition for deficit relates to economic demand, not need. Survey work inLusaka, in the Copperbelt towns and amongst rural households would certainly find
widespread shortfalls of purchases in relation to the need for quality and quantity in water. But such shortfalls are manifestations of low income, they are not driven byinsufficient quantities of surface water and groundwater flows.
Condition 2 for the truth of the deficit theory is that outstream water did not fullymeet the economic demand for water from households, agriculture, mining, manu-facturing, construction and the services sectors. In fact the evidence shows that theeconomic demand for water was fully met. So condition 2 does not confirm the generalhypothesis that the Kafue catchment was in water deficit in 2002.

8/12/2019 1843391775
http://slidepdf.com/reader/full/1843391775 183/230
172 The Price of Water
18.5 THE SUPPLY OF FOOD
In 1995, agriculture made up 17 per cent of the Kafue River Basin area, primarily onthe eastern side of the basin. In the same year there were 85,000 farming households,
mostly small and engaged in rainfed crops, crops and poultry, or crops, poultry andlivestock. The large-scale operators are typically involved in double cropping, withrainfed cropping in the wet season (often with supplementary irrigation) and fullirrigation in the dry season.
There were only 7 large or medium-scale irrigation projects in the basin in 1995.The total irrigated area was only 21,000 hectares, about 1 hectare in a thousand for thebasin as a whole. There are important sectors for maize and the irrigation of sugar-cane (both for domestic consumption and for export). Major irrigation takes place atMpongwe in the Upper Kafue. There is extensive fishing and livestock grazing (non-irrigated) and this is an important food source. Coffee is also produced. By 2002, there
was evidence of an expansion and intensification of agriculture.In 2002 the use of irrigation water was about one litre per second per hectare. This
is an annual total volume of some 660 million cubic metres (mcm). The annual riverflow at the Zambezi is about 9,450 mcm. So irrigation use is equal to about seven percent of that downstream flow. The main irrigated crops are banana, coffee, cotton,rice, soybean, sugarcane, tea and wheat.
There is no evidence that the economic demand for food is not met, either byproduction within the Basin or by imports. Moreover, the Kafue River Basin exportscopper and electricity on such a scale, in addition to its agricultural exports, that theBasin generates more than sufficient export income to finance its residual food needsfrom imported food at market prices.
However, there is widespread hunger and poverty throughout the catchment. Foodinsecurity is widespread in the Kafue Basin, particularly among farm households. We
can certainly say that sufficient food is not produced for the population’s needs. Butthis is due neither to lack of water nor lack of land. Low farm productivity amongstsmall farmers and extensive urban poverty are the major issues. The argument hereparallels that of section 4. The insufficiencies of food are not sourced by a lack of precipitation and instream water flows, they are rooted in low incomes.
Condition 3 for the truth of the deficit theory is that the basin population’seconomicdemand for food is not fully met from the domestic rainfed and irrigation sectors,domestic fisheriesand food imports financed by the basin’sexports. In fact the evidenceshows that the economic demand for food was fully met. So condition 3 does not
confirm the general hypothesis that the Kafue catchment was in water deficit in 2002.
18.6 ENVIRONMENTAL NEEDS
In 2002 no environmental requirements for the Kafue River Basin had been set bythe Zambian water resource institutions. In that sense the river’s instream flows didnot fall below defined minima and condition four for a catchment water deficit doesnot confirm the general hypothesis. In any case, Table 18.2 shows just how small weresurface water abstraction rights in 2002-03 compared with the river’s flow and thebasin’s groundwater potential.
Were environmental requirements to be introduced, they would almost certainlybe defined in terms of water levels of the basin’s magnificent floodplains, swamps and

8/12/2019 1843391775
http://slidepdf.com/reader/full/1843391775 184/230
Catchment water deficits 173
Table 18.2 The Kafue River Basin in 2002–2003: estimated total surface waterabstraction rights and the available resource in cubic metres/second
Abstraction Average GroundwaterSub-basin Rights Annual flow Potential
Upper Kafue 13 138 62
Middle Kafue <1 278 200
Kafue flats 13 285 91Lower Kafue 5 316 15
Source: Scott Wilson Piesold (2003) Integrated Kafue River Basin EnvironmentalImpact Study, Ashford: SWP.
marshes. The Kafue Flats and the Lukanga Swamps are the most significant of these vast ecosystems.
However, whereas there is no deficit-driven breach of environmental law, it isappropriate to refer to a different impact of the river’s development. Attention hasalready been drawn to the Kafue Gorge Upper and the considerable hydroelectricpower generated there. To secure maximum power output, a secure flow of water intothe Kafue Gorge is required. For this reason the hydroelectric sector has a powerful,long-term interest in maintaining the flow of the Kafue River. A catchment waterdeficit would be a disaster for the country’s electricity generation and its export of electric power.
This secure flow to the KGU is dependent, as has been shown in section 2 above,both on the reservoirs at the Gorge itself and those upstream at Itezhi-Tezhi. Unfortu-natelythe Itezhi-Tezhi dam hasreduced the depth,areal extent, duration andfrequency
of flooding in the whole of Kafue Flats. Moreover, recommendations to preserve theecological balance of the Kafue Flats by release of a freshet from Itezhi-Tezhi dam of 300 m3 /sec throughout the month of March each year have never been implemented.In part this is due to a smaller firm yield from the reservoir than in design documents –Itezhi-Tezhi dam is too low. Note that in this specific instance, the failure to meetan environmental recommendation is not because of deficit in the river’s flow butbecause of the manipulation of that flow for the requirements of hydroelectric powergeneration.
Condition 4 for the truth of the deficit theory is that the river’s instream flows donot fall below defined minima. Such minima do not exist. If they were to be introducedthey would probably apply to the flooding parameters of the Kafue River Basin’sfloodplains, swamps and marshes. In any case, condition 4 does not confirm the general
hypothesis that the Kafue catchment was in water deficit in 2002.
18.7 CONCLUSIONS
This paper begins by setting out two hypotheses applicable to any of the world’scatch-ments and then tests the first, general, hypothesis on the Kafue River Basin. Thegeneral hypothesis in this case is that in 2002 the Kafue catchment was in water deficit.The hypothesis is verified if, in 2002, any one or more of the following propositions
was true:

8/12/2019 1843391775
http://slidepdf.com/reader/full/1843391775 185/230
174 The Price of Water
1. Abstraction from the catchment’s aquifers was not maintained at a sustainablerate.
2. Outstream water did not fully meet the economic demand for water from house-holds, agriculture, mining, manufacturing, construction and the services sectors.
3. The basin population’s economic demand for food was not fully met from thedomestic rainfed and irrigation sectors, domestic fisheries and food importsfinanced by the basin’s exports.
4. The river’s instream flows fell below defined minima.
In fact, it was shown that none of these four propositions was true. Therefore, in2002 the Kafue River Basin was in surplus.
The application of the general theory to the specific circumstances of the KafueRiverBasinhasbeeninstructivebecauseithasshownboththatthetheoryistestable(todestruction in this case!) and also that that some of the characteristics of a catchment
water deficit exist even when no deficit exists. The author has particularly in mindthe unmet need for water amongst poor households, widespread hunger, and changes
in the flooding characteristics of the Kafue Flats. However, none of these realitiescan be ascribed to the catchment’s precipitation being insufficient to meet the river’senvironmental needs, for groundwater to be pumped at a sustainable rate, for theeconomic demand for water to be satisfied and for the population’sfood requirementsto be met.
The case-study has also suggested ways in which to strengthen the causal hypothesis
that defines the drivers of a catchment water deficit. It has become clear that inconsidering the water surplus or water deficit of catchments the focus should be carriedout through what can be called the analysis of densities. Four such density measuresare offered here as causal factors, drivers of surplus and deficit.
The first density measure we should deploy is the catchment’spopulation density in
terms of persons persquare kilometre. Themore peopleand households in theresidentpopulation, the greater will be household use and consumption (evapotranspiration)of water. High density here pushes the catchment towards deficit.
The second density measure is the catchment’s production per square kilometre.The greater the level of production, the more water is used and consumed in the pro-duction of goods and services. High density here again pushes the catchment towardsdeficit.
The third density measure addresses irrigation head-on. Irrigation’s importance isthat it uses about 70 per cent and consumes about 93 per cent of the world’s outstreamsupplies. Its density can be measured in various ways of which the best, perhaps, isirrigation water supplied to farmers, expressed as millimetres across the entire basin.Once again a high density pushes the catchment towards deficit.
The fourth density measure is precipitation in the basin expressed in millimetres.Total precipitation is proposed here, although a technically better variable would be
what is called net precipitation in the original paper on catchment water deficits (Mer-rett 2005a: 143). Here, high density pushes the catchment towards surplus.
The fifth factor that is a driver towards surplus, not strictly a measure of density, is water productivity measured by net output in each economic sector divided by waterconsumed in the production process.
Table 18.3 provides some of the required data for the Kafue River Basin. Thisinformation suggests that in 2002 the Kafue River Basin was in surplus because of itslow population density, its low irrigation density and its high total precipitation. As

8/12/2019 1843391775
http://slidepdf.com/reader/full/1843391775 186/230
Catchment water deficits 175
Table 18.3 Density measures of the Kafue River Basin in 2002
Population Irrigation Total precipitationpersons/square kilometre millimetres/year millimetres/year
71 4 1057
Source: derived from Scott Wilson Piesold 2003.
other studies of catchment water deficits and surpluses are completed, comparison of measurements of the five drivers discussed above will become possible.
Acknowledgements
I acknowledge permission to use the results of the Main Report from the Zambian
Office for Promoting Private Power Investment, the Zambian Ministry of Energy andWater Development, and ZESCO. I am also indebted to Alan Bates of Scott WilsonPiesold for his generous assistance in my work.
Appendix
The Generic Hypothesis:
“The Dwyer River Basin was in deficit in the year 2004.’’
1 River hydrology1.1 Where is the Dwyer River Basin?1.2 What is the area of the Dwyer River Basin?1.3 What is the length of the Dwyer River?1.4 What is the elevation of the river at source?1.5 What is the elevation of the river at the rivermouth?1.6 Was water imported to the River Basin in 2004?1.7 Was water exported to other river basins in 2004?1.8 Did the River Basin have any desalination plants in 2004?
2 Precipitation
2.1 Briefly describe the Basin’s weather.
2.2 What has been the average, long-term, annual totalprecipitation in the Basin?
2.3 What has been the average, long-term, annual evaporationfrom the Basin?
2.4 What has been the average, long-term, annual effectiveprecipitation in the Basin?
2.5 What was the annual effective precipitation in the Basin in 2004?2.6 What was the annual net precipitation in the Basin in 2004?2.7 What were the effective and the net precipitation per head of
population in 2004?

8/12/2019 1843391775
http://slidepdf.com/reader/full/1843391775 187/230
176 The Price of Water
2.8 Were there specific rainwater harvesting projects in place inthe Basin in 2004?
3 Groundwater
3.1 What is the location of aquifers with respect to the Dwyer
River Basin?3.2 What was the annual rate of abstraction of groundwater
within the Basin in 2004?3.3 What was the sustainable yield of the aquifers below the Dwyer Basin?3.4 What were the legal rights to abstract groundwater in the
Basin in 2004?
4 Environmental requirements and instream activities
4.1 What was the volume of water discharged at the rivermouth in 2004?4.2 What was this mean annual flow at the rivermouth as a
proportion of mean annual rainfall?4.3 Does the river basin contain natural lakes?
4.4 Were there hydroelectric infrastructures on the river in 2004?4.5 What was the area of each of the principal reservoirs in 2004?4.6 What was the rate of evaporation from each reservoir in 2004?4.7 What was the capacity output of each hydroelectric power
plant in 2004?4.8 Was there an active navigation sector in 2004?4.9 Was there an active fishing sector in 2004?4.10 Did the river basin generate wildlife conservation, recreation
and environmental tourism services in 2004?4.11 Did the catchment authority set a quantitative environmental
requirement for the flow of the river in 2004?
5 Economic demand for outstream water5.1 What was the River Basin’s hydrosocial balance in 2004?5.2 What were the main forms of hydrosocial supply?5.3 Was outstream water priced and, if so, what were these prices?5.4 In the case of the use of water that was not priced in 2004,
were there costs incurred by users in accessing water and what were these?
5.5 Could users purchase as much water as they wanted andcould afford at 2004 prices?
5.6 Were abstractions from the river used and then re-used in 2004?5.7 Did tradeable water rights exist in the Basin in 2004?5.8 Was water distributed unequally between different social classes?5.9 What was the ratio of output per cubic metre of outstream
water used in 2004 for each of the principal economic sectors?
6 Food self-sufficiency
6.1 Briefly describe the agricultural sector of the River Basin.6.2 Did the Basin’s farm sector produce sufficient food from the
rainfed and irrigated sectors to meet the population’s needs in 2004?6.3 If not, were the exports of the catchment sufficient to
purchase residual food needs in 2004?6.4 Did the institutions of the Basin import food in 2004?

8/12/2019 1843391775
http://slidepdf.com/reader/full/1843391775 188/230
Catchment water deficits 177
6.5 Were the prices of food imports equal to the internationalmarket price in 2004?
6.6 What proportion of outstream water was used for irrigationpurposes in 2004?
6.7 What proportion of outstream water was consumed forirrigation purposes in 2004?
6.8 Were there programmes in place in 2004 to raise the ratio of value of output per unit of water used or consumed in theirrigation sector?
7 Population
7.1 What was the size of the Basin population in 2004?7.2 What was the rate of change of the population within the
catchment in 2004 and what was the relative importance of natural growth and migration?
7.3 Was there a programme in 2004 to encourage family planning?
8 Production8.1 What was the value of Basin output in 2004?8.2 What was the value of output per head in 2004?8.3 What was the rate of growth in 2004 of annual output per
head of the population?
9 Water resource institutions
9.1 How were the River Basin’s water resources managed in 2004?

8/12/2019 1843391775
http://slidepdf.com/reader/full/1843391775 189/230
19
The Thames catchment: a RiverBasin at the tipping point
‘‘There is nothing so practical as a good theory’’Bertrand Russell
19.1 INTRODUCTION
In the preceding papers an account is given of what is termed a ‘catchment waterdeficit’. The concept is advanced in order to provide a methodological framework for
research into catchments and river basins (the terms are used here interchangeably)in which the volume of river and groundwater flows are insufficient for the basinpopulation’s requirements. A catchment water deficit is a situation in which, duringthe course of a specified year, total precipitation in a basin is insufficient to satisfysimultaneously the following four criteria:
1. Groundwater abstraction is maintained at a sustainable rate.2. Outstream water fully meets the economic demand for water from households,
agriculture, mining, manufacturing, construction and the services sectors. There isno assumption here that the set of charges and prices for water are fixed. Indeed, itmay well be that in future river basin authorities will vary their charges and pricesover time to deal, for example, with droughts. The capacity to adapt should be a
central goal of river basin management.3. The basin population’s economic demand for food is fully met from the domestic
rainfed, irrigation and fishing sectors and/or from food imports financed by thebasin’s commodity and service exports. The balance between food imports andfood grown (and then consumed) in the basin is sure to vary from year to year.
Again, the capacity to adapt is vital in water resource management.4. The river’s instream flows do not fall below defined minima.
C 2007 IWA Publishing. ThePrice of Water: Studies in Water ResourceEconomicsand Management
2nd Edition by Stephen Merrett. ISBN: 9781843391777. Published by IWA Publishing, London, UK.
178

8/12/2019 1843391775
http://slidepdf.com/reader/full/1843391775 190/230
The Thames catchment: a River Basin at the tipping point 179
Criteria 1 and 4 are hydrogeological, hydrological and environmental. Criteria 2 and3 are social, economic, commercial and agricultural. This comprehensiveness in thespecification of deficits is unusual and maybe considered to give the approach strengthand relevance in the 21st century.
These four criteria are, perhaps, deceptively simple. With criteria 1 and 4, whois it that defines the sustainable flows? It may be that these are set by only a singleinstitution, such as a catchment environment agency. However, when two or moreorganizations define the sustainable flows, the researcher may have to admit thataccepting organization 1’sdefinition, the catchment is in surplus, whereas it is in deficitif one accepts organization 2’s definition. This author believes that, in fact, there is noacceptable, generic definition applicable to every river basin on the globe.
The original paper referred to above suggested that global population growth andincreases in output per head would drive ever more catchments throughout the worldfrom surplus to deficit. By way of illustration, already in 2005 the Yellow River in Asia,the Nile in Africa, the Guadalquivir in Europe and the Rıo Bravo/Rio Grande in the
Americas are all catchments in water deficit.
19.2 THE KAFUE CATCHMENT
General theory has its place but it needs to be tested in the crucible of empiricalfalsification or verification. The original paper required a specific river basin on whichto test the general hypothesis that ‘Catchment X is in water deficit’.As good luck wouldhave it, a British engineering company, Scott Wilson, had provided the author withextensive material on the Kafue River Basin and the decision was taken to use theirstudy to match general theory with ground-level truths (Scott Wilson Piesold 2003).The results are set out in paper 18 of this volume.
19.3 THE ANALYSIS OF DENSITIES
The significant advance achieved through the Kafue study was to strengthen under-standing of the drivers to deficit and to surplus. These were weakly specified in theoriginal paper. The author now believes that these drivers – causal variables – arebest understood as a set of five densities, calculable for any and every river basin inthe world once the necessary fieldwork is carried out. The densities are set out inTable 19.1.
Density 1, population density is equal to persons resident in the catchment dividedby its area in square kilometres. It is a driver for deficit and creates this potential
for deficit in two quite distinct ways. First, a bigger population is associated with alarger volume of domestic water used and thereby (partially) lost to evapotranspira-tion. Secondly, bigger populations require more food. These food needs may lead togreater requirements forirrigation outputin the basin (see Density 3). Simultaneously,high population density may lead to a breach of criterion 3 for surplus as describedin section one above. The catchment population may suffer from food shortages orneed to turn to the international trade in agricultural produce in search of subsidized
food.Density 2, production density, is the value of output in the basin divided by its area.
It is also a driver for deficit. Greater output is accompanied by greater supply and use

8/12/2019 1843391775
http://slidepdf.com/reader/full/1843391775 191/230
180 The Price of Water
Table 19.1 Density drivers for catchment water deficits and catchment watersurpluses
Density drivers for deficit Density drivers for surplus
1. Persons per square kilometre (a) 4. Effective precipitation inmillimetres (c)2. Value of output per square kilometre (b) 5. Water productivity in $/cubic
metre (d)3. Value of irrigation output per square kilometre
Notes a. Number of persons resident in the catchment divided by catchment area. b. Value can be measured in various ways. Catchment gross value added is one such
measure. Output from the basin’s irrigation sector should be excluded from driver2 as it is covered by driver 3.
c. Total precipitation minus catchment evapotranspiration, but excluding evapotran-spiration during the course of household use and output production. It is an attempt
to estimate a natural process drivenby total precipitation, radiant energy, wind speedand humidity, rather than a socially-determined variable.
d. The ratio of total value of output to all evapotranspiration losses in the productionof that output.
of water in production, with consequential losses in evapotranspiration. Output hereshould exclude that from the irrigation sector as this sector appears as density 3.
Density 3, irrigation density, is the value of irrigation output in the basin divided bythecatchment’sarea.Thisisaspecialcaseofdensity2andmadeseparatebecauseofthe
intense evapotranspiration of irrigated agriculture. If we exclude evapotranspirationfrom reservoirs, Shiklomanov’s data suggest that at the global scale 93 per cent of hydrosocial evapotranspiration can be ascribed to irrigation and only 7 per cent to theurban sector’s domestic and production uses (Shiklomanov 2000: Table 5).
Density 4, effective precipitation, is a driver for surplus. The greater its value, themore likely is it that the river basin will be in surplus. Effective precipitation is equalto total precipitation less the catchment’s evapotranspiration, other than the evapo-transpiration that occurs in household use and the production of output (see Table19.1, footnote c).
Density 5, water productivity, is also a driver for surplus. It is defined as the catch-ment’soutput value of goods and services divided by the evapotranspiration that takesplace in producing that value. The catchment water deficit approach has a central con-cern with environmental flows; therefore it is primarily oriented neither to the supplyof water nor to water’suse, but focuses on the losses to the river basin’sflows of water asa result of evapotranspiration. The appropriate measure of these losses in productionshould be the evapotranspiration that takes place between the point at which water isfirst abstracted from river and aquifer through to the recycling point of waste waterand irrigation returns back to aquifer and river. Frederiksen’s and Perry’s critiques of
water crisis solutions and irrigation efficiency studies have contributed powerfully tothis orientation to evapotranspiration rather than water supply and use (Frederiksen1996, Perry 1996). Catchment water deficits are powered by evapotranspiration.

8/12/2019 1843391775
http://slidepdf.com/reader/full/1843391775 192/230

8/12/2019 1843391775
http://slidepdf.com/reader/full/1843391775 193/230
F i g u r e 1 9 . 1
M a p o f
t h e T h a m e s R i v e r B a s i n .

8/12/2019 1843391775
http://slidepdf.com/reader/full/1843391775 194/230
The Thames catchment: a River Basin at the tipping point 183
Table 19.2 The hydrosocial balance of the Thames River Basin in 1984
VOLUME (million cubicmetres)
CATEGORIES OF SUPPLY (POSITIVE)Rainwater collection 0Groundwater abstraction 570Surface water abstraction 1260Desalination of sea water 0Imports of water from other areas 50Internal reuse of wastewater not knownExternal reuse of wastewater not knownNet fall in water abstracted and stored negligible
TOTAL POSITIVE SUPPLY 1880
CATEGORIES OF SUPPLY (NEGATIVE)Supply-side evapotranspiration losses not knownSupply-side leakage −310Exports of water to other regions −30Net rise in water abstracted and stored negligible
TOTAL NEGATIVE SUPPLY −340
TOTAL NET SUPPLY 1540
CATEGORIES OF USE (POSITIVE)Households 760
Agriculture, including irrigation requirements 150Mining not knownManufacturing 190Construction not knownPublic services not known
Private services not knownOther uses plus ’not k nown’ c ategories 440TOTAL USE 1540
Source. Merrett (1997) Table 2.1.
Population and hydrosocial balance
The catchment population in 2004 was 12.5 million. The Basin’s principal towns areSwindon, Oxford, Reading, Maidenhead and Greater London. The population of Greater London alone is 8.1 million persons. No recent estimate has been made of the river basin’s hydrosocial balance but one exists for the year 1994 and appearshere as Table 19.2 (Merrett 1997: 17). (The hydrosocial balance for a specific yearand area tabulates the volume of outstream water supplied from different sourcesand the volume of outstream water used by different user-groups.) In 1994 the maincharacteristics of the catchment in respect of the supply and use of outstream water
were:
Total volume of abstraction was about 1,880 million cubic metres. Water imports from and exports to other river basins were each about three per
cent of total net supply. Surface water abstraction was the main source of supply.

8/12/2019 1843391775
http://slidepdf.com/reader/full/1843391775 195/230
184 The Price of Water
Table 19.3 Greater London Authority Gross value added by industry group in2002 in percentages
INDUSTRY GROUP GROSS VALUE ADDED (%)Real estate, renting and business activities 32
Financial intermediation 13Wholesale and retail trade 10Transport, storage and communication 9Manufacturing 8Other services 7Health and social work 5Education 5Construction 4Hotels and restaurants 3Public administration and defence 3Electricity, gas and water supply 1Mining and quarrying <1
Agriculture, hunting, forestry and fishing <1Total 100
Source: Office for National Statistics December 2004
There was substantial leakage on the supply side. The domestic sector was by far the biggest user of water.
There area numberof usersof water that accesstheir supplythemselves, by abstractingfrom the river flow and from local aquifers. All abstractions above a minimal limit arecharged for by the Agency and these charges form a part of its annual income. Themajor abstractors are the water utilities, which face similar controls and charges as do
non-utility abstractors.In 2005 the Basin’s first desalination plant has been proposed for the LondonBorough of Newham on the Thames Estuary. At the time of writing London’s Mayorhasvetoedtheproject on environmental grounds.If completedit would have a capacityof 150,000 m3 /day, that is, 55 million cubic metres per year.
Production
No estimates have existed heretofore for the Basin’s economic output. However, theprincipal location of economic production in the Basin is the area of Greater LondonanddatafortheGreaterLondonAuthority does exist. The Office for National Statistics
(2004) reports that London’s gross value added (GVA) for 2003 was £155 billion, with a GVA/head/year of £21,000. GVA is identical with Gross Domestic Productat basic prices. The percentage breakdown of the total by industry group is given inTable 19.3, which shows that services of various types dominate with 87 per cent of thetotal, whereas manufacturing, construction, mining and agriculture combined makeup only 13 per cent of the total.
Estimates of regional GVA areon a residencebasis, where theincome of commutersis allocated to where they live rather than their place of work. Since commuting intoLondon exceeds commuting out of London, the GVA statistics probably understateGreater London’s production. If we apply the £21,000 per capita data to the entire

8/12/2019 1843391775
http://slidepdf.com/reader/full/1843391775 196/230
The Thames catchment: a River Basin at the tipping point 185
12.5 million population of the Thames River Basin we have total output of about£260 billion per year at 2002 prices.
Water pricing
All outstream water supplied to the Thames River Basin’scustomers is charged for. Theutilities supplying the catchment are Thames Water, Three Valleys Water, South EastWater, Sutton and East Surrey Water, and Essex and Suffolk Water. The charges set byThames Water and these other private utilities are controlled by the Office of WaterServices.Forboth households andbusiness, provided that theirsupplyis metered, thereisbothafixedchargeandavolumetriccharge.Inthedomesticsector,ifthesupplyisnotmetered then, in addition to the fixed charge, there is a charge for the supply of waterbased on the value of the property. In addition, there are wastewater charges. ThamesWater suggests that the hot weather associated with climate change is increasing theeconomic demand for water and its use. Domestic use has risen from 150 litres per
head per day (lhd) in the 1980s to 163 lhd in 2005. Single occupancy households areincreasing and this also raises use per person. ( www.thames-water.com/ ).In most cases in the domestic sector, water is charged for on the basis of the value
of the family’s house. Therefore the household water bill does not vary with use; thereis no price of water. So, in these cases, no price-based, demand-side management of the use of domestic water exists.
19.5 THE THAMES IN WATER DEFICIT?
It is now appropriate to assess whether the Thames catchment is in surplus or in deficit.
To begin with, this can be done by turning the four criteria of section one into fourquestions. First, is groundwater abstraction maintained at a sustainable rate? The Environ-
ment Agency, as we have seen, has considerable regulatory powers to set limits ongroundwater abstraction so that the rate of withdrawal does not exceed the sustain-able yield within the basin. However, some parts of the aquifer have reached theirsustainability limit; and ‘there are some abstractions which are thought to be unsus-tainable and these are being investigated (Environment Agency, pers.comm., 17th
August 2005).There is a more complex issue here. Hydrogeologists agree that the estimation
of an aquifer’s sustainable yield rarely produces a single, unambiguous statistic. AsRoger Calow of the British Geological Survey says, there are widely-placed error bars
on most sustainable yield estimates (personal communication 22.10.05). In the caseof the Thames, different sustainable yield constraints and, correspondingly, differentrates of groundwater abstraction, lead to different environmental habitats. Whichof these mutually-exclusive choices should be the base-line is therefore a matter of debate, particularly in relation to recorded historical changes in habitat over longperiods of time. To sum up, there are cases of unsustainable groundwater abstractionin the Thames River Basin and there are cases where the sustainable yield is thoughtby environmentalists to be too high in historical retrospect.
Secondly, does outstream water fully meet the economic demand for water fromhouseholds, agriculture, mining, manufacturing, construction and the services sectors?

8/12/2019 1843391775
http://slidepdf.com/reader/full/1843391775 197/230
186 The Price of Water
The answer is uncertain. At the time of writing, in 2006, It has been more than ten yearssince restrictions were imposed on use, by limitations on spray irrigation or by limitingthe use of hosepipes and garden sprinklers. However, the author is informed by theEnvironment Agency’s Head of Water Resources that “You will be aware, I hope,from the Environment Agency’s published reports, that Thames Water currently hasa deficit of some 200 Ml/d; we are very concerned about security of supply’’(personalcommunication 12.9.05). 200 Ml/d (megalitres per day) is equal to 73 million cubicmetres per year.
Thirdly, is the basin population’s economic demand for food fully met from thedomestic rainfed, irrigation and fishing sectors and/or from food imports financed bythe basin’s commodity and service exports? Food output in the catchment is small incomparison with food purchases by the basin’s population of 12.5 million. However,the region’s exports of services are vast, both to the rest of the U.K. and to the world.In fact, London and New York may well be the world’s two largest urban producersof services for export. Finance, banking, tourism, the arts, research and educationflourish as exporting sectors. The basin’s exports are more than sufficient to meet its
net food requirements. Therefore the population of the Thames River Basin has nodifficulty whatsoever in accessing at the market price all the food it wants and canafford to purchase.
Fourthly, do the river’s instream flows meet defined minima? The author has notreceived any evidence from the Environment Agency that river flows regularly fallbelow these minima as a result of excessive surface water abstraction. However, inOctober 2004 an Environment Agency officer suggested that the abstraction levels inthe Thames River Basin were ten per cent higher than ideal from an environmentalperspective (London Assembly Environment Committee 2004: 5).
But it is also necessary to consider the export and import of water in the Basin.In 2004 imports were negligible whereas exports, primarily to the Anglian Region,
were about 40 million cubic metres. (Environment Agency, personal communication17.10.2005).
To sum up, in 2005 the Thames River Basin is a catchment in water deficit, but onlyat the margin.
19.6 DENSITY ANALYSIS OF THE THAMES RIVER BASIN
The Thames catchment is modest in size, has a large population, and has vast totaloutput. Despite this, the basin in 2004 and 2005 appears to be only modestly indeficit. In comparative terms, the river is certainly in a far, far healthier state than,
for example, the Murray-Darling, the Yellow River, the Nile, the Guadalquivir andthe Rio Grande. This conundrum should be possible to explain using density analysis.Table 19.4 provides the estimates for the Thames of the five density drivers set outand defined in Table 19.1.
Population density is about 960 persons per square kilometre. In comparison withthe rest of the world’s river basins this is extremely high. Figure 19.1 shows how largeis Greater London in comparison with the scale of the river basin. Table 19.5 showsthat, amongst countries with a population of five millions or more, England is the fifthmost-densely populated in the world. The population density of the Thames RiverBasin is 3.4 times greater than that of the rest of England. Put another way, if the

8/12/2019 1843391775
http://slidepdf.com/reader/full/1843391775 198/230
The Thames catchment: a River Basin at the tipping point 187
Table 19.4 Density drivers for the Thames River Basin
Density Drivers Density driversfor deficit Driver value for surplus Driver value
1. Persons per squarekilometre(persons/km2)
960 4. Effectiveprecipitation(millimetres)
280
2. Value of output persquare kilometre(£ /km2)
20,000,000 5. Water productivity(£ /cubic metre)(a)
1,730
3. Value of irrigationoutput per squarekilometre (£ /km2)
negligible
a Derivation of Driver 5. Output is set at£260,000,000,000. Total useis set at 740mcm,using the the 1994 data of Table 2 and excluding household use. Evapotranspiration
losses to the catchment in the course of production are assumed to be 20 per cent of use, giving the value for production ET of about 150 mcm.
Dr. Stephen Merrett, London
Table 19.5 Top ten world population densities in the year 2005: countries with apopulation of at least 5 million
Population Area (thousand Population densityStates and territories (million persons) square kilometres) (persons/km2)
Bangladesh 144 144 1000Taiwan 23 34 676
Korea (South) 48 98 490Netherlands 16 42 381England 46 130 354Japan 127 378 336El Salvador 7 21 333Belgium 10 31 323Rwanda 8 26 308India 1009 3288 307
Source: http://www.factmonster.com/ipka/A0004379.html
Thames River Basin were a country it would be the second most densely populated in
the world. Production density is £20 million per square kilometre, extraordinarily high. When
we have a broad range of global data of this type, it may prove that the Thames hasthe highest production density of any catchment in the world.
The first two drivers to deficit are powerful but the third, irrigation density, isextremelyweak.Thescaleof irrigation in thecatchmentis small.Unfortunately there isno published output value, but we do have data on the scale of irrigation water use. TheEnvironment Agency Thames Region (EATR) states that in 2003 the licensed volumefor agricultural spray irrigation was 11,321,000 m3 (EATR personal communication21.7.05).(The licensed quantitiesfor general agriculture, fisheries and watercress were

8/12/2019 1843391775
http://slidepdf.com/reader/full/1843391775 199/230
188 The Price of Water
8,730,000 m3.) Even if all of this irrigation use is lost to evapotranspiration, the flowis still slightly less than 1 mm when expressed across the river basin.
Turning to the drivers for surplus, we see that effective precipitation is rather high inglobal comparative terms. The catchment has a humid climate with moderate averagetemperature and wind speeds.
Finally, an attempt is made to estimate water productivity at the catchment scale.This variable, in terms of the definition given in section three, has probably neverbeen estimated before – anywhere. The data are fairly crude, particularly the volumeof water used in production and the suggested 20 per cent evapotranspiration losses inuse. But the value of this density driver is so large that even a substantial adjustment,following the necessary fieldwork, would still leave a value almost incredible in its size.So it is useful to restate what that value means:
The ratioof thegross value added in the production of goods and services in the Thames
River Basin to the number of cubic metres lost to the catchment in the evapotranspiration
of water used for production probably exceeds £1700/m3.
In 2004-2005, the volumetric charge for water supplied to non-domestic customers
by RWE Thames Water was £0.65 per cubic metre, or £3.25 for each five cubic metres.Therefore the ratio of gross value added to the cost of water supplied was 523 to 1!This allows for the fact that every five cubic metres supplied represents only one cubicmetre consumed. Put another way, non-domestic users cost of water was some 0.2 percent of gross value-added.
There is another way of expressing water productivity at the basin scale, althoughit does not permit inter-basin comparisons. Across the Thames River Basin, for everymillimetre of water lost to evapotranspiration during the course of output production,the value of that production is £20,000,000,000!
19.7 TIPPING DEEPER INTO DEFICIT
It is argued above that the Thames River Basin is in deficit but that the situation isnot yet desperate, despite the region’shigh population density and production density.This is because the catchment is fairly humid and because production recycles back tothe river basin about 80 per cent of the water used in the production process, with aconsequentially high value of water productivity.
Thehighrateofrecyclingexistsinpartbecauseofthemodestscaleofirrigation.Theminimal scale of plant production (either rainfed or irrigated) is possible because thebasin population of 12.5 million exports sufficient goods and services – particularly thelatter – so that it faces no financial or economic difficulty in importing food producedin other river basins. Those imports themselves require rainfall and/or irrigation for
their growth, of course, but the evaporative losses take place in other catchments, notin the Thames River Basin.
However, the author believes that we are now in the early stages of a tipping processduring which the severity of the catchment’s water deficit will accelerate. This shift inseverity is sourced by three dynamic forces: climate change, population growth andproduction growth. Climate change will bring with it hotter, drier summers and warmer
wetter winters. Summer heat and low humidity will reduce effective precipitation,impacting severely on river flows and groundwater recharge (Collingwood 2005). Population growth in the South-East, a region that overlaps with the Thames River

8/12/2019 1843391775
http://slidepdf.com/reader/full/1843391775 200/230
The Thames catchment: a River Basin at the tipping point 189
Basin, will drive up total household use. The South-East England Regional Assemblyannounced in 2005 plans to build 578,000 new homes in the region (Guthrie 2005).Pressure for growth at the eastern limit of the Thames River Basin will also arise fromthe siting of the 2012 Olympic Games on the River Lee, the Thames’s most easterlytributary. Production growth will drive and be driven by population growth. In particu-lar this will occur in the site area of the Olympic Games as well as in Thurrock, Essex,
where the biggest container port in Britain is to be constructed. Thurrock is on theThames and, technically, a dozen miles east of the basin’s limit (Blitz 2005).
In the light of these dynamic forces within to the Basin, redemptive options need tobe examined. There are just six such options, widely varying in their political feasibilityand desirability (see Paper 17):
1. The deceleration and reversal of the rate of growth of population.2. The deceleration and reversal of the rate of growth of production.3. Further increases in water’s productivity.4. The introduction of universal metering, to reverse the volume of household use
per person.5. The reduction of evaporative losses both from reservoirs and from water supplyleakage; groundwater re-charge has advantages here.
6. An enhanced capacity of the Environment Agency in its forward planning andits policy instruments, including the routine use of the hydrosocial balance inforecasting.
Certain palliative options also exist. One is to reduce the environmental standardsrelating to groundwater and surface water abstraction. These will, quite properly, beopposed by the environmental movement. A second is to increase water re-use; butthis can only be beneficial if it reduces evapotranspiration losses and this may notoccur. This is a policy area deserving new research. A third is rainwater harvesting, but
this is just surface water or groundwater abstraction under another name. A fourthis importing water from other catchments. But this may drive other catchments intodeficit and it is also costly in construction terms as well as demanding in terms of theelectricity required for pumping. Electricity generation is not carbon-neutral. A fifthis the desalination of sea-water, as in the case of the proposed plant in the LondonBorough of Newham. Again this requires expense and substantial electricity inputs.
19.8 CONCLUSION
It is the opinion of the author that the two roads to redemption from the threatof much greater Thames River Basin deficits in the future are to severely limit the
housebuilding programme in the catchment and to introduce the universal meteringof household water use. As Jay O’Keeffesuggests, water resource management shouldbe like the construction of a cathedral; one approaches it within the perspective of the very long run.
Acknowledgements
The author is grateful to the following institutions and persons for their valuable assis-tance in the writing of this paper: W.S. Atkins, Dr. Sally Watson, Ian Barker (Head of

8/12/2019 1843391775
http://slidepdf.com/reader/full/1843391775 201/230
190 The Price of Water
Water Resources, the Environment Agency), Michael Coffey (formerly RWE ThamesWater plc Director of Strategy), Alison McCartney (Department for Environment,Food and Rural Affairs), Melissa Bance, Aisha Burtally, Samantha Dinnage, ClareDinnis, Mark Funnell, Doug Hill, Crystal Hinks, Kate Kerton, Karen Lingard, AlysLogan, Jenny Sampson and Alastair Wilson – all from the Environment Agency, RobCoward and Adarsh Varma of the Greater London Authority, Peter Johnson andMichael Snell of ICID.UK, Robert Palmer of the Office for National Statistics andfrom RWE Thames Water plc: John Haakerson, Maria Ioannous and Steve Tuck.

8/12/2019 1843391775
http://slidepdf.com/reader/full/1843391775 202/230
20
Water resource impacts of newhousebuilding in the Thames
Region 2006–2025
20.1 INTRODUCTION
If the Thames Region were a country it would be the second most densely popu-
lated in the world, amongst countries with a population of 5 millions and more.The Region is also probably the most productive river basin in the world in termsof output per head. Families as well as businesses require water supplies in largequantities. So it should come as no surprise that the Thames Region’s high densityof population and production together place the river basin’s water resources understress.
It is the Environment Agency’s staff who are best placed to describe this stresson the water resource. For example, in October 2004 an Environment Agency offi-cer suggested that the abstraction levels in the Thames River Basin were ten per centhigher than ideal from an environmental perspective (London Assembly EnvironmentCommittee 2005, p.5). In 2005 the Agency commented on excessive withdrawals of groundwater by saying ‘there are some abstractions which are thought to be unsustain-
able and these are being investigated’ (see Paper 19). Again in 2005, the Environment Agency’s Head of Water Resources wrote “You will be aware, I hope, from the Envi-ronment Agency’spublished reports, that Thames Water currently has a deficit of some200 million litres per day; we are very concerned about security of supply’’(personalcommunication to the author).
C 2007 IWA Publishing. ThePriceof Water: Studies in Water ResourceEconomicsand Management
2nd Edition by Stephen Merrett. ISBN: 9781843391777. Published by IWA Publishing, London, UK.
191

8/12/2019 1843391775
http://slidepdf.com/reader/full/1843391775 203/230
192 The Price of Water
Table 20.1 Useful information on the Thames region
Area of the Thames River Basin (sq. kilometres) 12,867Length of the River Thames (kilometres) 333Length of River Thames and its tributaries (kilometres) 5,330
Average annual rainfall (millimetres) 690 Average annual evapotranspiration (millimetres) 455 Average annual effective rainfall (millimetres) 235 Average annual effective rainfall (thousand million litres) 3,022Population in 2001 (persons) 11,790,000Population density in 2001 (persons per square kilometre) 916
Average annual effective rainfall per person (litres) 256,000Population (households) not knownNumber of dwellings (houses, flats etc.) 5,060,000
Average number of persons per household not known Average number of persons per dwelling 2.33Domestic use of water in 2001 (litres per head per day) 159Total domestic use of water in 2001 (million litres per day) 1,875
Percentage of households with a metered supply in 2001 16Production (£ billion gross value added) 260Production density (£ per square kilometre) 20,000,000
Main sources: Environment Agency (2001) “Water Resources for the Future: a Strat-egy for Thames Region”, Reading: Environment Agency; and Paper 17.
The stress on the water resource will increase in the future because of climatechange. The Thames Region’s natural supply of water is its rainfall and this averages690 millimetres per year (about 27 inches). But 455 millimetres is lost annually inevapotranspiration. So net rainfall averages only about 235 mm/y. Climate change will
bring with it hotter, drier summers and warmer, wetter winters. The overall, averageimpact is forecast to reduce net rainfall (Collingwood Environmental Planning andLand Use Consultants 2005).
So climate change clearly threatens the vitality of the River Thames and its tribu-taries such as the Kennet, Thame, Loddon, Wey, Colne, Mole and Lee. But there isa second powerful threat and that is the plans for new housebuilding in the region.House construction itself uses water in large quantities but the permanent change itbrings to the river basin is an increase in population and therefore in the economicdemand for water. The objective of this paper is to examine the likely water resourceimpactsof new housebuilding in the Thames region over the twenty years 2006 to 2025.
20.2 THE BASELINE SITUATION
To anticipate the future, we need a good understanding of the present. The key infor-mation is contained in Table 20.1. The area of the Thames Region is almost 13,000square kilometres and at the time of the 2001 Census the population was a little lessthan 12 million persons. So population density was more than 900 persons per squarekilometre, approaching that of Bangladesh (see Table 20.2).
This high density results in extremely low net annual rainfall per head: 0.26 mil-limetres per person per square kilometre. This is the slender flow that has to meet thecombined requirements of:

8/12/2019 1843391775
http://slidepdf.com/reader/full/1843391775 204/230
Water resource impacts of new housebuilding 193
Table 20.2 Top ten world population densities in the year 2005: countries with apopulation of at least 5 million
Population Area (thousand Population densityStates and territories (million persons) square kilometres) (persons/km2)
Bangladesh 144 144 1000Taiwan 23 36 639South Korea 48 98 490England 50 130 385Netherlands 16 42 381Japan 127 378 336El Salvador 7 21 333India 1080 3288 328Belgium 10 31 323Rwanda 8 26 308
Sources: http://www.factmonster.com/ipka/A0004379.html; and National Statistics
Online.Thames Region 12 13 916U.K. excludingThames region
48 232 207
Sources: Office of National Statistics, Environment Agency, and Dr Stephen Merrett.
1. The region’s households.2. The river basin’s ecosystems.3. The region’s annual economic production, valued at £260 billion.
The focus of this paper is on domestic water use and how the economic demandfor water will swell with new housebuilding in the Thames river basin. For the base-line years, the Environment Agency Thames Region has provided a comprehensiveoverview of families’ use of water.
The public water supply in 2006 is sourced by five companies. They are: Essex andSuffolk Water, South East Water, Sutton and East Surrey Water, Thames Water andThree Valleys Water. Seventy per cent of their total supply (net of leakage) was takenup by households in 1999. Table 20.1 shows that in 2001 domestic use equalled 1,875million litres per day.
In terms of litres used per head per day (lhd) in the household sector, there is great variation. The lhd bandwidth lies almost entirely within the range 130 to 196. In 2006the overall average is about 160 lhd.
There are many determinants of this wide variation of use around the average, suchas whether the family has a garden or not, the number of persons in the family (smallerhouseholds use more litres per head), the number of white goods owned, their waterefficiency as well as the efficiency of other water-using fixtures, and the environmentalawareness of the family. Table 20.3 shows the micro-components of household use in2001 (Environment Agency 2001). In that year, the heavyweight players capturing 80per cent of the total were personal washing, use of a WC and clothes washing.
An important question in domestic use is whether or not the house or flat has ametered water supply. If the answer is ‘yes’, then the user knows that the bill for water
will increase with the amount used. If the answer is ‘no’, the bill does not rise with
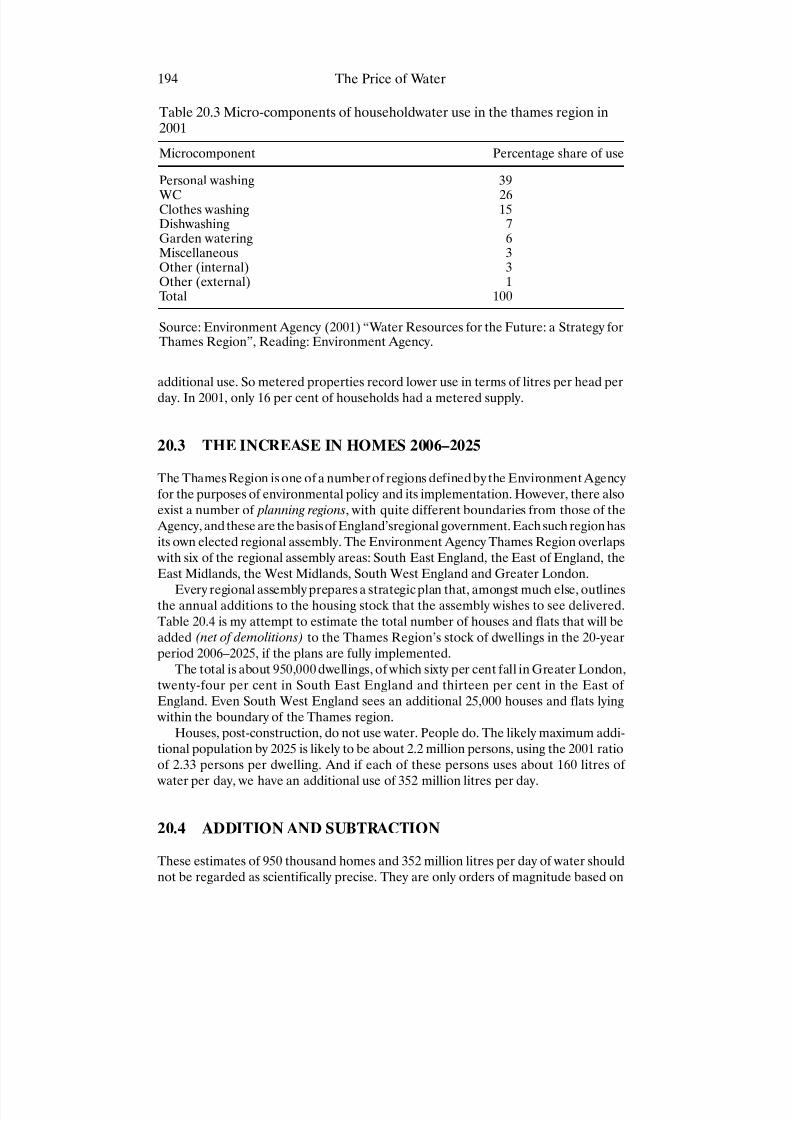
8/12/2019 1843391775
http://slidepdf.com/reader/full/1843391775 205/230

8/12/2019 1843391775
http://slidepdf.com/reader/full/1843391775 206/230

8/12/2019 1843391775
http://slidepdf.com/reader/full/1843391775 207/230
196 The Price of Water
and it is the low volume of net rainfall per person that is the key driver of the Region’s water stress. Climate change will exacerbate stress.
ii) Dryer, hotter summers will increase the use of baths, showers and garden sprin-klers. The last of these also suffers from high rates of evapotranspiration, so that the
water flow is lost to the river basin (see Paper 17). Droughts will be more frequent.
Subtractions from stress
iii) We can be sure that the number of households whose water use is metered willincrease in the future. This will moderate use. Of course, all new houses and flats
will be metered because the regulation of new housebuilding standards requires this.But there will be more houses and flats in the existing stock that switch to a meteredsupply. The impact on use per person, compared with the unmetered situation, hasmany determinants, including the tariff itself and, most important, the average priceof water. Metering and tariffs help little when prices are low.
iv) Continuing design improvements in white goods and other water-using fixtures will reduce water use.
v) Additional water requirements, whatever their exact volume, may be met by inter-basin transfers or desalination plants. This will serve to reduce the impactof populationgrowth on the River Thames ecosystems, but at a financial and environmental cost inthe infrastructures required, as well as the carbon emissions required for the electricitypowering that infrastructure.
vi) Leakage reduction will make more productive use of the water abstracted fromthe river or its aquifers, particularly in the Greater London area where the leakageruns uselessly into the Thames Estuary (see Paper 21).
Household size
vii) New housebuilding will add to the Thames Region’s population and exacerbate water stress, as has already been said. But the anticipated fall in average householdsize over time will weaken the net increase in the number of persons resident in theRegion. Yet again, smaller households use more water per person. The overall impactof the increase in the number of persons and higher use per person requires estimation.
A final complicating factor is that Thames Water’s estimates show 2.46 persons perdwelling, not the 2.33 used in the calculations up to this point. This higher figureimplies that future use will be 5 per cent higher than I have calculated above.
20.5 CHOICES
I believe that the resolution of these concrete threats to the Thames River Basinenvironment can be achieved by draconian reductions in new housebuilding targets,particularly in the East of England, South East England and Greater London. But
what will be the impact of these proposals on the housing opportunities of familiesliving in these three regions?
First, the housing market will be tighter; market rents will be higher and so willbe housing prices. However, if central government and local authorities focus their

8/12/2019 1843391775
http://slidepdf.com/reader/full/1843391775 208/230

8/12/2019 1843391775
http://slidepdf.com/reader/full/1843391775 209/230
21
Beneficial impacts for the ThamesRiver Basin of water company
leakage reduction 2006–2025
21.1 INTRODUCTION
In Paper 17 I set out a general theory to explain why, in the 21st century, we can
expect to see an immense expansion in the number of the world’s rivers that suffera catchment water deficit. This general theory was first applied to the Kafue RiverBasin in Zambia, which was shown to enjoy a comfortable surplus at the turn of thenew millenium (Paper 18). The Zambian exercise itself led to the specification of fivedrivers that explain the existence of surplus or deficit in a river basin. These are setout in Table 21.1.
The first two drivers to deficit, population density and output density, are bothknown to be to be high in the Thames River Basin. But as far as I was aware theBasin was not in deficit. So a case-study of the Thames seemed to be a worthwhileexercise in making or breaking the general theory of catchment water deficits. Thisled to Paper 19, which measured all the Basin’s five density drivers. It concluded thatthe Thames River Basin is in deficit in the sense set out above, but that the situation is
not yet desperate, despite the region’shigh population density andproduction density.This is because the catchment is fairly humid and because production recycles back tothe river basin about 80 per cent of the water used in the production process, with aconsequentially high value of water productivity.
Thehighrateofrecyclingexistsinpartbecauseofthemodestscaleofirrigation.Theminimal scale of plant production (either rainfed or irrigated) in the Thames Regionis possible because the basin population of 12.5 million exports sufficient goods and
C 2007 IWA Publishing. ThePrice of Water: Studies in Water ResourceEconomicsand Management
2nd Edition by Stephen Merrett. ISBN: 9781843391777. Published by IWA Publishing, London, UK.
198

8/12/2019 1843391775
http://slidepdf.com/reader/full/1843391775 210/230
Beneficial impacts for the Thames River Basin 199
Table 21.1 Density drivers for catchment water deficits and catchment watersurpluses
Density drivers for deficit Density drivers for surplus
1. Persons per square kilometre (a) 4. Effective precipitation inmillimetres (c)2. Value of output per square kilometre (b) 5. Water productivity in
$/cubic metre (d)3. Value of irrigation output per square kilometre
Notes a Number of persons resident in the catchment divided by catchment area. b Value can be measured in various ways. Catchment gross value added is one suchmeasure.Output from the basin’s irrigation sector should be excluded from driver 2 as it iscovered by driver 3. c Total precipitation minus catchment evapotranspiration, but excluding evapotran-spiration during the course of household use and output production. It is an attemptto estimate a natural process driven by total precipitation, radiant energy, wind speedand humidity, rather than a socially-determined variable. d The ratio of total value of output to all evapotranspiration losses in the productionof that output.
Dr. Stephen Merrett, London.
services – particularly the latter – so that it faces no financial or economic difficultyin importing food produced in other river basins. Those imports themselves requirerainfall and/or irrigation for their growth, of course, but the evaporative losses takeplace in other catchments, not in the Thames River Basin.
The next link in this chain of research papers was to assess the likely impact of new housebuilding and population growth on the region’s water deficit (Paper 20).The forecast number of new houses and flats in the years 2006–2025 is 950,000 (net of demolitions) and the forecast number of additional residents living in the catchmentarea is 2.2 million. As a result, household use of water in the Thames Region wouldincrease by more than 350 million litres per day (Ml/d). Water stress would becomemore severe than it is already.
However, a number of changes may help offset the calamitous impact of sucha seismic shift on the Thames ecosystems. These changes include a reduction inthe water utilities’ leakage of water, the spread of domestic metering of water use,design improvements in water-using white goods and fixtures, inter-basin transfers,and desalination plants.
In this paper, I examine the first of these changes, estimating the beneficial impactsfor the Thames River Basin of reduction in water company leakage during 2006–2025.
21.2 LEAKAGE IN THE THAMES REGION:
SOME BASIC FACTS
There are five water utilities in the Thames Region: Essex & Suffolk Water, SouthEast Water, Sutton & East Surrey Water, Thames Water and Three Valleys Water.

8/12/2019 1843391775
http://slidepdf.com/reader/full/1843391775 211/230
200 The Price of Water
Of these only Thames Water provides both a water and a sewerage service. Not allthe companies lie entirely within the Environment Agency’s Thames Region. In fact, whereas the area of the Region is 13,000 km2, the combined areas of the five waterutilities is as much as 24,000 km2.
The best source of leakage data is the Office of Water Services. Table 21.2 showsOfwat’sestimate of the scale of total leakage by company for the 5-year period begin-ning in 2000–01. For readers unfamiliar with this arcane subject it is worth pointingout that between the point at which a utility puts water into supply and the point thatit enters the internal network of the user, there are two types of leakage. The first isleakage from the company’s distribution system and the second is the leakage fromcustomers’underground supply pipes. The English and Welsh companiesestimate thatin 2004–05 their total leakage was made up of 72 per cent from distribution leakageand 28 per cent from supply pipe leakage.
Table 21.2 shows that, in the four-year period ending in 2004–05, annual totalleakage by the five Thames Region companies averaged 1.2 thousand million litresper day (Ml/d). Thames Water alone was the source of about 75 per cent of thetotal. In
terms of leakage expressed as litres per property per day or cubic metres per kilometreperday, ThamesWater also performedsignificantly less adequately than theother fourcompanies.
Ofwat and the companies use the terms ‘leakage’ and ‘losses’ almost interchange-ably. From their perspective this makes sense. If the Thames Region’s utilities pump water from river or aquifer, store it, convey it to a treatment works, treat the water soreceived to drinking water standards – but then see 1,200 million litres leaking everyday of the year prior to reaching the customer, this is certainly a loss.
But from an environmental and a hydrological point of view, leakage is not anecessarily a loss. Admittedly, it may evaporate or flow to the saline waters of theThamesEstuary. However, leakage may recycle to river andaquifer, and it may sourceplant growth such as urban trees,
This Paper’sperspective on leakage is to assess thescale of thepositive hydrologicalimpact of leakage reduction in the context of a possible net increase of 950,000 housesand flats in the Thames Region over the period 2006–2025.
The fundamental proposition here is that if the leakage flows that are reduced would otherwise have passed to the atmosphere through evapotranspiration or wouldhave flowed to the Estuary, the beneficial effects of leakage reduction in respect of the water resource for abstraction are clear and positive. But if the leakage flows thatare reduced would otherwise have recycled to the river, its tributaries and its aquifers,there are no such beneficial effects of leakage reduction.
The implication of this argument is that in understanding the beneficial impactsof leakage reduction we need to know what proportion of the leakage flows reduced
would otherwise have been ‘lost’ to evapotranspiration or to the Estuary.
21.3 FORECASTING THE REDUCTION IN TOTAL LEAKAGE
The struggle to reduce total leakage in England and Wales has been extensively docu-mented in the Environment Agency’s Demand Management Bulletin since its first issuein July 1993. However, the best source for forecasting future reductions is Ofwat’sannual publication Security of Supply, Leakage and the Efficient Use of Water (Ofwat2005).

8/12/2019 1843391775
http://slidepdf.com/reader/full/1843391775 212/230
Beneficial impacts for the Thames River Basin 201
Table 21.2 Company estimates of total leakage by year
ESSEX & Suffolk Water (‘Northumbrian South’)
Million litres Litres per Cubic metres per
per day property per day kilometre per day2000–2001 722001–2002 732002–2003 672003–2004 702004–2005 67
South East Water
Million litres Litres per Cubic metres perper day property per day kilometre per day
2000–2001 85 147 92001–2002 75 128 82002–2003 72 122 72003–2004 69 116 72004–2005 69 116 7
Sutton & East Surrey Water
Million litres Litres per Cubic metres perper day property per day kilometre per day
2000–2001 24 91 72001–2002 24 91 72002–2003 24 90 72003–2004 24 91 72004–2005 24 90 7
Thames Water
Million litres Litres per Cubic metres perper day property per day kilometre per day
2000–2001 688 200 222001–2002 865 250 282002–2003 943 272 302003–2004 946 271 302004–2005 915 261 29
Three Valleys Water
Million litres Litres per Cubic metres perper day property per day kilometre per day
2000–2001 140 116 102001–2002 157 129 11
2002–2003 152 125 112003–2004 152 124 112004–2005 149 120 10
All Five Companies
Million litres per day2000–2001 10092001–2002 11942002–2003 12582003–2004 12612004–2005 1224
Source: Office of Water Services (2005).

8/12/2019 1843391775
http://slidepdf.com/reader/full/1843391775 213/230
202 The Price of Water
Ofwat’sinterest is in the economic level of leakage, as the following quotation shows(Ofwat 2005, p.34).
“The water companies in England and Wales manage water distribution networks with a total length of approximately335,000km. In addition, there are almost24 millionconnections to properties and associated customer supply pipes, which all have thecapacity to leak. Eliminating leakage would be virtually impossible and enormouslyexpensive. Therefore, target levels for leakage have to balance the needs of customersand the environment. We believe that companies should compare the cost of reducingleakage and the value of the water saved, including any associated environmentaland social costs and benefits. The level of leakage at which it would cost more tomake further reductions than to produce the water from another source is known asthe economic level of leakage (ELL). Operating at ELL means that the total cost of supplying water is minimised and companies are operating efficiently.’’
In 2005 theregulatorpublisheda targettotal leakage volume foreach utility andforeach of the six years 2004–05 to 2009–20. These targets are recorded in Table 21.3. TheTable also shows the corresponding year-on-year reduction in leakage. In the future,
targets will increase (or decrease) only if a change in the cost of reducing leakage isout of step with a change in the value of water saved, raising or lowering the economiclevel of leakage, as the case may be. In the absence of such change, the targets willremain steady and the year-on-year reduction after 2009–10 will equal zero. The eraof leakage reduction will terminate.
The implication of all this is that from 2004–05 the total reduction in leakage thatis sought by the regulator for the future is the sum of the year-on-year data in Table21.3 (row 17), i.e. 194 Ml/d. However, this figure overstates the future contributionof leakage reduction in moderating the impact of new housebuilding on the ThamesRiver Basin for two reasons.
First, the leakage reduction targets forTable 21.3 take place throughout the compa-nies’areas, whereas the Thames Region makes up only 54 per cent of those areas. If inthe unlikely event that leakage reduction takes place in a uniform pattern throughout
Table 21.3 Ofwat leakage targets 2004–05 to 2009–10 for the five thames regionutilities (Ml/d)
Utility 2004–05 2005–06 2006–07 2007–08 2008–09 2009–10
Essex & Suffolk Water 70 69 68 68 67 66South East Water 69 69 69 69 69 69Sutton & East SurreyWater
25 25 25 25 25 25
Thames Water 905 860 805 770 745 725Three Valleys Water 150 150 145 145 145 140Total 1219 1173 1112 1077 1051 1025Year-on-Year reduction n/a 46 61 35 26 26Total reduction 2004–05
to 2009–2010 = 194Ml/d
Source: Ofwat’sSecurity of Supply, Leakage andtheEfficient Use of Water 2004–2005Report, Table 8.

8/12/2019 1843391775
http://slidepdf.com/reader/full/1843391775 214/230
Beneficial impacts for the Thames River Basin 203
A. TOTAL LEAKAGE
B. ECONOMIC LEVEL OF LEAKAGE
C. LEAKAGE REDUCTIONTARGET
D. RECYCLED LEAKAGE
E. EVAPOTRANSPIRATION
AND FLOWS TO THE ESTUARY
Figure 21.1
the companies’ areas, the Region’s target would be only 105 Ml/d. However, ThamesWater lies entirely in the Thames Region and it makes up 80 per cent of the totalleakage target. So a Region target for leakage reduction could be taken as about 160Ml/d.
Secondly, the water resources available for abstraction benefit from leakage reduc-tion only in the case where such leakage would have flowed to the saline waters of theThames Estuary or would have evapotranspirated. Figure 21.1 is useful here. If theleakage flows that are reduced would otherwise have recycled to the river, its tribu-taries and its aquifers, there are no such beneficial effects of leakage reduction froma resource perspective.
Thefuture contribution of leakage reductionin sourcing theneedsof the2.2millionresidents who would live in the houses built under current housebuilding strategiesis important but should not be over-estimated. For the present, the author suggeststhat in quantitative terms it is probably considerably less than 160 Ml/d. This can becompared with the estimate that the new housebuilding programmes for the ThamesRegion will increase household use of water by some 350 Ml/d in a river basin that is
already in deficit.
21.4 CONCLUSIONS
In this Paper the likelihood is examined that Ofwat’starget reductions in water utilityleakage provide an additional water resource to offset the growth in population in theThames river basin. But unqualified use of these targets overestimates the beneficialimpacts of leakage reduction in the Thames Region. First, the Region makes up only

8/12/2019 1843391775
http://slidepdf.com/reader/full/1843391775 215/230
204 The Price of Water
54 per cent of the area of the five companies, Secondly, a proportion of leakage in anycase recycles to the river, its tributaries and its aquifers and therefore such flows arenot lost to the Region from a hydrological and environmental point of view.
For thepresent, theauthorsuggests that in quantitative terms target leakage reduc-tions are important but would probably contribute considerably less than 160 Ml/d insourcing the needs generated by population growth.

8/12/2019 1843391775
http://slidepdf.com/reader/full/1843391775 216/230
Bibliography
Abernethy, C.L. (2003). Financing river basin management. In Svendsen, M.,Merrey, D.J., & Shah, T. (2003). Irrigation and River Basin Management: Options for Governance and Institutions. Wallingford: CABI.
Allan, T. 1995. “The political economy of water: reasons for optimism but long termcaution’’, in J.A. Allan and J.H.O. Court (eds) Water in the Jordan Catchment Coun-tries: a Critical Evaluation of the Role of Water and Environment in Evolving Relationsin the Region, London United Kingdom: School of Oriental and African Studies.
Allan, T. (2001) The Middle East WaterQuestion: Hydropolitics andthe Global Economy,
London: Tauris. Allan, T. 2003. “Virtual water – the water, food, and trade nexus useful concept ormisleading metaphor?’’, Water International 28 (1): 106–113.
Allen RG., Willardson LS., Fredricksen H.D. 1997. Water use definitions and their usefor assessing the impacts of water conservation, in de Jager J.M., Vermes L., RagabR. (eds) Sustainable Irrigation in Areas of Water Scarcity and Drought. Oxford: ICID.
Altaf, M.A., Whittington, D., Jamal, H. & Smith, V.K. (1993). Rethinking rural water supply policy in the Punjab, Pakistan. Water Resources Research, 29(7),1943–1954.
Anderson, P. 1997. Demands and resources for public water supplies in Scotland from1991 to 2016, in Water and Environmental Management, Vol. 11, No. 3, pp. 164–169.
Anglian Water Services Limited (2002). Annual Report and Accounts 2002.
Huntingdon, AWSL. Anglian Water Services Limited (2003). Anglian Water Services Drought Plan March 2003. Huntingdon, AWSL.
Anon. (1975) ‘Medical, health, agricultural and public water supply aspects of nitratesin water: symposium on nitrates in water,’ Water Treatment and Examination 24:142–223.
Berkoff DJW. 1990. Irrigation Management on the Indo-Gangetic Plain. WashingtonDC: World Bank.
Berkoff, J. (2003). Prospects for Irrigated Agriculture: Has the International ConsensusGot It Right? http://www.brad.ac.uk/acad/bcid/GTP/altwater.html.
205

8/12/2019 1843391775
http://slidepdf.com/reader/full/1843391775 217/230
206 Bibliography
Bhatia, R., Rogers, P., Briscoe, J., Sinha, B. & Cestti, R. (1994). Water Conservation and Pollution Control in Indian Industries: How to Use Water Tariffs, Pollution Charges, and Fiscal Incentives, Washington: World Bank.
Bjerregaard, R. (1998). Getting Europe’swaters cleaner: getting the citizens involved,Water Policy, 1(1), 73–80.
Blackie, J.R., Houghton-Carr, H.A., McCartney, M.P., Moores, J.P., Davies, H.N.(1996) The Trinity Catchment Study: Final Report, Wallingford: Institute of Hydrology.
Blitz, R. (2005). £1.5 bn boost for sea freight. Financial Times 21 July 2005.Blomqvist A. 1996. Food and Fashion: Water Management and Collective Action among
Irrigation Farmers and Textile Industrialists in South India. Linkoping: University of Linkoping.
Briscoe, J. (1995). The German Water and Sewerage Sector: How Well it Works and WhatThis Means for Developing Countries, Washington: World Bank.
Bruns BR. & Meinzen-Dick RS. (2000) Negotiating Water Rights. London: IT Publica-tions.
Bruns BR. & Meinzen-Dick RS. (2001) Water rights and legal pluralism: four contexts
for negotiation. Natural Resources Forum 25: 1–10.Cairncross, S. & Kinnear, J. (1991). Water vending in urban Sudan. Water Resources
Development, 7 , 267–273.Cairncross, S. & Kinnear, J. (1992). Elasticity of demand for water in Khartoum,
Sudan. Social Science and Medicine, 34, 183–189.Chapman, G., Cleese, J., Gilliam, T., Idle, E., Jones, T. & Palin, M. (1979). Monty
Python’s The Life of Brian (of Nazareth), London: Eyre Methuen.Chief Adviser’s Office (1997) An Introduction to Jersey: Jersey and the Channel Islands
in relation to England and France, St. Helier: Chief Adviser’s Office.Chilton, P.J. & Bird, M.J. (1994) Nitrate in Jersey’s Groundwater, Keyworth: British
Geological Survey.Choe, K., Whittington, D. & Lauria, D. (1996). The economic benefits of surface water
quality improvements in developing countries: a case study of Davao, Philippines. Land Economics, 72(4), 519–537.
Collingwood Environmental Planning and Land Use Consultants (2005). SEERA Cli- mate Change Adaptation and Mitigation Implementation Plan: Consultation Draft.South-East England Regional Assembly, London.
van Damme, H.M.G. & White, A. (1984). Technology choices for the decade. Bourne,P.G. (ed.) Water and Sanitation: Economic and Sociological Perspectives. San Diego,
Academic.Davis, J. & Whittington, D. (1998). “Participatory’’research for development projects:
a comparison of the community meeting and household survey techniques. Economic Development and Cultural Change, x(y), 73–94.
Department of Agriculture and Fisheries (2002) Statistics 2001, Trinity: DAF.
Department of Agriculture and Fisheries (DAF) (2004) Code of Good AgriculturalPractice for the Protection of Water (The Water Code) Jersey, Trinity: DAF.
Department of the Environment (1986) Pollution Paper No. 26 by the Nitrate Co-ordination Group, London: HMSO.
Department of the Environment, Food and the Regions (2000) Fertiliser Recommen-dations for Agricultural and Horticultural Crops RB 209, London: HMSO.
Dinar, A. (ed.) (2000) The Political Economy of Water Pricing Reforms, New York:Oxford University Press.
Dow, S.C. (2002). Economic Methodology: an Inquiry. Oxford: Oxford University Press.

8/12/2019 1843391775
http://slidepdf.com/reader/full/1843391775 218/230
Bibliography 207
Dubourg, W.R. (1993) Sustainable management of the water cycle in the United Kingdom(Norwich, Centre for Social and Economic Research on the Global Environment).
Dubourg, W.R. (1995) Pricing for sustainable water abstraction in England and Wales: a comparison of theory and practice (Norwich, Centre for Social and EconomicResearch on the Global Environment).
Dyson, J.R. 1994. Accounting for non-accounting students, London, Pitman, 3rd edn.Earl, P. E. (1995). Microeconomics for Business and Marketing . Cheltenham: Edward
Elgar.Environment Agency (1993–2006) Demand Management Bulletin,
www.environment-agency.gov.uk/ savewaterEnvironment Agency (2002) Demand Management Bulletin, 54 (August): 3.Environment Agency. 2002. Drought Plan Guideline. Bristol: Environment Agency.Environment Agency Anglian Region. 2001. Water Resources for the Future: a Strategy
for Anglian Region. Peterborough: Environment Agency.Environment Agency Anglian Region. 2003. 2003 Regional Drought Management
Plan – Final Plan. Peterborough: Environment Agency.European Commission (1991) Urban Waste Water Treatment Directive 91/271/EEC,
Brussels: EEC.Fass, S. (1988). Political Economy in Haiti: the Drama of Survival. (New Brunswick NJ:
Transaction Books).Foster, S., B. Adams, M. Morales, S. Tenjo (1993) Groundwater protection strategies: a
guide towards implementation (Lima, CEPIS).Foster, I.D.L., Ilbery, B.W., Hinton, M.A. (1989) ‘Agriculture and water quality: a
preliminary examination of the Jersey nitrate problem’, Applied Geography 9: 95–113.
Fowler, S. (1995) Water wise: the RSPB’s proposals for using water wisely (Sandy, RoyalSociety for the Protection of Birds).
Foster, S.S.D. (1976) ‘The vulnerability of British groundwaters to pollution byagricultural leachates, MAFF Technical Bulletin, 32: 68–91.
Foster, S.S.D., Bridge, L.R., Cripps, A.C., Darling, W.G. (1977) The Groundwater Nitrate Problem, London: Institute of Geological Sciences.
Frederiksen HD. 1996. Water crisis in developing world: misconceptions about solu-tions. Journal of Water Resources Planning and Management 122 (2): 79–87.
Frigot, D. (2001) Jersey’s Rural Heritage: a Farming Way of Life, Jersey: Royal Jersey Agricultural & Horticultural Society.
Gale, R., Barg, S. & Gillies, A. (1995). Green Budget Reform: an International Casebook of Leading Practices, London: Earthscan.
Gass, G.M., Robins, N.S., MacDonald, A.M. (1996) Groundwater Resources Degra- dation in Jersey: Socio-Economic Impacts and their Mitigation, Keyworth: BritishGeological Survey.
Gazmuri Schleyer R. & Rosegrant MW. (1996) Chilean water policy: the role of water
rights, institutions and markets. Water Resources Development 12 (1): 33–48.Giddens, A. (1984). The Constitution of Society: Outline of the Theory of Structuration.
Cambridge: Polity Press.Gleick, P.H., P. Loh, S.V. Gomez, J. Morrison (1995)California water 2020: a sustainable
vision (Oakland, Pacific Institute for Studies in Development, Environment andSecurity).
Green, A.R., Feast, N.A., Hiscock, K.M., Dennis, P.F. (1998) ‘Identification of thesource and fate of nitrate contamination of the Jersey bedrock aquifer using stablenitrogen isotopes’, in Robins (ed.) pp. 23–35.

8/12/2019 1843391775
http://slidepdf.com/reader/full/1843391775 219/230
208 Bibliography
Green, C.H. (1990). Economics in a Time of Failure, London, Middlesex Polytechnic,Flood Hazard Research Centre Publication No. 180.
Guthrie, J. (2005). Homes will not ruin countryside, says minister. Financial Times17–18 September.
Haddad BM. (2000) Rivers of Gold: Designing Markets to Allocate Water in California.
Washington DC: Island Press.Hearne RR. & Easter KW. (1995) Water Allocation and Water Markets: an Analysis of
Gains-from-Trade in Chile. Washington DC: World Bank.Hills, J.S. (1995). Cutting Water and Effluent Costs, Rugby: Institution of Chemical
Engineers.Hodge, C.A.H. & Seale, R.S. (1966). The Soils of the District around Cambridge.
Harpenden: Agricultural Research Council.Hodgson, G. M. (1994). Cultural and institutional influences on cognition. Hodgson,
G.M., Samuels, W.J. & Tool, M.R. (eds). Institutional and Evolutionary Economics A-K. Cheltenham: Edward Elgar.
Hodgson, G., Samuels, W. & Tool, M. (Eds). (1994). The Elgar Companion to Institu-tional and Evolutionary Economics, Cheltenham: Edward Elgar.
Hoekstra, A.Y. and P.Q. Hung. 2002. “Virtual water trade: a quantification of virtual water flows between nations in relation to international crop trade’’, Value of Water Research Report Series No 11. Delft: The Netherlands: IHE.
van Hofwegen P. & Svendsen M. 2000. A Vision of Water for Food and Rural Develop- ment. The Hague: Netherlands Directorate General for Development Cooperation.
Holmes, M.R.J. (1979) ‘The place of applied nitrogen in crop production’in Chemistry and Agriculture, London: Royal Society of Chemistry.
House of Lords (2003). Water Bill [HL]. London: Stationery Office.Howard, J. (1999) La Rosiere Jersey: the Largest Freshwater Reverse Osmosis Plant
in the British Isles, St. Helier: JNWWC.Howsam, P. & R.Carter (Eds) (1996) Water policy: allocation and management in
practice (London, Spon).
Hotte, M.H.H., van der Vlies, J. & Hafkamp, W.A. (1995). Levy on surface water inthe Netherlands, in Gale et al. op.cit. pp. 220–230.
Jersey New Waterworks Company Limited (1998) A Description of the Water Supplyof Jersey, St. Helier: JNWWC.
Jersey New Waterworks Company Limited (2002) Annual Report and Accounts for theYear Ended 31st December 2001, St Helier: The Jersey New Waterworks CompanyLimited.
Kaminsky, G., Lizondo, S., Reinhart, C. (1998). Leading indicators of currency crises. IMF Staff Papers (45) 1–48.
Kay M., Franks T., Smith L. (1997) Water: Economics, Management and Demand.London, E. & F.N. Spon.
Kemper, K. (1996) The cost of free water: water resources allocation and use in the Curu
valley, Cear a, Northeast Brazil (Linkoping, University of Linkoping).Kemper KE. (2001) Markets for tradable water rights. In Meinzen-Dick RS. &
Rosegrant MW. (2001a).Kemper KE. & Olson D. (2000) Water pricing: the dynamics of institutional change
in Mexico and Ceara, Brazil. In Dinar A. (ed) pp: 339–357.Kinnersley, D. (1994) Coming clean: the politics of water and the environment (London,
Penguin).Koubratova M. 1997. Water pricing for irrigation during the transition to market econ-
omy in Bulgaria, in Kay M.,Franks T., Smith L. 1997.Water: Economics,Management and Demand. London: Spon Press.
8/12/2019 1843391775
http://slidepdf.com/reader/full/1843391775 220/230
Bibliography 209
Kraemer, A. (1995) Water resources taxes in Germany in: R. Gale & S. Barg with A. Gillies (Eds) Green budget reform: an international casebook of leading practices(London, Earthscan) chapter 16.
Kuhn,T.S. (1970)The Structureof Scientific Revolutions, Chicago: University of ChicagoPress.
Langley, J. & Kett, S. (2005) Quinquennial Review of Jersey Flowing Waters (1998–2004).
Lant, C. 2003. ‘Commentary’, Water International 28 (1): 113–115.Lee, F. (1994). Full cost pricing, in Hodgson et al., op.cit. Vol. 1, 262–266.Linn, J.F. (1983). Cities in the Developing World. New York: Oxford University Press.London Assembly Environment Committee (2005.) Down the Drain: London’s Water
Usage and Supply. LAEC, London.Lott, J.E., Parkinson, R.J., Fuller, M.P., Beattie, L. (1999) Nitrates and Phos-
phates in Surface Water on Jersey: Sources and Land Management Strategies,Plymouth: Department of Agriculture and Food Studies of the University of Plymouth.
Lott, J.E., Parkinson, R.J., Fuller, M.P., Beattie, L. (1999) Nitrates and Phosphates in
Surface Water on Jersey: Sources and Land Use Management Strategies, Plymouth:University of Plymouth Department of Agriculture and Food Studies; and HowardDavis Farm: States of Jersey Department of Agriculture and Fisheries.
Lundqvist, J. (1998) ‘Avert looming hydrocide’, Ambio 27 (6): 428–433.Lundqvist, J., U. Lohm, M. Falkenmark 1985. Strategies for river basin management:
environmental integration of land and water in a river basin, Dordrecht, Reidel.McDonald, A.T. & D. Kay (1988) Water resources: issues and strategies (Harlow,
Longman).MacRae, D. & Whittington, D. (1988). Assessing preferences in cost-benefit analysis:
reflections on rural water supply evaluation in Haiti. Journal of Policy Analysis and Management, 7 , (20), 246–263.
Maslow, A. (1954). Motivation and Personality. New York: Harper and Row.
Matthews, A. & Carter, A. (1999) An Assessment of the Persistence and Mobility of Chlorthal Dimethyl and Chlorthal, Keyworth: ADAS.
Meinzen-Dick R. & Rosegrant MW. 1997. Water as an economic good: incentives,institutions, and infrastructure, in Kay M., Franks T., Smith L. 1997. Water: Eco- nomics, Management and Demand. London: Spon Press.
Meinzen-Dick RS. & Rosegrant MW. (2001a) Overview. In Meinzen-Dick, R. &Rosegrant, M.W. (eds) (2001b).
Meinzen-Dick RS. & Rosegrant MW. (eds) (2001b) Overcoming Water Scarcity andQuality Constraints. Washington, IFPRI.
Merrett, S. 1997. Introduction to the economics of water resources: an international perspective, London, UCL Press.
Merrett, S. (1999a) ‘The regional water balance statement: a new tool for water
resources planning’, Water International, 24 (3): 268–274.Merrett, S. (1999b). The political economy of water abstraction charges, Review of
Political Economy 11, (4), 431–442.Merrett, S. (2001) Behavioural Studies of the Domestic Demand For Water Services
In Africa, Water Policy, 4 (1): 69–81, 2002.Merrett, S. (2002a) Water for Agriculture: Irrigation Economics in International
Perspective, London: Spon Press.Merrett S. 2002b. Twelve theses on the cost and use of irrigation water. Irrigation and
Drainage 51 (3): 265–268.

8/12/2019 1843391775
http://slidepdf.com/reader/full/1843391775 221/230
210 Bibliography
Merrett, S. 2003. “Virtual water and Occam’s Razor’’, Water International 28 (1):103–105.
Merrett, S. (2007) ‘Behavioural studies of the domestic demand for water services in Africa’ In The Price of Water (2nd Edition). IWA Publishing, London.
Merrett, S. 2008. Farm-level drought management: an irrigation case-study from the
UK., The Price of Water: Studies in Water Resource Economics and Management2nd edition, London: IWA Publishing.
Merrett, S. (2005a) ‘Integrated water resources management and the hydrosocial bal-ance’, in Merrett, S. (2005c): 20–36.
Merrett, S (2005a). The Price of Water: Studies in Water Resource Economics and Man- agement. International Water Association, London.
Merrett, S. (2005b) ‘Deconstructing households’ willingness-to-pay for water in low-income countries’, in Merrett, S. (2005c): 118–131.
Merrett, S. (2005b). Catchment water deficits in the 21st century. Water Policy, 7 (2):141–149.
Merrett, S. (2005c) The Price of Water: Studies in Water Resource Management andEconomics, London: IWA.
Merrett, S. (2005c). Catchment water deficits: an application to Zambia’s Kafue RiverBasin. Water Policy (forthcoming).
Merrett, S. & C. Sharp (1991) The denarius hypothesis: house price inflation in owner-occupied London, in: M. Satsangi (Ed.) Changing housing finance systems (Glasgow,Centre for Housing Research, pp. 271–312).
Miloradov, M. & P. Marjanovic 1998. Guidelines for conducting water resources assess- ment, Studies and reports in hydrology No. 55, Paris, UNESCO.
Morris, J. et al. 2003. The sustainability of irrigation in England and the impact of water pricing and regulation policy options. In Maksimovic, C., Butler, D. Memon,F.A. (eds) 2003. Advances in Water Supply Management. Lisse: Swets & Zeitlinger:623–632.
Mu, X., Whittington, D. & Briscoe, J. (1990). Modelling village water demand
behavior: a discrete choice approach. Water Resources Research, 26, 521–529.National Rivers Authority (1993) NRA water resources strategy (Bristol, National Rivers
Authority).National Rivers Authority(1995) 1995–96annual abstraction charges (Bristol, National
Rivers Authority).National Rivers Authority Thames Region 1994. Future water resources in the Thames
region: a strategy for sustainable management, Reading, NRATR.Office for National Statistics (2004). Regional Gross Value Added. ONS, London.Office of Water Services (2005), Security of Supply, Leakage and the Efficient Use of
Water 2004–05 Report, Birmingham: Ofwat.Ofwat. (1994). 1993–94 Report on the Cost of Water Delivered and Sewage Collected ,
Birmingham: Ofwat.
O’Riordan, T. (ed.) (1995) Environmental Science for Environmental Management,Harlow: Longman.
Owen, D. 1994. A Review of Techniques for Systematic Client Consultation. World Bank:Southern Africa Department.
Oxford University Press (1979) The Compact Edition of the Oxford English DictionaryVolume I . Oxford: Oxford University Press.
Parkinson, R.J, Beattie, L., Fuller, M., Hillman, J., Lott, J. McCrory, D. (2001) Nitrates and Phosphates in Jersey Surface Waters: Sources and Land Management Strategies.Jersey: Department of Agriculture and Fisheries.
Pearce, F. (2003) ‘Replumbing the planet’, New Scientist, 7th June: 30–34.

8/12/2019 1843391775
http://slidepdf.com/reader/full/1843391775 222/230
Bibliography 211
Perry,C.J.(1996)TheIIMI Water Balance Framework: a Model forProject Level Analysis,Colombo: International Irrigation Management Institute.
Perry CJ. 1996. Alternative Approaches to Cost Sharing for Water Service to Agriculturein Egypt. Colombo: International Irrigation Management Institute.
Pigou, A.C. (1932) The economics of welfare (London, Macmillan).
Pigram, J.J., R.J. Delforce, M.L. Coelli, V. Norris, G. Antony, R.L. Anderson, W.F.Musgrave (1992) Transferable water entitlements in Australia (Armidale, Centre forWater Policy Research).
Public Services Department (2000) Water Made Clear: Guidance Notes on the Provi-sions of the Water Pollution (Jersey) Law, 2000, Bellozanne: PSD.
Rees, J. with S. Williams (1993) Water for life: strategies for sustainable water resource management (London, Council for the Protection of Rural England).
Rees, J., S. Williams, J. Atkins, C. Hammond, S. Trotter (1993) Economics of water resource management (Hull, University of Hull, R&D note 128).
Reisner M. (1993) Cadillac Desert: the American West and its Disappearing Water . NewYork: Penguin Books.
Ricardo, D. (1821) On the principles of political economy and taxation (Cambridge,
Cambridge University Press, edited by P. Sraffa, 1951).Robins, N.S. (ed.) (1998) Groundwater Pollution, Aquifer Recharge and Vulnerability,
London: Geological Society.Robins, N.S. (2000) The Water Resources of Jersey: an Overview, Wallingford: British
Geological Survey.Robins, N.S. & Smedley, P.L. (1998) The Jersey Groundwater Study, Keyworth: British
Geological Survey.Robinson, J. & J. Eatwell (1974) An introduction to modern economics (London,
McGraw-Hill, revised edition).Rogers, P. 1991. What water managers and planners need to know about climate change
and water resources management, Proceedings of the first national conference on climate change and water resources management, US Army Corps of Engineers.
Rogers, P. 1992. Comprehensive water resources management: a concept paper ,Washington DC, World Bank.
Rosegrant MW. & Binswanger HP. (1994) Markets in tradable water rights: potentialfor efficiency gains in developing country water resource allocation. World Devel- opment 22 (11): 1613–1625.
Rosegrant MW. & Gazmuri Schleyer R. (1996) Establishing tradable water rights:implementation of the Mexican water law. Irrigation and Drainage Systems: pp. 263–279.
Rosegrant MW. & Meinzen-Dick RS. (1996) Water resources in the Asia-Pacificregion: managing scarcity. Asian-Pacific Economic Literature 10 (2): 32–53.
Rosegrant MW. & Ringler C. (1998) Impact on food security and rural developmentof transferring water out of agriculture. Water Policy 1 (6): 567–86.
Russell, B. (1996) History of Western Philosophy and its Connection with Political and Social Circumstances from the Earliest Times to the Present Day, London:Routledge.
Sandmo, A. (1987). Public goods, in Eatwell, J., Milgate, M. &, Newman, P. (Eds),The New Palgrave: a Dictionary of Economics, pp. 1061–1067, London: Macmillan.
Schiffler M. (1997) Intersectoral water markets: a solution for the water crisis in aridareas? In Kay M., Franks T., Smith L. (1997).
Schiffler, M., H. Koppen, R. Lohmann, A. Schmidt, A. Wachter, C. Widmann (1994)Water demand management in an arid country: the case of Jordan with special referenceto industry (Berlin, German Development Institute).

8/12/2019 1843391775
http://slidepdf.com/reader/full/1843391775 223/230
212 Bibliography
Scott Wilson Piesold (2003), Integrated Kafue River Basin Environmental Impact Study Main Report, Ashford: Scott Wilson Piesold.
Seckler D. et al. 2000. World Water Supply and Demand: 1995 to 2025. Colombo:International Water Management Institute.
Shiklomanov, I.A. 1997. Assessment of water resources and water availability in the
world, Stockholm, World Meteorological Organization.Shiklomanov, I.A. (2000). Appraisal and assessment of world water resources. Water
International 25(1), 11–32.Simon, H.A. (1959). Theories of decision-making in economics and behavioural sci-
ences. American Economic Review, 49, 253–283.Simon, H.A. (1982) Models of Bounded Rationality: Volume 1, Economic Analysis
and Public Policy; Volume 2, Behavioural Economics and Business Organization.Cambridge, Mass.: MIT.
Soderbaum, P. (1994) Environmental policy, in: Hodgson et al, vol. I, pp. 193–199.Steppacher, R. (1994) K.William Kapp, in: Hodgson et al, vol. I, pp. 435–441.Talbot, R. & Whiteman, R. (1996). East Anglia and the Fens. London: Cassell.Tuddenham, M. (1995) The system of water charges in France in: R.Gale & S. Barg
with A. Gillies (Eds) Green budget reform: an international casebook of leading practices (London, Earthscan, chapter 14).
Turner, R.K. & W.R. Dubourg (1993) Water resource scarcity: an economic perspective(Norwich, Centre for Social and Economic Research on the Global Environment).
Veblen, T. (1919). The Place of Science in Modern Civilisation. New Brunswick: Trans-action Books.
Watson RT. et al. 2001. Climate Change 2001: Synthesis Report of the Intergovernmental Panel on Climate Change. Cambridge and New York: www.ipcc.ch/pub/syreng.htm
Whittington, D. 1998. Administering contingent valuation surveys in developing coun-tries. World Development, 26(1), 21–30.
Whittington, D., Briscoe, J., Mu, X., & Barron, W. (1990A). Estimating the willingnessto payfor water services in developing countries: a case study of the useof contingent
valuation surveys in Southern Haiti. Economic Development and Cultural Change, 38(2), 293–311.
Whittington, D. & Choe, K. (1992). Economic Benefits Available from the Provision of Improved Potable Water Supplies. Washington DC: US Agency for InternationalDevelopment.
Whittington, D., Choe, K. & Lauria, D. (1997). The effect of giving respondents “timeto think’’ on tests of scope: an experiment in Calamba, Philippines, in R.J. Kopp,W.W. Pommerehne, & N. Schwarz (eds), Determining the Value of Non-marketedGoods:: Economic, Psychological and Policy Relevant Aspects of Contingent Valuation Methods, Rotterdam: Kluwer.
Whittington, D., Davis, J., & McClelland, E. (1998). Implementing a demand-drivenapproach to community water supply planning: a case study of Lugazi, Kenya. Water
International, 23, (3), 134–145.Whittington, D., Lauria, D.T., Choe, K., Hughes, J.A., Swarna, V. & Wright, A.M.
(1993). Household sanitation in Kumasi, Ghana: a description of current practices,attitudes, and perceptions. World Development, 21, 733–748.
Whittington, D., Lauria, D. & Mu, X. (1991). A study of water vending and willingnessto pay for water in Onitsha, Nigeria. World Development, 19, 179–198.
Whittington, D., Lauria, D. & Mu, X. (1991) ‘A study of water vending and willingnessto pay for water in Onitsha, Nigeria’, World Development 19 (179-198). The materialin this chapter originally appeared in the journal Water Policy, Volume 8, Number4, 2006: pp. 339–349.

8/12/2019 1843391775
http://slidepdf.com/reader/full/1843391775 224/230
Bibliography 213
Whittington, D., Lauria, D. Okun, D.A. & Mu, X. (1989). Water vending activities indeveloping countries: a case study of Ukunda, Kenya. Water Resources Development, 5, 158–167.
Whittington, D., Lauria, D., Wright, A.M., Choe, K., Hughes, J.A. & Swarna, V. (1993).HouseholddemandforimprovedsanitationservicesinKumasi,Ghana:acontingent
valuation study, Water Resources Research, 29, (6), 1539–1560.Whittington, D., Mu, X. & Roche, R. (1990). Calculating the value of time spent
collecting water: some estimates for Ukunda, Kenya. World Development, 18, 269–280.
Whittington, D., Okorafor, A., Okore, A. & McPhail, A. (1990). Strategy for costrecovery in the rural water sector: a case study of Nsukka District, Anambra State,Nigeria, Water Resources Research, 26, 1899–1913.
Whittington, D., Smith, V.K., Okorafor, A., Okore, A., Liu, J.L., & McPhail, A. (1992).Giving correspondents time to think in contingent valuation studies: a developingcountry application. Journal of Environmental Economics and Management, 22,205–225.
Whittington, D. & Swarna, V. (1994). The Economic Benefits of Potable Water Sup-
ply Projects to Households in Developing Countries. Manila: Asian DevelopmentBank.
Whittington, D., Wu, X. & Sadoff, C. (2005). Water resources management in the Nilebasin: the economic value of cooperation, Water Policy 7 (3), 227–252.
Willows RI. & Connell RK. Eds. 2003. Climate Adaptation: Risk, Uncertainty and Decision-making . Oxford: UK Climate Impacts Programme.
Winpenny, J. (1994) Managing water as an economic resource (London, Routledge).World Bank (1975). Issues in Village Water Supply. Washington: World Bank.World Bank Water Demand Research Team (1993). The demand for water in rural
areas: determinants and policy implications, The World Bank Research Observer ,8(1), 47–70.
World Health Organisation (1970) International Standards of Drinking Water , 3rd Edi-
tion, Geneva: WHO.Young, C.P. & Gray, E.M. (1978) Nitrate in Groundwater , Medmenham: Water
Research Centre.Zaman, M. (1996) Sustainable irrigation management through cost recovery system,
in: Howsam & Carter, op. cit. pp. 221–227.
WEBSITES
http://www.anglianwater.co.uk/ http://www.environment-agency.gov.uk/
www.environment-agency.gov.uk/regions/thames/ www.thames-water.com/

8/12/2019 1843391775
http://slidepdf.com/reader/full/1843391775 225/230
Index
A
abstraction charges, scope of developing a taxonomy of charge-setting
principles, 93–96impact on users, 98–99and sustainable catchment management,
96–98and theory of rent, 92–93
Anglian region, drought management of,
59–60 Anglian Water Services’s drought plan,
63–64drought plan and water economy,
64–65Environment Agency Anglian Region’s
drought plan, 62–63regulatory instruments, 65–67 water economy of the region, 60–62 water utilities in the region, 60
Anglian Water Services Limited (AWS), 44,60, 63–64
B
baseline statements, for regional waterbalance, 10, 21, 38–39
behavioural studies, of African domestic water services
discrete choice model, rationale for,113–114
market networks, 106–108methodology, 110–113uses of water, 108–110 water demand school’s work, on the cities
of Kumasi and Onitsha, 106
Bellozanne sewage treatment works (STW),33
biological oxygen demand (BOD), 136black reservoir, 14Bruns, B. R., 83
C
catchment area, of water, 2Dwyer catchment, 160–164general hypothesis of surplus and deficit,
165global deficit, 160–164hydrosocial balance, 159 water surplus, 5–6
catchment’s water economyinstream, 38outstream, 41rainfed, 38
chalk groundwater, 61charge-setting taxonomy
average total cost charge, 94environmental regulation charge, 94incentives charge, 95–96marginal cost charge, 94–95market-clearing charge, 93–94no charge, 93Pigovian charge, 95revenue-maximizing charge, 93
chemical oxygen demand (COD), 136climate change, 582004 Code of Good Agricultural Practice for
the Protection of Water, 143Colorado-Big Thompson scheme, 94compensating non-leakage (CNL), 45
214

8/12/2019 1843391775
http://slidepdf.com/reader/full/1843391775 226/230
Index 215
concessions, in trading of water-rights, 81costs, for access to water, 3–4
D
demand, for water, 2–3
consumption of water, 88economic demand for water, 88–89need for water, 88supply-side leakage and evaporation of
water, 89–90use of water, 87–88for waste water services, 133–135
demand and supply functions, for farmers’ water-rights, 78–79
density drivers, for catchment water deficitsand catchment water surpluses, 180, 199
disposal chargesenvironmental regulator, 137–138objectives, 132–133
and water utility, 136–137DOE Pollution Paper No. 26 (DoE 1986), 141domestic water and waste water services, in
the low-income countries, 104–106double-entry water accounting, 10, 15drought
defined, 58management, see Anglian region, drought
management of Dubourg, W. R., 96Dwyer catchment
population, productivity and output changeover time, 161
redemptive options, 161–164
E
EC drinking water standards (80/778/EC),141
91/676/EC Nitrates Directive, 142economic demand, for water, 88–89EC’s Urban Waste Water Treatment Directive
(91/271/EC), 149effluent disposal, 131–132engineering variables, 19England and Wales British Waterways, 15EU’s Urban Waste Water Treatment
Directive, 33evapotranspiration (ET) losses, of water, 41
F
farmers’ supply function, 80farm-level drought management strategies
Anglian Region, description of, 44informational strategy, 51–56infrastructural strategy, 47–50review of the activities of the agribusiness,
45–47financial accounting practice and regional
water balance statement, 13
G
Giddens, Anthony, 110gold reservoir, 15green reservoir, 15groundwater and surface water abstraction,
13
H
Haddad, B. M., 81household water use behaviour, 4–5hydrological variables, 19hydrosocial balance, 20–22, 38
of a catchment, 39for a defined region in 2003, 87of Island of Jersey, 25for a specified area in a base year, 45for a specified region in a base year and a
scenario year, 40
of Thames catchment, 183–184hydrosocial cycle, 10–11, 13flow types in, 23
I
industrial effluent policy and uses of waterdemand for waste water services,
133–135disposal charges, 136–138generation and regulation of industrial
effluent, 131–132measurement of pollution, 135–136objectives of disposal charges, 132–133
instream water, case of, 1
integrated water resources management(IWRM)
bridge between quality and quantity,21–24
and hydrosocial balance, 20–22Island of Jersey, case example of,
24–34International Hydrological Programme, 19
Introduction to the Economics of Water Resources: An International Perspective I,9
Island of Jerseyhydrosocial balance of states of, 25nitrate pollution on, see nitrate pollution
and management, on Island of Jerseyphysical geography and hydrology, 24 water quality, 28–34 water supply, 24–27 water use, 27–28
Itezhi-Tezhi reservoir, 170
J
Jersey’s farmers and irrigation methods, 29Jersey Water Code, 150Jersey Water (1972) Law, 144

8/12/2019 1843391775
http://slidepdf.com/reader/full/1843391775 227/230
216 Index
K
Kafue Gorge Upper (KGU) hydroelectricpower station, 170
Kafue River Basindescription, 168–170
economic demand for water, 171environmental requirements for,
172–174estimated total surface water abstraction
rights and the available resource in cubicmetres/second, 171, 173
food source of, 172groundwater abstraction, 170–171
Kemper, Karin, 83–84Kyoto consensus, on water, 74–75
L
leakage data, of Thames Catchment area,199–203
leather industry and effluent wastes, 134
M
maximum admissible concentration (MAC),31–33, 141–142
Meinzen-Dick, R. S., 81, 83Merrett’s law, on regional water
balance, 16The Middle East Water Question:
Hydropolitics and the Global Economy,68, 73
N
nitrate pollution and management, on Islandof Jersey
benefits of, 149–155the department of agriculture and
fisheries, water quality management by,143–144
of groundwater and surface waters,141–143
households, water quality management by,147–148
the Jersey New Waterworks Company Ltd.(JNWWC),water quality managementby, 144–147
waste water discharges, water qualitymanagement of, 148–149
O
Occam’s razor, to the virtual water thesis,71
outstream water, case of, 1
P
partial sale, of the farmer’s water-rights,81–82
pollution measurements, 135–136pre-treatment of water, 134
R
rainwater collection, 13, 26
recycling, of water, 2, 13–14regional water balance statement
change statements and its use, 16–19formulation of, 10–13storage capacity of regions, 14–15supply sources, 12–14use behaviour category wise, 12, 15
rent theory and abstarction charges, 92–93reused water, 2Ricardo, D., 92–93river basin’swater economy
basin water productivity, 41benefits and its sharing, 37–42
Rosegrant, M. W., 81
rural–urban market theory in abstractionrights, limits of
concessions, 81legal context, 82–83partial sale of the farmer’s water-rights,
81–82sale of land, 81–82third party effects, 83–84time-scale propensities, 81transaction costs, 84–85 water rights markets, 84
Russell, Bertrand, 71
S
sale of land and water-rights, 81–82scenario statements, for regional water
balance, 10, 21, 38–39Schiffler, M. H., 79Scott Wilson Piesold study, of groundwater
abstraction for the Kafue River Basin,170
seawater desalination, by JNWWC, 145–146Silver Birches plc, review of the activities of
the agribusinesscompany information, 45drought warning chart, 55hydrosocial balance for, 46infrastructural planning, 51–56monthly Anglian Water Services, 47purchases of irrigation water, 54supply planning at, 48–50, 52–53 water supply and use, 46–47
soakaways and septic tanks,recommendations on, 30
storage capacity, of regions, 14–15supply-side leakage and evaporation, of
water, 89–90sustainable catchment management and
abstraction charges, 96–98

8/12/2019 1843391775
http://slidepdf.com/reader/full/1843391775 228/230
Index 217
T
Thames catchment, 14, 41, 91density analysis of, 186–188economic production, 184–185hydrology of, 181
hydrosocial balance, 183–, 183–184increase in number of houses and flats,
194–196leakage losses in, 199–203micro-components of householdwater use
in, 194population, 183–184, 192–193range of environmental services, 181tipping process during deficit, 188–189useful information on, 192 water deficit, 185–186 water pricing, 185
theses, on costs and use of irrigation water,101–103
third party effects, in trading of water-rights,83–84
time-scale propensities, in trading of water-rights, 81
transaction costs, in trading of water-rights,84–85
U
UK Water Bill, 43urban actors’ demand function, 78–79
V
Val de la Mare catchment’s nitrogen export
coefficients, 30 virtual water concept, 7–8
flaws with Allan’s thesis, 70, 73–74importation of, in MENA region, 70and Kyoto consensus, 74–75as a metaphor, 72–73Occam’s razor to the virtual water thesis, 71
W
water deficit concept, 69 water economy, 59, see also river basin’s water
economyWater Pollution (Jersey) Law 2000, 29–30,
148–149 water quality, in Island of Jersey
household discharges, 30household usage behaviour, 30JNWWC supplies, 30–33Public Services Department discharges,
33–34by rainfall and irrigation, 29
Water Resources Act 1991, 63 water resources management balance
(WRMB), 19 water-rights, 5
farmer’s abstraction rights, 80rural–urban market theory in abstraction
rights, limits of, 80–85and urban demands, 78–80
water services, in any region, 106Whittington, Dale, see behavioural
studies, of African domestic waterservices
willingness-to-pay concept, in low-incomecountries
anchor prices, 126–128data collection, 118–119private agendas, 124–126problems in the application of demand
theory to survey practice, 119–120sanctions for non-payment of the water bill,
123–124and substitutes, 121–123survey methods, 117–118
vs. ability-to-pay, 120–121World Meteorological Organization (WMO),
19World Water Forum, in Kyoto, 74–75

8/12/2019 1843391775
http://slidepdf.com/reader/full/1843391775 229/230

8/12/2019 1843391775
http://slidepdf.com/reader/full/1843391775 230/230