1950 annual report of portsmouth, va., sewage treatment plant
TRANSCRIPT
1950 Annual Report of Portsmouth, Va., Sewage Treatment PlantAuthor(s): B. F. RockecharlieSource: Sewage and Industrial Wastes, Vol. 23, No. 8 (Aug., 1951), pp. 1048-1050Published by: Water Environment FederationStable URL: http://www.jstor.org/stable/25031675 .
Accessed: 15/06/2014 06:51
Your use of the JSTOR archive indicates your acceptance of the Terms & Conditions of Use, available at .http://www.jstor.org/page/info/about/policies/terms.jsp
.JSTOR is a not-for-profit service that helps scholars, researchers, and students discover, use, and build upon a wide range ofcontent in a trusted digital archive. We use information technology and tools to increase productivity and facilitate new formsof scholarship. For more information about JSTOR, please contact [email protected].
.
Water Environment Federation is collaborating with JSTOR to digitize, preserve and extend access to Sewageand Industrial Wastes.
http://www.jstor.org
This content downloaded from 195.34.78.61 on Sun, 15 Jun 2014 06:51:28 AMAll use subject to JSTOR Terms and Conditions
1048 SEWAGE AND INDUSTRIAL WASTES August, 1951
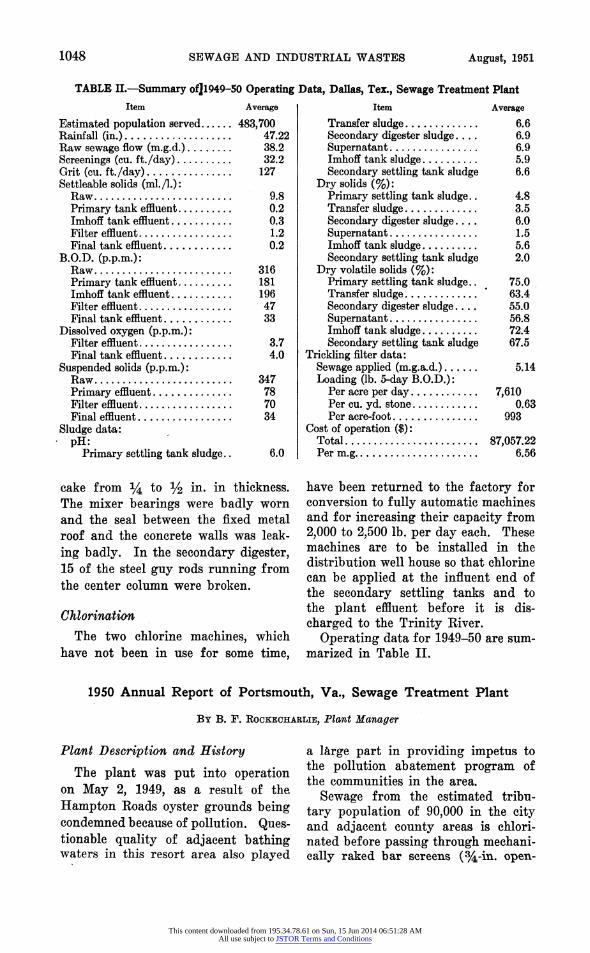
TABLE II.-Summary of]1949-50 Operating Data, Dallas, Tex., Sewage Treatment Plant
Item Average Item Average
Estimated population served...... 483,700 Transfer sludge ............. 6.6 Rainfall (in.) ................... 47.22 Secondary digester sludge.... 6.9
Raw sewage flow (m.g.d.)........ 38.2 Supernatant ................ 6.9
Screenings (cu. ft./day) .......... 32.2 Imhoff tank sludge .......... 5.9 Grit (cu. ft./day) ............... 127 Secondary settling tank sludge 6.6
Settleable solids (ml./l.): Dry solids (%): Raw ........................ 9.8 Primary settling tank sludge.. 4.8
Primary tank effluent.......... 0.2 Transfer sludge ............. 3.5
Imhoff tank effluent........... 0.3 Secondary digester sludge .... 6.0
Filter effluent ................. 1.2 Supernatant ................ 1.5
Final tank effluent............ 0.2 Imhoff tank sludge ......... 5.6 B.O.D. (p.p.m.): Secondary settling tank sludge 2.0
Raw ........................ 316 Dry volatile solids (%):
Primary tank effluent .......... 181 Primary settling tank sludge.. 75.0
Imhoff tank effluent .......... 196 Transfer sludge ............. 63.4
Filter effluent ................. 47 Secondary digester sludge.... 55.0
Final tank effluent............ 33 Supernatant ................ 56.8
Dissolved oxygen (p.p.m.): Imhoff tank sludge.......... 72.4
Filter effluent................. 3.7 Secondary settling tank sludge 67.5
Final tank effluent............ 4.0 Trickling filter data:
Suspended solids (p.p.m.): Sewage applied (m.g.a.d.)...... 5.14 Raw ........................ 347 Loading (lb. 5-day B.O.D.):
Primary effluent.............. 78 Per acre per day............ 7,610 Filter effluent................. 70 Per cu. yd. stone............ 0.63
Final effluent ................. 34 Per acre-foot .............. 993
Sludge data: Cost of operation ($): pH: Total........................ 87,057.22
Primary settling tank sludge.. 6.0 Per m.g ...................... 6.56
cake from 1/4 to /2 in. in thickness. The mixer bearings were badly worn and the seal between the fixed metal
roof and the concrete walls was leak
ing badly. In the secondary digester, 15 of the steel guy rods running from the center column were broken.
Chlorination
The two chlorine machines, which have not been in use for some time,
have been returned to the factory for conversion to fully automatic machines and for increasing their capacity from 2,000 to 2,500 lb. per day each. These machines are to be installed in the distribution well house so that chlorine can be applied at the influent end of the secondary settling tanks and to the plant effluent before it is dis charged to the Trinity River.
Operating data for 1949-50 are sum marized in Table II.
1950 Annual Report of Portsmouth, Va., Sewage Treatment Plant
BY B. F. ROCKECHARLIE, Plant Manager
Plant Description and History The plant was put into operation
on May 2, 1949, as a result of the
Hampton Roads oyster grounds being condemned because of pollution. Ques tionable quality of adjacent bathing
waters in this resort area also played
a large part in providing impetus to the pollution abatement program of the communities in the area.
Sewage from the estimated tribu tary population of 90,000 in the city and adjacent county areas is chlori nated before passing through mechani cally raked bar screens (3/4-in. open
This content downloaded from 195.34.78.61 on Sun, 15 Jun 2014 06:51:28 AMAll use subject to JSTOR Terms and Conditions
Vol. 23, No. 8 EXTRACTS FROM OPERATION REPORTS 1049
ings) and a grit chamber prior to re ceiving primary treatment in straight line sedimentation tanks. Separate sludge digestion is provided by one fixed cover digester and one floating cover digester, each of 375,000-gal. capacity, designed for either parallel single-stage operation or as a two
stage system in series. The latter method is employed at present. Di gested sludge is elutriated, dosed with ferric chloride, and dewatered on two 150-sq. ft. vacuum filters. Dried sludge cake is utilized by the city on public grounds.
Personnel
The 13-man operating force consists of a plant manager, a chemist, a main tenance man, a maintenance helper, a chief operator, four shift operators, and four shift helpers.
General Activities
From the beginning, the reputation of the plant has suffered because of the poor quality of the influent. Flat grades and consequent low velocities set up ideal conditions for decomposi tion of the raw sewage in the collec tion system. Because obnoxious odors cannot be vented to the atmosphere from the force mains leading from the five pumping stations, they are all con
centrated at the treatment plant. The obvious solution is to keep the sew age from decomposing until it reaches the plant. Therefore, during the sum
mer of 1950 chlorinators were installed at three of the pumping stations. However, the required chlorine dosage was considerably higher than had been anticipated, probably due to the on set of hot weather before the installa tions were completed.
During the year the State Board of Health desired considerably more bac teriological data than was originally expected. This problem results from the proximity of the important shell fish grounds in the receiving waters. To facilitate running the additional tests, the laboratory was expanded so that bacteriological examinations of the sewage are now run at the plant instead of at the Public Health De
partment. After almost two years of operation,
the only major repairs required have been normal general overhauling of the gas engines.
Sources of Revenue
Revenue is derived from a sewer
service charge based on water con
sumption. Bills are sent either quar terly or monthly, the rate being the same under both methods of billing.
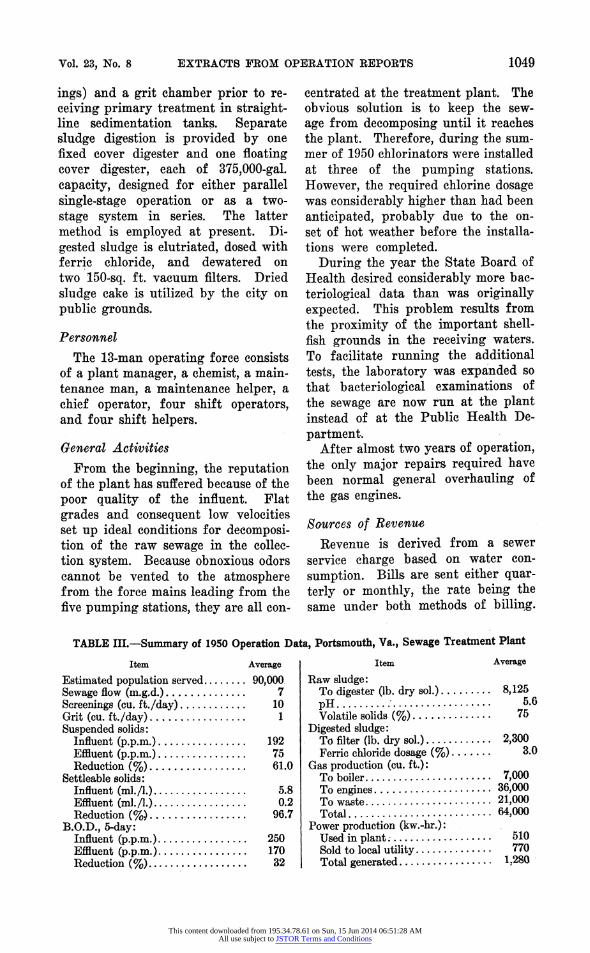
TABLE III.-Summary of 1950 Operation Data, Portsmouth, Va., Sewage Treatment Plant
Item Average Item Average
Estimated population served........ 90,000 Raw sludge:
Sewage flow (m.g.d.).............. 7 To digester (lb. dry sol.)......... 8,125
Screenings (cu. ft./day)............ 10 pH ............................ 5.6
Grit (cu. ft./day) ................ 1 Volatile solids (%)............ 75
Suspended solids: Digested sludge: Influent (p.p.m.) ................ 192 To filter (lb. dry sol.)............ 2,300
Effluent (p.p.m.)................ 75 Ferric chloride dosage (%) ...... 3.0
Reduction (%) ................. 61.0 Gas production (cu. ft.):
Settleable solids: To boiler ...................... 7,000
Influent (ml./l.)................. 5.8 To engines .................... 36,000
Effluent (ml./l.)................. 0.2 To waste....................... 21,000
Reduction (% ) ................. 96.7 Total........................ 64,000
B.O.D., 5-day: Power production (kw.-hr.): Influent (p.p.m.)................ 250 Used in plant .................. 510
Effluent (p.p.m.)................ 170 Sold to local utility.............. 770
Reduction (%).................. 32 Total generated................. 280
This content downloaded from 195.34.78.61 on Sun, 15 Jun 2014 06:51:28 AMAll use subject to JSTOR Terms and Conditions

1050 SEWAGE AND INDUSTRIAL WASTES August, 1951
On a monthly basis, the following schedule applies:
Up to 400 cu. ft. (min.) $0.50 Additional to 3,000 cu. ft. $0.10 per 100 Additional to 33,000 cu. ft. $0.085 per 100 Additional to 333,000 cu. ft. $0.07 per 100
Negotiations are almost complete whereby the city will purchase Hamp ton Roads Sanitary District Commis sion facilities lying within the corpo
rate limits. This transaction will re flect favorably on future revenue.
The sale of excess power to the local electric utility was begun in April, 1950. During the remaining eight
months of the year the power company paid the city approximately $2,500 for power.
Operation data for 1950 are sum marized in Table III.
Annual Report of the Sewage Treatment Plant, Danville (Ill.) Sanitary District for the Year 1950
BY J. E. MEERS, Chemist
Description of Plant
The Danville, Ill., Sanitary District sewage treatment plant, first put into operation in February, 1937, provides primary treatment consisting of rotary mechanical screening, comminution, de-gritting, flocculation, and settling. Facilities are available for enhancing flocculation by the addition of chemi cals. Separate sludge digestion is ac complished in a floating cover digester of 75,000 cu. ft., with a similar unit serving as a sludge storage tank. Di gested sludge is dried on 12 open beds totaling 40,000 sq. ft.
Plant Flooded
On January 3, 1950, the plant was flooded out by a sudden rise of the Vermillion River, to which the plant effluent discharges. The likelihood of this happening had been foreseen
some years ago, at which time a levee was constructed around the plant. Al though the river rose to 1.5 ft. above the levee, the additional time afforded before the levee was overtopped al lowed arrangements to be made for
dismantling and removing motors, etc. As a result, damage was held to a mini
mum, repair costs were negligible, and the plant lost only seven days of op eration.
Personnel
Adjustments made in plant em ployees' wages this year bring them closer to the level of other municipal employees performing work of a simi lar nature. Beginning with January 1, 1951, the District will become a
member of the Illinois Municipal Re tirement Fund, thus giving the em ployees more adequate protection for accidents and retirement.
TABLE IV.-Summary of 1950 Operation Data, Danville, Ill., Sewage Treatment Plant Item Average Item Average
Rainfall (in.) .................. 48.25 Final effluent ............... 82 Estimated population served ... 35,000 Raw sludge: Sewage flow (m.g.d.)............ 4.723 To digester (gal.)............ 14,800 Grit (cu. ft./day)............... 1.95 Solids (%).................. 4.7 Settleable solids (ml./l.): Volatile solids (%)........... 68,6
Raw........................ 6.1 Gas production (cu. ft./day)..... 26,400 Final effluent................ 0.6 Dig. sludge to drying beds (gal.).. 830,900
Suspended solids (p.p.m.): Cost of operation ($): Raw ........................ 183 Total..................... . 38,763.99 Final effluent................ 72 Per m.g..................... 22.46
B.O.D. (p.p.m.): Per capita .................. 0.905 Raw ....................... 211
This content downloaded from 195.34.78.61 on Sun, 15 Jun 2014 06:51:28 AMAll use subject to JSTOR Terms and Conditions