1976. feb 77 143p. - ed
TRANSCRIPT

DOCUMENT RESUME
BD 134 248 JC 770 087
TITLE Financial Report of the County Colleges of the Stateof New Jersey for the Fiscal Year Ended June 30,1976.
INSTITUTION New Jersey State Dept. of Higher Education, Trenton.Office of Community Coll. Programs.
PUB DATE 1 Feb 77NOTE 143p.
EDRS PRICE MF-$0.83 HC-$7.35 Plus Postage.DESCRIPTORS Capital; Community Colleges; Costs; *Educational
Finance; Enrollment; Enrollment Trends; ExpenditurePer Student; *Expenditures; Financial Needs;*Financial Support; *Income; *Junior Colleges;Program Costs; Tables (Data)
IDENTIFIERS *New Jersey
ABSTRACTData drawn from audited financial statements of the
individual county colleges of New Jersey for fiscal years 1975 and1976 provided the basis for this report on the county colleges'finances with regard to sources of current income,full-time-equivalent (FTE) student enrollments and costs, educationaland general expenditures, and physical plantband capital. Analysis ofthe data for fiscal year 1976 compared to fiscal year 1975 revealed:state aid accoinited for 28% of total revenues in 1976, up 2%; countyappropriations constituted 35% of revenues, up 20%; 29% of revenuescame from tuition and fees, up 13%; 8% was contributed from othersources (grants, investments, interest income, miscellaneous), down16%; educational and general expenditures increased 13% while cost,per FTE student declined .5%; and 1976 FTE enrollment was 67,894, upfrom 60,056 FTE's in 1975. Overall, the rate of growth ofexpenditures (13%) was greater than the rate of growth of revenues(12%). However, when inflationary factors are accounted for, the realrate of expenditure growth was only 7% while FTE enrollments grew by13%. Further study of what constitutes a desirable balance betweensources of revenue for the county colleges is needed. Appended arefinancial data for all colleges. (JDS)
*************************************************36 ********************Documents acquired by ERIC include many informal unpublished
* materials not available from other sources. ERIC makes every effort ** to obtain the best copy available. Nevertheless, items of marginal ** reproducibility are often encountered and this affects the quality ** of the microfiche and hardcopy reproductions ERIC makes available ** via the ERIC Document Reproduction Service (EDRS). EDRS is not* responsible for the quality of the original document. Reproductions ** supplied by EDRS are the best that can be made from the original. ************************************************#4**********************

Financial Report
of the
County Colleges of the State of New Jersey
For the Fiscal Year Ended
June 30,1976
U S DEPARTMENT OF HEALTH,
EDUCATION I WELFARE
NATIONAL INSTITUTE DF
EDUCATION
THIS OCKUME N1 HA5 BEEN REPRO.Nap EkaoLy AS RECEsVED FROMTHE PERSON OR ORGANIZAIION ORIGIN.
ATING IT POINTS OE VIEW OR OPINIONS
STAYED DO NOT NECESSARILY REPRE.
SENT OFF ICIAL NATIONAL INSTINTE OF
EDUCATION POSILON OR POLICY

MEMBERS, BOARD OF HIGHER EDUCATION
Katherine K. Neubeiger
Chairman, Board of Higher Education
.0-Ralph A. Dungan
Chancellor, Department of Higher Education
Dr. William 0. Baker
Mr. Edward E. Barr
Mr, Edward E. Booher
Prospero DeBona, Esq.
Dr. Marion G. Epstein
Mr. William J. Gaskill
RaLb1 Harry B. Kellman
Mr. Gerald LeBoff
Mr. Philip C. Muccilli
Mr. Hubert F. O'Brien
Mr, Malcolm Pennypacker
Dr. Jerome M. Pollack
Mr. Sydney G. Stevens
Dr. Deborah P. Wolfe
Fred (i ;urke, Commissioner
DepJ: ent of Education
5
;

TABLE OF CONTENTS
PAGE
LETTER OF TRANSMITTAL FROM THE CHANCELLOR 1
INTRODUCTION 4
HIGHLIGHTS OF FINANCIAL OPERATIONS 6
SOURCES OF CURRENT REVENUE 11
FULL-TIME-EQUIVALENT ENROLLMENTS AND COSTS 15
EDUCATIONAL AND GENERAL EXPENDITURES 17
PHYSICAL PLANT AND CAPITAL 20
CONCLUSION 22
APPENDIX 24
6

8
STATE OF NEW JERSEY
DEPARTMENT OF HIGHER EDUCATION
TRENTON, NEN' JERSEY 08625
February 1, 1977
Members of the Board of Higher Education
Members of the.Council of County Colleges
Directors of the Boards of Chosen Freeholders
Members of the Boards of Trustees of County Colleges
Ladies and Gentlemen:
I am pleased to present the Financial Report of the County Colleges of the State of New
Jersey for the year ended June 30, 1976. It is based on actual audited data which I hope you
will find useful in understanding the financial side of New Jersey's county colleges. This
document responds to the concern of the Department of Higher Education and the Council of
County Colleges for more accurate fiscal reporting. In the past, financial reports for the
' county colleges were based on budgeted data. The Financial Report, however, is based on actual
data, that is, on actual revenues and actual expenditures for the county colleges of the State
of New Jersey as reflected in their audit reports.
Fiscal year 1976 was a year of many changes for higher education in general and for the
county colleges in particular. The Consumer Price Index rose 7.1%. The Higher Education
Price Index which reflects the increase in costs for goods and services necessary to operate
institutions of higher education rose 6.6%.
At the same time, the headcount of students enrolled at the county colleges increased by
13%, mostly as a direct result of increased part-time student enrollment. The average age of
the county college students also increased as more older adults began returning to school to
pursue a degree or to stay contemporary in areas of professional or personal interest.
Indications that enrollments would soon be leveling off and the fiscal stringencies faced
by the State of New Jersey accounted for the leveling off of construction at the county colleges
and for the slight increase in State aid to the colleges.
9

-2-
The state of the economy was a primary cause of significant academic changes evidenced by
increased offerings of technical and occupational programs at the county colleges.
In spite of the fiscal constraints of the past year, the prospects for the future of the
county colleges are good. The administrations and boards of trustees of the colleges appear
to be making difficult decisions judiciously in allocating scarce resources. They are main-
taining tile educational and financial integrity of the colleges through new programs and
improved cost-reporting analyses.
The Board of each county college will undoubtedly wish to examine this and other available
data to satisfy itself that the college is operating in an educationally and financially
efficient manner. If the Department staff can assist in these endeavors, we would be pleasedto do so.
We are most indebted to the Presidents and Chief Financial Officers of the county colleges
for their assistance in compiling this report.
Re at fully submi
I 6.Ralph A. Dungan
Chancellor of Higher Education
State of New Jersey
10

\
I . INTRODUCTION
12

-4-
r. INTRODUCTION
The Financial Report of the County Colleges of New Jersey has been prepared by the Office ofCommunity College Programs of the Department a iligher Education, with technical assistance from theDepartment's Office of Budget and Fiscal Planning. The purpose of this report is to provide the Boardof Higher Education, State and County officials, and the public at large with data concerning communitycollege finances for FY'76.
The Report's data are drawn from the audited financial statements of the individual county col-leges required by the New Jersey Administrative Code, Section 9:4-3.67. Such audits are conducted by
private auditing firms and submitted annually to the Boards of Trustees of each county college andthe Chancellor of Higher Education. For comparative purposes, this report utilizes data gathered fromcollege audit reports for the fiscal years 1975 (July 1, 1974 - June 30, 1975) and 1976 (July 1, 1975 -June 30, 1976). This should provide a clear picture of the current educational and general expendi-tures of each institution in the most comprehensive fiscal terms available.
While the audits deal with two types of funds, restricted and unrestricted, 1 this Report is pri-
marily concerned with funds of an unrestricted nature because they provide the colleges' major funding.
Unless otherwise designated, the tables provided in this document reflect only unrestricted funds.
This Report studies the following areas of county college finances:
- Sources of Current Revenue
- Full-Time-Equivalent Enrollments and Costs
- Educational and General Expenditures
- Physical Plant and Capital Data
The technical study of these four areas is preceded by a discussion of the highlights of these finan-cial operations. Following the Conclusion, there is an Appendix which provides a fiscal overview ofeach county college.
1Unrestricted funds are by nature free of specific spending designations. Funds of a restricted
nature, however, must be spent for or in support of specific items as designated by an external agencyor individual. They include gifts, grants for a specific purpose, and financial aid.
The level of restricted funds will vary from institution to institution. To include these funds
in computing the cost per full-time-equivalent student would, therefore, distort the averages.
14'

II. dICHLIGHTS OF FINANCIAL OPERATIONS

II. HIGHLIGHTS OF FINANCIAL OPERATIONS
SOURCES OF CURRENT REVENUE
New Jersey county colleges receive funds from four primary sources--the State, the counties,
student tuition and fees, and miscellaneous or Other income. In FY'76, the total revenue for the
county colleges was $111,964,000. This was an increase of 11% or $11,037,000 over FY'75. The level
of contribution from each of the four primary funding sources in FY'76 was is follows:
State Aid--Twenty-eight percent of the total current revenue for the county colleges came from
the State of New Jersey in FY'76. This was an increase of $637,000 or 2% over FY'75.
County Appropriations--Thirty-five percent of total current revenue was contributed by the
counties in support of the county colleges. This was an increase of $6,601,000 or 20% over
FY'75. The increase in County aid may have reflected the desire of most counties to offset
increased costs in the face of the slight increase in State aid and the decrease in Other
income.
Tuition and Fees--Twenty-nine percent of total current revenue was contributed through student
tuition and fees. This was an increase of $5,414,000 or 20% over FY'75. In the light of the
13% increase'in FTEs over FY'75, this represents an increase in the ratio of student derived
income to student enrollment. The change in the ratio can be attributed to the 22% increase in
part-time enrollment at the county colleges and to the fact that part-time students generally
pay more tuition per credit than full-time students. Coupled with tuition increases which
went into effect at the county colleges in FY'76, the tuition generated by the increased number
of part-time students accounted in large part for the orerall incrs4e in tuition revenue.
Other Current Revenue--Eight percent of total current revenue was contributed from Other revenue.
This represents a decline of $1,615,000 or 16% from FY'75, This category includes but is not
limited to such items as unrestricted miscellaneous grants, interest income, investment income
and, in FY'75, anticipated State aid for over-enrollment. The latter refers to the number of
students enrolled by the county colleges in excess of those funded by the Appropriations Act
for FY'76 and the exclusion of this amount in their audit reports accounts for the decline in
Other revenue.
For further discussion of "Sources of Current Revenue" see Section III, pp. 11-13 below.
1617

FULL-TIME-EQUIVALENT ENROLLMENTS AND COSTS
The cost per full-time-equivalent student (FTE)1
at the county colleges declined .5% from 1974-75
to 1975-76. This slight decrease can be attributed to the fact that while the county colleges admitted
13% more FTEs in FY'76, expenditures increased slightly less than 13%.
For further discussion of "Full-Time-Equivalent Enrollments and Costs" see Section IV, p. 15 below.
EDUCATIONAL AND GENERAL EXPENDITURES
Educational and General Expenditures (E & G) is an expenditure category that includes General
Expenses and General Administration, Instruction, Student Services, Extension and Public Services,
Library, Plant Operation and Maintenance, and Other.
County college E & G Expenditures rose approximately 13% to $103,181,000 in FY'76, When compared
to the $11,037,000 increase in revenue in FY'76, this $11,407,000 increase in E & G Expenditures raises
questions relative to future county college financing. While absolute revenue dollars were sufficient
to cover expenditures in FY'76, it should be noted that the rate of expenditure growth was 127. and the
rate of revenue growth 11% in FY'76, The fact that the rate of expenditure growth exceeded revenue
growth in FY'76 points to the need for further study of current funding.
1The full-time-equivalent student, as distinguished from the full-time student, is a budget desig-
nation. The New Jersey Administrative Code defines calculation of FTEs in the following manner:
a) Full-Time Students--The "full-time-equivalent" of the full-time student is computed on the
basis of one-half (1/2) of an FTE for each full-time student each semester, regardless of
the number of credits in excess of 12. If one hundred (100) full-time students were In
attendance in a particular semester, this would equate to fifty (50) fr.11-time-equivalent
students for that semester. The annual total of FTEs is obtained by adding together each
semester's total,
b) Part-Time Students--The full-time-equivalent of part-time student enrollment is computed by
adding the total credit hours taken by part-time students in the Summer, Fall, and Spring
semesters and dividing the sum by 30. Credit 'lours taken by full-time students in excess
of the required 12 credit hours are not included in the computation of the FTE calculation
for part-time students.
c) Non-Credit Students--The full-time-equivalent of non-credit student enrollment is computed
by dividing total student contact hours by 450.
18 19

The level of expenditure for the primary E & G categories in FY'76 is as follows:
Instructional Expenditures--Forty-six percent of E & G Expenditures was for instruction. This
was an increase of $4,965,000 or 11% over FY'75.
General Expenses and Administration--The General Expenses and Administration category includessuch items as staff benefits, administrative salaries, and purchases of a miscellaneous nature.
Twenty-three percent of E & G Expenditures was for General Expenses and Administration.. Thiswas an increase of $3,511,000 or 17% over FY'75.
Student Services--The category of student services includes such items as counseling, health
services, admissions, and registrar operations. Seven percent of E & G Expenditures was spentfor Student Services. This was an increase of $795,000 or 12% over FY'75.
Extension and Public Service--The category of Extension and Public Service includes expendituresfor community affairs and activities designed to serve the public. Four percent of E & G
Expenditures was spent for Extension and Public Service in FY'76. This represents an increaseof $206,000 or 5% over FY'75.
LibraryThis category includes expenditures for books, periodicals, and other learning resourcessuch as audio-visual equipment. Six percent of E & G was spent for Library in FY'76. This
represents an increase of $127,000 or 2% over FY'75.
Plant Operation and Maintenance--Included in this category are all maintenance costs., heat, light,
and power. Fourteen percent of E & G Expenditures was for Plant Operation and Maintenance inFY'76. This represents an increase of $1,750,000 or 14% over FY'75.
Other--This category includes items of a miscellaneous nature which cannot be easily categorizedin the categories as presently defined. Less than 1% of E & G Expenditures was in the cateogryOther in FY"76. This represent.; an increase of $0,000 or 75% over FY'75.
For further discussion of "Educational and General Expenditures" see Section V, pp. 17-18 below.
20

HIGHLIGHTS OF FINANCIAL OPERATIONS
(000)
Year Ended Year Ended
REVENUES FOR CURRENT OPERATIONS June30,_1975 June 30, 1976PPM.MM.P =1State Aid
$31,242 $31,879
County Appropriations 32,264 38,865
Tuition and Fees 27,34132,755
Other Current Revenue 10 080 8 465......)._
TOTAL CURRENT REVENUE $100,927 $111,964
EDUCATIONAL AND GENERAL EXPENDITURES
Instruction$42,842 $47,807
General Expenses and Administration 20,828 24,339
Student Services 6,668 7,463
Extension and Public Service 3,972 4,178
Library5,136 5,263
Plant Operation and Maintenance 12,258 14,008
Other70 123
TOTAL EDUCATIONAL AND GENERAL EXPENDITURES $91,774 $103,181
COST PER FTE (actual dollars)$1,528 $1,520
22

III. SOURCES OF CURRENT REVENUE
2 4

III. SOURCES OF CURRENT REVENUE
UNRESTRICTED REVENUE
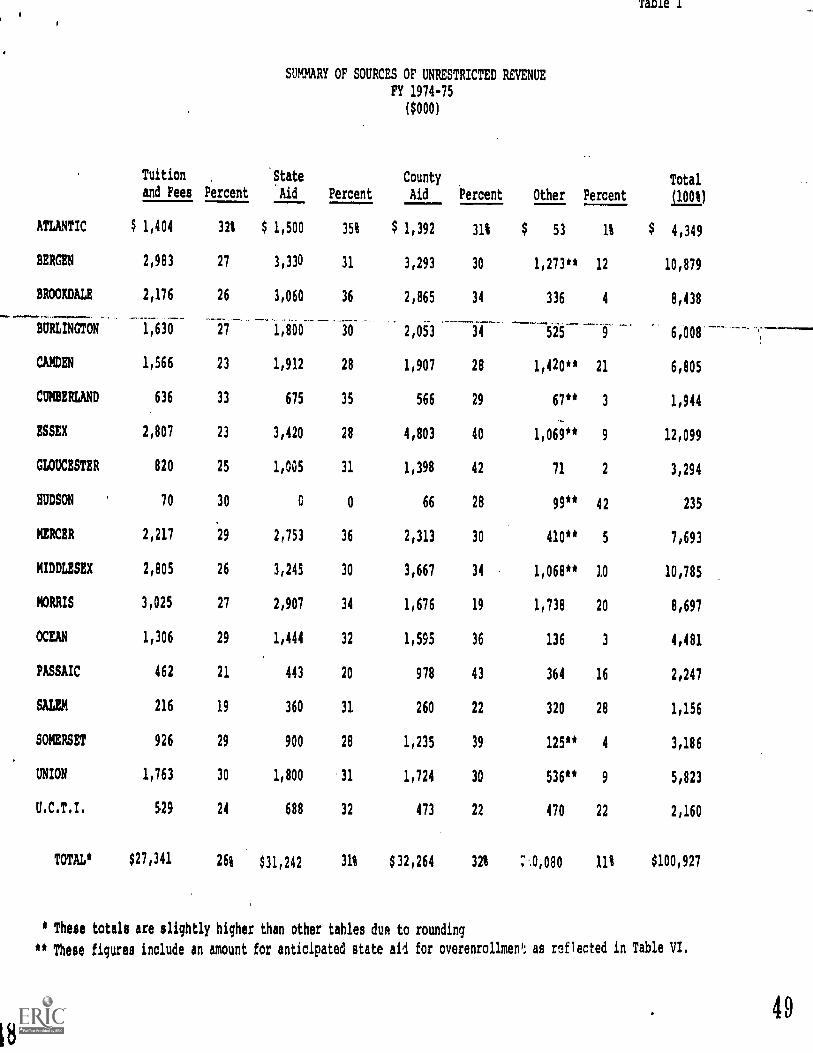
New Jersey County Colleges are funded from four primary sources--State Aid, County Appropriations,Tuition and Fees, and Other. Tables I and II depict the amounts contributed by these sources for thetwo years of this Repolt.
Systenwide in FY'76, the percentage of unrestricted revenue derived by the county colleges fromthe four primary revenue sources "shifted away" from State Aid and Other to Tuition and Fees and CountyAid, as illustrated below:
FY'75 FY'76 Change
State Aid 31% 28% - 3%
Other 11 . 8 - 3
Tuition and Fees 26 29 + 3
County Appropriations 32 35 + 3
Total 100% 100%
Stat$ ti aLi Other Revenue each declined bl 3%, County Appropriations and Student Tuition and Feesech twertse0 by 3%. The probable causes and implications of these significant percentage changesare discussed further beiow.
while the percentage change in the four major revenue categories statewide averaged plus orr44,1110) 3%, the percentage change at the individual colleges varied widely. As illustrated byrules III, IV, and V below, the State's percentage of total unrestricted revenue decreased from1% to 7% at 15 of the 18 institutions.
The County's percentage of total unrestricted revenveincreased from 2 to 10% at 13 colleges. The student's percentage, contributed by tuition and fees,rose from 1 to 11% at 17 colleges.
Each category of unrestricted revenue is discussed separately below.
State Aid--The colleges' total actual FTE enrollments in FY'75 and FY'76 were not funded by theState, because of fiscal constraints. Although the State provided $600 per FTE for the number
of students indicated in the Appropriations Act of FY'75 and FY'76, the county colleges enrolled
more students than were funded by the State, As of the publication of this Report, no funds havebeen received by the colleges for FY'75 over-enrollment, Uncertainty about appropriation for
26

over-enrollment resulted in the disparate treatment of State Aid on audit reports submitted
for FY'75.
Some institutions showed anticipated funds as a revenue on their income statements and,
correspondingly, as an account receivable on their balance sheets. Others showed the funds as
a revenue but established a reserve for the amount indicated as receivable from the State.
Others did not show the funds as a revenue. Because of the disparity in the treatment of these
funds, it was decided, for comparative purposes, to list only State Aid funds actually received
in the category State Aid. If an institution elected to treat the funds for over-enrollment
as a revenue, the revenue is included in the category Other.
Table VI shows anticipated State Aid for over-enrollment at the county colleges for FY'75. A
Supplemental Appropriations Bill passed by both houses of the Legislature would have granted
$4.7 million in supplemental funds to the county colleges in FY'77 to adjust for FY'75 over-
enrollment. Shortly before publication of this ReArt, the Governor reduced this appropriation
to $2 million and directed that these funds should be expended only upon the recommefidation of
the Chancellor of Higher Education, after determining that a county college ha demonstrated
the existence of fiscal problems related to enrollment overruns during FY'75.
Anticipated State Aid for over-enrollments was not a problem in FY'76 because the Appropriations
Act specifically stated that no county college would be compensated in excess of its share of the
53,129 FTEs to be funded.
The State's share of total unrestricted county college funds was 3% lower in FY'76 than in FY'75.
'However, in absolute dollar terms, the State contributed $637,000 more in FY'76 than in FY'75
(see Table VII), because it increased its funding of ETU from 52,069 to 53,129.
County Appropriations--The counties' share of unrestricted county college funds was 3% more of
total county college support in FY'76 than in FY'75. This increase amounted to $6,602,728 in FY'76.
Individually, the ability or willingness of counties to increase their support to the county
colleges varied greatly. The percentage change of county support among colleges ranged from a
92 decrease at Union to a 65% increase at Camden (see Table VIII).
Tuition and FeesTuition and Fees revenue includes funds derived from full-time and part-time
tuition and required fees. The Board of Higher Education authorized ceiling for full-time tuition
for both FY'75 and FY'76 was $400. Eight county colleges in FY'75 and twelve colleges in FY'76
charged the maximum permissable full-time tuition (see Table IX).
27 28

In addition to the higher full-timetuition rates, Tuition and Fees revenue increased due to
enrollment growth? Student mix also contributed to increasing revenues, since the rate of part-time student enrollment increased faster than full-time student enrollment and part-time tuitionrates, in general, generate more revenue per credit hour than full-time tuition.
These three reasons--higher tuitionrates, increased enrollments, and student mix--accounted
for the 202 increase in Tuition and Fees revenue in FY'76. This was an increase of $5,414,000(see Table X).
Other--The revenue category of Other includes miscellaneous income such as that derived frominvestments, interest, gifts, unrestricted grants, and in some instances for 11'75, anticipatedState Aid for overenrollment. As a percent of total revenue, this category decreased 2% from1975 to 1976. This was a decrease of $1,615,000.
1
The chart below indicates county college student numerical growth:
2
29
Fall 1974 Fall 1975 Change
Full-Time 36,017 40,932 4,915
Part-Time 40 823 49 641 8 818
Total 76,840 90,573 13,733
Part-time students are charged on the basis of credits per semester. A full-time student is onewho is taking a minimum of twelve credits a semester. A part-time student pays the per creditcharge up to twelve credit hours a semester. At twelve credits, the full-time rate becomeseffective and the student may take more than twelve credits at no additional charge. If weassume that an institution charges $360 per year for full-time students and $15 per credit forpart-time students, one full-time student taking 30 credits (15 each semester) would pay $360 fortwo semesters. However, five part-time students taking a total of 30 credits (each student taking
three credits per semester) would pay a total of $450 a year at $15 per credit hour. Thus, five
part-time students registering for 30 credits a year would generate more tuition revenue than one
full-time student registering for 30 credits in the same period.

IV. FULL-TIME-EQUIVALENT ENROLLMENTS AND COSTS
31

-15 -
IV. FULL-TIME-EQUIVALENT ENROLLMENTS AND COSTS
The cost per FTE student is calculated on the basis of total annual E & G Expenditures of an
institution divided by the FTE enrollment.
Tables XI, XII, XIII and XIV depict widely ranging costs per FTE at the county colleges. Although
no single cause can be identified for this variation, factors such as salary levels, program offerings,
institutional size, and faculty workload influence total costs and hence the cost per FTE.
As indicated in Table XIV, the cost per full-time-equivalent student at most institutions declined
between FY'75 and FY'76 while total costs increased, primarily because the number of FTEs increased
more than did total costs. The decline in cost per FTE may possibly be attributed.to college achieve-
ment of economies of scale. Once an institution has.an established faculty and a sufficiently large
physical plant, it seems able to add students without proportionately increasing variable costs. Thishas the effect of reducing the cost per FTE.
In FY'76, the county colleges enrolled 67,894 FTEs, but were funded for 53,129. In FY'75, they
enrolled 60,056 FTEs, but were funded for 52,062. In both years, the enrollment mix was similar with
95% credit and 5% non-credit students (see Tables XV, XVI, and XVII).
Despite the fact that the State funded 53,129 FTEs in FY'76, the county colleges chose to enroll
FTE students in excess of that number. In FY'76, the county colleges enrolled 28% more FTEs than were
funded by the State. One college enrolled .5%, four colleges 11 to 18%, four colleges 20 to 27%, five
colleges 33 to 35%, and four colleges 46 to 58% more FTEs than were funded.
Enrollment data reported in the Higher Education General Information Survey (REGIS) revealed the
following for Fall, 1974 and 1975:
1) total headcount of all students increased 18% from Fall, 1974 to Fall, 1975; and
2) full-time enrollment increased only 14%, whereas, part-time enrollment increased by 22%
(see Table XVIII).
33

V. EDUCATIONAL AND GENERAL EXPENDITURES

-17-
V. EDUCATIONAL AND GENERAL EXPENDITURES
Four major categoriesof Educational and General Expenditures are discussed below--Instructional
Expenditures, General Expenses and Administration, Student Services, and Library. Expenditures foreach of these categoriesremained relatively stable in percentage terms from FY'75
inflation and higher student enrollment caused an increase in the dollar expenditure for each E & Gcategory.
Each expenditure category is discussed below.
Instructional Expenditures--The largest expenditure category in FY'75 and FY'76 was Instruction(see Tables XIX, XX, XXI, XXII). Expenditures for Instruction
increased from $42,841,953 inFY'75 to $47,807,954 in FY'76. However, because the colleges enrolled 7,838 more FTEs in FY'76instructional costs per FTE.decreased slightly by 1.0%. The decreases ranged from 0.8% atAtlantic and Essex to 27.0% at Passaic. With the exception of Hudson,1 instructional costincreases did not exceed 11.9% (see Table XXIII).
General Expenses andAdministration--Expenditures for General Expenses and Administration
increased from $20,826,432 in FY'15 to $24,338,688 in FY'76.Higher enrollments, however,
resulted in a small increase of.3% in the expenditure per FTE from $346.78 in FY'75 to $358.48in FY'76. Eight colleges showed a decrease in their expenditure per FTE in FY'76, ranging from3% at Middlesex, Morris, and Ocean to 50% at Hudson. At the remaining ten colleges, theexpenditure per FTE increase ranged from 4% at Camden and Mercer to 21% at Essex (see Table XXIV).
Student Services--Expenditures per FTE for Student Servicesdecreased slightly in FY'76, from
$111.02 in FY'75 to $109.90 in FY'76. Eight colleges showed a decrease in their expenditureper FTE for Student Services, from 7% at Cumberland and Ocean to 50% at Hudson. At the remainingten colleges the expenditure
per FTE ranged from 1% at Atlantic and Bergen to 49% at Salem (seeTable XXV).
1Hudson's increase may not be truly comparable
because Hudson had only been in existencefor one-half year in FY'75.
35

Librarr-Library expenditures per FTE in three of the eighteen county colleges increased in FY'16
by 2%, 4%, and 14% respectively. Expenditure decreases at the remaining fifteen colleges ranged
from 4% to 40%. Systemwide, the weighted average decrease was 10%, down from $85.83 per FTE in
FY'75 to 577,50 per FTE in FY'16 (see Table XXVI).
37

VI. PHYSICAL PLANT AND CAPITAL
39

-20-
VI. PHYSICAL PLANT AND CAPITAL
C .tge physical placts have been funded from several sources since 1965-- egislative appropria-
tions tor minor capital, the bonds issues of 1968 and 1971, and the terms of Chapter 12,'PL 71.
According to the latter, county colleges may receive State support for capital projects approved by
.the board of Higher Education in amounts not to exceed one-half of the costs of the project. Under the
provisions of Chapter 12, PL .1971, a.county may sell bonds.for the entire_amount of a county.college
capital _pro ject-and.. receive -up- to one-half-the- cost- of pr inelpal-and-interest-of the-bonds-on an----
annual basis from the State. Such capital may be utilized to construct facilities and to obtain fixed
and moveable equipment (see Tables XXVII, XXVIII).
Tables XXIX and XXX contain the schedules of fixed assets for FY'75 and FY'76 and capitalized
physical plant expenditures. All assets have been recorded at cost, except where otherwise noted. According
to the Administrative Code, initial library acquisitions for county colleges may be capitalized and,
therefore, have been included in the schedules for fixed assets, except for those colleges which do not
capitalize these expenditures.
In addition to capital authorizations, the State appropriated minor capital in FY'73, '74, and
'75 for the initial acquisition of library books, for miscellaneous office and instructional equipment,
and for construction or renovation projects of less than $50,000. Counties matched these minor capital
funds. In FY'76, due to financial stringency, the State did not fund minor cipital.
1
Minor capital is defined as funding for a project of less than $50,000 designated to implement
new programs, modify existing programs, enlarge facilities, or fill specialized equipment needs.
40 41

VII. CONCLUSION
4 2

43
-22-
VII. CONCLUSION
One of the public's major concerns is the accountability of its public institutions. It is hoped
that the financial statistics presented in this !tarrt will, in some measure, respond to the public's
right to information and greater insight into the county colleges of the State of New Jersey. A
numbeeof issues facing the county collegee.impinge on the public at large. Three questions are of
major concern.
1. Wilraerall revenue be dequate-to suppotridaiffdirartitTidditer
2. What should be the balance between sources of revenue?
3. Are current expenditures reasonable?
A brief discussion of each of these concerns is.presented below.
WILL OVERALL REVENUEJESBUATE TO SUPPORT ADDITIONAL STUDENTS?
Revenue projections, at best, are not very assuring as New Jersey looks to the future. For county
colleges, the question of how many students will attend is related to whether or not state and county
governments will continue to fund the amounts recessary to support their attendance.
In this Report, the reader has been shown that State aid as a funding source for the county col!.
leges increased only $637,000 in FY'76 despite the Board of Higher Education's recommendation for an
increase of $3,364,600. Fiscal stringency accounted for the State's funding of the county colleges
below the requested amotint. If the State's funding does not look promising, will or can the counties
and students be expeCted to assume an even larger share of the cost of a two-year college education?
The Legislature passed a bill in 1976 which Governor Byrne signed into law which does not allow a
county to increase its budget supported by tax levy by more than five percent. Thus, component parts
of a county'sludget that are supported by tax levy may increase by more than five percent, provided
only that there are offsetting decreases in other areas. Some counties may use this as a rationale
to limit the appropriation to the county college, while others may increase efforts to provide funds.
However, when there are so many agencies competing for scarce resources within a county, it is
questionable whether or not a county college will obtain sufficient funds to meet inflationary trends
and even small enrollment increases, let alone the resources necessary for maintaining program quality.

4
WHAT SHOULD BE THE BALANCE BETWEEN SOURCES OF REVENUE?
This Report indicates that a shift has occurred with retard to the sources and amounts of revenue
contributed by the State, the county, and the student.
The contribution of the State as a percent of Otal revenue has been declining over the past fewyears. Should the State provide additional funds? Should present funds available for education bereallocated so as to-Provide additional dollars to the county colleges? What method of distributionshould be utilized? The reader will have already noted the variable county support among the colleges
and the apparent willingness or ability_d_smccunties to contributuorzthan_others_in_support_of
their respective colleges. The question of whether or not county support should'be equalized would
seem to be one that might be raised in the near future.
The question of balance between revenue sources also involves the extent to which the student
can and should be expected to bear the costs of county college education. Should the student be
expected to finance the greater part of his or her education on the assumption that he or she is the
primary beneficiary of that education? Or should public revenues totally fund the costs of education
on the assumption that society is the beneficiary of the education of its citizens? Perhaps the
recently published Booher report will stimulate discussion which will facilitate the development of a
new aid perhaps more appropriate funding mechanism for the county colleges.
ARE CURRENT EXPENDITURES REASONABLE?
It would seem that expenses are reasonable, particularly on an incremental basis. County college
expenditures rose 13% systemwide in FY'76, If approximately 6% of this increase can be accounted for
by inflationary factors, then 7% was the result of larger FTE enrollment which rose by 13%. The
additional students who entered the system in FY'76, therefore, drove down the actual cost per FTE and
ostensibly without any serious deterioration in educational quality.
The reasonableness of costs is a highly complex issue. Criteria of judgment must be sensitive to
the disparate treatment of costs at the various county colleges. The Department of Higher Education
and Council of County Colleges are in the process of developing a cost-reporting system to be
implemented beginning in FY'78. This cost-reporting system will produce data which should assist in
improving the request and allocation decisions which must be made.
This Report, makes no value judgment with regard to particular programs and institutional perform-
ance. The difficulty with any cost-reporting system or, for that matter, any finance report of this
type is its tendency to measure only those items that can be easily quantified. Educational quality
is less easily quantified, although it is reasonable to assume that academic quality bears some
relationship to costs and institutional effectiveness,
46

VIII. APPFIMIX
4 7
SUMMARY OF SOURCES OF UNRESTRICTED REVENUE
FY 1974-75
($000)
Tuition
and Fees Percent
State
Aid Percent
ATLANTIC $ 1,404 321 $ 1,500 35%
BERGEN 2,983 27 3,330 31
BROOKDALE 2,176 26 3,060 36
County
Aid Percent Other
$ 1,392 31% $ 53
3,293 30 1,273**
2,865 34 336
------i6RLINaioN- -1;630 --b 1;8-00 ---Jo- 2,05-3 -----34 525
1,907 28 1,420**
566 29 67**
4,803 40 1,069**
1,398 42 71
66 28 99**
2,313 30 410**
3,667 34 1,068**
1,676 19 1,738
1,595 36 136
978 43 364
260 22 320
1,235 39 125**
1,724 30 536**
473 22 470
CAMDEN 1,566 23 1,912 28
CUMBERLAND 636 33 675 35
ESSEX 2,807 23 3,420 28
GLOUCESTER 820 25 1,005 31
HUDSON 70 30 0 0
MERCER 2,217 '29 2,753 36
MIDDLESEX 2,805 26 3,245 30
MORRIS 3,025 27 21907 34
OCEAN 1,306 29 1,444 32
PASSAIC 462 21 443 20
SALEM 216 19 360 31
SOMERSET 926 29 900 28
UNION 1,763 30 1,800 31
U.C.T.I. 529 24 688 32
TOTAL* $27,341 261 $31,242 31% $32,264 32% 7'0,080
Tame I
Percent
11
Total
(1001)
$ 4,349
12 10,879
4 8,438
9 6,008
21 6,805
3 1,944
9 12,099
2 3,294
42 235
5 7,693
10 10,785
20 8,697
3 4,481
16 2,247
28 1,156
4 3,186
9 5,823
22 2,160
11% $100,927
* These totals are slightly higher than other tables due to rounding
** These figures include an amount for anticipated state aid for overenrollment as reflected in Table VI.
18
49

Table II
SUMMARY OF SOURCES OF UNRESTRICTED REVENUE
FY 1975-76
Tuition
and Fees Percent
State
Aid Percent
($000)
County
Aid Percent Other Percent
Total
(100%)
ATLANTIC $ 1,815 36% $ 1,507 30% $ 1,675 33% $ 108 2% $ 5,105
BERGEN 3,346 28 3,345 28 4,063 35 1,084 9 11,838
BROOKDALE 21495 24 3,060 29 4,178 40 693 7 10,426
BURLINGTON 2,125 30 1,821 25 2,581 36 658 9 7,185
CAMDEN 1,987 24 1,943 23 3,146 38 1,311 15 8,387
CUMBERLAND 753 35 681 31 676 31 61 3 2,171
ESSEX 3,112 26 3,450 29 5,059 42 435 3 12,056
GLOUCESTER 116 27 1,010 29 1,440 42 81 2 3,447
HUDSON* , 283 39 131 45 96 13 21 3 733
MERCER 2,607 kl 2,757 31 3,102 35 358 4 8,824
MIDDLESEX 3,324 29 3,263 29 3,813 34 968 8 11,368
NORMS 3,460 38 2,917 32 1,642 18 1,122 12 9,141,
OCEAN 1,574 31 1,457 28 1,941 38 155 3 5427
PASSAIC* 720 30 509 21 1,092 46 79 3 2,400
SALEM 321 20 408 27 415 27. 394 26 1,538
SOMERSET 1,297 32 901 22 1,742 43 107 3 4,047
UNION 1,997 36 1,817 32 1,573 28 246 4 5,633
U.C.T.I. 623 25 700 27 631 25 584 23 2,538
TOTAL** $32,755 29% $31,879 28% $38,865 35% $8,465 8% $111,964
* Unaudited
** These totals are slightly higher than other tables due to rounding.
50

Table III
SUMMARY OF STATE SUPPORT
(FY 1974-75, FY 1975-76)
FY 1974-75
Percentage Contribution
State Aid of Total Revenue
FY 1975-76
Percentage ContributionState Aid of Total Revenue Change
ATLANTIC $ 1,500,000 35% $ 1,506,600 30% (5)
BERGEN 3,330,000 31 3,345,000 28 (3)
BROUDALE 3,060,000 36 3,060,000 29 (7)
BURLINGTON 1,800,000 30 1,821:000 25 (5)
CAMDEN 1,912,200 28 1,942,800 23 (5).
CUMBERLAMD 675,000 35 681,000 31 (4)
ESSEX.
3,420,000 28 3,450,000 29 1
GLOUCESTER 1,005,00V 31 1,009,800 29 (3)
HUDSON - - 333,000 45 N/A
MERCER 2,752,800 36 2,757,000 31 (6)
MIDDLESEX 3,244,800 30 3,262,800 29 (1)
MORRIS 2,907,000 34 2,916,600 32 (2)
OCEAN 1,443,600 32 1,457,400 28 (4)
PASSAIC 443,400 20 508,800 21 1
SALEM 360,000 31 408,000 27 (4)
SOMERSET 900,000 28 901,200 22 (6)
UNION 1,800,000 31 1,816,800 32 1
U,C.T.I. 687,600 32 699,600 27(6)
TOTAL $31,241,400 31% $31,877,400 28% (3)%
() - Indicates negative number
52

Table IV
SUMMARY OF COUNTY SUPPORT
(FY 1974-75, FY 1975-76)
FY 1974-75 FY 1975-76
Percentage Distribution Percentage Distribution'ounry Aid of Total Revenue County Aid of Tutal Revenue Change
ATLANTIC $ 401 31% $ 1,674,993 33% 2%
BERGEN 3,293,220 30 4,062,516 35 5
BROOKDALE 2,865,000 34 4,178,179 40 6
BURLINGTON 2,052,828 34 2,581,273 36 2
CAMDEN. 1,906,725- 28 3,145;623 38 10
CUMBERLAND 566,137 29 675,581 31 2
ESSEX 4,802,651 40 5,059,311 42 2,
GLOUCESTER 1,397,532 42 1,439,750 42 -
HUDSON 66,000 28 95,900* 13 (15)
MERCER 2,312,559 30 3,101,877 35 5
MIDDLESEX 3,666,505 34 3,813,114 34 -
MORRIS 1,676,465 19 1,641,668 18 (1)
OCEAN 1,595,395 36 1,941,203 38 2
PASSAIC 977,830 43 1,092,347* 46 3
SALEM 260,000 22 414,608 27 5,
SOMERSET 1,235,218 39 1,742,071 43 4
UNION 1,723,500 30 1,573,286 28 (2)
U.C.T.I. 472,520 22 631,420 25 3
TOTAL $32,261,992$32% $38,864,720 35% 3%
Indicates negative nUmberUnaudited
54

Table V
SUMMARY OF TUITION AND FEE REVENUE
(FY 1974-75, FY 1975-76)
FY 1974-75
Tuition Percentage ContributionRevenue of Total Revenue
F\ 1975-76
Tuition Percentage ContributionRevenue of Total Revenue Change
ATLANTIC $ 1,404,246 321 $ 1,814,564 36% 4%
BERGEN 2,982,672 27 3,346,513 28 1
BROOKDALE 2,176,210 26 2,494,662 24 (2)
BURIINGTON 1,629,836 2' 2,125,075 30 3
CAMDEN 1,565,901 23 1,987,234 24 1
CUMBERLAND 636,441 33 752,833 35 2
ESSEX 2,807,372 23 3,111,762 26 3
GLOUCESTER 819,647 25 916,506 27 2
HUDSON 70,352 30 283,326* 39 9
MERCER 2,216,965 29 2,606,501 30 1
MIDDLESEX 2,804,915 26 3,323,803 29 3
MORRIS 3,025,128 27 3,460,111 38 11
OCEAN 1,306,162 29 1,574,198 312
PASSAIC 461,563 21 720,262 30 9
SALEM 215,814 19 320,834 20 1
SOMERSET 925,581 29 1,297,499 32 3
UNION 1,762,506 30 1,997,369 366
U.C.T.I. 529,060 24 623,120 25 1
TOTAL $27,340,371 26% $32 756,172 29% 3%
0 Indicates negative number
Unaudited
5657

'
'58
Table VI
STATE AID AND ANTICIPATED STATE AID
State Aid
FY1975
State Aid plus
Anticipated
State AidAnticipated
State Aid
ATLANTIC $ 1,500,000 $ 228,60b $ 1,728,600
BERGEN 3,330,000 263,400 3,593,400
BROOKDALE 3,060,000 260,880 3,320,880
BURLINGTON 1,800,000 481,800 2,281,800
CAMDEN 1,912,200 603,000 2,515,200
CUMBERLAND 675,000 140,280 815,280
ESSEX 3,420,000 595,782 4,015,782
GLOUCESTER 1,005,000 187,200 1,192,200
HUDSON 92,400 92,400
MERCER 2,752,800 89,160 2,841,960
MIDDLESEX 3,244,800 568,200 3,813,000
MORRIS 2,907,000 191,400 3,098,400
OCEAN 1,443,600 270,000 1,713,600
PASSAIC 443,400 139,200 582,600
SALEM 360,000 85,200 445,200
SOMERSET 900,000 26,850 926,850
UNION 1,800,000 339,600 2,139,600
U.C,T,I. 687,600 228,000 915,600
TOTALS $31,241,400 $4,790,952 $36,032,352
59

60
Table VII
SUMMARY OF CHANGES IN STATE AID REVENUE
FY 1974-75, FY 1975-76
($000)
Dollar Percent1974-75 1975-76 Change Change,
ATLANTIC $ 1,500 $ 1,507 $ 7 .5%
BERGEN 3,330 3,345 15 .5
BROOKDALE 3,060 3,060 - -
BURLINGTON 1,800 1,821 21 1.2
CAMDEN 1,912 1,943 31 1.6
CUMBERLAND 675 681 6 .9
,ESSEX 3,420 3,450 30 .9
GLOUCESTER 1,005 1,010 5 .
HUDSON - 333 333 -
MERCER ' 2,753 2,757 4 .1
MIDDLESEX 3,245 3,263 18 .6
MORRIS 2,907 2,917 10 .3
OCEAN 1,444 1,457 13 .9
PASSAIC ,443 509 66 15.0
SALEM 360 408 48 13.0
SOMERSET 900 901 1 -
UNION 1,800 1,817 17 .9
U.C.T.I. 688 700 12 1.7
TOTAL $31,242 $31,879 $637 1.7%
61

---
rN.1
Table VIII
SUMMARY OF CHANGES IN COUNTY SUPPORT
FY 1974-75, FY 1975-76
($000)
Dollar Percent
1974-75 1975-76 Change Change
ATLANTIC $ 1,392 $ 1,675 283 20%
BERGEN 3,293 4,063 770 23
BROOKDALE 2,865 4,178 1,313 46
BURLINGTON 2,053 2,581 528 26
CAMDEN 1,907 3,146 1,239 65
CUMBERLAND 566 _ 6.76 110_
ESSEX 4,803 5,059 256 5
GLOUCESTER 1,398 1,440 42 3
HUDSON 66 96 30 45
MERCER 2,313 3,102 789 34
MIDDLESEX 3,667 3,813 146 4
MORRIS 1,676 1,642 (34) ( 2)
OCEAN 1,595 1,941 346 22
PASSAIC 978 1,092 114 12
SALEM 260 415 155 60
SOMERSET 1,235 1,742 507 41
UNION 1,724 1,573 (151) (9)
U.C.T.I. 473 631 158 33
TOTAL $32,264 $38,865 $6,601 20%

Table IX
COUNTY RESIDENT TUITION RATES
(FY 1974-75, FY 1975-76)
FY 1974-75
Per Year
Full Time
Per Hour
Part Time
FY 1975-76
Per Year
Full Time,--Per Hour
Part Time
ATLANTIC $ 400 $ 17.00 $ 400 $ 17.00
BERGEN 400 16.00 400 15.00
BROOKDALE* 400 15.00 40r 15.00
BURLINGTON 350 15.00 400 17.00
CAMDEN 300 13.50 - 300 13.50
CUMBERLAND 400 17.00 400 17.00
ESSEX 350 15.00 400 17.00
GLOUCESTER 400 17.00 400 17.00
HUDSON 400 15.00 400 15.00
MERCER 360 16.00 360 16.00
MIDDLESEX 350 15.00 375 15.00
MORRIS 400 16.00 400 16.00
OCEAN 400 17.00 400 17.00
PASSAIC 350 1.00 400 20.00
SALEM 375 13.50 400 20.00
SOMERSET 350 15.00 350 15.00
UNION 350 14.00 350 14.00
.U.C.T.I. 350 15.00 350 15.00
* Tuition rate is based on $15.00 per hour for both full-time and part-time students up to
a maximum of $200 per term.

SUMMARY OF CHANGES IN TUITION & FEE REVENUE
FY 1974-75, FY 1975-76
($000)
1974-75 1975-76
ATLANTIC $ 1,404 $ 1,615
BERGEN 2,983 3,346
BROORDALE 2,176 2,495
BURLINGTON 1,630 2,125
CAMDEN 1,566 1,987
CUMBERLAND 636 753
ESSEX 2,807 3,112
GLOUCESTER 820 916
HUDSONf
70 283
MgRCER 2,217 2,607
MIDDLESEX 2,805 3,324
MORRIS 3,025 3,460
OCEAN 1,306 1,574
PASSAIC 462 720
SALEM 216 321
SOMERSET 926 1,297
UNION 1,763 1,997
U.C.T,I. 529 623
TOTAL $27,341 $32,755
66
Table X
Dollar
Change
Percent
Change
$ 411 29%
363 12
319 15
495 30
421 27
117 18
305 11
96 12
213 300
390 18
519 19
435 14
268 21
258 56
105 49
371 40
234 13
94 111
$5,414 20%
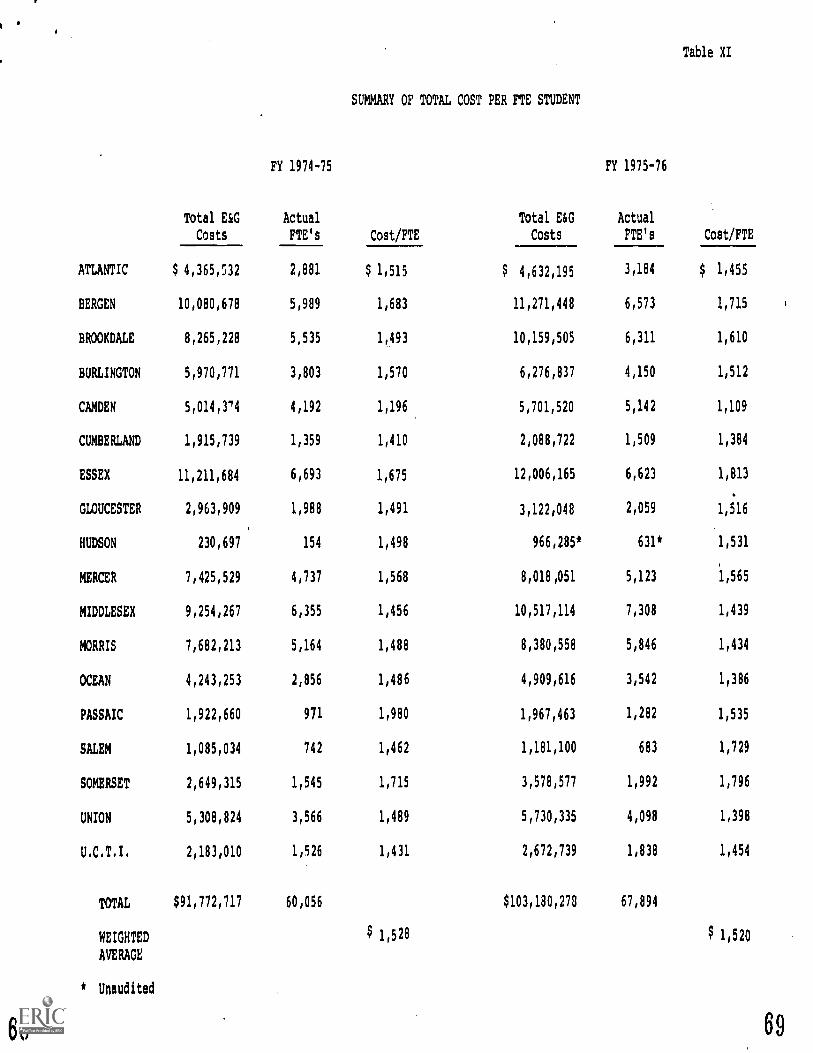
Table XI
SUMMARY OF TOTAL COST PER FTE STUDENT
Total EsG
Costs
FY 1974-75
Actual
FTE's Cost/FTE
Total E&G
Costs
FY 1975-76
Actual
FTE's Cost/FTE
ATLANTIC $ 4,365,532 2,881 $ 1,515 $ 4,632,195 3,184 $ 1,455
BERGEN 10,080,678 5,989 1,683 11,271,448 6,573 1,715
BROOKDALE 8,265,228 5,535 1,493 10,159,505 6,311 1,610
BURLINGTON 5,970,771 3,803 1,570 6,276,837 4,150 1,512
CAMDEN 5,014,314 4,192 1,196 5,701,520 5,142 1,109
CUMBERLAND 1,915,739 1,359 1,410 2,088,722 1,509 1,384
ESSEX 11,211,684 6,693 1,675 12,006,165 6,623 1,813
GLOUCESTER 2,963,909 1,988 1,491 3,122,048 2,059 1,516
HUDSON 230,697 154 1,498 966,285* 631* 1,531
MERCER 7,425,529 4,737 1,568 8,018,051 5,123 1,565
MIDDLESEX 9,254,267 6,355 1,456 10,517,114 7,308 1,439
MORRIS 7,682,213 5,164 1,488 8,380,558 5,846 1,434
OCEAN 4,243,253 2,856 1,486 4,909,616 3,542 1,386
PASSAIC 1,922,660 971 1,980 1,967,463 1,282 1,535
SALEM 1,085,034 742 1,462 1,181,100 683 1,729
SOMERSET 2,649,315 1,545 1,715 3,578,577 1,992 1,796
UNION 5,308,824 3,566 1,489 5,730,335 4,098 1,398
U.C.T.I. 2,183,010 1,526 1,431 2,672,739 1,838 1,454
TOTAL $91,772,717 60,056 $103,180,278 67,894
WEIGHTED $ 1,528 $ 1,520
AVERAGE
* Unaudited
68 69

SUMMARY OF COST PER FTE STUDENT BY RANK
FY 1974-75
College CostLFTE
CAMDEN $1,196
CUMBERLAND 1,410
U.C,T.I 1,431
MIDDLESEX 1,456
SALEM 1,462
OCEAN 1,486
MORRIS 1,488
UNION 1,489
GLOUCESTER 1,491
BROOKDALE 1,493
HUDSON 1,498
ATLANTIC 1,515
MERCER 1,568
BURLINGTON 1,570
ESSEX 1,675
BERGEN 1,683
SOMERSET 1,715
PASSAIC 1,980
70
Table XII
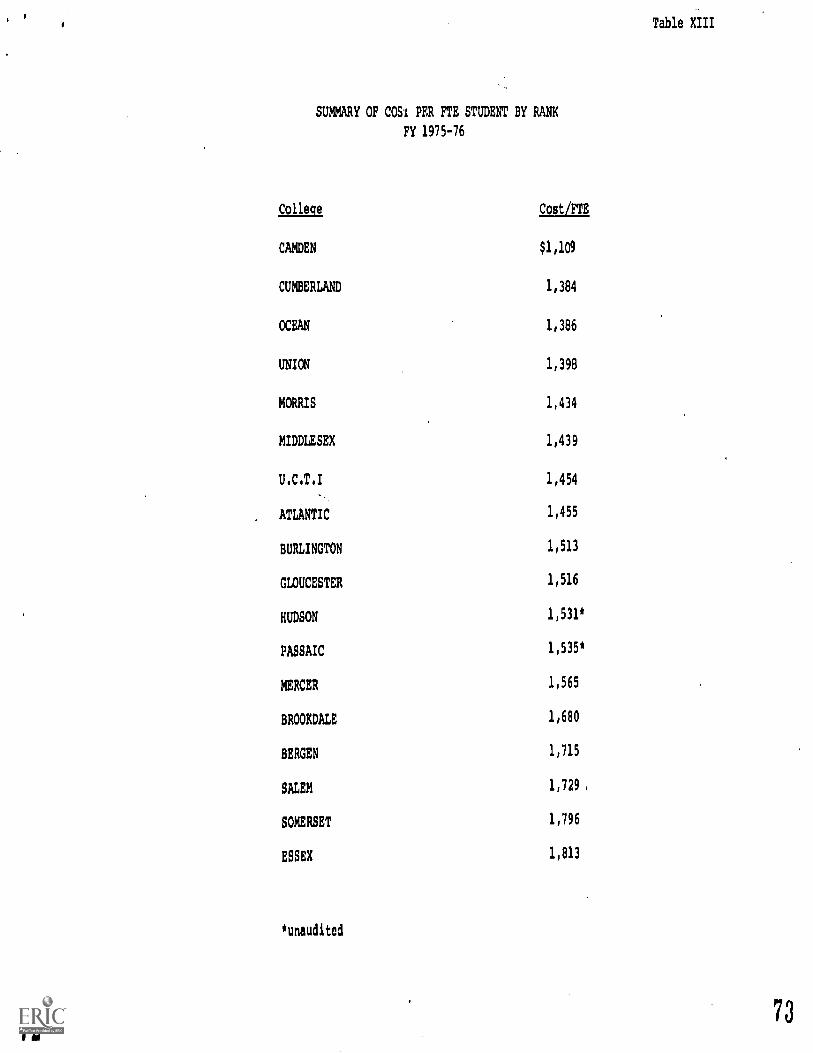
SUMMARY OF COS1 PER FTE STUDENT BY RANX
FY 1975-76
College Cost/FTE
CAMDEN $1,109
CUMBERLAND 1,384
OCEAN 1,386
UNION 1,398
MORRIS 1,434
MIDDLESEX 1,439
U.C.T.1 1,454
ATLANTIC 1,455
BURLINGTON 1,513
GLOUCESTER 1,516
HUDSON 1,531*
PASSAIC 1,535*
MERCER 1,565
BROOXDALE 1,680
BERGEN 1,715
SALEM 1,729 .
SOMERSET 1,796
ESSEX 1,813
*unaudited
72
Table XIII
73

74
Table XIV
GROWTH IN COST PER FTE vs. nROLLMENT GROWTH
Total Total
Cost/FTE Cost/FTE Percent
FY 1975 FY 1976 change
Actual FTE
FY 1975
Actual FTE
FY 1976
Percent
Change
ATLANTIC $1,516 $1,454 ( 4) % 2,881 3,184 11
BERGEN 1,683 1,715 2 5,989 6,573 10
BROOKDALE 1,493 1,610 8 5,535 6,311 14
BURLINGTON 1,570 1,513 ( 4) 3,803 4,150 9
CAMDEN 1,196 1,108 ( 7) 4,192 5,142 23
CUMBERLAND 1,410 1,384 ( 2) 1,359 1,509 11
ESSEX 1,675 1,813 8 rr93 6,623 ( 1)
GLOUCESTER 1,491 1,516 2 1988, 2,059 4
HUDSON 1,498 1,531* 2 154 631* 310
MERCER 1,568 1,565 ** 4,737 5,123 8
MIDDLESEX 1,456 1,439 ( 1) 6,355 7,308 15
MMIS 1,488 1,434 ( 4) 5,164 5,846 13
OCEAN 1,486 1,386 ( 7) 2,856 3,542 24
PASSAIC 1,900 1,535* (22) 971 1,282 32
SALEM 1,462 1,729 18 742 683 (8)
SOMERSEI 1,715 1,796 5 1,545 1,992 29
UNION 1,489 1,398 6 3,566 4,098 15
U.C.T.I. 1,431 1,454 2 1,526 1,838 20
AVERAGE $1,528 $1,520 ( 1)1
TOTAL 60,056*** 67,894*** 13 %
() Indicates negative nuther
* Unaudited,
** Less than 11
*** This total slightly hiqher than actual due to rounding 75

Table XV
SUMMARY OF STATE FUNDED AND ACTUAL FTE STUDENTS
State
Funded
FY 1974-75
Actual Minus
Actual State Funded
Percentage
Difference
State
Funded
FY 1975-76
Actual Minus
Actual State Funded
Percentage
Difference
ATLANTIC 2,500 2,881 381 15% 2,511 3,184 673 27%
BERGEN 5,550 5,989 439 8 5,575 6,573 998 18
BROOKDALE 5,100 5,535 435 8 5,100 6,311 1,211 24
BURLINGTON 3,000 3,803 803 27 3,035 4,150 1,115 37
CAMDEN 3,187 4,192 1,005 32 3,238 5,142 1,904 59
CUMBERLAND 1,125 1,359 234 21 1,135 1,509 374 33
ESSEX 5,700 6,693 993 17 5,750 6,623 873 15
GLOUCESTER 1,675 1,988 313 19 1,683 2,059 376 22,
HUDSON - 154 154 N/A 555 631* 76 14
MERCER 4,588 4,737 149 3 4,595 5,123 528 11
MIDDLESEX 5,408 6,355 947 18 5,438 7,308 1,870 34
MORRIS 4,845 5,164 319 7 4,861 5,846 985 20
OCEAN 2,406 2,856 450 19 2,429 3,542 1,113 46
PASSAIC 739 971 232 31 848 1,282 434 51
SALEM 600 742 142 24 680 683 3 .4
SOMERSET 1,500 1,545 45 3 1,502 1,992 490 33
UNION 3,000 3,566 566 19 3,028 4,098 1,070 35
U.C,T.I. 1,146 1,526 380 33 1,166 1,838 672 58
TOTAL 52,069 60,056** 7,987 15% 53,129 67,894** 14,765 28%
* Unaudited
** This total slightly higher than the actual due to rounding.
76

78
ENROLLMENT SUMMARY OF CREDIT AND NON-CREDIT FTE STUDENTS
FY 1974-75
Credit FTE's Percent
Non-Credit
FTE's Percent
ATLANTIC 2,667 04 214 N
BERGEN 5,501 92 488 8
BROOKDALE 5,105 92 430 8
BURLINGTON 3,762 99 41 1
CAMDEN 4,192 100 ..0
CUMBERLAND 1,303 96 56 4
ESSEX 6,682 100 11 *
GLOUCESTER' 1,947 98 41 2
HUDSON 154 1000
MERCER 4,593 97 143 3
MIDDLESEX 5,699 90 656 10
MORRIS 5,084 98 80 2
OCEAN 2,746 96 110 4
PASSAIC 968 100 3 *
SALEM 569 77 173 23
SOMERSET 1,516 98 29 2
UNION 3,241 91 325 9
U.C.T.I 1,470 96 56 4
TOTAL 571200 2,856
WEIGHTED
AVERAGE 95% 5%
* Less than 1%
Table XVI
Total
(100%)
2,881
5,989
5,535
3,803
4,192
'1,359
6,693
1,988
154
4,737
6,355
5,164
2,856
971
742
1,545
3,566
1,526
60,056
79

80
ENROLLMENT SUMMARY OF CREDIT AND NON-CREDIT FTE STUDENTS
FY 1975-76
Credit FTE's Percent
Non-Credit
FTE's Percent
ATLANTIC 3,018 95% 166 5%
BERGEN 6,040 92 533 8"..
BROOKDALE 5,872 93 439 7
BURLINGTON 4,104 99 46 1
CAMDEN 5,026 98 116 2
CUMBERLAND 1,469 97 40 3
ESSEX 6,594 99 29 1
GLOUCESTER, 1,806 88 253 12I
HUDSON* 562 8969 11
MERCER 4,987 97 136 3
MIDTIESEX 6,739 92 569 8
MORRIS 5,763 99 83 1
OCEAN 3,299 93 243 7
PASSAIC* , 1,269 99 13 1
SALIM 637 93 46 7
SOMERSET 10958 98 34 2
UNION 3,590 88 508 12
U.C.T.I 1,767 97 51 3
TOTAL 64,5203,37A
WEIGHTED
AVERAGE95%
5%
* Unaudited
Table XVIL
Total
(100%)
3,184
6,573
6,311
4,150
5,142
1,509
6,623
2,059
631
5,123
7,308'
5,846
3,542
1,282
683
1,992
4,098
1,838
67,894
81

Table XVIII
SUMMARY OF HEADCOUNT ENROLLMENT(1)
F/T
FALL 1974
PIT Total F/T
FALL 1975
P/T Total
Percent Changes
F/T P/T Total
ATLANTIC 1,629 2,216 3,845 1,867 2,378 4,245 15% 7% 10%
BERGEN 3,767 4,524 8,291 3,931 5,331 9,262 4 18 12
BROOXDALE 2,747 4,072 6,819 2,742 4,790 7,532 (*) 18 10
BURLINGTON 1,897 2,805 4,702 1,935 3,394 5,329 2 21 13
CAMDEN 2,750 2,890 5,640 3,282 3,608 6,890 20 25 22
CUMBERLAND 839 689 1,528 1,021 786 1,807 22 14 18
ESSEX 3,885 2,087 5,972 5,093 2,739 7,832 31 31 31
GLOUCESTER 1,175 1,135 2,310 1,355 1,198 2,553 15 6 11
HUDSON 0 0 0 217 609 826 N/A N/A N/A
MERCER 2,977 3,476 6,453 2,989 4,086 7,075 * 18 10
MIDDLESEX 3,834 4,475 8,309 4,329 5,753 10,082 13 29 21
MORRIS 3,697 4,155 7,852 3,965 4,641 8,606 7 12 10
OCEAN 1,903 1,755 3,658 2,214 2,411 4,625 16 37 26
PASSAIC 600 514 1,114 891 467 1,358 49 (9) 22
SALEM 386 452 838 522 . 401 923 35 (11) 10
SOMERSET 861 1,484 2,345 1,127 1,958 3,085 31 32 32
UNION 1,992 2,880 4,872 2,165 2,825 4,990 9 (2) 2
U.C.T.I. .1,078 1,214 2,292 1,287 2,266 3,553 19 87 55
AVERAGE 14% - 22% 18%
TOTAL 36,017 40,823 76,840 40,932 49,641 90,573
(1) Based on HEGIS Data
() Indicates negative number
* Less than 1%
F/T Full time
P/T Part time
N/A Not applicable83

81
Table XIX
SUMMARY OF DISTRIBUTION OF EDUCATIONAL AND GENERAL EXPENDITURES
FY 1974-75
Instruction
General
Expenses and
Administration
Student
Services
($000)
Extension and
Public Service Library
Plant
Operation &
Maintenance Other Total
ATLANTIC $ 2,266 $ 910 $ 356 $ 222 $ 195 $ 417 $ $ 4,366
BERGEN 4,787 1,858 708 192 875 1,661 - 10,081
BROODALE 3,308 2,108 603 148 864 1,234 - 8,265
BURLINGTON 2,702 1,932 427 101 189 620 - 5,971
CAMDEN 2,769 892 170 - 247 936 - 5,014
CUMBERLAND 1,010 351 93 74 120 268 - 1,916
ESSEX 5,564 2,831 1042 367 562 846 - 11,212
GLOUCESTER 1,334 715 160 134 210 411 - 2,964
HUDSON 56 31 125 - - 19 231
MERCER 3,462 1,879 589 95 172 1,220 9 7,426
MIDDLESEX 3,952 2,066 457 1,197 336 1,246 - 9,254
MORRIS 3,395 1,582 610 610 445 1,040 - 7,682
OCEAN 2,101 952 311 49 213 617 - 4,243
PASSAIC 836 520 173 13 143 196 42 1,923
SALEM 531 230 36 124 43 121 - 1,085
SOMERSET 935 636 189 276 225 388 - 2,649
UNION 2,697 889 496 257 244 726 - 5,309
MILL 1,137 446 123 113 53 311 - 2,183
TOTAL 842,842 $20,828 $6,668 $3,972 $5,136 $12,258 $ 70 01,774
85
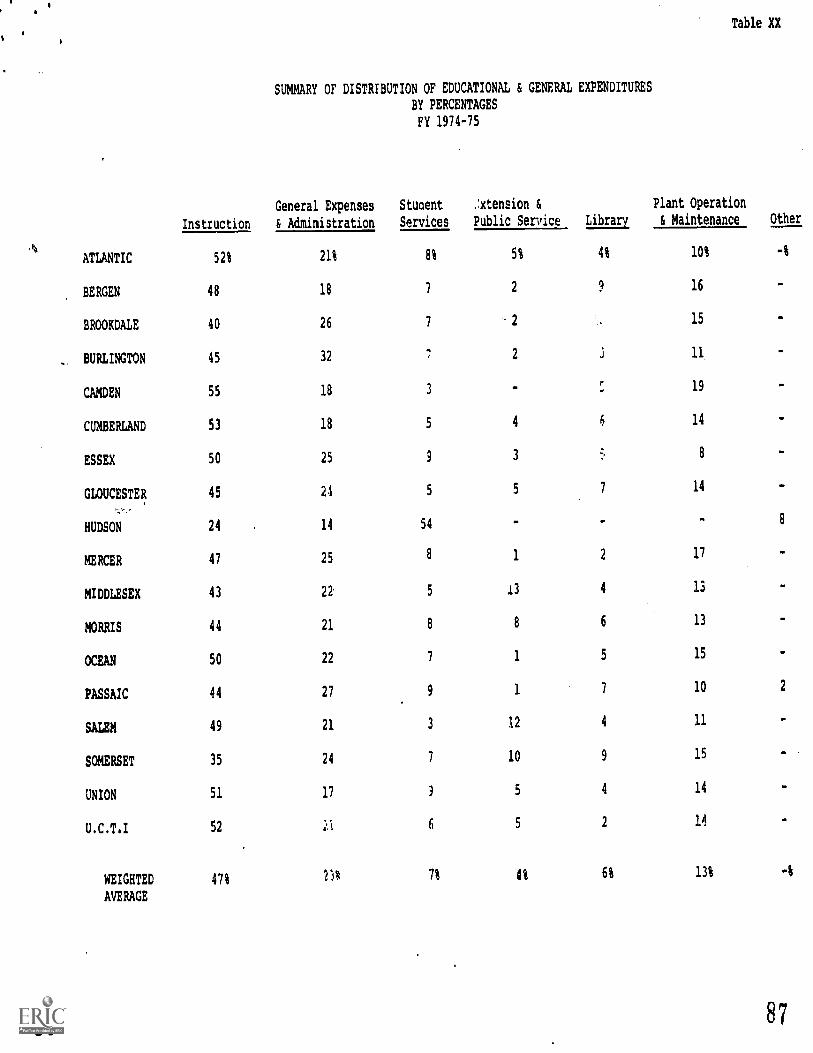
Table XX
SUMMARY OF DISTRIBUTION OF EDUCATIONAL & GENERAL EXPENDITURES
BY PERCENTAGES
FY 1974-75
Instruction
General Expenses
& Administration
Stuaent
Services
.:xtension &
Public Service Library
Plant Operation
& Maintenance Other
ATLANTIC 52% 21% 8% 5% 4% 10% -%
BERGEN 48 18 7 2 9 16 -
BROOKDALE 40 26 7 2 15 -
BURLINGTON 45 32 2 i 11 -
CAMDEN 55 18 3 - 19 -
CUMBERLAND 53 18 5 4 6 14 -
ESSEX 50 25 9 3 13 -
GLOUCESTER 45 24 5 5 7 14 -
HUDSON 24 14 54 - - 8
MERCER 47 25 8 1 2 17 -
MIDDLESEX 43 n 5 13 4 13
MORRIS 44 21 8 a 6 13
OCEAN 50 22 7 1 5 15 -
PASSAIC 44 27 9 1 7 10 2
SALEM 49 21 3 12 4 11
SOMERSET 35 24 7 10 9 15
UNION 51 17 9 s 4 14
U.C.T.I 52 :A 6 5 2 14
WEIGHTED 47% 29A 7% 4% 6% 13% .%
AVERAGE
8687

Table XXI
SUMMARY OF DISTRIBUTION OF EDUCATIONAL AND GENERAL EXPENDITURES
FY 1975-76
($000)
General Expenses Student Extension & Plant OperationInstruction & Administration Services Public Service Library & Maintenance Other Total
ATLANTIC $2,483 $ 962 $396 $ 152 $196 $ 443 $ - $ 4,632
BERGEN 5,441 2,194 787 201 857 1,791 11,271
BROOKDALE 3,948 2,779 745 164 951 1,573 - 10,160
BURLINGTON 2,868 1,941 409 137 216 706 - 6,277
CAMDEN 2,941 1,135 251 - 210 1,076 89 5,702
CUMBERLAT, 1,046 432 96 94 125 296 - 2,089
ESSEX 5,501 3,396 1,122 177 576 1,234 - 12,006
GLOUCEETER 1,416 874 126 96 172 438 - 3,122
HUDSON 638 64 255 - - - 9 966
mrcr,R 3,712 2,113 666 104 212 1,211 - 8,018
MIDDLESEX 4,577 2,308 535 1,253 379 1,465 . 10,517
MORRIS 3,665 1,740 616 807 470 1,083 .8,381
OCEAN 2,431 1,151 360 57 210 701 - 4,910
PASSAIC 806 613 135 59 113 228 13 1,967
SALEM. 547 243 49 166 37 127 12 1,181
SDMERSET 1,331 839 286 332 228 563 - 3,579
UNION 2,941 1,117 507 180 246 739 5,730
U,C.T.I 1,515 438 122 199 65 334 - 2,673
TOTAL $47,807 , $24,339 $7,463 $4,178 $5,263 $14,008 $123 $103,181
°Unaudited
88 89
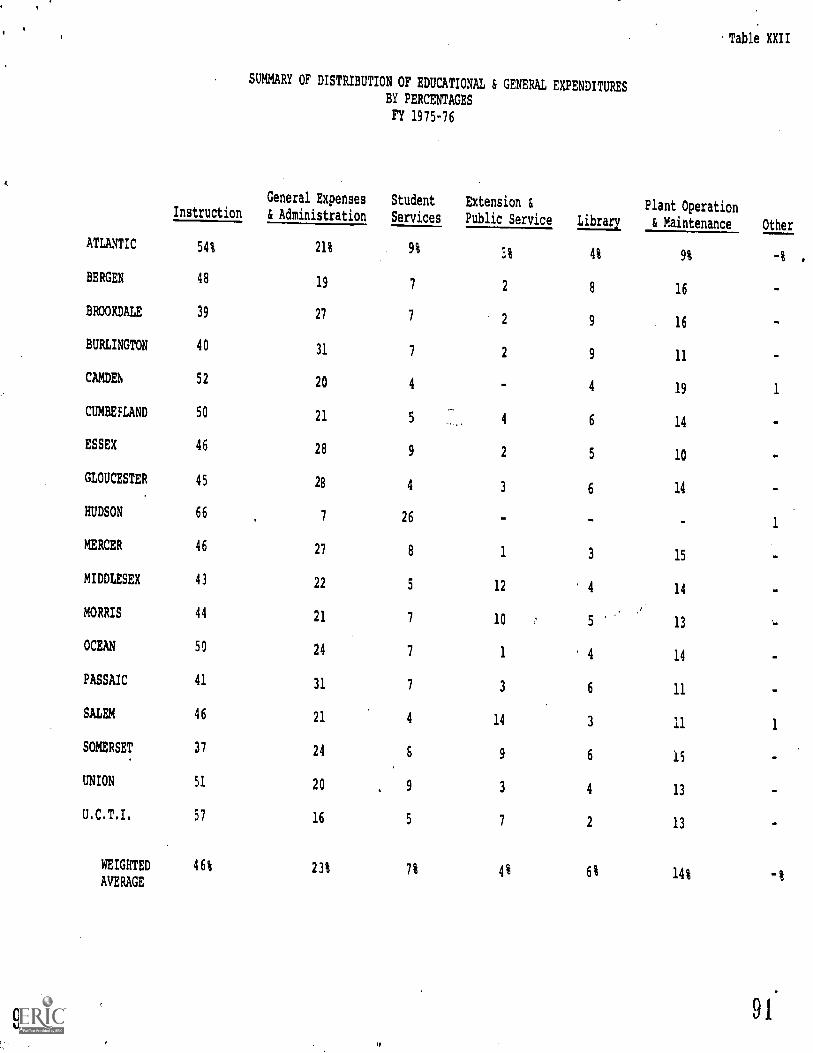
Table XXII
SUMMARY OF DISTRIBUTION OF EDUCATIONAL & GENERAL EXPENDITURES
BY PERCENTAGES
FY 1975-76
Instruction
General Expenses
& Administration
Student
Services
Extension &
Public Service Library
Plant Operation
& Maintenance Other
ATLANTIC 54% 21% 9%'A 4% 9% -%
BERGEN 4819 7 2 8 16
BROOKDALE 39 27 72 9 16
BURLINGTON 40 31 7 2 9 11
CAMDEh 52 20 4 4 19 1
CUMBEFLAND 50 21 5 4 6 14
ESSEX 46 28 9 2 5 10
GLOUCESTER 45 28 4 3 6 14 OS
HUDSON 66 7 26 - - - 1
MERCER 46 27 8 1 3 15
MIDDLESEX 43 22 5 12 4 14
MORRIS 44 21 7 10 5 13
OCEAN 50 24 7 1 4 14
PASSAIC 41 31 7 3 6 11
SALEM 46 21 4 14 3 11 1
SOMERSET 37 24 6 9 6 15
UNION 51 20 9 3 4 13
U.C.T.I. 57 16 5 7 2 13
WEIGHTED 46% 23% 7% 4% 6% 14%AVERAGE
90
.

Table XXIII
SUMMARY OF INSTRUCTION EXPENDITURES
(FY 1974-75, FY 1975-76)
FY 1974-75
Instruction
Expenditures Cotit/FTE
Instruction
Expenditures
FY 1975-76
Cost/FTE
Percent
Change
cost/FTE
ATLANTIC $ 2,266,169 $786,59 $ 2,483,600 $1,30.03( .1)
BERGEN 4,787,335 799.35 5,440,561 827.71 4
BROOKDAIE 3,308,231 597.69 3,947,613 625.51 5
BURLINGTON 2,701,445 710.35 2,868,007 691.09 (19)
CAMDEN 2,769,131 660.58 2,941,259 572.01 (13)
CUMBERLAND 1,009,905 743.12 1,046,226 693.32( 7)
ESSEX 5,563,729 831.28 5,500,844 830.57 ( .1)
GLOUCESTER 1,334,204, 671.13 1,416,151 687.79 2
HUDSON 55,915 363.08 638,004* 1,011,10 179
MERCER 3,461,451 730.73, 3,711,935 724.56 ( .8)
MIDDLESEX 3,952,453 621.94 4,571,462 626.36 ( .7)
MORRIS 3,394,942 657.42 3,665,260 626.97( 6)
OCEAN 2,101,550 735.84 2,430,931 686.32 ( 7)
PASSAIC 835,592 860.55 805,983* 628.69 (27)
SALEM 530,988 715.62 546,732 800.49 12
SOMERSET 934,913 605.12 1,331,241 668.29 10
UNION 2,697,260 756.38 2,941,391 717.76( 6)
U.C.T.I. 1,136,740 744.91 1,514,754 824.13 11
AVERAGE $713.36 $704.15 ( 1)%
TOTAL $42,841,953 $47,807,954
() Indicates negative number
92 * Unaudited
** Less than li
93

Table XXIV
SUMMARY OF GENERAL EXPENSES AND GENERAL ADMINISTRATION**
(FY 1975, FY 1976)
FY 1974-75
General Expenses
& Administration Cost/FTE
FY 1975-76
General Expenses
& Administration Cost/FTE
Percent Change
Cost/FTE
ATLANTIC $ 909,796 $315.79 $ 961,644 $302.02 ( 4)%
BERGEN 1,857,413 310.14 2,194,404 33?.85 8
BROOKDALE 2,107,821 380.82 2,779,061 440.35 16
BURLINGTON 1,931,781 507.96 1,940,823 467.67 ( 8)
CAMDEN 892,240 212.84 1,135,039 220.74 4
CUMBERLAND 350,384 257.82 431,989 286.28 11
ESSEX 2,830,880 422.96 3,396,098 512.77 21
GLOUCESTER. 714,816 359.57 874,220 424.58 18
HUDSON 31,176 202.44 63,796* 101.10 (50)
MERCER 1,879,293 396.73 2,112,813 412.42 4
MIDDLESEX 2,065,711 325.05 2,308,223 315.85 ( 3)
MORRIS 1,582,134 306.37 1,740,312 297.69 ( 3)
OCEAN 952,057 333.35 1,150,595 324.84 ( 3)
PASSAIC 520,386 535.93 613,565* 478.60 (11)
SALEM 230,27. 310.35 242,657 355.28 14
SOMERSET 635,625 411.41 838,873 421.12 2
UNION 889,004 249.30 1,117,034 272.58 9
U.C.T.I. 445,639 292.03 437,542 238.05 (23)
TOTAL $20,826,432 $24,338,688
WEIGHTED $346.78 $358.48 3%
AVERAGE
*Unaudited
**Excludes Student Services95


ATLANTIC
BERGEN
BROOKDALE
BURLINGTON
CAMDEN
CUMBERLAND
ESSEX
GLOUCESTER
HUDSON
MERCER
MIDDLESEX
MORRIS
OCEAN
PASSAIC
SALEM
SOMEMSET
UNION
U.C.T.I.
TOTAL
WEIGHTEDAMA=
Unaudited
StudentServices Cost/FTE
$ 356,540 $123.76
707,792 118.18
603,493 109.03
427,432 112.39
170,470 40.67
93,338 68.68
1,041,516 155.61
159,875 80.42
124,704 809.77
588,972 124.33_
456,746 71.87
609,594 118.05
311,226 108.97
172,568 177.72
35,978 48.49
188,586 122.06
495,957 139.08
122,991 80.60
$6,667,778
$111.02
SUMMARY OF STUDENT SERVICES(FY 1974-75, FY 1975-76)
StudentServices Cost/FTE
$ 396,132 $124.41
786,702 119.69
744,334 117.94
408,972 98.55
251,414 48.89
96,164 63.73
1,122,171 169.44
125,697 61.05
255,183* 404.41
665,771 129.96
534,788 73.18
615,360 105.26
360,201 101.69
135,042* 105.34
49,213 72.05
285,748 143.45
507,408 123.82
121,643 66.18
$7,461,943

SUMMARY OF STUDENT SERVICES(FY 1974-75, FY 1975-76)
StudentServices Cost/FTE
StudentServices
356,540 $123.76 $ 396,132
707,792 118.18 786,702
603,493 109.03 744,334
427,432 112.39 408,972
170,470 40.67 251,414
93,338 68.68 96,164
1,041,516 155.61 1,122,171
159,875 80.42 125,697
124,704 809.77 255,183*
58a,972 124.33 665,771
456,746 71.87 534,788
609,594 118.05 615,360
311,226 108.97 360,201
172,568 177.72 135,042*
35,978 48.49 49,213
188,586 122.06 285,748
495,957 139.08 507 408
122,991 80.60 121,643
;6,667,778 $7,461,943
nil .02
Percent ChangeCost/FTE Cost/FTE
$124.41 1 %
119.69 1
117.94 8
98.55 (12)
48.89 20
63.73 ( 7)
169.44 9
61.05 (24)
404.41 (50)
129.96 5
73.18 2
105.26 (11)
101.69 ( 7)
105.34 41
72.05 49
143.45 18
123.82 (11)
66.18 (18)
109.90

Table XXVI
SUMMARY OF LIBRARY EXPENDITURES
(FY 1974-75, FY 1975-76)
FY 1974-75
Library
Expenditures Cost/FTE
FY 1975-76
Library
Ex2enditures Cost/FTE
Percent Change
Cost/FTE
ATLANTIC $ 194,861 $ 67.64 $ 196,022 $ 61.56 ( 9)%
BERGEN 875,065 146.11 857,111 130.40 (11)
BROOKDALE 864,168 156.13 951,406 150.75 ( 4)
BURLINGTON 189,387 49.80 215,977 52.04 4
:AMDEN 246,824 58.88 209,598 40.76 (31)
CUMBERLAND 120,360 88.57 124,735 82.66 ( 7)
ESSEX 562,086 83.98 575,620 86.91 ( 4)
GLOUCESTER 209,483 105.37 171,883 83.48 (21)
HUDSON - - - - -
MERCER 172,296 36.37 212,016 41.39 14
MIDDLESEX 336,409 52.94 379,178 51.89 (10).
MORRIS 445,364 86.24 469,475 80.31 ( 6)
OCEAN 212,593 74.44 209,665 59.19 (21)
PASSAIC 142,552 146.81 112,612* 87.84 (40)
SALEM 43,177 58.19 36,734 53.78 ( 8)
SOMERSET 225,369 145.87 228,121 114.52 (22)
UNION 244,252 68.49 246,209 60.08 (12)
U.C.T.I. 53,329 34.95 65,256 35.50 2
$5,261,618
TOTAL $5,137,575
WEIGHTED $ 85.83 $ 77.50 (10)%
AVERAGE
*Unaudited
( ) Indicates Negative Number
9899

Table XXVII
SOURCE OF CAPITAL AND MINOR CAPITAL AUTHORIZATIONS TO DATE
Minor Capital
FY 73,74.75 State Ail*
Bond Issue
1968
Bond Issue
071
Chapter 12
PL
Total
state Sham
ATLANTIC $ 97,411 $ 1,722,086 $ 305,388 $ $ $ 2,124,885
BERGEN 254,506 3,649,214 10476,339 886,000 14,966,059
BROORDALE 628,950 1,101,232 7,624,120 1,498,119 5,911,S00 16,763,921
BURLINGTON 279,935 1,014,146 3,803,480 900,000 5,997,561
CAMDEN 87,216 1,604,435 4,123,318 1,394,874 7,209,843
CUMBERLAED 27,393 1,155,809 239,253 1,422,455
ESSEX 595,715 1,949,336 1,219,414 10,100,000 3,287,500 17,151,965
GLOUCESTER 105,480, 1,019,178 1,766,979 229,036 3,120,673
HUDSON...
,
MERCER 313,146 1,556,016 8,540,637 900,000 11,309,799
MIDDLESEX 411,379 2,932,069 3,326,950 1,300,000 1,603,826 9,574,224
MORRIS 203,927 5,327,824 2,425,550 3,300,000 11,257,301
OCEAN 182,088 1,856,567 1,525,407 1,800,000 5,364,062
PASSAIC 414,300 714,200 200,000 3,325,000 4,143,500
SALEM 143,382 . 100,000 243,382
SOMERSET 74,449 657,499 1,717,501 3:116,350 3,975,500 10,141,299
UNION 134,504 134,504
U.C.T.I 34,050 1,851,250 1,885,300
TOTAL $3,987,831 $25,749,611 $46,994,336 $28,563,379 $17,515,576 $122,810,733
.
* Prior years State Aid Capital and 1968 Bond funds were combined to cover prior years authorizations. 1 01
100

Table XXVIII
COUNTY COLLEGE CAPITAL AUTHORIZATIONS*
Capital Costs
Authgrized
Total
State Share
ATLANTIC $ 4,249,770 $ 2,124,885
BERGEN 30,182,11e 14,966,059
BROOKDALE 33,545,892 16,763,921
BURLINGTON 11,995,122 5,997,561
CAMDEN 14,419,686 7,209,843
CUMBERLAND 2,901,976 1,422,455
ESSEX 34,303,930 17,151,965
GLOUCESTER 6,241,346 3,120,673
HUDSON MOM=
MERCER 22,685,598 11,309,799,
MIDDLESEX 25,522,551 9,574,224
MORRIS 22,514,602 11,257,301
OCEAN 10,728,124 5,364,062
PASSAIC 8.287,000 4,143,500
SALEM 386,74 243,382
SOMERSET 20,282,598 10,141,299
UNION 269,008 134,504
U.C.T.I 3,770,600 1,885,300
TOTAL $252,286,685 $122,84,733
102 * This report summarises the capital authorizAr which the State has participated.

Table XXIX
Land/Site
IREE2212
FIXED ASSETS AT COST AS OF JUNE 1975
($000)
Buildings and Equipment and
Improvements Furnishings
Lib:ary
\Books
Total
Fixed Assets
ATLANTIC $ 168 $ 3,806 $ 1,158 $ 371 $ 5,503
BERGEN 4,161 25,263 2,998 186 3,608
BROOKDAIE 491 27,878 4,421 563 33,353
BURLINGTON 358 7,749 3,792*
11,899
CAMDEN 960 11,295,, 2,415 563 15,233
CUMBERLAND 22 3,100 577 276 3,975
ESSEX 992 30,016 1,732 681 33,421
GLOUCESTER 306 4,990 .731 199 6,226
HUDSON N/A N/A N/A N/A N/A
MERCER 939 22,810 4,460 30 28,558
MIDDLE:4U 1,327 17,158 3,100 250 22,835
MORRIS 1,071 18,453 3,090 403 23,017
OCEAN 267 11,4i5 874 231 12,837
PASSAIC 253 840 543 183 1,819
SALEM 122 668 159 81 1,030
SOMERSET 557 16,115 1,307 445 18,424
UNION 2,068 8,049 1,546 *11,663
U.O.T,I. - 3,702 - - 3,702
TOTAL $15,062 $213,357 $32,903 $4,781 $266,103
*Initial, purchudeui Library Books not capitalized
N/A - Not Applicable
1 0 d

Table XXX
FIXED ASSETS AT COST AS OF JUNE 1976
($)00)
Land/Site
Improvements
Buildings &
Improvements
Equipment &
Furnishings
Library
looks
Total.
Fixed Assets
$ 168ATLANTIC $ 3,950 $ 1,196 $ 371 $ 5,685
BERGEN 4,172 25,593 3,225 186 33,176
BROORDALE 491 28,113 4 497, 563 33,664
BURLINGTON 358 7,750 3,990 * 121098
CAMDEN 960 11,302 2,489 627 15,378
CUMBERLAND 23 3,105 596 276 4,000
ESSEX 11032 32,052 3,984 667 37,735
GLOUCESTER 306 5,055 814 199 6,374
HUDSON** N/A . N/A N/A N/A N/A
MERCL 970 23,691 4,841 384 29,886
AIDDLESEX 2,327 17,522 3,214 250 23,313
MORRIS 1,071 18,455 3,199 403 23,128
;
OCEAN 267 11,679 925 250 13,121
PASSAIC 737 890 466 169 2,262
SALEM*** 156 800 160 81 1,197
SOMERSET 557 1:),128 1 676, 445 ' 18,806
UNION 2,068 'Ad 1,649 * 11,781
0.C.T.I. - 3,702 - - 3,702
TOTAL $15,663 $217,851 $36,921 $4,871**** $275,3%
* Initial purchase of library books not capitalized
** Unaudited
*** Equipment carried at estimated value of June 30, 1973 with minor additions since that date recorded at cost.
N/A - Not Applicable
****These figures do not reflect total library holdings. Purchases acquired through current operating
expenses. are not capitalized by all institutions.
1 06 107

ATLANTIL ;OMMUNITY COLLEGE
Atlantic Community College is located in Maye Landing, Atlantic County, on the eastern edge of tho State.
The College formally opened its doors to students in September, 1966, in rented facilities and moved to itspermanent 546 acre campus in February, 1968. According to the 1970 census, the College serves a county popu-lation of 175,043. In 1975-76, it enrolled 3,184 ITS students in A full range of transfer, occupational, andcommunity service programs.
FY 197475 FY 1075-76
Stet, Aid 11,500,000 11,506,600County Aid 1,391,907 1,674,993Tuition Revenue 1,404,246 1,114,565Other 53,428 108,312
TOTAL REVENUE 14,349,581 $5,104,469
Instruction 12,266,169 12,483,600
Student Services 356,540 396,132General Expense, and Generil Administration 909,796 961,644Extension and Public Services 220,743 172,217
Library 194,161 196,022Plant Operation and Maintenance 417,423 422,510
Other - ..
TOTAL EDUCATIONAL AND GENERAL EXPENDITURES 14,365,532 14,632,195
TOTAL FULL-TIME -EgtIVAJNT STUDENTS 2/881 3,114
EDUCATIONAL AND GENtRAL COST PER FT! 110515 11,455
108109

BERGEN COMMUNITY COLLEGE
Bergen Community College is located in Paramue in Bergen County in the northeast corner of the State. The
College opened its doors to students in Fall, 1968, in an Interim I building on a permanent site and occupied
permanent Phase I facilities by December, 1972. In 1970, the College served a County population of 911,500. In
1975-76, it enrolled 6,573 FTEs in a variety of comprehensive community college degree and non-degree programs.
FY 1974-75 FY 1975e76
State Aid $3,330,000 $30451000
County Aid 3,293,220 4,0621516
Tuition Revenue 2,982,672 3,3461513
Other 1,272,912 1,083,606
TOTAL REVENUE $10,878,804 $11,8371635
Instruction $4,787,335 $5,440,561
Student Services 707,792 7861702
General Expenses and General Administration 1,857,413 211941404
Extension and Public Services 191,808 201,546
Library 875,065 857,111
Plant Operation and Maintenance 1,661,265 11791,124
Other - -
TOTAL EDUCATIONAL AND GENERAL EXPENDITURES $10,080478 $11,271,448
TOTAL FULL-TIME-EQUIVALENT STUDENTS 5,989 6,573
EDUCATIONAL AND GENERAL COST PER FT! $1,683 $1,715,f
111

BROOKDALE COMMUNITY COLLEGE
Brookdale Community College, the county college of MOnmouth, located in Lincroft in-central New Jersey nearthe Atlantic seacoast, was founded in 1967. In 1970, Monmouth County's population stood at 461,849. In 1975-76,
the College enrolled 6,311 FTEs in a full range of comprehensive community college programs.
FY 1974-75 FY 1975-76
State Aid $3,060,000 0,060,000County Aid 2,865,000 4,178,179Tuition Revenue 2,176,210 2,494,662
Other 336,937 693,438
TOTAL REVENUE $8,438,147 $10,426,279
Instruction $3,308,231 $3,947,613
Student Services 603,493 744,334
General Expenses and General Administration 2,107,821 2,779,061
Extension and Public Services 147,938 164,279
Library 864,168 951,406
Plant Operation and Maintenance 1,233,577 1,572,812
Other - -
- TAL EDUCATIONAL AND GENERAL EXPENDITURES $8,265,228 $10,159,505
TOTAL FULL-TIME-EQUIVALENT STUDENTS 5,535 6,311
EDUCATIONAL AND GENERAL COST PER FTE $1,493 $1,614
113

114
BURLINGTON COUNTY COLLEGE
Burlington County College is in Pemberton in Burlington County which stretches from the Delaware River to
the Atlantic. The College opened in September, 1969, in temporary facilities, and today is housed on a 225 acre
campus. In 1970, the population of the County was 323,132.
full range of comprehensive community college offerings.
In 1975-76, the College enrolled 4,150 FTEs in a
FY,1974-75 FY 1975-76
State Aid $1,800,000 $1,821,000
County Aid 2,052,828 2,581,273
Tuition Revenue 1,629,836 2,125,075
Other 524,850 657,634
TOTAL REVENUE 6,007,514 7,184,982
Instruction $2,701,445 $2,868,007
Student Services 427,432 408,974
General Expenses and Gener0 Administration 1,931,781 1,940,823
Extension and Public Services 100,881 137,239
Library 189,387 215,977
Plant Operation and Maintenance 619,845 7051E7
Other - -
TOTAL EDUCATIONAL AND GENERAL EXPENDITURES $5,970,771 $6,276,837
TOTAL FULL-TIME-EQUIVALENT STUDENTS 3,803 4,150
EDUCATIONAL AND GENERAL COST PER FTE $1,570 $1,512
MO`
115

CAMDEN COUNTY COLLEGE
Camden Conty College, located in a county directly across the Delaware River from Philadelphia, operatesfrom a 320 acre tract that formerly housed a seminary in Blackwood, New Jersey. The College opened-in 1967 andserved a County population of 456,291 in 1970. /n 1975-76, Camden County College enrolled 5,142 FTEs in avariety of comprehensive community college programs.
FY 1974-75 FY 1975-76
State Aid $1,912,200 $1,942,800County Aid 1,906,725 3,145,623Tuition Revenue 1,565,901 1,987,234Other 1,420,181 1,310,623
TOTAL REVENUE $6,815,007 $81386,280
Instruct* $2,769,131 $2,941,259Student Services 170,470 251,414General Expenses and General Administration 892,240 11135,039Extension and Public Services
Library 246,824 209,598
Plant Operation and Maintenance 935,709 1,075,738Other - 88,472
TOTAL EDUCATIONAL AND GENERAL EXPENDITURES $5,014,374 $5,701,520
TOTAL FULL-TIME -EQUIVALENT STUDENTS 4,192 5,142
EDUCATIONAL AND GENERAL COST PER FTE $1,196 $1,109
117
116

CUMBERLAND COUNTY COLLEGE
Cumberland County College is located on a 100 acre campus in Millville and Vineland in the southern tip
of the State. Classes were held for the first time in the Pall of 1966. Cumberland County's population in
1970 was 121,374. In 1975-76, the College served 1,50°
programs.
FTEs in a range of comprehensive community college
FY 1974-75 FY 1975-76
State Aid $675,000 $681,000
County Aid 566,137 675,581
Tuition Revenue 636,441 752,833
Other 66,838 61,369
TOTAL REVENUE $1,944,416 $2,170,783
Instruction $1,009,905 $1,046,226
Student Services 93,338 96,164
General Expenses and General Administration 350,384 431,989
Extension and Public Services 74,326 94,128
Library 120,360 124,735
Plant Operation and Maintenance 267,426 29,1480
Other - VI
TOTAL EDUCATIONAL AND GENERAL EXPENDITURES $1,915,739 $2,015,722
TOTAL FULL-TIME-EQUIVALENT STUDENTS 1,359 1,589
EDUCATIONAL AND GENERAL COST PER FTE $1,410 $1,384
119

ESSEX COUNTY ODLLEGE
Essex County College, located in Newark in the northeast of the State, opened its doors in September, 1968,
in rented space. In April, 1976, the College dedicated a "Megastructure" on its permanent 22 acre urban campus.
The College served an estimated County population of 937,025 in 1971. In 1975-76, it enrolled 6,623 FTEs, in
a full series of comprehensive community college programs.
FY 19744;75 FY 1975-76
State Aid $3,420,000 $3,450,000
County Aid 4,802,651 5,059,311
Tuition Revenue 2,807,372 3,111,762
Othdr 1,069,163 434,720
TOTAL REVENUE $12,099,1d6 $12,055,793
Instruction 5,563,729 5,500,844
Student Services 1,041,516 1,122,171
General Expenses and General klLin:stration 2,830,880 3,396,098
emension and Public Services 367,377 177,505
: miry 562,086 575,620
Plant Operation and Maintenance 846,096 1,233,927
Other - -
TOTAL EDUCATIONAL AND GENERAL EXPENDITURES $11,211,684 $12,006,165
TOTAL FULL-TIME-EQUIVALENT STUDENTS 6r693 6,623
EDUCATIONAL AND GENERAL COST PER FTE $1,675 $1,813
121
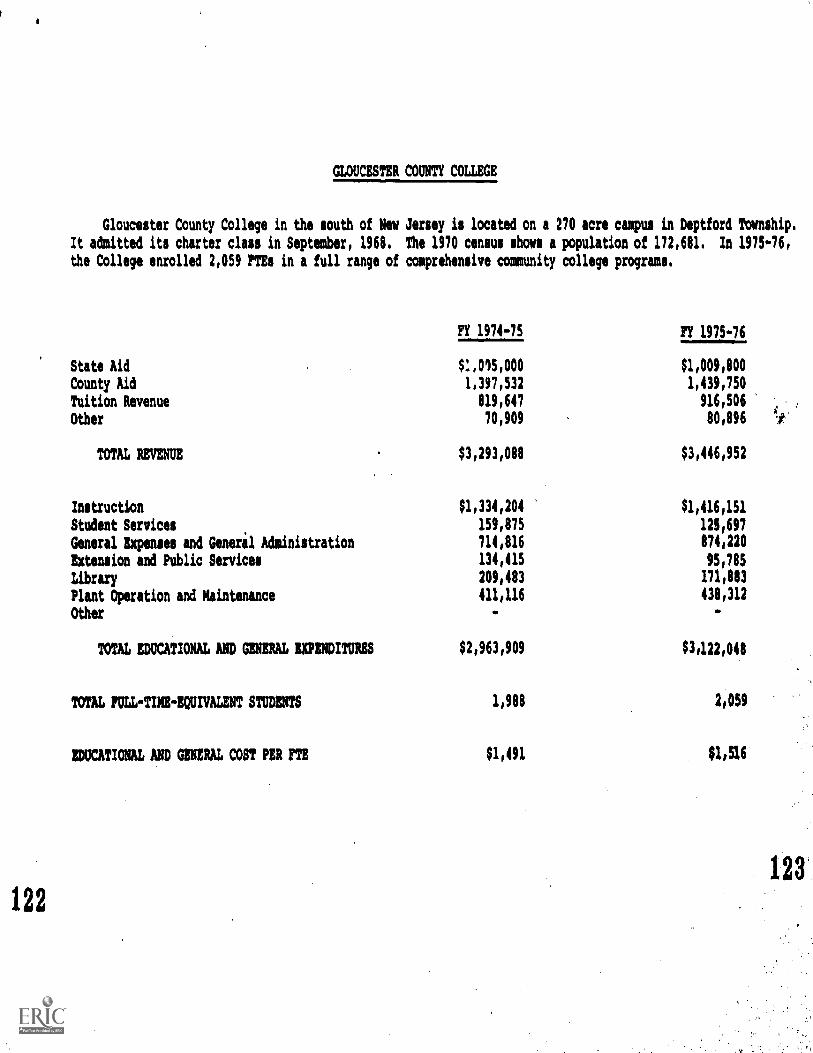
GLOUCESTER COUNTY COLLEGE
Gloucester County College in the south of New Jersey is located on a 270 acre campus in Deptford Township.
It admitted its charter class in September, 1968. The 1970 census shows a population of 172,681. In 1975-76,
the College enrolled 2,059 PTEs in A full range of comprehensive community college programs.
FY 1974-75
State Aid $,015,000
County Aid 1,397,532
Tuition Revenue 819,647
Other 70,909
TOTAL REVENUE $3,293,088
Instruction $1,334,204
Student Services 159,875
General Expenses and Generil Administration 714,816
Extension and Public Services 134,415
Library 209,483
Plant Operation and Maintenance 411,116
Other -
TOTAL EDUCATIONAL AND GENERAL EXPENDITURES $2,963,909
TOTAL FULL-TIME-EQUIYALENT STUDENTS 1,988
EDUCATIONAL AND GENERAL COST PER FTE $1,491
122
11 1975-76
$1,009,800
1,439,750
916,506
80,896
$3,446,952
$1,416,151
125,697
874,220
95,785
171,883
438,312
-
$3,122,048
2,059
811516
123

HUDSON COUNTY COMMUNITY COLLEGE COMMISSION
Hudson County Community College Commission in Jersey City serves a county located directly across fromNew York City, The College is the newest in the New Jersey county college system. In 1970, Hudson Countyhad a population of approximately 610,000 residents. In 1975-76, the College, still in its beginning stages,enrolled 631 PTEs. Because Hudson County Community College Commission is a "brokerage" institution, it con-tracts directly with neighboring institutions such as St. Peter's College, Jersey City State Colleget'andStevens Institute of Technology for most of its institutional services.
State Aid
FY 1974-75 FYl975-76*
- $333,000County Aid
66,000 95,900Tuition Revenue
70,352 283,326Other
99,076 20,862
TOTAL REVENUE $235,428 $733,088
Instruction $ 55,915
$623585:01081
Student Services124,704
General Expenses and General Administration 31,176 63,796.Library - -Plant Operation and Maintenance - -Other
TOTAL EDUCATIONAL AND GENERAL EXPENDITURES $230,697 $966,285
TOTAL FULL -TIME -EQUIVALENT STUDENTS154 631
EDUCATIONAL AND GENERAL COST PER FTE $1,498 $1,531
*. Unaudited
24
125

MF10ER COUNTY COMMUNITY COLLEGE
Mercer County Community College in the central sector of New Jersey is located on a canrim near Trenton.
The College started its academic program in the summer of 1967. In 1970, it served a County population of
303,968. In 1975-76, it enrolled 5,123 FTEs in a full program of comprehensive community college programs.
FY 1974-75 FY 1975-76
State Aid $2,752,800 $2,757,000
County Aid 2,312,559 3,101,877
Tuition Revenue 2,216,965 2,606,501
Other
TOTAL REVENUE
409,870
$7,692,194
358,224-,
$8,823,602
Instruction $3,461,451 $3,711,935
Student Services . 588,972 665,771
General Expenses and General Administration 1,879,293 2,112,813
Extension and Public Services 94,453 104,522
Library 172,296 212,016
Plant Operation and Maintenance 1,220,035 1,210,994
Other 9,029
TOTAL EDUCATIONAL AND GENERAL EXPENDITURES $7,425,529 $8,018,051
TOTAL FULL-TIME-BQUIVALENT STUDENTS 4,737 5,123
EDUCATIONAL AND GENERAL COST PER FTE $1,568 $1,565
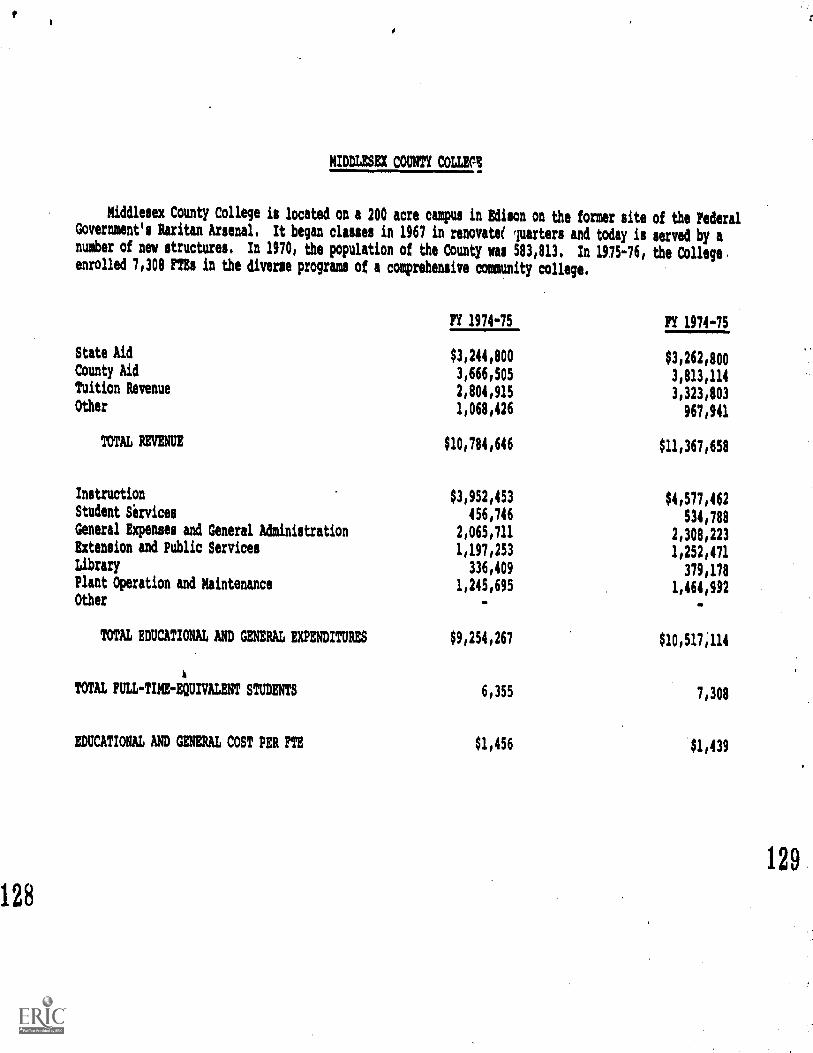
128
MIDDLESEX COUNTY COLLECt
Middlesex County College is located on a 200 acre campus in Edison on the former site of the FederalGovernment's Raritan Arsenal, It began classes in 1967 in renovate( luarters and today is served by anumber of new structures, In 1970, the population of the County Vas 583,813. In 1975-76, the College,enrolled 7,308 FTEs in the diverse programs of a comprehensive community college.
FY 197475 FY 1974-75
State Aid $3,244,800 $3,262,800County Aid 3,666,505 3,813,114Tuition Revenue 2,804,915 3,323,803Other 1,068,426 967,941
TOTAL REVENUE $10,784,646 $11,367,658
Instruction $3,952,453 $4,577,462Student Services 456,746 534,788General Expenses and General Administration 2,065,711 2,308,223Extension and Public Services 1,197,253 1,252,471Library 336,409 379,178Plant Operation and Maintenance 1,245,695 1,464,9)2Other - -
TOTAL EDUCATIONAL AND GENERAL EXPENDITURES $9,254,267 $10,517;114
TOTAL FULL-TIME -EQU/VALENT STUDENTS 6,355 7,308
EDUCATIONAL AND GENERAL COST PER FTE $1,456 $1,439
129

COUNTY COLLEGE OF MORRIS
The County College of Morris, in Randolph Townihip in the northern area of the State, is on a 218 acre
campus. It opened its doors to students in Septehber, 1968. in 1970, Morris County had a population of
383,000. In 1975-76, the College enrolled 5,846 FTEs in a full range of comprehensive community college
programs.
FY 1974-75 FY 1975-76
State Aid $2,907,000 $2,916,600
County Aid 1,676,465 1,641,668
Tuition Revenue 3,025,128 3,460,111
Other 1,006,610 1,169,682
TOTAL REVENUE $8,615,203 $9,188,061
Instruction $3,394,942 $3,665,260
Student Services 609,594 615,360.
General Expenses and General Administration 1,582,134 1,740,312
Extension and Public Services 609,692 806,954
Library 445,364 469,475
Plant Operation and Maintenance 1,040,487 1,083,197
Other - -
TOTAL EDUCATIONAL AND GENERAL EXPENDITURES $7,682,213 $0,380,558$
TOTAL FULL-TIME-EQUIVALENT STUDENTS 5,164 5,846
EDUCATIONAL AND GENERAL COST PER FTE $1,488 $1,434
130
._
131

OCEAN COUNTY COLLEGE
Ocean County College is four miles northeast of Toms River, the County Seat, midway betieen Philadelphia
and New York on the Atlantic. The College opened in the Fall of 1966 and today is located in modern facilities
on a 275 acre campus. In 1970, Ocean County had 208,470 residents. In 1975-76, it enrolled 3,542 PTEs in
diverse comprehensive community college programs.
FY 1974 75 FY 1975-76
State Aid $1,443,600 $1,457,400
County Aid 1,595,395 1,941,203
Tuition Revenue 1,3064162 1,574,198
Other 1354760 154,748
TOTAL REVENUE $4,480,917 $5,127,549
Instruction $2,101,!j10 .$2,430,931
Studint Services 311,226 360,201
General Expenses and Generil Administration 952,057 1,150,595
Extension and Public Services 49,141 57,318
Library 212,593 209,665
Plant Operation and Maintenance 616,686 700,906
Other -.
TOTAL EDUCATIONAL AND GENERAL EXPENDITURES $4,243,253 $4,909,616
TOTAL FULL-TIME-EQUIVALENT STUDENTS 2,856 3,542
EDUCATIONAL AND GENERAL COST PER PTE $1,486 $1,386
133

PASSAIC COUNTY COMMUNITY COLLEGE
Passaic County Community College within the City of Paterson is a 'young comprehensive community college
in the northeast of the State. The College accepted
lation reached 460,782 in 1970. In 1975-76, the College
its first class in the Fall of 1971.
enrolled 1,282 FTEs.
FY 1974-75
The County popu-
FY 1975-76*
State Aid $443,400 $ '508,800County Aid 977,830 1,092,347
Tuition Revenue 461,563 720,262Other ,
363,531 78,505
TOTAL REVENUE $2,246,324 $2099,911
Instruction $835 592 $805 983Student Services 172,568 135,042
General Expenses and General Adainistratio, 5201386 613,565
Extension and Public Services 134455 59,311
Library 142,552 112,612
Plant Operation and Maintenance 195,979 228,077
Other 41,928 12,871
TOTAL EDUCATIONAL AND GENERAL EtPNATURES $1,922,660 $1,987,463
TNAL FULL-TIME-EQUIVALENT STUDENTS 971 1,282
EDUCATIONAL AND GENERAL COST :' $1,980 $1,535
* Unaudited
134
,;

............
136
SALEM COMMUNITY_ COLLEGE
Salem Community College is located on a campus in Penns Grove in the southwestern portion of the Statedirectly across from Wilmington, Delaware, In 1970, the County had a population of 60,346 people. In 1975-76,the College enrolled 683 FTEs. Salem Community College is a comprehensive community college concentrating in
occupational programs.
FY 1974-75 FY 1975-76
$360,000 $ 408,000
County Aid 260,000 414,608Tuition Revenue 215,814 320,834Other 319,631 394,018
TOTAL REVENUE $1,155,445 $1,537,460
Instruction $530,988 $546,732
Student Services , 35,978 49,213
General Expenses and General Administration 230,276 2420657
Extension and Public Services 123,720 166,046Library 43,177 36,734
Plant Operation and Maintenance 120,895 127,609Other .. 12,109
TOTAL EDUCATIONAL AND GENERAL EXPENDITURES $1,085,034 $1,181,100
TOTAL FULL-TIME-EQUIVALENT STUDENTS 742 683
EDUCATIONAL AND GENERAL COST PER FTE $1,462 $11729

138
SOMERSET COUNTY COLLEGE
Somerset County College is in the heart of New Jersey on A 225 acre campus in Branchburg Township. The
first class entered in the College's temporary quarters in A local high school in September, 1968, and moved
to its permanent facilities in Fall, 1973. The County population in 1970 was 198,372. In 1975-76, the
College enrolled 1,992 IPTEs in comprehensive community college programs.
-State Aid
FY 1974-75 FY 1975-76
4-4041.000 *-3011203----,
County Aid,
Tuition Revenue
Other
TOTAL REVENUE
1,235,218
925,581
124,516
$3,185,315
1,742,071
1,297,499
106,717
$4,047,487
Instruction $934,913 $1 331,241
Student Services 188,586 285,748
General Expenses and General Administration 635,625 838,873
Extension and Public Services 276,407 332,227
Library 225,369 228,121
Plant Operation and Maintenance 388,415 562,367
Other .
TOTAL EDUCATIONAL AND GENERAL EXPENDITURES $2,649,315 $3,578,577
TOTAL FULL-TIME-EQUIVALENT STUDENTS 1,545 1,992
EDUCATIONAL AND GENERAL COST PER FTE $1,715 $1,796
139

UNIONCOLLEG
Union College serves as the communiq college of Union County in conjunction vith Union County TechnicalInstitute, under contract vith the WU County Coordinating Agency for Higher Education. It is located inCranford in the northeastern section of the State, The College, formerly Won as Union Junior College, wasfounded in 1933 and entered into an agreement vith the Union County Coordinating Agency in 1969 to provide
colloge-level programs for the County in lieu of a Canty College. The County population in 1970 vas504,255. The College's ITE enrollment-TM-76 vas 4,098.
140
-11-t974.75*, -
State Aid $1,000,000 $1,816,800County Ald 1,723,500 1,5731186Tuition Revenue 1,762,506 1,997,369Other 536,193 2451718
TOTAL REMUS 05,822,199 $51633,243
Instruction $2,697,260 $2,941,391Student Services 495,957 507,408
General Expenses and General Administration 889,004 1,117,034Extension and Public Services 256,735 179,497Library 244,252 246,209
Plant Operation and Maintenance 725,616 738,796Other . .
TOTAL EDUCATIONAL AND GENERAL EIPENDITUIES $5,308,824 $5,730,335
TOTAL YULL-TIRPIQUIVALENT STUDENTS 3,566 4,098
EDUCATIONAL AND GENERAL COOT PER FTE $1,489 $1,398
141

UNION COUNTY TECHNICAL INSTITUTE
Union County Technical Institute in Scotch Plains in the northeastern part of the State serves as the
community college of Union County in conjunction with Union College, under contract with the Union County
Coordinating Agency for Higher Education, The Union County Technical Institute opened in1960. In 1969,
U.C,T.I.'s Technical Institute became the Technical Branch of the Comprehensive Community College of Union
County, Where Union College provides community college-level instruction mainly in the arts and sciences,
U.C.T.I. provides technical and occupational programs, In 1975-76, 11,C.T.I. enrolled 11838 FTEs,
FY 1974-75 FY 1975-76
State Aid $687,600 $699,600
County Aid 472,520 631,420
Tuition Revenue 529,060 623,120
Other 469,977 584,470
TOTAL REVENUE $2,159,157 $2,538,610
Instruction $1,136,740 $1,514,754
Student Services 122,991 121,643
General Expenses and General Administration 445,639 437,542
Extension and Public Services 112,977 199,242
Library 53,329 65,256
Plant Operation and Maintenance 311,334 334,302
Other - -
TOTAL EDUCATIONAL AND GENERAL EXPENDITURES $21183,010 $2,672,739
TOTAL FULL-TIME-EQUIVALENT STUDENTS' 1,526 1,838
EDUCATIONAL AND GENERAL COST PER FTE $1,431 $1,454
!1
142
H
CLEARING1.10'
JUNIOR COLL:riES
143