1985. on...balrampur kashipur matha headquarters purulia manbazar bandwan jhalda joypur hura...
TRANSCRIPT

GOVERNMENT OF INDIA , MINIST RY OF E NVIRONMENT AND FORESTS
( DEP ARTME NT OF FORESTS P.ND ~rJ' ILDLIFE )
REPORT
ON
FOREST RESOURCES OF
PURULIA DISTRICT OF WEST BENGAL
FOREST SURVEY OF INDIA
EASTERN ZONE
1985.

CON TEN T S
CHAPTER-I - BACKGROu}ID INFORMATION
Need for the survey
Name of tbe catchment
SiFuation and boundaries
Location
Administrative units and areas
Geographical area by District and Forest Division.
Forest area by Districts an d division
Locality factor
Climate
Temperature
Rainfa1.1
Humidity
Topography
Altitude
Mountain ranges
Aspect
Slope
Drainage
Geology? rock and soil
General description
Mineral resources
Land use pattern and assessment of' the condition of land, erosion status etc.
Land use classification
Soil
Ground water
People and their socio-economic condition
General
Livelihood classes
Cultivation details
Industrial dependance
Economic standing
Dependance on forests
Special programmes of development in forestry.
Forests
Para page
1 1
1 .1 1
1 .2 1
1 .3 2
1 .4 2
1 .4.1 2
1.4.2 2
2 3 2.1 :3 2.1 .1 3 2.1 .2 4
2.1 .3 .5 2.2 5 2.2.1 6
2.2.2 6
2.2.3 6
2.2.4 7 2.2.5 7 2.3 7 2.3 .. 1 8
2.3.2 9
3 9
3.1 10
3 .. 2 11
3.) 13
4 13 4.1 14
4.2 14
4.3 14
4.4 1.5
4.5 15
4.6 16L:
4.7 16
5 17

r-ianu~l. processing
Processing of unit record machine
Electronic data processing
Calculation of area
Tree volume study . Volume equation
General volume equation
Local volume equation
Volume of tree enumerated
Plot volume
Volume per,. ha. by strata
T:fe~ density study
Sal strntu~( stems)
Miscellaneous stratum
Plantation stratum
Stock tabl.es
Volume studies(sal stratum)
Vo l.ume studio s (Misc., stratum)
Volume studies{Plantation -stratum"}
Local volume tables
Estimation o~ error for growing stock
Growing stock( total. - ire l~me )
, CH.t.:?TER-:-IV ANNU1.L YIELD:
General
Inventory result st_rata-wise
Annual. yield
Area under present management
I-~rea considered exploitable as per this survey.
Futu:re .manaF-,erp.cnt model
Estimation of annua1 yield(accqrding to the present managem~nt)
Calculation of yield according to the model management.
~ Page
3.2 42
3.3 42
3.4 42
3.5 43 3.6 43
3.7 44
3.7.1 44
3.7.2 45
3.7.3 45 3.7.4 45 3.8 46
3.9 46
3.9.1 47 3.9.2 47 3.9.3 48
3.10 49 3.11 49 3.12 ,50
3.1 3 51
3.1 4 51 3:'15 51 3;16 51
4.1 54 4.2 54
4.3 54 4.3' ..55 4.3;2 .5.5
4.3.3 .56 4.3.4 61
4.3 • .5 63
- -- - -----------------
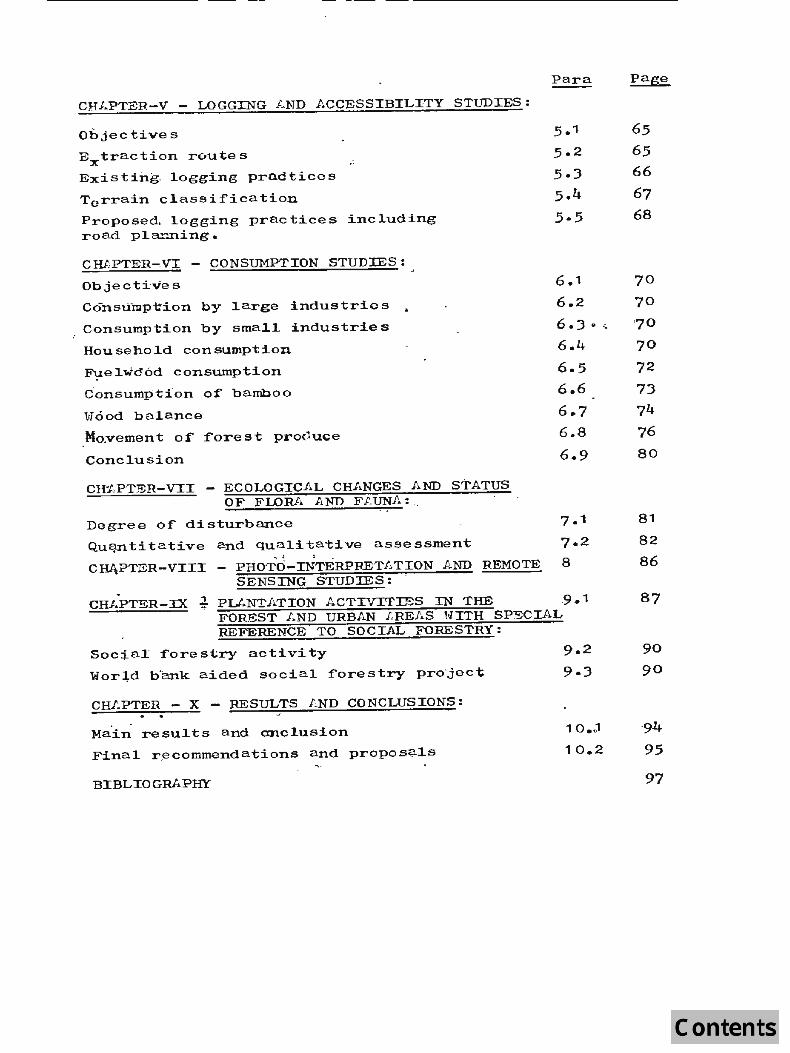
CHJ..PTER-V - LOGGING LND ACCESSIBILITY STUDIES:
Objectives
E~traction routes ,:'
Exi sting, logging prad t i ce s
Torrain classification
Proposed. logging practices including road plar.ning.
CHAPTER-VI - CONSUMPTION STUDIES:
Objecti'ves
Consui11p1:ion by large in,dustrios
Consumption by sma~l industrie s
Household consumption
~e1wd6d consumption
Consumption of" bamboo
vlood be1ance
Mo.vement of' forest pro(Juce
Conclusion
CH1!PTER-VII - ECOLOGICAL CHANGES AND STATUS OF FLORA liND F t,UN.il :,
Para
6.1
6.,2
6.3 • ... 6.4 6.5 6.6 6.7 6.8
6.9
65
65 66
67 68
70 70
'70
70
72
73 74 76 80
Degree of disturbance 7. 1 81 Qu~titative and qualitative assessment 7.2 82
, . "', ~ ~. :
CHA.PTER-VIII - PHOTO-INTERPRETATION AND REMOTE 8 86 SENSING STUDIES: .
CH1.PTER-IX ~ PU.NTATION ACTIVITIES IN THE 9.1 87 FOREST LND URBAN /,REAS "lITH SPECIAL REFERENCE TO SOCIAL FORESTRY:
Soctal fores~ry activity
'Worl,.d bLank aided social forestry pro'ject
CHI~PTER - X - RESULTS I~ND CONCLUSIONS: , .
Main results and anclusion
Final r ,e cornmenda ti ons and proPQs~1s
BIBLIOGRAPHY
10 • • 1
10.2
90 90
94 95
97

Tabl.e No.
1 .1
1 .2.
1 .. J.
2.1 ..
2.2
4.1 •
4.2.
i)
ii)
iii)
i.v)
v)
Vi)
vii)
viii)
ix)
x)
xi)
LIST OF Tf:,BLES (PUP-ULIL DISTRICT)
Particul.ars
Sterns per ha. by species and diameter c las s in Sal. stratum.
Stems per ha. by species and diameter cl.ass in Misce1Laneous stratum.
Stems per ha. by snecies and diameter cl.ass in Plantation stratum.
Vol.ume per ha. by specie s and diameter c1ass in Sal. stratum.
Vol.ume per ha. by species and diameter class in Misce11aneous stratum.
Vol.urne per ha. by species and di ameter class in Plantation stratum.
Total stems per ha. by species and diameter c1ass in Sal. stratum.
Total stems per ha. by svecics and diameter class in misc. stratum.
Tota~ stems per ha. by species and diameter class in Plantation stratum.
Total volume per he. by specie s and diameter class in Sal stratum.
Total volume per he. by species and diameter class in Misc. stratum.
Total volume per ha. by species and diameter c1ass ~ Plantation stratum.
Mi;.:?S & DIAGRAMS.
Project area in In.dia.
Inventory Design.
Forest type, roads, Railway lines, rivers and important locations.
Pafle
98
100
10J
104
106
109
110
112
115
116
118
121
DeSign fol1owed with respect to household and consumption study sampling units.
Map showing distribution of stock according to size c1asses.
Map showing fire inci«ence.
Map showing injuries to crop.
Histogram showing distribution of total stem/ha. & stem/ha. of sal accordi.ng to diameter cl.ass in different strata.
No.
Histogram showing distribution of total volume/ha. & vOlume/ba. of sal. accordibg to diameter class in different strata. Piechart showing tota1 number of stems according to diameter classes. Piechart showing total volume according to dia. classes.

PREFACE
The inventory of forest resources in Puru~ia District of West Bengal was taken up by the Eastern Zone of Forest Survey Of India during the year 1 981-82. The field work was conducted during the period February to March, 1982 and \..;as supervised directly by shri B.M. Dev, Assistant Director under the overall supErvisio n, direction and guidance of Shri A.B. Chaudhuri, the t h en Joint Director, Eastern Zone~
A Consumption study of wood in the district was conducted by Dr.J.S.Negi, Deputy Director(I) of Forest survey Of India, Dehradun \vith the help of field staff of Headquarters office and Eastern Zone during June, 1982. His findings have been incorporated in the report to calculate the wood balance.
The field data has been processed at the Regional Computer Centre,Jadavpur under the supervision o f Shri S.K. Sen,Asstt.Director(Statistics). The report has been compiled by Sri K.K.Singh,Dy.Director and the final scrutiny, for subsequent modifications, wher-ever necessar~, were made by sri S.C.Dey, Joint Director, Forest Survey Of India, E.Zone.
'rhe findings in the report indicate that the f o rest resources of the district are fast dwindling. The demand of wood far exceeds the , present supply from the recorded sources. The average volume per hectare estimated3 for the high forest has been found 3 to vary between 20-25 mOld the same was approximately 8m from plantation areas. This stock per hectare needs to be improved through sound silvicultural management and vigorous forest protection. The p e r capita forest area is only .05 ha. which is much below the national average. This is required to be increased, epecially when almost 35% of the population belongs to the traditionally backward class and majority o£ them re~y on the forest for their livelihood and sustenance.
The social forestry programme taken up rece ntly in the district has encouraged large scale planting of trees in areas outside the forest. This programme is required to be intensified further to lessen the pressure on Government forest for meeting the bonafide requirement of wood for dome stic consumption. I am sure that this r e p o rt will be helpful in planning strategies for improving the status of for~st in the district.
The hard work put in by all the staff o f the Eastern Zone in carrying out the field work, collection of data, their processing and preparation of the report is thankfully acknowledged. The help and cooperation extended by officials and sta£f of the Forest Department of west Bengal and the administration of Purulia district during inventory and collection of various data are also thankfully acknowle dged.
sd/-( D.B. Misra
Director.

CHAPTER: I
BACKGROUND INFORMATION
Need for the survey:
The s\,lrvey was needeo. to assess the quantity and qua~ity of forest resources exi·sting in the district. The data co~~ected will provide a base to monitor the changes occurring in the forest resources during p~riodic sUrvey.o The survey will al so prov.iqe a comprehensive source of data to the state Government and wi~l help in p~anning further deve~opmental work specia~ly in the forestry sector' for improving the poor economy of the area and for genera~ upliftment of the indigenous popu~atiori specially the traditionally backward class.
1.1 Name of the catchment: .'
The northern portion of the district falls in the catchment of Damodar river. The central and greater part of the southern portion falls in the catchment of river Kang5abati and a part of the eastern portion falls in the catchment of river Silabati and Darakeshwar. The south western portion .falls in the catchmen~ 0 f river Subarnarekha. --
1 .2 si tuation and boundaries:
The forest areas of Purulia D~vision lie entire~y within the district Qf Puru~ia. It is pituated in the western most corner of West Bengal and 'was formed after splitting from the erstwhi~e Manbhum division in November 1956 during the transfer of Purulia dis.trict from Bihar to West Bengali under West Bengal (Trans£er Territories) .Act, 1956. It is bounded in the north by the "districts of Giridih and Dhanbad, on the south by Singhbhum district and partly by Midnapur district; on the east by districts-:o:f Bankura and Midnapore and on the west by Ranch! and Hazaribagh districts.
1.3 Location:
The divisioh is located between north latitude 22 °43 1 to 23°42 '0 'and east longitude 85°49 1 to 86°54'.

: L: :
1.4 Administrative units and areas:
The division is headed .. by a Divisional Forest Officer who is assisted by one Asstt.Divisional Forest Officer and one Asstt.Forest Officer. The division is divided into ranges · each headed by a .Range Officer who has a nt.unber of bea'ts under him head$i by a Beat Officer. The names of territorial ranges with their Headquarters and areas are given below:
Name of Range
Purulia Manbazar Bandwan Jhalda Joypur Hura Balrampur Kashipur Matha
Headquarters
Purulia Manbazar Bandwan Jhalda Joypur Hura Balrampur Kashipur Matha
Forest area in hectare.
11049 6429
15285 14269
5272 6474
11000 5472
17034
92284/
1.4.1Geographical area by ~districts and forest division:
. J.Geographical: area Of· Purulia district is 6234.10 km., the gross 'area ':of t,pe forest division is a~~o 6234:t6 km;. ,I, ,:"
1.4.2 Forest area by districts and division:
Area of the forest within. Jpuru.lia pi vision is 92284 ha. as intimated by the Divisional Forest Officer,
JPurulia. During"'creation of· the Division the total !,: 'area 0'£ the" foi-est in"the district was estimated to be \~1,38)466 ha"~- :as"given in the prel.iminary l"Jorking Plan report of Purulia Forest·l Division. The forest area recorded by the Chief' Conservator Of Forests, West Bengal is,however>'87614 ha. The'discrepancies in the a rea statements appear to be due to the presence of unclassed state Forest·· which were- vested to ehe ·State Government under var.:i,bus acts and s6rh~' of which were sUbsequently handed over' to the forest -'Department for management. Part of these area~F are under dispute ~n courts and t h eir legal positions are not very clear. The results of the revisional settlement have not yet bee n completed. However, as toe field inventocy work ~as d one o n the
: basis of ~he forest. ,a rea '.intim2H::ed by' the Divisional Forest Officer, Purul-ia ·th.i·s are~ h a s been taken as the basis of the report.
: 3 :
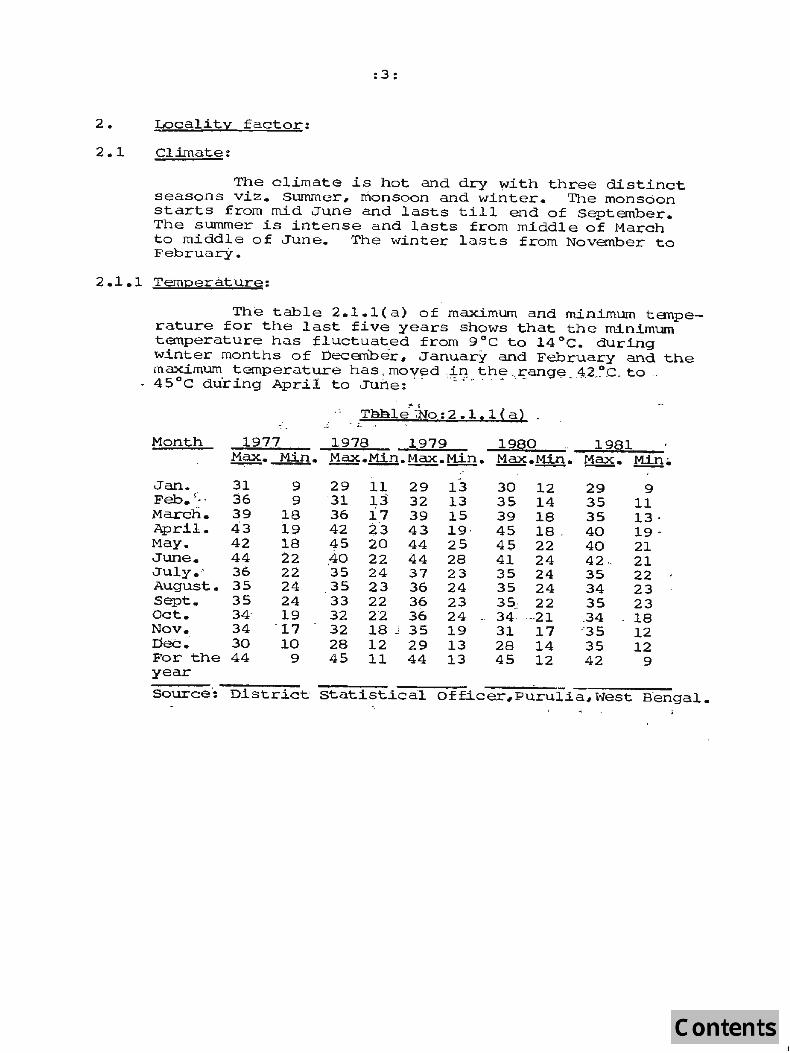
2. Locality factor:
2.1 Climate:
The climate is hot and dry with three distinct seasons viz. Summer, monsoon and winter. The monsoon starts from mid June and lasts till end of september. The summer is intense and lasts from middle of March to middle of June. The winter lasts from November to February_
2.1..1 Temperature:
The table 2.1.1(a) of maximum and minimum tEmperature for the last five years shows that the minimum temperature has fluctuated from 9°C to 14°C. during winter months of I)ecember. January and February and the maximum temperature has. moved ,.tq . the --rang~ _ 4,2_~C. to 45°C during April to June: .: ' '_- - ' ' - , .
Taale'":No: 2 .1.1!a2 - -- "
Month 1977 .1978 1979 1980 1981 Max. Min. ~.&n-Max.t!!n. Max.!:a!n .• ~. Min.
Jan. 31 9 29 11 29 13 30 12 29 9 Feb.'-, 36 9 '31 13 32 13 35 14 35 11 March. 39 18 36 17 39 15 39 18 35 13' April. 43 1.9 42 ~-3 43 19 , 45 18, 40 19-May. 42 18 45 20 44 25 45 22 40 21 June. 44 22 40 22 44 28 41 24 42, 21 July.' . 36 22 35 24 31 23 35 24 35 22 August. 35 24 35 23 36 24 35 24 34 23 Sept. 35 24 33 22 36 23 35~ 22 35 23 Oct. 34 19 32 22 36 24 34- ,··21 ,34 18 Nov. __ 34 '17 32 18 j ' 35 19 31 17 '35 12 Dee.' 30 10 28 12 29 13 28 14 35 12 For the 44 9 45 11 44 13 45 12 42 9 year
Source': District statistical Officer,Purulia,West B'engal. " ' '"i .
2.1.2
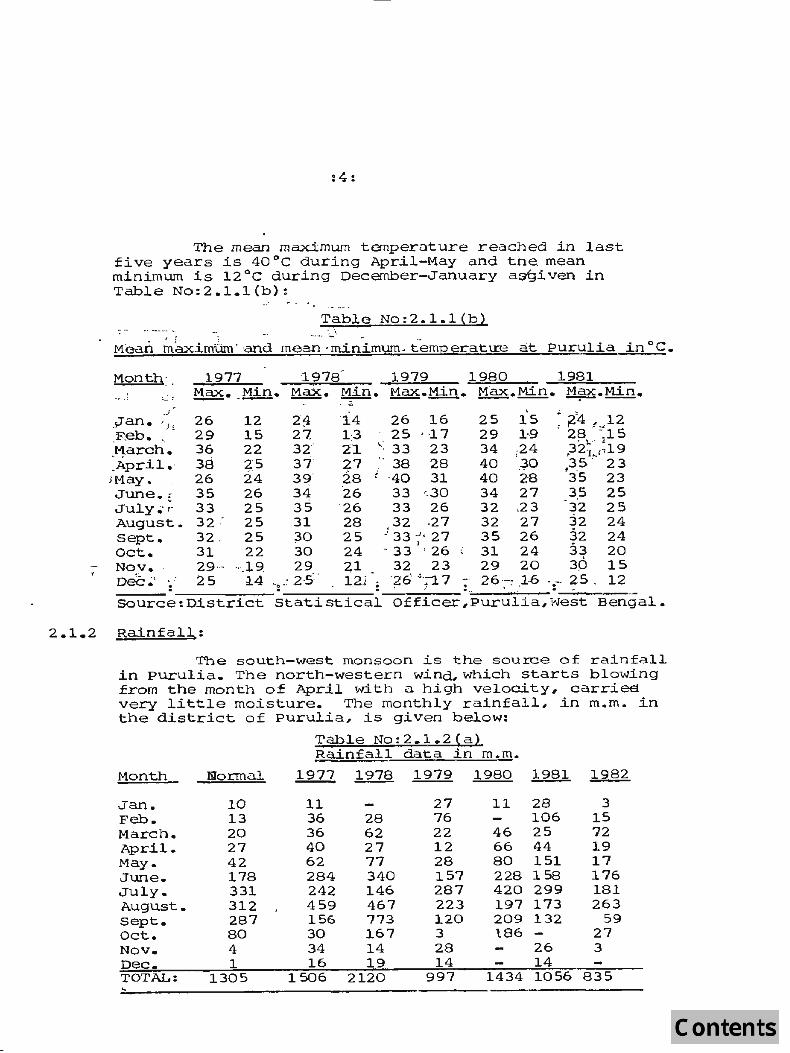
: 4:
The mean maximum temperature reached in last five years is 40°C during April-May and the. mean minimum is 12°C during December-January a~iven in Table No:2.1.1(b):
Table No:2.1.1(b) ~ . i '. ;. -;
Mean maximUm' and mean ·minimym. t'emperatu:e at Purulia inoC.
1977 ·1978 1979 1980 1981 Month: . . ". ,1 ~"~ : ~. _Min. ~. r;_in. Max. Min. Max.Min • - - ---:----
..J ,
~ i4 , 12 ,yan. '." 26 12 2~ '14 26 16 25 15 .,' ~, ' 28 '::15 F~b. 29 15 27. 1:3 25 ' '17 29 1·9
:~arch. 36 22 32' 2l ~: 33 23 34 ,24 • 1." ~
,321 ;..1',19 _.April. 38 2.5 37 27
., 38 28 40 :30 35' 23
iMay. 26 24 39 2S -40 31 40 28 13'5 23 June. e 35 26 34 '26 33 ·:, 30 34 27 3,5 25 July;,'r 33 25 35 '26 33 26 32 ,23 32 25 Augus:t,. 32 . 25 31 2S ,32 ,27 32 27 32 24 sept. 32, 2S 30 25 -, 33 J . 27 35 26 32 24
1 33 Oct. 31 22 30 24 - 33 ' 26 ,. 31 24 20 Nov. 29,·- -'c19. 29 21 32 23 29 20 30 15 DeC~' ,. 25 14 y:25 121 ';2 6' '~';-1 7
_. 26;-: ;1-6 25 ., 12 : . ..; . .. , ,..
Source: District Stati stical Officer ,purulia, lAJest Bengal.
Rainfall:
The south-west monsoon is the SOUICe of rainfall in purulia. The north-western wind, which starts blowing from the month of April with a high velocity, carries very little moisture. The monthly rainfall, in m.m. in the district of purulia, is given below:
Month Normal
Jan. 10 Feb. 13 March. 20 April. 27 May. 42 June. 178 July. 331 August. 312 sept. 287 Oct. 80 Nov. 4 Dec. 1 TOTAL: 1305
Table No:2.1.2(a) Rainfall data i n m.m.
1977 - 121§. 1979 1980
11 27 11 36 28 76 36 62 22 46 40 27 12 66 62 77 28 SO 284 340 157 228 242 146 287 420 459 467 223 197 156 773 120 209
l2§1..
28 106 25 44 151 158 299 173 132
30 167 3 186 -34 14 28 26 16 19 14 1 4
1506 2120 997 1434 1056
1982
3 15 72 19 17 176 181 263
59 27 3
835
: 5:
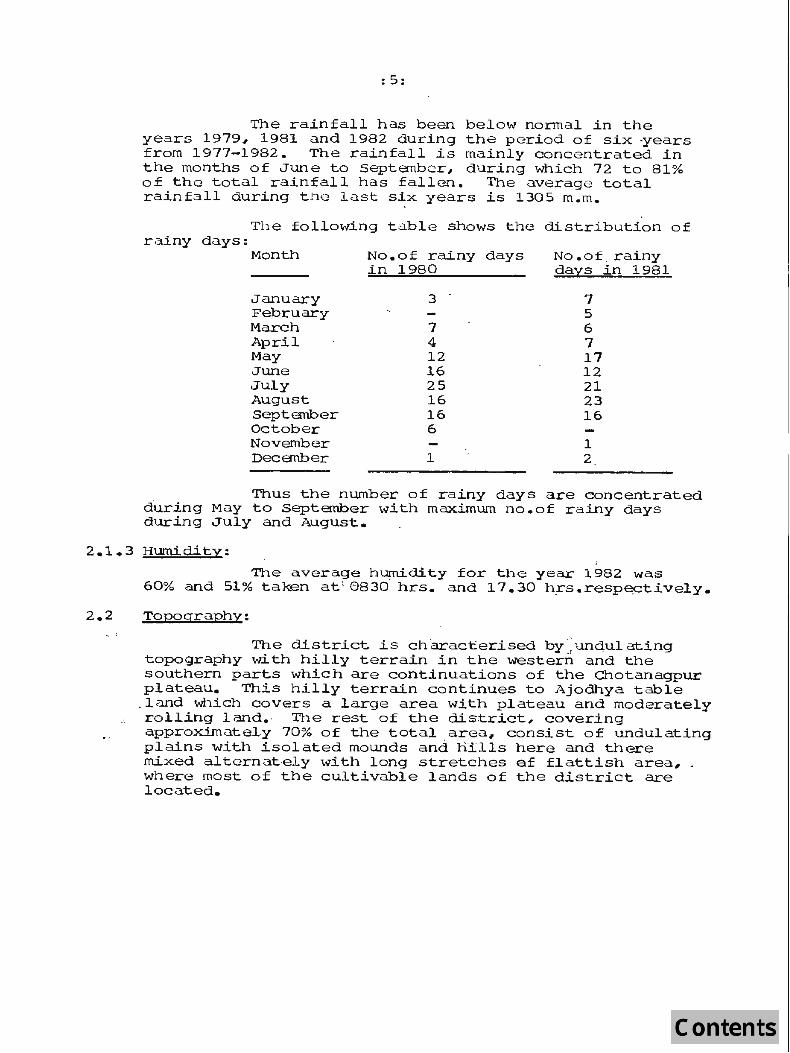
The rainfall has been below normal in the years 1979# 1981 and 1982 during the period of six years from 1977-1982. The rainfall is mainly concentrated in the months of June to september, during which 72 to 81% of the total rainfall has fallen. The average total rainfall during the last six years is 1305 m.m.
The following table sho ws the distribution of rainy days:
Month No.of rainy days No.of,rainy in 1980 days in 1981
January 3 7 February 5 March 7 6 April 4 7 May 12 17 June 16 12 July 25 21 August 16 23 september 16 16 October 6 November 1 DecEmber 1 2
Thus the number of rainy days are concentrated during May to September with ,m~um no.of rainy days during July and August.
2.1.3 Humidity:
The average humidity for the year 1982 was 60% and 51% taken at ' 0830 hra. and 17.30 h _rs.respe_ctively.
2.2 Topography:
The district is charact.erised by":und,ulating topography with hilly terrain in the western and the southern parts which are continuations of the Chotanagpur plateau. This hilly terrain continues to Ajodhya table .land which covers a large area with plateau and moderately rolling land., The rest of the di$.trict, covering approximately 70% of the total "a,rea, consist of undulating plains with isolated mounds and h~lls here and there mixed alternat,ely with long stretches af flattish area, where most of the cultivable lands of the district are located.

2 .. 2.1 Altituge
The'general elevation of the district ranges from 150m. to 300m. The' greater part 0 f the district is plain. The hiily areas in the west attain an altitude of 67Om. n~~r Ajodhya. -'The hilly areas .in the south att,ain an altitude 0 £ 356 m. in a portion of D~lma range •. _The Panchet hill in the North east attains an ,alt£tude of 487 m. , The altitu de in the ceJ:)tral portion of the district Vc;Lr ies between 150m.
"'to 200m.
2.2.2 Mountain ranges:
2.2.3
A series of isolated groups' o£ hills and peaks lie in the Pargana of Jhalda. 'Furth.er south this gives way to a regular range called BaghmUndi 'or Ajodhya range Which ends abruptly in Matha. Numerous iso lated peaks and groups of 19w hills connect 'it with the spurs fran the Ranchi plateau, on the west. Gqrga Bura 670m. 'is the highest pe;lk' 1.:1"' Baghmundi ;r-apge.' A number of dome like" h"ill s wi,~h a gener<3.1 East-west trend .1i~s to the north and .west' of Jhalda along .the ~ na:rth 'Western border q£ the district. The prominent
'hills p~ar' Jha;t'da is Barsa pahar(483m. ) Raika paha r ,,( 434 'm.), Churui pahar( 361m .. ), Dangi (325m.) and Gurma pahar( 337m. ) •
," At the northern end of Jhalda range but d e t a c h ed
from it and rislng abruptly from the genera l level of the plain .is Bar.s<a pahar. In the north-east. p~nchkot, or Panchet hi~1(487m.) is the most ,.consp,icuous hil,l • .In the south of Panchet lies a. grqup Of,';liocky hills with great mass of gre y -b~a.ck boulders jutting out above tt"le $canty scJ:;'ub jungle. other important hills are T.ilabari(407m.), -RanchandPur(3~m .. ~) ,Barbaria( 331m. ) and Ja.icJia.t'!dpur(319m.) .
Aspect:
1: " The gre.ater part -'oi I the dis.trict' has easterly and South easterly aspect. , 1'he survey also indicates that 'appreci able part o f the £orest area has north and north·eastern aspect. Area with west and south western' aspect is less.

: ,., ,
2.2.4 Slope:
Following has been the distribution of sample plots acconding to slope percentaQe class:
Slope percentage 0-10 10-20 20-30 30-40)40 TOTAL
No. of plots_ 52 34 3 9 15 113
Thus 76% of the area has slope of less than 20% out of whi,ch 60% has slop e less than 10%. 13% of the area has slope' mO:re' than 40%. ' Th.:Ls area lies hear the boundary of Kalma and Simmi Beat o.f Joypur range" near Jhalda, in Matha range 'and in Latapara and Naina beat of Bandwan r§nge.
2.2.5 Drainage:
The ~atural rilope of the district is, easterly and south easterly and allJ ,the rivers passing through or originating within the district have their courses along these two. direct.ions~ _r , ,- - I. . j ,
.i. ~ ~' ._ r
.. River. Kasai. drains practica11y, the whole of the ._' central and the ,south; eastern portions of the district
east- of ,Baghrmmdi. and north of Dalma ,ra~ge. It rises on the extrEme west in the hills n o rth ,of ~alda.
" namodar river passes through the district due
east and receives t.he water of Jamuna from the north and Gowai from the south. The later along with its tributaries Ijri and Harai drai.ns practically the
'who'le country east of .TI1alda hills, 'north of the Ranchi road and nor:th west 0 f the Purulia Asansol Ra11way 11ne as fur cup a~ .the Panchet h11l.
1: J'
DarClkeswar ri ver drains a small 'area in th e horth eastern part b f the district. Its important tributaries Beko nadi, DuBhbaria nacll, Dangra nadi are seasonal and usually dry up during summer. Silabati river originates from the high land east of Baragram in the eastern boundary of the district and drains a very small area in the'eastern part.
2.3 'Geology, rock and soil:

8
2.3.1 General description:
Three successive geologictll 'belts can be differeri;ti.~:!=-_~. In the Northern belt lies the coal baSins of ,the Gondwana which include s Jharia and Rani-gunj" t 'hat. are separated by an intervening area of crystalline rocks. Th.is middle belt occupied exclusively by crystaline rocks is the broadest formation. A. series cf 'ancient slates with associa,.ted volcQIl.i~ -rocks belonging to th~, popula'r . Oharwar ~ . system forms the southern belt'~" .
The Dharwar consists of quartzites, quartzitic sandstone, slates of various kinds k shales, hornblendic mica, talcosa and chloritic schists.
The majority of the crystalline rocks in the middle belt is the intrusive porphyritic granite gneiss known as dome-gneiss. This dome-gneiss is a coarse granitie rock composed of quartz, muscovite mica and orthroclase felspar which occur both in the general matrix and as large porphyritic crystals that give a conglomeratic appearance. The colour of the felspar is usually pink or grey and sometime brick red.
Numerous igneous instrusions, varying in composition from highly siliceous, to comparatively poor in Silica but rich in lime, iron and magnesia also occur in the district.
A peculiar saliceous and sometimes feruginous rocks also has a wide distribution. These rocks accom~any the lines of faulting. A remarkable vein of blue Kyanite (Silicate of alumina) and muscovite mica(Silicate of alumina and potash) with an average width of 2 feet has been found to occur in the areas east and west of salbari.
Laterite also occurs in thinner layers fairly well distributed over the area. A few varieties can be di s tinguished:
1. Pisolitic, generally in the form of loose gravel but sometime compact.
2.a)Conglomeratic, containing both rounded and angular fragments of quartz.
b)Conglomerate passing into coarse grit.
3. Concretionary. 4. Compact, occurring in stratified beds:-

2.3 .. 2
: 9:
Thick deposits of clay have been found at many places and in some places the deposits attain a thickness of '60 .feet. Limestone has also been found to occur in small quantity at the junction of the Damodar and Panchet bel ts. .
,The soil is an infertile laterite of no great depth. The fl at spaces between ridges require constant protection with bundhs for retention of the soil that has been washed down from the higher slopes.
Mineral resources:
The district ~is endowed with deposits of wide range of minerals which characteristically belong to the non-metallic stratum. They include coal, limestone phosphat"e, barytes, ~~lspar, quartz, quartzite, China clay, Kyani te, decorative stone, b1.ack stone, pyrophyllite etc. Reserves of coal. in Purulia has been estimated to be 455 million tonnes. Two big collieries Ranipur and Perbelia are already being worked. Limestone has been found to be beneath the soil of Jha1.da, .:Jabangrum, Hanspathar, Mara,mum,Belemin and Simmi and its reserve is estimated to be approximate1.y 8.60 millioQ ~on~es. Large deposits of commercia1.1y important. Kyanitic rock have been located in the district "·of Purulia in the vicinity, of Balarampur, Bagmundi; Dibhe and Ichadih. PGgmatite containing felspar hap also been:' found. Rock .phosphate has been found to 'occur in plenty. Significant deposits of China clay has be\=T1- found at Dhatare, Mahatamare, Balamin and Katajhar". . ."
Land use -pattern and assessment of the condi tion of land, erosion status etc.

. ... ..-i 0 .. I 5 ...-I ... ~ 0 .. .....t ~ rtl .. e • ... .. rtl IU 0 OlCi +) OhM 0 ... +) <I> 0 s:: til S::"N 0 ... 0 ~ O·.-j 0 ~ OJ .. \!) ..-i ... 8 IU IU'U+) 1Il" .. ... ..-1 ~ .. O,rel .. ..-I ..-i ... .. 4) o <lJ .. • • "'<1> H ~ "0 ro ... ... z () ttl .. 0 ~ ... .. M .. ... 4-) til .. ... S:: ~ "N "'" .. <I> .. M ..-i .. ~ ..-I .. ... .. S-t ..-I .. 0'1 M .. =' ttJ "..-I .. U 4-1 ... • .. .. ... .. "N M .. ~ I CI) "M 0'\ ... ... (I) ..-I '0 ... e .. ..c: ~ s:: ... co N .. 8 10 ~ C'O "..-I
CI) .. 4-1 0...-1 ... ~ .. .. 0 .. I . ... .. • .-f .. ::S (l) Q) ... M N .-f .-f ... +J .....t +J .. ("I') M .. 10 0 ........ ~ til .. e • 0-4-1 ... ::S 10 "0'1 "'" ... s:: ... u ~ ~ .. co ..-i • ()) (I) rll ttJ .. t .. • .. .-f (l) .. .. +J til .. I a ::S.-f ... II} ...... ... ttJ Q) 0.0 (JJ .. o \0 ... {£ ... ..-1 IU S-t s:: rtl +J .. r- r-- · +J .. ·ri ;:- H!:> ~
(I) .. • • ... () .. ctl -r-! rtl rtl .. 0'1 "'" ... 'r-! .. >+J co ~"'"' ~"N ... II} H .. r.:J ~ ... · U +J .. ::s e .. .. ....
0 til .. +J U +J l (JJ .. ..j.J .-4 ;a .. 0 ~ I .....t § :...-1 ... (I) .. s:: I-l o.s:: ;:j N .... .. o • o U "0 "'" ... ..j.J
a> ... rtl 4-IS:: '0 s:: -..-I Q).. • • !'j .c ... (].) 0 g H H ... lfl 0 ... ..j.J
+J :~ £l~ Oo\::l ... \.O ...-I e U) ...:I+JC'O..j.J .. ...
4-1 .. ~ L_ i .. .~ .'_ · '0
0 .. ... '.:-~- ' S:: "+3 I' .... ,-. : .. ; -~ ; i~'7 e· rtl
(I} .... S:: ... Ul No; ... W ~ ,'·a)' '-Q) rtl • .. e 00 ~ ' ''~ I-l S-t '0 ... ... U
.. ::l 0- S, .. • ·rl 'U ~ ~'-g rd ... -: . .,. , ts"! s:: 0'10 .: ... IU .. OJ IO .S:: s:: H .\~ § ..-I "0. 0.,r.:J .... 0\ .-... ... .... ) 0 +J '" (I} ~ .. r.J s:: ... (I} ~ .... ... <l.I .. I-l • .. ,.
'0 • u: .. .. ..j.J 00 .. ... Q) C CJ ... • 00' OJ .. ...-I ~' • 'ri 0 1.4 .. 0 0.:>- .. 0 ;N '" ..-I
. ..-1 0.. .. 00 8 10 ''''". • • 0-+J ':~ H . ~I. ... "'" .~.~ ('Q , ... .@' rtl <V 0 0\ "rl " .. CJ ES .. .~ ...
-..-I ... +l .. · 4-1 .' 44 .. 00 .' "..-i l[) ... 0 • ..-1 ... Q) c;j "-\0 0 • 00 .. s.... Q) , .. • • .. ,~ 00 .. 0 S-t .. r-- "'" • .(0 ... rx. rtl ... "00 ,. ..-I ... ',Q) .-'-I ... .. .....t , • ' 1.4 CJ ... ....
~ .. \-.:::1 .. C .... , ". • r:!l •
,(]) ; ..... , r l 0 J. ... J::. 10 0 , •• til ... ,_. '..-1 -r-! .. ...:-t ...c:: +l • ,(1) ::l ... .tIl .:J. .. . ' • .. 0
... '0 '00 rtl. . l .. r:1' O 4-1 m • H i'
'E .... ..... § C'O'O ! ' ... e 0 0 (]) .. ::l -: ~ ;'3 m: ... 0 S-t • . ~ 0
ttl ... !<C. - ' '~ '" .. (J) . ~
~.
r,

: 11 :
It is thus Been that forest occupies about 14% of the geogruphical area. Approximately 20% of the land is waste land. Next to agriculture forestry is the major land use of the district.
3.2 Soil:
The soil oJ., :th~ district., has been . formed by the weathering ;0; the ,~rCh~2:thi:9ro.nif.e·' gneisses and schists.and is of residual' ·type. ~ The so£l ' in ·the uplands is 1 aterit.iC -and th~' sOi.l in "the v al1eys-'is clay l o.3ffi of white to r e ddish cl,i;¢Y;" .~ 'The soil in g e neral is acidic containtP(~i b'.,?'1"Yo' hitr<!'geh, 0.00'50/0' ~2b5'. ar:d; '0".0'1'% <\<2V. ~ - \ The max.I:mum· n~trog(m ~s 0.087% and m~nl..mum 0.036 % with Ph.- varying froin" 5~'5- to' 7.'2. ~ ':'"_":', ' .. " .. -,
.~ . : '. ~A . ~ , " ! ','_;' •
The soil is thus. 6:t'poo~: '~uci1. i,ty w.ith· very low fertili'ty. "water taBle remains 'tow during Illon~monsoc:m . period making irrigation faciIity ',' difficult. 'These.,. -;:';factors have greatly affected the agr.fcul tural prod~c..;;·:':':::tion of the clistrict. This has also r e sulted in mak inej" the sit'e quality poor for' tree growth. Regenerati o n ' ," - , and nurture of trees # there fore, requi re <31 aborate -moisture conscrvat:ion measureS • .. ' . '. ... . "\ .. " .
... ': . \. " '. 'The 'soIL in the ,various s ample plots were examined
for its texture, consistendY-~ depth, presence of coarse fragments and 'humus:J:content.:,,:~-:,- The,_£o,llowing table_,i n diqate the occurrence and distribution of var.io,u.s soil types in the project area:- . _
- -._",. "
TabrG :No; 3.1.1 ' . ' " - ... ~ '. . . '\. ~ \. '. . - .. .. ' , ' .. '. . .
·~ i.-. "
ClaY§'l ~ Sandy Sand\!: ,To.tal l;__, . · 10 am , l -, 1. oam '" , '. ', . ,_ , . " . '. ~ ' .
Soil texture Clayey
. , . ,- • I • i .. , • , • ~ ,. ' . , . " ._ .~, ,. ; ., • , • ,. • I • ~ • # • , • ., • , • ~ • ". • , • , • , • , • , • ,
No.o£ plots' ~ "",;"," 1. 16 . .32 53 1 '1 ; , i 113
f : ! . .
. Pres e nce of Loose fragments. J . stones.
Table NO'~f3+1.2 Bouldery Grave 1iy. Noeof
c oarse frag-
Tot.al: . '1....:
i ments .. -,;. ' :' , ~ . , ~ ' " , . ';' f :
, • , • I ' · , • I • , • , • , • , • -I '. , • , • , • , • -I • i • I. I • 1-.',. . , • ". I • I ' . , • , .'#
No .. of "plots 8 15 40 50 113

Table No:3.1 .. 3
soil depth Less lScms.to than less than l"Scms.30 ems.
30cms. to less than 90cms.
90cm .. ~ mor~.
TOTAL
No.of plots ~ • , • , • , • I • I • I • , • , • • • , • # • I • , • ~ • , • I • I • , • , • , • , • , • ~ • , •
1
Soil consistency,
11 4S S6 113
Table NOj3.1,4
Frbable §lighbly compact·
COmpact Cemented TOTAL
#" ., .. , • , • I ." -. , '. , • # • , • , • , • , -. , • , • , • , • , e . ~ .", • , • I • I • , • # • , •
N-O.of 63 46 '4 ' 11.3 pla-ts • • • , • , • I • , • , • , ... ' • ,. , • , • , • , • , • , • , • , • I • , • , • , • ; • ., .. .I • , • , •
Table No:3.1.S
Humus status li2 Depth • .~C" humus- l.ess
_- than Scm.
pepth . from .-
,Scm: . to lOem.
Depth more than lOcms.
TOTAL ,
No.of plots. I. " • , • # • # • , • I' • , • , • I • , • I • I • , • I' • , • , • I • , • , • # • , • I • , • , • I ••
42 ,_69 2 113 , •. , .•.. ;1 • .I • , • , • , • , • , • , • , ,. ., • .,.!_ • " ~ i.:' • , • , _. <# .••• , • , • , .. , ~ , • ,
.~ ,; -:-~ !~. ...
The' above tables 3.1.1 to 3.1.5 indicate that the majo"rity, ~p;£: t.he. .~pil of the forest ar:ea 'hasi',be~ , f0":U1~ __ t2 be l.q<¥.O to 9andy lpi=Ull,.in ,texture with cons:rs ... tehcy varying from friabl.e to slightl.y compact and depth varying from :30cm. to more than 90cm. The soil contains very little boulders and loose stones and majority of the soil. of the area contain poor humus with depth less than Scm. The soil is loose gruined with low organic content which indicate poor site quality,
The following has been the occurrence of plots in the project area according to theErosion status: 1·'·"" ",~",.,.~.",.,.,.,.",_",.,.""""",.", Erosion No erosion Moderate Heavy erosion TOTAL status or mild eroSion
erosion 1·,·,·""""",·,·,.,.,.,.",.,.",.,.,.,."",.,.,1 No.of 88 ' 23 2 113 plots.
: 13:
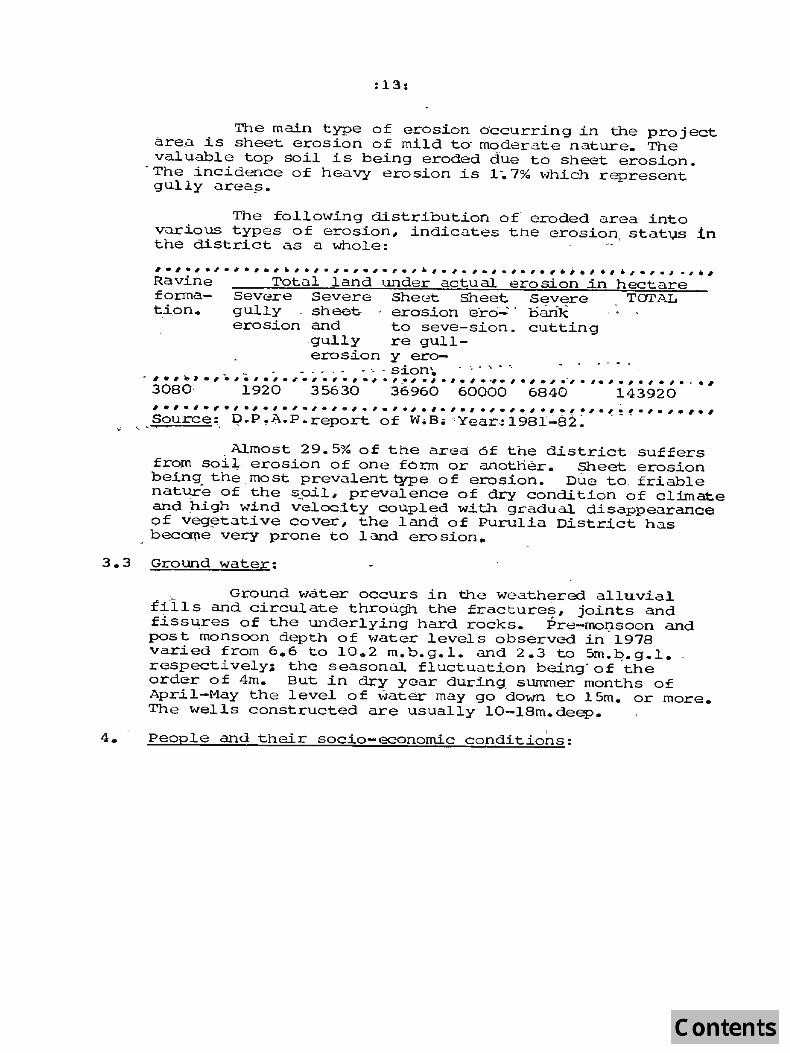
Th~ main type of eros~on C)ccurr~ng in the project area ~s sheet eros~on of mild to' moderate nature. The valuable top soil is being eroded due to sheet eros~on.
- The incidence of heavy erosion is 1-.7% which represent gully area;:;.
The following distribution of' eroded area into various types of eros~on, indicates the erosion, stat~s in the district as a whole:
'.'.#.'.#.'.I~'.'.'.'.I.#.'.I.I.'.'.I.'.I.~.'·'.I.'.' .,., Ravine Total land under actual erosion in hectare forma- Severe Severe She~t Sheet Severe TOT,~ ti,on. gully sheet erosion e'rc::i~" bank
erosion and to seve-sian. cutting gul.ly re gull-erosion y ero-
. . _ '",' . ' .. - .. -_ . 's:ion.. 4 -•• ~ • - .
-,.~~».,~,~~.,.,.,.,.,.,~,.,.,.,.,.~.,.,., •. ,.,.,.,.,. , • . • , 3080' 1920 35630 . 36960 60000 6840 143920 '.'.'.,.,.,.,.,.,.,.,.,.,.,.,.,.,.,.,.,.,.,.,~,~,.,.,. ,.,
source~. Q.P~.i:\.P.report of W.B. :Year-!1981";'S2:' . - .
Almost 29.5% of 'the area 6f the district suffers from soil, erosion of one tom or another.. Sheet erosion being the , most prevulent type 0 f erosion. Due to. friable nature of the spil, prevulence of dry condition of climate and high wind velocity coupled with gradual disappearance of veg~tative cover, the land of PUrulia District has bec~e very prone to land erosion.
3.3 Ground water:
Ground "'later occurs in the weClthered alluvia~ fills and circulate through the fracture9' joints and fiss~res of the underlying hard rocks. Pre-moQsoon and post monsoon depth of water levels observed in 1978 varied from 6.6 to 10.2 m.b.g.l. and 2.3 to 5m.l:?g.1.respectively; the seasonal. flUctuation b 'eing- of the order of 4m. But in dry year during_ S1..lIMler months of April-May the level of water may go down to 15m. or more. The wells constructed are usually lO-l8m.deep.
, 4. people and their socio-economic conditions:

4.1 General:!>
The population of PUrulia district is 1855429 (Census 1981), out of which approximately 81% live in the rural areas. The percentages of scheduled caste and scheduled tribes population are 14.99 and 19.58 respectively. Thus 34.57%·of the population belong to the traditionally backward classes. The literacy percentage in the district is 21.50; the same in the state being 40.88.
4.2 Li~elihood classes:
The following table indicates dist~ibution of the population according to li velihood classes:
1."·.·,., .. ,.,·,.".,.·,.,·,.,·,.·,.,.,.,.,.#.,.,·, ,·,·,·# Cultivators Agricul
tural labourer.
Workers in household industries •
Other workers.
•• '·'·'·I·#·I·'.'.~·'·'·'.'. ,.,.,.,., ••• ,., .,.,.,.,., percentage 41.09 34.34 5.01 19.56 of popula-tion. , • , • , • , • I • , • , • , • # • , • " .', . . , • I • , • , • , • , .,'_, • " • , • , • J . " , • , ". , • ,
Thus 75.43 percent of the population earn their livelihood from agriculture. The economy of the district. shows its sustenance from agricultural activities. , The erratic and scanty rainfall during the south west monsoon and the general drought condition lead to frequent failure of crops. Lack of
_ adequaee'iFrigational facilities and disadvdntageous ·soil.. condit,ions have be,e.n .t!1e major '·lin1.iting· fa~tors of agricultural development. - ·Stnal·l- and fragmented land holdings discourage the majoritY,of the farmers to use ·inputs like fertilisers and imp'roved' seeds. Poor literacy, orthodox traditions and customs also stand in the· way of adopting modern methods of ?griculture rn many. areas.
'I ... .... ~ • ."... : .,; ~. '" . .. .
", ~ , .. I. • . .... (.,_
4 ~ Cultivation details: ,. \... 'I, .::.;.=.=..;::;;::.:"";'O=i'=:,:.:::::;.:.:,.....-'=:=. .• "".-"":", =.:=. =>:,=. , . . \ . . , . \, . ... . paddy is the main crop in the dis'trict and
.only single crop is raised in the majoritY·"o£·-the area. The cropping patte:rn and yield .are highlighted
-by tl:te following table: . .

:15: .
".1.'.,.,.,."., .. ,.,. , .,., .. ,.,.,.,.,.,.,.,.,.,.,.,.,.,., Crop Cropping pattern in Purulia Total production
percentage of total area in '000 tonnes. under crop.
,.,.,.,.,.,.,.,.,.,.,.,.,.,.,.,.,.,.,.,.,.,.,.,.,.,.,., Paddy Wheat Vegetable Sugarcane. 4
Maize
83.78 3.02 2.89 0.68 2.51
93.18
1.61 Not available. Not available. 2.093
, • ,. ,. , • I" .. , • I • I • , .; • , .. I • , • , • , .. , .. " • , .. , • , eo., • , • , • , .. , • , • , • ,
The yield of paddy is 1.43 tonn~s per hectare per year which is poor. Sugarcane which is an important cash crop occupies only O. 68% d:l f the total area under agricultural crops.
4.4 Industrial dependance:
There is no heavy or large industries in the district. Industrial activities continue to be artisan oriented and c~nducted on small, tiny and cottage scales .
'.'.'.1.,.,.,.,.,.,.,.,,.,.,.,.,.,.,.,.,.,.,.,.,.,.,.,., No.of regd. factories.
Year No.o£ No.of small workers industrial employed. units.
No.of workers employed.
,., .,.,.,.;.,.,.,.,.,.,.,.,.,.,.,., -;"'·'·'·'·'.1.'.'.' 1978-79 55 4453 400 2532 1979-80 51 4412 519 3778 , • , • , .. , • , .. , .. , ., .. , • ~ • , • , • , • , .. , .. ~" .. , , • ~ • , • , • ~ • ,. I • , • I .• , - " •
The above table shows that the employment in the organised industrial sector is 1imdted.
~.5 Economic standing:
The people in general are poor. Their per capita annual income has been estimated to be around ~.402.10. The per capita income in the agricultural sector was estimated to be only Rs. 267.20 in 1970-71 as against Rs.799.50 in Burdwan and Rs.384.40 in Bankura. This indicates that most of the people living on agricultural income lives below the poverty line.

: ~'6:
4.6 Dependance on· Forests:
Forest is the most important natural resource of the district. The rural population rely heavily on the forests for meeting their day to day needs of fuellNOod, fodder for their cattle and also partly for earning their liveli~90d. The rural population, specially the tribals, during the ~eriod of private ownership of forests enjoyed rights and priv~leges over the forest produce in the nei'ghbOuring forests through which they used to meet their needs. The life of the tribal population, their culture, and religion revolved greatly round the forests. Their almost self sufficient ecOnomy was also based on the produce derived from these -foreaS. Collection and s\l1;?sequent' sale of " produce like Sal seed, . Kend '·1.eaves; M~dhuca fruits and Tassar etc. "served' as sources of au,x.illiary income. -:r:hus the forest provi.ded a sUP1:iOrt to the rural economy o;f. the ,region.
. The' sudden stoppage of a1.l rights and privileges 'frC)lll the forest created resentment and .:i.11 felling among the local popUlation speci.ally the 'tribal people. They c~!l,si.dered the ik!t of control as an infringement on their rights and continued to avail the earlier benefits and p~ivileges surreptitiously, which in course of time, turned t'o'· be a regular livelihood for than. Th.i~ resulted into large scale devastation' aha degradation of forest. -
The protecti.on of forests, gradually, posed a serious challenge to the· forest department.. To cope wifih this socia-economic problem, forestry activities were intensifl.ed in . order to provide anp loyment to the rural pol?ulatiol1 and also to : improve. and augment the forest resources of the -district with a view to meet primari"ly the needs of forest produce of the rura~ people.
4.7 Special programmes of development in forestry:
All round developmental:. p'rctJrdffimes under different sch~es-like D .. P.A.P. r,,'r·.D.l?.;' ,scheduled ·· caste compon~t J).I\NIDA etc .. are being carried but i:h . the di:;;trict with partiCipation 'of different departments'. Under these schanes. plantations 'ar.~. raised prim~i.1.y . of spec;ies which are of local -importance and have! some bearing on the life of the tribals.

: 17:
DGv~lopment of fodder resources, creation of minor forest produce, raising of laG and tassar hosts on Government land as well as in land of private people are some programmes taken up under these schemes to improve the economic standard of local people and to build up rural small scala industries for self sustenance.
'The outlays under development schemes in the forestry sector including soii conservation progr~es are as follows:
'.,.;el.' Year I979-80 1980-81 -1981-82
·'·'·'·'·''''·'·~·'·'·'·'·'·'·'I.' Outlay in lakh rupees.
. 99.76 123.78 163.59
Forestry schemes being primarily labour intensive, aSSuming that 80% of the outlay goes in -p .aying wage to labours, the annual mandays 9.:nerated at a daily <,wage rate at Rs. 8.58 is as fol~ows: ,~
1.,., . .,.,.,.,.,;.,.,.,.,.,.,1.,.,.,.,.,.,.,., ~ 1979-80 1980-81 1981-82
Mandays 930163
1154125 1525125
, •. ' • I • , • , • I • , • , • , • , • , ~ , • , "', .. , • , • I • , ., • I • I • ,
The outlays in the forestry sector during these three years indicate a progressive increase and they also show the ilnpact -of forestry activities on the local population.
5. Forests:
The forest of Purulia consist of Sal and other miscellaneous species. In some areas the crop is predominantly Sal which occur~ with its miscellaneous associates and in other areas ~he miscellaneous species occur by thenselves without Sal.

.5.1
. ~.2
C~assification by types and compositiQD:
The Sa~ forests of Puru~ia conform to Champion & Seth· S Dry Peninsu~ar Sal-type 5B/C2 where Sa~ occurs both as pure crop as wel~ as in mixture with other miscel~aneous species. The common misce~laneous aesoaiate.s of Sa~ are Tenninal.ia tomentosa(Asan), semecarpus anacardium(Bhe~a), Lagerstroemia parviflora (Sidha), Anogeissus latifolia(Dhaw), Terminalia be~erica(Bahera),Diospyros mclanoxylon{Kend),Lannea coromendelica(Maina), Buchanania latifolia(Pialj, Scneleichera trijuga(Kusum), Madhuca latifolia(Nahua), Bauhinia purpurea(Kanchan) ,Pterocarpus marsupiun ... Other associates af Sal which have been found to occur in 'l*esser number are Terminalia ci trinaU-Iar.taki) OJ
Syzygium cuminii (Jamun), Croton oblongifoli.us, CClssia tomentosa(Gilchi), Cassia fistula(Sonalu), Emblica officin?ri~(Aml.a), Adina cordi£o~ia(Haldu)etc •
. The bther miscellaneous species which occur common~y have been found to be Mallotus phillipensis" Hollarhena .antidysenterica, __ Gnelina arborea(Gamar). saccopeta~um tomentosa, Bombax ceiba, ~~wellia s~~rata, Bridella retusa But~ ~rondQ§S, Butea monosperma, Zizyphus and Ficu§ species.
The conspicuous' creepers fauna ~re·Eutea .~uDerba and Baubinia vahli. The common herbs and shrubs noticed in the project area are Pogostemon pleqtranthoides (Bantulsi), Andrographis Qaniculatg_(Kalmegh) ,Carisa opaca(Karamcha .} ,Lantana camera(Bhut-bhoreli), Ichnocarpus frutesc<ma(Dudhilatc:.l _;rnQi.gO~a. species, ~lax m~crophyllu, Nyc~anthes arbortistes, Woodforcia floribudda" Clerodendron infortunatum, Helicteres isora, CochlosQen:num gossypium and Capparie. sativa, CQmhretum decandrum etc.
Among bamboos pendrocalamus strictu~ has been noticed in the project area in scattered wayo
Stratification:
The natural forests of the project arqa have been divided into tl&9 strata accord.ing to the--distinct characteristics noticed in the crop composition - one in which the crop composition is predominant~y sal and the other wnere the occurrence of sal is less and the miscel.l.aneous species are predominant. Plantation areas have beGn dealt with separately.

:19~
5.3 Legal status:
The forest of this district has been acquired through various sources ft The forests originally belonged to private owners like Zamindars and their tenure holders called "Ghat\'\1als" and Company Estate. These private forest's c'ame under the man<lgement of the Government under Bihar Private Forests Act, enacted in 1946 which subsequently became unclassed State ~orest -under the Estate Acquisition Act of Bihar. Finally the West Bengal Estates Acquisiomon Act was extended to Purul~a during 1964 when all forest areas retClined.,by the intennecliaries were also vested 'wi-th the Forest Department. The following are the status of the forests now pccurring in the district as per recorfis intimated by the Divisional Forest, Officer, Purulia:
i)
i.f) iii)
a) Reserved forests b) No'tJ;fl'cation of Indian
Fores,;t ~t 192 T_and in the process of reservation.
'Protected Forests Unclassed Forests
l03.27 sq.kffi. 1'1.95 ..
728.78 " 78.84 ..
Legal status 0 f some areas is still under confusion as these areas have been reCently vested to the state and notifications under I.F.A~ are yet to be issued. SOme areas are under High Court injunction and there ex;ist some areas, where the' injunctions have been recently vacated but where the legal position is not yet clea,r'._- ;_ ____ .' ,~ _ .
5.4 Demarcation and Forest settlement:
The forests have bee n demarcated by boUndary marks on cleare d lines~ These boundary marks" are " " made of stones and also of turfed earthen pillaJ;s. ' The houndax;:y lines have been rel aid after the· . revisional settlement survey~ which started from 1956, as a result of which some encroached land has been included inside the forest boundary. In many places the forest boundaries are demarcated with the help of C'.P. trench or other boundary trenches.

5.5 BJqhts and Privileges:
No rights of the villagers exist in the area. The previous custom of allotting right holders coupes have been terminated after the enforcement of West Bengal Estate Acquisition Act. As per new directives of forest management in tribal areas the local tribals have been allowed to collect free of charge:
i) Brush wooq/Jhanti , for domestic use~ at the rate of one head load per individua~ and one cart load per group.
ii) Leaves, flowers, fruits and seeds of trees like'Mahua, Peasal , Kendu, S~l etc.
iii) One pole per tribal house-hold per annum to be used as' a plough and tnree poles per tribal household for house construction every five years •
.i v) To as sign any tree in the forest as I J aherthan I for the purpose of offering prayer and worship l:?~ tribals.
Free-permits arc to be issued to two persons per tribal household situated in or around the forest area.
The Scheduled Tribe and Scheduled Caste families who have been occupying the reserved or protected £orcst land for a long time before August 1977 would be assigned pattas up to an area not exceeding one acre per household after screening by a duly appointed committee. When such prsons have settled deep inside the forest, attempt would be made to persuade them to move to the periphery where they would be assigned land up to the aforebnid limit.
5.6 Present management practices:
The forests of Purulia Division, which was created during 1956 by secession from Manbhum Forest Division; 'wer;eOtlrider private ownership and under <Shatwals;' who held forests under permanent Yagirs •
. These were managed according to the whims of the managers.

: 21:
First step towards scientific manage~ertt started after a working scheme was prepared in 1998 fqr Matha and Quilipal Forest blocks which were declaredprotected forest in 1894. This scheme was revised in 1919-20 and then replaced by a Working Plan in 1930. Under the . revised Working plan of 1940-41# .the forests were worked under the silvicultural system of coppice with standards with a rotation of 40 years wnere 5 to 8 standards per acre were retained. Thereafter in 1942 the forests of Baghmundi estate came under Government management under a 20 years lease. In 1946, Bihar Private Forests Act was enacted. Prov.tsional Ti-vorking Schemes were prepared for the Reserved Forests held under lease and also for the private Protected Forests. In the foune~, rotations of 80 years and 30 years were fixed depending on the demand in the area. The rotation of 10 years fixed for other areas, was subsequently raised to 30 years. Thereafter the Working Plan, prepared for Manbhum Forest Division for the period 1955-56 to 1964-65 was partially followed till 1964-65. This Working plan prescribed management under coppice with standards system with a rotation of 20 and 40 years. During 1964 the PriVate Protected Forests and Unclassed Private Forests were vested with the state of West Bengal free from all encumbrances. The forests are now being "WOrked on annual working scheme since 1965-66.
5.6.1 Area coverod under Working Plan:
The Working Plan for Purulia Division is under preparation and the field work is still in progress. A preliminary viorking Plan Report of purulia Forest Division has, ho\vever, been prepared in. 1977 to draw the guidelines for prepar,ltion of a WorkiQ.g Plan.
5.6.2 Short detdi1s of forest management:
The forests of Purulia are managed according to the annual scheme prepared by the Divisional Forest Officer in consultation with DiviSional Forest OfficGr, Wor~ng Plan at Bankura. The silvicultural system follwwed is coppice with or without standards. In <bsence of a Working Plan, the area felled every year, has been maintained at the level prescribed by the old Manbhum Working Plan. The rotation followed is 10 to 15 years.
A preliminary Working Plan report for the division prepared during 1977 has prescribed the following general objects of management:
'i) To meet the bonafide requi rements of the local population for timber, fuel, bamboo and other forest produce in consistence with t he conservation of forests.
ii) To foster the idea of ·community forests and to protect and manage the forests scj_entifically with' the cooperation of the local people ..
iii) To produce raw' materials required for p aper and pulp indu~tries.
iv) Consistent ~ith the above~ obtain maxiMum sustained yield of timber, fuel and other forest produce and realise maximum and progressively increasing annual revenue"
nie following working circles have been sugg e·st-ed:-
Sal Coppice Working Circle:
This circle will be managed with the obJects of
i) meeting the agricultur~l, domestic and i ndustrial requirements without adve rsely effectin g the forests,
ii} to rehabilitate the degr<'lded Sal. copp ice forests and achieve improvement of' stand and stocking thro~gh sound sil. vicul tural practices which wo uld also provide adequate emploYment to the local people.
Simple coppice system should be fol~owed with a rotation of fifteen years.
2. Pulpwood Working Circl.e:
This circle will provide the raw materi a ls for pulpwood. The area will inc1 ude blank areas, waste land, open derel.ict forest and a11 the existing plantations except those of teak. The silvicultural system will be clea rfelling fo~wed by coppice regeneration, natural regeneration and planting. The conversion period and the felling cycle will be 10 years.

3.
4.
TeQk conversion Working Circle:
An area of 12,000 ha. is sUggested for this circle with an annual planting target of 200ha. and a conversion period of 60 years. Expected rotation is 60 years corresponding to 50 em. d.b.h. of Teak trees.
High Forest Con~ersion Working Circle:
This circle will constitute of areas adjacent to range and beat offices and also in the inaccessible areas of Ajodhya hills. 10% of the good Sal coppice forests of each felling series should also be included in this working circle. The conversion period is fixed at 20 years. No rotation bas been suggested now but since the aim is to create big sized trees under this working circle, the rotation here will not be less than 80 years.
Besides the above working cirCles, Senul is recommended for working under Selection system with 10yrs. felling cycle.
5.6.3 Exploitation:
The disposal of vdrious forest produce is done by afluction, tender, allotment and permit system. The timber and poles are gener3lly sold through auction. pulpwood is supplied mainly on allotment basis to Paper Mills on receipt of royalty. This system has been 'discontinued since 1980-81 due to, local demand. Bidi leaves,and other minor forest produce were sold through auction or permit system in the paste Now Lh~PS collect Sal seeds and Kendu leaves £rom Purulia Division on monopoly basis on payment of royalty. The following has been the outturn of forest produce during the last three years: ,.,.,.,.,.".;. I·'. Ie,. 6.'.,.,. I.,., .,.,.,., ., . .,.,.,., .',., .. Year Ti~ber Pole Firewood Pulpwood Bidi leaves Sal seeds
in m3 (Nos)i.n m3 in M.T. in M.Tonnes in M.T. ,.,.,.,.,.,.1.1.'.'.1 41.'.,.,.,.,.,.,.,.,.,.,.,.,.,.,. ,., 1979-80 271.77 186227 23910.51 19252.5 252.55 5 1980-81 134.82 149893 32243.35 222.94 275 1981-82 238.80 169293 36093.69 130.70 65
Averag~ 215.13 ~68471. 30749.18 19252.5 202.06 115 annual outturn ~ • I • , • ,. , • , • I • , • , • , ., ,.,.,.,. I. , • , .1 • , • , • , • I • ; • , • I • , • , ., • I

6.1
;'t4- t
It is thus seen that the bu1.k of the outt urn of forest produce are firewood and po1.es. Po1.es expLited are of d.b.h. Bem. to .15cm. a1.though majority of the poles sold are in the d~b~ho range of 8-12 em. Poles of Sal of d", b.h. 6em. are also sold. Pol.es of other miscellaneous species l.ike Dhaw, Asan, Pial, Kencl. etc .. have also got market value; the popular diameter being 8 to 10em. The common timber specie s sol.d are Simul of d.b.h. 60 cm., .,:Sirish, Haldu and teak 0:1: d.b.h. 50 to 60cm.. The follo\..ring have b.een the quantit<)s of p lpwood supplied and royalties earned from the di.v:i_sion:
'~8.C.'.'.'.'.'.,.,.,.,., .• ,.,.,.,.,.,.,.,.,.,.,., • • • ,. Year Area(in hao ) PUlpwood(In M.T. Royalty earne d
'.#.'.I.I.'.'.~.'.~.'.~.'.'u8.#.'.~.'.' ~ r.~o'.'.'.,.,e
1978-79 612 5277.46 ~.2,72 ,861.00 1979-80 2181 19252.50 ~c8,35,OOOoOO 1980-81 Nil e Ni 1 •
The average out-turn of pulpwood is approxim3.tely 8.78 M.T./ha. \<lhich is equivalent to approximately L·~ .. 47m3/ ha. The out-turn of timber and pole per hao as. calc .. \..;1..ated from the sale of annual coupe of 1981-82 has been found to :Qe approximatel.y 11. 58 m3 and the out-turn 0 f fire 'vood is 54.9 m3/hao
Forest r,esoU1;¢es itdio_rma-t:.ion.: i
The natural forests of purulia can be olassifj_ed into two types':' viz o i) l1iscellaneous forest - where i~here is no predominance of any particul~r species and the cLop cons.ists of various miscellaneous species, and ii) SaJ. forest- where ~al occurs as ·- a predominant species in
.ass9ciation with some misceTlaneous species" \, ... '. ~ , "
Misce.llaneous forest: -~ . : .. , .
, \
- The majbrlty' of the miscellaneou.s . .forest has been found to occur .in hiLl.y terrain with sLope varying from 14% to~ 21%.
The miscellaneous forests have been found to ocrur in the following size classes: , ., • # ., • , • , • , • , • , • , • , • , • , • , ., • ,. , • ,. , ., • I • , ~ .• , • , 0 , • , • I • ~ e .#
Predominant Below 10-20 20-20 30em. & -.t-lixed size d.b.h" _ .. -10cm. 'cms. ems." above.. '. class I·'·'·'·I.'.'.~.'.'.'.'.'·'.'.'.'.'.'·'.'.'.'.'.'.#.I. ,., No.of pl.ots 12 13 2 1 10 % of 31.6 34.2 Ss3 2.6 26.3 occurrence

:25:
Thus majority of the crop has diameter less than 20 cms. Approximately 5% of the area has been found to contain deg~aded and scrub vegetation.
6.2 .Sal Forest:
The stocking in the predominantly sal forest area has been found to be poor and the fol£wing distribution of plots indicate that 62.5% of the area contains crop with diameter less than lOans.
,·,·,·,·,.,.,..,.,.,.,.,.'.'.1.'.'.'.'.1.'.,.,.,.,.,.,. , Predominant 10cm.· 10-20 2Q -30 30cms. and Mixed sizes d.b.h. below cms. cms. above. '.'.I·'·'·'.'.I.I.'.'.'.I.'.'~'.,.,.,.,., ·'·'·'·'·'·'-1 No .of plots 25 10 4 1 % 0 f 62. 5 25 10 2 • 5 occurrence.
25% of the predominantly sal forest has been found to be de~raded and scrUbby.
6.3 Plantations:
During survey twenty nine plots fell within plantation areas. The following has been the distriibution of plantation according to'size.classes: '.'.'.'.'.'.'.1.'.,.,.,.,.,.,.,.,.,.,.,.,.,.,.,.,.,.,.# Predominant Below 10-20 20-20 3Qcm. and Mixed sizes d.b.h. lOem. cms. cms. above. ~., ·'·'·'·'.'.'.~.~.I.'.'.'.'.'.'.'.,.,.,.,.,.,.,.,.,., Nb.of plots 16 . l~ - 1 'Yo" of 55.~· 41.3 4 • .5 occurrence. ~ .,. # • i .,.,. 1'.,., ., .,. , 0 # ., .,.,.,"'t."., . , ., .'.,.,.,.,.,.,
Thus _rnajori ty of the crop -has diameter below 10cms." 20.7% of the area has been found to contain very young crop where the canopy formation has not yet taken pl~ce. '

"
6.4 General assessment:
stocking of plantation is in general ppor. Injuries due to illicit £ellings were noticed in all the areas cohtaining crop having diameters of 10-20cms. This would indicate that the dia.class 10-20cms. was . more prone to illicit feliings. No illicit felling was noticed in general in plantation crop with average diameter less than 7.5 ems.
Approximateiy 25% of ~he plantation area was found to contain seriously damaged stock;~ith open canopy. and blank areas resulting from illicit fe1.1ings .•.
' . ,.
6.4.1 Compositio!'.1L..A.ensi.ty and distribution 0 '£'. CrOP!
~ .. . . . '\ From the distribution. of qomposition and density
of cro~.the area was diviaed into following sectors whiCh showed distinct vari'ations:
- - - - - - - - - - - - - --- - - - - -~-
Se<::.'t:.0r '. _ .Name -of Range Total Total Sal stems Vo1.. ssems per per per ha. ha. ha.
-- - -- .... - - - - - - --A Joypur, 525.2 23.379 113.000 2.554
Jhaldah, Matha, Puruli a, & B.alrampur (part)
B Bandwan S22 .. 2i.~ ~6,843 237.708 8~741 # .~ ~ " •
C Kashipur'. 329.218 6.256 '~S_3e4 0.232 D -Mahbazar, . 197.363 10.644 99.471 2.054
Burra, Bal.rampur (part) . .
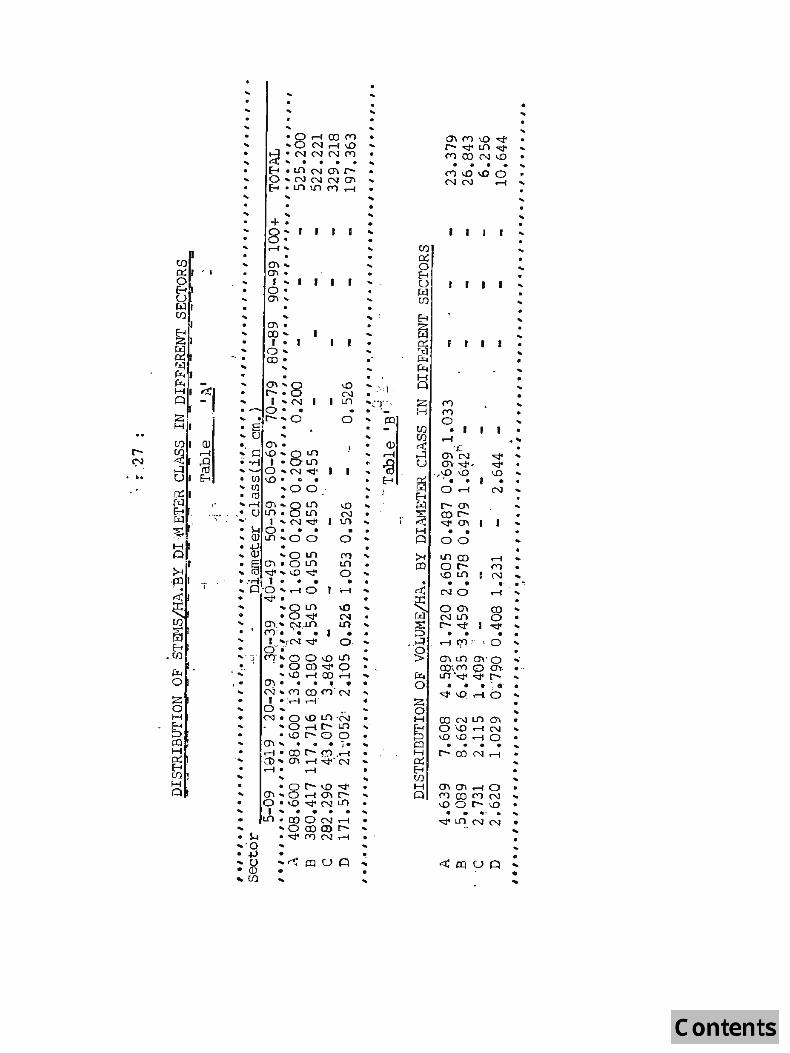
. __ -" "_' - -The following table will show the distribution
of stems and volume per hectare in different sectors as classified above;
"I
. .. ~ .. .. .. .. ·0 r-! CO C") m C") \.O"<i' ... .. 0 N r-! \.0 t--~I.J)"<f'
~ • N N N C") ("') O)N\.O .. • .. 0 • .. E-< • I.J) N 0) t-- ("') \0 \.0 0 O .. NNNm .. N N r-! E-< • U'l U'l C") r-! .. ... .. ...
~ ... ... + • · 8:- .. •
r-!" (I) ...
~~ · ~ 0\ .. .. 0 ...
"1 0) • 8 J .. U ..
o · (il 0 .. m .. .. (I) .. (il l U) .. .. .. E-i ...
I m • ffi E-< .. CO .. .. .. Z I · ~ ~ ... 0 .. , ... ~ .. ro o · p;.
~il ... ... ~ ~ J H • ~ ~ \0 .' '· 1 • Q ... HI ~I N Q ... I L() '<T" Z ("')
• · H C") Z .. 0 .. !Xl 0 .. HI (I) 0 I
(I) rl ... Ull OJ Q) ~ ' I"
r- (I) .-f .. rl ....:l 0) ~N "d' .. ~ ~ .0 ~ (.) 0): -;;1" "d'
~ rt! .. ., \0 \0 ~ ... •• CJ E-< · U) • ~ ~ , .. · I • • .. U) O r-! N ~ I · rt! · E-i
. ~ ,. .. ~ Ol ~ 8 I.J) \0 j:i) r- Ol
.' CJ i.J1 • U'l N ">' cor-rx.) '. ; .... r"' N-.;!t tf) ... , ;;e
"'" '" ~ · H o . • • • H • •
Sr .. OJi.J1 ... oo 0 CI 0 0 .+) ... (1) ... 0 U'l M .. ~ i.J1 CO ..-t ., · ~ m . oU'l U'l e:r:l o r- ("')
~ .. "<f''' ~ -.;It 0 .. \OL() N .. 'f!) T · ... . 1 · • • • . • • 0 , · . Olea ~ r-I 0 T-I ... ~ N O ~ .. .-:(. "<f'. ... "'0 U'l \.0 .. O M co ..
.0 -.;It N r.il N U') 0 (I) .... Ol .... ~ .. U') . U'l .. ~ r-"d' -.;It ... ~ (""') ' . . . • :::> .. .. • ... r "' rN -.;It o · "8 ..-t 'i> ; ' 0 ... E-< 0 .. •· .(1) .... -T C"T '" 0 0 \.0 U'l > Ol Ln 0\' 0 " r>'.
I ~. ~ .
· ·o O)~ o CO\ (") 0 (]"r. .. ..0 r-I co r-I .. "" L() -.;It <::Jo~ ..
0 , " m· ...... 0 • • • . o' 0 .. N .. M CO M ' N .. "d' \0. rl b ... Z I " :..-t r-I' • Z 0 ... 0 ..
oN 0 .. H 0l • 0 \.0 L() H O) N L() 0'1 E-< .. "O.-t r-LO .. ' t; 0 '\0 ..-t N ... :::> ·\Or-o o \.O~ ..-t O C() 0\ .. • • 'j,_ el • .. H r-I • co r- m . ..-t •. H r- CO N r-I .0::: '(1) .. m ..-t .,:,ji···N .. ~ E-< r-I " r-! E-< U) ~ .. U) .. H ·o r- \O ~ H o) 0l r-f0 Q .. m .. O r-lO)r- Q ("') COMN ..
• O'\'o ""' N U'l \.Oo r- ~ .. I .. • • • · .. LO- roO N r-I "<f' L0. N N • .. "' 00) en r- ...
• H • . -.;It (Y') N r-I ... · 0 .. • +) • ~ ... C) ... ~ m O Q ... ~ !Xl 0 0 ... • OJ • • .. U) .. ... ..

:28:
A.l.though sector A has a higher number of stems/ha. sector B has a higher volume, indicating that higher diameter class trees are more in sector B. The distribution of higher diameter classes for 20cms .. onwards is in genera1 more in Sector A and B. Sector D has the least number of stE!lTls/ha. Although Sector C contains more stems/ha. thc:m Sector D, the volume/ha. is more in Sector D due to the presence of bEes of higher dieme~ar classes.
6.4.2 Forest recession:
During inventory six sample plots which were shown as forest areas in the topographical sheets were found to be under agricu1ture. Taking each sample plot to represent approx. 862 ha. of forest areas as calculated from the ratio of total forest area to total forested plots, recession of total forest area can be roughly estimated to be 5172 ha. during the period of 10 years, the toposheets being of 1971-72 origin. Ass~ng that the forests have receded in a uniform rate approximately 517 ha. forests have been put to agriculture every year for the last 10 years.
Following types of minor forest produce occur in the area:
6.5.1 Oil. seeds:
a) §al Seed: sal seeds yield 19-20% of fatty oil (Sal. Butter) which is contained in the cotyl.edons. Kernels constitute 72% of the waght of the seeds. The oil is greenish white to whitish in colour an~ is used locally for cooking and lighting. It is used mainly in soap making ana as a substitute for cocoa butter in the manufacture of chocol.ates.
The area contains app roximately 34499 ha. of predominantly Sal forest out of ~hich 25% is degraded and scrub. The balance area of 25874 ha. can be considered as potential. area for yield of Sal seeds.
A sample survey by the State Forest Department in 1977 indicate d that a yield of 52 kg. of Sal seed per ha. can be available in this region during normal seeding year. The potential. yield of Sa~ seeds from this district would be approximately 1345 M .. T.during normal. seeding year.

:2.9:
The following has been the quantity of sal seeds collected by Lio.MPS:
Year
1980 1981 1982
Quantity of seeds collected
5 M.T. 275 M.T. 65 MoT.
There th~s appears to be further scope for collection of sal seeds.
b) Mahua Seeds: The seeds of Mahua(Madhuca latifolia) yield 20-30% of oil which is used in manufacture of soap and candle. The oil is used as a substitute for cocoa butter and also has medicinal uses. Mabua flowers are consumed by the,tribals as stable food during the lean period an~ are also used for brewing liquor for dcmestic consumption. The collection and marketting of Mahua seeds and flowers are dOne by the tribal people during, the month$ ,of March to June.
Average production of seeds is approximately 20 kg. ,pe~ tre~ in ~est Bengal and regular seed production begins after the t_J:ee attains an-'approximate dianeter of 206m. There are 94873 trees of Mahua as potential seed bearers. The total seed prodUction after deduction of 50% due to insect attack, immature falling and wind damage will be 949 M.T. approximately.
The collection of seeds from the forest areas h ave been 72.20 M. T. apprOximately' 'On average, eve_cy year, which is far below t~e_potential yield. From records ,available in the Rang'e Office' it 'was seen that approximately 330 quintals of Mahua seeds. ,!lav~ been collE~ctea from Raiyati land in a year for '!int~r divisional, movement.
.' c) Palas seeds: Seeds of Palas or Butea frdndosa
are a so'urce of non-'edible -.oil for sO,ap industry. A survey conducted by the Bihar Forest Department to I
estimate the ,yield of Palas seeds per tree, ind~cated that an average. of 0.79 kg. ,was the yield of seeds from each Pa1as 'treeo " There -'are 103513 trees in the forest area of the d~strict with a , potential yield of 82 M.T. of seeds. The tree is also a good, traditional lac host.

:30:
d} Kusum Seeds: The seeds of Schlichera trijuga yield 25.27% of oil which is used for cooking and lighting purposes. It is also used in soap, harr oil and as a lubricant. It is reported to be the original. Maossar oil.
The fruits of tns tree are also eaten during hot dry weather by the villagers. No ·reliable data is avail able for Yi.eld of Kusum seeds. There are 1,89,751 trees of KUSum available in the forest area out of which 94.880 trees are above 10cm. d.b.h. and are potential. seed bearers. . It has been fo'und 'from records that on average 5047 qUintals of seeds and 50 quintals of fruits have been collected annually from Rayat.i plots. This is also a good lac host.
e) Karan; Seeds: The seeds of pongamia pinnata yield of 18-22% of red brown oil which is used for lightj,.ng, as grease and lubricants, and as medicine, speciall.y in skin diseases. onl.y 8626 trees were found in the ~ea.
6.5.2 Gums and Ol.eoresins:
Gums are collected from various trees like Sterculia urens, Cochlospemum gossypium, Anoge.i'ssus l.atifolia, Boswellia serrata, Lannea grandis, Buchanania latifolia, Terminalia belerica etc. The gums are found to be of extensive use in .manufacture of food articles, pharmaceuticals, cosmetic, polishes, adhesives" paints" varnishes, inlc, textiles, paper, explosiVes, insecticides etc.
sal tree also yields an aeoresin called sal dammar which is used as incense. It is also used for hardening soft waxes, in shoe polish, and in manufactUre of carbon paper, typewciter ribbbns, as plastering medium for wal~ and roofs as well as a cementing material.for plywood asbestos sheet etc. Sal resin also yields, on dry distillation, an essenti.al oil called chira oil which is used as a fixative in heavy perfume, for favouring chewing and smoking tobacco and as antiseptic.

:31:
The following number of gum yielding trees have been found to be available in the forest areas:
1) Sterculia villosa 2) Cochlospermum gossypium 3) . Boswellia serrata 4) Lannea coromendelica 5) Buchanania latifolia 6) Terminalia belerica 7) Anog~issus latifolia
6.5.3 Kend leaf:
17,252 2,32#.895
60,382 8,,97,060 3,79,516 5,95,131 9,74,657
Annual collection of Kend leaf from Purulia by LAl"IPS has peen as fol.lows:
1980 1981 1982
Collection in M.T.
256.60 232.10 246.62
58 quintals of Kend leaf have also been collected from· Rayati land in a year. The Kend leaves produced are of average quality. Kend(Diospyros melanoxyl.on) tre~s occur in scattered patches a llover the forest area and are found more in the Sal fQrest. Collection of Kend leaves and their trade, forms an important paJ;t. of the trade in minor forest Broduce of Purulia.
At present, the. minor forest produce is collected and traded through the agency of LAMPS under west Bengal Tribal Developmenta Cooperative Corporation. Collection of these minor ~orest produce at appropriate time and their proper storage for protection against damp and insect attack are essentia~ for improving the trade of minor forest produce. This trade of minor forest produce if organized properly" will improve considerably the economic status of the village people specially the tribals.

:32:
7. Maps and Photographs:
given: Maps showing the following details have been
i) Project area in India ii) Inventory Design.
iii) Forest type,roads,Railway lines, rivers and important locations.
iv) Disign followed with respect to household and consumption study sampling units.
v) Map showing distribution of stock according to size classes.
vi) Map showing £i,1:"9 'incidence. vii) Map showing 2njuries to crop.
- - I" :~~... .r.. .
8. Infrastructure: . " 8.1 Administrgtive:
The Division is headed by a Divisi9nal Forest Officer who is assisted by the Assistant Divisional Forest Officer and an Assist.;3.ot Forest Officer. There are 14 pests of Range Officers, 69 posts of Deputy Rangers and 159 posts of Forest Guards. The inter ratio. 'between the strength of Range Offic!2rs, Deputy Rangers and Forest Gu:,itds" come to approximately 1: 5: II. A portion of the above executive staff has been engaged e~clusively for protection of forest resources. Besides, the above staff 285 1'.Jatchers are also engaged primarily to provide protection to plantations and natural f orests.
8.2 Communl.:.£S...tion faciJ,.ityt'
The district' 'pds'sesses good netwoJ:::.K ,of rgads. south ~astern Railway cutst.hrough the district lengthwise connecting purulia to ~~shedpur 'and Ranchi. There are 33 Raiway stations falli.ng within the district. National Highway 32 .is the 'main road which connects purulia to Dhanbad in the North and Ranchi in the west. The Naticnal Highway 32 meets the erstwhile G.T.Road in the ;'lortn' while it meets ,the National Highway 33 in the west linking it to i,mporti).nt industrial towns of Bihar notably Jamshedpur. There is 378 kms. of state Highway and 64kms. of N'ational Highway in tqe district. Good net-works of road are also maintained by, the PvID, local bodies like the District Board", Municipalities and Forest Department.

:33:
The length of ro ad exising in Purulia District is as ' follows:
# • # • , • # • ~ • I • , • , • , • , • , • , • , • I • , • , • , • , • , • .I • , • , -_. I .. I.. • , • , • , • , • I • , • I
Type of Road
National ljighway
State Major Other :Village Local. Forest High- Dist- Distri-roads. Bodies Department way. rict dt roads.
Ro ads. roads. ,.,.,.,.,.,.,.,.,.,.,.,.,.,.,.,.,.,.,.,.,.,.,.,.,.,.~~ ,.,.,.,
Length in 64.00 378.00 77.30 262.50 11~60 564.00 285.00 KIn. '.'·~·~·I·#.'·'.'.'. ,.,.,.,.,., .'.I.'.'.'.'.'.'.#.'~.'.'.'.I.
" 'O' ••
Important roads of the dist.:rict are given below:
i) purulia-Cha~dil-J~shedpur Road ( N .H'. 32) ii) Purul i a-Ranchi Ro,ad ( N . H. 32 and St at e Hi ghway )
iii) .. Cbas 9ulbar RQ9c;l.(N8H~32)". ' , " iv} Barakar-purulia Road(State ~ghway) '
v) Chana-Immadi road(State Highway} vi} Raghunathpur-Santuri Road(State Highway)
vii) Raghunathpur-Chandankeyoni Chas Road(State Highway) viii) Sarberi-'riluri.-Panchet Dam Road~state Highway)
'" Forest roads also exist in considerable 'length for ·the. facility of managem~nt,. qf .. forest. Const.ruction and maintenance of fO,rest roads are carried out r 'egularly by Purulia Forest Division.
9. Forest based industries and markets:
The industrial acti vities' l.n~·· tn~" dIstrict are based on ti .... :!:l.ditional lines and are primarily ' artisan" oriented. The ihdustries are conducted on small and cottage scales. The follo~ing forest based
l industries exist .in the district:
'.t~; .~ .. ~, . .. ~ ; _~: ," .... ~:t-+ -:' ' .
1. ' 'saw Mill industry. 2. Lac process.J.ng "industry. 3. Tassar silk weaving industry. 4. Mask making .ind,ustry.

:34:
9.1 Saw -Mills:
. .Saw Mill i's' the. most 'important forest pased ~hdust'ry of the distri.ct. Rec9+"ds have' ihdicated that there are 28 S~w Mills '.' Dur.f.rg the inventory 18 Saw
,.Mills have been surveyed which indicated th~ the present total annual out-put capacity of · the industry was 15045 m3. Consumption study in Purulia, however, indicated that the total input of the saw mill was 6646rn3. The Saw Mills. worked below their installed capacity because of in~ufficient and irregular supply of electricity, raw material and somet~es because of labour trouble. The distr±bution of surveyed saw mills according to their annual capacity is as follows:-
'.'.'.'.'.'.,.,.,.,.,.,.,.,.,.,.,.,.,.,.,.,.,.,. Annual Capacity 300m3 301 to 601 to 1aOOm3
600 m3 1000m3 & above. '·'·'·'·'·'·'·'·'.,.,.,.,.i.,.,.,.,.,.,.,.,.,.,. No.of saw Mills 6 8 :2 '2 % of occu~rence 33.3 44.5 11.1 11.1 , • , ., • , • # • # • , ., • , .:' • , • , .. I • # • I • I • .t • I , • '. • I • ~: .~ , ·It., • " •
77.8% of the .Saw Mills possess annual capacity of less than 600 m3.
The ~ollowing tuble shows the amount of timber i.mported by .Saw·; Mi'lls from outside PurUl..ia:-
,.,.,.,.,.,.,.,.,.,.,.,.,.,.,.~.~.,-,.,.,.,.,.,.
Item Total 100% of 50% of their survey- their out-put ed.. out-put imported.
imported I.#.'.'.'.'.'.'.'.' ••• '.'.,.,.,.~.#.,.,.,.#.,.~. No.of Saw Mills 18 5 4 'Total capacity 9672m3 3549m3 2490 m3 ,.,.,.,.,.,.,.,.,.,.,.,.,.,.,.,.,.,.,.,.,.,.,.,.
Thus 50% of the Saw Mills imported timber fran outside sources mainly Bihar, Orissa and Madhya Pradesh from timber depots like Badampahar in Orissa, Latehar in ~adhya Pradesh and Joshipur in Bihar and the quantity impOrted was 49.57% of the total capacity of the Saw Mills surveyed. The total import of timber would then be 7458 m3 whic~ is 49.57% o£ the total installed capacity of the Saw Mill industry. The reason for this import has been ascertained to be insufficient supply of local. raw materials.
: 35:
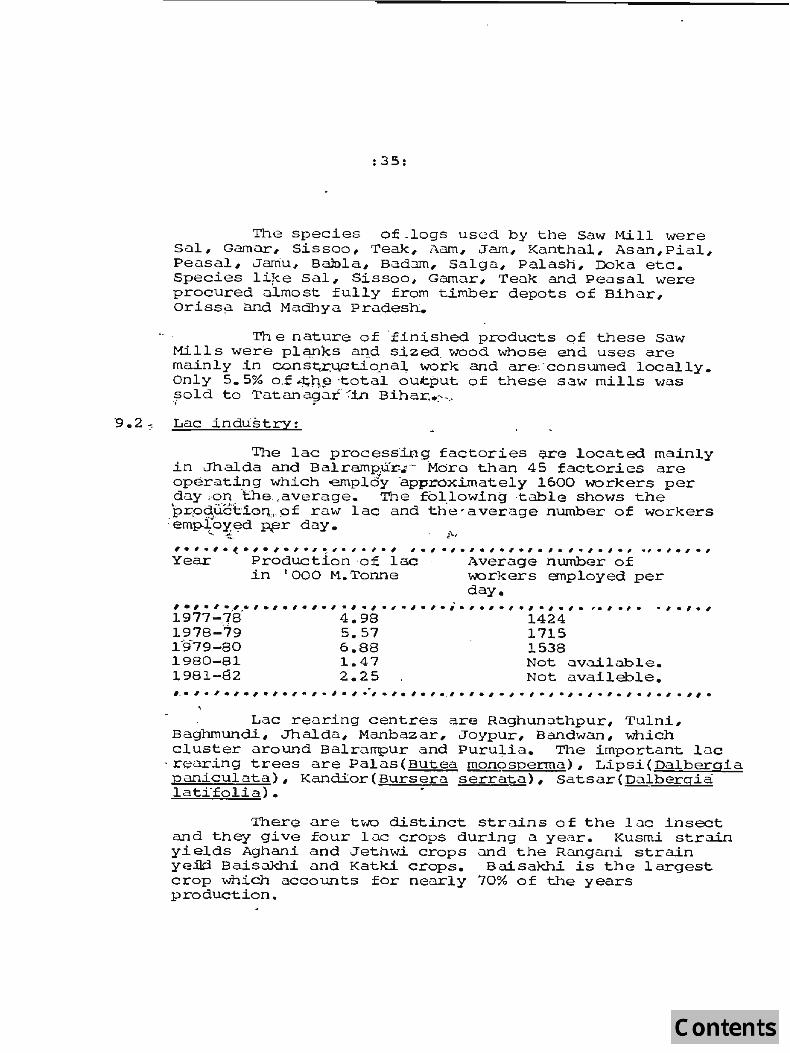
The species of_logs used by the Saw Mill were Sal ~ Gamar, Sissoo, Teak, Aam, Jam, Kanthal, Asan,piCll, Peasal, Jamu, Balola, Bad:ml, SalgCl, Palash~ Doka etc. Species l.:i.f<e sal, Sissoo, Gama.r, Tea.k and Pe<J.sal were procured almost fully from timber depots of Bihar, Oriss~ and Madhya Pradesh.
Th e nature of 'finished products of these saw Mills were plqn}cs ,aJ:}d sized, wood whose end uses are mainly in const,r.~,ti.o_naJ,. ,wo;rk and are~-consumed locally. Only 5.5% 0 ,£ 4;h~ 'total oucput of these saw mills 'l.vas sold to TatQ.nag.::l.r :~±n Bihar..:>, . . ~ .
'9.2.:; Lac industry:
The lac process.i:ng factories Qre located mainl.y in Jhalda and Balrampur-i-'- Mora than 45 factories are operating which €mpl6y app~oximately 1600 workers per day "on -the,.avera.ge. The fal.lowing table shows the
_prp9:,uctio1'l,,-of ra.w lac and the'aver<lge number of workers ' emp:loy'~d ~r day. <
~ ~ ' . ~
, • I • 6 •. ( • I • , • , • I .~ , • ~ • , ! I. .,., • ., ',-. I • , • , • , • , • , • I. • , ., .,.,.,.,
Year Production 'of lac Average number of in 1000 M.Tonne workers employed per
day. , • ,'. , '!)~ .• , • I • I • I • I • , • I • I • I. .. #' • ; • , • , • , • , • I. • I. • ,. I .,. .,.,. ~
1977-~8 4.98 1424 1978-19 5.57 1715 1 '979-80 6.88 1538 1980-81 1.47 Not available. 1981-g2 2.25 Not availeble. ,_. , • I • , • , • , • , • , • i • , .. ", • , • , • , . , I • , • , • I • , • , • I • ~ • , • # • I • , ,. , , •
Lac rearing centres are RQ.ghun::l.thpur, Tulni, Baghrriundi., Jhalda, Manbaz ar, Joypur, Bandwan II which cluster around Balrampur and Purulia. The important lac
. rearing trees are Palas(Butea monosperma)" Lipsi(Dalbergia paniculata), Kand:Lor(Bursera serrata), Satsar(Dalbergia lati·folia) • •
TherG are two distinct strains of the 1 ac insect and they give four lac crops during a year. Kusmi strain yields Aghani <3.nd Jethwi crops and the Ranga.ni strain yeild Bais.:lKhi and Katki crops. Baisakhi is the largest crop which accounts for nearly 70% of the years production.

:36:
.<
The Jethwi cropp , Gfe harvesteCi during June and July after l.nfection auring December and Janu(ll;'Y. The Aghani cropS is harvested during Dc~ember and J a nuary and infected during June and July. . Bai,sGk hi crop i~ " • harvested during April to July afte r i rifection during October . and NovEmber. ·Katki.is harvested '-during -octo b e r & November after infection during June a nq. July~ A lac host yield about 2 , to 5 -~g. 1 ac per ' t ree a nd the Government has approved a minimum support price of Rs. 2 • .2.5. per: kg .• -of, raw ··Lac to the vi'l :l 'ugers'" - 'Th-e: _'Director of LGC Research has estimated a fair "pr.ice of ~. 5/- per kg. of raw lac. .
. ', .: .Lac rearing engages approximately 50,000 people e:very year. They beiong mostly- to backward and tribal communJ.ties. -It is- thus, a ' source' of', ste ady! income- to the poor small population •.
. Major po rti:on' of 'the processed lac;"is expa:rrted from Puruli'a and onlY ' apprciximately. , lO% -is used loqa lly :; for manufacture.:.cof ba.ngles~ sealirig wax, toys, bleached
oL.1§.C. .<.et-c. The, bal.Llnce 90% finds .its way mostlY to foreign '----markets in the form of sheets. .
9.3" Tassar Industry: , "
Tassar rearing and weav~ng is another i mportant village industry which absorbs approximately 4,000 persons annually. The tassar ,cocoons a re r e are d on Asan and Arjun trees. The tassLlr cocoo ns are a lso rea red in the neighbouring forest of Bihar and Orissa. The materia ls are even collected from Madhya Pradesh. The t ass a r units are mostly scattered in and around·puruli a town in- place s like Raghunathpur, P ara and NituIia and they are e stimated to be aro und 200. The followi'ng has b e en the- quantity of r a w tassar produced by the , village rs:
1980-81 1981-82 198 2-83
Quantity o f raw tas sar produced in Kahan
900 1100 2 000
1 Kahan ;:: 10 - 12 Kg. green weight ~ Kg. of dry we~ght.

:37:
Thus the production is steadily increasing and has been more than double during last three yearso The raw tassar crops are harvested thrice every year during July, october and January for which May-June, Augustseptember and November-December are the infection time. The yield of tassar is approx imately 22 Kahan per hectare per year on the basis of 660 numbers of bushy trees per hectare. The raw tassar is woven into fabrics which are sold to the public.
9~4 Mask making:
There are about 50 units of mask making in which the raw material s used are paper mache. Thi.s has a rural base and are used for decoration in folk festivals. The decoration papers produced in these industries are also exported.
In addition to these industries there are small units for making combs, wooden pie and toys from timber like papra(Gardenia latifolia), Gamar(Gmelina arboreal, Kurchi(Hollarhena antidysenteric} and Challi{Morinda tinctoria). The number of forest species used in such individual enterprises and number of families dependant on such enterprises are gradually increasing.

. ' 1<" - )8 ,,_
CHAPTER: II
INVESTIG-yrION l\ND METdODOLOGY
2.1 Objectives:
'larious data were collected from the field during inventory with the following objectives:
i) to estimate the t otal growing stock of Purulia Division. .
ii) to examine the extent, " ccmposition of the forest crop andL its dist.ribution according to~ size classes and:, density •
• ' t
iii"> "to estimate the qu.:.mtity of dom~stic and industrial woo~ c <;m sl,ll1lption .. , . , . '.' , . '.. , ... . . .
i~) 't~'~~iv~ at d"net wood bala~ce in Purulia District • . These data will also fOrl1\ a base,
v) to monit:or periodically(on 10 years cycle) the changing situation of forest resources and
vi) to serve the data needs 0 f development planning of the State as wall as the central Government •
.. ' 2.2 Aerial reconnaissance.:
No, ae~i?~, r@connaLssance w~s carried out.
2,3 ,Photo-interpretation and mapping:
Pho to-interpre tation maps for the district were not available. Ground inventory was carried out on the basis Qf,Survey Of India topograph~cal 'sneets of 1: 50,OQO scale. The following map~ sheets have . been used:
73E/15, 73I/2 73E/16 73I/3
, . >'731/4
.-
73 I/5 73 I/6 73 'l/7
. ", .
73 I/8 73 I/12 73 I/10 73 ,r/t'4 . 73,~~ :t/l1 '13 '1/15
_ , . " .73. 1/16 ,

: 39:
During 1ocation of the plot centres of sample plots according to random numbers it was found that all the plot centres did not fall within the forest area shown in the toposheets. AS such these sample plots were not 'surveyed during the groun d inventory. Many grids were excluded from sampling as both the plot centres bf the sample plpts wi thin ,these grids fell outside the forest area. Th~ folloWing table shows the details of sample plot:-s mapped and subsequently surveyed:
,., ••• , .~ • , • I • ., • I • , • I • I • , • I. i .. , • , • I .". • " .,., • ., • , • I. I ., • I ., ., •
Total number of Total no.o£ Total Total Total no. grids corit'aining plots repre- . no.o£ no.o£ of plots forest area as senting .. piots p10ts found to per survey o£ these grids': approa"': ,found bentain India toposheet. ched to be forest.
I 'for barren, survey. 'agricui
ture, pasture land etc.' .. ~.,.'.'.' .. ,.,.,.,.,.,.,.,.,.,.,.,.,.,.,.,.,.,.,.,., ., ..
165 330 192 85 107 , .. # • , • ". • , • , • , • , • # .. , • , • ~ • ; •. , J~ , • , • , • " • ~ • • • ". • , • , • , • , • # • , • I • ~
The distribution of sample 'plots in the Sal and Miscellaneous strata and in plantation areas has been as follows:
•• # • #' • , • ~ • I • , • I. ,. , • , .. , .• "' • , ., -• ., • , • , • , • , • , • ". • , • , ., • ~ • I .. , • ,
No.of plots No.of plots in Sal stra~ in misc. tum. stratum.
Total no. of plots in Sal & Misc. stratum.
No.of plots in plantations.
Total no.of plots.
,.,.,.,.,.,.,., .,.,.,~,.,.,.'.'.'.'.'.'.I.'.'·I.'·'·'·'·' 40 38 78 29 107
The areas of Sal Stratum, Miscellaneous stratum and Plantations have been estimated in the same proportion as the distribution of plots to the total forest area. The distribut.ion of the areas is given below: 1.'.'.'.1.,.,.,.,.,.,.,.1.,.,.,.,.,.,.,.,-,.,.,.,.,.1 8 ,.,.
Total forest Area of Sal l\.rea of Misc. Area of p1anta-area in ha. strntum in stratum in tion in ha.
ha. ha. '.' ••. 1.,.,.,.,.,.,.,.'-'.'.'.1-'.1-'.'.'.1.,.'.1 8 #-'. ,.,.
92,284 34,498.69 32,773,76 25,011.55

:40:
According to the records available ~n the Forest Directorate the area of plantation t~ll 1981 in Purulia is 44000 ha. There is thus a . gap of ap~roximately 18989 ha. between the recorded plantat~on area and the plantation area estimated from the inventory. The reason for this discrepancy can be that many plantations raised by the various Soil Conservation D~v~sions and also the Territorial Divisions in earlier years were damaged due to illicit felling and the Sffine are~s were planted up" ·denovo but these areas have been recorded as new plaht'at::t~n a~ea.~. Thus .the, tqt:.al plantation ar.eas are required to he surveyed .in d~1::ails to assess the actual state of afmr9.
2.4 Inventory des~gn: •
. .. ..J..... .t , _, .~';"'::: _._ . ~~ '; __ ._,
The. standard design for ground::irivehtory--work 'prepared by Forest survey Of Indi.a has been adopted.
2.4.1 Sampli:ng design:, i ..
• f
-';Each topographical map sheet of scale 1:50 1 000 rel:ating to Purulia District was .divided into grids of 2~' x 2~ I which formed .a unit. The plot centres 0 f two sample plots were selected in each gr~q cwhich were locat~d in the fielq.~ A plot of '.1 ha. wi3.s laid out around the plot centre and inventory of this sample plot was,done.
The plot centres of the two . sample points in each grid were selected in the following manner:
Two randon) numbers "weL"e selected from the random number table whi.ch formed the basis of x .and y co-ordinates of the plot centre of one sample plot with the latitude as x aXis and l.ohgitude as y axis and the south west corner of the -2~ I x 2~' grid a~ the orig~n. The sample plot was plotted in the grId. The location of the second sample plot was found by joining the first plot centre with the grid centre and extending it to an equal distance in the opposite direction. The point at the Gnd will be the plot centre of the second sample plot.

:41:
2.5 Field work:
Field data were coLlected by Crews; each crew consisted of one J.T_A. one Dy.Ranger and a Fieldman. Two or three labourers were kept attached wj.,:th the crew team for cutting jungles, laying out plots and plazing of trees etc.
2.5.1 Field instructions:
The pl.ot centre of each sample plot is iocated in the field,with the help of a reference point and a plot of • 1 ha. -is laid out around it according to the instructions contaip~d in the manuaL and the data collec.ted in r-elevant forms. Detailed instructions. on the procedure of field work and filling the various forms according to the correct codes, are given in the field manuaL. Each crew was allotted a number of grids which conta;iIlEXl a number 0 £ sampl.e plots which were surveyed ,by than ac'cording to the above procedure.
For collection of informations the fo~wing forms ."fere used.
i) i.1)
ii'i) .tv) -'v)
vi)
Plo~ appra6ch'£orm, plot description form, Pl.ot enumeration ' fo.rm,
,,' Sample tree form, Herbs and Shrubs-'data form" Bamboo enumerat. ion forins.
~. , . . .

:42:
Cfu~TER: III
DATA ANALYSIS
3.1 General:
3.2
,.3.3
The d~ta processing operations can be classified into three phases:
a) b)
. . .... ,c) • " ''_ .'- -I (
- .... ':': , ~.
Manual process:ing ;' , .. Proce..$sing on unit record machine. El~ctrQnic data processing •
~ ...
-Manual processing: ..!.I.
The process . involves the follow.ing steps:
i) ii)
iii)
iv)
Proper documentation of field forms. COding the informations in the field forms which have not already been incorporated. . ... ' Manual checkinc;;r'of infonnation filled
l in th e fo.r:ms. ". . Reconcilliation of discrepancies w~th
the help of field Officers. \. . -_
Proce~s.inq~O_f unit record machine:
i) Punch.:!-lf9 ,of. data' from· tne field ~q.r;mQ . , _ , . '. . " . on '. card$ .. , . _ '
' ii) Verification ',of the punched cards • . iii) Sdrc.ing and coIl ating the 'c'ards for proper
iv) input to Computer. Listing the punched data for detecting any omission or duplication~
3.4 Electronic data processing:
It involves the fo110wing steps:' i)
ii) iii)
iv)
Loading of the i data 6n to -magnetic tapes. Consistency checking on Computer. Corrections of data to remove discrep'ancies noticed on consistency checking.
' Preparation of general volume equation.

v) vi)
vii) viii)
ix)
:43:
Calculation of sample tree volumes. Derivation of local volume equations~ Calculation 0;. ~ree and plot volume. Preparation of standard tables of stand and stock. Preparation of growing stock bables for different strata.
3.5 CalCUlation of area:
In absence of aerial photo_interpretation maps, the area estimate was ba~ed" on the figures obtained from the State ¥qrest Dep~rtment. The fLnal estimate arrived at is as follow's:
.~-... '
• • ~ • .I • , • I • , • , • , • , • I • , • I ., • , • I • , • , • ,. . :-1' .- , • , • , .. , .;:'_ ·i-::-'~I .; . ... , • , • , • ,
Total forest area Area of planta- Area of natural of the diVision tion( ha.) forest( ha.) ( ha.) ,.,.,.,.,.,.,.,.,.,.,.,~,.,.,.',.,.,.,.,.,.,.,.,.,.,.,.,.,
92284.00 25011.55 67272.45
Net forest area excluding plantation area works out to be 67272.45 hectares. The areas of various strata have been shown in para 2.3
The estimations of -areas of different stra~a and other classified groups have been· Calculated p~por-' tionately from the total forest area on the basis of number of sample plots falling in each stratum or claSSified groups. These areas .have been shown in various tables given in the subsequent chapeers. These areawise break-ups are approximate and have more of indicative value. They: do not claim statisti,cal preciSion.
3.6 Tree Volume Study: No trees were felled for construction of 'volume
equations. It was decided that the volume data of Ranchi District would be used for Puru~ia District as it is adj acent to the project area. The best and most iooa1 method for construction of volume equation is to select and fell a large number of trees of required species. The cost in this process would have been prohibitive and the time required would have been appreciable. In view of these and also because of the fact that the vegetation of both the areas exhibit little variation, the volume equations develope d for Raoohi District have been used to estimate the growing stock of the area.

:44:
3.7 Volume Eguation:
3.7.1 General .volume Equation:
The general volume equations were used for the following important species in the present survey:
1. Shorea robusta. 2. Anogeissus lati fOlia. 3. syzygium c\.lmj.nii. 4. Adina cordi folia. 5. Terminalia tgmentosa. 6. Boswellia serrata. 7. , t{e~t 0 .£ the s.p~i.es.,
The 'equations given below ·were' selected' in Ranchi survey after taking into cons~derat.ion, the standard error of the estimate" the multiple deter:mination co-efficient arid the applicability .0'£ the equations in the. entire range of data:
,.,.".,.,.".,.,.,.".,.,.,.".".".,.".,.,.,.".".,.,.,.,. I." Species Nnme. " Equations: I' • .. • " • I • I • , • , • ., • _, • , • , • , • , 2. I • I • , • , • ., • , • , ., • ., • ~ • , • "2' • • • , • ,
~ogeissus, latifolia V/D2 H = 0.45110 + 0.00161/0 ~ Syzygium cuninii V/D H =' 0.3750 - 0~OOl,154/D +
V /'. ,. : . 2 0.0077689/D H 2 ",Adina cord~:Eol~a v/D H = O. 55615 o.~0052'355/D H ,,&orea' robust~ V/D
2H = 0.37802 + O.OO41834/D
2H
o~wellia seF~?tCa v/D2H = 0.43527 - 0~OO18469/D2 + 2 > •• 0.005:748.9/D. H, _ '. < ' ., 2
erminalia tomentosa ",Rest of the species
-V/D2 H. = 0.42823 , -_ 0.002149/D H V/O H =; O.5089(l - 0~0019764/D2 + , . " O.0078117/D H ,
, • , 411' I • , • I • , • I • , • , .-, .... 'i. " •.. ' · .I • I • •.• , • I • , • , • , • , • , ., .3' • I • , • , • , • I
V= Total under bark volume in em )including branches • .
D= Over bark~'diaffieter(m) -at breast heighe.' , H= .:Height of the tree(m)
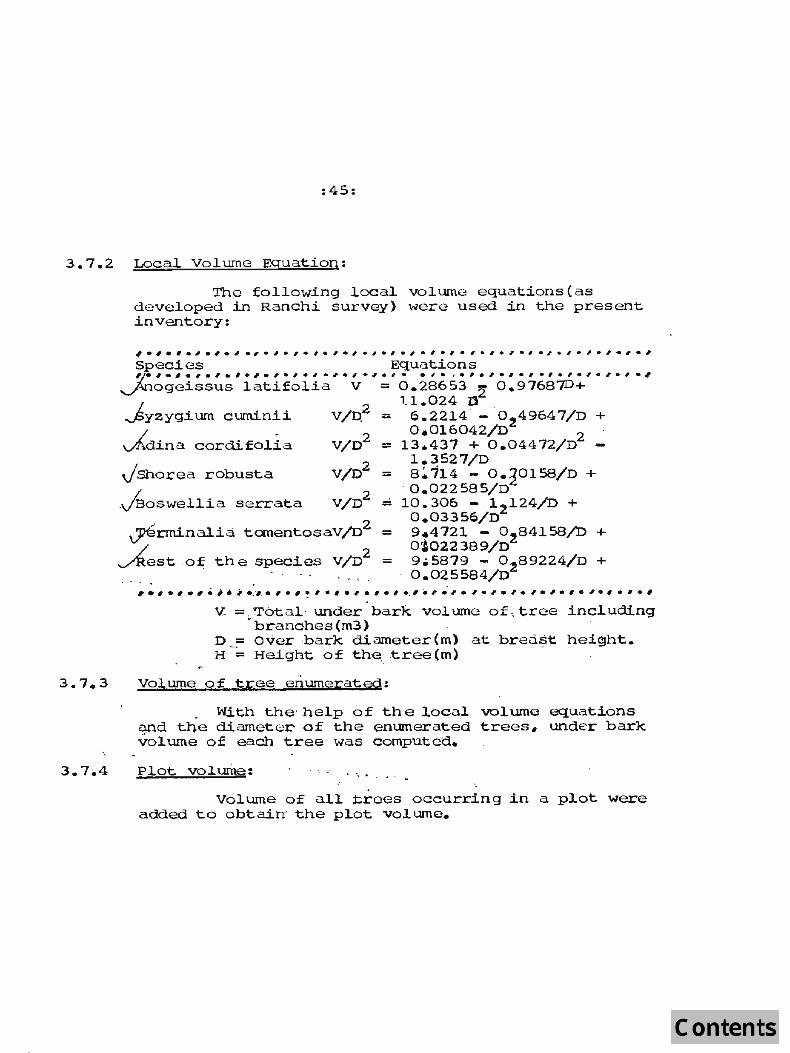
: 45:
3.7.2 Local Volume Equation:
3.7.3
3.7.4
The following local volume equations (as developed in Ranchi survey) were used in the present inventory;
'.# ••• '.'.I.'.'.'.'.'.I.I.'.'·'·'·'·'.'·~·'.;·'·'·I.' Speci es Equation s ~~ ., • I .. , • , • , • , • , • , • I' • , • , • , • I. .,...., • .,.,. I • I' • , • , • , • # .,
~~ogeissus latifolia V = 0.28653 2 0.976870+ 1.1.024 :a
~yzygium cuminii V/D.2 = 6.2214 - O~49647/D + / . 2 0.016042/D 2 '
~dina cordifolia v/O = 13.437 + 0.04472/D -
JShorea robusta 1.3527/D
V/D2 = 8~714 - O.~01S8/0 +
L ' 0.022585/D ,vBoswellia serrata v/o2 - 10.306 - 1 2124/D +
0.03356/0 ~rminaJ..ia tomentosav/D2 = 9.4721 - 0~84158/D +
/ 0~022389/0 ~eSt o:e the species v/02 - 9~5879 - 0289224/D + ,
0.025584/0 . .. * •
'.'.#.#~I.i;~.'.'!'.'.'.'.'~'~'~'.'.'.'.'.'.'.'.'.'.' V =. ''Tot al ' under bark volume 0 f; tree incl uding
. branches (m3) D = Over bark diameter(m) at breaSt' hei~ht. H ";" He~ght of the" .tree{m)
Volume of tree enumerated:
. With the ' help of the local volume eq:uations a,nd tqe diameter of the enumerated trees, under bark vol ume of each tree was computed.
Plot vol.~: .. ",' I> •.••
Volume of all ;brees .. occurring in a plot were added to obtain' the plot vci1ume.

:46:
3.8 Volume per hectare by strClta:
3.9
. ~hree dist£nct strata have been identified in the area 'namely Sal, Miscellaneo1..l9 and plant'a t ions" The volume/ha. distribution by species and diameter class for'di'f£erent stratum is given ih the table No.2.1 to 2.3. The volume/ha. by strata is, as 9iven beibw:
#' .-'#-;~ .~ ;~· ,i • _' .• I .;~ --,', . I " . , ",.'~ . - , • , III ,6 " ! ~. , .. ~ ' . , •• " • I • ',* .' 3-' -.;~ •. ~ . p'. _~_,·_1 • ,
strata, V'?,l LlITle (111. ')/lJa. Vo~'\lffi,~ (m )/h? cjf ~ ", • ' . e Sal: spp .. , ,
, • # • I' .. I'. , • , .' ~ • , • # • , ., I • , • , • , • , • , • , • , • , • I ~ , • , • , • ; . . ". I • I • ,
• sal . 'I..," ' 2'0.045 ' ·· " "'6,."994 ' ~ .. ... Miscelhmeous 25.280 '1.252
, ,pi'aritat.!on ' .. -7.497 ",- .. I .. , • , ' .... ,,' .'1'. , . ' .... , ., . , .' " e. , • ,'. , • # • , •• ~, • " • i .~ I e . , .. ~ • ~ • . ~ ! , 'eo, • I
Tree density study: ., -
;' 'Ihe 'distribution 0 £ stems/ha., by species' and:
di'ameter: crass has' been cal~ulat.ed and '.is' g.iven in table No.l.1 to 1.3. These tabl'es give the est:imates for Sal, Miscellaneous· and Plantation stratum separately. "An ,abstract of the same is appended be1.ow:,
" # • # • i • ,; ., .-, • , • ~ ., .. # • I.' • I • I. rOe, • , ., ,_, ., • J • I • ,._., ., • , • #. ,
StratUm Stems/ha. Sterns/ha. (Sal spp.) , • , i # • ," I. , • # • , .. .. .i. , . , · , . I • # .. ,; • ,; •• , ., '_ , • ., • , • I .-, • , ' . i • , • , • ,
. ...sal, . " . 400 • 500 232 • 000 '" . "_ . Misce11aheous '-537 .. gal -. ... "'" .. ·4-6-.-.3·2.3: , .. " , .,. ~. Plan't:a:t'ion " .. , . " ,167.:58
ei, , ...
, ... " • 1. .... ~ .... ... ... . , • # • , • , • I .', .... ~,. , ., .-, • , • , .. , • , ., • ,-e , • I ., • , • .I • , • , ., • I .. , • I • i
Th e'distribution of total- riumb'er 'of, stems by species arid'·diameter classes for·.:sal, Miscellaneous and Plantation stratum is gi..ven ~n the ~'able NO-. 3.1 t9 3.3 at the end of the report. .. " .. ,
. " , From the study or the taJ::)]es as ment'ioned )~ve the following ·.i.nterences' m'a:y be-' drawn: ,
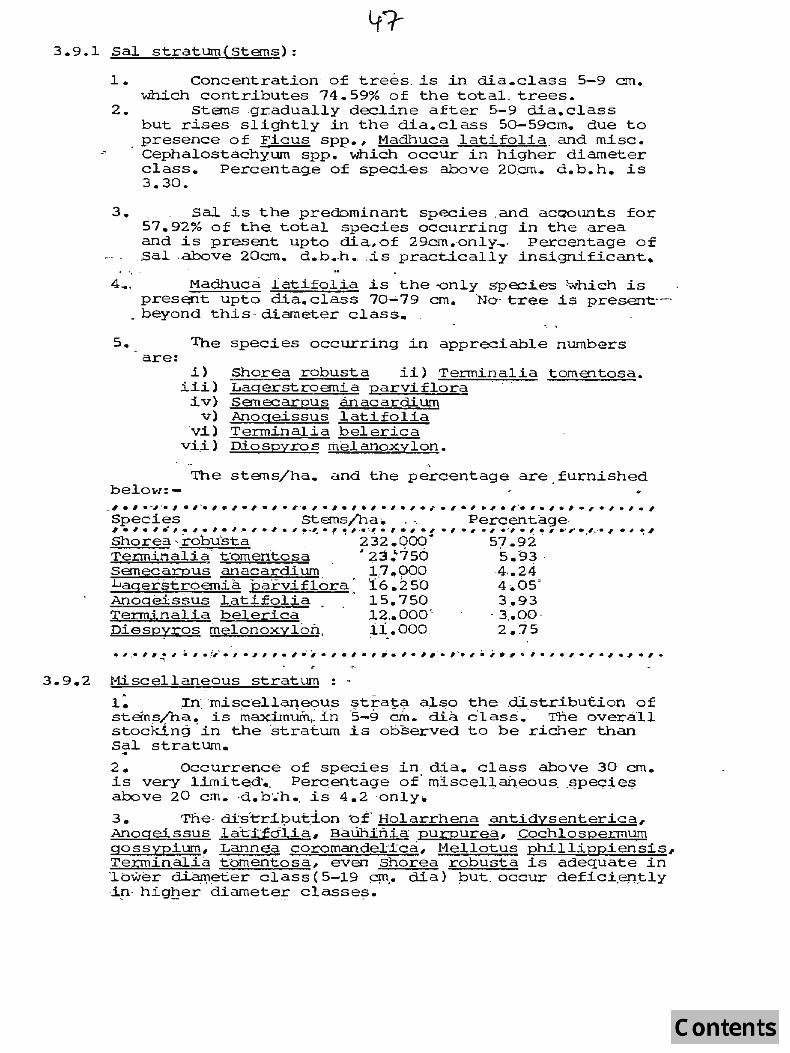
3.9.1 Sal stratum(stems):
1. Concentration of trees. is in dia.class 5-9 am. which contributes 74.59% of the total. trees.
2. Sterns gr.adual.ly decline after 5-9 dia.class but rises slightly in the dia.class 50-59cm. due to presence of Ficus spp., Madhuca latifolia and misc. Cephalostachyum spp. which occur in higher diameter class. Percentage of speci€s· above 20.cm. d. b. h. is 3.30.
3. sal is the predominant species .and aCQOunts for 57.92% of the. total species occurring in the area and is present upto dia#of 29em.·only .... · percentage of .sal ·above 20cm. d.b.h •. . is practical.ly ins.ignificant.
4.... Madhuca lati£olia is the -only species ;which is prese'1t upto ma. class 70-'79 cm. No- tree is present·-,
. beyond this- diameter class •.
5. '!he species occurring in appreciable numbers are:
i) iii) iv)
v) 'vi)
vi,i)
Shorea robust a ii) Terminalia tomentosa. Lagerstroemia parvi£lora Semecarpus anacardium Anogeissus lati£olia Terminalia belerica Diospyros melanoxylon •
. , The stems/ha. and the percentage are, furnished
below:-., • I -. -I ' . , • , '-. I • , • I • , • ". I • .I • I , '. I • , • # .; t/' • I .' I • , -_ I ' . I • , '. # • , • , • , • ,
. Species . stems/ha. , ', Percentage ., • ~ • , .: , • , • , • I ,. , •. 1 • ~ • "'4 • ., • ,,;. ;, • " • , ., • , • , • , '. r,. • , • , ... ,' • ,.~ .• ., •. 1 .,
Shorea-:r'obusta '.' :232.000" 57.92· . . Terminalia: t'omentosa I 23:750 5.~3 ' Semecarpus anacardium i} .. oQo 4..24-Lagerstroemia. Parviflora' 16.250 4.05' Anogeissus lati£ol.ia, . 15.750 3.93 Terminalia belerica 12,;'000' , 3 .• 00 , Die~pyros melonoxyloii., fl.. 000. 2.75
• I _. -,. , • , • I .l.,'. , • .I I , • i '" .',' • , • ., .-, • '. , • , ~ ; . #'. , it _I .. , • I • # • ,. • , • , • ~ • I • . -,
3.9.2 Miscellaneous stratum: -
1: In' miscellariE:!ous strata also the ,distributi.on of stems/ha; is maXiIntim~ in '5~9 em. ilia c'lass'_' The 6vera'fl stocking' in the 'stratum is · observe d to b e richer than Sal stratum. ~
2. Occurrence of species in dia. class above 30 em. is very limi te.d'.. Perce ntage of' ml.scellan.eous. ,~pe9ie$ above 20 em. ·d.b .. 'h •. is 4.2 ·only ..
3. Tht;!· distri~ut.ion "C:f" H61arrhena antidysenterica, Anogeissus la't;t£dl.ia , Bawiifiia pUrPurea, Cochlospermum gossypium, Lannea coromandel'ica, Hellotus phillippiensis, Tepninalia tbmentosa, even · Shorea· robusta is adequate in 'lower dLaro~ter class (5-19 qn,. dia) put. occur defici,en~ly ip· higher diameteJ:;" classe~.

:48:
4. The species occurring in reasonable numbers are Terminalia tomentosac Shorea robusta, Holarrhena antidysenterica, Mallotus philippinensis, Semecarpus anacardium, Lannea coromondelica etc. The stems per hectare with percentage for some of the species are appended below :-
• -, .,"# • " • ~ • , • , • , • "r:. •. ,.~ . , • • • ~ • , • I • , • # • , • , ,. • • • , • • I • , • , ••• , • , • , • ,
S P e c i e s Stems/ha. Percentage ·'·'·'·'·'·'·'·~·'.'·'.'.'.'.'.,.,o,.,.~~,.#.~.~.,.,., .,.
Terminalia tomentosa Shorea robusta .Halarrhena ant±dysentrica Mallotus philippinensis SEi!necarnus an ac ardi urn Lannea coromandelica Anogeissus latifolia Emblica officinalis
. Pterocarpus' marsupium Bauhinia purpurea Gmelina 'arborea saccopetalum tomentosum Croton oblongifolius Buchanania latifolia
51.061 46.323 41.059 36.585 23.425 17.898 13.160 13.160 10.265
9.738 8 .. 949 7.370 6.843 5.790
9.49 8.61 7.63 6.80 4 .. 35 3.3:4 2.44 2.44 1.91 1.81 1.66 1.36 1.27 1.08
.'" #- •. , e , • , • , .,1'_ • , e " • I • I' • , • ~ ., • , • , • , • , • , • ~ • , ., • , • ~ • , • , • I • , •
3 e 9.3 Plantation stratum :
The number of stems/ha. in the stratum is . observed to be 167~5 which is below the expected level.
An examination of the plantation areas indicates that tmout 25% of the plantation area is denuded and blank, and in the balance, about 3 .. 4% has been seriously damaged due to illicit fellings. These factors are responsible for considerable reduction in the stems/ha of the plantation stratum. Further, the observation' indicate that the percent'age of pure plantation species namely Acacia auriculifopnis and Eucalyptus hybrid are 26.7 and 62.7 respectively. There is a preponderance of these two .. ,.species in the stratum with significant concentration. in dia class 5-9 cm. '(62.1%) and dia. c.hss 10-19 em. (15.6%). . .
Among other predominant species observed in the stratum are Choco1oro.;mermUffi gossvpium (2.8%), Butea monospepnum (1.4%), Lannea coromandelica (1.2%) and sernicarous anacardium (0.8%). Madhuca latifolia is observed in dia .. class (70-7'9 cm.). These miscellaneous species from original forests are reared in the plantable areas in consideration of their multiple economic utility as a source o£ m.£.p. like lac, gum6 mahua seeds etc.

3.10.
:49:
Further from the pattern of distribution of the crop it is apparent that the crop is concentrated around the dia.class(5-9)cm. wherein about 81.4% of the stems lie. Trees beyond 30-31 em. dia.dlass is practically absent.
stock Tables:
. Volume/ha •. and total volume by species and diameter classes are given .in table 2 .. 1 to 2.3 and 4.1 to 4.3. Tge following' '.inferences C<¥l be d.rawn :from the " above tables: ' .0.
3.ii' 'Volume, studies (Sal stratum): . \ \ .
1. The v~i~e.iha.· ~n' .t.n.ip str~tum ' :is oh1y 20.045m~ . . ?The main .species is ShOrea: robus.ta which
accounts for '34.-8% \Qf the total vo'l'u1n'e.' ", ·I·t is observed"that for Sh~rea robusta, . the volume is concentrated in the, di&r!eter c.l ass . S':'9cm.only and this gradually declines ';as' high.er diqmeter classes are approached • . ~~ total·, vQi~e/ha. of tl~~s species is 6.9911 m _ which~.:ip rather satisfactory consider~g"the .out-t.u.rn of the area. .;_~_ .... ~.
2. In Sa.l -'stratum the total volume. :is concentrated in the. dicrneter classes ·10 .... 191Cffi. and thereafter this 'fa.lls steeply. - nie totai' volum~/h.a. of other ,species in this stratLllTl is low.
3. The volume contribution of Madhuca",+<?-tifolia .. , - continues upto 70-79, em. diarn~ter c_lass.
Maxiinutn· volume is observed in diameter class 70-79 and is' ;aholit '36-.42% of its to'tal volume. Among the other ,higher dia.'cTasses,. ,species of Terminalia citrina <:illd Ficus species are import'3.nt • . - - J, ,.' -
. Out of miscellianeo~.~ species):Madhuca latifol.ia, Diospyros melanoxylori, Termihalia citrina may be considered·as al;:>undant specie~ growing all over the area. " ' .
5. 70.3% of'the total volume is concentrated upto 30cm. dia.class. Only 29.7% o£ the total -volume is contributed by species of diameter
higher -than 30Gm. .
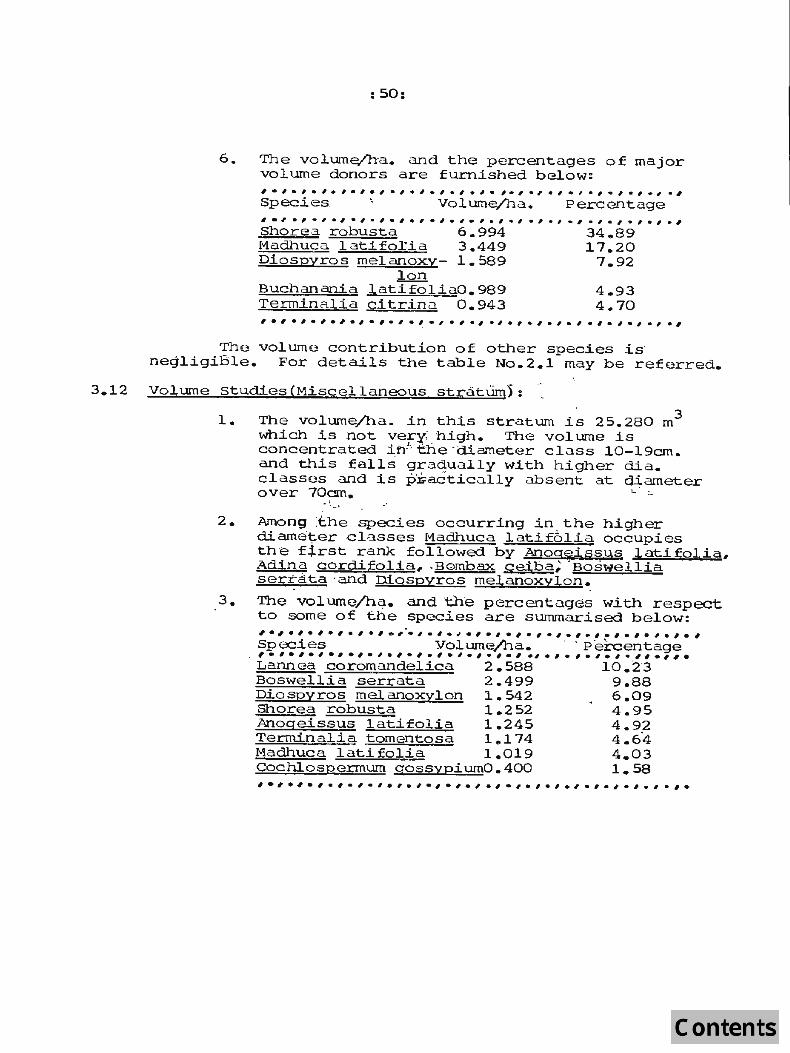
: 50:
6. The volume/ha. and the percentages o f major volume donors are furnished below: #",., • .,.1-'.'.'.,.,.,.,.,.,-,.,.,.,.,.,.,-" Species, " Volume/ha. Percentage I·'·'·'·.;·'·I·· ··'·,·,·~·,·,·,·,·,·,.'.'.I.' Shore3. robusta Madhuca latiforia Diospyros melanoxy-
6.994 3.449 1.589
10n Buchanania latifoliaO.989 Terminalia citrina 0.943
34.89 17.20
7.92
4.93 4.70
,.,.,.,.,.,.,.,.~.,.,.,.,.,.,.,.,.,.,.,.,.,
The vol.ume contribution of other species is negligiBle. For details the table No.2.1 may be referred.
3.12 Volume studies (Miscellaneous stratUm'):
1. The volume/ha. ih this stratum is 25.280 m3 which is not very high. The volume is concentrated inhthe ' diameter class 10 -19cm. and this falls gradually with h igher dia. classes and is pEactically absent at diameter ove r 70cm. I .. ;.
- I, _ .'
2. Among :the species occurring in _ the higher diameter classes Madhuca latif6lia occupies th-e first rank followed by Anogei~sus latifolia, Adina cord.:bfolia, .Bombax ceiba; ' Boswellia serrata'and p!9spyros melanoxylon.
. -3. The volume/hq.. and the percentages with respect
to some of the species are swnmarised below: , . ,.,.,.,.,.,.,~,.,. # .,.,.,.,.~.,.,.,.,.,.,.,
Species VoJ.ume/ha. ' 'Percentage '.'.,.,.,.,.,.,.,.,.,.,.,.,.,.,.,.,.,." . ". Lannea coromandelica 2.588 10.23 Boswellia serrata 2 .499 9.88 Dio spyros melanoxylon 1.542 6.09 Shorea robusta 1.252 4.95 Anogeissus latifolia 1.245 4 .9~ Terminalia tomentosa 1.174 4 . 64 Madhuca latifolia 1.019 4.03 Cochlospermum gossypiumO.400 1.58 , • I' • , • I • , • , • , • , • , • ~ • , • , • ., • , • , • , • , • ., • , • ~ • , • , •

• ~~ 1 • . -.....
3.13 Volume studies(Plantation stratum}':
As already explained in para no.3.9.3 about one fourth of the.area in the stratum is denuded. 3 The net onu-turn per ha. in the stratum is 7.497 m which is quite low.
It is observed that about 30.2% of the volume in thl$ stratum is contributed by pure plantation species namely Teak, Eucalyptus hybrid and Accacin auriculi£ormis. 58.3% of the volume of these species occur in 5-9 cm. dia.class. Teak was found to occur
.in lO-l~ 9m. dia. class only. The p redominant nonplantation species contributing towards total volume are t"1adhuca lati£olia(23.7%), Butea £rondosa{14.5%), Butea monospermum(11.7%) and Chochlospermum gossypium (9.2%) which occur in higher diameter classes(30-39 em.) It is seen that about 76.2% of the volume is contributed by stems upto 39 cm. d.b.-h.
3.14 Local volume tables:
Local volume tables for some of the important species occurring in this areahave been prepared. The species are: .
1. Anogeissus lati.£Qlia 2 • syzygi 1..iITi. c l..JDin:ii 3. Aaina cQr41fblia' .4. Shorea robusbj.~·:: · --.~
5. Bos~lvellia serratIa 6. Termi.nalia tomentosa 7. Other species
., '.
Estiniati.on of error for growing stock: . . :q J. _ "
The volume per hectare and the standard error percentage for Sal, Miscellaneous and plantation strata is given bel.ow:
, • , • , .. , • ,; • I • # • , • # • ' ...... " . ;~ -, .•... ~~. I • , • , • # • , • , .. , • , • , • ,. •
stratum volum~(~ )/h~. S.E.Percentage I 0 , • I • ~ • , • # • , • , • ~ • , • . , • " • , ... , • , .. , • , • , • I • I • , • , • , •
Sal 20.045 18.183 Miscellaneou·s 2?280 ,. 19.437
' ·Plantation' - 7.497, , .. · .. 2-1. .511 '.'.'.'.I.'.'.I.'.~.'.' .• ,.,.,.,.,.,.,.,.,.,.,. e--,
3.16 arowing stock{Total volume)'!, •
Total stems and total volume by diameter and species are obtainedLa product o£ area, respective stems and volume per hectare. These are given in tables 3.1 to 3.3 and 4.1 to 4.3.

.. • .. • • .. , . Ul • Q) .. S-t • .-t .. Q) U • .c Q) '
:,g go .. • ...
• .. • .. ... · . .. • .. • .. •
' ... • ... • .. (I)
• (1)... to •
: '(j 0 • • ... r<l! C • H • .-t .. Q ...;..,
• ... . ... • 0 C-- N Q) r--. r--. CO N .t' .~ ".-t 0'1 CO 'II) N CO ~ CO .-t."" • 0 0 M Q) II) M '<j< \0 .-t r--. ~ '. . . . . . . . . . • ,0 0 0 0 .-t N M "" \0 C--... .. ., • .. ... • I .. 0\ m '<j< 0'1 M r- 0 N ~ ll'l ·8 0\ CO ll'l N to- N t.n r:- Q) .. OMCOt.nM~\oO'" • • • e ' • • • • • • • :0000 '_{' N M '<j<, \0 l"'-:: ... '. .. •
, . , ."\." ' i, \
• lI) r:- "'. N '<j< '.;-of t.n \.0 N "" .. 0 Q) C-- r- C-- ro· 0\ .-f <::I' r:-• 0 0 M CO l.() <:;It t.n 0'1 :<:t', ...-( .
• ... • .. • .. ... • .. " . ... • .. e .. • .. • ... • .. e . .. .. .. .. '. .. . . . . . \ ... . ~. ... . . ,
.· ·.ooO·O..-l N M <::I' '" CO .. •
... t ... • .. .-t ~ r- t.n l' M ~ 0'1 0\ N • ...-fl' ID Q) N 0\ ro 0\ M 0
· .. 00 N LrJ 0 ...... NO 0 .-! , . , .. ' .. ; .... "'0000 ...-f ...-f N M <::I't.n • .. • ... ...
• .. • ...... .. ..
... • .. • .. .. • .. • .. • .. " ....
• • ":~Q).-tM"'O ~ O\'<j<O ...
• • .-I .-I t.n 0 l' to- co .-! C-- 11"1 "O.-!<::I'Oc:..,to-O\<::I'OO\ .. . 0 • . . . • • . • • • • "!'O 0 0 .-t.-! N M l..f\ C-- cO .. ... • .. • ... • ..
... " ... .. .. • ..
• • ... 0\ 0'1 0'1 0\ 0\ 0\ 0\, 0\ .. ·O\...-fNM ~ l/)\Or- CO • "0 I I 1 I I I I I + .. • I 00000000 O · • .. L.O .-I N M '<j< l/) '" C-- CO 0\ ..

: 53:
The following table giv.es the total estimated growing stock in different stratum of th~ area:
'.'.'.'.'.'.,.,.,.,o,.,.,.,.,.,.~.,.,.,.,.,.,.,.,., . ,
Name of stratum ArGa in ha. Vo.Iume/ha. Growing3stock
in m3 ( • 000 m ) ,.,., Sal Miscellaneous Plantation
,.,.,.,., .. ,.,.,.,.,.,.,.,.,.,.,.,.,.,.,.,.,.,., 34498.69 10.045 691.532 32773.76 .',: 25.280 828.520 25011.55 . 71.497 ~ 187.512
" , • I' • I ... ~ • , .. , • , • , • , • , • I ."t. I .. , _/'.$ # • , • , • , • , • , • , • , • , • , • .; • ' ) _ ,
Total: ~2284.00. Ir.s"'\)"3, 1707.564 -...../ '.'.'.'.'.'.,.,.,.,.,.,.,.,.,.,.,.,.,., . ,~,.,.,.,.,.,
The tabl~ p'elow gives ali ' al:!stract .'of total estimated growin'g :Stock for some of, the ,important species. Distriput!qr1 (ff't6tal voJ..u.me by; species and diameter c].ass is given in table 4.1. to 4.3.
, • " • , • ~ • , • I • , • , • # • , • , • ,. .,. , • , • , • , ' . , • , .', ' ';' , • , • , • , • , • "
Species Name : Toti,3..l growing3stock P;eicentage , , (1000 m) , '
fI 'II • ~ • • .. - • " ;
"""""""""'~~"""""~"{~""'~""""'" i)Shorea robusta - 284.422 16.6
ii)Madhuca latifolia 196.884 11.5 iii ) Diospyros melanoxylon 105.352 6.2
iV)Lannea coromandelica 100.301 5.9 v)Boswellia serrata . 81".901 4.8
vi)Terminalia tomentosa 62.390 3.6 vii)Anogeissus latifolia 58.2?2 3.6
viii)Buchanania lat~folia 42.031 2.5 iX)Terminalia citrina 35.431 2.1
. ~ f.'
""#""#"""~~""""""""""""~""""" "

: 54 :
CHAPTER: IV
.. ANNu AL YI ELD
4.1 G e n era l:
The natural forests o£ the division has been classified into two stratum Sal and Miscellru~eous according to the predominant species occurring in the composition o£ the crop. The stem,lha. and volume/ha. have been calculated separately for these strata.
During inventory 29 sample plots were located within the plantation areas ,of the district. The stems/ha. and volume/ha. o£ the plantation species have also been estimated from the data collected from these samp'le pl.ots.
4.2 Inventory result strata-wise:
The classification o£ total forest area into Sal and Miscellaneous strata and Plantation area has already been shown in 2.3. The total. number of stems and volwne
are shown below cl ass-wise:
I.~.I.'.'.'.'.~.#.'.#.'.'.~.'.'.'.~.'.'.#.'.#~'.'.'.,. ,. Class . Plantation Sal Miscellaneous Total
area stratum stratum #.'.~.'.'.I.~.'.'.'.'.~.'.'.,.,.,.,.#.,.~.,.,.,.,.,.,.,
Area in hectare 25011.55 34498.69 32773.76 922284
Stems/hectare 167.581 400.50 537.981 Total. no. 0 f 4191461 13816:725 ~7631660 35639646 stems. vol. UIllc/ha • 7.50 20.045 25.280 Total 187586.63 691526.24 828520.65 1707.633.50 volume
4.3 Annual yield:

4.3.1 Area under present management:
The area falling under the management of purulia Forest Division is 97, 284 ha. which comprises the Reserved Forest, Protected forest and Unclassed Forest. Although the Divisions Kangsabati-I, Kangsabati-II and Panchet Soil Conservation Divisions have raised plantations in part of this area the managenent and exploitation of these plantations are done by the territorial division of Purulia.
4.3.2 Area considered exptatable as per this survey:
The survey has, indica~ed that 25% of the area in Sal stratum has become degraded.. Besides this·,15% of the area in Sal stratum has. a poor stocking with trees of below 1Pcm. d.b.h. These area, consi:.ituting 40% of the; area in Sal stratum, will be unfit for regular exploitation~ . . . . .
The total area available for exploitation will be :
Area of sal stratum in ha.
Area not .. avai,l~le
for exploitation in ha.
34498~69 13799.48 ------ - ... - - -
._.;: .~;
Net. area available for eXploitation. in, . Sal stratum in ha.
Area a~ailable in I'Uscellan8C)us stratum in ha.
_-Planta tion area.
Total. area avail. able .:J .
\ .. ', ' .. for
exploit ab.1en in ha.
20699.21 32773.76 25011.5578484.52 '_ .- - - - - .,- .~ - - i~

: 56:
4.3.3 Future management model:
The density of the crop in Sal stratum can be assessed from the following table which shows the distribution of sample plots of the Sal stratum according to canopy density:
Canopy density Canopy not formed 5-29% 30-69% 70% TCYrAL
Number of sample 12 14 13 1 40 plots. Percentage of 30 35 32.5 2.5 100 occurrence.
out of the 30% of the area where the canopy has not been formed 25% contained degraded and scrub forest; the balance contained young crop of Sal. 35% of the area containing crop of density from 5 to 29% can be further Sub-divided according to the following size clasees: ,.,.,.,.,.,.,.;.,.,.~.,.,.,.,.,.,.,. , .,.,. .,.,.,.,., Predominant d.b,h" <100m. >lOcm.. TOTAL
Number of sample plots Percentage of occurrence
6
15
8
20
14
35
"".,."",."""""",.'",.",.""""""",.,. ,e
15% of the sal stratum contains areas of 10em. deb.h. crop with poor density.
Only 35% of the sal area contains fairly good stocking.
The total number of stans/ha. in the Sal stratum is 400. SO. Out of which the stems/ha. of Sal .i~;58%, Miscellaneous species of local importance such as Terminalia tgmentosa, Tepminalia belerica, Terminalia arjuna, Te;r:minalia chebula, Emblica officinalis,Madhuca latifglia, DiosRyros melanoxylon etc. constitute approximately 19% Which is very low.
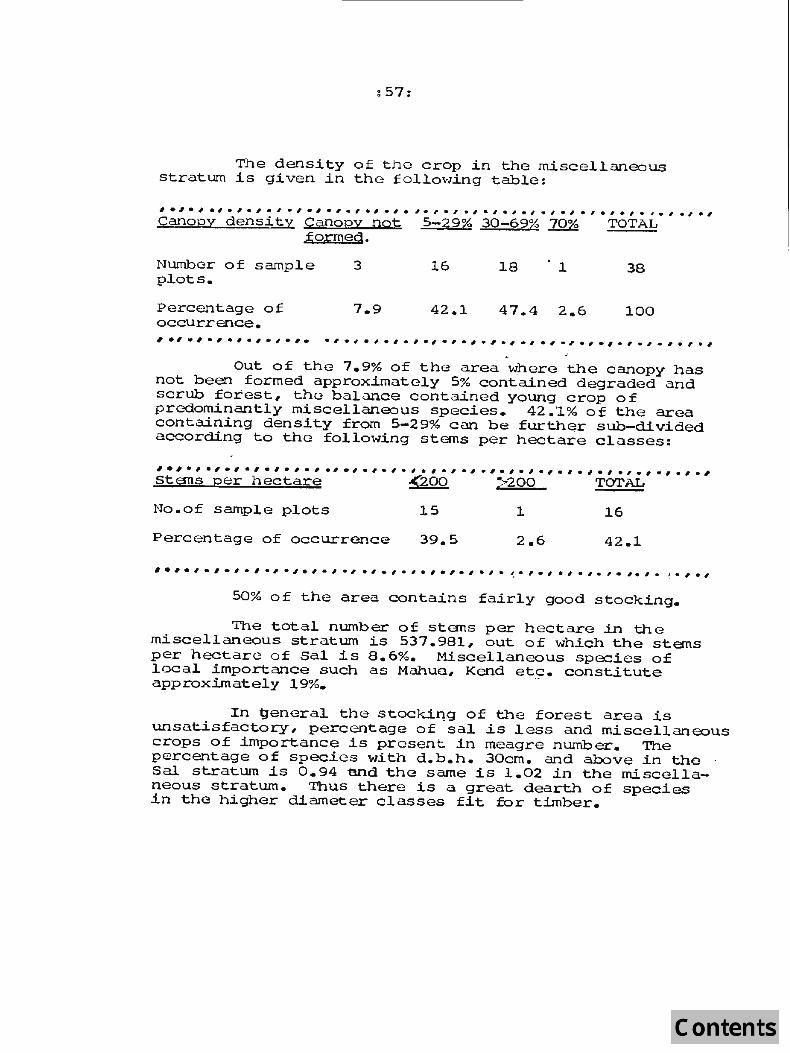
:57:
The density of the crop in the misce~~ an eo us stratum is given in the fo~~owing tab~e:
#.'.'.'.'.'.'.'.I.'.'.'.'.#.'.,.,.,.,.,.,.,.,.,.,.~.,. ,·1 canopy density Canopy not 5-29% 30-69% 70% TOTAL
formed.
Number of sample pl.ots.
Percentage of occurrence.
3
7.9
16
42.1
18 1 38
47.4 2 .. 6 100
, .,., ., • I.,., • I. .,.,.,. I. , ., ., ., .,., ., • 1 • .-1 _, .,. , .,. , ., .. I
Out of the 7.9% of the area w~ere the canopy has not been formed approximately 5% contained d~~raded and scrub forest, the balance contained young crop of prooominantly miscellaneous species. 42.1% of the area containing density from 5-29% can be further sub-divided according to the following stems per hectare classes:
'.1.,8 1.'.'.'.'.'.''''.''.'.1.'.'.'.,.,.,.,.,.,.,.,.,.,.,., stems per hectare ~ "'>200 TOTAL
No.of sample plots 15 1 16
Percentage of occurrence 39.5 2.6 42.1
, • , • # • ~ • , • I ., • , • , • I ., • , • , • , • , • , • , • I • ! ~ -, • , • , • , • , • ,. ,. ~_ . I' • ,
50% of the area contains fairly good stocking.
The total number of stems per hectare in the miscellaneous stratum is 537.981, out of which the stems per hectare of Sal is 8.6%. Miscellaneous species of local importance such as Mahua, Kend et.9. constitute approximately 19%.
In general the stockiqg of the forest area is unsatisfactory, percentage of sal. is l.ess and miscellaneous crops of importance is present in meagre nLUnber. The percentage of species with d.b.h. 30cm. and alx:>ve in the . Sal stratum is 0.94 end the same is 1.02 in the miscellaneous stratum. Thus there is a great dearth of species in the higher diameter classes fit for timber.

: 58:
The objects of management suggested for these forests are as follows:
~) to cons~rve and improve the comp osition and density of the forest stand and to prevent the gradual retrogression of the vegetation.
ii.» to meet the needs of the loc_al population ~~r polest small timbers and . . fi.rewObd~ '
" ."
iii) to meet the req~rements of minor forest produce for domest.ic consUmption, developmenb :o:r- rui:-cil industries and trade by the local people speci ally by the tribcUs. . . ,
i . _ . f..; ("' ~ r
iv) to draw cooperation and par:tic~pation of "the local population in t "he matter of
.1' ·.forest protection and deve19pment • . . ... ,.
v) to provide local ernploym~t through forestry activlUes in order to improve the economic standard of. the people • .
·vi) to meet the needs of neighl:>ouring industries and earn"progressively higher reVenue. '
'I .. ..
To achieve the abov~objectives the forests are propo~~d to, be dj:"vided into the fol.lowing circl.es:
1. Sal rehabilitation working circle: ~. - }
Th±s will contain predominantly Sal forest and the -£~llowing areas ~n sal' stratum: . c
~ . .... .
1) degraded sal forest = 25% of area in Sal
ii) . ' . ~ . . stratum • 15% ar~as w~ th crop dens.i,ty =
5~29% and containing . crop of size class less than lOcm.d.h .. h ·. Total'::
40% 6£ area in -Sal stratum.
= 13799.48 hectare.
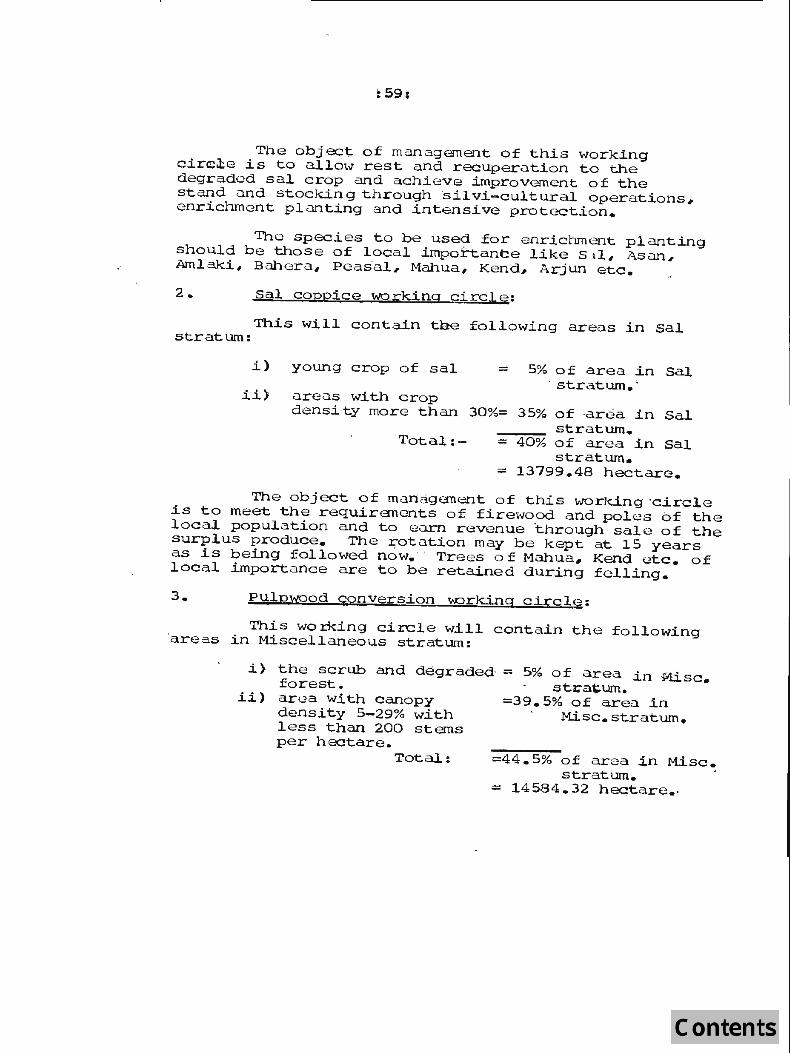
The obj ect. of management of this work ing circ.:te is to al.low rest and recuperation to the degraded sal crop and achieve improvement of the stand and stocking through ·silvi-cultural operations, enrichment planting and intensive protection.
The species to be used for enrichment planting should be those of local importance like S t l, Asan, Amlaki, Bahera, Peasal, Mahua, Kend, Arjun etc.
2. Sal coppice working c i rcle:
This will contain tae following areas in Sal stratum:
i) young crop of sal = 5% of area in Sal
ii} areas with crop . stratum. '
density more than 30o/~ 35% of .area in Sal stratum.
Total: - = 4 0 % of area in Sal stratum.
= 13799.48 hectare.
The object of managanent of this working ·circle is to meet the requirements of firewood and poles of the local population and to eLlm reve nue through sale of the surplus produce. The ~otation may be kept at 15 years as is being followed now. Trees 0 f Mahua, Kend etc. of local importance are to be retained during f e lling.
pulpwood conversion working circle:
This wo rking circle will contain the following -areas in Misce llaneous stratum:
i} the scrub and degrade d · = 5% o f area in ~sc. forest. stra1;.um.
ii) area with canopy =39.5% of area in d e nsity 5-29% with Misc. stratum. l e ss than 200 stems per hectare.
Total: =44.5% of are a in Misc. stratum. .
= 14584.32 hecta re.;

:60:
The working circle will also contain areas already planted with pulpwood species Which approximately is 22011.55 hectareo
The object of management will be to provide a .source of raw mCJ.teria.l. to paper and pulp industries in the neighbouring areas& The circle will also provide to the local people firewood and poles for local consump
tion besides providing minor forest produce for consump-tion and trade. .
Plantation species to be tried will be Eucalyptus and Akashmoni covering 80% of the area and the balance 20% is to be planted with species .like SaL, Mahua, Kend etc. mixture.' '. '
Existing 'rotat.ion 'o:{-l.O years may remain. During felling, trees C)£ Mah1,l.a, Kend/- P,easal etc. are to be retained to 50 stans per hectare.. ._
4.
areas:
Timber conversion working circle:
This working circle wi~l contain the following
i') . in Sal stratum the areas with canopy density 5-29% with crop size of more than IDem. 'd.b.h.
ii) -in miscellaneous '-stratum: a) areas containing young
crop.
b) areas with canopy density 5-29% with more than 200 stGms/ha.
-c) areas with canopy density more than 30%
Total:
= 20% of area in Sal stratum.
= 6899.74 ha.
= 2.9% area in Misc.
·,:strarum .. 2.6% ~ -do-
= 50%
-,=55.5% of a.:.>::"ea . in Misc.
stratum. = 18189.44 ha.

Ltnay
This working circle will also contain the present p~nntations of Teak whose area is approximately 3000 hectare.
ThG object of this working circle is to meet the demands of the local population for smal~ timber ~d minor forest produce as well as to earn revenue through sale of thG surplus.
The species to be planted will be 83.1, Mahua, Kend, Asan. Bahera, Amlaki, ·~Haritaki, peasal, Satisal etc. Teak may be raised only in deep and well drained soil pockets.
A longer rotation may be fixed to yield suitable diameter of trees for sm3.l1 timber. At-eempt must be made to regenerate Sal through planting so as to increase the over percenta~e of Sal in the crop. Research programmes · L be oriented to find a. suitable rI:lethod to raise Sal plantations in these areas.
The distribution of areas to natural forests and plantations in di f£erent ·working circ! e' according to this model of management will be as follows:
'.~.'.'.'.'.'.'.'.'.'.".'.I.'.'.'·'.'·'.'·'.I·'.'·'·' .,
Area Area undor Area under Area under Area Wlder Total area rdhabilit- Sal work- Pulpwood timber con- in ha. ation wor- ing circle working version king circ- in ha. circl,e in working Ie in ha. ha. circle in
ha. Sal· .,
stratum 137~~.~~ 13799.~8 6899.73 34498.69
Misc. 14584.32 18189.44 32773.76 _. stratum
Planta- 22011.55 3000 25011.55 tion a a
Total 13799.48 13799 .. 48 36595.87 28089.17 92284.00
4.3.4 Estimation o£ annual yield(according to the present man agement)
Due to absence of a regular working plan for Purulia Division annual yield and the felling prescriptions for each year was guided by the working Plan of Manbnum Division till 1964-65. Thereafter the forests were worked according to annual Working Scheme prepared by Divisional Forest Officer, purulia. In 1978, the Divisional Forest Officer, Working P1an(South)Oivn.No.II made an attempt to assess the annual yield against felling series of Bandwan, Matha, .TI1alda and Balarampur Ranges on the basis of an oceul<:lr survey. Subsequently the net area available under Sal Coppice working Circle in the Division was calculated and found to be 29,852 hectare.

:62:
The net totu~ urea of the fell~ng series was obtained after deduction of 15% frcm the total available area, for allocation to SuI high forest Working C~rcle which is me<l!lt to compensate the loss of forest areas like~y to take place by further development, r evisional settlement operation etc. As the consolidation of revisional settlement has not yet b een comp~etGd t h is 15% area which works out to 5268 ha. can b e taken as the area of Sal High Forest Con~orsion Wo r king Circle.
The distribution of the area of the division into various working circles follOwing the pattern suggested by the Working Plan DiviSion and details mentioned above ~ll be as fo~lows: '.I·'·'·'·'·#·#·#·'·'·'·'·'·~·'·'·#·'·'.'.#.'.'.'.I.'.# Name of working Sal Coppice P~pwood Teak High TOTAL
con- f o re-ver- sts. sion
I • I • , • , • # • , .. • , • , • , • I • , ~ . , • , • , • , • , • , • , • ., • , • , • I • , • I. .,.,.,
Area,. under each 2.9852 45164 12000 5268 92,284 work,ing circle in hectare.
The total annu~ ;felling area pre scribed b y t:h e Working Plan Officer h.:lS been 1526 h a . Due to acrninistrati ve reasons and also reasons of p ruct ioabilj:ty the annual -felling are as for the past years have not cO!'lfonned to the above prescription, and the actua.l felling has been approximately 1200 ha. per annum. The average yield of forest produce estimated from the ,.outtum figures from .1979 to 1981 is as fol.lows(Ref.5.6.3) :
'·'·'·' · '·'·'·'·'·s·n.'.'.,.,.,.,.,.,., ., .,.,.,. , ~,.,., Average yield in m : T.imber Po.le · Firewood . Total
,-~~~~-~~~~----~-~---~------:;U 5 -12034 · 30749 44998
, • , • ~ .• , • I • ., • , • , •. # e , .. , • # • , :.: ., • " ., • ,. I., • , • ~ • ,. • , • ., • , • ,. ,. I . . .

Thus the average annual. yiel.d from t he forest for past years have been nomina~. As this average out turn of forest produce goes to moet the demands of the l.ocal. peop1c and others., this outturn wil.1 betaken as the present annual. yield from the forest whil.e calculating the wood balance. ThiS wil~ give a more rea~istic picture of the d~and and supply position in Purulia at present.
4.3.5 Calculation of yield according to the model managgmgnt:
Under the model management the Sal Coppice Working Circle wi11 have a rotation of 15 years. The existing plantations of pu1pwood £al.ling.within the pulpwood working circle will. be worked under .21 rotation of 1.0 years a:I1d the conversion period can be assumed to be 1.0 y8ars. Short conversion period can be adopted for quick: improvement of stocking. In the t.;lmber
conversion wor~ng circle, the areas in.the Sal stratum having canopy d\Nlsity of 5-29% and the areas in the Miscellaneous stratum containing young crop and crop with canopy density 5-29%, will be conserved to yield small timber a10ngwith restoc~ng through p1antation. Thus, an area of 8702.29 ha. wi1.1. not contribute towards the yield in immediate future. Out of the ba1ance area of 16386.88 hectare of the working circ1.e with canopy density 30%, 9103.82 ha. of the working circle contains timber sized crop which can be expl.oited. If the conversion period is taken to be 10 years, the annual cut would be 910.38 hectare. Accordingly, the annual cut in the different '-Iorking circle and strata will be as follows: ,.,.,.,.,.,.,.,.,.,.,.,.,.,.~.,.,.,.,.,.,.,.,.,.#.,.,.,
Strutum Annual cut in m Volume Y~old Sal Pulp- Timber rotal per in m3 Copp- wood conver- h~.in ice w.c. sion m
__ ~ __ ~ __ w~.~c~.~ ________ ~w~.~C~. ______ ~~~=-~~~--~~~-=~--Sa1 919.97 919.97 20.04 1.8436.20 Misc. 1458.43 910.38 2368.81 25.28 59883.52 planta- 2201.16 2201.16 7.50 16508.70 tion. ,.,.,.,.,.,.,.,.'.1.'.'.'·'_1.,.,.,., ••• 1.'.6., ••. ,.,. , TotcL1919.97 3659.59 91.0.38 5489.94 94828.42
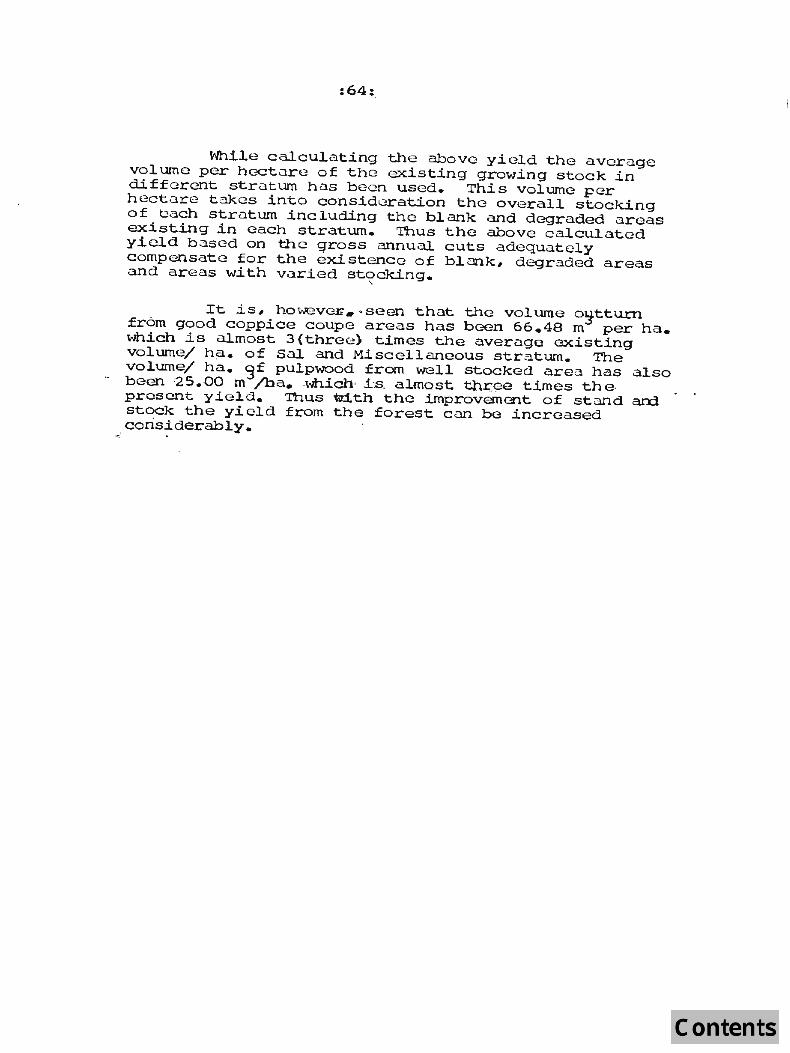
~.
:64:
Whi~e calcu~ating the above yield the average vol.ume per hecture of the existing growing stock in different stracum has been used. This volume por hectare tukes into consid~ration the overall. stocking of bach stratum inc1uding the blank and degraded areas existing in each stratum. Thus the above calculated yield based on tho gross annual cuts adequately compensate for the existence of bJ.ank, degraded areas and areas with varied stocking. . ,
It is, howevG~ •. seen that the volume o~tturn from good coppice coupe areas has been 66.48 m per ha. which is almost 3(thrc8) times the average existing vol.ume/ ha. of Sal. and Miscellaneous stratum. The volume/ ha. 9£ puJ.pwood from well stocked area has also been 25.00 m /ba •. which i_iS. aLmost thr.ee times the, present yield. 'nlus with the improvement of stand an1 stock the yi eld from the forest can be increased considerably.

- 65
C HAP T E R - V.
LOGGING AND ACCESSIBILITY STUDIES .
,5.1. Objectives: Logging and accessibi~ity studies have not been done
in detail. Available data has been collected from the timber merchanto who harvest t h e standing trees and from range officers under whose jurisdiction, the coupes are worked. The logging practices hav e been examined in this bac kground •
5.2. Extra ction routes:
,The trans ..... ort system. of Purulia consis t s mai nly of road and r,'ail transport of Which the bulk of t he traffic and cargo is c~rried in the former. T he net work of roa ds are bui.lt on the skeleton of National Highway 32 amd other S t ate Highways. The National Highway 32 connects Purulia w i. t h Dhanbad in the north and Ranchi in t he west. In the north thi.s road meets with the National Highwa y 2{erstwhile G.T. Road) which l e ad's up'to New Pelhi whi1e in the wes t t his links wi t'h the National Highway 33' which pas ses through some 'industrial' towns of Bi.har notably Ja:mshedpur. A~ to g ether -378 kms. of' Stat e Hi:ghW'ay and 67 kms. of National Hie;hway traverse throug~ the. dis,tric t. There is also a g ood network ofroad mainta ined by the P .W .D., 10ca l bodie s like the District Board, 14unicipali ties and the Forest Department which facilitates inter regiona1 movement of. g oods. T h e following table ,gives the lengths of roads m8.'in-t ,ained by-th e diffe rent org~;lDizati'ohs: ' ,' . ..
• ,. - -, .. ~. _ .~. roO, -, ~.-f ,: _ ;. L e ngth of ro'a ds ' in' kth. .
, -
P.lrl.D. Local, :Bodie s Munic ipalitios Forest Met a ll- Non-met a lDe p t t. e d ro ad ~ed ,roa d roa d
Metal.led Non-metaroad lIed road
Metal1- Non-meta- I
ed rand lIe d foad
586.30 207.30 50.95 . !713 .O~_ , 50.,04, 20' .-88 285
South-~astern Ra i1wa"Y cuts through the distr1ct l e ngthw1se and a1so connects Purulia wi t b J a mshe dpur" ' i n t h e we st. The re a r e 33 Railwa y s t a tions in t he' distr1ct out of which Adr a i s t he .most i mpor.t a nt R a ilwa y .st a t i on.
,'I'he_ ~ :x: t:rac t10n of fore s t proquc.e is dQne o mal;.n1y by road. Main tra n sport is truck. Off-road tra nsP9r't' -at ma j o ri ty o f' t he p1ac e s is also ' done on'.; true-oks 'through Fore st D@p~r-tment r oads. Long distance movem ertt of fore st prod u c e a re car r ied out ma in'1y from Band wan, JoY-pur,; Jha1da t
Balrampur 8.nd Purulia r a nges on t rucks. 1<The:r e fe1~ling s i t es a r e not n e ar roadside temporary extra c tion p at'hs a r e constructe d a n d the forest produces a r e e xtrac ted' up t o the motora ble ro ed on these e xtra ction p aths.

66
5.3. Existing l..ogging practices:
At present the expl..o:itation of' timber :' & po1.es is done by the contractors who purchase standing trees in the a~ction con~ted by the Forest Department. They emp10y their own l..a~ourcrs who us~ traditional.. l..ogging methods to extract the forest produce from the site to . their own depots ..
The common expl..oitabl..e diameter of Sal.. ove r bark is 10 cm~ to 15 cm. a nd 1engths vary from 4 m~ to 6 m. These are used as pol..es. Trees of' diameter 15 cm. to 18 cm. and lengths varying from 3 mo to 6c5 m. are used as-props. Labourers empl..oyed by the' Department are paid wages @
Rs. 8.58 per day. The fol..1owing 10gging practices are fo11owed : -
i) Stump operation:
The fel..1:ing is carried out by axe which is also used for 1opping, de~v~nch~ng and debarking, which a re a ll.. carried out.at the stump 's ite. The o perations are c arried out singl..y by one l.abourer when tllese rel..ates to trees of pol..e size. The fo1.10wing gives the estimates of average cost and approximate (iutput peor man-day for stump _ . '.!'
operations: .
Tree size
Cost of stump '0 pe ra ti-on
Output/ man-day
Pol..e of d.b.h. 10-15 cm. 15 cm.
20 nos. 12 nos.
Logs per mJ Firewood per stack
Rs.4.30 P.
2 stacks
ii) Off-road transport :
Timber and po1es are g e neral..1y ro11ed down a hil..1ock to the road side in case of hil..1.y terrain. In the plain region, the poles and timber are transported from the stump site to the nearest e xtractiori path through man carriage' . The f'o11owing is the cost and output per man-day:
Tree size
cost. of hff-ro~d transport.
Output for mand a s
.~ ,- ',
Pole d .b.h. Logs mJ Firewood/s t ack 10-15 cm.. 15 em.
50 P. 95 P. Rs.15.30P. R s .. 4.30 P ..
17'nos . 9 no s . 2 stacks
The off-road transpor t is usua1l..y mf distance 1ess tha n 200 metres.

5 .. 4.
-67-
The fo11owing ~e the nverage capaci~~·the truck: ....... Logs Poles(each) (:In m3 )
Firewood/sjracks
8 -- 300 20(10 doub1e stacks)
Eight_ numbers of ·labourers . load one truck in two hours at the contract price of Rs. 50/- per truck. 5 nos. of 1abourers un10ad ons truck in 2 hours @ Rs ~20/- per truck. The 10ading and unloading cost genera11y comes to as follows:-
Logs/m" Pole (each" . Firewo9d/stack
Rs .. 8.7!j 0.23 P. I· ,
The transport cost wil1 be as follows:-
Item
Logs/m.3 ., P()le(ea ch)" Firewood/stack
10 lcms.;,
-Rs .. 9.38 0.25
Rs .. 3.75
. ; 10-20 lans.
RI;:1 _.15/.~ P. 0.40 P. P.Rs.6/-
220-.30 lems ..
Ra. -18.75 P. ,0.;50 P.
Rs. 7.50 P.
The total-cost of logging ann tra;nsportation of forest pr_o~uce -:from the s :tump' to a depot' within ,30 kms. will, be as follows~ _
Item _ I:.ogs/mJ pole !each l Firewood 10-1,2 cm. 1,2 cm.
,-Cost of stump Rs. 7.·15 4, operation.
P. 72 P. Rs. 4.,30 P.
Off-road Rs.15.,30 50 P. 95 P. - Rs. 4.,30 P. transport Loading and Rs.8.75 23 P. !_23 P. Rs. ,3·50 p. unloading. Transport to Rs.18.75 50. P. .20 P. Rs. 2.:20 p. Depot Rs. 49.95 Rs.1 .66 Rs- .2.40 Rs.19.60
r
'Terrain c1ass:lfication:
T e rrain.c1assification is done in order to divide the areas i:nto various assessment units according to terrain diffic-ulties. Same values of various logging parameters are expecte~ to apply ;to areas. falling within each unit. ;- r

68
The.distributi"ori Of sample plots falling lim varlious slope percentage classes are shown below:-
Item
No. of plots 52
% of occurrence46
34
30
9 8
Thus 76% of the" area has slope of 10ss than 20% .
The distribution ,of the forest plots acco rding to their distances from a motorable road is as fol].'o\,/s:-
' Distance 1 km. 1-3km. 3-5 5-7 7-10 10-1 5 15 lon.
km. 'lem. km. km. No. of plots 38 30 16 5 4 2 12
% of ,occurr-' .
ence. 35.5 '38.1 1 .• 5 4 .• 6- 3.7 1.9 11 .2
75. 1 %' of the area lies within 5 krn. fro m a motora bl.e ro<;!.d. J4ajority of'the area is fairly ac6essi.b1~ to road transport. ' ,_
" ," As the area is fairl,y accessible to road transport at:'~ majority-o:!" the area' P~lls i.n an und ulating terrain, detai.led terrain cTassification of' the area with a view to assess the logging' pa.rame·te;rs for each uriit has not b e en
' ~t~erDpte~ •
5·5. J;lroposed'logging'practices including road p l a nning:
- In the absence of large scale concentrate d f'ellings 'meChanised logging metl)ods a.re ,no,t r e commended. Unskilled workers. a.re read,i'ly 'available 1.n the area. ' As such the 'lolming metbods Should ~dm at optimum use o,t: 1abour' ard reduction of' wood w a stage . The fe1ling by axe invo'l:ve s siZeable wastage of wooq. . Fe11ing b y s aw inc1udi,ng power cha:in saw may b e cons idereQ . ' The effici ency of f e lli.ng b y powe~ cha in saw on the numerous small coppice stool being limited ava:i-l.abi1i ty- of s.killed labour, the operational cost and o utput should be ttiily examined be f ore i.ntroducing me chanised f e lling.

•
Total length o~ road in km. Area of' range in ha. Road density /ha .. ~n m.
/Kachha
-69-
The present road ctensity per ha. ~~ forest area o~ each Range ~s shown below:-
Manba- Kashi-zar pur
162.5 327.04
6429 5472
Purulia
11049
18.35
Name of Range Joypur Matha Bala- Jhalda Band- Hurra
rampur wan
5272 170)4 11000
10.79 8.14
The road density in the ranges of Matha, Balarampur, Jhalda and Bandwan, where ~ellings are concentrated varies from 8.14m./ha. at Jhalda to 12.S¢ m.lba. at Bandwan wh~ch are ~airly good. The cost of construct~on of motorab~ le/road in forest is estimated to be on average Rs.5250/per km. for a 5-6 m. wide road and Rs. )100/- per km. for 3 metres wide road.
Conclusion:
At present the. explo~tation ~s done through the agency of contractors. The logging practices used are orthodox. The average annual felling prescr~ption for the division is approximately 1525 ha. but the actual felling is on the average 1200 he. annually. As the coupes are wor~ worked indivi.dual1y by the contractors, large sca,le fellings and exploitations are not done in a concentrated manner. Considering the poor stocking in the area, the chances o~ increasing the felling areas at present is remote. The timber operations provide employment to the local people who are mainly tribal. As such the logging operations will continue to remain under manual working and improvement can be ~ntroduced only in reducing wood wastage and ~ncreasing output per man day. Logging effic~ency can also be improved w~th construction of forest roads wh~ch will reduce the cost of off-roed transport •

. I
- 70
C HAP T E R - VI.
CONSUMPTION STUDY: '
t:.. study on. tlie consumption pa.tt;e·~ of wood and bamboo in the ctistrict of Puru1ia was undertaken by the Headquarters unit of Forest Survey Of In~ia. The study was conducted by Dr.J.S.Negi't p-y .. J;>irector(Industries) with the he1p or F.S .. I. staff of Headquarters and Eastern Zone,
v yalGutta~
6.1.0bjectives: ~ . j . ; J . ,-..{ . "'!
6:.4.
The study' ·w~S, made with the .f011owing obj,~ctives~-
I. to estimate , ;tn~ 90ns" .~.m:ption 'of wood and' bamboo fofo househo1d:' 'Purpose!s both .in. rura1 ~~n(t !-1rbBD afdas . . :f:a1·ling within the; district •
.( .... . . . .. - _ . . .. . ... . . - ··~~{r .~ ._ . ':.:' ~
II. to estimate the woo'ct consumption by wood based industries am other .sma11 l?ca1e industries •
Consumption by 1arge industries: ,; ··V ,. .-_. "~~"- - -
-'~
. , ..
:,.. i:
No J.arge industry which consumes :Corest produce exist .;i.~ t'be di.strict" Some wood and bamboos: were be:lng supp1ied 'to P~per Mi1.1s ti11 1979 but the ,$-ttp~ryhas be.en stopped. ~t was' found un1ike1y that wood. wi).1 be taken 12lut :ror supp1y
"to 1arg~ industries.
Consumption by sma1l industries:. t'
Saw trii11s were found to be the on;l.y wood b~sed industries existing within the district •. A ~yrvey of saw ini1:1.s w~iJe done am .. the tota1 log inp'ut of' the saw ~il1s' h'a's been ;esti.mated -to be· '·~bou,t 6646.4- m3/ye a r •
. : i .. ~ If" •
Househo1d consumption: "_. , ~
House'hold consumption study for the f'o11owing items were made: - f) ,
I. Agricultura1 implements II House construction
III Fumi ture 0
IV Fue1wood
In rural areas a sample of' 1.4% 0:C the total vil1age was surveyed randomly and data obtained in p rescribed format :Crom random1y se1ected :Cive to eight households in each vi11age. 2459 habited vi11ages and 2,85,250 households as given in 1981 census, were considered :Co r surve y.

- 71 -
In urban areas towns having population of more than 50, 000 were considered where 0 .. 4% of tota1 households, was taken for study, Which numbered 40 households.
Thirty five villages we:ve sampled in two different strata:-
I distance of village from foreBt within 10 km.
II distance of village from forest above 10 km.
In each village 5-8 houses were sampled depending on the number of households and' population of the village~
F01lowing considerations were made while calcu1ating annual consumption:
iv)
~griculturai implements are replaced annua11y. The longivity of a house is 10 years and annual requirement of wood for house construction wou1d be 10% of the wood Which is in us.~ now. For repairs of house, wood required is .... 10% of wood re.quired for new construct'ion annually.
Furniture item being indoor, their average life 'is taken to be doub1e that· of the house and the annua1 req-p.irement of wood will be 1/20th c.f the wood presently in use.
Fire w09d . coll:eated is consumed during the year.
Requirements of wood were calculated separ~teiy for urban and rural population. Per capita consumption and tptal annual. consumption was ca1culated on the above consideration •. ' . Calculation of weighted average.
I. Quantity consumed annually by a household = Household No •. 01' persons 1iving in the household per capita.
{Household per capita = Village per No .. of househo1ds surveyed capita.
Per capita consumption = .~Villnge per capita . No ~of village ·s.urveyed.
The ,sampled villages were separated ~c..cording. to distances from the forest in order to compare consumption off' firewood between villnges,1ying Within 1q kms. distance from the forest land v11lages lying beyond 10 kms. from the forests.
Following points have been taken into consideration -. while calculating consumption of wood under various
categories: . . a_ House construction: Items like ploughs,
yokes~ rice pounde~s, bu110ck carts, tool hand1es etc. uti1i~ed in agricu1~ural work have been considered. These equipments are used by the rural popu1ation and their use ,is not found in urban areas

- 72 -
a. House construct!2.!l: Nearl.y 80% of the househo·l.ds in rural areas are Kachha or semi-Ka chha built with mud wal.l. and thatched roofs or tiles o Bamboo "-is' use'd mos,tly for making roof frame. "\-looden beams are used for suppor.t:1 .. ~g the bamboo frames •.
· b. -Ftirniture: The furniture items general.ly used are: WOo den cots-~ ChC'l.irs, chawkies and wooden alm:l.rahs.
c. Agricultural. "implements: Ite ms like ploughs, yokes, rice pounders, bullock c a rts, too 1 handles etc. utilised in agricultural work have been considered'; : The equipments are used by the rural population and their use is not fOUI.ld in urban areas.
6.5. Fuelwood consumption:
, The survey has i.~d.ib'~ted. that f'uel.wood accounted for 90.75% of wood consumed. Mnuaily in the district and wood contributed to ' 73% oJ: the total. fuel used in th(). _~rea • . _ __ "_ Fuelwood .is consllmed primarilybyl the rural, population an'(j only a :f'z::action by urba:Jl- popul.ation.; · In the " urban areas
; '9% of the fuel used is. Coal and ;this ;i.s als<D. used by the rural popul.ation. Loccl'people are found to general.ly use agricul·tural· waste and t'Uel.wood obtained from farm and village trees. I'.. small. fi-action of wood is purchased from the market. It was also seen thet ... the .. .. per .capita consumption 01.'- t'uel.wood in vi11ages within 10 kin. distance from f"orests is nea~ly double than-that of villages away from the forests. Kerosene was used in both rural and ; urban areas for lighting purposes. ... ,
The fol.lowi.ng tabl.e gives .the consumption at' other fuels :as found during· the survey: - '
Items
1. coa l/Coke (tonnes)
2. Animal dut:lg (tonnos)
3. Kerosene(Ltr.)
4. E1ectricity (K.1I1. )tis e d for lighting put-pose ' only.
5. ~gricu1tural resid ues
. ,
Fer capita consu- Annual consumption mption Rural. Urban Rural. Urban
0.072 0.078 1,27,080 12,480
__ .. 0.078·~· .. .. 0.'0027 .. 1 , 37 ~ 670
10.09 ,6.000 1,78,.08,850 .9.,60,000
: ;: :
0.077 ... 12,355

Item
- 73
, ' The fo11.owing tab1es wi11 show tho"'cstirnated
cbnsumption or wood for various purposes:
Tab1e - 1
Total. quantity of wood present1y in use for various qonsumption was estimated to be as fo11ows':-
Items , .~
House construction. Furni ture .' Agricu1tura1 implements. Fuel}'food
Estimated amount of wood used(~j) Bura1 areas Urban areas
490670
49420 6 1 775 .
1196670
14880
5600
, . In v'!iew (J't" tAh~ conside-ratioil c 'listed. i,11 para 6.4 the annua1 consumption And per capi;'1;a> consumption , of wood was ca1cu1ated an0l-estimated adcording1y as fol1o.w's:-. ,
Rural areas Total. Per: annual. con- cap:J.ta sumption consum-(mJ ) ,ption
(m3 )
Urban' areas ~ .. To'ta1 annua1 =T:-"o;"'i;;::-a-':l.~~;"P~·,";;e"';r;;"""·----'--- . c Qnsump t ion , annual 'capita T , .;, ~aWn ,. Round conswn.;. conswnp- woo~ wbod
(,!31n r ;t ,ion (mJ ) (m3 ) , r~J r)
House constru,-, ction. Furniture 2471
61 775
0.028
0.006 -
0.°35
1488
,:2751
61775
84258
-!.- -
4585
· 102958
"":"~. ~.-'-.-.-.
Agricu1t"': ural. imp-. 1ements
Fue1wOOd 1196670 & .A.gri •. '
0.678 1248 0.008 11 9791 8 1197908
waste.
Industria1 wood •
.6646 11076
Tota1:
6.6.
. ;
1400785 - - - '- - - - - -
Consumption of bamboo:
Quantity of consumption of bamboo in·the area was a1so estimated. The total. quantity of b~boo in use in the rural. and urban areas is 13414000 and 6096 numbers respecti-vel.y ..
It.i.s assumed that 5t:Jt% of the bamboo wou1d' annual.l.y be repl.aced. The annual. requirement of :tl:le bamboo in rural. and urban areas works out to be 6707000 numbers and 3048 numbers respective1y. Bamboo is used mainl.y for making roof frames and support of mud wal.1s. Bamboos are al.50 extensive1y used for ~encing purposes in tho courtyard, gardens and cattl.e Sheds.

- 74 -
No bamboo was found in the forest area during inventory. The bamboos grow in private land.
6.7. Wood ba~ance~
The annua1, con~umptiorl ·of fuelW'ood including agri-cu1 tura'l ,waste' has bepn eil'ima:ted to be 11,97,900 m3. Approxi.matel.y 2~ of' this requirement is met from the i;1gricu1 tU1~al. waste asstlming "the consumpti.on' pa:ttern to be s:iml:1ar as for the count:ry. ' A cons-iderabl.e portion of the fuelwood consuritption is also met from dry leaves, dry fallen branches etc. t which are collected' from village trees as well. as the f'orests.' These ' types of fuelwood are collected· from the forest in head-io'ads OJ:' cart loads af'ter acquiring permits from the respecti.-;ve .Range Office:o.
Records. available in 6 ranges were' consulted and found that an average 52b89 bead-loa,cls and 2480 cart loads -Were coa.J.ec-ead annually.. If' one' cart load :ls assuf.!1ed' to be equivalent .,tp 20 head-loadS,. the total bead-1,oa(j5 collected annually from J3rx, ,ranges workS out to be 1 ,011689 w.hich in turn works but 'to 16948 head loads in eacb range. The approximate,. number pf llead :,'19~d: pe~its given i ,n 9 ranges of theddivision would thEm po, ' 152532. Assuming that each bead load contains approximate~y .06 1n3 of' fuel. wood the· recorded fuol.wodd removed, .as .. Jbantis" work out to 9 1 52 m3~ ' However, actual. co11ecti.'8n of' these headloads . would. be more. than ·the permi tted c;r recorqed numbere From fie1d observation and 10cal enquiry':t tis" estimated that onl.y 30% of these he.ad 1000s l'i':r'-e;=j::reco;rded _' The total. amount of tlJhantis" etc. removed from the forest "loul.d then be 30,506 m3. No record w;p.:s ava:'i.ii:ibie .o..f the similar type of firewood collected f'rom the trees. in'p:viya'te ~ancl. -,
"- ' "
The past average "o'!.ltturn of fir,ew'ooq per year f;rom the'f&ivi:s.iQn has been e.stiniated. j~o be ';approximately 30,749 -m3 whi:ch m?-y be taken" Cl-S the-- pre sent yield of' f'ire-wood from tlie for,ests.. " .
.... _--':; Then the account of' f~e'lwood availabl.e from various
immed':le.te sources will be as f'ollow~ --:;;..; i_ .i
Quantity of fuelwood used as Agricultural Jh~nti ary 1eawast:e rit:J. .. ,m3. ves etc. from
forest in 'mJ.
Fi.r~wood lab1e 'at -.' .
from . the in m3
avai- To ta:r-1"ue 1-present wood avail.fore.~t able in m)
),00,835

- 75 -
Thus the net balance of fuelwood works out as:
Gross demand of fue 11,10 od in m3
Fuelwood available from various sources " 3.
Net balance in mJ •
11 J 97. ,900 3 .. 00,835 (-') 8,97,06,5
Movement of produce inside or outside the district has not been takem into consideration while estimating this net balance. Th~s ba1ance of fue1wood requirement is met from unrecorded squrces including trees in private land.
As the forest exists in sca"ttered patches and is uneve;nly distrl..butec+-p the vi11ager~ can not meet' a11 their requirements of fuelwood from iJle forest area a1i)ne and have to depend 02l sources outside the forest.
The average outturn of timber am p01e calcu1ated from the yield from forest for the 1ast three years, has been approximately 12,24,9 mJ 'which can be taken to be the present yie1d fro~ the forest. (Volume of' p01e = .07 mJ )
The wood ba1ance is shown in the--f'011owing table. (l'Ji.thout taking into consideration movement 91' produce inside or outsid~~the"district).
Annual. consumption of ' wood in. mJ Total. for ' annual House Fprni~ Agricult- Industr-consumconstr- ture ural imR- ial use.ption uction. lements: in mJ
4,,585 1,02r958
Net yield
in m3
Bet bal.ance
in mJ •
demand. The yiel.d of wood is insufficient to meet the
£.. perusa1 of transit passes of various ranges in Purulie inci:J-cated , the t some amount of' wood .~as brought from Raiyatl land for consumPtion within and'outside Puru1ia. The f01lowing was the average quantity produce of various categories moved for one year:-
Firewood in ~3
7144
Timber in rn:' 2773
;Poles & coggins in m:1
1 J11
Total in m::J
11229
Thus annual yield~ of' wood 'from Rai.yati land is approximatel y 24.95% of yie1d :from forest, land. As the tranSit-passes are generally taken ___ only wben ___ there is movement of .forest produce along motorable roads of adequate distances, it: is reasonable to expect that no
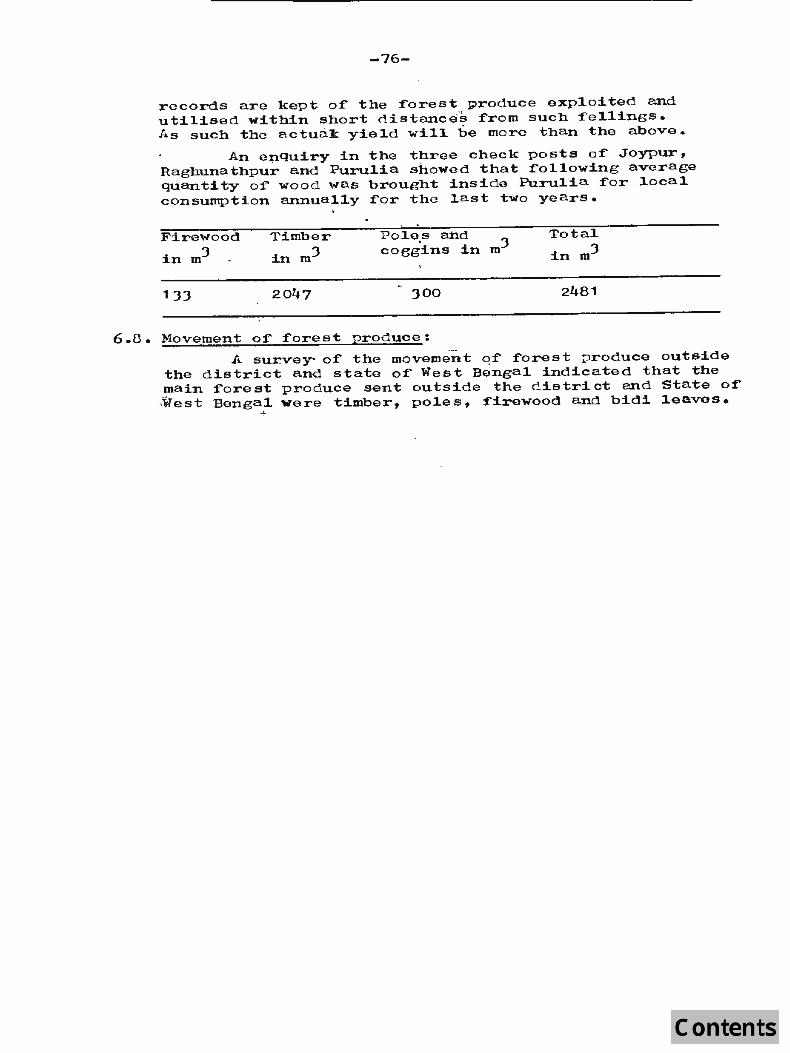
6 .. 8.
-76-
records are kept of the forest produce exp10ited and uti1i.sed within short oistance;"s from such fe11ings. As such the actual: yie1d wi11 be more than the above.
An enquiry in the three check posts of Joypur, Raghunathpur and Purulia showed that fo11owing average quantity of wood was brought i.nsid e Puru1ia f o r 1oca1 consumption annually for the last two years.
Firewood Timber Po1e.s and m3
Total
in m3 in m3 coggins in i.n m3
133 2047 JOO 24.81
Movement of' forest j2roduce:
I ... survey- of the movement of forest :;::'lroduce outside the district and state of' West Bengal indicated that the main forest produce sent outside the district and State of' ;West Bengal were timber, po1es, firewood and bidi 1eaves.
-!-

~ • .-1 ~
=' "t::l
ell -.-I .-I e ~ <t-I o ~
=' o flO J::
• .-1 o ~
(J> (.)
.g o M Po ~ (I) (!)
M o
<t-I
<t-I o ?>
+> -1"'1 +> a =' 0-
(!) . "c +> rn
• .-1
(ill ~
0.-1 ~ o
..-!
..-! C\I oeo <t-IO\
o ~
lI"'\
C""\QJOOO~ 0\ ~ \.0 lI"'\ C\I C""\ C""\ eo C""\ lI"'\ ... ..
0\ \D 0 C\I 0\ ~ C\I
,.. \.0 ,.... 0 ~
~ .~ 0 ·· ~ g .. ['-. lI"'\ 0 ..-
. c::J N
,... ,... ,... ,....
,-...
• ,-... E-< -C'"\ •
• E ~ rn o ~
I •
I
I ·'
- I
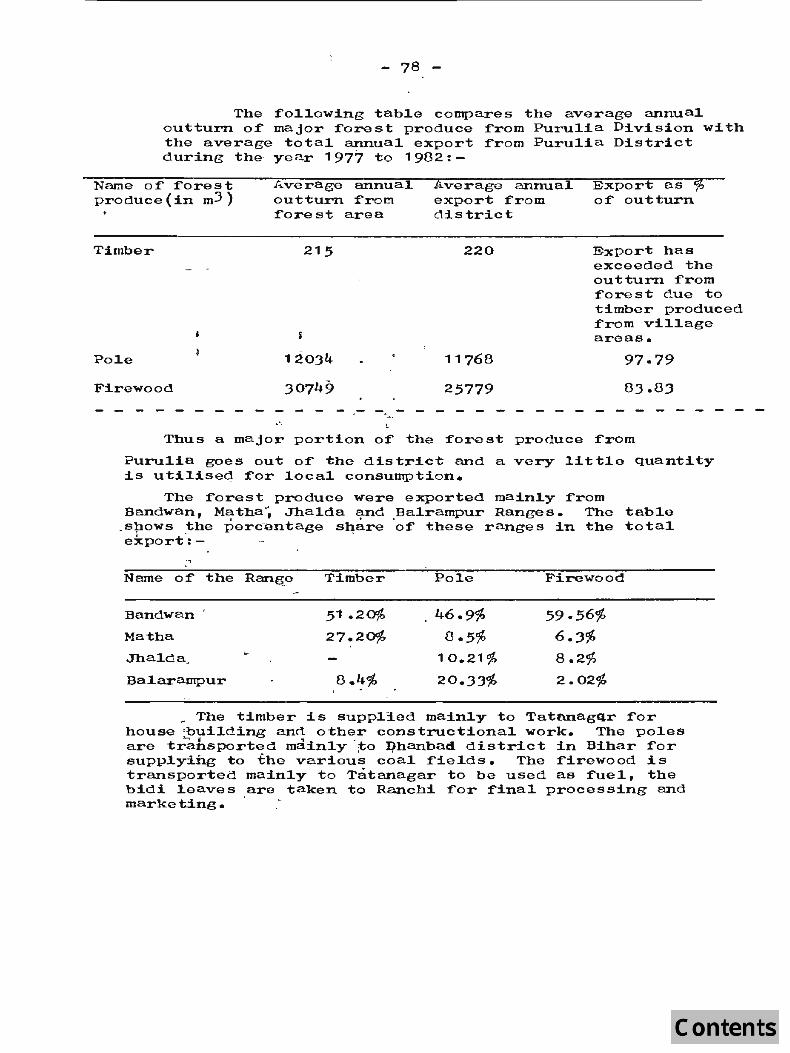
78
The ~ollowing table compares the average annual outturn o~ major rorest produce ~rom Purulia Division with the average total annual export ~rom Purulia District during the year 1977 to 1982:-
Name of' forest produce(in m3 )
Timber
Pole
Firewood
Average annual ou t turn f'rom f'orest area
2 1 5
Average annual export from district
220
11768
25779
Export as % of outturn
Export has exceeded the outturn from forest due to timbe r pro duced f'rom village areas.
97.79
83.83
Thus a major portion o~ the forest produce from
Purulia goes out of' the district and a very little quantity is utilisoq f'or local consumption.
The forest produce were exported mainly f'rom Bnndwan; Matha~ Jhalda and Balrampur Ranges. The table
.shows the percentage shlire ·of these ranges in the total 1 ·· .
export:-
Name of the Ran6.e Timber Pole Firewood
Bandwen 51 .20% 46.9,% 59.56% Matha 27.20% 8.5% 6.3% Jhalda. 10.21% 8.2% Ba1ara mpur 8.4% 20.33,% 2.02%
~ The timber is suppl1ed mainly to Tatnnagar ~or house ·~uilding and other constructional work. The poles are trahsported mdinly·~o ~hanbad district in Bihar ~or supplying to the various coal fields. The ~irewood is transported mainly to Tatanagar to be used as fuel, the bidi leaves are taken to Ranchi ~or final processing and marketing.
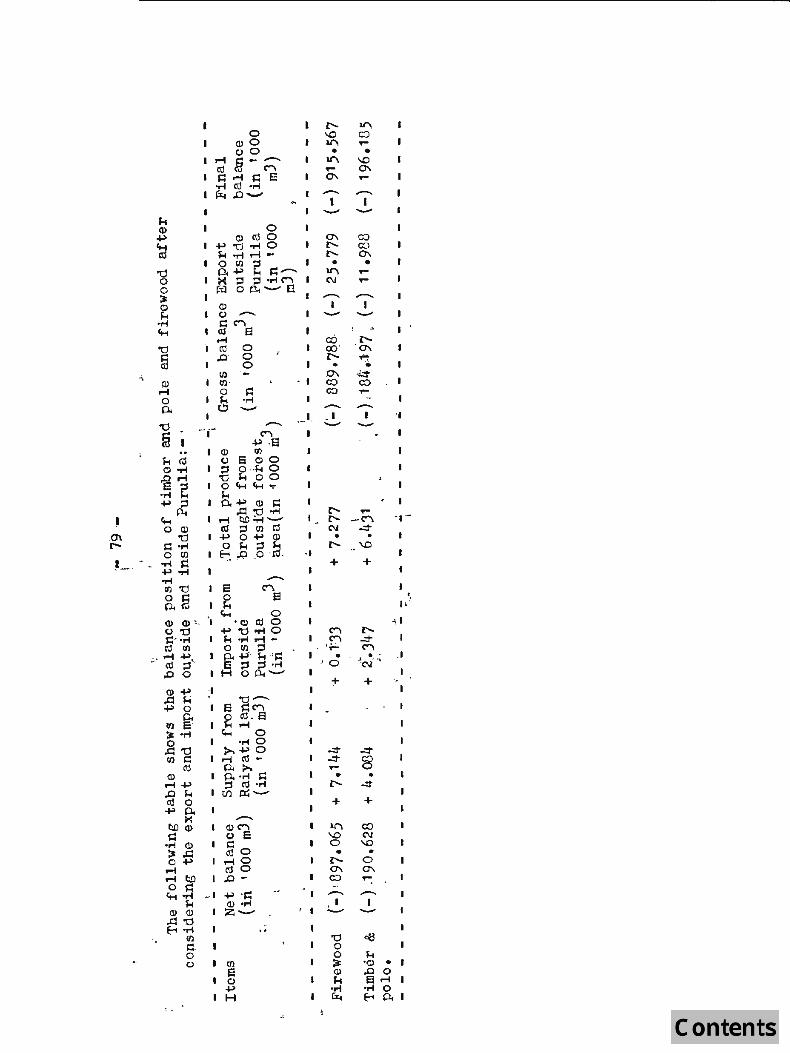
...-...
-e C"'\ g e c,... 0
o W to 0 10)"0 .... 0
1 M oM .-t -o Ill. ='
.1 o.~' M -' I=: e ::s ::s 'M IHOp..,-
.......... (l)C""I (,) e aO .-10 ro O .0-
_ 1 -10) '1=: <ll oM z -
..
, 1
-- -
-I ---
---
co CO 0'-• .... ....
...-... I .........
-I
['- -['- - C"'\ N ...::t • •
l'- '\0
+ +
C""I ['-. C"'\ ..::t-
'p. ' C"'\
.' a ~cJ·;
:t- +
..:t
..:t .... •
l'
+
.-
• ..:t
+
co C\I '\0
• o 0'\ """: --ca M
'1
1
.1
"0 o o ;;t Q)
"0 • I .0 <J.) k ..... rz.
a .... 'M 0 E-4 o.

- 80 - --
6.9. Conc~usion:
It thus appears that there is a big gap between the demand and avai1abi1ity of: firewood, timber .and p01es~ The supp1y from estimab1e and recorded sources fa11s considerab1y short of demand. Whi1e it is expected that the demand of firewood, timber and po1e is met to a considerab1~ ::extent from unrecorded· sources like trees from ' private land; some portion of the demand is a1so 1ike1y to be met from il.lJici t trade' of f'ue1wood and timbera

- 81 -
CHAPTER-VII
ECOLOGICAL CHANGES J',. N) STATUS OF FLORA AND Ft_UNA
7.1. Degree of d·isturbance:
Record shows that the forest of Puru1ia has been subjected to' repeated and severe mal.treatmcnt. The origiria1' vegeyation of dense ane. 1arge sized trees of Sal, Pea-Sa1 etc. have giVen way gradua11y to open forest containinb mainly pol.e crop. The proportion of Sal has also gone down appreciabl.y.
Record of 5th and 6th century A.D. shows that the country around Talk:upi, an important place nea·r Panchet was full of dense gung1e and ferocious men call.ed savans. Brahmanda section of the Bhabhishyat Purana compiled in 15th-16th century A.D. indicates that Navabhumi which comprised Manbhumi was overspread with impenetrable forests of Sal and other trees. The forest was extensive consisting chiefly of Saklote r Arjun and Sal trees. These were playgrounds of tigers and bears.
Forest being under the private ownership of Zamindars and their tenure ho1ders were managed according to the whims of the managers. Unregu1ated Zellings of forest for profit resulted in rapid denudation of forest. Unrestricted cutting of jungl.e for cultivation and improvident land use further depleted the forest. The private forest came under the control and management of the forest department graduall.y under various acts like Inc~ian Forest Act, Bihar Private Forest Act, Estate' .•.. Acquisition .A.ct of Bihar and subsequently of' \-lest Bengal.. During this tranSitory period the private owners caused further depl.etion to tho forest in order to reap the final profit and, in some cases, to spite the Government. Following the vest~g of the forests with tho department,
. ..... _ ..
the rights and privileges of the poopl.e, which were provided earl.ier, were stopped. The demand of the loca1 population increased with the rise in population. The stoppage of' rights and privil.eges brought hostility and non-cooperation towards the forest and forest staff. People continued to extract their requirements of timber, pole and fire-wood from the forests surreptitiousl.y. The depletion of forests continued unabated. The subsequent denudati.on
aocelerated sbeet erosion which ddteriorated the site qua~ity of the area.
The earlier forests were predominantly of Sal with associates of various miscellaneous species commonly found i.n Chotanagpur belt. The common associates of Sal. were Mahua (Madhuca latifolia), panai(Cleistanthus collinus), Kend (DiOSpyrOs melanoxYlon)~ Sidha(Lagerstroemia parviflora ), Galgal.i(Cochlospermum gossyPium),Pea-Sa1(Pterocarpus marsupium) Rahora(Soymida fobriguga), Kusum(Sch~iechera trijuga), Palas
II' ".. # \ ,' .... _

- 82
(Buteo. monospermum), Souli(Nyctanthus arbortristis), ~rjun (Termina lia arjun), Haritaki(Terminalia chebu~a), Asan (Terminalia tomentosa), Bahera(Terminalia belerica) Chekalta (Adina cordirolia , Semul(Bombax cciba), Gamar{Gmelina arborea , Bhela Semecarpus anacardium), Pial(Buchanania la ti!'olia) etc.
7.2. Quantitative and qualitative assessment:
The present surv'ey has indicated that Sal is concentrat'ed in the diameter class of' less than 20 ems. Stems of sal above the diameter class of 20 cms. contribute only 0.56% of' the number (d' stems 'in the sal stratu~ and 0.2<>% of' the same in the miscellaneous stratum. It was also seen t 'hat except Madhuca latifolia, Terminalia citrina, trees above )0-39 cm. dia. class is absent in sal stratum which contribute only 0.25% of' total stems. In, miscellan~~us stratum trees above )0-39 em. diameter class are mainly Boswellia serrata and Diospyros,melanoxylon Which' contri.bute 0.29% of' the total stems in the stratum. Thus large size,d trees are slowly disappearing and the existing crop is mainly of pole si'ze trees. This is further indicated by the distribution of plots according to size classes.
Distribution of plots according to size class.
Predominant Less than 1 0~1 9 20-29 )0 .... 39 Mixed diameter. 10 cm. cm. F cm. cm. sizes
No.
% of
of plots 53 35 6" 1 12
occurrence 49-5 32.7; " .5.6 0.9 12.)
,Thus 82.2']& of the to,tal area 'contai.n crops with eve ,rage , d~ameter below 20 cm. - .-- '
The contribution of S,ai sterrts/ha. i.n the, ,StU" str,a::tUhl is '57.92']& and the I same:' :in the misce'ilaneous stratum is 8.61% which in(jicate that the domin~ce of, sal. in t;he area. , is slow1y: l'oosing ground.
1,'he-':-inf-luence, of 'biotic6 :ractors is eyident from the following tables Showing incidence of grazing, injury to crop anq. fire damage.
Grazing incidence.
Type of' grazing Heavy Medium Light No grazirtg_
No. o.f p10ts 48 37 20, 7 t% of occurrence 42.9 33 17.8 6.3- .'
Areas where gra~ing was absent was found to be only 6.3% whi.ch ,is mostly located in areas away from habitations.

Type of injury
No. of plots % of occurrence
- 83
Injury ,to crop.
Pest damage Girdling & felling for encro..,. ac hr.1en t •
1 0.9
Illici.t No. felling injury
eo TI.4
26 23.2
Only 23.2% of the area showed no incidence of injury. 72.3% of the area showed injury due to biot;ic factors ...
Typ e "0 f" f" i re incidence
No. of' plots % of occ.urrence
Fire incidence
Very heavy' . Frequent Occasional No fire
2 1 .8
34 30.4
Thus 54.5% of" the area suffered no incidence of fire but the balance areas showed incidence of fire ranging from occas~ional to very heavy.
It is thus seen th at the influence o~ biotic factors is profound in the project area. The' presence of Sidha .
.. (Laserstroemia p a rvif'lora), Parasi (Cleistan thus colrinus) in appreciable number indicates a retrogression of the vegetation and approach towards drier con9itions. This is further indicnted by the presence of' the following herbs and shrubs ' Which were found during field inventory:-
Bantulsi (Pogostemon plectranthoides), Kalmegb Andrographies panicu1ata), Karmacba(Cassia opaea), Lantana camera, Dudhi1ota{Ichnocarpus frutescens), Indigof'era spp., Smilax macrophy1la, Nyctanthus arbortristis, Woodf'ordia floribunda, C1erodendron infortunatum etc.
Occurrence of weeds:
39% of ~he area contain weeds of moderate ~o very denSe quantities which is again indication of' the poor ·site quality.
Presence of weeds Very dense Dense Moderate Scanty Absent
No. of' plots" 9 13 22 32

-84-
Tho"adjacent populati.on of the forest area consist mostl.y'of'tribal people whose culture, li~e ' style and religious ceremonies are centred "(ery nruch rourld the f'orest. Gradual dep1etion of' f'ore st f'rom the' area l:lave led to a socio-economic imbalance between the tribal population and the forest. The annual. hunting ceremony i.s continuing from age ol.d days. W'i th the increase in population and decre ase in f'orest capital., the i.mpact of this ceremony on the forest is becoming more and more pronounced in recent years. The de$truction of' forest Which take pl.ace during this hunting ceremony has al.so become a matter of concern. The f'o11owing table which shows the number of' tribals gothered during the festival and the animals hunted by them gives an indication of' the problem:-
Year No .of' tribals No. of animals hunted assembled. Barking vJ:lld Pea Jungl.e Rabbit
deer. boar. fowl. fowl.
1982 20,000 3 9 :3 20 23
198) 42,850 6 15 2 10 2
Source: Record of' D.F.O., Purulia.
Total.
58
35
There are ~bout 4 res~ent elephants which move in the f'orest of Bandwan Range. A f'ew migratory el.ephants f'rom Dal.ma forest of' Singhbhum district of' Bihar also visit the area during the rainy season in the month of' September af'ter the paddy transpl.anting is over. They return to their original. habitat after harvesting of paddy. The el.ephants enter the fiel.ds in search of' f'ood and damage f'ield crops and dwell.ing houses. The Forest Department has to pay compensation to the local }":i::Ll.agers for these damages. The compensation paid to the local people over past three years has been as fol10ws:-
Year
1980
1981
1982
Amount of compensation paid.
Rs. 29,.565/
Rs. 10,490/
Rs. 4r],900/-
No. of' people compensated
Ji35
520
667
other animals f'ound in the area are IT..oopard-, I Indian wolf, Hyena, S10th bear, Barking deer, Wild p~g, Benga1 porcupine, Langur, Squirre1, Common Indian Hare, Common Fox, Jack.~. The common bird popu1ation consi.sts of Peafow1,
Jung1~fow4. Fruit bats, Orioles, Drangoes, Common Grey Tit, Shrike, Bul.bu1s, Bub1ers, Minivets. Hoopee, Egrets, Storks, Owls, Partridge, Doves, Barbets, Fl.y Catchers, Swif'ts, Sunbirds, Maynahs, Cuckoos, Pittes, Bee catchers, P10vers etc. Tiger, Which was once common in the area, is now absent.

- 85
A proposal has been submitted to the Goyernment :Cor esyablishing a wild life Sanctuary called it'Mayttrjharna Abhayaranya" comprising of a part of forest in districts of Bankura, Purti.lia and r,1idnapo-re, l'occ>te,d in the comn1on boundary 'between Purulia, Midnapore .& Ba11,~ra near Kumar:i:-Kangsa'l::>ati reservoir. The tract is well fQrested " with abund,ant ' water ' resources.
Total area 'containing two ,core areas, the corridor and the closed area in the fringes is' 162.981 km2 out of which 46.724 km2 falls under Purulia Div:isiori. This 1'fi1. d Life Sanctuary when estab1ished wi1l go a long way i.n preserving the hah!. tat· for- locp,l .. :f'auna who se population has now depl.eted to an alarming state '.,

86 -
C HAP T E R - VIII.
8. PHOTO-INTERPRETLTIO~l AND REMOTE SENSING STUDIES.
No aerial photograph or Sate11ite imagery was
available for the District. Hence it was not possible to make
a detailed analysis of forests with respect to Geographica1
distribution, area computation, quantitative or qualitative
assessment of growing stock based on photo-interpretation
or interpreted imageries. The total area assessment has
therefore been made on the basis of the figures supplied
by the state Forest Department. Assessment of growing stock
has been made on the basis oC enumeration data.

.... 87 :.-
, C H t_, PTE R ..... IX.'
PLliNTATION t.CTIVITlES;. ·IN THE FOREST ANn URBAN i>REAS . . .. UITH SPECIAL REFERENCE TO $09I1~L FORESTRY
P1antation activities in the ~orest anct urban areas with specia1 re~erence to socia1 ~orestry: , ;
" A1though Puru1ia Division came into existence in 1956,
a~ter merger of erstwhi1e Manbhum District of Bi.'"har with' West Benga1, p1antation activities, in serious and sustained manp.er, begun on1y f'rom 1961. Prior to merger of the <;1ivisiori" on1y a f'ew misce11aneous p1antations were raised on some tsca~tt~reid b1ank areas. The majority of' the foreat areas· ... were' under the "priv~te ownerships of Zamindars and their Ghatwa1·, tenur~ ·r ho1'qe~s ~ and, private estates who consi-dered 10ng term investmentsin p1antation activities fUti1e, and, ;~er!.it8'·· . interested 'in co11ect~ng :qui'c~ and maxim~m prof'i ts, the f'ore'sts continued to be manaeed undeJ;' th~ coppi~e system
-which required nii,niOlUm 'iiiaintenance and lll.vestment. P1antatiol.l:.activities which . continued iduril)g the period" took p1ace witl'l~h the Governmen,t forests which werii comparative1yI g ood f'or~st providing ':11. t .-i).e 'scope f'or 1arg~ sca1e p1.antation. 1:..1tbough the .. private f'orests haa." -a1ready reached considerab1e st'age of degra'ctation and in~iudthlGb1ank areas which cou1d ibe p1anted uti -prof'i t a b1y, p1a nta'tion ac'tip;i tl.es continued to remain in a very sma11 sca1e in such ~ore sts. -_
. .' ~~
Ti11 1960 the tota1 ~e'a-of_ p1antations raised in 'the . divis:l.on was on1y 599 he. The species' p1anted were a11 miacel1aiieous.. From 1961 onwards the p1anta£ion ac't_i vi ties wore .increased and species 1ike sa1, teak: and Eucalyptus were a1sq "t 'ried besides the 'misce:llane ous species. The. :fol1owing 'give~ ' the P:r;'o~~ss of 1 plantation upto tho y e ar 196Ij.f - .
'., ~rea of', Area of various p1a ntations r a ised in h e ctares P ro g ressp1a ntation Sa.1 Teak Euc~1~.tus Misq,011.aneous Tota 1 :l,ve tota1
.J ' J . ';r in h a •
Upto 1960
1961 219 5~_ .
1962'" 214_58 ... _ - --...
1 963 9 -1~:~, , '. -., . 1964 10.5
~ - - -
LJ}--
55 .
.599 182 '~'
--
14
254
- .. ~75'_ .- - - " ;';';" . ...
';599 4.59
388
32.5 '
4~5
... .. 1 '
::'
~) 599 1058
1446
1771
2206

- 88 -
Sal plantations were raised along with other miscellaneous species but survival of sal was very poo_r, only miscellaneous species like minjri and sonajburi etc. survived. Tbe p1antations of sal gradually declined and was finalDy abandoned in 1964. Planyations of Teak raised. from 1961 onwards were sucdessful_ ," but suffered excb6nsive damage' due to ilricit fellings. From 1967-63 the miscellaneous forests of-Matha, JlIalda and Balarampur ranges were clearf'elled and uprooted in the foot hills of' Ajodhya and thereaf'ter converted to Teak plantations. BarabazarBandwan areas have also beon found to be good areas Por raising teak. The up-to-date plantation area under Toak bas been estimatocl to. be. 3000 ba. The total p1antation ~aised by Purulia territorial Division ti11 1981-32 was' 40)0 ba. Tho progress ·· of pla ntatiqns from 1979 to 19U2 has been as fo110ws:-
1979-80
1980-81 ~ .: •.. !
1981-82
Area. of ,plantation (in ha. ).
682
1157
2092.
T~us ·the ' plantation activities h~ve i~creased steadily over the years fr.om 1979 to 1982. The above plantations included pla ntattdns raised under Social Forestry and Farm: Forestry:' where seedling s.were distributed f'ree of ch~4e.
'The pla~iation programme ,.of" Purti1ia terrilboriai j )
Division during 1982-83 un~er o~fferent scbemes is as f'ollows:-
,~~, '
Scheme Industrial D .. P. I.T. ~;<?.hedul:e pl~ntation A.P. D.P. C'a's'te "
tcotitpo'nents
DANIDA, .so c i al I.L.O f'orest
_
project try
Farm Total :f'ore·s-
/~fea o~ plantation (in ha.)
i- _.
500 1 00- 225 5,' 0
, , 'try,' ' : _i- .
120 1000 ,2689
- 'O~ •. _Y:~d~~ - i.n<;lustr;ia1-;-p-l~n_tat_~on quick growing species l.ike Eucal.yp'tus .and Akashfnoiti ar~er being plant.ed pr-imRtrily to meet the requirement of' pu1pwood. Under D.P.~f:.P •. t . ..'._I:.T .. -D~P., Scheduled Caste c·omp6hent ·schemes the pl.antations raised arc of' species wl;lich have 10ca1 economic v?1U:es and .rural industry potential. 'li.ke Mahua, Kend t Kusum, Sal, Peasa1, Asen etc. Stress has been given on deve10pme nt of fodder resources, cultivation of' other mknor forest produce and Tassar host pl.ants.
D;LstributiQ:p. of' plantations raised from other departmenta1 scheme :f'~om 1979 to 193) is as ~o11 ows;-
Name of scheme 1979-80
D.P.A.P. 682 ha. I.T.D.p. Schedul.ed Caste Component
1980-81
1157 ha.
19(31 -82
2002 ha. 180 ha. 100 ha.
1982-8)
1570 ha. 225 ha.
510 ha.

- 89 -
The over-exploitntion and mismanagoment of the erstwhile private forests in the past had r.eached such a state of degradation that in majority of the areas 'the forest ceased to. . exe:I7cise the:l.r main pro.tec·ti.ve function of' reducing soil. loss th~ough"surfaoe r.un .o'£f'. l .. s such considerable areas in tho district 01' :?urulia came 'to be"af'fected by soil erosion. The West Bengal Flood Enquiry C9mm'i'ttee formed in 1959 f'ixed top prior1. ty in tho' ,schemes of' affprestation ancl soil conservation in tho ·upper catchment of' Ka~~sabati river, in the catchment of Ajoy, Mayurakshi and Damodnr river wi thin l"lest Bengal and in the catchment of Si1.abati am Darakeswar. The long ··term ameliorative, measures contemplated were to provide adequate vegotative c.over i.n the uppe'r ':catchment which are at present denuded and to :1.ritroduce sci.entific land use in the middle and lower areas. Thus large scale plantati.ons of' mainly Eucalyptus and Akashmon1 ·were ra.:li;ed in the upper catchment of Kangsabati. river be~innine i'rom 1964-65- under the supervi,sion ilIf' l{angsabati Soil Conservation Division. The upper~catchrnent of' Damodar river was also planted up with mainly Eucalyptus and Akashmoni since 1966-67 to 1979-80 under Panchet Soil Conservation Division. 'fhe;' af'£orestation- wO,rk i.n the catchment of Kangsabat:l. river c;:<?~t:l.ntied with vigour after setting up another Kangsabati Soil Conservation Division in,.1965-66. ·All these d:l.v:l.sib~1jI had their headquart~rs at Purul.if!lo .. The foilowing tabl~ gi.ves. tl,te areas of plantations.rai.scd by these clivis:l.ons :
Divisl..on
, Kangsabat:t'So:i.i Conserv.?tion-I.
UP:to . 1 980-81
9,690 ha.
Kangsabat:l. 5.0:1.1 10,199 ,ha. Conservation~II
Panchet Soil Conservation
9,412 ha.
1981-82 1982-83 Total.
860 he.
-11 ,,870 ha.
368 he ... · . 200 ha. ~ 9,980 ha.
The:;>e .. p;tantations are: howev~ib, hai.ng damaged, through i11:l.cit ,fellings 'doric by -the" 1.0 cal popu=!:ation. The extent of' damage caus~d' 'by 'j:llici. t f'e lli·n6 :l.n recent years i.s -ind:l.cated in the following table:-
Area urider Period of' control of' damage
Puru1ia Division.
, , 1981 -82
to 19B=?-83 ;.
Kangsabat:l.-I 1980-81 i -:,.._1
Kahgsabati-II
to 19132-....a3 "980-81-;
to' '1982-03
288.6
1550.00
2981.67
Average area Remarks in ha. damaged ih a year
516~6
993.8 ;-
Source: '--Chief
Conservator Of Fore sts, "lest Bengali Forest Economist.
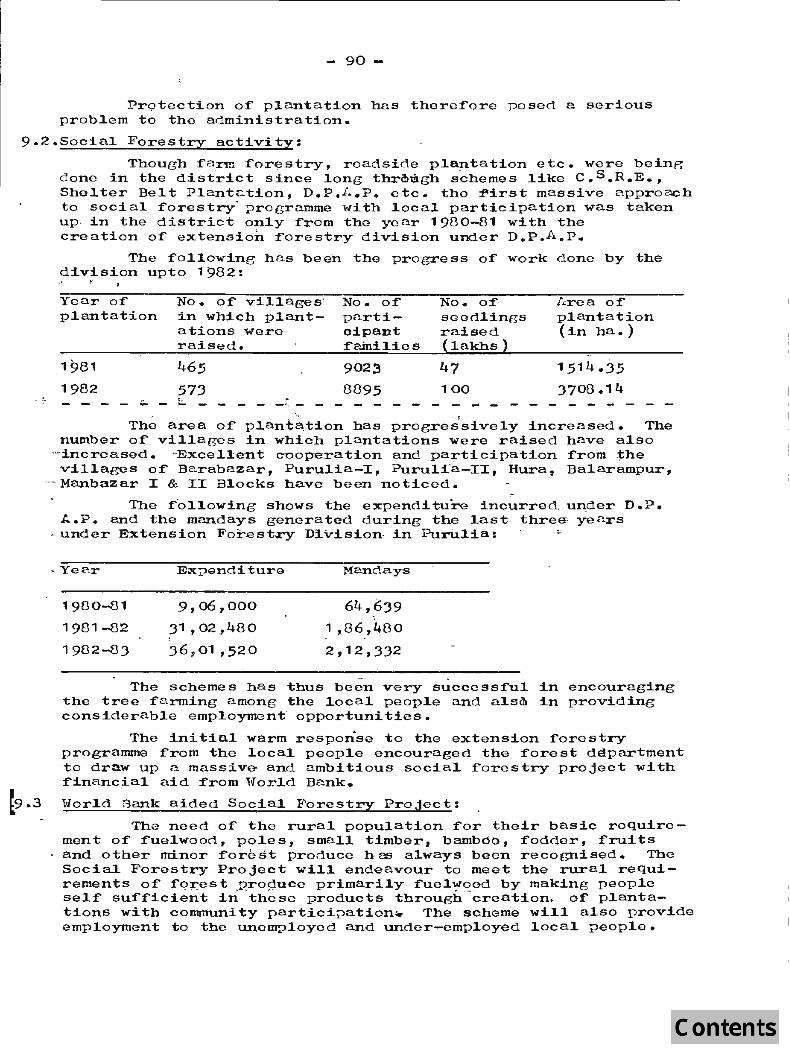
- 90 -
I'rQtection of p1antation has therefore posed a serious problem to tho administration.
9.2.Social Forestry activity:
. ..
ThouGh farm forestry, roadside plantation etc. we re beine done in the district since long through s'chemos li.ke C .S.R.E., Shelter Belt Plant~tion, D.P.J~.P. etc. the first massi.ve approach to social forestry' programme with local participation was taken up· in the district only from the year 1980-81 with the creation of extension forestry division under D.p.A.p.
The following has been'the progress of work clone by the division upto 1982:
Year of No. of vill.ages' No. of' No. of /.rea of' plantation i.n which p1ant- parti- seed1ings plantation
ations were oipant raised (in h a .) raised. fainil.ies (laIms )
1981 46.5 9023 47 1.514.:3.5
1982 573 8895 100 3708.14 - - - .;;.. .l;.. - - - - -(. - - - ... - - - - - - - -
Tb~ area of' p1ant~tion bas progres'siyely increased. The number of vi11ages in which plantations Were raised have also
"'"increased. '"Excellent cooperation and participation from the villagas of Barabazar, Purulia-I, Puruli"a-II, Hura, Balarampur,
.. - Manbazar I & II Bl.ocks have been noticed.
The f'ollowing shows the expenditure incurred. un,der D.P. ~.P. and the mandays generated during the last thre~ years
> under Extension Forest.ry DI.vision, in PurU~ia: ,"
. Year E;x:penditure Manctays
'980-81 .9, 06 ~ 000 64,639
1981 -82 31 , 02 ~480 '1 ,86,480
1982-83 36,01 ,520 2,12,:3:32
The schemes has thus been very successful in encouraging the tree farming among the local people and alsm in providing considerable employment' opportunities.
The initial warm response to the extension rorestry programme from the local people encoura~ed the forest ddpartment to draw up a massive- and ambitious social forestry project with financial aid from W'orld Bank.
19.3 vlorld Bank aided Social Forestry Project:
The need of the rura1 population for their basic requirement of fuelwooct, poles, small timber, bamboO, fodder, fruits and other minor forest produce has a1ways been recogni.sed. Tho Social Forestry Project will endeavour to meet the rural requirements of" f'<?z:est _pr09uc~ primari1y fuelwood by making people self' sufficient in these products thr01.igh -creation. of plantations with community participation. The scheme will also provide employment to the unemployed and under-employed local people.

- 91 -
. - ._ .-The s~heme envis~ees to raise p1antatio~s in ~arrow
1inear strips a10ng roads, rai1, canaD. banks, on t~e.av~i1ab1e river banks, embankments raised for protection of agricu1tura1 1 ands, tank ernbankmen ts; on w~ste l.ands(. owned by p~ivate individual., state or 10C3l. vi1l.age communities and on institutional. lands. The scheme wi1r a1so cover p1antations<on degraded Governme nt. £orest 1and. Pl.antatfons wil.]' be raised by the Forest Department in a11 Government 1and and p1antations in the private land wil.1 be raised by private ind·ividua1s for which seeq1ings wi11 be (~.istribute·d from 'departmenta1 nurseries. ,Cash :incentives have been provided. :t:or growing tree-s -'in private 1and •
. :. Fast crowing species with Dnl1tipurpose uses producing fuel.wood, r?01es smal.1 timber,"1eaf' fodder, fruits etc. Pref'erab1y \1i th strong coptdcing power wi11 be p1anted for work:!:p.g., in short rotationS which wi11 i~ ensure .. repaated ' f'1ow of' ben9fit!3 within a comparative1'y' short . p~riod o.f' :t;:ime •
. ' ~! ", : i J~ « ; , ._ ~ It is e.etima ted th at the fo1l.owing "lands wi!.]. be
avai1ab1e for the above scherne._in Puru1ia.:· • • _ .' ., t r -: r _
Land c1assification
1,~ - l i,,,,
Uncu1tivab1e waste 1and. Current fn1iow ', Other · f'a11 ow Cu1tivabl.e waste Cul.tivated 1and Home.stead. Road side Tank & Tank bank Ifi:vers and Canal: banks.
t:..rea in ; 'Percentage potent.ia11y Total. area hectare; · avai1ab1e for ,, ~cia1 ' ava:l.1ab1e
'Forestry., f'or Socia1
"
29700 (30
19320 75 18320 f · 50 89330 25 ~
. , :1 , .j .
Forestry in bar ..
,"
2)760
14490
300011 5
9160 223,32 15000 .. '12)" 2' 24640-
9240' ' r
10700
'-:37Q4
,," 5 10 10 10
: . .,. I'
' -,
924 1078 370
Degr,aded f'orests to be rehabi1i tated
88346
20000
100346
Tho primary objective of the,project is to estab1ish - 93000 ha. of' p1antations in 16 districts of '\-Test Benga1 inc1ud
ing Purulia to supp1y (i) fue1wood (ii) p01es, bamboos, sma11 ti.mber, fodder grass, frui.ts" oi1seeds and other species and -(iii) al.so to generate emp10yment. Tll~ir target in West . ',' Bengal. and 'in Purul.i.a ar~ as ,:f'o11ows: _ . .
J .

Name of planting
Strip planting Farm forestry Reforestation 01' degraded forest. Village wood lot
Total:. '
-_ 92 -
- - - - - - - -Targot in West
- - - -20,000 'ha. 52,000 ha. 15,000
6,000 ha ..
93,000 ha.
- - - - - - - - - - - -Bengal Target in
Purulia District - - - - - - - - -
455 ba. 11,500 ha.
4,600 ha.
160 ha..
16,71 5 ha. ---r- - - - - - - - - - - - - - - - - - -
--
Strip plantation wil1 be· raised in linear strips by the Social Forestry wing in Gover~e~t land remaining unutilised at present. The people' f'rom, tlie ne,:i..ghbouring village's will. be entrusted with the :responsib:ility of protection in lie,u of right to co11ect fuelwood etc. Under vi11age wo9(l lot" demonstration p10ts of 1 ha. in every ,~il1age Pancbaya1J'wi11 be raised to show the benefit 01' community forests and" to" encourage subsequent pla:p.tation programmes ip c9mmunity land. under the Panchayats
-initiative. Farm l'orest will be raised on privately owned .. waste , lands and Government w~ste land tak~n on private '1ease. For this purpose free segd.ling-s-wrll be distributed part1'y wi.th ca,sh
._-incent:ives';- Degraded fore'sts wi.ll. be rehabilitated througb replariting wi. th qu~ck growing tue lwood species ano' a;lding :. ro-e stab1~shment of the naturai crop through coppicin~, t,end:f,.ns, . and r:igid protection. 25%01' the produce will go to tbe villageers 'free of cost.
E:f':f'orts will.. be made to motivate as many small f'armers and landless farm l.abourers as possib1.e f'or rai,ping tree farms .. The manaGement and protection of village wood lot and strip , plant'ation will be handed over to Village panchayats at 7th iuid 8 th year after recovery of direct co~,ts. _ The 'following has been the progres~_of' work and-'-tlici" t-titure programme of Social Foresw:-' :..
Year Village Farm Ref'ore-station Strip Total. wo,od lot .. 'Forest:1" of degraded j?).an-(1n ha.) (in ha. __ forest(ha. -t:in~
. ":~ . t .
. i'
1981-82 10 232 500 742 , - ~
1 982~83 20 1122 108 219 1,479
1983-84 1400 90 :' '234 1724 - - - - - - - - - - - - - -
The total programme of' socia1 f'orestry is the refore increasing in the district. The targets f'or village wood lot and R.D.F. have registered a decrease. This is because the demonstration plots of' 1 ha. yield negl:igible benefit to an individual villager and as such the motivation is less. The R.D.F. programme is being carried out mostly under the normal forestry operations. As the locations of strip plantations are littl.e isolated from villages, the community participation has

-93-
been l.ess. The results of farm forestry programmes have, however, been very encouraging. Peop!e's participation and interest in the programme is increasing steadily.
The fol10wing shows the percentage of area worked under various Social Forestry Programmes in the district in rel.ation to the total. target , in the state:-
Year
1931 -82
19[32-83
1983-fl4
Vil.lage wood lot (in percen-tage) - - - - - -10.25
5.60
- - - -
Farm forestry (in percen-tage) - - - - - -7.99
17.64
12.58 - - -
Reforesta- Strip Total. in tion of plan- the dis-degraded ting trict i.n f"o re s t s (% ) (in %) % - - -8.74 8,06
5.48 12.02 7·513
2.85 6.96 9.4 - - - - - - - -
The share of" the Social Forestry Project in Purulia so f"ar has been on an average 8.35% of the total programme of the State·. The' comparative shares of the programme in Purul.ia and Bankura and Midnapore to the total programme of the State are as fol.1.ow s:-
Year Midnapore Bankura Purul.ia (in %) (in %) (ill ~)
- - - - - - - - - - - - - - - - - - - - - - -1981-82 28.4 21 .. 48 8.06
1982-83 9.1 10.8 7.58
1983-84 21.4 21.76 9.4 - - - - - - - - - - - - - - - - - - - - - - - - - -
The reason for 1.ess layout of' Social Forestry Project Fund in Purul.ia district is that a lot of" Social. Forestry works of' the district is already being carried out througb D.P.A.P. programme.

1 O.~
- 94 -
C H t.. PTE R - X.
RESULTS & CONCLUSIONS
Main results artd conclusions:
Unfavourable c1imatic cofiditioris ~nc1uding erratic rainfall, coupled with poor conditions of so:11 and its nutrient status, have acted as impediments in the progress of the agricu1 tural economy of· Purul~~_. Pis:trict. The indus trie s .in the distr.ict are smal1/cottage and . mainly artisan oriented; per capita irtcome is low. .
L-' sizeable population' earn auXiliary income through cuI ture cof' lac and tassa:r~ and ' through co1lection and trade of minor. forest' produco '1ike bid leaves, sal seeds etc ..
, F~rest, .next to ag~iculture~ is the m~jor land use ~n the district •. Approxi:mate+y .5172 :ha. of forests have been con-vort~~ into agricultural land during a period of 10 years.
Poverty of' the increasing population and the great demand of' .ood~have been the main causes of' this recession of' f'orest _and forests Have been severe·ly mal-t:_reateci.
Rural population, wh~ch constitute 81% of' the total population, rely considerabDy kn the ~or~.ts f'or:meeting their needs of timber, fuelwood and other mdnor f'orest produce. Development activities in the forestry sector provide consider-able employment to the rural popu1.:a.t:lkn. .
, ,~. .. .' Only about 37.38% of' t~e.,total fo~est area,contain
pre~ominantly sal crop; the balance area contain pr~dom±nant~ miscel1ane'ous species; scrub land, open "area and plantat:lons.
• • 0' r:-. . ~-
1'.pproxima tely 10263 ha. of." forests h_ave.' becD.IlJ.e degraded out of' Which 8624 ha., is sal forest,. whic:h is ~25%: of'. the tota.1 sa~ fore st. ;,
The total growing ·stock of." the' di'strict 1.8' 1707564 013 and the average stems/ha. ~s 386. The volume and stems are concentrated in 5-1 9 cm. d.b.h. c1a·sses. There ~s a ' great dearth of ~trees above 30 cm. d.b.h.
The annual consumption of wood by local· .people far excee~s the annual yield from the forest. The net demand of wood per year ~s 69% of the total growing stock of": Purulia district. Majority of' outturn of .forest produce f'rom the forest are taken out of the .distri.ct t~·: nie~t the -de~ands o'f' co1.l.:l.eries and also transported to indus;trial towns like T~tanagar whore the dem~nd of' f'ore.st produce is. great. At presen;t the demand of' the' loc~l people is met partly from the trees in private land and lops and tops of' trees kept af"ter operation in ·the fore'sts inc1uding il.licit col1ect:lon. The wood brought into Purulia from outside the district is very little. The annual consumption of firewood is 11.97-,900 mJ
'·which constitute almost 90% ot: the total actual annual consumption of wood.
- 95 -
Providing protec tion to the :fGrests and yOurl{5 plantations have become very' .. diff'icult. Social Forestry Scheme has shown encouraging results and 108346 ha. of potential area exists in Purul ia for implementing So~ial Forestry activities.
EcoloeY of the regi~n has·b·een-great1.y disturbed due to maltreatment of forest. The popUlation o:f fauna of' the region have a1.so been greatly 'reduced Ql)._~..; . .:::tp the d,isturbance of: their habi:tat.
. .. ;
10.2 Final recommendations and proposals:
a)
Lto
d) ... ~ i
The 'forest .of Puru1-ia,.is in a bad shape. The r'osources have been greatly depleted and t~ey require 'careful. conso1.idation am subseqUent tmvrovement.· ~t i.s recommended that adequate attention be paid on. correct demarcation o~ boundaries' and in :finalising the correct status of the forests .;~ Immediate steps should be taken to con.vert u.S.F~ areas into P.F. and subsequently to ReserV"e fore s:ts •.
It is a.lso recommended th at the forest.s be managed inte~sive1.y for meeting f:l.rst the requirements of' the local people e Impro'Vement ·of stand·, composition and stocking of the forest :is to be achieved through proper siTvicul tural: operaiifi·ons •. .f Protection mea~,_u'es o.;re to
'be intensified. . 1
The 'per .hect·are yie1.c\' of forest mus.t be increased through imprdvement of ·existing coppice 'crop, ·and by plantation o:f- quick growing specie s :for meeting the demand of f'Uaiwo6d etc~
.. 'the ,~dema.nd of the papula t:ion can not be met, alone f'rom '·the Lforests.. Villagers must be- made self Sruff'icient in their requirements of' wood through social,forestry
;schemes. Qu:i.ck grow~ng specie~, pl~tad closelly in land outside the f.orest can be -~arked at .5 years rotation f'or provid:ing' f'irewood~. . The thrust L of" the Social.
• Forestry activities shoul.d be directed to the areas , neighbouring f'oresi>s where the population are more
dependent on forest f'or'·li.veli.hood. Social :f'orestry activi ties' shou1ci be! t 'arge-tted :in small units of convenient groups' of v:i1-1ages, from ' where the::- tote1 demand o:f -~orest produc;~., .:fo;r . cons~mp~ion and trade, shou1d be. ,'assessed and ,the programm..~ :Cor the unit oriented accord:ing1jr /achieve the ·t.arget. The programme should bo imp1.emented-in ;a11 avail.ab1c land e. It wi11 ,_ also be neces sary to asse:ss in d.e"tai.ls ··t.he ~oci avai1-
. ab1e from private .1and lying out,si;d~ .. the' :forest area in order to pl.an futu:t:'e , programme,s 9F e.x.:.p-l0~tation. Support can be prov:lded by the Forest Depa~"tment in
.r ,or€?anising trade of minor forest proctuce and set.ting -, ,"l;lI? of processing units under cooperati.ve bodies. This . w~11 :improve the economic rlonrlition'o~ the 1oca1 people, ~"specia11y tbe tribals, who 'will. receive beibter price
for the minor f'erest proctuce, "('lue to; elimination of intermediar:l.es.
- 96 -
e) Under tho existing system a very sma11 portion of tota1 outturn of timber, pole and firewood from forest, is be±ng consumed by the local people. The export of forest produce from the district must be controlled. The uti1isation of forest produce must be properly planned for moeting tho demands of the local people.
f) Llternate sources of fuel should be developed in order to reduce the demand of fuelwood. Community biogas plants Should be,_ encouraged. Other s ources of fuel such as Coal, Kerosene oil should be readily available, even in rural areas, if required at subs~diBed1rates.
g) Efforts are to be made throuch wide publicity to achieve 10cal cooperation and mass scale participation of people in forestry activit~es and for protection oC forest by inculcating tree conciousness and love for the forests.
h) Due protection should be provided to the forest and local fauna by strengthening the administrative set up.
i) The proposal for creating 'Wild Life Sanctuary containing part of Purulia District shouln be expeditiously sm ctioned.
l .. s the district of Purulia lies in a drought prone area, the scope for improvement of the agricultural economy is limited. Hence forest has a major role to play in improving the economic and social life of the local people. A large portion of the forest of the district is being cut by the local people at a much shorter rotation than what it should be. This, if allowed to continue for long, may threaten tho very existence oC the forest in the district. Forest Department has taken some steps to save tho forest from forcible destruction, and for improving the stock and quality of the forest thrau"gh massive planta-tion programme of quick growing species. It is, however, felt that the problem ~s too big to be contr011ed by the Forest Department a10ne and the Whole Government machinery must work together for the protection and preservati&n of the forests otherwise the achie vement may not reach the target which is aimed at. Cooperation of local people in the matter is also essential.

- 97 -
BIB L IO G R 1. P H Y.
, • Hast Bengal Forests Centenary Commemoration Volume - Forest Directorate, 1964.
2. ~ report on Industrial Potential Survey on the district of Purulia - l"'est Bengal Consultancy Organization Limited.
3. Forestry in West Bengal - 1.n appraisal 1977-1982 Forest Directorato, 1982.
4. Key Statistics 1980 of Purulia District, District Statistical Officer, Purulia •
.5. D.,P./. .• P. Reports of Government Of' Hest Bengal, 1981, 1982 & 1983.
6. Ground water development potential of Purulia District, West Bengal - Central Ground Water Board.
7. Social Forestry Project, West Bengal, Forest Directorate, 1980.

ell 't:l o tJ
+ o o ..-I
00-. 0-. 0-.
I 00-. 00 GO
0\ t'-I
o C'--
-0-, o I
U"\ o
00000000000 U"\O U"\O 0 0 11'\0 U"\O 0 C'--ONII'\U"\ll"INON01l"\ • • • • • • • • • • •
11'\ ... 000 ll"IN ... 0 ...... ...
I I , I· •
00000000 001J'\lt"\0lt"\1I'\lt"\ OO['-C\lONNN • • • • • • • • ...... 00 ... 00\0
I . I • I , I
t
o o 11"\ .. 01
00 00 00 . . '1:-'-,..-
o 00 It''\ 11"\0 N N It''\ • ••
NIOO
I
o ll"I N .. o o o 11'\ •
1..-
000 OU"\U"\ ll"I [', N
0-11'\ N • o
o o ll"I
• • • OnO .t I .:
I
00 0 00 0 00 0 .,. . N'~ ~
o o U"\ • o
o U"\ ['-
• _I
0000 If\U"\1J',0 ['-[,-NO · .. . . ['-00 ...
00 00 00 . .
I
o IJ'\ N • o
I 1
I
o ll"I N •
10
00 If\0 NO • •
0..-
o o o •
I I~ I If\ ....
00000000 o IJ',ll"Ilf\O 000 O['-C\lNOOlt"\O • • • • • • • •
O'\..::t 0 C""\..::t C\l .... ['-
· o
o It''\ N • o
o ll"I N • o
o ll"I ['-
• o 00 00 11'\0 • • 0 .....
o It''\ N • o
c""\ ... N
000 IJ', U"\ U"\ NNN • • •
C\l00
000000 0 01J',U"\0lt"\0 0 U"\NNOC\llt"\ ll"I • • • • •• •
... C\lON ... ['- N
o o o •
['-
n
I I I I
'0 -+" s:: o (.) I I I

r' '1
~ .-. C
.J
i 000000 0
0 It''llt''llt\V'l00 ° ...c I . 0 ['- C\I ['-(\111\0 11\ I. eiS ..~
" • • • " • • • • ,oP C\I 0 .... ("'\00 0 " 0 "0
f; .,... C'Ii C"'\ 0
f-i" ..::t I
'cA..
0 0 ..- t I J ,-
t .1 I ,.
00\ ~ L 0\ 0'. '. •• I I I
I I i 0 0\ \ i CO CO
-I '" 0 !.['- 1t"\ ~
'1 I '"I C'Ii I 0 •
:.". t' ... 0
'" 0 0 \,() 1t"\' ,- 1t"\
. I I C'Ii C'II 0 . • '-0 0 I; 0 •• '. - I
• '" 1-. 0 0 :J"\ It''l 1t"\ , . .~ I C'Ii ['-
IS ° • · (.l l<"\., 0 0
"1=: "" 0 ~!~ 11\
"!-"I I C'Ii 01 · 0 •
I 'J <J). . ..::t 0 0'\ til (J) I1l 0\ ,0 0 0 I Itl '" 1t"\ 0 I It\
:-I I C\I It'\ C\I 6 0 . · •
C"'\ 0 0 C'II t M
" $Ig; 0 0 0 11'\ 11'\ 11'\
Q) l C'Ii ['- l'-eo . • • <tlN 0 0 I '" \01"11; •
0000' 000 Q' 0 0'\ 1I'\lt\01l'\U"\00 11'\ .... C'Ii ['-ONC'Ii 11'\ 0 C\I
•• .. . • • • • • • 0 NO.,... It'\OOO CO ..... .... CO
0 0 0 0 1t"\ 1t"\ U"\ 1t"\
'" C\I ['- C\l "
['.0 0 ~. • • I '" ['. '" CO
If'\ .,... ... '" 0 C\I ' I~
........... "1.0 "1.0--- ... Ol'-COlf'\ ...........
CD , ·\ It''\o .... -o 'd ,_ U"\ It''\ [Ij 11'\ ........... 0 to.._."._.. en 1t"\ ... () ~ ~ , () to <tl O-lt"\
:.1"1 r-i i=:-+o:> <tl It\
'E . l M.E 'r-! ~ h-~a>. M C> ;:..ro
<tl f-4 '~CU -+0:> e p..,o ~,) .c .1"1 0 0 :; ~
C> .b()()-+O:> ~ '1"") <tl e >. ::!- -+0:> ro ro ro <il til i'< '1"")0 0 s:: ·ri ·ri '1"1 'ri 0 f-I
r-ir-i r-ir-i I1l til \0 U) ttl ro ro ro :::J ::!-<D I::: s:: s:: S::.t:1 .t:1 ttl ·ri ·ri 'r; ,1"1 -ri o.~h (.l e e e e » C> C> h M h L .. ..... ..... 0. C> C> C]) (') 'ri ·ri of.)
U) 88 E-t f-< NN 0

·1
+ o o .., &~I \ ~ f.
00"\ 00 CX)
0"1 [' I
o ['
0\
'f ! :.g
....
o 0 C'"\ 0\ \.J:) C'"\ \0 0 C'"\ \0 It"'\ N It"'\ 0 CO C'"\ CO N 0\ 0"\ \0 C'"\ ~ \0 0\\0 I' N It"'\N 0\\0..- CO ~ 0\ 0\ l.t"\\O C'"\~ I' \0 N \0 ~ ..-[,N~l.t"\Olt"'\~NC'"\~COCO~"-N~CO~~l.t"\NO~
C'"\ ..:t co . . . . . . . . . . . . . . . . . . ~ . . . ..
C'"\~O~O_OOO_C'"\_Nl.t"\C'"\Oo\~_NOO_~ .-
• \0
I a 1 I J , I 1 I I I J
I I .. .._i • ... ,. .. ,. .
I, I I I I
I
". ' I 1 .1 • ,I • I
C'"\ C'"\
\0 '" ; C\1 C\l • • 00
C'"\ \0
jN '. o C'"\ C'"\ '-0 \0 C\!N • • 00
I
C""'I \0 N • o
C'"\ \,0 C\! •
10
C'"\ \0 N
! •
I I I 0
\0 C'"\ ('"\ N '" \,0 It"'\N N •• • 00 0
1 1
1 I
I I
('"\ C'"\ \,0 '-0 NN • •
100
\,0 '" C'"\ ~ 0 n", N ... N It"'\ '-0 0\ \,0 _ C'"\ C'"\l.t"\ON~NC""'\\'o
It''\C\l co e"'l't0"l O\~ It"'\\O C-CX)CO-C'\Il.t"\
·n \0 C'\I .. . . . . . . .
.... 0"':' OOO..-N • • • • •
N ..... mO,_ •
I · 0
.1
I. ; I
\() C""'I N \0 I.t'I ('It • • o 0
'" C'"\ C"'I (\I ('\I C\l\,ol.t"\~ ~ It''\NO CX) co • • • • •
I~ 00_ ~ ''_
0\ o t
I. O· 00" c.-\ • .• co C""'I'-O
C""'I \,0 N
l.t"\ CD \0
'-00\\0 0\ O\~ ... C""'I co l.t"\ C'"\ \0
Q) '0 o '-l
'8 III
I~
CI) I 8 ~
I = CIl Q) .... ()
w p~
Ul
11"\ l'- C\l • • • '-O~O
• o • C'"\
•••• C'- ....... N • - C'"\ ~
I I , f
f . I
'1
C'"\ '-0 C\l ..
10
C'"\ '-0 C\l •
' I 0
0\ l'~ ,. ....
C'"\ l.t"\ o • ,_
1
'I I I
I '1 I
n \0 N
C'"\ C'"\
'" '-0 (\IN . .. 00
• o

1 .-I o .-I I
+ o o
, t~ . ~~ I 00\ CO CO
• 00\ z:--. z:--. I
'0'. \0
1 o \0
\0 C""\ C\l \0 U\ C\I • • 00
J
I:
"
coO\OO'\O\C"'IC""\O'\ co \0 0 ('...:f' \0 \0 11\ ..:f' .......... lf"IO\C\lC\lO • • • • • • • • O\C"'IC\I ..... COOO,..
co ,.. '.' .:::t
~, .1 I i
i~ , " ~;
' 1.111'1 1
"
I •
V' I ./ ~.~
.;-'
I , j
1 I : 1
1 1
1 I
;
C""\ \0 C\I • o
•
.. ". ",".
C""'I \0 (\I
0\ MN
I <il, I ~O
I <l1 C\I
'J a
I
.... 0\
~-
<l1 '0 o ()
'0 § <l1
8 ~
I 0 < .-t
l 0'. o I
If''I o
f '~~ C\lN If''I It'\. . ..
• I ' , I o "
(1'\ : ' \0
( ' C\I / I " r ,"1 ,0 ;' .,1 ;)
\0 Mi:· . '" 0\ C""'I C""'I C""'I
I I 00
C\I \Cl. . -- , 1 ..." t-- 'z:--.. 11\", If''I \0 If''IC\I , 'lr'Ilf"IO,O C\I .. ._,.. .'-.... : .. _. "-' 00 'I _ r ..... '·,:.:' ..... 0 I " .
co_ coco ....::t I.t'\ . .. 0'\_ co ,...
\0 0'. co ..
'. 9
l
\0 0\ \0 U\ C\l\oNCO It'\ C""\ at'\ \0 • • • •
ONOC""l
I
!
, I
1 I
'I
I ' I, ~
/ I
\0 C\l If''I
1 • . , 0' I '
I \0 \01 .0 C\I C\I / 0\ 1t'\ If''I .1:"-•• • 00 0
cocoC""\M 11"\0'.\0\0 ,_' co C\I N • •••
C""I('.OO ,..
I I
' I J
\0 C\I 1t'\ • o
co ....::t 0\ ..
, , C""\
1 •
f
C""I \0 C\I .-.0
I I
C""\ C""Ilt\ \0 \0 \0 NNN • • • 000 ,...
• f r .
I
, [
I I
I I
I I
I I
I I
C""I
! ! ~
C""'I\O\O \OC\lC\i C\llf"I lI'\
.. .. 0
000
co 'f", o
.! 0 ' I
C""\..:f' \0 \0 C\lC\I .. ..
10 I.t'\
,.. o o
I I It\
/
\0 C\I at'\ • o
\0 N It\ .. o
C""I \0 C\I • o
r '\ "'.
I
• o

N CD .-I .' :
. 1
.-4 cj ~ 0
8
I·
••
0 ... I,
OtO-0... 0...
I 00... 00 co
0... )"" o· ['0.
0\
0-. o I
ll"I o
I
\0 0'1 N l'-
'" '" • • 0_
I
. i I
I I I
I I '
'.
I I
C"'\\O 0 '" NC\lO'IN n '" l'-...;2" • • • • \00, 0 C"'\ ...;2" N
I I I
I I
I I
. I' " I
. I ;.
• ... • ... \0 \0...;2"
.... NC\I\O C\I IJ'\ It'\ N • • ••
...;2"OOll""\ l i . I
.. co 0-. (,;() .. l"-...
nO \0 ['0. C\I n • • 0['0.
I
I' I
J
\0 o
C"'\ C""\ ['0. \O\OC\l~\O C"'\.- o...C'IIco NNlI"Il'-..-\O\O\O..::t.-.·."'C"'\<\I0C"'\00.-
00",
""' 'D N .. o
, .
.'
1
1
.. • ......
I
I
C"'\ \0 C\i • o
\00 N 0'\ '" ['-. . . 00
0"",,,", C'\ It'\ \0 ['-.ON . .. . 0 .... 0
• • .. • • O ... C'II~l'-
'" I
1 I~
I I' I
1
l'-
0-. (,;() l"-.. o o co '" •
""' \0 C\I ... C"'\N ...;2"\0 \0 ll"IOO .... • • • •
l'-Jo .... cp
C""\ No-. ~g.~ • • •
ON....::t" -
TO"
I
..-00 0'\ • ['0.
n
'" I
I J f J
I
C"'\ \0 N .. 0
.. .... J o
..::t" ..... o •

" ,....
o (I)
z o H
t
~ -.'
Ul en -<
-"'..:I '0
~
~ A
~ ~
(/)
~ o re -(/) . .->:t Il=I
~, ['<0. " L, .
o ~
J-t0'l cPN +,. I <li0 EN ('j ,~
80"\ "....
Cf.l <l) ·rt u
18. 1(1)
I o .-
~~O~~ro~~O"\~~~O'I~~O ~..:t 0'1 <'Il 0 N ..:t r-- \0 ..:t ..:t..:t ['- N C\l 0\ ~~\O[,-..:tro~~O~~~~['-ro\O . . . . . . ... . . . .. . . . . OOO"....C\I..:tOWOlC\lOOO,.. ..... ..:tO
• • •• I f I I
o ..:t' ,....
~ ..:t ~, '-. . -4< • • J
• I 0 ,'" ," ,. i. ' I . J .. of » • ..
-",1.,;.:.'
'. ~ 11\ , ..:t ..:t ~C""\ • •
.00
~ 11\ ~.11\ ~'C""\' C""\..:tJ 00 0 C""\ • • • •
.... ,...."....0'
It'\~Olt)1I\C''"\ ~..:::t O\~ N 0\ t""'It""'I\Ot""'IOC" • • • • • • oooo ... t""'I
. " . .,. . .
. 1.f'\0\ , C'"\ \.0 00 .. .. .-N
co ~ ... .. -g
.. ..
I ' I. , . 1
I .'
~ ..:t .~ ' • '0
~ ..:t ~ ..:t 11\ O\..:t ".... ..:::t ~..::t C'-N~ t""'I
.. t""'I~['o. • " o " .. "C\lO
0 .... "....,..
1 I
. . ...
If
1 I
I
I . ! I
I .
I '
I ,
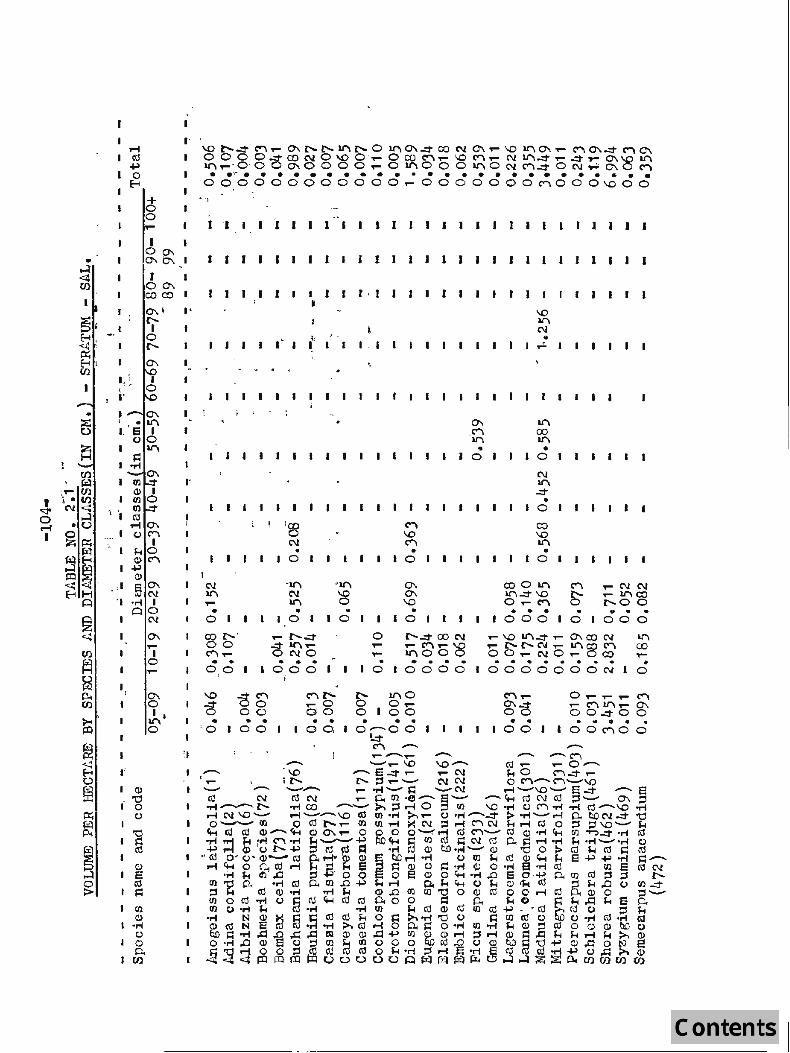
• ~ ~ t/)
I
I 0", ",0-,..
J o '" enrol
'" i I' ra o l'-
I
"
I ~-
"
,..... I
o ,.....
~
1~1
rJl Cl)
I -.-I CJ o.l p., 00
'f
.. ,
I
I
J I I
N Il"'\ ,..... • o
t
CO l'-' 00 C"'\,..... • •
0,0
<3S 00
• •• '0 1-00-
leo o N • o
'Il"'\ N
. 11"'\
•
I
•
I
I
. I
. 10 10 ,
,..... l'-.::t ..::t ll'\ .... ONO .. . . 000
("\ l',....,0 00 . . 00;
I J
J 1 1 I
r . I
I
I - I
o ,..... ..... . o
s-O
C'""t \0 C'""t • o
~ ~ \0
• 10
l'-..::t CO N ,.. ("\,..... \0 ll"IOOO · . . . 0000
ll"IO 0,.... 00
1 1
\0 U"\ C\I • , ..-
0'\ 11"'\ .C'""t CO Il"'\ 11"'\ " . o 1.0
N 11"'\ ..::t •
10
CO \0 11"'\ • o
coO 11"'\ U\..::t \0 0,.....("\ • • • 000
• J
· o
,.....C\lN ,.. 11"'\ CO t"- 0 0 . . . 000
.... \0 li"I..::t ,.. 0'\ CO C\l ,..... t"- l'- C\l ,..... 11"'\ eo C"'\ 00,.. C\l0 .... OCO
Il"'\ to ,..... . . . . . . . . • oOOOOOON o
• • 00
0,.....,.....,... C"'\ ,.... C"'\ U"\_ 0'\ 00..::1"00
• a • • • 00<""\00

+ o o 'i o~
'l'0\ I~~
0\ O.
l~
C> 't:l
1 0 o·
I. rJl Q) .~
o (]) P.
UJ
,
I .
I J I 1 I "I
" • I ••
'I
'T'
e' o N
, I
r , . r '-0' ..,..., . ~,
I I
I ,
0\ o ~ .. o
N •
.,
•
~: ,I ~
,... · o
o (""I' o N ,... N · . o 0
\0, C'"'! C'"'! • o
• o
..
['. 0'\ I.t"\ '" CO, '" 0 C""'i~ ..::t '-0 0 ' N ' O'i ..... 0(""1'000\0 · . . . . . . • 0000000 '-0
O' N ,... ". o
U") N ,... • o
! N,' II i"t-
C\I '" N N .. .. o ~
i I
! I,

• •
1
'.
I.
1
" 1 o o 4
0\ ~ N
co Nro 0\ nO 4"N,.. ~OO
~~N~~b~~_~O~~~~~~~~~~_m ~mO~~~4.0.,...~~~~_mONoo~~n-~ N~ONOO.,..00.,..m4_N~OnOOOooO
.. 1 ~ •••• • ." • • • • • • • • • • • • • • • • _OOPOOO?OOON900QOOOOOOO • o • o • • • • 0 .... 00
I
+ o o r- I I J J , I I '1 ·1 I I l ~ 1 1 J I 1 I I I I I I 1
I I 00\ Q-\~ 1
I , 0 Q-\
COCO
N\o Oeo
1 "V\,.:t .' . 00
V\ o
.!
I I i
C""'I \0 .,.. ! ..
I
I I I I I \
I .I
L I
1 ,
. :_ 1
n 0\ If'\. ~_ <""I'
C""oN <""I • • • ON 0
..::t \0 .... •
0\ ..-C\I: • it ~ I
01 10 10 I I I o
(])
'CI o ()
.'8 ro
~ co
0\ .-I
o 1
p~
~:: • • 00
..:t C""\ .,..C\! 40 • • 00
:g~~ 000 • • • 000
'" "'" .... • o
<""I W"l N .... N .... •• • 0010
N 00 ° 'eo ~..- \0 N ~ C"'\..:;t 0 CO.- C"'\\O .,..OOOOO .... N
'8 ~l .... 0 • • 00
~-co C""\ .... ~ 000
• • • • • • • • • • • • • • ••• 00000000
~ o . I I 0
00000 01000
..::r N o • o
ar.ro C"'I ~ \00..-("'\ 0000 . . . .
100CO I.
M C""o N • o
l:'N ..• o
· o
\0
~ • o
C""'I ..:t .... • o
0\ <""I o • O~
o 0\ ~ · o 1 I
co C\I: eo 0\ C""'IO\N..-0,.. 0 0 • • • •
0000
~ o o •
>'..
I ~
0) (]) ;~ () (])
0.. {"'l

, lo .-I I
I'll CD
+ o o
I 00\ JAo--
'1-00\ CO CO
I 00\ ['. ['
I'll 0\ UlC"'l I'j I .-10 () C"\
S-t0'\ CDC\! -1->. 0)0 eN
I Q "P'40\
~"i o ~
I'll CD
01"1 () CD P.
(.')
8-I
I.t"\ o
""" {,CO ~ C"\ N ... 00 • • • 1000
I I
"
' I
I
i "
i'
I
f ·
..-~
'I i..-, .
1.,0
,1 , I.
['. cb' C"'\N 00 • • 100,
t
1
I' ,
C\! O..::t co O,C"'IC"'I ..::t 0'\ ['. [" co IJ"'I 0
0 ['..-C"'IN_O • • • • • • • 0000000
l ,
I
,...['. 0\ ['. ......... . . 00;' . ,
['. N ..- I.t"\ <""'I COCOOC01!'\ 0 ..... ..- .0 a • • • • • 00000
C\l C"'\ .::TO . r-- ,..
• • 00
C\l .... ~ • o
I·
• :0
~ N • o
-g N I •
o
, I ,
Ii i
co {'['O \O'-OC"\~ 00..-0 • • • • OOOQ
1 J
, _
" I._' I. I.
/ I,
• • 00
,... •
0 .1
I.t"\
~ , . _
o
Oco lI"',CO 01t'! • • ON
Oeo ~O 00
' .. 00
• I,' t,
I , ,.,... 1
\0 .,... IJ"'I _. o C"\ co C"\ • .1 .... I
Oeo
-88 . . 00
CO 0'\ C"\ C\! ..... O OO..::t • • •
0..-0
I I . .... . ...
,I
... ~ 0\ . o
co co '-0 N\ON 000 ••• coo
0'\ C"'\
'8~ • • 00
~ I
, _.
• • I'
• I . .. ~
I
• o

+ o o ;~
1 I • 0 0\ II 0\ 0)
I \ I 1 00'\ CO em
\ ;"
1-' ,
II
I
I (]) 't:I o o
0\ o I
tt"\ o
I -
~ co C""'I • o
tt"\
'8 .. o
I ..
'll"\ o o • o
I '. I .
l I
I-
I ! I
,
t •. I
. .
I
1 !
\0 ..... 0\\0 00 . .
..:::t 0\ ~ C""\..:::t ..:::t It; N ..:::t . C""'I ['. \0 0 If\ \0 0 0 ['.
0 ·. 0 0 O .'r"" N It; 0 ..... . ........... 0.0·-000<) .0.0 .....
[ ":"'1 ." . r. ..:.i . ....
I
J J t I J I
I
I ' I i II I, I
0\
'cg •
-g N • o
0\ C""'I N ['. ...-IN
• •
C""'\ N .... •
'I~ .1.100 00 o 00 o C""'\co'~ h .. ~ C""'\ ...• ..;to I['t I.f"\ ..... ..:::t N..::t COL- C"'\ ...... 0 .... C""'IO 0 IN . 0 0 . . . .. . . ~ . ~ . 000000 00
g; co ,.... ..:::t ..... <3 o o \0 C\l . • • • • o o o 10 o -
N U"\ co o C""\ C\I ..... .::..0
.~ .. . . 1000
C""'\ C\l Ol.f"\ 00 . .. 00 --
..-C""I Il'\ • o ,
N ..... ON Ol.t"\
• • 00
CO ..... It'\ ~O..::t o IN,.... • ••
OOtt"l
I •
I . 1
I ~
• • o 0
O..-N INOCO ONN . ... . . 00 ..... 1
8 o . o
\0 N z:-..
e -O
J
..... It'\ 0\ . o
• ll'\
° ['. ['.
• z:-..

•
0'\
~ f o , r:---
til (l) til 0\ tIlC""\
I •
I
I ro , I , .-i 0
,. (J C""\
J.t (J)O\
I+lC\l . (J) • a ~ I
"" o I , 0'\
I
~I
.... c! ,...
0\ o I
art o , I
(J)
't:I 0; ()
., ..
t ·
........ ~O\o~
.... .,...C""\O\COO\ 00 a O .. O"D
It\ 0\ 0\ N It\ C\I .... co ....
••••••• .~ • 1_ boa ,...'0 O' a 00
~'8 "!~
100
i I
, ..
.... It''\0 It''\ \0 M\O C\l' 1:'..::t C\I .... • •• •
1000 0
i ........ ..::tC\lO\..::t ........ nlt"\C"\C""\ 0000_..::t , . .. . . . .
' 00 '00'0'0; I I
,
co 0\ l:'('i 0 ..... • •
00
,.... co 1:' • o
I.
I ' .
If'\ cd..::t' ..::tNO\ 000 • • • qoO,
I
I 1
" ! I
0\ l'(\J
• o
I r
I!
N It''\
I :
I,
C""\ 0\ ll"\ • o
C""\ co C\I • .....
. .
I,
J
"

o o o
., '.
.6 o ... I 1 o 0'\ 'I' 0\1
00\1 co co
I
I I
'J I
0'\ • •
~ l'-
0\
0'\
'" I I o ll"\ • 1
"" 1
' I I
1 'I
.........
0'\' ..::t N •
l" . .-
\,0 0\ 0\ 0\ ..::t ..:t
• • C"i ..:t o C"i . .....
~O\O'\C"'I(\IO'\lt'\O'\coO\ C\I~~..:tNo\C\lO'\.::tO\ \,0 C\I C\I l'- \,0 ..:t \O.::t l'-.::t • • • • • • • • • •
COl'-r---O\r---~c:o..:t~..:t ...... oor---C"i C"i"'C"i ,...
I I I
I I I
I. I. • • . - • •
I I 1 I
I I
I , I . I , I
I·
CXl
CXl ..:t l"
11"1 N \.0 • • .
lI"\ 1:1 co .,
0'\011"\ ..::t l" N C\I C"'I \,() • • •
r---O'\coJ .- C\I
•
1
•
I· • •• .,... .... •
ICD -c 10
(,)
I , '0
IS:: c;l
I , (l)
IS
I~ IUl
CD tori
(,) Ie>
p.. Iv~
JO\ o
I .\,0
• IC\I
N ..:t
• • CO I'
• •
0'\ 0\ ..::t
• co..:t I ..:t \,0 n C""I
• l" ...
•
..:t '" 0\ lI"\ lI"\.::t r---No\C\lC\lO co \0 ..:t '" \0 '" • • • • • • IrlCO..:tCOCOO C\I C"i \.0
IrI
I
I 1
J
I I
I I
..:t 11"\ 0\ l'-C\l0'\ CO \,() ..:t •••
lI"\CO ..::t C\I C"i
I
•
I I
It"\ N '-0 •
CO
en 0\ It"\,... lrI\O co co\oNC\lO'\O\.::t ..:t co '" ,... 0'\ \C) I' .... ,."" . OC"iCOC\lr---C"i_ i- '" ,... C"'I 0 11"\ C"i ... .,...,...0
CO
I
I I • •
I I I •
lI"\ C\I \0 • leo
• co
lrI N
'" • CO
..::t r:--CO •
I lI"\ N
0\ 0-. ..:t 0\ N..::t • •
l"...:j.... C"i
• '0 ...,
I I g
1 ' I J
lrI • C\I ~ N. C\lN ", ... '-0 '" • • • • 00 ,r:--- CO
l"
(,)
• • •

, I .. 1
, .' -I co ..::r ..::r ..::t C""II.t"'oO"\O 11"\ t
I"- CO I"-..::t N N.::t \0 C\l
• • ..,f I ..::t 0\ CO""' ..-\oN~ 1"-• ." ~ • • • • .. • • • • " ~ I \0 C""\ at'\0\ ""' CO ir'.::t
\(5"
" 0 CO ..- N·,..... :.:t . ..- ""' .-E-t '. at'\ ~ CO 0 CO ..... ""' I, >+ ?-
0 0 •• .- J I I I I 00'\ 'i'; O'\l I I
o 0'\1
I , co c::J 1 " '. '. t i, Il(\
I
Ii 0'\
'I I
lJ I C\l , I~ 0 ":1
~ , , • ., ,,"1 11 ['. 1 , I- I I c::J
• -, I 1 ; ,
0\ • '1at'\ ~ , . ~ ~V\
• ;'1 N • N ., \0 \0
0 ' • , . • \0 , I CJ CO
I 11"\ ..::t
- 0- 'N ir' I.t"'o \0 CO ·1 • • 0 \ I CO at'\ ~
; I C\l I \
" 11"\ C\l
\ \0 1 · I \ 1. I I I CO \ , ,
I.t"'o 0'\ I N I C\I .::t N
...... '-0 C\I \0
...... • • •
...... ,.
\fO ['. ['., , . I : 1\ \ .- ; I
['-
til I Q) t-I
,11"\ 'at'\ ..::t ~ " ;
ell 'N .C\I 'z:-.. I ell 0\ \0 \0 CO C""\
I (OJ N I· • ~ J; .. 1\ .-I I IQO \0
I t> 0 N I C""\ C\I \ C""\
~ IQ,f-.. Q) C'J, ..::t'(;Q 0'\ 11"\ 0"\ ir' 0\ I ~ I ..::t N " ir'.- 0\ N..::t c::J 0
Q) C\I \0 \ co'.- ~\ONO'\ i lr\
~-~ I. • • . • • • . • .. > ,.
\0 l'-.. I.t"'o,.... ..::t i;:o l'-..::t . (. -..::t' -, I 'r-i 1. CC ['. NCO ""' . .~,.... ..::t" . ..::t I
~, 0 J,t - . . C""\ 'i -0
I ,.... .t •• 1:-. '. 1.- , 1 •• CfI , I
• \0 M ~\ i 0 ..::t 0 , ..- ,S <P '. CC
,,' \0 .,... ""' ..- ..::t • • • • •
0\ ..- 0'\ N I ..::t , \0 0 0\ ..... .,_ \0 " 0 I ..::t ""' \0 \0 ""' I.t"'o 0
0 -.. - ..... [' CO-
l!> 0 ..... 0 "0 I.t"'o~ 11"\ I.t"'o-0 rj -(f) -It'''\..-t> t> (OJ 0 ro-lt"'\ .... .-I-~ ~ nf If'\ "0 ~ :1 .~ .r-i H-
I !i3 - Q) .0 Q) ~ >.ro
Nr-I <l> e ~ ~.g ....t l'- Q) ~O ..-I (OJ
I!> ..::t.o t> ~, tl ....t • .., ~
e - >. ::s- O ro III e Q Q !.1l ·-CIl ;.< ...,0 8 ~ ;::I ;::I'.-t-..-I'.-i\o 'M 0
p. • .-ir-l\O..-.I....t ........ rJ) CIl\O 112 ~"OQOQruat'\I.1l;::l::s-Q) C\I H s:: lI'\ s:: s::- ~ ~ .cl II)
'M tl CIl ..-I- • .-t 'M '.-i p,. ~ H tl Q) tlE EEl s>' Q) Q) S ('is H ~ ~ N N .~ P- C) S::<U Q)Q) Q) ..... .-t~
U) UJ CI.lt-' t-'~ t:::< L~ L"" V I'

,... i
<"oJ r-I r-I t
• C\l • C"',
ts ~
(!
• I"
(.) III 'M S
I
f3 f"'!. ~ ~~, 8' W'
(/). fil· U) (/)
:s 0.
~
E ,
:E: ~ --A
@ ~ ,
(I)
~ ~ ... t.)
~~ p.. (I)
IX;
8 H
~ 0 0 0
Z H
(/.)
~
~ Vl
~ <>: E--< 0 8
I
( I.
J a.) '0 0 (.)
'0 ~ ro CD
I a ~
I ~ CD
.!"i o.
I c:> Po. V~
+ o o .... J
I .
r
o 0-.1 0-.0\ I I 00'
col
,...
0\ I 0
I , r ll"\ 0
1 . r ~ 'I
1 "I
J
\0 \0 C\lC\l \0 \0 • • coCX)
\0 C\l \0 •
co, •
~~, \0\0 • • COCX)I
C""iN ['.. If'\ ['.. N i
• • 0\ ['.. 'co 1...... '.,...10\\0 lI"\ \0 C\I \0 C\l \0 · ' .. lI"\ It''\ co ... at"\ C\l .,...
I I
I '
C\I \0 :11"\ 1C\t C\I \0
• • • co ['co ,...
I , . OC\l..::t\OCO\OO .... C"',lI"\OC\l['..C\lC"',\O
:.,... :C\l 'lI"\ \0 co \0 .... C\I • • • • • • • •
C"', ['....::t co lI"\ co C""\ \0 ..::t ' .... C""\. C\l' ..::t"CO
"0 : C\l '1.0
• co
.-1
I I
\0 C\l ! \0 •
0:>1
J J
I • I I
\0 \0 I\I N \0 \0
• •
, ! I ['..C\lC"I\O\O COCO .... C\lll"\ co C""'I 11"\ \D r--• • • • •
\0 C\l \0 !
• ..:rOC"lCO.,...ICO 0-. \0 0 i 11"\'
lI"\ N\:OO.::r '1.0 co lI"\ C""'I C"I ~ ['..['.. .... \0 • • • . • 1 0 co ..- C"I ['-
C\I It'\ It'\ ~ ['.. ,... C\I
• I
•
• "-....
C\l\O..::tN lI"\C\lOco C\l '" lI"\ C"I • • • • ['..CO..::tO ?- ' C""\\O!
"" .... at"\ •
I ' C"I 0 .... -
[' co [''0 '0 '0 [' ['..::t C\t C\t C\l ~co_\O\O\O • • • • • • ..::t lI"\ _ co co co
C\lC\lCO C\l ....
1 . I J
• co
'" \0 C\I •
11"\ at"\ .-
•
\0 C\I \0 ·
• .... 11"\
.g lI"\ • ..:r
("")
-
r • I
\0 C\l \0 •
co
"
• • • • '0 +> ;:::: o (.)
• •

0;
, ,I ,
+ o o ,... 1 ' o 0'\1
<t' 0'\1 00'\ err col
o "" ['0 ['0,
0'\
OJ "0
I 0 (.)
'E CO
~ CO
I ~
I If) ¢>
ON () Q)
C ·1 UJ
,...
- 1
I I
• 1
I.
J , C
1 c I,
I:. 1
.,... ....
I '
, I
I I
1 'I 1
\0 N \0 •
ex)
ex) ['0 ex)
• 1f\ N
\'oN~Nlt"\ (\J It'\ M &r\ \D \ON\OC\l.l' .. ' .. ,. 1:0 r--- r-.. ['0 0
__ ['0 ..... (\J
.....
- . ,I
J •
I' I 1
I I J
I . /"
'::.
NIf\ (\j ' '. ['. ....
I
c\lN ex) 1l"\ U"\ ['0. C'\IN ex)
• • ['0. ['0. ..- .,...
• 1f\ N
c-. N \,0 \D ,... ['0 C\I N ,11"\ It''\ \0 \0
• e ' ••
"" \,0 CO ex) Oro ..-It"I
I
I I
I
I
C'I.I ''',11''\
N · I ['0. .,... . .,.... 0'\ M •
0'\ N ,... ..:t \0 \.0 ""'NN 0\0\0 • • •
\.0 C() ro ['0. N
\,0 a;) .... Nl'C\I. \0000 • • •
CO U"\ 0'0. N 0'\ ,.. ,...
. I
i
\,0 N N C\I It''\ U"\ \,ONN • • •
00 ['- ['0.
Y"'!" .~
\0 \,0 '-0 C'I.I \.0 NN ..... lI'\N \O\O..:tC'\l\O •••••• ex) ro, \D ['0 ro
\0 ..-M
I. J
\,0 ,...
NN \0 &r\ • •
C() N ['0. ~
I
• • • • ~ = o (.)
• • • •

: I qt .,4 .-t
I
CD o
I fIl CD roO-.-4C\1
c,) I o
I M C\I (1)
+> (Ij 6 (1)0'\ .~ ..... A I o
I (1)
"d I 0
c,)
"d I ~
(Ij
(1)
~ I s:: I! (/.l
C1)
..-I I (,)
I \(1) p.. Ul
I
+
N'O ~N(X)O\\.QO M'\lt"'ICOat'\l'o_NC""I N l'o _ N co l'o \.Q IJ"\ • • • • • • • • [' _ co l'o.at'\ ['0 GO ....
.... at'\_ .... N'O -=t It', l'- N ,..
f
I J 1
,
.. I I- I
I I
I I
.. . <X) CO
NOl'-NN .... \,O'O ~ C""\,_ 11"\ 11"\ N N N N .... 0 ('IJ C'II at'\ '0 \.0 • • • • • • • • [' C""\ex) l'o [' C\l CO CO ..... -=tC""\ ........ ['. .... ....
....::r \0 \0 ..
I 11"\ -=t C""\ .... -
I
I .. .
.. .
I I
I I I I . . . . I
'" N
'" .. 00
J
I
.. .. . ., I
L
J
I
I I
. .
ex) [' ex) ..
1 C\l 00 11"\ [' N 00 ;
~"D 11"\ .C\l C\i -""
\0 It"'I ['. .. .. .. ;/. - .
l'o 11"\ I -N
l'oCO .... r It"'I
ex) ....::r \0 ['O('IJ ex) 11"\ \0 • • •
lI"\..::t ex) NC""\
, \.0 0'\ ('IJ \.Q \.0 N . . COlt',
It',
'" "'i N CO at'\ at'\ ex) 0'\ ..... N C""\ .... • • • •
t 0 l'o 0 at'\ It',..... '" 0-('\j at'\
\0 ['\.0 N..:r- IJ") \.OOl'-. . . CO "" .... 01.1"\
• 'r'" .. • • ..;t • ,...
I
U I
\() C\l \()
•
-=t C""\ \.0 .. ['.
-R CO ex)
• -=t 0--
r;-...
'8 .. N 1.1"\ It"'I
r;-... 1.1"\ \0 •
0-N C""\ C""\
C\l ex)
" r-;
..
I CX)
\0 11"\ C""I .. ....

I 1Il r-i r-i I
o o o
Z H
.1
' 1
I + o I o -I o "" 'l' "', 0", Co CO I
'" .1 lJ
J I
I I I
• • t. I
I,
0'\ o , I
1 (!)
~ o ()
'8 ~
C) I 5
c.l 1 I=:
1 Ul CJ:)
OM () CJ:)
Po u~
~ :J t
[' I" ['. '" COCOCOC\l CO CO CO \.0 • • • •
Lr\ lC\ U"'\ CD C\lC\lC\l
"''''CO 0-['0\ C\I C\I U"'\ C\I ("'\ \0 \O\OC\I\O\OCO . . . .t · . (X) ·co r-- CO 'Lr\..:t
.... C\I 0-
1. I. I
I . I
I 1 I
• •
.", ° <\I ~\. ': .. • • • • COl
I ,
•
I ,
•
I •
'" C\I '-0 . co
0-0- .... 0("'\0-C\lC\l0\C\l0\C\l \0 \O..:t ,... ..:t \0 . . . ... . COc:l..:tMOCO
C"'\..:t ,... ("'\
.. . ..:t C\I r--. •
10 ..-
• -«l. •
.1
I ,
1 I 1
I'
-1
I .
0'\ .... 0'\ •
,... " "~
.r ' : ." ..
.1
t I
• 1
II

C'"'\
S o o
I I .--
I
·1
+ o o ~ o 0'\1 0'\ 0\ J I
00-.. co c:)1
I 0'\ • f'oo- -,
6 "I f'oo-
III ell 0'\ CIlC""\ UJ I roO ~C""\ o k (1)0'\ ~N ell \1 eo roN .... A
(I)
'0
0'\
I o ..-
0'\ o I
lI'\ o
I. -I
I
t
• 0 o
'. '0 ~. cd
~ . ~ III OJ . .., (.)
ell P,
i Vol
C'"'\ \.0 ..:t •
f'oo-..-
J
1
I •
•
co ("'\ C\I •
N..:::t~1l"\lt"'I O'\~ ........ C'"'\ \.0 ..... .... ..:::t .... . . . . . -"'OO .... ..::!" . C'"'\
.-
.-. J t k
.. I ·1-.
I
•
, I
..::t \.0 ..... • ['
co ...-• co' ....
..- f'oo-..- f'oo-N ..:::t C\t 11'\ C\t 0'\ 0\ C\l C\l N f'oo-• ••• • o ONOC""\
J. J
-, r f t
I ·
I·
I
..- C\I l.t'\..:::t co C\I 0\
:\.0 '\.0 • • o C'"'\ ..-_
•
..- lI'\ co, '..:::t co ..::!" •• •
1..- co 0
...::t ""'. • C'"'\ .... .. ~ ~ . ~ ......... ..:::t C\l t'\I
• • • _0 0 1.0
•
..
o l'-..• o
••
<3 co • ..:t
lI'\
..::t co f'oo- .... __ \.0
• • .... 0
J J
.-C""\ .... •
C\l
I •
I I I
'",""'I·.
•
co 0'\ "0 .. .. ..::t ~
1 I
1 I
1 1 ::.~., .
r
0'\ ,.::tco C'"'\ ('0....-ex::> .... \.0
• • 4i' ['- ..... 0 ....
.0 .0\ .. . . ,-r-.. ..::t .... C""I • • o 0,
0'\ lI'\ "'" ['['.0
It'''I "'" c;:, • • • coOl' ....
I
I
I I
•
• I I .....
It'''IO ('0.. N
'" \.0 • • ON
..:::t 0\ .... •
I I ("'\
I
I
co ['. 0'\ • co .....
..-• • • J • • '0 ~ ~ o o •
..::t • C\l • "'" . • "'" ...:::t
•
0'\ 0'\ lI'\ •
0\ .... ..:::t C'"'\ .... co co 11'\ • •
..::t C\t
•
co .... ..::t
•
....

1 II> 'd
1 0 ()
'0 1 fa
II> 1 e
ro ~
I • Q')
II> -.-I ()
II> p..
100
0\
I o
0\ o I -. o
... ,I , ',I I
I
.... CO ~
• CO
•
• N
'.
•
I
....
. .
.. '" .. C""\ "" '8~
• • • 0\0 ....
c-. ""..:::2' C\tO\O ..... \0 0\ • • •
CO,.... C""\ ,.. C\!
1
I I
• • • • • • • I
•
..... .\
i '. I ,I 0 ~
It"\ It"\ 0 C\I \0 0 CO . ..:::2' c-. • • •
N C""\ c-.
. .
)
c-. C""\..:::2' C""\O\ 0\ c-.\O CO . . .
t--;:t ..... -:-,.. .. ."
• "" '..:::2' ..:::2' --
c-. c-. C""\ • , C\!
• •
I
..
"" o o ,I _
C\!
o CO It"\ .. •
, I ..... \O! ..... I · I.l'\
OOC""\C\l c-. 0\ 0 C\l 0\ 00 .... ooM
C\l •
1- c-. N 0\ • ..... ... ....
•
I •
1 ..
I i
'I

I CO .....
• o til H ~
'1 ~~ ..:::t<
C""\ ~
o o o
Z H
I' ,
0\ en n
1 CI> 1 enO IT.)C""\ (\! .... o HO\
lCl>C'\l +>. (1)0 ~C'\l
-.-I Cl
(]) I'CI
o o
0\ ..-
I o ..-
I
I O\N~~~~OOO~~C""\_~C""\OooN~NO\~~O\_
10 00 ~.,... C""\ 0 N C\l ~..:::t C\I 0 0\ ("", ~ c--. ~ CO ..:::t 0 0 ~ 1t'\ 0 ~1t'\OOC\lnoo~n..:::t~O\nO_C\l~~~C\lNn1t'\_
I·· • • • • • • • • • • • • • • • • • • • • • • ONOO\.,....,.....:::tNO..:::t~.,...~~~OON.,....,....,...ONn ~N Noo.,... .,...
I
,I I ; .
I
....... I.;t-C""\ ..:::t 0\ I • • ~~ h- ..-IN
I~ •
i'-O
10\..::t .,... ('"\
)\000 . . IN C""\ •
I I ... ~ If'. ~ Lt"\~
I· • nO 1,...
J
-I
• I
• ..:::t I I
...... \,O~OOOlt'\Lt"\O ~ C""\O t"('\i t"..::t<X> \,ONC'"'INt"n..:::tLt"\
• • • • • • • • C'"\ ..... ,...ONO..:::tCO
t" Lt"\
-0 •
. I I I I I
I I
I
-I -I ·1 I I
I ,
I - ~ I
o \,00 0\ \,0 n 0\ ..:::t Lt"\ • • • _ C""\N
..... '. .,...
C"'\ 0\ ['
..:::t~\,Q 0\ (\l 11"'1("", 0 ,... N..:::tC'll
• • • • •
u-, It'\ 0\ .... 0t"Lt"\Lt"\ C\I nan ..... • • • •
_ON..:::t
•
O\..::t 00 [,-OO..::t o 1t'\..::t N .,.....::t 00 C'\l ~O\'D 0\ • ••••• oo ..... OOO..::t
Lt"\
I I
• J I • • • J J • •
J J:g --~ o
00 '\D 0\ • o ,...
• ['-.
'" N ~ CO co
..::t , ..:t 00 0\ • • •
N Lt"\ N
l..:::t
o\..:::t n t"oo oou-,ON ..... ~C\lnO\~ • • • • • _ . ,... \,0 0 0
t" N (\l ·
u • • •
10 101 C'IIOO ... .... ..... o

. I,
.. I
I Q)
't:l I 0
CJ
rn Q)
'1"1 CJ Q) P-
I UJ
+ 1 o o 1
, J I
I
I
I ......
r-- N ..... C'"\ ..... ooC'"\"'O.::t \.0 (1.1 ..... Lr'\ \.0
• e, ••• \.ONC\I...:t .....
~I ·1- I
I
I
o r-- "I 00 It\..- 0 r-\.0 00 C"'\ C\I •••• ..... .::t,....0
00
·L·
1:'--..-0 Noo ..... '" C'"\ N . . . " OC"'\C"'\
C'"\ ,_.
'i 1 I 00-.. ~ 0'\11 o 0-..1 or 00 , 0'-",1 ['. l'-J I I .1 .................. .. J'J J'~ ., ..... • 1 .1 .. • ' .1' .• 1 •
co I 0-..
1 o
I
I I
1 0"'1 1 : j 1t",1t",
It\ r--10 C\I "10\ , ... .... 0
I
I
.J .' ., ;.' • ,r I . .. . I
(
• I I ~
,...\.OC\I\.O.::t 1t\['.000.::t OO"'C""'I['.~ . .. . . .
N It\ ('\j
•
r C\I U"t C""I('\l ....
• IC"'\
• • 0 ...
. I
,I I ,I I "' . ~ ~ . 'II .. . .
I
I I. .1
I I
r I
r--0\ 00 •
\.0 . ,......
O\NOO \OOr--00 C"'\ C\I . . .
10..- 0 C\I
o i \0 : O~"'O ,..... 0 It\N
\0 ..... •
11 .... ' C"'\. •
, I -I
• '0. eo .. -.o~ • ...... • • ••
.r:--...::t 1;""'1.
Ii '; a I q : .-; ...... , I · , . • N .... -
N .::t O\.::t 1t\.:jI f" f" (\J f" \.0 .-• • • •
C\I,.....::tO .-
I " . J
N U"t N •
N
I , , • • • •
· ;, .
1 I
• O...:t Nf"
• r r u • • NO
I
J
I
. .
. .
. C'"\
.::t \0 r-N f" ['. f"OOC\l . . . ,.... C'"\,....
.....
~. 0: I:
N .::t C\I .
10 N

.-4 ('j ~ 0
E-t +
I 0 0 ,... I 00\ 0\ 0\ I I o 0\.. cr"to t
, I 0 0\ I ['- ['-
I I
~ I
0 I.
... "" I I
00\ I..r"II..r"I
III Q) III
, , I
III ('$0\
I M N () I
0 0 N ~ N .-r t
c:.> ~ a> a 0'\ 'f"l .... ~ I
0 ... 1
.0\ • 0 I iii 0
\D 0 "" S4 N 1'1' ""' N 1''''' CO .... ~ \DOl' O'\~oolt"',~I..r"III"ICOO'\O'\'" "~N.,-I.t"\NOO\D\004C:O~0 • • • • • • • • • • • • • • •
0400 .... NNO 11"1 CO \0 0 CO N \.0 "" ... ,.... "" 0 ,....
1 I I I I 1 \ I ... \ "
1 I I • I I "\
I ' I I I
I ,J~ I. I. I" I' I I I ....
• • • ~ • ... • . • .. • • "
1 ~t 'I . 1 I •
1 .1 I 'I
1 "
" CO ' .. CO C\l
"" .... • .' \D 1 ' I \ I 0
N
['0 N ,... " 0\0 0\ 40'\ I.t"\ ..:t C"\\ .... 0\ ""' , .- 0'\ C\l NC1\ 00\ ....
• • • \ • . • • , . ; n~ ... I N I ..::t 00 4-.::- I • .:!:tI ,....
. . ~ n..::t ['-cO \0 ,11"1 L"- 0 co c:--nN ... ..::t
O\N " CO C"'"\ ... ~,
. '. . . . 0 .... 0\.-.0
C'""'I..- C\l 0'\lr\0\C\l C"'"\..::t 0\ • C"\ \.0 ll"\0 • • '. • • • ..
&\..::t 0 1 "o,cr.N'. ,.... \ ..::t
0\ "CO
0 N ~
• CO N CO
I .
-- . ", . '00.
0 \0 ,_. • .-
""
co lr\ \.0
• " C'l ,... ..:t N 0 •
:u"\ ~
0 .1..r"I'\
, I ..::t •
..::t 0\. .-
, I CO lr.\
I ~, . '\0 •
..::t If'\ " N
1.
0 '8 ~ .. "'.1'
.~~ ~O'" 11"'\ ['- ll"\
-OON ·'co • lS'\ • ... ... ~ .... 6 of .... ' ••
" •• '\- iii" •
I N I 0.- I --. ... I 0 ['- 0 ' /' '-GI • 1 , 11"'\
~ "'f"": '" C\l .J .~.I ..---- 0
I..r"I
I ,
,. 1
, i
' I
I~·r . 1

I .-t N ....-t
I
z o H E-<
~ j p..
I
n :£ o o o
Z , H
+ o o ... I 00\ '1'0\. 00-.1 co co
1 I I 1 I
I
t
0\ I' "..;- l ,. l •
['. . 6· .. 1 ,._ t r- r .. r· 1 I ['. ~ 1 I O~"I
1
c\ o 1
IJ\ I' , 0
I ...
( .,
.1 I
1 1 -I
In ['. \0 an .... \0
• • 'I ['.['..1 -I I_I
an CO CO ['. ncoOn o CO an ...
• • • 't 0\ 0 \(). n ....... CO("'\C'\I..::rC\l
CO ['.\0 0\0\0 ['.Ncon..::rco C'\l .. • • • • "OO~C'"'\O o .....
.. I 1 0\
I
I J
J I
, 1 ' I
o
I.
,.. C""t\O C\I 0 \0 NO..::t'\O\O['. 'P"'['.C'"'\\O~ ... • • • • • •
..... OC'\l,.. .... C'"'\ C\I
• IN
I ....
• • I- • • • • • 0 • • ~ • • • ........ •
1'(1) "0 o ;0 '
.Q) ,
5
~
I~
N ... an •
['. CO ~
0\ ... CO • ~ ,..
•
CO 0\ o N C""t
I

:.""
FO RES T SURVEY OF INDIA
EAST ERN ZONE
MAP OF INDIA
SHOWING P RO.JECT AREA IN
-
seA L E '_ I 1!:l,OOOOOO
MAH AR ASHTRA
, .' ,
, ,', .r·· I~. Hyd.raDad ,! ~ .. -
:::;. '-.. _.,. ..... "
Daftoat_. ,. -~ .... _"
~ ,'-
, •
.. ~ - J "- ... "."
- --
~ o
'.' (l o ., ;D
. :."""'lItfi-

eOD
25°
e'
23·
"'30"
2S· o·
FO REST SURVEY OF INDIA
INVENTORY DESIGN
30' .~o 32'-30" 80-1 _'-- - - -~. ---, k- _- - -
.
<v- I
CENTRE POINT
~- (S~.~ ORID)
02 " ~
1/ "
I'~ "' ..
/
2 . ~ "
.
" . , I
, . 2 X ~. :X ~
~
'" ,
<$>1 ~
, "-/ , /
/ '~
FIRST PLOT IS SELECTED RANDOMLY AND THE CIE"CONOPLOT IS SITUATED AT AN EQUAL DISTANCE FROM THE CENTRE OF THE FIRllT PLOT TO
THE CENT~E OF 2'- 30" X 2'- 30" GA.ID AND ,. oIUGT L.OCATED IN TJiU DP~OSITE DIRECTION.
DETAILS OF PLOT

II
~
«'.
. " :::. ...
(.
, z.
C'1~,Ti~ : IUT ION OF TOTAL STEMS pcn Hr,CTARf: AJ\JP
:iTr:ft.,Jf"') PER HECTARE OF SAL ACCORDING TO Pll.\rv'-::T"-~ ,CLASS IN OIPFERI:::NT CTRATA
1'.1' n C -G T RAT U 1'..-1 t: =- -::....;;.
.c;::~ ,
4"~1 fl f ,~
t ' ";
3~lJ -1 1 l' ·f '5'!: -i I
OT~ATUM - -'~ I I
.!~ ... I _J
{ r 1 :!:~o· ~ s-,:"C'-J
I !!7!J ...
4!"~ """1
t-:oIJ
, .... __ ... -"::I -t
"JO .. I~" I
'"),- --I
7') .,
C::) _~
~
~
~
I " '~ I 1 1
r ~ •• r ... ", '"
I" f ~ 'A. t
J_' .. t1
iI. I
'.'
PLANTATION c ST~A_TUM
t ,"!:1 i
I -I
!J _,
• ~ I:""':'
, '
I ., G
i r ~ ,
1 -, ,t 1; '~-;
_j_ - _-'--
:1 ,-- ..=x::;. ~.fO' ~
.' ·,r _~_
j C A' f,.; - :E'tl t~ E;'lCH DIA ,'LAOD
__ -=-- __j

DISTRIBUTION OF TOTAL VOLUME PER HECTARE AND _.
VOLUME PER HECTARE OF SAL ACCORDING TO CIAlv.:::TER
SAL STRATUM •
7 o-r ,
6-~
f1 G-O n ~ I
0'15 , t I , • I •
1'50 i ~
~ I " t
~ i l 4 ~ i
40i n ~ ~
~ t ~ '10 -I
CLASS IN DIFFERENT STRATA
MI$C OTAA'TUM
IS 5 -l
"O~ 4' i t40~ I I
. - --"
I I ,
I
, ·1
i h
I
I
~. ~-,,-! :l' "J' I " PLANTATION STRATUM
-..J If! ... " ~ i I
; ! 1 c (. - l
....
:J I
<il ~'O •
~- I "-I- :: I) -t
~- I f. 2°1 ;
:'1
...... 0 - , I' 00 1 I
I, ~ .. ' o _;:I .l. I
'" 1 r "0 _., I'. ~ I 05 -l I 0''- i l •.
I"II'IMftTFFl __
RF t:' ctl't_ENCJ!
PIA M.rtT!'~ ,H eM
10-ID
::'0-29
.... ') e, AI!OVE
"r ...___........,..:-, .. , , i w • _....... ~ ....r
~ - .... _- ...
. -,
t!-U. .pete,," 0 ••• IN CACH DIA.CLA~
" , ,. -'0-
," .... - . .-4
[ ·AII.1ETEA - ----

DISTRIBUTION
ACCORDING
/ /. ./
/ .
I t
r J.
;'
.. A E .... -
1:!1A..~.~T II; 11 J..N ~M...;
'0 .... 9 4 10-19
/
,
/
/
"
20-29
30 eo ABOVE
/ ,/ . ,- /
./
" ~
I
OF TOTAL NUMBER OF STEMS . l!
TO DIAMETER CLASSES
, .
./. ~
'.+4- -" -l ~ ., ".
--"" - ~:)
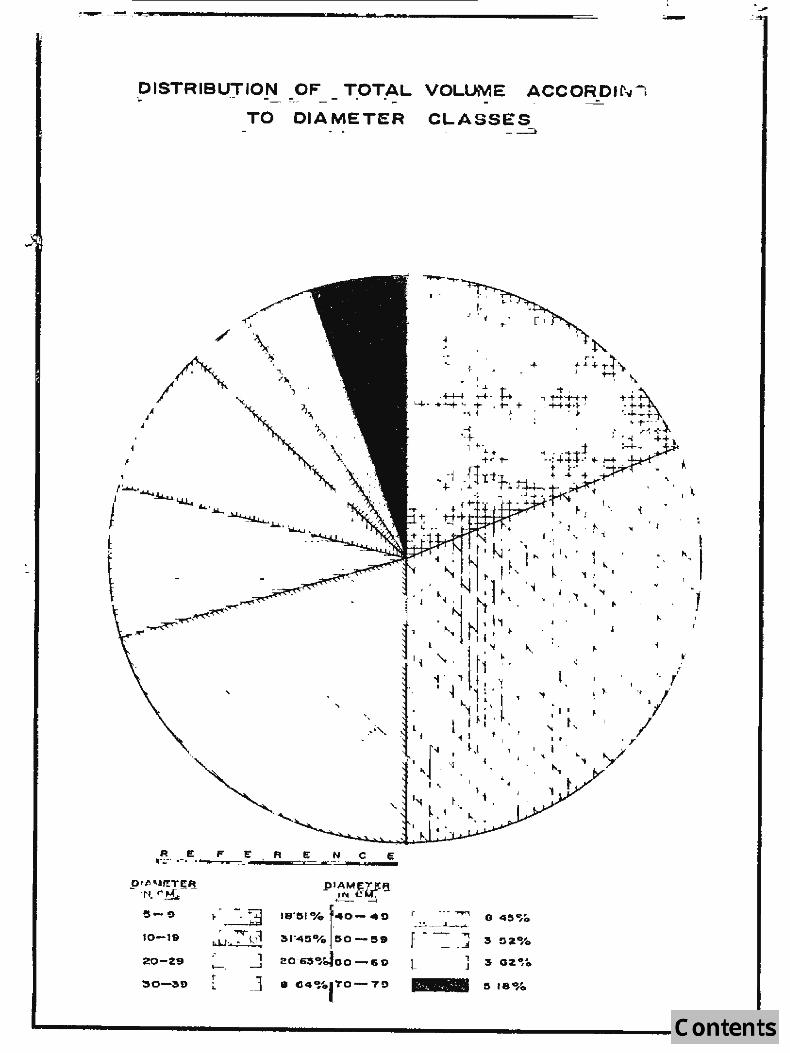
.:"_"., -.-..."".,.~----------------------------==-
DISTRIBUTION OF 1.. ._. - ___ _ TOTAL VOLUME ACCORD.r-,,'I
TO DIAMETER
./
'C'J.::.,.-,E, '= ':. E
o.~ 'utTI!I! - 'N. ~~-.
.,- 9
10-19
~O-Z9
""=:"':3 • '"T:1 ~~, , 1--, .....J
A It NeE --' ==. pIAIIA~Tp,:f!
,"" cY:" ..__ '-'
18'~1 0/°1:.0_ 40
~'·.Ooro GO - e.
~0'6S~~OO-.9
CLASSES -~
--J • ( 1
....
~ J
,H4 ~'h 4, +---+ ~ -t'- ,-r, +-
'\ ~ "
r ,,- ~ ~.!.'--....___..._
f - --= ,~ L :s G2.~o
• 'I
I }-
'J'
."
1 "