1996 - influence value defuzzification method
TRANSCRIPT
8/7/2019 1996 - Influence Value Defuzzification Method
http://slidepdf.com/reader/full/1996-influence-value-defuzzification-method 1/7
You have been given the
task to design a fuzzy
logic embedded system.
At the heart of the sys-
tem is a very “cost-
effective” microcontroller. You and I
know that cost-effective microcon-
troller system translates into “s-l-o-w.”
Now suppose that you are to design a
system that requires update rates on the
order of milliseconds (control systems
with fast actuators could fall into this
category). You spend a month or soputting the project together, everything
is going great, and then you realize that
the defuzzification routine in your
fuzzy logic module is eating up all of
your loop time. In essence, the thing is
too slow. Of course, you knew this at
the beginning of the project. You first
realize that a means of reducing the
burden on the microcontroller is, natu-
rally, special computational hardware,
such as custom integrated circuits;
such a solution, while attractive,
increases both complexity and cost.
Your second option is to switch to a
faster microcontroller. So you tell your
management that you need a faster
(and more expensive) microcontroller
and they quickly remind you that
adding a dime to the cost of the micro-
controller would result in an increased
project cost of $100,000 per year
(which, by the way, is significantlymore than you get paid). You quickly
reconsider the second option. The third
option is to dispense with max-min
inference and instead employ a more
computationally favorable method of
inference. An increasingly popular
approach is the use of symmetric out-
put functions (such as gaussians) in
combination with output aggregation
by DINU MADAU
Influence ValueDefuzzificationMethod
42 EMBEDDED SYSTEMS PROGRAMMING DECEMBER 1996
Defuzzification is compute inten-
sive and may seriously bog down
your system. Here is a computa-tionally efficient method that
reduces the resources required and
eliminates the need for a faster
microcontroller or custom logic.
N a n c e P a t e r n o s t e r
8/7/2019 1996 - Influence Value Defuzzification Method
http://slidepdf.com/reader/full/1996-influence-value-defuzzification-method 2/7
with PLUS rather than MAX. This
approach allows the output functions
to be characterized on the basis of their
areas and centroids and avoids entirely
the need for numerical integration inthe defuzzification process.
As you consider these options, you
determine that for your particular
application, you need the true center of
area (COA) defuzzification. I don’t
want to debate your design choice or
the relative merits of the various infer-
ence methods. Rather, I will assume
that max-min inference is deemed
preferable for certain applications.
Fortunately, a computationally effi-
cient method of defuzzification, which
we call the influence value (IV) algo-
rithm, exists. The IV algorithm reduces
the resources necessary for computa-
tion of the COA defuzzification. To
whet your appetite, I submit a project
that I was involved in: we realized an
estimated 94% reduction of defuzzifi-
cation computation time, when com-
pared to the full piece-wise integration
technique of COA. For practical appli-
cations, this reduction permits max-
min inference to be carried out with
inexpensive processing devices at rela-
tively high speeds.
I am making the assumption that
you have some basic understanding of
fuzzy logic, inference methods, and the
COA defuzzification technique. If not,
don’t worry: this method relates only
to the COA output defuzzification,which mathematically translates to
determining the center of area of a
given centroid. So before we go any
further, here’s a brief review on how to
get the center of area of a centroid.
DECEMBER 1996 EMBEDDED SYSTEMS PROGRAMMING 43
We realized an
estimated 94%
reduction of
defuzzification
computation time,
compared to the
piece-wise inte-
gration technique
of COA.
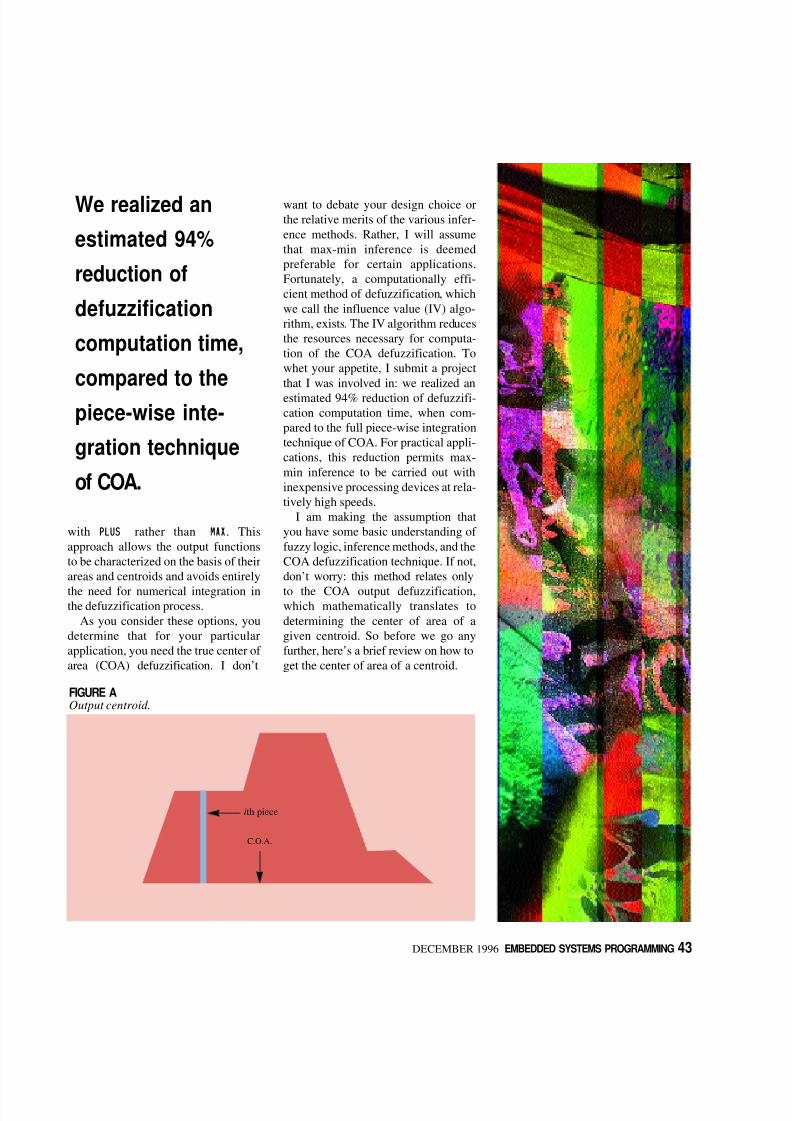
FIGURE AOutput centroid.
ith piece
C.O.A.
8/7/2019 1996 - Influence Value Defuzzification Method
http://slidepdf.com/reader/full/1996-influence-value-defuzzification-method 3/7
CENTER OF AREA
Given a set of fuzzy logic rules
and their associated output
memberships, the combination
of the truncated output memberships(typically triangular or trapezoidal)
generates an output centroid whose
center of area is the crisp output result
of the fuzzy logic computation (see
Figure A).
The center of area requires the
zeroth and first moments of the output
function. The first moment of the cen-
troid is divided by the zeroth moment
to generate a crisp result. In fixed-point
processors, a straightforward defuzzifi-
cation procedure would typically be
based on a discretized output range.
The range, for example, could be a
gain for your controller, an on-time for
a solenoid, or whatever you desire to
control or manipulate. The area is cal-
culated by piece-wise integration of
the centroid. For each piece in the
range, the value derived from the MAXoperation is the height for the piece
that is then used to determine its area.
The area multiplied by the relative
position of the piece in the range yields
its moment with respect to the origin.
The crisp output is computed with one
multiply and two additions for eachelement in the range, followed by a
final division operation. The output
equation is then given by:
where i indexes the discretized pieces
across the output range. Therefore, the
computation time scales roughly with
the number of values into which the
output range is divided.
MAX-MIN INFERENCE
Assuming that you have an under-
standing of max-min infer-
ence, I will discuss only those
aspects necessary to explain the pre-
sent method. In particular, the details
by which rule strengths are obtained
from inputs and input membership
functions are not considered here. I
need only assert that a strength has
been computed for each rule and is
applied to the corresponding output
membership function. Secondly, theoutput membership function is truncat-
ed at the rule strength, although the
method may be applied if the output
function is scaled rather than truncated.
In fixed-point processors, the height of
the output membership functions is an
integer value (derived from the rule
strength for that membership with a
range typically 0 to 1.0). The value is
scaled dependent on the resolution
required by the algorithm designer. For
example, {0...1.0} could translate to
{0...64} where 64 is equivalent to 1.0.
Having stated the previous, let’s con-
centrate on the mechanics of defuzzifi-
cation that require determination of a
crisp output value, using agglomera-
tion by MAX and computing the center
of area, from the set of output mem-
bership functions, typically of triangu-
lar or trapezoidal shape, and from the
set of rule strengths.
We may make some simple observa-
tions about the mechanics of defuzzifi-
cation on max-min inference. First, the
strength of a rule influences both the
numerator and denominator in theCOA calculation, but in neither case is
such influence a linear function of the
strength of the rule. The primary rea-
son for this, of course, is that the area
of a truncated triangle or trapezoid is a
nonlinear function of the height of
truncation. For example, a triangular
membership function’s influence
increases quickly as the rule strength
increases from a low value but tapers
off as the membership rule strength
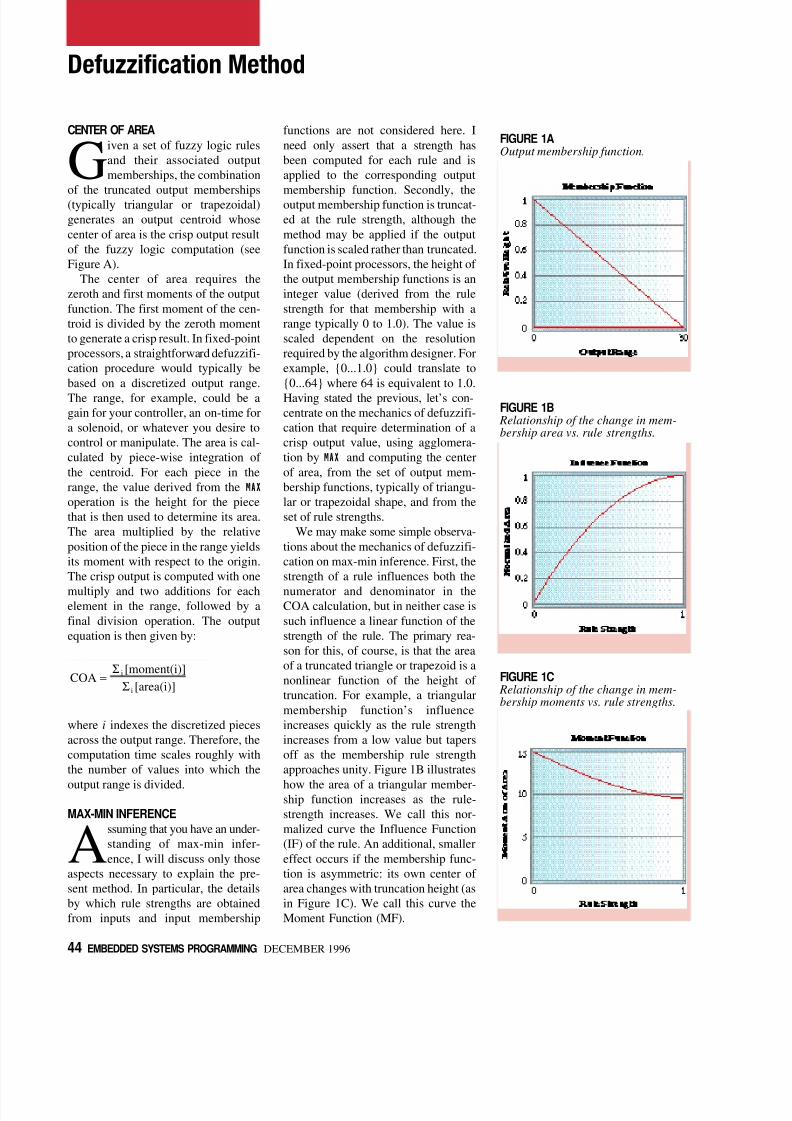
approaches unity. Figure 1B illustrates
how the area of a triangular member-ship function increases as the rule-
strength increases. We call this nor-
malized curve the Influence Function
(IF) of the rule. An additional, smaller
effect occurs if the membership func-
tion is asymmetric: its own center of
area changes with truncation height (as
in Figure 1C). We call this curve the
Moment Function (MF).
COA =S i [moment(i)]
S i [area(i)]
44 EMBEDDED SYSTEMS PROGRAMMING DECEMBER 1996
Defuzzification Method
FIGURE 1AOutput membership function.
FIGURE 1B Relationship of the change in mem-bership area vs. rule strengths.
FIGURE 1C Relationship of the change in mem-bership moments vs. rule strengths.
8/7/2019 1996 - Influence Value Defuzzification Method
http://slidepdf.com/reader/full/1996-influence-value-defuzzification-method 4/7
46 EMBEDDED SYSTEMS PROGRAMMING DECEMBER 1996
Defuzzification Method
Another observation is that the
contribution of a particular rule on the
numerator and denominator in the
COA calculation depends on thestrength of neighboring rules, such as
those rules whose output membership
functions overlap the rule in question.
Simply stated, the use of MAX agglom-
eration means that if membership
functions overlap, the overlapping
areas contribute only once. (This
interaction between the rules is a prin-
cipal feature of the max-min infer-ence—though i t frustrates simple
superposition, the interaction has the
effect of discounting redundant evi-
dence and is appropriate in certain
circumstances.)
INFLUENCE VALUE (IV)DEFUZZIFICATION METHOD
The intent in devising the IV
method was to formulate adefuzzification scheme whose
computation scales more closely with
the number of rules than with the num-
ber of output divisions. The non-linear-
ities mentioned above can be handled
in an obvious way—that is, by precal-
culating the variations in areas and
centroids for each rule as a function of
rule strength and storing them in
lookup tables. In fact, we may precal-
culate the moments themselves and
store these instead of the centroids.
When all is said and done, we will
have generated two tables, an area
table and a moment table, which will
be indexed by the rule strength for the
unique output memberships. For fixed-
point implementation, one would typi-
cally choose a convenient number of
values of rule strength, such as a power
of 2. Using such tabulations, we could
perform an approximate defuzzifica-
tion by performing two summations
over rules, indexed by i. The numera-
tor of the COA is approximated as:
S[moment(i)]
and the denominator as:
S[area(i)]
where the values moment(i) and
area(i) depend on the strength of rule i.
Though this approximation does not
take proper account of the possible
overlap between output membership
functions, an elegant way of doing this
exists. The idea is to augment the rule
base with pseudo-rules which willcompensate for the overlap regions.
Let us suppose, at first, that output
membership functions overlap only in
pairs. We create a pseudo-rule for each
overlapping pair of output membership
functions. The output membership
function of a pseudo-rule is formed
from the overlap region of the original
output membership functions. The
8/7/2019 1996 - Influence Value Defuzzification Method
http://slidepdf.com/reader/full/1996-influence-value-defuzzification-method 5/7
48 EMBEDDED SYSTEMS PROGRAMMING DECEMBER 1996
Defuzzification Method
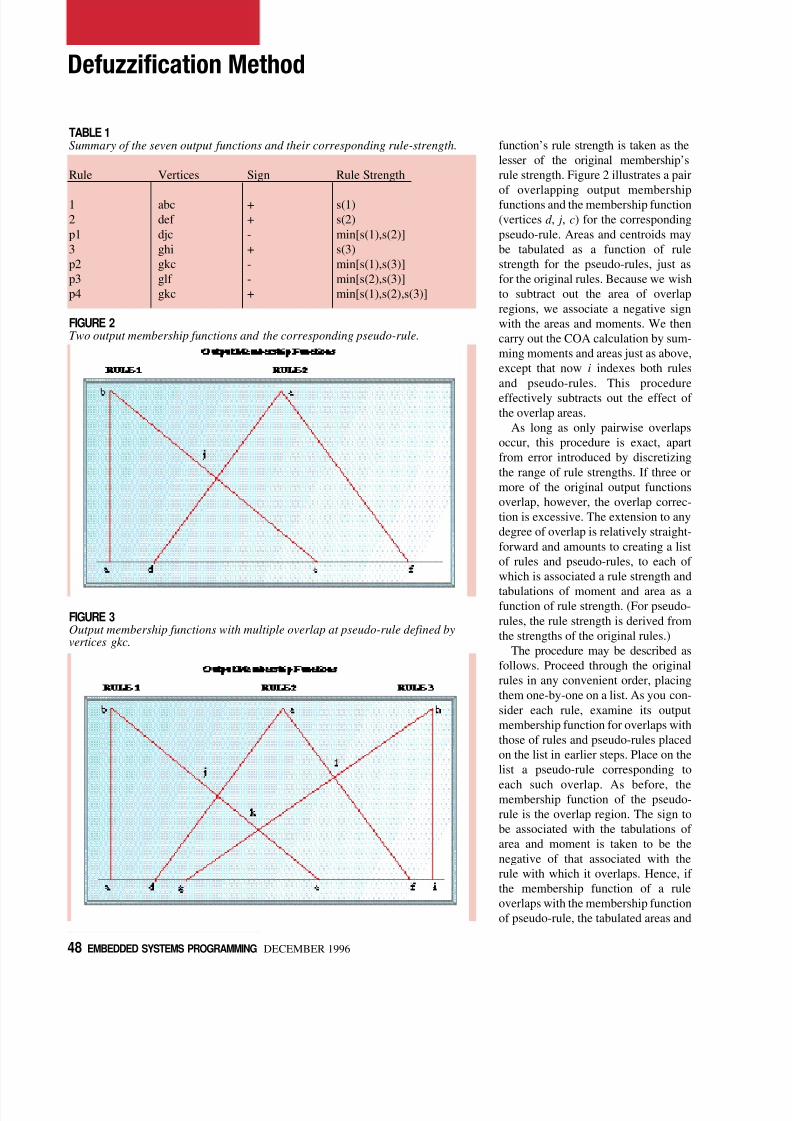
function’s rule strength is taken as the
lesser of the original membership’s
rule strength. Figure 2 illustrates a pair
of overlapping output membershipfunctions and the membership function
(vertices d , j, c) for the corresponding
pseudo-rule. Areas and centroids may
be tabulated as a function of rule
strength for the pseudo-rules, just as
for the original rules. Because we wish
to subtract out the area of overlap
regions, we associate a negative sign
with the areas and moments. We then
carry out the COA calculation by sum-
ming moments and areas just as above,
except that now i indexes both rules
and pseudo-rules. This procedure
effectively subtracts out the effect of
the overlap areas.
As long as only pairwise overlaps
occur, this procedure is exact, apart
from error introduced by discretizing
the range of rule strengths. If three or
more of the original output functions
overlap, however, the overlap correc-
tion is excessive. The extension to any
degree of overlap is relatively straight-
forward and amounts to creating a list
of rules and pseudo-rules, to each of
which is associated a rule strength and
tabulations of moment and area as afunction of rule strength. (For pseudo-
rules, the rule strength is derived from
the strengths of the original rules.)
The procedure may be described as
follows. Proceed through the original
rules in any convenient order, placing
them one-by-one on a list. As you con-
sider each rule, examine its output
membership function for overlaps with
those of rules and pseudo-rules placed
on the list in earlier steps. Place on the
list a pseudo-rule corresponding to
each such overlap. As before, themembership function of the pseudo-
rule is the overlap region. The sign to
be associated with the tabulations of
area and moment is taken to be the
negative of that associated with the
rule with which it overlaps. Hence, if
the membership function of a rule
overlaps with the membership function
of pseudo-rule, the tabulated areas and
FIGURE 3Output membership functions with multiple overlap at pseudo-rule defined byvertices gkc.
TABLE 1Summary of the seven output functions and their corresponding rule-strength.
Rule Vertices Sign Rule Strength
1 abc + s(1)
2 def + s(2)
p1 djc - min[s(1),s(2)]
3 ghi + s(3)
p2 gkc - min[s(1),s(3)]
p3 glf - min[s(2),s(3)]
p4 gkc + min[s(1),s(2),s(3)]
FIGURE 2Two output membership functions and the corresponding pseudo-rule.

8/7/2019 1996 - Influence Value Defuzzification Method
http://slidepdf.com/reader/full/1996-influence-value-defuzzification-method 6/7
50 EMBEDDED SYSTEMS PROGRAMMING DECEMBER 1996
Defuzzification Method
moments for the new pseudo-rule will
be positive if those of the overlapped
pseudo-rule were negative. Figure 3 is
an example in which three membershipfunctions overlap. In this case four
pseudo-rules would be created.
Table 1 summarizes the 7 output
functions, the signs to be associated
with their areas and moments, and the
rule strengths to be used in the table
lookup process.
Note that the sign for pseudo-rule 4
(p4) is positive because it is generatedby the overlap of two pseudo-rules
(rules p2 and p3, whose signs are nega-
tive). It should be emphasized that the
work of constructing the pseudo-rules
and calculating the tables for moments
and areas needs to be performed only
once for a given rule base. For our pro-
ject, we wrote a program that automati-
cally generates the two tables, given aset of triangular/trapazoidal output
memberships. Because the computa-
tional cost of defuzzification roughly
scales with the total number of rules and
pseudo-rules, the present method is best
applied to systems in which the overlap
patterns are not too complex.
Furthermore, it may be satisfactory to
ignore pseudo-rules whose membership
functions have very little area, in direct
analogy with truncating a series expan-
sion when the terms become small.
CRISP OUTPUT
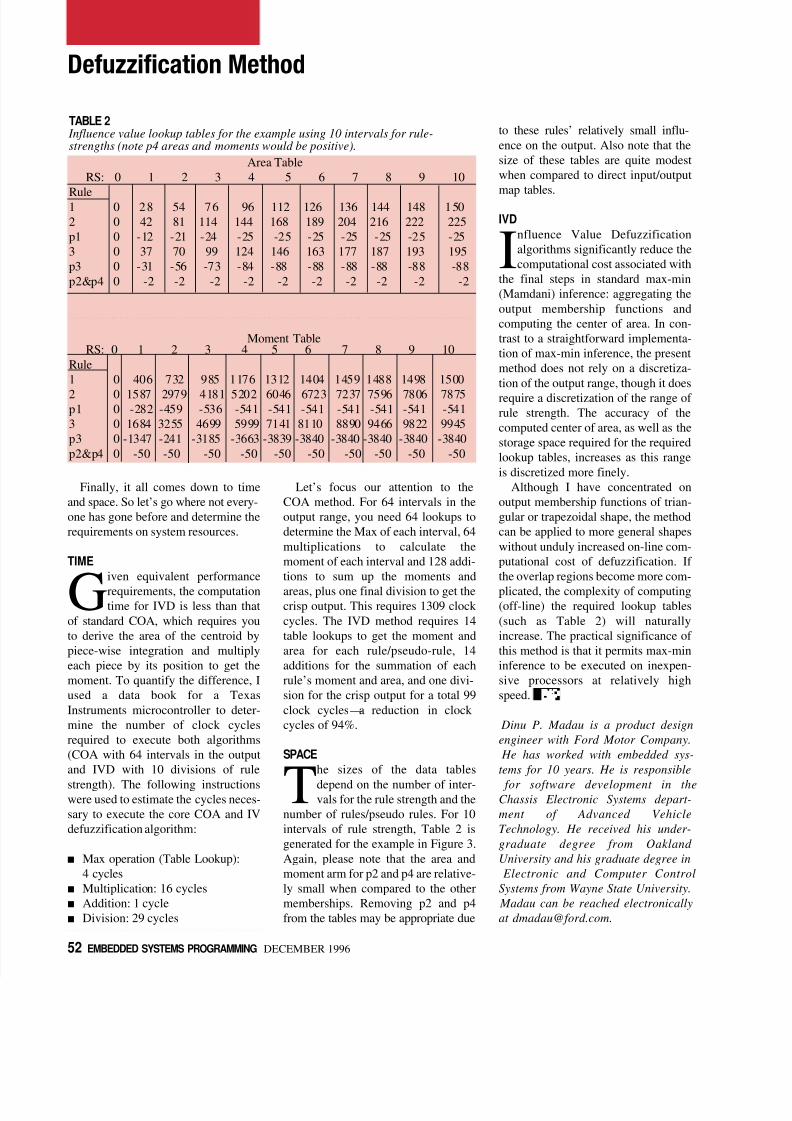
Table 2 illustrates the IVD tables
for the example in Figure 3 with
the following points for vertices:
a = 0
b = 0
c = 30
d = 15
e = 30
f = 60
g = 25
h = 64
i = 64
The least significant bit of rule-
strength is equal to 0.1 (0 to 10 equiva-
lent 0 to 1.0). The following pseudo-code
can be used to generate a crisp output,
given rule-strengths for the individual
rules (A_Table = area table and M_Table= moment table):
Area = 0;
Moment = 0;
RuleNumber = 1;
while (RuleNumber <= MaxNoOfRules)
{Area +=
A_Table(RuleNumber,RuleStrength);Moment +=
M_Table(RuleNumber,RuleStrength);}
COA = Moment / Area;
8/7/2019 1996 - Influence Value Defuzzification Method
http://slidepdf.com/reader/full/1996-influence-value-defuzzification-method 7/7
52 EMBEDDED SYSTEMS PROGRAMMING DECEMBER 1996
Defuzzification Method
Finally, it all comes down to time
and space. So let’s go where not every-
one has gone before and determine the
requirements on system resources.
TIME
Given equivalent performance
requirements, the computationtime for IVD is less than that
of standard COA, which requires you
to derive the area of the centroid by
piece-wise integration and multiply
each piece by its position to get the
moment. To quantify the difference, I
used a data book for a Texas
Instruments microcontroller to deter-
mine the number of clock cycles
required to execute both algorithms
(COA with 64 intervals in the output
and IVD with 10 divisions of rule
strength). The following instructionswere used to estimate the cycles neces-
sary to execute the core COA and IV
defuzzification algorithm:
s Max operation (Table Lookup):
4 cycles
s Multiplication: 16 cycles
s Addition: 1 cycle
s Division: 29 cycles
Let’s focus our attention to the
COA method. For 64 intervals in the
output range, you need 64 lookups to
determine the Max of each interval, 64
multiplications to calculate the
moment of each interval and 128 addi-
tions to sum up the moments and
areas, plus one final division to get thecrisp output. This requires 1309 clock
cycles. The IVD method requires 14
table lookups to get the moment and
area for each rule/pseudo-rule, 14
additions for the summation of each
rule’s moment and area, and one divi-
sion for the crisp output for a total 99
clock cycles—a reduction in clock
cycles of 94%.
SPACE
The sizes of the data tables
depend on the number of inter-vals for the rule strength and the
number of rules/pseudo rules. For 10
intervals of rule strength, Table 2 is
generated for the example in Figure 3.
Again, please note that the area and
moment arm for p2 and p4 are relative-
ly small when compared to the other
memberships. Removing p2 and p4
from the tables may be appropriate due
to these rules’ relatively small influ-
ence on the output. Also note that the
size of these tables are quite modest
when compared to direct input/output
map tables.
IVD
Influence Value Defuzzification
algorithms significantly reduce the
computational cost associated with
the final steps in standard max-min
(Mamdani) inference: aggregating the
output membership functions and
computing the center of area. In con-
trast to a straightforward implementa-
tion of max-min inference, the present
method does not rely on a discretiza-
tion of the output range, though it does
require a discretization of the range of
rule strength. The accuracy of the
computed center of area, as well as the
storage space required for the required
lookup tables, increases as this range
is discretized more finely.
Although I have concentrated on
output membership functions of trian-
gular or trapezoidal shape, the method
can be applied to more general shapes
without unduly increased on-line com-
putational cost of defuzzification. If
the overlap regions become more com-
plicated, the complexity of computing(off-line) the required lookup tables
(such as Table 2) will naturally
increase. The practical significance of
this method is that it permits max-min
inference to be executed on inexpen-
sive processors at relatively high
speed.
Dinu P. Madau is a product design
engineer with Ford Motor Company.
He has worked with embedded sys-
tems for 10 years. He is responsible
for software development in theChassis Electronic Systems depart-
ment of Advanced Vehicle
Technology. He received his under-
graduate degree from Oakland
University and his graduate degree in
Electronic and Computer Control
Systems from Wayne State University.
Madau can be reached electronically
TABLE 2 Influence value lookup tables for the example using 10 intervals for rule-strengths (note p4 areas and moments would be positive).
Area Table
RS: 0 1 2 3 4 5 6 7 8 9 10
Rule1 0 28 54 76 96 112 126 136 144 148 150
2 0 42 81 114 144 168 189 204 216 222 225
p1 0 -12 -21 -24 -25 -25 -25 -25 -25 -25 -25
3 0 37 70 99 124 146 163 177 187 193 195
p3 0 -31 -56 -73 -84 -88 -88 -88 -88 -88 -88
p2&p4 0 -2 -2 -2 -2 -2 -2 -2 -2 -2 -2
Moment TableRS: 0 1 2 3 4 5 6 7 8 9 10
Rule
1 0 406 732 985 1176 1312 1404 1459 1488 1498 1500
2 0 1587 2979 4181 5202 6046 6723 7237 7596 7806 7875p1 0 -282 -459 -536 -541 -541 -541 -541 -541 -541 -541
3 0 1684 3255 4699 5999 7141 8110 8890 9466 9822 9945
p3 0 -1347 -241 -3185 -3663 -3839 -3840 -3840 -3840 -3840 -3840
p2&p4 0 -50 -50 -50 -50 -50 -50 -50 -50 -50 -50