1999 iaea h|iha|
TRANSCRIPT
KR0100805
KAERI/TR-1632/2000
1999 IAEA H|iHA|
Participation in the 1999 IAEA InterlaboratoryComparison on Chemical Analysis of Groundwater

PLEASE BE AWARE THATALL OF THE MISSING PAGES IN THIS DOCUMENT
WERE ORIGINALLY BLANK

1999 IAEA «l5lAl^%v7p o\)
8-1
A •

J2_ ^T.I I
TIH ^ J *=^j" ttttt , 1
I. 1999 IAEA a] 57 x\ *) -7}. 2
1. %7}7i$\ 2
2. ofl«1 ^ 5
2.1 I B ^ I S . ^ 5
2.1.1 *1 S*fl fl 5
2.1.2 A l s ^ - ^ 5
3. «1 JUAl *| -g- A] s.^^ 9
3.1 A] g . ^ ^ ^ £L3£: 9
3.2 £- 4 Mov^ 4i 9
3.3 ICP-AES°fl 2]«b ^ - # ^ § - € - ^ 10
3.3.1 ICP-AES °1H ^ ^ ^ ? 1 3 L ^ A H V 10
3.3.2 The mechanism of the ultrasonic spray 10
3.3.3 Effect of acidity of the sample solution on sensitivity of wavelength 10
3.3.4 Metal hydride method 11
3.3.5 #^§ data ^ ^ 11
3.4 Ion chromatography°fl SJtt -§-°l^r •§"*} 14
3.4.1 <S ^ "?1 31 B Af«j- 14
34 2 H.S.T'l-S.nH))^ S ? i 14
3.4.3 A ] ^ . ^ ^ ) 5 ) 14
3.5 HCO3" # ^ 15
4. §-M 4 11 i 15
5. Hi IE A} ^ ^ jlf 18
II. IAEA Consultants' Meeting %7\ 20
1. s^^-8- 20
- 01 -

in. ^ 25
%3.&# 25
^ I
Assesment of the Chemical Analysis of Coldwater in Some Laboratories Participating in
Technical Cooperation Projects on Isotope Hydrology
Jf II
Recommended Improvements to Methodologies and Procedures for the Analysis of
Common Chemical Species of Water
- in -

IAEA Isotope Hydrology Laboratory°1H£- UNDP/RCA/IAEA 5 S ^ E <
KAccess to Clean Drinking Water)"# $]'$: ^ l * ] - ^ ^ Sl^Aj-g-
IAEA Interlaboratory Comparison for Chemistry of Coldwater, RAS/8/
084)* ^Ml0}, ^ n l , OrSe!?]-*]^ ^ T f ^ ^ f l ^ ^ z]-^- ^ * J ^ * cfl^^-S. 1999\1 5^.^^
^r IAEA71- *!•£)«}•£
r Si $\ (Consultants' Meeting) *
pH, ^ 7 ] ^ [ £ H , HCO3", Cl", SO/", NO3", SiO2, B, Li+, Na+, K\ Ca2+, Mg2+ *§• 13711
477fl
2] -@-M c-11 ol E] 7]
S } ^ ^ ^ ^^71-71- IAEA71- ^ ^ s } f e ^>^-S)5\(Consultant' Meeting)^! ^ € - ^ - 5 . %7\
: 7H
}^Z\] -L
- 1 -

I. IAEA «1HA]^ %7\
1. « l5L^r^^-7> ^
- 1999M 5€ - £ ^ } 2 3 ^ ^ < 2 ^ ^ 1 ( ^ ^ ) 5 - ^ IAEA?}-
- 1999V1 5€ IAEA Hydrology Laboratory S ^-B] Hl ja^ -^^s .^ .^ ^ ^ S ( S . 1)
2).
a 1. GUIDELINES FOR 1999 INTERLABORATORY COMPARISON OF CHEMICAL
RESULTS UNDER RAS/8/084
1. The IAEA Hydrology Laboratory will prepare the following water sample to be
distributed to all participating laboratories'-
- low Cl concentration less than 30 mg/L.
- pH ranging from pH 6 to pH 8 at sampling source.
- One set of sample will be unacidified.
- Another set will be acidified using 2.5 mL of concentrated HNOs(at least AR
grade) per liter of sample.
2. Two water samples, consisting of 500 mL acidified and 500 mL unacidified portions
will be sent to all participating laboratories c/o the contact person to be submitted
by the participating countries.
3. All participating laboratories should measure and report the following parameters to

the IAEA. A format for reporting will be sent together with the sample.
pH, conductivity, HCO3, SO4, Cl, Na, K, Ca, Mg, Li, and NO3(optional), NH3, SiO2
Expected number of labs: 11 countriesx21abs 22
IAEA ref lab 1
Total 23
SCHEDULE:
Action ItemXMonth M A M J J A S O N D
Submission of names of participating labs X
Preparation of samples by IAEA X
Shipment to participating labs X
Measurements of unknowns by labs X
Submission to IAEA X
Evaluation by IAEA and reporting XXX
2.
: "1999 INTERLABORATORY COMPARISON OF CHEMICAL RESULTS UNDER
RAS/8/084" °11 %7\
Organizer : IAEA/Hydrology Laboratory
Sample : Groundwater(Cold Water)
Participating laboratories : e>\MM, ^ 1 , 4^-SJ^V *}^7} ^ %• 237fl
KAERI
- 3 -
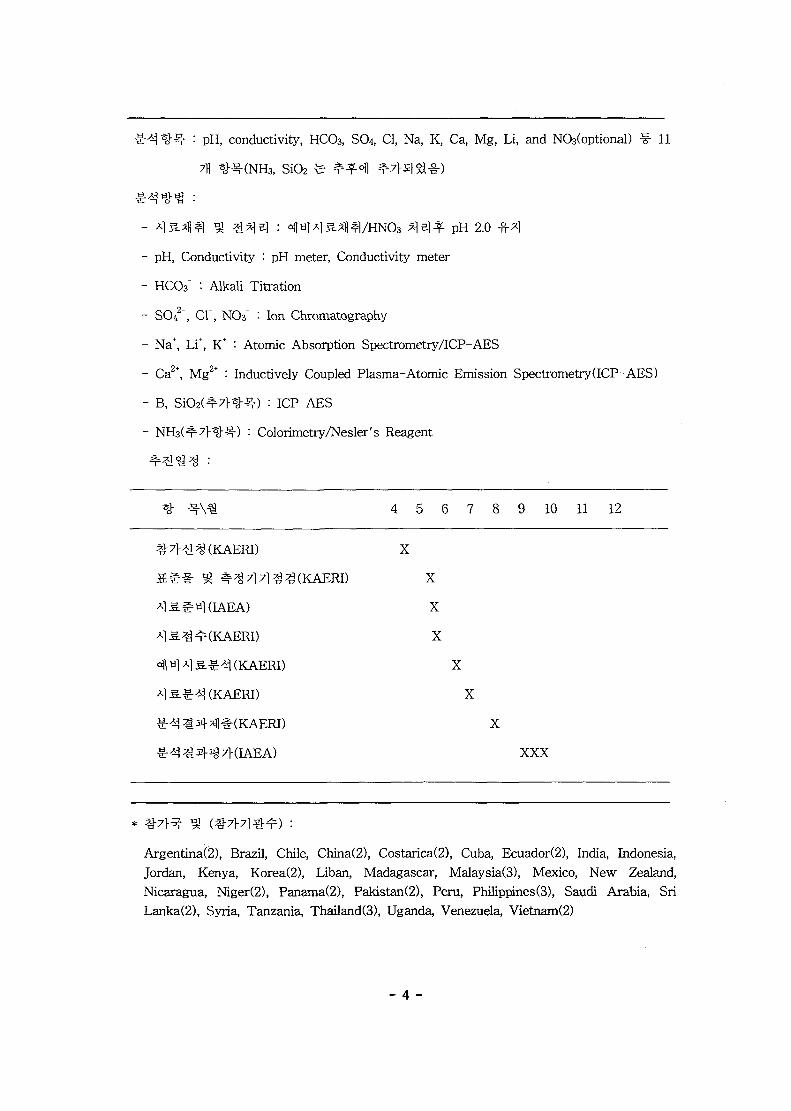
: P H , conductivity, HCO3, SO4, Cl, Na, K, Ca, Mg, Li, and NO3(optional) ¥ 11
3, SiO2 fe
pH 2.0 4M
pH, Conductivity : pH meter, Conductivity meter
HCO3" "• Alkali Titration
SO42 , Cl~, NO3 : Ion Chromatography
Na+, Li+, K* : Atomic Absorption Spectrometry/ICP-AES
Ca2+, Mg2+ : Inductively Coupled Plasma-Atomic Emission Spectrometry(ICP-AES)
B, SiO2(^7J-sj-s.) : ICP-AES
: Colorimetry/Nesler's Reagent
4 5 6 7 8 9 10 11 12
X
X
X
X
X
X
X
XXX
Argentina(2), Brazil, Chile, China(2), Costarica(2), Cuba, Ecuador(2), India, Indonesia,Jordan, Kenya, Korea(2), Liban, Madagascar, Malaysia(3), Mexico, New Zealand,Nicaragua, Niger(2), Panama(2), Pakistan(2), Peru, Philippines(3), Saudi Arabia, SriLanka(2), Syria, Tanzania, Thailand(3), Uganda, Venezuela, Vietnam(2)
- 4 -

2.
2.1. i ]
2.1.1 *]&%%
^ - ^ & S *] ( S a m p l e I, II)# 13H 500 mL ^ 2 Bottles » z^z]- 22]
9. 6. 21/99. 6. 24). ZJ- S H 4 1 Bottlei HNO3(Supra Pure)^ ^ pH 2.0 3
7\] *}3. M-^^l *ls.fe -tir^el S H 25 °C IncubatoHl 1«J a ^ t t ^ 4 ^ - ^ : 4 ^ ^ ^ § 1 -
^cf(99. 6. 22/99. 6. 25).
2.1.2 A ls .£^
^ ^ ^ ^ w o v ^ ^ . a ^ - ^ ^ 3 ^ £ - ^ M ^ ^ S * ^ « > ^ 4 . ^-«l Li+, Na+, K+ fe AAS
4 ICP-AES-1- ^o] ^-g-*}^ ^ ^ datal- &S. a]HSj-sa4. Na* 4 K* 2] ^ - f ICP-AES
7]- AAS i . t f s $ fe£: &-£ Ji^feEl] ^^)1 -4)- <Hl tfltb Ionic Balance*
AAS S t* ^ S i * «fl 2.43%, ICP-AES #•§• ^ S i i : "fl 4.04%S AAS St°l ci
^-S. Ionic Balance7> <2% «>1 « 1 - ^ * Date ° l s , >5% ° 1 ^
ionic balance7|- 5% °
Monochromator ^ Polychromator
3).
. ICP-AES
Ca, Mg, Si, B, Na, K, Li# #
3. Comparisorii of Data Measured between the Types of ICP-AES
^~^—^JCP-AES TypeElement ~—— _
Ca(ppm)
Mg(ppm)
Si(ppm)
B(ppb)
Na(ppm)
K(ppm)
Li(ppb)
Monochromator
23.2, 22.8, 23.6
2.59, 2.58, 2.57
19.9, 19.7, 20.3
-
-
-
-
Polychromator
23.3, 23.5, 23.3
2.49, 2.54, 2.56
19.7, 19.8, 19.4
<50
15.7, 15.7, 15.8
1.0, 1.1, 1.2
<50
X\s. :
- 5 -

3°1H iL?i Ca, Mg, Si -2] ^ - f monochromator ^ polychromator 2] ^ ICP-AES
£-§. i.o]i4 ; B, Na, K, Li 2] ^ - f monochromator ^l^fe °llr
^ £ monochromator ^ H f e " S ^ ^ i l - ^ 500 nm <>l#s]
588 nm, K 766 nm, Li 670 n m ) t # ^ ^ -r ^^1 nflE-o^, B ^ ^ - f ^ #
metal hydride ^-§- ^-§-§|-2-S. °]«fi 717H ^^S:0!] boron °1
^ ^ ^ §1^4 . I 4, i 5, I 6 D^ S 7°flfe 27B^ djnlAls.ofl
nfls] ionic balance* M-Bt-ifl cf. ^ ^ - f S.^ ionic balance
71- 5% o]* rS M-EJ-^^-H-S., ^ 1 ^ ^ ^ls)£7l- fe^ ^ J ^ S ^ ^ € 4 . ^-«I Na+ $• K+
°ll tfl«l|^fe ICP-AES &£.t\- AAS S-i- 61-§•«-§• "fl ionic balance &*} ^ ^ ^ &-I;
S. 4. PRELIMINARY TEST FOR INTERLABORATORY COMPARISON REPORT
• Major Water Chemistry(Sample I)
Parameter
pH
Conductivity
HCO3"
crSO/"
SiO2(Si)B
Na"(ICP)Na+(AA)K+(ICP)K+(AA)
Ca'+
Mg^Lf(ICP)Li+(AA)
NH3NO3"
(optional)Ionic
Balance
Dateof
Analysis
1999/6/22
MethodUsed InCodes(*)
PH
CM
TMICICPEPEPEAAPEAAPEPEPEAACO
IC
Units
pH units,24.5 °CuS/cm,24.5 °C
mg/Lmg/Lmg/Lmg/Lug/Lmg/Lmg/Lmg/Lmg/Lmg/Lmg/Lug/Lug/Lmg/L
mg/L
Result1
6.23
152
96.134.493.5419.9<5015.714.21.0
0.8523.22.59<50<5000.52
9.06
Result2
95.864.453.6119.7<5015.714.41.1
0.8622.82.58<50<500
9.04
Result3
96.084.483.8420.3<5015.814.41.2
0.9623.62.57<50<500
9.25
MeanResult
96.024.473.6620.0
15.714.31.1
0.8923.2
Std.Dev.(Is)
0.140.020.130.3
0.060.140.10.060.3
2.58 I 0.01
9.12
4.04%(2.43%)
0.09
*CODE Method
AA Atomic Absorption methods, PE Plasma emission methods
- 6 -

FE Flame emission method, CP Complexometric Ca and Mg
IC Ion chromatographic method, CO Colorimetric methods(UV-vis spectrophotometry)
TM Titrimetric Alkalinity determination, VD Volumetric determination
GM Gravimetric determination, IS Ion selective electrode
TU Turbidity method, PO Potentiometric determination
PH pH meter, CM Conductivity meter
3£ 5. Ionic Balance of Groundwater(Sample I)
Mass
Species
mg/L
mmol/L
meq/L
7
Li*
<0.05
<0.007
<0.007
23
Na+
15.7
(14.3)
0.683
(0.622)
0.683
(0.622)
39
K+
1.1
(0.89)
0.028
(0.023)
0.028
(0.023)
24
Mg*+
2.58
0.107
0.214
40
23.2
0.58
1.16
19
F"
-
-
-
35.5
cr
4.47
0.126
0.126
62
NO3"
9.12
0.147
0.147
61
HCO3"
96.02
1.547
1.574
96
S<V
3.66
0.038
0.076
* ( ) : AAS data
re = 2.085(2.019), ra = 1.923
e = (rc-ra)xl00/(rc+ra) = 4.04%(2.43%)
, r c : ° ^ o ] ^ ^ mequivalent
ra : - E M ^ I #• mequivalent
e : ionic balance
- 7 -
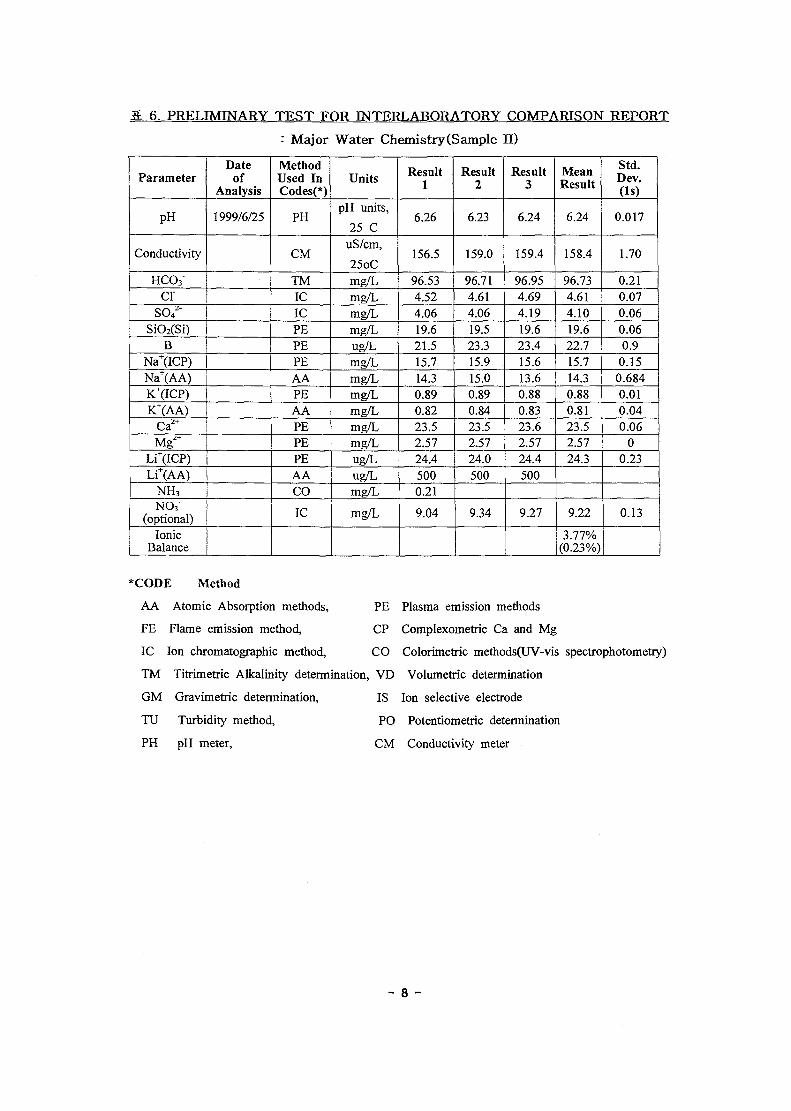
6. PRELIMINARY T E S T FOR INTERLABORATORY COMPARISON R E P O R T
'• Major Wate r Chemistry (Sample II)
Parameter
pH
Conductivity
HCO3"CY
SO/"SiO2(Si)
BNa+(ICP)Na^(AA)K"(ICP)K+(AA)
Ca'+
Dateof
Analysis
1999/6/25
Mg2+ |Li+(ICP)Li+(AA)
NH3NO3'
(optional)Ionic
Balance
MethodUsed InCodes(*)
PH
CM
TMICICPEPEPEAAPEAAPEPEPEAACO
IC
Units
pH units,
25 CuS/cm,
25oCmg/Lmg/Lmg/Lmg/Lug/Lmg/Lmg/Lmg/Lmg/Lmg/Lmg/Lug/Lug/Lmg/L
mg/L
Result1
6.26
156.5
96.534.524.0619.621.515.714.30.890.8223.52.5724.45000.21
9.04
Result2
6.23
159.0
96.714.614.0619.523.315.915.00.890.8423.52.5724.0500
9.34
Result3
6.24
159.4
96.954.694.1919.623.415.613.60.880.8323.62.5724.4500
9.27
MeanResult
6.24
158.4
96.734.614.1019.622.715.714.30.880.8123.52.5724.3
9.22
3.77%(0.23%)
Std.Dev.(Is)
0.017
1.70
0.210.070.060.060.9
0.150.6840.010.040.06
00.23
0.13
*CODE Method
AA Atomic Absorption methods,
FE Flame emission method,
IC Ion chromatographic method,
PE Plasma emission methods
CP Complexometric Ca and Mg
CO Colorimetric methods(UV-vis spectrophotometry)
TM Titrimetric Alkalinity determination, VD Volumetric determination
GM Gravimetric determination, IS Ion selective electrode
TU Turbidity method, PO Potentiometric determination
PH pH meter, CM Conductivity meter
- 8 -

IE. 7. Ionic Balance of Groundwater(Sample II)
Mass
Species
mg/L
mmol/L
meq/L
7
Li+
<0.024
(0.5)
<0.004
«0.07)
<0.004
«0.07)
23
Na*
15.7
(14.3)
0.683
(0.622)
0.683
(0.622)
39
K+
0.88
(0.82)
0.023
(0.021)
0.023
(0.021)
24
Mg2+
2.57
0.107
0.214
40
Cazt
23.5
0.59
1.18
19
F"
-
-
-
35.5
cr
4.61
0.130
0.130
62
NO3"
9.22
0.149
0.149
61
HCO3"
96.73
1.586
1.586
96
SO/"
4.10
0.043
0.086
* ( ) : AAS data
re = 2.104(2.041), ra = 1.951
e = (rc-ra)xlOO/(rc+ra) = 3.77%(0.23%)
, re : <£61-€T-°-1 %- mequivalent
ra : -§-ol-&£] %• mequivalent
e : ionic balance
3.
3.1
IAEA/Hydrology Laboratory 3,-fEi 500 mL
* ^1^*M 25 °C thermostated incubator <1
2 bottles(AcidifiedAJnacidfied)
3.2 ^ r ^
3.2.1 £ ^
3.2.2
5 - 20
3.2.3
Mg ; ICP-AES, SO4 ; Ion Chromatography)^
B) ic nebulizer)
- 9 -
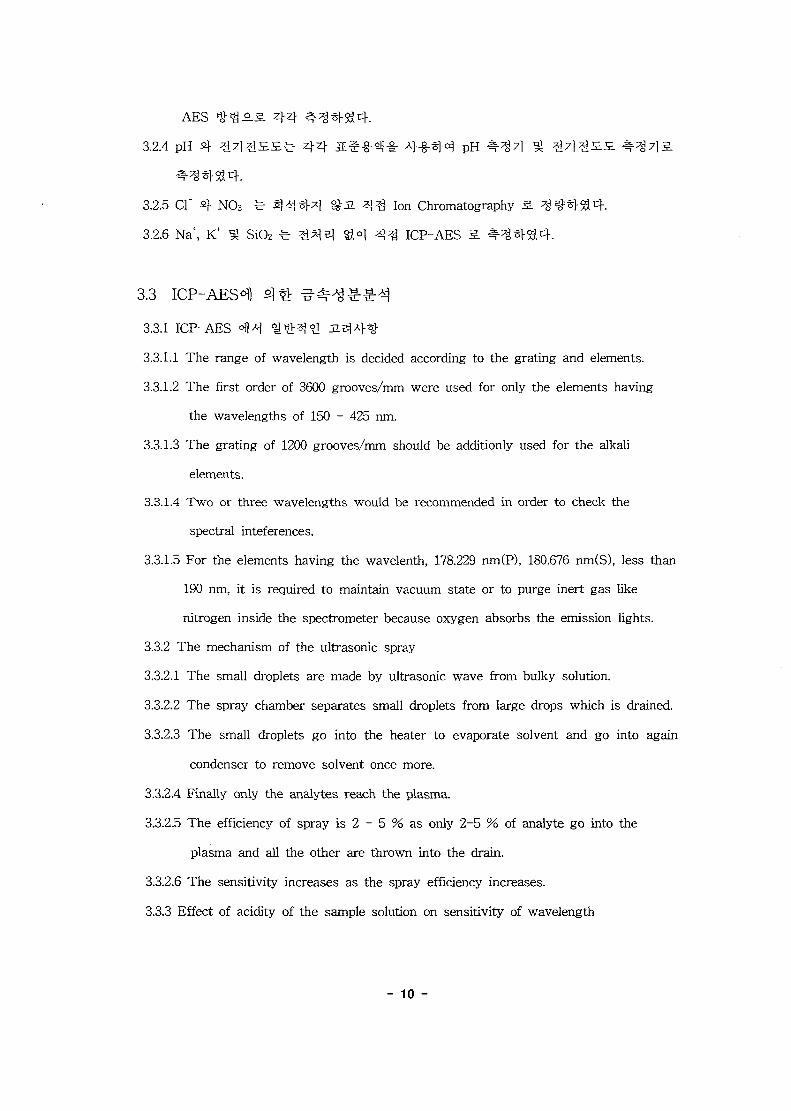
AES l ^ i
3.2.4 pH s\ ^
3.2.5 Cf fif N03" fe- 3H*r*l ^ J I 3 ^ Ion Chromatography
3.2.6 Na+, K+ % SiO2 fe- 3*13 8M 3 3 ICP-AES 5.
3.3 ICP-AES <i
3.3.1 ICP-AES °fl*
3.3.1.1 The range of wavelength is decided according to the grating and elements.
3.3.1.2 The first order of 3600 grooves/mm were used for only the elements having
the wavelengths of 150 - 425 nm.
3.3.1.3 The grating of 1200 grooves/mm should be additionly used for the alkali
elements.
3.3.1.4 Two or three wavelengths would be recommended in order to check the
spectral inteferences.
3.3.1.5 For the elements having the wavelenth, 178.229 nm(P), 180.676 nra(S), less than
190 nm, it is required to maintain vacuum state or to purge inert gas like
nitrogen inside the spectrometer because oxygen absorbs the emission lights.
3.3.2 The mechanism of the ultrasonic spray
3.3.2.1 The small droplets are made by ultrasonic wave from bulky solution.
3.3.2.2 The spray chamber separates small droplets from large drops which is drained.
3.3.2.3 The small droplets go into the heater to evaporate solvent and go into again
condenser to remove solvent once more.
3.3.2.4 Finally only the analytes reach the plasma.
3.3.2.5 The efficiency of spray is 2 - 5 % as only 2-5 % of analyte go into the
plasma and all the other are thrown into the drain.
3.3.2.6 The sensitivity increases as the spray efficiency increases.
3.3.3 Effect of acidity of the sample solution on sensitivity of wavelength
- 10 -

3.3.3.1 The acidities of the standard solution and sample solution are required to be
same.
3.3.3.2 "The higher the acidity the lower the sensitivity"
3.3.4 Metal hydride method
3.3.4.1 The sensitivities of the elements such as As, Bi, Ge, Hg, Sb, Se and Te are
increased by making their metal hydrides with hydrochloric acid in ICP-AES.
3.3.4.2 As and Se are measured in 3 - 5 M HC1 medium after reducing As from
As(V) to As(III) and Se from Se(VI) to Se(IV), respectively, because metal
hydride is more easily made at lower oxidation states.
S. 8. ICP-AES
Element
B
B
Ca
Ca
Mg
Mg
Wavelength/nm
249.678
249.773*
393.366*
396.847
279.553*
280.270
Element
Si
Si
Li
K
Na
wavelength/nm
212.412
251.611*
670.776
766.490
589.592
* : more sensitive line
3.3.5 # ^ data
ICP-AES°fl
1^ ICP-AES
] ICP-AES 1
El-
S.
; g. 8
o. I 9 1c T ft
10 °1|^ ICP-AES(AAS)
- 11 -

S. 9. ICP-AES
Spectrometer
- System
- Focal length
- Mounting
- Grating
Light path
Torch
Nebulizer
Spray chamber
Gas flows
- Outer
- Sheath
- Aerosol carrier
Sample uptake rate
Incident power
Integration times
Observation height
JY 38 PLUS
Sequential type
1 m
Czerny-Turner optical mount
3600 grooves/mm
N2 purging below 190 ran
Fassel type
Meinhard type CUltrasonic
Scott type
12 L / min
0.3 L / min
0.3 L / min
Meinhard 1 mL / minUltrasonic 3 mL/ min
1000 W
3 X 0.5
15 mm above coil
JY 50 P
Simultaneous type
0.5 mPaschen-Runge optical mount
3600 grooves/mm1200 grooves/mm for alkali
N2 purging below 190 nm
Fassel type
Meinhard type CUltrasonic
Scott type
12 L / min0.3 L / min
0.6 L / min for alkali metals
0.3 1 / min
Meinhard 1 mL / minUltrasonic 3 mL/ min
1000 W
3 X 5
15 mm above coil
- 12 -

10. ICP-AES ^ AAS
Element
Ca(ppm)
Mg(ppm)
Si(ppm)
Btob)
Na(ppm)
Li(ppb)
K(ppm)
10«
20«
5afl
10»
20«
Jejj
833
iq
$m833833i^
10*83320«
Std.Std.Std.Std.Std.Std.Std.Std.Std.Std.Std.
833Calib.
Add.
Calib.
Add.
Add.
Add.
Calib.
Add.
calib.
Add.
Add.
ICP-AES(l)
97.5, 94.5
96, 96, 95
98.0, 96.4
19.9,
21.6,
4.2,
4.3,
2.7,
47.1,
46.5,
9.4,
4.8,
5.2,
224,
93.4,
4.8,
2.5,
4.8,
19.6,
21.4
21.8,
21.4
4.2,
4.2,
2.3,
45.1,
46.0,
9.5,
4.3,
5.3,
8.4
225,
93.4,
4.8,
2.6,
4.7,
19.7
21.8
4.2
4.2
3.0
45.6
47.4
9.4
4.7
6.1
222
93.1
4.7
2.6
4.8
ICP-AES(2)
92.0,
88.0,
19.7,
19.5,
3.7,
97.4
93.1
92.7,
88.0,
18.5
19.9,
19.6,
4.1
3.5,
45
90.6
89.2
20.3
19.2
3.6
ICP-AES(3)
91.0, 91.5, 90.5,
90.7**contaminated
92.0, 95.8, 89.6,
92.0**, 92.6**19.2, 19.1, 19.4
19.9, 20.0, 20.3
20.9, 21.9, 21.8
17.4, 19.3, 18.9
AAS
9.5,
80,
4.6,
9.4, 9.5-
9.3-
90, 90-
4.6, 4.4
-
4.4
# Ca : ICP-AES(l) : 393.366nm, 396.847 nm, 10*11 ^ ^ (polychro. 393.366nm) ; analyst 1ICP-AES(2) : 393.366nm ; analyst 2ICP-AES(3) : 317.933nm, 393.366 nm, 396.847 nm ; analyst 3(5 point
calibration) ** : two point calibrationMg : ICP-AES (3) : 279.553 nm, 280.270nm, 285.213nm
- 13 -

3.4 Ion chromatography^] $& •%•%•<>]•$:
3.4.1
3.4.1.1 Selection of separating column for analytes : resolution, separating time(column
capacity), eluant(preparation/purchasing)
3.4.1.2 Decision of injection amount of sample : column capacity, sample loop, sample
concentration, dilution, concentration, overload etc.
3.4.1.3 Considering interfering ions '• survey of interfering ions, checking of peak
shapes
3.4.1.4 Calibration curve : using standard solution, controlling the sample peak position
to be at the position of 2/3 of calibration curve.
3.4.1.5 making a calibration curve with 3 - 4 point of different concentrations.
3.4.1.6 Free from contamination from laboratory environmentals, for example, Cl~
3.4.1.7 Invalid standard solution
3.4.1.8 Laboratory temperature might cause retention change and injection volume
3.4.2
3.4.2.1 Anion analytes : Cl", NO3 , SO42 in groundwater
3.4.2.2 ^3i& :
DX-100 chromatographic system, Dionex Co.
Analytical column : IonPac AS14(4 mm x 250 mm, 65 ^eq/columnm)
Guard column : IonPac AG14(4 mm x 50 mm)
Eluant : 3.5 mM NjteCOa/l.O mM NaHCOs
Sample Loop ". 20fiL
Flow rate : 1.2 mL/min.
Detector : Suppressed conductivity, ASRS(Anoin Self-Regenerating Suppressor)
recyle mode
Standard solutions of anions : "Aqua Standards" purchaised
3.4.3
SO42 : 3 times, 5 times dilution, respectively
- 14 -

Cl , NO3 '• direct injection without dilution
11
11. Ion Chromatogranhv
z|-2]-
Cf(ppm)
N(V(ppm)
SO/lppm)
<£ofl
3.3afl S ^
5«l|3H
3.3afl^^4
3.3«11^^
IC(1)
3.86
4.00
3.98
6.41
6.42
6.11
136.5
123.0
114.6
«*K1S)0.034
0.089
0.063
0.035
0.200
0.262
0.82
2.60
2.80
IC(2)
3.80
3.79
3.89
6.30
6.22
6.16
134.8
117.4
116.0
€*K1S)0.049
0.095
0.074
0.051
0.095
0.115
0.29
0.62
1.43
* IC(1) : 7/1
IC(2) : 7/2
3.5 HCO3" #^2:?i
3.5.1 Sample volume taken : 20 mL
3.5.2 HC1 standard solution : 0.01 N standardized by 0.04 N
3.5.3 10 mL buret : 0.001 mL unit, Metrohm 725 Dosimat
3.5.4 End point : pH 4.50
4.
. 3.
balance 7f 5%
^ - ^ l ^ l - ^ ionic balance* 5. 12^- 3. 13^]
i0 nic balance 7} 0.9% S. q-Ej-^jS.^ «>1 ^ ^ f e ionic
H.711
- 15 -

12. INTERLABORATORY COMPARISON REPORT; Maior Water Chemistry
(IAEA Groundwater Sample)
Parameter
pH
Conductivity
HCO3"
crS O /SiO2
BNa+
Ca*+
Mg2+
Li+
NH3NO3"
(optional)
Ionic Balance
Dateof
Analysis
1999/7/01
MethodUsed InCodes(*)
PH
CM
TMICICPEPEAAPEPEPEPECO
IC
Units
pH units,
25 CuS/cm,
25oCmg/Lmg/Lmg/Lmg/Lmg/Lmg/Lmg/Lmg/Lmg/Lmg/Lmg/L
mg/L
%
Result1
7.76
536
244.33.85117.68.98
0.04719.44.891.019.9
0.0943(0.5)
6.35
0.6
Result2
7.75
545
244.23.78115.08.98
0.04519.54.891.820.0
0.0934
6.25
1.1
Result3
7.76
539
244.23.76115.48.77
0.04569.44.792.020.1
0.0931
6.29
1.3
MeanResult
7.76
540
244.33.80116.08.91
0.04599.44.891.620.0
0.0936
6.30
0.9
Std.Dev.(Is)
0.01
5
0.060.051.4
0.120.0010.060.060.50.1
0.0006
0.05
0.4
CODE Method
AA Atomic Absorption methods,
FE Flame emission method,
IC Ion chromatographic method,
CODE Method
PE Plasma emission methods
CP Complexometric Ca and Mg
CO Colorimetric methods(UV-vis spectrophotometry)
TM Titrimetric Alkalinity determination, VD Volumetric determination
GM Gravimetric determination, IS Ion selective electrode
TU Turbidity method, PO Potentiometric determination
PH pH meter, CM Conductivity meter
* ( ) : NH3 data fe * H # s M
- 16 -
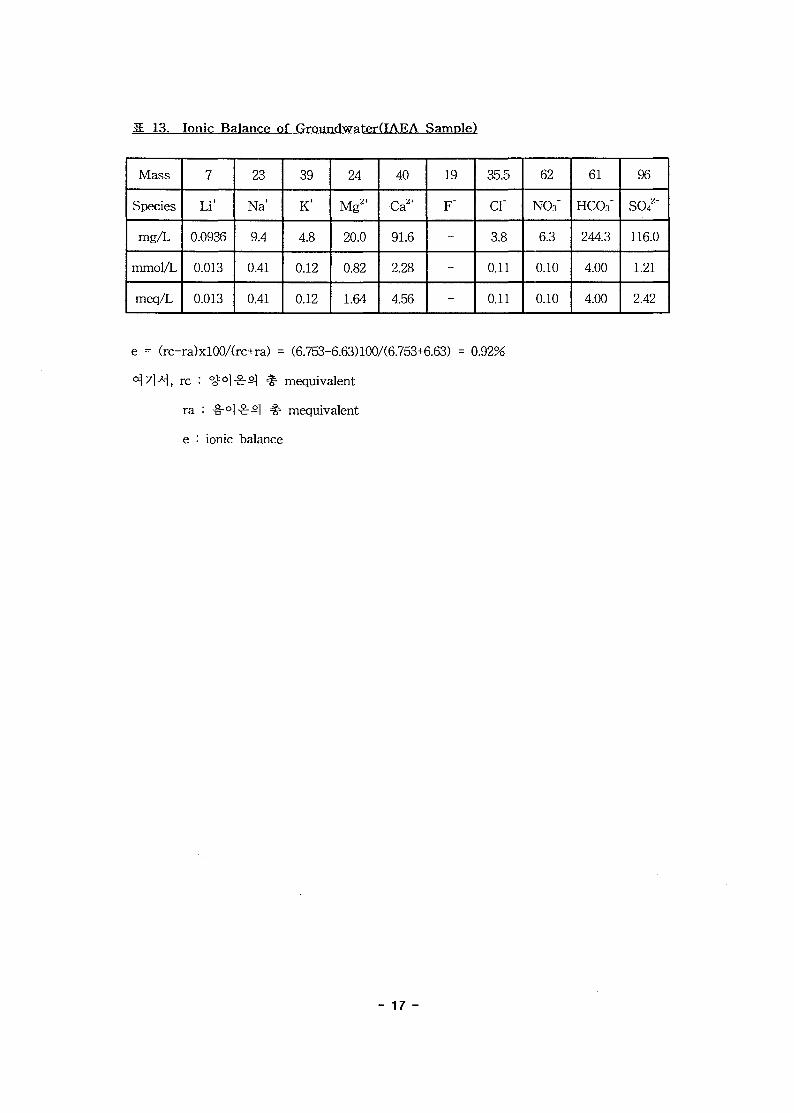
3£ 13. Ionic Balance of GroundwaterdAEA Sample)
Mass
Species
mg/L
mmol/L
meq/L
7
Li+
0.0936
0.013
0.013
23
Na+
9.4
0.41
0.41
39
K+
4.8
0.12
0.12
24
Mg*
20.0
0.82
1.64
40
Ca*
91.6
2.28
4.56
19
F '
-
-
-
35.5
cr
3.8
0.11
0.11
62
NO3"
6.3
0.10
0.10
61
HCO3"
244.3
4.00
4.00
96
SO/"
116.0
1.21
2.42
e = (rc-ra)xl00/(rc+ra) = (6.753-6.63)100/(6.753+6.63) = 0.92%
, re : °<M-8rS] %• mequivalent
ra : -§-°l£s] #• mequivalent
e : ionic balance
- 17 -
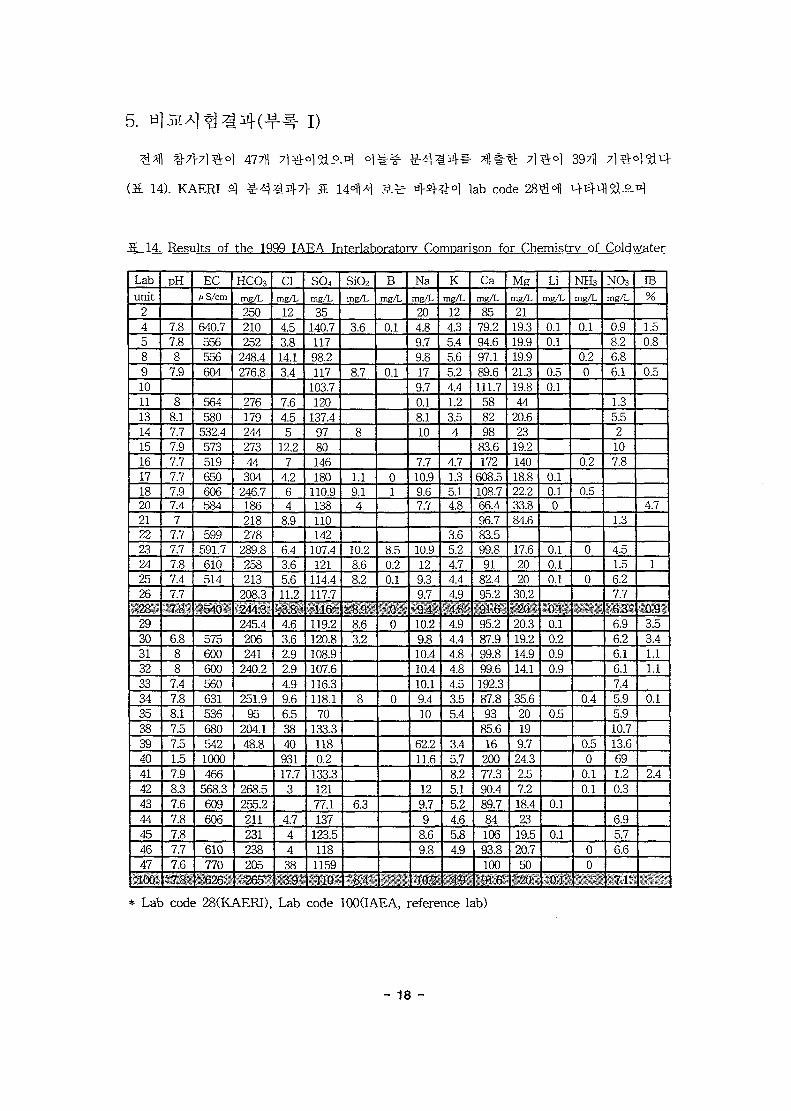
5.
397H
(5 . 14). KAERI S] lab code 28^^)1
it 14. Results of the 1999 IAEA Interlaboratorv ComDarison for Chemistry of Coldwater
Labunit
24589101113141516171820212223242526
•28"'2930313233343538394041424344454647100
PH
7.87.88
7.9
88.17.77.97.77.77.97.47
7.77.77.87.47.77,8
6.888
7.47.88.17.57.51.57.98.37.67.87.87.77.67.8
EC/iS/cm
640.7556556604
564580
532.4573519650606584
599591.7610514
"--540 •
5756006005606315366805421000466
568.3609606
610770626
HCO3
mg/L
250210252
248.4276.8
27617924427344304
246.7186218278
289.8258213
208.3244.3245.4206241
240.2
251.995
204.148.8
268.5255.2211231238205265'
Clmg/L124.53.814.13.4
7.64.55
12.27
4.264
8.9
6.43.65.611.23.8^4.63.62.92.94.99.66.5384093117.7
3
4.744383.9
SO4
mg/L
35140.711798.2117
103.7120
137.49780146180
110.9138110142
107.4121
114.4117.77,116/119.2120.8108.9107.6116.3118.170
133.31180.2
133.312177.1137
123.51181159110
SiO2
mg/L
3.6
8.7
8
1.19.14
10.28.68.2
<f&98.63.2
8
6.3
-8.4
B
mg/L
0.1
0.1
01
8.50.20.1
00
0
Namg/L
204.89.79.8179.70.18.110
7.710.99.67.7
10.9129.39.79.4-10.29.810.410.410.19.410
62.211.6
129.79
8.69.8
10.2
Kmg/L
124.35.45.65.24.41.23.54
4.71.35.14.8
3.65.24.74.4494.84.94.44.84.84.53.55.4
3.45.78.25.15.24.65.84.9
49
Camg/L
8579.294.697.189.6111.7
588298
83.6172
608.5108.766.496.783.599.891
82.495 291.695.287.999.899.6192.387.893
85.616
20077.390.489.78410693.810091.6
MR
mg/L
2119.319.919.921.319.844
20.623
19.214018.822.233.884.6
17.62020
30 220-
20.319.214.914.1
35.620199.724.32.57.218.423
19.520.75020
Limg/L
0.10.1
0.50.1
0.10.10
0.10.10.1
0.10.10.20.90.9
0.5
0.1
0.1
0.1
NH3mg/L
0.1
0.20
0.2
0.5
0
0
0.4
0.50
0.10.1
00--
NO3mg/L
0.98.26.86.1
1.35.52107.8
1.3
4.51.56.27.76.3^6.96.26.16.17.45.95.910.713.6691.20.3
6.95.76.6
7.1
IB%
1.50.8
0.5
4.7
1
0.93.53.41.11.1
0.1
2.4
* Lab code 28(KAERI), Lab code 100OAEA, reference lab)
- 18 -

(reference labs] 3|°13*1- °i^)^), S $ A
3|- KAERI
j ^ j - 2 ) . ^BJ-AJ ^ IAEA
Hydrology Laboratory ^ Ef <g^7l^ro)] ^
S ^ ^ ^ ° l ] ^ 1 # ^ ^ S . 3-ojSH KAERIS1
4.
- 19 -

II. IAEA Consultants' Meeting %7\
KAERI 3\ ^^o] - f ^ T f l M-Bf -cfl ^ ^ 7 1 ^«1 IAEA
Hydrology Laboratory <*Hfe S ^ ^ r ^ ^ S . n ^ s l t e Consultants' Meeting-i; 1999VI
12€ 6^^ -B] 12€ 8O4?M 3<S ^<£ IAEA £4- A1782 3 ^ 4 H H 7fl -&}Sa . £ s |£H
i ^ l ^ i -*]-%!• xr ^ .^"^ Station d'Hydrobiologie Lacustre Institut National de Recherche
Agronomique 'S^rt-Sl Paul Blanc, -Tf^^S. Wairakei Analytical laboratory Institute of
Geological and Nuclear Science " S T 1 ^ ^ Desmond Chan, He}?! Philippine National Oil
Company-Energy Development Corporation $\*}2\ Rowena Isidro, ^L^JL t t ^ -^ i^^^T 2 -
± 3^7]^r ¥ 4 ^ ^ l ^ A ^ , ZLSi\ ;g.H.Ai<y IAEA Hydrology Laboratory«H] i Marina
Dargie, Johanna Lippman, Jane Gerado-Abaya, Manfred Groening -§-°l %7l-*}-< %- 8"^-^.
397fl
ifl-g-
S. 15 oflfe- ^ ^ l ^ l ^ ^ l tfltb ^ l ^ ' S ^ * M - ^ a ^ K A E R I ( a 7 ] ^ ) i A ^ "Quality
System Management Compiled to ISO/DSC Guide 25 Requirements in KAERI" It ^1^-A
S, ¥&m * > ^ 4 . ^ -^ S ^ - i INRACMr. Paul Blanc)°fl^ "Role of chemitry and the
analysis of physico chemical constituent, sampling, field measurement and laboratory
analysis" ft ^1^-^.S., T T ^ € ^ IGNS(Mr. Desmond Chan)°fl^| "Your analysis is only as
good as the weakest link" Q $]^±£., a s ] ! | s ] ^ 2 j PNOC-EDC(Ms. Rowena
Alvis-Isidro)°1]^ "Towards Compliance to ISO/EEC Guide 25 Laboratory Accreditation:
the PNOC EDC Experiences"
A
- 20 -

S. 15.
CONSULTANT'S MEETING
Preparation of Recommended Improvements to Methodologies and Procedures forthe Analysis of Common Chemical Species of Water
Meeting Room A1782
IAEA Headquaters, Vienna
December 6-8, 1999
Provisional Agenda
OBJECTIVE:
To examine the possible solutions and improvements of methodologies for chemical
analysis of common species of water.
Scientific Secretaries:
Jane Gerado-Abaya and Manfred Groening
Monday, 6 December 1999
0900 Registration
0930 Opening of the Meeting
Remarks : Dr. Pradeep Aggarwal - Head, Isotope Hydrology Section,
IAEA
Administrative Arrangements
1000-1015 Coffee Break
1015-1030 Background and objectives of the meeting - J. Gerado-Abaya, IAEA
1030-1100 Practices for quality assurance in Isotope Hydrology Laboratory, IAEA
by M. Groening, IAEA
Part 1: Presentation of the results of interlab comparison exercises
1100-1130 Results of the 1999 Interlaboratory Comparison for Chemistry of
Coldwater by J.Gerado-Abaya, J.Lippmann and M. Dargie, IAEA
- 21 -
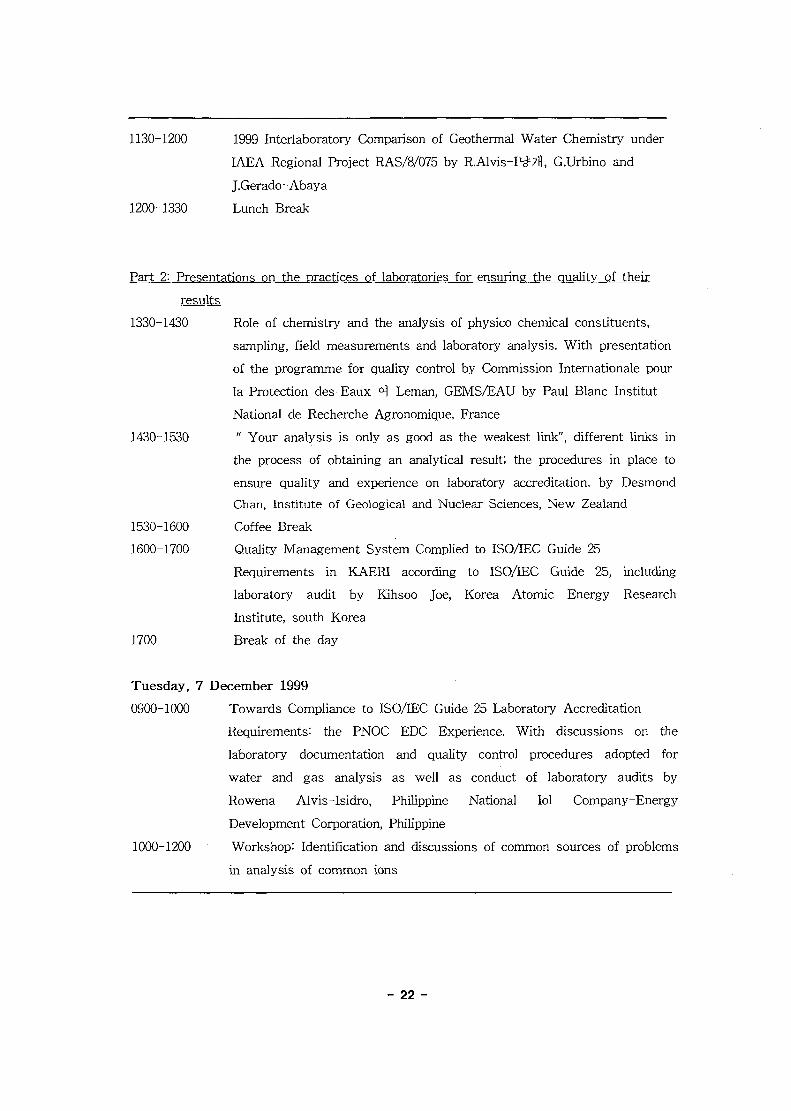
1130-1200 1999 Interlaboratory Comparison of Geothermal Water Chemistry under
IAEA Regional Project RAS/8/075 by R-Alvis-I^ti, G.Urbino and
J.Gerado-Abaya
1200-1330 Lunch Break
Part 2: Presentations on the practices of laboratories for ensuring the quality of their
1330-1430 Role of chemistry and the analysis of physico chemical constituents,
sampling, field measurements and laboratory analysis. With presentation
of the programme for quality control by Commission Internationale pour
la Protection des Eaux ^ Leman, GEMS/EAU by Paul Blanc Institut
National de Recherche Agronomique, France
1430-1530 " Your analysis is only as good as the weakest link", different links in
the process of obtaining an analytical result; the procedures in place to
ensure quality and experience on laboratory accreditation, by Desmond
Chan, Institute of Geological and Nuclear Sciences, New Zealand
1530-1600 Coffee Break
1600-1700 Quality Management System Complied to ISO/lEC Guide 25
Requirements in KAERI according to ISO/IEC Guide 25, including
laboratory audit by Kihsoo Joe, Korea Atomic Energy Research
Institute, south Korea
1700 Break of the day
Tuesday, 7 December 1999
0900-1000 Towards Compliance to ISO/IEC Guide 25 Laboratory Accreditation
Requirements: the PNOC EDC Experience. With discussions on the
laboratory documentation and quality control procedures adopted for
water and gas analysis as well as conduct of laboratory audits by
Rowena Alvis-Isidro, Philippine National Iol Company-Energy
Development Corporation, Philippine
1000-1200 Workshop: Identification and discussions of common sources of problems
in analysis of common ions
- 22 -

Discussions on solutions and improvements of methodologies for
chemical analysis of common species of water
1200-1330 Lunch Break
1330-1700 Continuation of workshop ...
Preparation of guidelines for improvements of the quality of Member
State's chemical results
Wednesday, 8 December 1999
0900-1200 Finalization of outputs
1200-1330 Lunch Break
1330-1530 Presentation of outputs
1530-1600 Coffee Break
1600-1700 Preparation of final report
Closing of the meeting
- 23 -

2. * i t § K ^ *1^1 ^ H K ^ n)
, pH # 3 , Bicarbonate, Boron, Total Silica, ICP-AES°fl
, AAS°fl £}*V ^ " ^ ^ f t , ^fsl€-
, Ion Chromatography^] ^ t t -g
"Recommended Improvements to Methodologies and Procedures for the Analysis of
Common Chemical Species of Water"
- 24 -
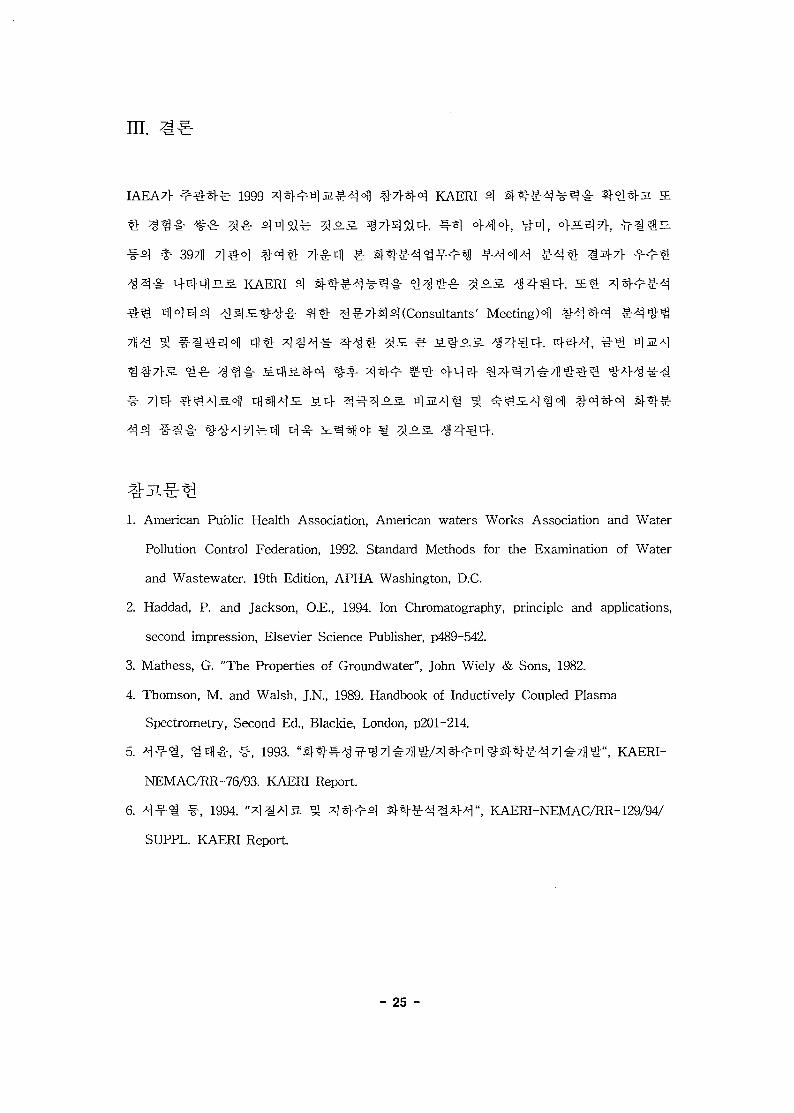
III.
IAEA71- ^^-§}fe 1999 *]*Hr«lH>g-<iH %7}-5}<$ KAERI
ft ^^-i" *
¥ 3 # 397fl
s. KAERI
- t i s j ^ ^ ^ - i : ^-& ^^7>s]5](Consultants' Meeting)^
711-S 5J f
1. American Public Health Association, American waters Works Association and Water
Pollution Control Federation, 1992. Standard Methods for the Examination of Water
and Wastewater. 19th Edition, APHA Washington, D.C.
2. Haddad, P. and Jackson, O.E., 1994. Ion Chromatography, principle and applications,
second impression, Elsevier Science Publisher, p489-542.
3. Mathess, G. "The Properties of Groundwater", John Wiely & Sons, 1982.
4. Thomson, M. and Walsh, J.N., 1989. Handbook of Inductively Coupled Plasma
Spectrometry, Second Ed., Blackie, London, p201-214.
5. *\¥<&, •*n&, ^ , 1993. ' m v ^ W ^ 7 l # 7 l ! W * l * r ^ l ^ « ] - & ^ 7 l £ 7 l l t r , KAERI-
NEMAC/RR-76/93. KAERI Report.
6. - ^ I * , 1994. "^^^S- ^ *1*K^ S f t ^ A j ^ M " , KAERI-NEMAC/RR-129/94/
SUPPL. KAERI Report.
- 25 -

Assesment of the Chemical Analysis of Coldwater inSome Laboratories Participating in Technical CooperationProjects on Isotope Hydrology
ASSESSMENT OF THE CHEMICAL ANALYSIS OF COLDWATERIN SOME LABORATORIES PARTICIPATING IN TECHNICAL COOPERATION
PROJECTS ON ISOTOPE HYDROLOGY
by
J.Gerardo-Abaya, J. Lippmann and M. Dargie
February 2000
Isotope HydrologyInternational Atomic Energy Agency
Vienna, Austria

ASSESSMENT OF THE CHEMICAL ANALYSIS OF COLDWATER INSOME LABORATORIES PARTICIPATING INTECHNICAL COOPERATION PROJECTS ON ISOTOPE HYDROLOGY
JANE GERARDO-ABAYA, JOHANNA LIPPMANN
and MARINA DARGIE
Isotope Hydrology SectionInternational Atomic Energy AgencyVienna
1. INTRODUCTION
An assessment of the results of the chemical analysis of coldwater in laboratoriesparticipating in the UNDP/RC A/IAEA project in Asia, RAS/8/084, Access to Clean DrinkingWater was conducted by the International Atomic Energy Agency (IAEA) in May 1999. Thisexercise was extended to other regions which have active Technical Co-operation (TC)projects with the IAEA. As all the three previous exercises of the same nature proved to be ofsignificant value to the improvement and assurance of high quality analytical results inparticipating laboratories, this assessment was organised:
• to assess the chemical results of laboratories which are providing analytical servicesto various TC projects for chemical species commonly used in water resourcesinvestigations; and
• to determine areas where improvements in chemical analyses are required.
The assessment of chemical results was by statistical analysis and did not examine thedetailed analytical procedures employed by the participating laboratories. It is, thus, beyondthe scope of this report to provide an extensive examination of the potential reasons attributedto differing procedures and equipment in the different laboratories if the reported chemicalresults are variable.
Natural samples were sent to 47 hydrochemical laboratories in 31 Member States inAsia, Latin America, the Middle East and Africa (Annex 1), with the IAEA IsotopeHydrology Laboratory serving as the reference laboratory. A total of 39 results (81% turn-out)were received and are evaluated in this report.
2. PROCEDURE FOR SAMPLE PREPARATION AND DISTRIBUTION
The Isotope Hydrology Laboratory prepared two sets of samples from a drinking watersource. Due to low concentrations of NO," and Na\ the samples were artificially spiked withNaNO3 The samples consisted of: 1) half a litre of water acidified with 2.5 ml of concentratedHNO3"; and 2) half a litre of unacidified water. These were distributed to all participants inMay 1999. All participating laboratories were requested to measure the pH, EC as well as theconcentrations of the following chemical species: HCO3", Cl\ SO4
2~, SiO2, Na+, K \ Ca2+, Mg2+,Li*, B, NH4
+ and NO3" (which was optional), and to report results, including the ionic balanceas well as the analytical methods, according to the format attached as Annex 2.

RESULTS OF THE 1999 IAEA INTERLABORATORY COMPARISON FOR CHEMISTRY OF COLD WATER
Lab no
no.
24
5
8
9
1011
13
14
15
16
17
18
2021
2223
24
2526
l ^ 28
3031323334
353839
4041
42
434445
4647
100 (IAEA)±SD (IAEA)
PH
7.87.88.07.9
8.08.17.77.97.77.77.97.4
7.0 '#7.77.7
7.8
7.4
7.77.8
7.88.08.07.4
7.8
8.17.57.5
1.5*#7.9
8.3 #7.67.87.8
7.77.6
7.8±0.01
• EC
640.7556.0525.7604.0
564.0580.0532.4573.0519.0650.0606.0584.0
599.0591.7610.0514.0
540.0
575.0600.0600.0560.0631.0536.0680.0542.0
1000.0 •466.0568.3609.0606.0
610.0770.0 •
626.0±1.2
HCO3-1
250.0210.0252.0248.4276.8
276.0179.0244.0273.044.0 "
304.0246.7186.0218.0278.0289.8258.0213.0208.3244.3245.4206.0241.0240.2
251.995.0 •
204.148.8 *
268.5255.2211.0231.0238.0205.0265.0±1.4
Cl
12.0 '4.53.8
14.13.4
7.6 •4.55.0
12.2 '7.0
4.2
6.0
4.0
8.9 •
6.4
3.6
5.6
11.2 '3.84.63.6
2.92.94.9 '9.6 *6.5
38.0 '40.0 '
931.0 "17.7 *3.0
4.7
4.0
4.0
38.0 •3.9
±0.1
SO4
35.0140.7117.098.2
117.0103.7120.0137.497.080.0
146.0180.0110.9138.0110.0142.0107.4121.0114.4117.7116.0119.2120.8108.9107.6116.3118.170.0
133.3118.0
0.2
133.3121.077.1
137.0123.5118.0
1159.0110.0±0.9
#
• #
" #
#
• #
SiO2
3.6 *
8.7
8
1.1 *9.1
4 •
10.28.6
8.2
8.98.63.2 *
8
6.3 •
8.4±0.1
#
#
n
#
#
B Na K
concentrations are giver
0.1
0.1
0.01.0
8.50.20.1
0.00.0
0.0
20.0*4.8 *9.79.8
17.0 '9.7
0.1 •8.1
10.0
7.710.99.67.7
10.912.09.39.79.4
10.29.8
10.410.410.19.4
10.0
62.2 *11.6
12.09.79.08.698
10.2±0.2
#
#
#
#
It
#
12.043.05.45.65.24.41.23.54.0
4.71.35.14.8
3.65.24.74.44.94.S4.9
4.4
4.84.84.5
3.55.4
3.4
5.78.25.15.24.65.84.9
4.9±0.1
1 in
ft
#
#
#
#
Ca
[mg /1]
85.079.294.697.189.6
111.758.082.098.083.6
172.0608.5108.766.496.783.599.891.082.495.291.695.287.999.899.6
192.387.893.085.616.0
200.077.390.489.784.0
106.093.8
100.091.6±0.8
#
#
##
#
#
##
Mg
21.019.319.919.921.319.844.020.623.019.2
140.018.822.233.884.6
17.620.020.030.220.020.319.214.914.1
35.620.019.09.7
24.32.57.2
18.423.019.520.750.020.0±0.6
#
#
#
##
n
n###
#
#
Li
0.10.1
0.50.1
0.10.10.0
0.10.10.1
0.10.10.20.9
0.9
0.5
0.1
0.1
0.1
NH4
0.1
0.20.0
0.2
0.5
0,0
0.0
0.4
0.50.00.10.1
0.00.0
-
NO3
0.98.26.86.1
1.35.52.0
10.07.8
1.3
4.51.56.27.76.36.96.26.16.17.45.95.9
10.713.669.0 *1.20.3
6.95.7,6.6
7.1±0.1
AcceptedResults
[%]
4382
100809180509082754060
1004057
10081
1009178
10010091899088827.075702250707890
10010043
100
TABLE 1: Values reported by 39 participating laboratories. The IAEA results (Lab 100 ) are the reference values ± 2 SD . Theoutliers which are marked with *(star) were rejected by the statistical test. Those marked with # (number sign) were, likewise, rejectedbecause they were outside of the range of 2 standard deviation (SD) from the mean of accepted results or of the reference value.
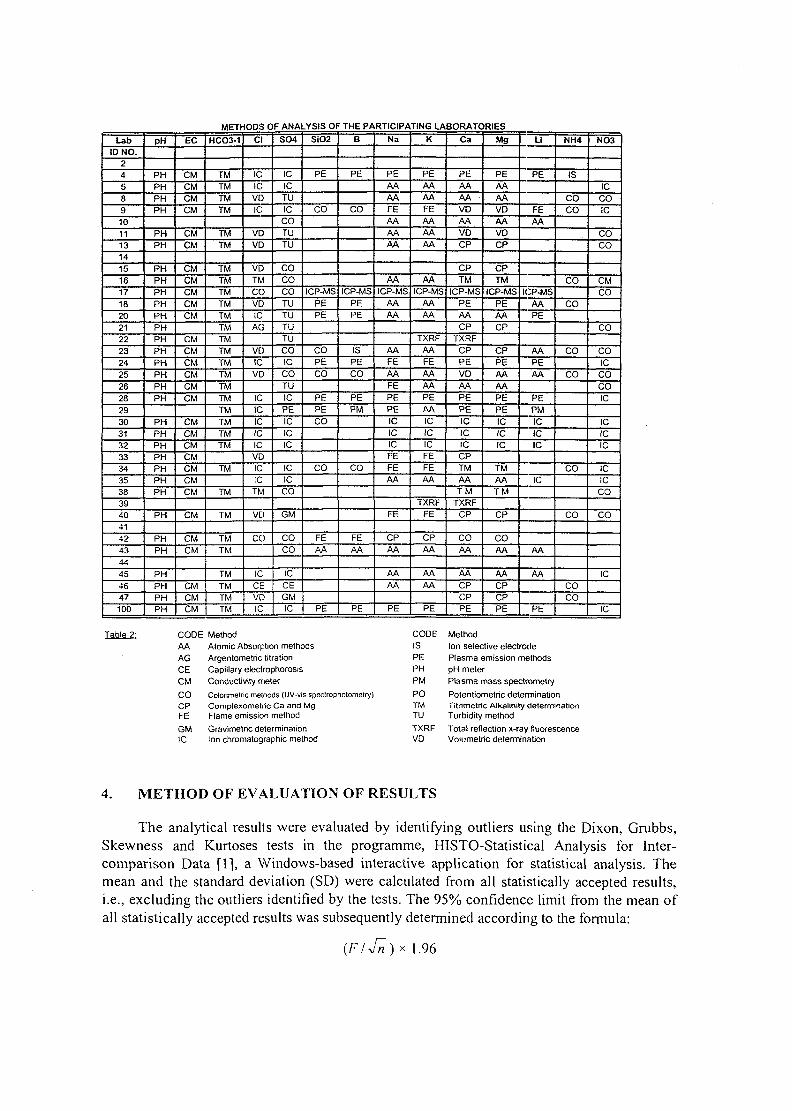
METHODS OF ANALYSIS OF THE PARTICIPATING LABORATORIES
LabID NO.
24589101113141516171820212223242526282930313233343538394041
42
43
44
45
4647
100
PH
PHPHPHPH
PHPH
PHPHPHPHPHPHPHPHPHPHPHPH
PHPHPHPHPHPHPH
PH
PHPH
PHPHPHPH
EC
CMCMCMCM
CMCM
CMCMCMCMCM
CMCMCMCMCMCM
CMCMCMCMCMCMCM
CM
CMCM
CMCMCM
HCO3-1
TMTMTMTM
TMTM
TMTMTMTMTMTMTMTMTMTMTMTMTMTMTMTM
TM
TM
TM
TMTM
TMTMTMTM
Cl
ICIC
voIC
VDVD
VDTMCOVDICAG
VDICVD
ICICICICICVDICICTM
VD
CO
ICCEVOIC
SO4
ICICTUICCOTUTU
COCOCOTUTUTUTUCOICCOTUICPEICICIC
ICICCO
GM
COCO
ICCEGMIC
SiO2
PE
CO
ICP-MSPEPE
COPECO
PEPECO
CO
FEAA
PE
B
PE
CO
ICP-MSPEPE
ISPECO
PEPM
CO
FEAA
PE
Na
PEAAAAFEAAAAAA
AAICP-MS
AAAA
AAFEAAFEPEPEICICICFEFEAA
FE
CPAA
AAAA
PE
K
PEAAAAFEAAAAAA
AAICP-MS
AAAA
TXRFAAFEAAAAPEAAICICICFEFEAA
TXRFFE
CPAA
AAAA
PE
Ca
PEAAAAVDAAVDCP
CPTM
ICP-MSPEAACP
TXRFCPPEVDAAPEPEICICICCPTMAATM
TXRFCP
COAA
AACPCPPE
Mg
PEAAAAVDAAVDCP
CPTM
ICP-MSPEAACP
CPPEAAAAPEPGICICIC
TMAATM
CP
COAA
AACPCPPE
Li
PE
FEAA
ICP-MSAAPE
AAPEAA
PEPMICICIC
IC
AA
AA
PE
NH4
IS
COCO
CO
CO
CO
CO
CO
CO
COCO
NO3
ICCOIC
COCO
CMCO
CO
COICCOCOIC
ICICIC
ICICCO
CO
IC
IC
CODE MethodAA Atomic Absorption methodsAG Argentometric titrationCE Capillary electrophorosisCM Conductivity meterCO Colorimetric methods (UV-vis spectrophotometry)CP Complexometric Ca and MgFE Flame emission methodGM Gravimetric determinationIC Ion chromatographic method
CODE MethodIS Ion selective electrodePE Plasma emission methodsPH pH meterPM Plasma mass spectrametryPO Potentiometric determinationTM Titrimetric Alkalinity determinationTU Turbidity methodTXRF Total reflection x-ray fluorescenceVD Volumetric determination
4. METHOD OF EVALUATION OF RESULTS
The analytical results were evaluated by identifying outliers using the Dixon, Grubbs,Skewness and Kurtoses tests in the programme, HISTO-Statistical Analysis for Inter-comparison Data [1], a Windows-based interactive application for statistical analysis. Themean and the standard deviation (SD) were calculated from all statistically accepted results,i.e., excluding the outliers identified by the tests. The 95% confidence limit from the mean ofall statistically accepted results was subsequently determined according to the formula:
1.96
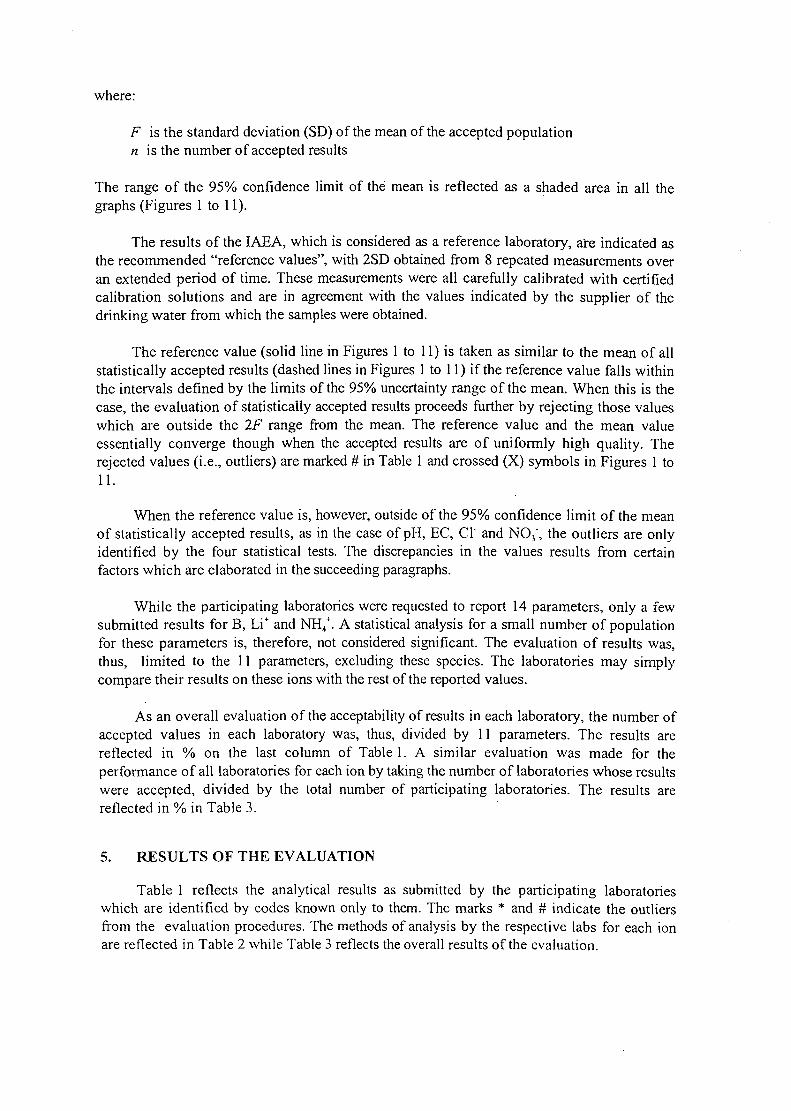
where:
F is the standard deviation (SD) of the mean of the accepted populationn is the number of accepted results
The range of the 95% confidence limit of the mean is reflected as a shaded area in all thegraphs (Figures 1 to 11).
The results of the IAEA, which is considered as a reference laboratory, are indicated asthe recommended "reference values", with 2SD obtained from 8 repeated measurements overan extended period of time. These measurements were all carefully calibrated with certifiedcalibration solutions and are in agreement with the values indicated by the supplier of thedrinking water from which the samples were obtained.
The reference value (solid line in Figures 1 to 11) is taken as similar to the mean of allstatistically accepted results (dashed lines in Figures 1 to 11) if the reference value falls withinthe intervals defined by the limits of the 95% uncertainty range of the mean. When this is thecase, the evaluation of statistically accepted results proceeds further by rejecting those valueswhich are outside the IF range from the mean. The reference value and the mean valueessentially converge though when the accepted results are of uniformly high quality. Therejected values (i.e., outliers) are marked # in Table 1 and crossed (X) symbols in Figures 1 to11.
When the reference value is, however, outside of the 95% confidence limit of the meanof statistically accepted results, as in the case of pH, EC, Cl" and NO,', the outliers are onlyidentified by the four statistical tests. The discrepancies in the values results from certainfactors which are elaborated in the succeeding paragraphs.
While the participating laboratories were requested to report 14 parameters, only a fewsubmitted results for B, Li* and NH4
+. A statistical analysis for a small number of populationfor these parameters is, therefore, not considered significant. The evaluation of results was,thus, limited to the 11 parameters, excluding these species. The laboratories may simplycompare their results on these ions with the rest of the reported values.
As an overall evaluation of the acceptability of results in each laboratory, the number ofaccepted values in each laboratory was, thus, divided by 11 parameters. The results arereflected in % on the last column of Table 1. A similar evaluation was made for theperformance of all laboratories for each ion by taking the number of laboratories whose resultswere accepted, divided by the total number of participating laboratories. The results arereflected in % in Table 3.
5. RESULTS OF THE EVALUATION
Table 1 reflects the analytical results as submitted by the participating laboratorieswhich are identified by codes known only to them. The marks * and # indicate the outliersfrom the evaluation procedures. The methods of analysis by the respective labs for each ionare reflected in Table 2 while Table 3 reflects the overall results of the evaluation.

Analysedcomponents
pHEC
HCO3Cl
SO4SiO2
BNaK
CaMgLi
NH4NO3
Reference Value± 2 SD (IAEA) [mg/l]
7.8 ±0.01626.0 ±1.2265.0 ±1.4
3.9 ±0.1110.0 ±0.9
8.4 +0.1
10.2 ±0.24.9 ±0.1
91.6 ±0.820.0 ±0.60.1
7.1 ±0.1
Mean of all acceptedresults ± 2SD [mg/l]
7.8 ± 0.4581.0 ±90.0241.0 ±60.0
4.5 ± 2.2117.8 ±31.4
8.5 ± 0.8not evaluated9.8 ± 2.24.7 ± 1.3
91.4 ±18.620.0 + 2.6
not evaluatednot evaluated5.8 ± 6.2
Percent of accepted Results forevaluated ions
91(94)A
(91)A
(67)*8260
79688060
~
TABLE. 3. This table reflects the reference values ± 2 standard deviations (SD), the meanvalues of the accepted results ±2SD and the percentage of the accepted results.The symbol A indicates that the reference value and mean value do not convergewithin the 95% confidence limit, therefore, the criterion using 2SD of the meanto identify outliers has not been applied on the data set and the numbers reflectonly on the statistical rejection.
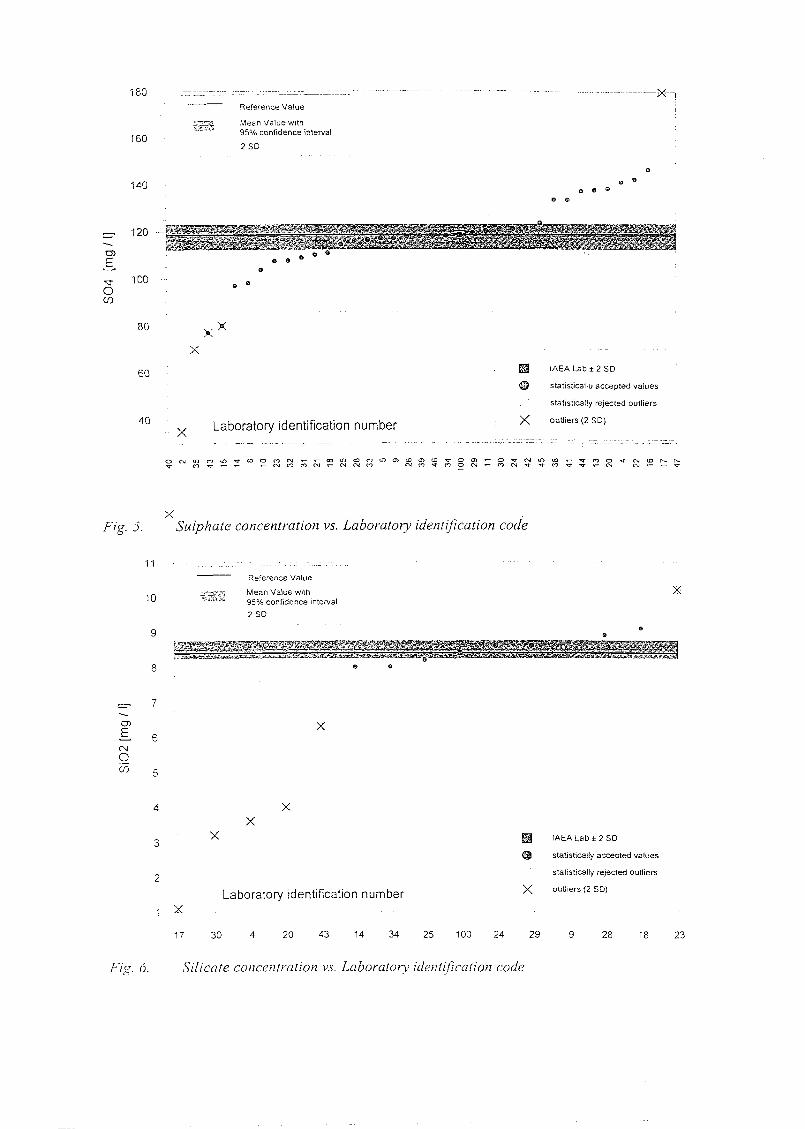
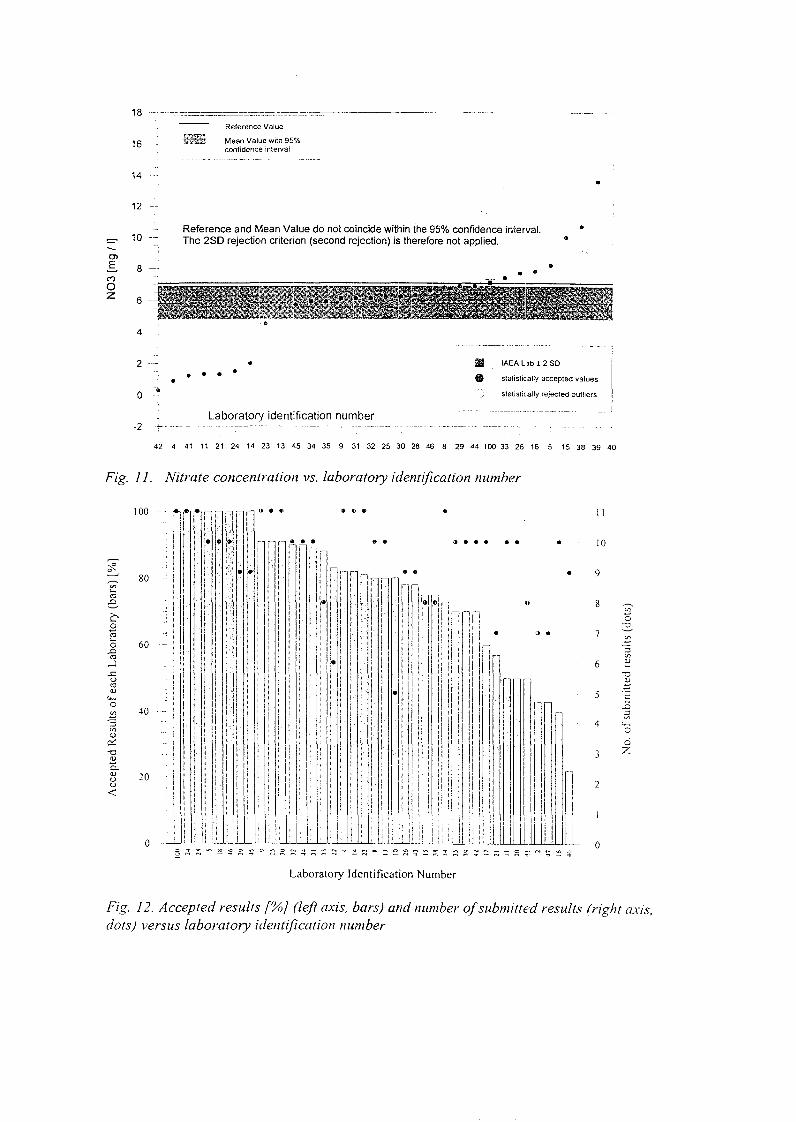
The results of the evaluation are graphically presented in the s-plots for each ion(Figures 1 to 11). There is good agreement, within the 95% confidence limit, between themean of statistically accepted results and the reference value for most parameters. In allexcept four cases involving EC, HCO3", Cl' and NO3" the reference value (solid line inFigures 1 to 11) and the mean value of the statistically accepted results (dashed line inFigures 1 to 11 and Table 3) fall within the interval defined by the limits of the 95%uncertainty range of the mean (shaded area). There is a big difference though between themean and the reference values for EC and HCO3" (Figs. 2 and 3) while this is very slight forCl' and NO3" (Fig. 4 and 11, respectively) In these four parameters, therefore, the outliers wereidentified purely from the statistical tests.
There can be no other explanation for the discrepancies in EC except a lack ofcalibration of instruments since the method used by all the labs was the same. For HCO3",however, 3 sets of populations are reflected in Figure 3. One set has a value around 210 mg/l,the second with high values around 270 mg/l and the third around the mean of the acceptedvalues at 240 mg/l. The IAEA Laboratory (code number 100) obtained a HCO3" concentrationof 265 mg/l by titrating the sample at pH of 4.3. A few laboratories reportedly titrated at thesame pH and obtained lower values while a number of the laboratories which titrated theirsamples at pH of 4.5 or with a methyl orange indicator reported values in all ranges. Whilethere is a tendency for measurements towards lower values, no correlation between the valuesand methods could be established.
A slight difference, but which is within the range of uncertainty, between the referencevalue and the mean value is observed for Cl" and NO3" (Fig. 4 and 11, respectively). There is a

general tendency for Cl" values to be on the higher side. Contrary to HCO3" though, a directcorrelation apparently exists between CY values and methods. Higher values are associatedwith the volumetric determination method (Table 2) which is not really precise because thedetection limit is high and in general, not recommended for analysis of low Cl" water, as in thecase of the drinking water sample.
Likewise, the mean of accepted NO3~ values is on the low side due to a small group ofpopulation with low NO3" results. It would also be noted that values determined by thecolorimetric method either result to high or low results which dominate the tail ends of thes-curve. On one hand, the accepted values were determined by the ion chromatographicmethod. The colorimetric method has less sensitivity in comparison to the ionchromatographic method which produced acceptable results. The latter has low detectionlimits, good separation capabilities and is free from interference from other substances.
The last column in Table 1 reflects that acceptability of results in individual laboratoriesfor the 11 parameters that were evaluated range from as low as 22% up to 100%. It alsoindicates that more than half of the laboratories submitted results which are below 80%acceptability. Table 3 indicates that the acceptability of results of certain components rangefrom only 60 to 89%; pH is acceptable in only 89% of all laboratories whereas Mg2" and SiO,are acceptable only in 60% of the participating laboratories. The results of all laboratories forthe rest of the ions are similarly quite low. Considering the importance of Cl" and Mg2T inclassifying and determining the sources of water as well as an indicator of the movement offluids, the accuracy in the measurement of these ions is critical.
While 79% of electrical conductivity results in all labs are accepted, it should be notedthat this is the easiest parameter to measure, and its accuracy is always expected. Therefore,the low percentage of acceptability which might be due to factors such as lack of calibrationof the EC meter calls for stringent adherence to calibration and careful check of measurementsin future analytical activities of those laboratories.
The overall performance of the participating laboratories by means of the percentage ofaccepted results is represented in Figure 12. The performance of the individual laboratorieswas, therefore, finally based on these 11 components (pH, EC, HCO3\ Cl", SO4
2\ SiO2, Na",K+, Ca2+, Mg2+ and NO3"). The scale on the right hand side of the figure reflects the number ofmeasured components (represented as dots) out of the total of eleven. As an example,laboratory 5 reported only ten results out of eleven, while laboratory 24 reported all eleven.
About 30% of the participating laboratories fall below 70% of accepted results (Fig. 12).These laboratories should be extra cautious and invest extra efforts in data interpretation priorto any improvements in the quality of their chemical results.
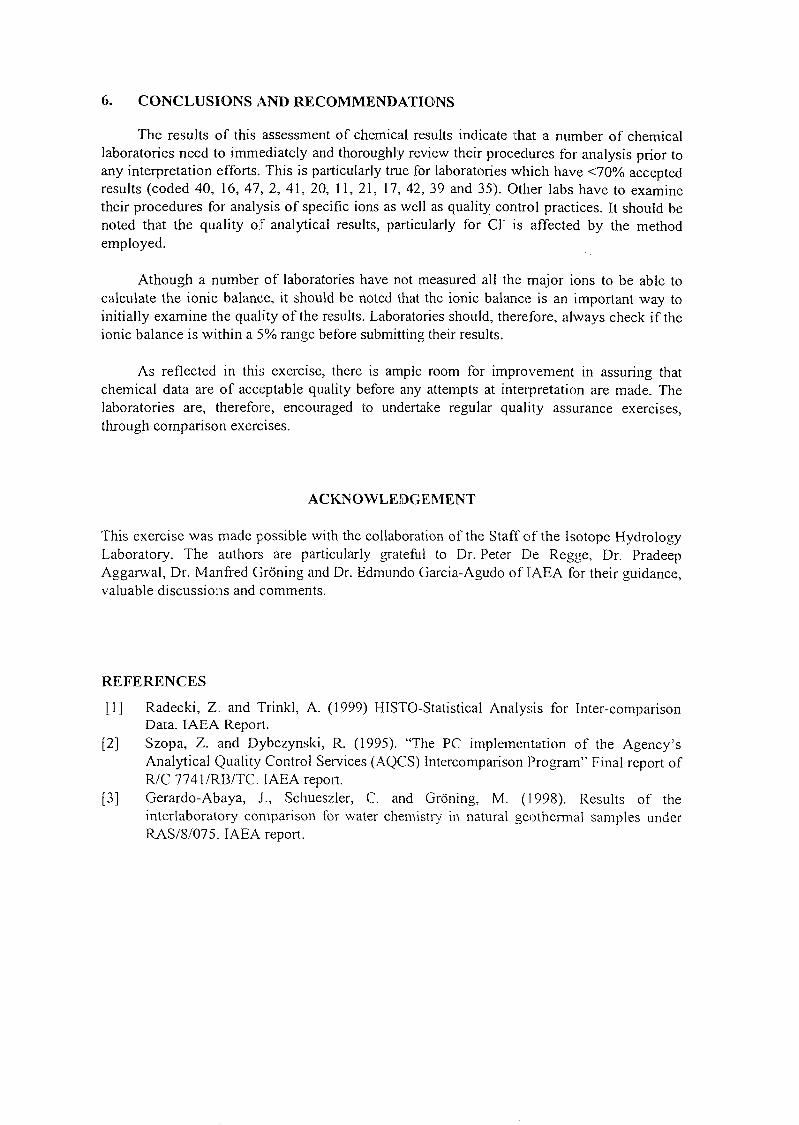
6. CONCLUSIONS AND RECOMMENDATIONS
The results of this assessment of chemical results indicate that a number of chemicallaboratories need to immediately and thoroughly review their procedures for analysis prior toany interpretation efforts. This is particularly true for laboratories which have <70% acceptedresults (coded 40, 16, 47, 2, 41, 20, 11, 21, 17, 42, 39 and 35). Other labs have to examinetheir procedures for analysis of specific ions as well as quality control practices. It should benoted that the quality of analytical results, particularly for Cl" is affected by the methodemployed.
Athough a number of laboratories have not measured all the major ions to be able tocalculate the ionic balance, it should be noted that the ionic balance is an important way toinitially examine the quality of the results. Laboratories should, therefore, always check if theionic balance is within a 5% range before submitting their results.
As reflected in this exercise, there is ample room for improvement in assuring thatchemical data are of acceptable quality before any attempts at inteipretation are made. Thelaboratories are, therefore, encouraged to undertake regular quality assurance exercises,through comparison exercises.
ACKNOWLEDGEMENT
This exercise was made possible with the collaboration of the Staff of the Isotope HydrologyLaboratory. The authors are particularly grateful to Dr. Peter Lie Regge, Dr. PradeepAggarwal, Dr. Manfred Groning and Dr. Edmundo Garcia-Agudo of IAEA for their guidance,valuable discussions and comments.
REFERENCES
[1] Radecki, Z. and Trinkl, A. (1999) HISTO-Statistical Analysis for Inter-comparisonData. IAEA Report.
[2] Szopa, Z. and Dybczynski, R. (1995). "The PC implementation of the Agency'sAnalytical Quality Control Services (AQCS) Intercomparison Program" Final report ofR/C 7741/RB/TC. IAEA report.
[3] Gerardo-Abaya, J., Schueszler, C. and Groning, M. (1998). Results of theinterlaboratory comparison for water chemistry in natural geothermal samples underRAS/8/075. IAEA report.

8.5
8.0
Reference ValueMean Value with
95% confidence interval2SD
xQ.
7.5
7.0 X
_CDLLJ
Laboratory identification number
H IAEA Lab ± 2 SD
0 statistically accepted values
' ) statistically rejected outliers
X outliers (2 SD)
40 21 20 25 33 38 39 43 47 14 16 17 22 23 26 46 30 4 5 24 28 34 44 45 100 9 15 18 41 8 11 31 32 13 35 42
FIG. 1. pH vs. laboratory identification number
800
750
o• i 600oOo
550
500
450
Reference ValueMean Value with
95% confidene interval
o Reference and Mean Value do not coincide within the 95% confidence interval.^ The 2SD rejection criterion (second rejection) is therefore not applied.
JL 650
Laboratory identification number
IAEA Lab ± 2 SD
statistically accepted values
statistically rejected outliers
41 25 16 8 14 35 28 39 5 33 11 42 15 30 13 20 23 22 31 32 9 18 44 43 24 46 100 34 4 17 38 47 40
Fig. 2. Electric conductivity vs. laboratory identification number

340
320
300
?ao
•" ~r^zzzzz::zzzzz
•; a
z.-Zzzzi~^~—'sr---—~-—
Reference ValueMean Value with95% confidence interval
260
240 -
—CO
HC
O-3
220
200
180
160
140
120
100
80
-1
- - •
Reference and Mean Value do not coincide within the 95% confidence interval.The 2SD rejection criterion (second rejection) is therefore not applied.
i | IAEA Lab ± 2 SD
41) statistically accepted values
^ " statistically rejected outliers
;• ,N Laboratory identification number -
FIG. 3. Bicarbonate concentration vs. Laboratory identification code
20
18
16
14 -
mi-
l l€>
Reference Value
Mean Value with95% confidence interval
IAEALab±2SD
statistically accepted values
statistically rejected outliers
1 2 .• :•
1Q ; Reference and Mean Value do not coincide within the 95% confidence interval.
O
•—• The 2SD rejection criterion (second rejection) is therefore not applied.
Laboratory identification number
FIG. 4. Chloride concentration vs. Laboratory identification code
180
160
Reference Value
Mean Value with95% confidence interval
2SD
140
: = *
O)
P
S04
[[
120
100
60
40
xx
xLaboratory identification number
H IAEALab±2SD
@ statisticallu accepted values
statistically rejected outliers
X outJiers (2 SD)
XFig. 5. Sulphate concentration vs. Laboratory identification code
11
Reference Value
ii^2^s Mean Value withi'-AWK g50/<> confidence interval
2SD
y
CD
— 6CM
O5
X
XX
X
Laboratory identification number
H IAEA Lab ± 2 SD
© statistically accepted values
statistically rejected outliers
X outliers (2 SD)
17 30 20 43 14 34 25 100 24 29 28 18 23
Fig. 6. Silicate concentration vs. Laboratory identification code

tL\j ~" , ; . -7™_'ri___._i ~r.z.~.~s~.~i^~"
18 --
1 6 ••->
1 4 -••
z-crx"ja"
— --
Reference Value
Mean Value with95% confidence
2SD
interval
-X—•
X
12 X X
ro
10• » -
Fig. 7.
12
11
10
9
Laboratory identification number
H IAEA Lab ± 2 SO
© statistically accepted values
, . statistically rejected outliers
X outliers (2 SO)
o ^ o c o c > O i N N n o ^ wC O T J - I - C O C O C S J O C O I O T - O J ^ C M T I -
Sodium concentration vs. Laboratory identification code
Reference Value
itSS^J Mean Value with95% confidence interval2SD
X
„ s s s
Laboratory identification number
H IAEA Lab ± 2 SO
© statistically accepted values
^ v statistically rejected outliers
X outliers (2 SO)
i- i - n T- n CMo o c O j ( o f C D o o T c N < o a j c o o c o r s i c n c oC N l c o r o r f T — c \ j c s i c M c o c o C N j c \ j ' ( j - O T - T f cg
Fig. 8. Potassium concentration vs. Laboratory identification code

.,20
110
Reference Value
Mean Value with95% confidence interva2SD
100
==• 90 -en
03
O 80
70
en
5 0
Laboratory identification number
fg IAEA Lab ± 2 SD |
© statistically accepted values |
. statistically rejected outliers i
X outliers (2 SD)
Fig. 9. Calcium concentration vs. Laboratory identification code
40
Reference Value
Mean Value with950/ confidence interval
2 SO
XX
x
20 *"••'"**"*&*--4-^ K*»-^»-
x x
10 X\y
Laboratory identification number
B IAEALab±2SD
^ statistically accepted values
statistically rejected outliers
X outliers (2 SD)
Fig. 10. Magnesium concentration vs. Laboratory identification code
CD
Oz
1 8 • -
16 -
1 4 -••:
12 -H
•A10 —
•H
6 -
Reference Value
Mean Value with 95%confidence interval
Reference and Mean Value do not coincide within the 95% confidence interval.The 2SD rejection criterion (second rejection) is therefore not applied.
0 - - *
IAEA Lab ±2 SO
statistically accepted values
statistically rejected outliers
-2- Laboratory identification number " "
42 4 41 11 21 24 14 23 13 45 34 35 9 31 32 25 30 28 46 8 29 44 100 33 26 16 5 15 38 39 40
Fig. 11. Nitrate concentration vs. laboratory identification number
100
60
40
20
nnil in
M i I . I l l l i i l
r
ii
10
od
Laboratory Identification Number
Fig. 12. Accepted results [%] (left axis, bars) and number of submitted results (right a.xis,dots) versus laboratory identification number

ANNEX I
LIST OF PARTICIPATING LABORATORIES IN THE1999 INTERLAB COMPARISON FOR CHEMISTRY OF COLD WATER
COUNTRY
Argentina
Argentina
Brazil
Chile
Name of Laboratory and contact person
Ing. Jose LobosInst. Instituto Nacional del Agua y del AmbienteAutopista Ezeiza CanuelasTramo Jorge Newbery km 1,12, Partido Esteban EcheverriaPcia. de Buenos AiresTel.: 54-11-4480-9219/25Fax:54-11-4480 0094E-mail: [email protected]. ar
Dra. Ana FazioAnalisis de RocasInst.: Departamento de Ciencias GeologicasUniversidad de Buenos AiresPabellon IICiudad Universitaria1428 Buenos AiresTel/Fax: 54-11-4576-3329E-mail: [email protected]
Mr. Paulo MinardiRua Prof. Mario Wemeck s/nCornissao Nacional de Energia NuclearCentro de Desenvolvimento da Tecnologia NuclearCidade UniversitariaC.P. 941 -Pampulha30123-970 Belo Honzonte, M.G.Tel: 005531 4993100.Fax:005531 4993444Email: [email protected]
Dr. Arturo Givovich HernandezDICTUC S.A.Laboratorio de Analisis de Agua y RilesAvda. Vicuna Macken # 4860, MaculCasilla 306 - Correo 22SantiagoTel: 686 4171 -5536589Fax:686 5806E-mail: [email protected]

China, P.R.
China, P.R.
Costa Rica
Costa Rica
Cuba
Ecuador
Ecuador
Prof. Zhang ZhongfuInstitute of Hydrogeology and Engineering GeologyChinese Academy of Geological SciencesZhengding 050803, Hebei ProvinceFax:00-86-311-8021225E-mail: [email protected]
Song YanhangDrinking Water Analysis CentreShijiazhang Water Supply Companey
Calvo Porras RodrigoSenara Lab
Lie. Jose Francisco FernandezLaboratorio de HidrologiaInstituto Costarricense de ElectricidadPo.Box 10032 -1000 San JoseTel.: 506 220 7379Fax: 506 220 8204
Sr. Manuel Semant JorrinLaboratorio Provincial de Quimica y Biologiade las Aguas de Recursos HidraulicosCentro de Investigaciones y Proyectos HidraulicosMaximo Gomez No. 318 CP42400Colon, MatanzasTel: 53 52 92712Fax:537799190E-mail; [email protected]
Sr. Oswaldo YanezLaboratorio de Control AmbientalDireccion de Medio Ambiente del Municipiodel Distrito Metropolitano de QuitoCheca 127 y 10 de AgostoQuitoTel: 593 2 545277Fax: 593 2221634E-mail: [email protected]
Ms. Ruth AyabacaLaboratorio de AguasComision Ecuatoriana de Energia AtomicaJuan Larrea 534 y RiofrioQuitoTel : 593 2225166Fax: 593 2 563336E-mail: [email protected]
India
Indonesia
Jordan
Kenya
Korea. R.O.
Korea, R.O.
Liban
Mr. K.M. KulkarniIsotope Application DivisionBhabha Atomic Research CentreTrombay, Mumbai - 400085.Tel.: 91-22-550 5050 ext. 2717, 2771Fax.: 91-22-550 5151E-mail: [email protected]
Mr. Satriyo HadipurwoDirectorate of Environmental GeologyDept of Mines and EnergyJl. Diponegoro 57, Bandung 40122Tel: 062 22 774676 (ext 480)Fax: 062 22 706167E-mail: [email protected]
Ms.S. KilaniCentral LaboratoriesWater Authority of JordanAmmanFax: 0096265825275E-mail: [email protected]
Prof. Mwakio ToleSchool of Environmental StudiesMoi University, P.O. Box [email protected]
Dr. Yong-Kwon KohKorea Atomic Energy Research InstituteP.O.Box 105. YusungTaejon 305-600 KoreaE-mail: [email protected]
Dr. Man Sik ChoiIsotope Research LabKorea Basic Science Institute52 Eoundong Yusungku, Taejon, Kore 305-333Fax: 082-42-865-3419E-mail: [email protected]
Conseil National de la Recherche ScientifiqueBoulevard de la Cite SportiveImmeuble Dogher et FakhriBoitePostale8281BeyrouthFax:961 1 822 639
Madagascar
Malaysia
Malaysia
Malaysia
Mexico
New Zealand
Nicaragua
M.Joel RajaobelisonConsortium de LaboratoiresLab. national des Mines et INSTNINSTN BP 4279, Antananarivo
Mrs. Kamisah AliasMalaysian Institute For Nuclear Technology Research (MINT)Bangi,43000 KAJANGFax: 603 8250907E-mail: [email protected]
Mr. Ismail C. MohamadGeological Survey Department (Peninsula)Jin. Sultan Azlan ShahP.O. Ek>x 1015, 30820 IPOHFax: 605 5462815
Mr. Lee Sik BengKelantan Water (M) Sdn. Bhd.Ting. 4, Bangunan PetronasJin. Sultan Yahya Petra15200 KOTABHARUFax: 609 7472030
Dr. Felipe Arregin CortesLaboratorio de Calidad del AguaInstituto Mexicano de Tecnologia del AguaPaseo Cuauhnahuac 8532, Col. ProgresoJiutepec, Mor., C.P. 62550Tel.: +52/73/19 43 81Fax:+52/73/19 43 81E-mail: [email protected]
Mr Desmond ChanWairakei Analytical Laboratory, Institute ofGeological and Nuclear SciencesPrivate Bag 2000, Taupo, d.Tel: 64 4 570 7 376 0139Fax: 64 4 374 8199E-mail: [email protected]
Ms. Katherine VammenUniv. Nacional Autonoma de NicaraguaCentro de Investigacion en Recursos AcuaticosDe Telcor de Villa Fontana, 300m al LagoApdo. Postal 4598
ManaguaTel.: 505 2 786981

Niger
Niger
Panama
Pakistan
Pakistan
Panama
Peru
Monsieur Garba Dan MaradiResponsable de la Cellule d'hydrochimieDirection des Ressources en EauBP257 NiameyTel. 227 72 38 89Fax 227 72 40 15E-mail: [email protected]
Monsieur SoumaTla AssoumaneResponsable du laboratoire de qualite des eauxDirection Departementale de l'HydrauliqueBP 480- ZinderTel. 227 510 419Fax 227 72 40 15
Prof. Jose Villarreal MLaboratorio de Calidad de Agua y AireUniversida de PanamaApartado 10896 Estafeta UniversitariaTel.: 223-7575 - ext. 2207Fax: 223-6638E-mail: [email protected]
Manzoor Ahmad ChoudhryRadioisotope Hydrology LaboratoryRadiation and Isotope Application Divisionor Manzoor Ahmad ChoudhryPakistan Institute of Nuclrear Science and TechnologyP.O. Nilore, IslamabadFax No. 92-51-9290275E-mail: [email protected], [email protected]
Arif SaleemWASA Laboratory, Lahore
Lic.Sr. Cenobio CardenasLaboratorio de Sanitaria-Facultad de Ingenieria CivilInst.: Universidad Tecnologica de PanamaApartado 6-2894 El DoradoTel: 507 236 4694Fax: 507 236 4694E-mail: [email protected]
Ing. Juan Carlos Ruiz / Ing. Nelly GuerreroLab. Nam: Laboratorio de Analisis de Aguasde la Planta de Tratamiento de la Atarjea - Planta No. 2Inst.: Servicio de Abastecimiento de Agua Potable y Alcantarilladode Lima (SEDAPAL)Autopista Ramiro Priale Km. 1 - El AgustinoLimaTel/Fax: 51 1 3625394

Philippines
Philippines
Philippines
Saudi Arabia
Sri Lanka
Sri Lanka
Syria
Tanzania
Thailand
Hydie MaspinasDavao City Water District
Soledad S. CastanedaAnalytical Measurements Research GroupPhilippine Nuclear Research InstituteDiliman, Quezon City, Philippines
Evangeline C. SantiagoResearch and Analytical Services LaboratoryNatural Sciences Research Institute, UP Diliman Quezon City
Mr. I. Al-SagabyKing Abdulaziz City for Science & TechnologyInstitute of Natural Resourcesand Environment, PO Box 6086Riyadh 11442Fax:0099614813616
Mrs. D.WijekoonWater Resources Board , 2A, Gregorie's AvenueColombo-7Fax: 941-689772
Mr.W.S.C.A.FonsekaRegional LaboratoryNational Water Supply and Drainage BoardSaunders RoadFax:941-622912
Y.M. JubeliFax:009636112289Atomic Energy CommissionDamascus, P.O.Box 6091
Mr. Hassani J. MjengeraWater Laboratories UnitP.O. Box 35066Dar es Salaam
Mr. S. ManitHydrochemistry lab, OAEPVibhavadi Rangsit Road, Chatuchak10900 BangkokThailandTel: 0066 2 5795230Fax: 006625613013E-mail: [email protected]

Thailand
Thailand
Uganda
Venezuela
Vietnam
Vietnam
Environmental Research & Trg. CenterDepartment of Environmental Quality Promotionc/o Mr. S. Manit, OAEPVibhavadi Rangsit Road, Chatuchak10900 BangkokThailandTel.: 0066 2 5795230Fax:006625613013E-mail: [email protected]
Groundwater DivisionDepartment of Mineral ResourcesRama VI Road10400 BangkokThailandTel: 0066 2 2023798Fax: 0066 2 2023586
Mr. Nicholas AzzaWater Quality and Pollution Control LabWater Resources Management Dept.P.O. Box 19, Entebbe
Prof. Ing. Carmen Cardenas/Ing. Luisa SaulesLaboratorio de Ingenieria AmbientalCentro de Investigacion del Agua, Universidad del ZuliaAv. Ziruma, Ciudad UniversitariaLagunas de OxidacionDiagonal a la Facultad de AgronomiaMaracaibo. Estado ZuliaTel: 5861596210/5861596396Fax: 5861596206E-mail: [email protected]
Mr. Nguyen Kien ChihnCenter for Nuclear Techniques217 Nguyen TraiST, QlHo Chi Minh City
Prof. Nguyen Mong SinhDalat Nuclear Research Institutec/o Center for Nuclear Techniques217 Nguyen TraiST, QlHo Chi Minh Citv
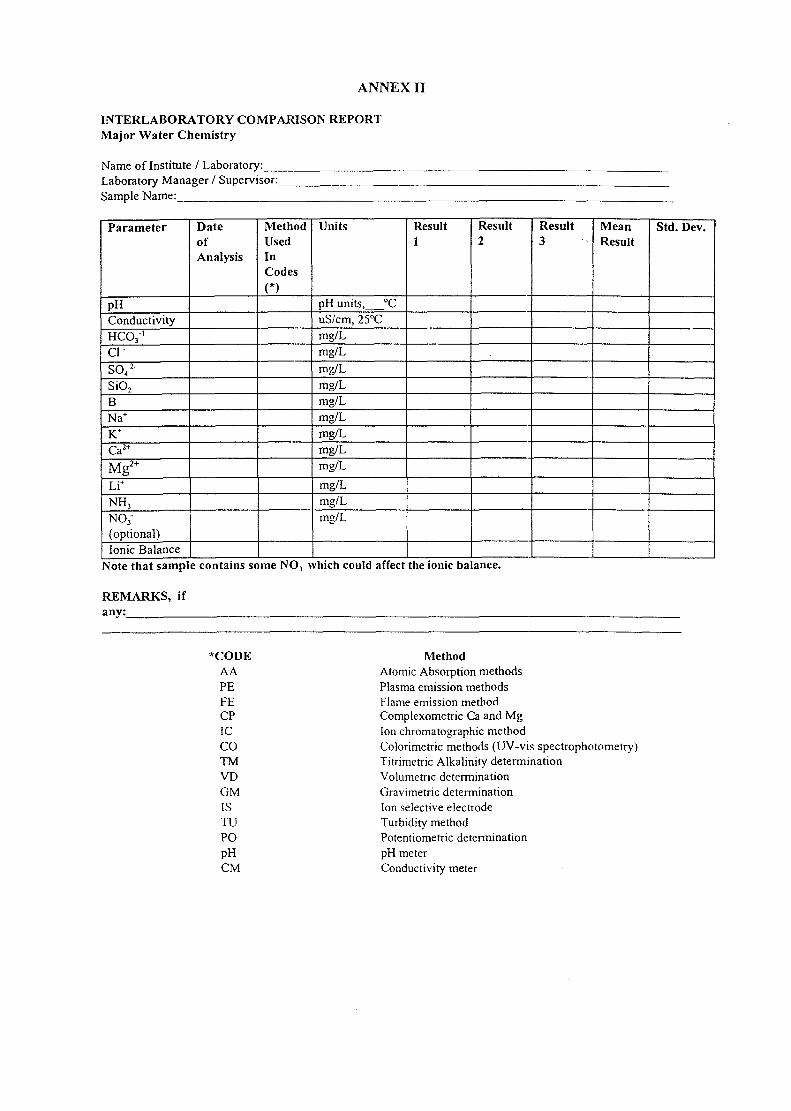
ANNEX II
INTERLABORATORY COMPARISON REPORTMajor Water Chemistry
Name of Institute / Laboratory:Laboratory Manager / Supervisor:Sample Name:
Parameter
pHConductivity
HCO31
c\-SO4
2"SiO2
BNa+
K+
Ca2+
Mg2+
Li+
NHj
N O /(optional)Ionic Balance
DateofAnalysis
MethodUsedInCodes(*)
Units
pH units, _°CuS/cm, 25°Cmg/Lmg/L
mg/Lmg/Lmg/Lmg/Lmg/Lmg/Lmg/L
mg/Lmg/Lmg/L
ResultI
Result2
Result3
MeanResult
Std. Dev.
Note that sample contains some NO, which could affect the ionic balance.
REMARKS, ifany:
*CODEAAPEFECPICCOTMVDGMISTUPOPHCM
MethodAtomic Absorption methodsPlasma emission methodsFlame emission methodComplexometric Ca and MgIon chromatographic methodColorimetric methods (UV-vis spectrophotometry)Titrimetric Alkalinity determinationVolumetric determinationGravimetric determinationIon selective electrodeTurbidity methodPotentiometric determinationpH meterConductivity meter

n
Recommended Improvements to Methodologies andProcedures for the Analysis of Common Chemical Speciesof Water

RECOMMENDED IMPROVEMENTS TOMETHODOLOGIES AND PROCEDURES FOR THE ANALYSIS
OF COMMON CHEMICAL SPECIES OF WATER
Report of a Consultants' Meeting
December 1999IAEA Headquarters

RECOMMENDED IMPROVEMENTS TO METHODOLOGIES AND PROCEDURESFOR THE ANALYSIS OF COMMON CHEMICAL SPECIES OF WATER
INTRODUCTION
From 1997 to 1999, the IAEA conducted four interlaboratory comparison exercises forchemical analysis of common species in water. The participating laboratories were from MemberStates with active Technical Co-operation projects on drinking water and geothermal energydevelopment. The results indicated that about 50% of participating laboratories only produceresults up to 70% acceptability and at least 30% have results with acceptability of 50% or below.Likewise, common ions such as HCO3, Cl, SiO2, K, Mg are oftentimes erroneously measured.These conditions have impacts on the classification of waters, determination of processes anddynamics affecting the hydrological system under investigation and, in the case of geothermalwaters, provide erroneous estimates of reservoir temperatures which could lead to severenegative economic consequences.
Due to these concerns, the IAEA organised in December 1999, a Consultants' Meeting forthe "Preparation of Recommended Improvements to Methodologies and Procedures for theAnalysis of Common Chemical Species of Water". The meeting discussed the quality controlprogrammes practised in the respective laboratories, and examined the possible solutions andimprovements of methodologies for chemical analysis of common species of water. Practicalguidelines based on the experiences of different laboratories in the analysis of common ions weredeveloped and elaborated in this paper. These guidelines are deemed helpful to the efforts ofMember States to improve the quality of their chemical results.
PRACTICAL GUIDES IN ANALYTICAL ACTIVITIES
While numerous references (APHA, ASTM, ISO, AFNOR, etc.) exist on the analyticalprocedures of common species, oftentimes, the practical aspects which are obtained fromexperiences are not exposed. The following items are, therefore, elaborated to guide workers inanalytical chemistry:
Minimum requirements for laboratories:
1. Analytical balance with readability of 0.1 mg. Calibration of balance should be done at leastonce every 3 months using standard weights traceable to NIST standards.
2. Good quality distilled water (with conductivity of <2 uS/cm).3. Drying oven with capability for maximum temperature of at least 110°C.4. Clean laboratory to ensure no contamination.5. Properly calibrated pipettes, volumetric flasks and glasswares. The pipettes and glasswares
should be thoroughly clean. Glasswares are calibrated by weighing the amount of distilledwater which it contains (in case of volumetric flask) or delivers (in case of pipettes).
6. Properly maintained equipment. Maintenance schedule should be established using theinstrument manual as a guide.
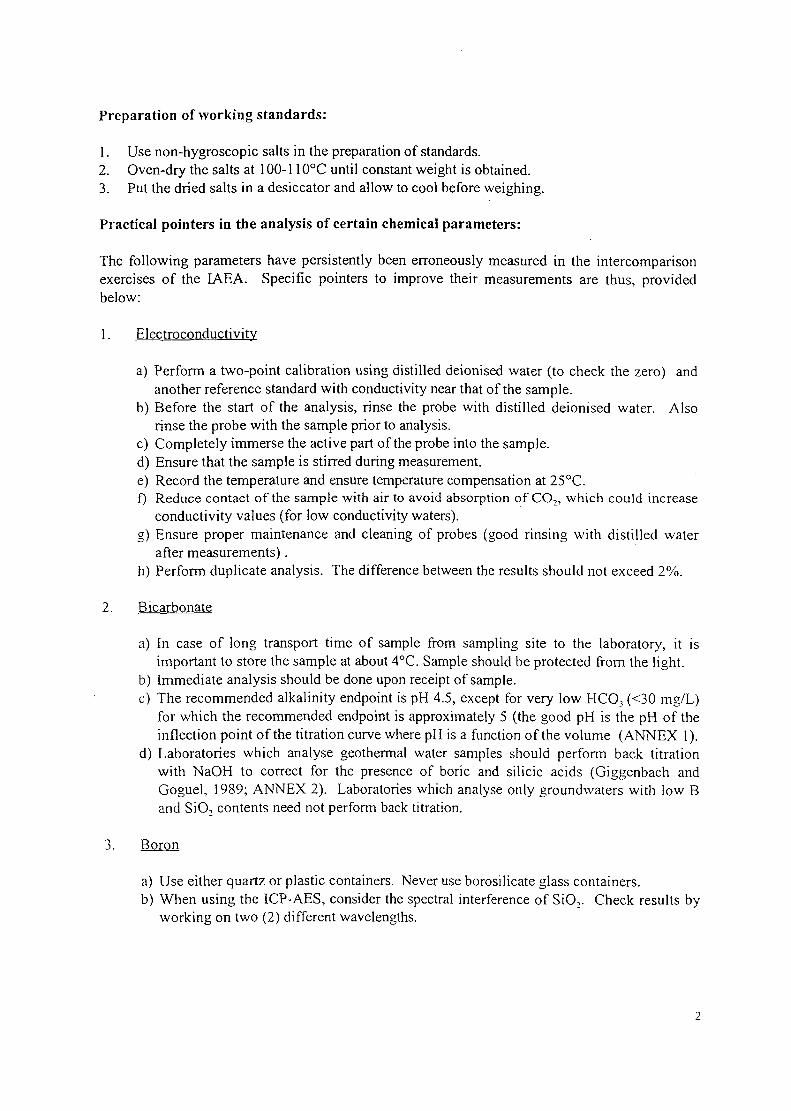
Preparation of working standards:
1. Use non-hygroscopic salts in the preparation of standards.2. Oven-dry the salts at 100-110°C until constant weight is obtained.3. Put the dried salts in a desiccator and allow to cool before weighing.
Practical pointers in the analysis of certain chemical parameters:
The following parameters have persistently been erroneously measured in the intercomparisonexercises of the IAEA. Specific pointers to improve their measurements are thus, providedbelow:
1. Electroconductivitv
a) Perform a two-point calibration using distilled deionised water (to check the zero) andanother reference standard with conductivity near that of the sample.
b) Before the start of the analysis, rinse the probe with distilled deionised water. Alsorinse the probe with the sample prior to analysis.
c) Completely immerse the active part of the probe into the sample.d) Ensure that the sample is stirred during measurement.e) Record the temperature and ensure temperature compensation at 25°C.f) Reduce contact of the sample with air to avoid absorption of CO,, which could increase
conductivity values (for low conductivity waters).g) Ensure proper maintenance and cleaning of probes (good rinsing with distilled water
after measurements).h) Perform duplicate analysis. The difference between the results should not exceed 2%.
2. Bicarbonate
a) In case of long transport time of sample from sampling site to the laboratory, it isimportant to store the sample at about 4°C. Sample should be protected from the light.
b) Immediate analysis should be done upon receipt of sample.c) The recommended alkalinity endpoint is pH 4.5, except for very low HCO3 (<30 mg/L)
for which the recommended endpoint is approximately 5 (the good pH is the pH of theinflection point of the titration curve where pH is a function of the volume (ANNEX 1).
d) Laboratories which analyse geothermal water samples should perform back titrationwith NaOH to correct for the presence of boric and silicic acids (Giggenbach andGoguel, 1989; ANNEX 2). Laboratories which analyse only groundwaters with low Band SiO2 contents need not perform back titration.
J .
a) Use either quartz or plastic containers. Never use borosilicate glass containers.b) When using the ICP-AES, consider the spectral interference of SiO,. Check results by
working on two (2) different wavelengths.

4. Total Silica
a) When using the AAS method with the nitrous oxide-acetylene flame, it is important tocheck the standard regularly. If drifting is observed, recalibration should be performed.
b) In case of the colorimetric method, when analysing for low SiO, (<10 mg/L), theheteropoly blue imethod is recommended since it has better sensitivity. High SiO,content may be analysed using the yellow molybdate method. In this case, digestion ofthe sample with NaOH is required (Giggenbach and Goguel, 1989; ANNEX 3). Whendigestion is not done, only the monomeric SiO2 is determined.
c) It is best to either use plain distilled water or demineralised water which has later beendistilled in the preparation of blanks, standards and samples because there may be SiO,in demineralised water.
d) For the colorimetric and ICP-AES method, the most stable standard to be used is in theform of Na^iF, or (NH4)2SiF6.
e) Do not use glass containers.
5. Metals (Na, K, Ca, Mg, Li and trace elements)
ICP - AES Method
a) The sample and standard matrices should be similar. Both should have pH below 2.Both should be prepared using the same acid (nitric acid is commonly used).
b) Results may be confirmed by preparing different dilutions of the sample.c) Filter the sample, in case particles are present.d) Check for spectral interferences. It is better to work on more than two (2) wavelengths.e) The standard addition method is recommended in case there is a difference between the
matrices of the samples and the standards. The difference in matrix gives physicalinterferences. A total salt concentration of more than 0.5% cause ionisation andviscosity interferences.
f) Regularly check the drift in peak height or peak position using standard solution. Ifexcess drift is observed, recalibration is required.
AAS Method
a) When using the air-acetylene flame, always add a chemical suppressant, e.g. Lanthanumas well as ionisation suppressant, e.g. Cesium to blanks, standards and samples.
b) When using the nitrous oxide-acetylene flame, always add ionisation suppressant e.g.KC1 (or CsCl) to blanks, standards and samples.
c) Always filter the sample.d) The matrices of the samples and standards should be similar.e) The temperature of samples and standards should be similar to avoid differences in the
nebulisation efficiency.f) Only acidified samples should be analysed. The same acid at the same concentration
should be used in the acidification of standards and samples.g) It is preferable to work within the linear range of the calibration curve. Good linearity
may be obtained by proper selection of wavelength or by rotating the burner head.

6. Volumetric Titration (B, Cl, Ca, Total hardness)
a) All titrants should be standardised.b) Always keep titrants protected from light and stored in properly capped bottles to avoid
evaporation.c) Drain the burettes several times with titrant before proceeding with the analysis.
7. Colorimetric Method bv UV-visible Spectrophotometry (NH3, SiO,, SO4, NO3, low Cl)
a) Always calibrate the instrument using calibration standards.b) Always use clean cells. Since BaSO4 tends to form a film in the cell, special attention
should be given in cleaning cells used for SO4 analysis using the turbidimetric BaSO4
method.c) For low SO4 concentrations in samples, always prepare low concentration standards
since the calibration curve is not linear in the low concentration range (approximatelybelow lOmg/L).
d) Always filter samples for SO4 analysis.e) For NO3 analysis, the best method is by reduction by Cd. Other methods are limited by
the interference of Cl.f) For low SiO2 determination, the recommended procedure is heteropoly blue method
while for high SiO2 determination, the yellow molybdate method is recommended. Fortotal SiO2, digestion with NaOH is recommended (ANNEX 3).
g) For heteropoly blue method, if reduction is done by ANSA (Amino Naphtol SulfonicAcid) a temperature of about 25-30°C is required.
h) For low NH3 levels, the indophenol blue method is recommended because it is the moresensitive method. However, sulfides are interferences.
i) In NH3 analysis, contamination from air is a common problem for low levels. To avoidthis, the glasswares should be filled with distilled water and properly capped (when notused and, in any case, it must not be dried to avoid ammonia fixation on the glass).
8. Ion Chromatography (Cl, SO4, NH4, NO,, F)
a) Always filter the sample.b) Keep in mind that laboratory temperature should be constant since it affects the
sensitivity of the conductivity detector.c) Na2CO3/NaHCO3 eluent is recommended for F, Cl, NO,, SO4, PO4 in groundwater
sample.d) Injection volume should be such that the column is not overloaded. This could be done
by considering sample concentration, sample loop, column capacity and dilution.e) Survey of interferences is important to identify the cause of overlapping peaks, if any.f) For samples having very low level of anions (in ppb) such as Cl, SO4, NO3, PO4, the use
of pre-concentration column is recommended.g) For high concentration of ions, the dilution factor should be checked.h) Clean column when required, particularly when retention time and/or peak shapes
change.

9. pH
a) Ensure that the correct pH of the standard buffer solutions at their actual temperature isused in the calibration of the pH meter.
b) Reduce the contact of sample with air to avoid absorption or desorption of CO,, whichcould affect the pH values.
c) Stir the sample gently to establish equilibrium between the electrode and sample and toensure homogeneity. If the stabilization of measurements is too long, check for thequality of the reference junction and the cleanliness of the glass probe. The probe maynot be as sensitive with calibration buffers because the buffers are generally moreconductive than the samples.
10. Ion-selective electrode method (F. NH3, Cl)
a) Use the proper ionic strength adjuster.b) Ensure proper maintenance of the electrode.c) Standard addition method may be used to confirm results.d) Check slope of the electrode response.
QUALITY CONTROL CHECKS
1. To validate the linearity of the calibration curve, five (5) calibration standards arerecommended. Once this has been established, a minimum of three (3) standards arerecommended for routine analysis.
2. Sample concentration should be within the standard calibration curve. If the sampleconcentration is higher than the highest standard concentration, dilution of the sampleshould be done.
3. Analyse the following after every 20 samples, or with each batch of samples, whichever isless:
a. method blankb. field blank (if possible)c. duplicate sample for precision checkd. check standarde. reference standard for recovery and calibration checkf. spiked sample for recovery check and matrix effects
4. Prepare X-control charts for reference standard (ANNEX 4) as follows:
a. Analyse the reference standard repeatedly. Compute the mean using 20 good results.Statistical tests should be done to determine outliers. Plot the mean.
b. Compute and plot the ±2SD of the mean (SD is standard deviation). These are calledthe Upper and Lower Warning Limits (UWL and LWL). Any result beyond theselimits would indicate the need to review possible causes for the deviation.
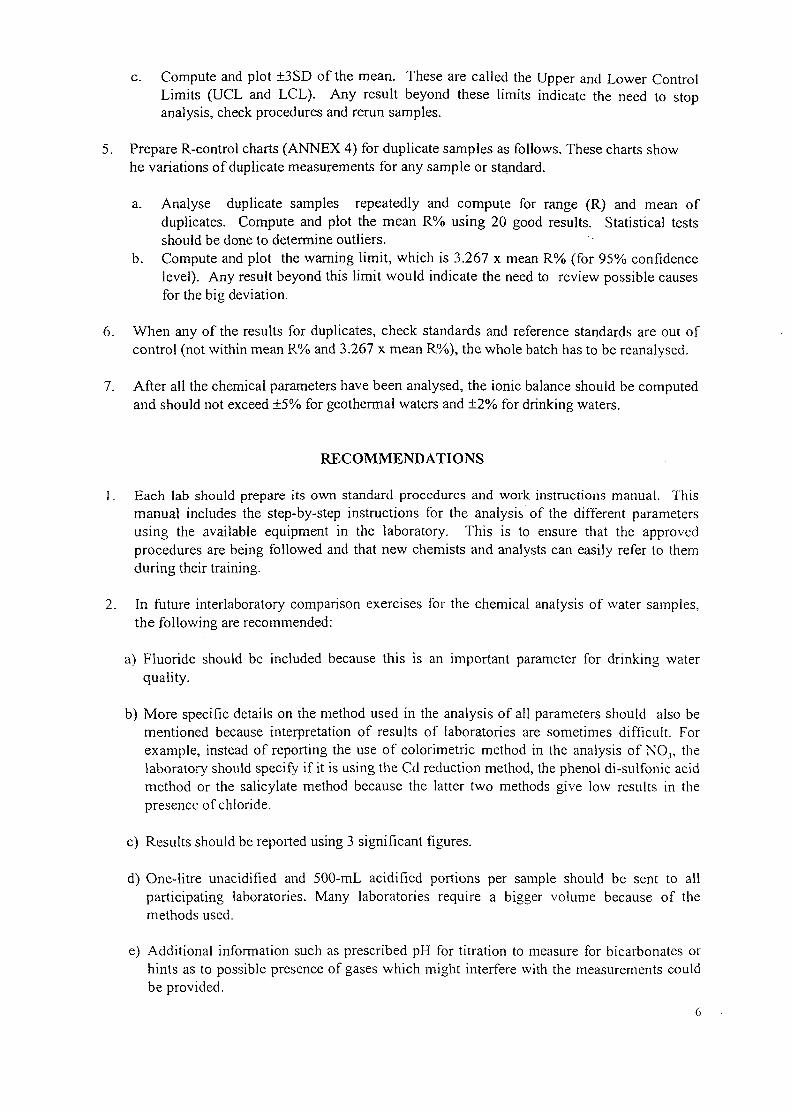
c. Compute and plot ±3SD of the mean. These are called the Upper and Lower ControlLimits (UCL and LCL). Any result beyond these limits indicate the need to stopanalysis, check procedures and rerun samples.
5. Prepare R-control charts (ANNEX 4) for duplicate samples as follows. These charts showhe variations of duplicate measurements for any sample or standard.
a. Analyse duplicate samples repeatedly and compute for range (R) and mean ofduplicates. Compute and plot the mean R% using 20 good results. Statistical testsshould be done to determine outliers.
b. Compute and plot the warning limit, which is 3.267 x mean R% (for 95% confidencelevel). Any result beyond this limit would indicate the need to review possible causesfor the big deviation.
6. When any of the results for duplicates, check standards and reference standards are out ofcontrol (not within mean R% and 3.267 x mean R%), the whole batch has to be reanalysed.
7. After all the chemical parameters have been analysed, the ionic balance should be computedand should not exceed ±5% for geothermal waters and ±2% for drinking waters.
RECOMMENDATIONS
1. Each lab should prepare its own standard procedures and work instructions manual. Thismanual includes the step-by-step instructions for the analysis of the different parametersusing the available equipment in the laboratory. This is to ensure that the approvedprocedures are being followed and that new chemists and analysts can easily refer to themduring their training.
2. In future interlaboratory comparison exercises for the chemical analysis of water samples,the following are recommended:
a) Fluoride should be included because this is an important parameter for drinking waterquality.
b) More specific details on the method used in the analysis of all parameters should also bementioned because interpretation of results of laboratories are sometimes difficult. Forexample, instead of reporting the use of colorimetric method in the analysis of NO3, thelaboratory should specify if it is using the Cd reduction method, the phenol di-sulfonic acidmethod or the salicylate method because the latter two methods give low results in thepresence of chloride.
c) Results should be reported using 3 significant figures.
d) One-litre unacidified and 500-mL acidified portions per sample should be sent to allparticipating laboratories. Many laboratories require a bigger volume because of themethods used.
e) Additional information such as prescribed pH for titration to measure for bicarbonates orhints as to possible presence of gases which might interfere with the measurements couldbe provided.

3. Laboratories which persistently submit below 50% acceptable results would require morethorough and immediate technical assistance.
4. Ionic balance, IB= (Ic-Ia)x 100/(Ic+Ia)where: Zc = sum of cationic equivalent
Za = sum of anionic equivalent (Mathess, 1982)is recommended as an indicator for the acceptability, or not, of the analytical data. If theionic balance is in the range of > 5%, the analytical error presumes to be quite high or theremight be some mistakes in data calculations. If the ionic balance is in the range of < 2%, theanalytical data is acceptable. However, oftentimes there is a higher ionic balance error(> 5%) in some cases where there is less than 5 meq/L of total ionic equivalent.
REFERENCES
American Public Health Association, American Water Works Association and Water PollutionControl Federation, 1992. Standard methods for the examination of water and wastewater.19th edition, APHA Washington, D.C.
American Society for Testing and Material, 1995. 1995 Annual book of ASTM standards. Vol.11.01, ASTM Philadelphia.
AFNOR 1997 (Association Francaise de Normalisation), Recueil de Normes francaises . Qualitede l'eau, 4 tomes.2nd edition. AFNOR Tour Europe - 92049 Paris La Defense CEDEX
Giggenbach, W.F. and Goguel, R.L., 1989. Collection and analysis of geothermal and volcanicwater and gas discharges. 4th edition. Department of Scientific and Industrial Research,Petone, New Zealand
Haddad, P. and Jackson, P. E., 1994. Ion Chromatography, principle and applications, secondimpression, Elsevier Science Publisher, p 489-542.
ISO, International Standardisation Organisation, Geneva.
Matthess, G. " The Properties of Groundwater", John Wiley & Sons, 1982.
Rodier , J., 1984. L'analyse de l'eau . Dunod, Orleans : 1365 pp.
Thompson, M. and Walhs, J. N., 1989. Handbook of Inductively Coupled Plasma Spectrometry,Second Ed., Blackie, London, p 201-214.

ANNEX 1
ALKALINITY
The determination of low alkalinity (below about 50 mg CaCO3/L or 0.2 meq/L) requires aspecial procedure because titration to pH 4.5 gives too high results. Two possibilities aredescribed :
the first is given for visual titration in the presence of mixed indicator methyl red-bromocresol green which gives a gradual colour change from about pH 5.2 to 4.3. This isuseful during field work or when the pH meter in not very precise,the second is useful for titration with a pH meter having a resolution of 0.01 pH unit.
1 - Visual titration of low alkalinity :
Use mixed indicator methyl red-bromocresol green and stop the titration according to thecolour changes indicated in the following table:
Alkalinity as CaCO3
about 30 mg/Labout 150 mg/Labout 500 mg/L
End point pH5.14.84.3
Colourlight greenish-greylight violet-greylight pink
2 - Potentiometric titration of low alkalinity, two end point titration :
Titrate to pH between 4.7 and 4.3. Record the volume of acid V, and the pH value. Continuetitration to reduce the pH by exactly 0.3 units and record the total volume V,. Because thischange in pH corresponds to an exact doubling of the hydrogen ion concentration, a simpleextrapolation can be made to the equivalent point (Rodier, 1984).
Calculation :(V.-V,)xNx 50000/ ^ ™ , r N ( 2 x V . V , ) x
Total a l k a l i n i t y (as CaCO2 m g l L ) = - ! -mL sample
With N = normality of the acid.
Reference:
Rodier , J., 1984. L'analyse de l'eau . Dunod, Orleans : 1365 pp.

ANNEX 2
BICARBONATE AND CARBONATE IN GEOTHERMAL WATERS
The analytical method consists essentially of an alkalinity titration corrected for the effects ofother weak acids, mainly boric and silicic acid or ammonium ion, by a back titration. Forsamples with a laboratory pH >8.3 the amount of carbonate, CO3, is obtained by titration with0.02N HC1 to pH 8.3 or 8.0 (see below). This reaction converts all CO3 to HCO3. Subsequenttitration with 0.02N HC1 to pH 3.8 converts all HCO3 to H2CO3, which is removed as CO, bybubbling with N2 or CO2-free air. By titrating the now CO2-free solution with 0.02N NaOH backto original pH, all interfering species are converted back to their original state of ionisation.(Note: The alkalinity endpoint may vary depending on the sample concentration.)
Reagents:
0.02N standardised solutions of HC1 and NaOH. The use of freshly prepared 0.02N NaOHsolution is essential.
pH Buffer solutions, pH 4.0 and pH 9.0.
Determination:
1. Pipette 10 ml of sample (Vs) into 50 ml beaker with a rotating magnetic stirrer. Insert pH-electrode calibrated against pH 4 and pH 9 buffers.
2. If pHs (pH of sample) >8.3, titrate to pH 8.3 with 0.02N HC1. Note volume A.3. Titrate from pH 8.3 to pH 3.8 with 0.02N HC1. Note volume B.4. To remove CO,, bubble CO2-free air or N, through solution for 5 to 10 minutes by using a
glass frit bubbler.5. Titrate to pHs or pH = 8.3, whichever is lower, with 0.02N NaOH. Note volume C.6. If pHs >8.3 titrate further to pHs with 0.02N NaOH. Note volume D.7. Calculate concentrations of carbonate, CC03, and bicarbonate, CHC03, (in mg/kg) according to:
CCOJ = 60092 (ANHa-DNNaOH)/Vs
CHCos = [61016 (BNua-CN^/VsI - 1.015CCOJ
Both values, CHC03 and CC03, together with pH have to be reported as all three are required in theevaluation of ionic balances and pH-dependent equilibria. NHO and NNa0H are the normalities ofthe reagents (0.02N).
Reference:
Giggenbach, W.F. and Goguel, R.L., 1989. Collection and analysis of geothermal and volcanicwater and gas discharges. 4th edition. Department of Scientific and Industrial Research,Petone, New Zealand.

ANNEX 3
TOTAL SILICA BY YELLOW MOLYBDATE METHOD
The colorimetric method in the analysis of total silica represents a valuable alternative to theAAS and ICP methods, which place stringent demands on instrumentation. It is based on theyellow color of the silico-molybdate complex absorbing at 410 ran and produced by theinteraction of molybdate with monomeric silica at pH 0.8 to 1.5. The reaction rate depends onthe OH" activity. The time required for the reaction to proceed to completion decreases from >1hour at pH 0.8 to 1 minute at pH i.5. The complex, however, is not stable, its rate of breakdownalso being a function of pH. At pH 1.5 and above, the color already begins to fade in less than anhour.
The method given here includes an alkaline digestion to break down polymeric silica. The oxalicacid is added to destroy interfering ferric chloride and molybdophosphate complexes. Ferricchloride strongly absorbs at 410 nm, as does the phosphate complex. Oxalic acid alsoaccelerates the breakdown of the silico-molybdate complex and, therefore, should only be addeda few minutes before the absorbance measurement. In view of the generally low iron andphosphate contents of geothermal waters, oxalic acid may be omitted and hydrochloric acid bereplaced by an equivalent amount of sulfuric acid.
Reagents:
Ammonium molybdate: 100 g (NH4)5MO7O24.4H,O/L. Store in a polythene bottle.Oxalic acid: 75 g (COOH)2.2H2O/LHydrochloric acid: 50 mL cone. HC1/L (-0.5 M HC1)Sodium hydroxide: 40 g NaOH/L (~1 M), store in polythene bottle.Stock standard: 2000 mg/kg SiO2. Dilute to 20, 50, 100, 150, 200 mg/kg SiO2.
Calibration and Determination:
Mix an aliquot containing up to 1 mg SiO, (1 to 5 ml) of standard solution with 5 ml distilledwater in a platinum crucible. Add 0.5 ml 1 M NaOH. Heat for 10 minutes on a boiling waterbath. Cool. Transfer to a 50-ml volumetric flask containing 10 ml 0.5 M HC1. Wash thecrucible and add the washings to the flask to make about 40 ml. Add 5 ml of the ammoniummolybdate solution, shake to mix, and leave for 15 minutes. Add 2 ml oxalic acid solution, fillto 50 ml, and read the absorbance at 410 nm within 10 minutes. Use a water blank and thestandard solutions treated in precisely the same manner as the samples to prepare a calibrationplot. The graph should be linear up to 1 mg SiO, in measured sample.
Reference:
Giggenbach, W.F. and Goguel, R.L., 1989. Collection and analysis of geothermal and volcanicwater and gas discharges. 4th edition. Department of Scientific and Industrial Research,Petone, New Zealand.
10

ANNEX 4
CONTROL CHARTS
This section is extracted and adapted from "ANALYTICAL QUALITY ASSURANCE ANDCONTROL - A training guide for the improvement and maintenance of good laboratoryperformance" prepared by the WHO Collaborating Centre for Water Quality Assessment andControl, and UNEP Collaborating Centre for Freshwater Quality Monitoring and Assessmentat VKI, Agern AM 11, DK-2970 HOrsholm, Denmark. Editor Dr Ulla Lund. January 1997.
Control charts
Control charting is one of the most important tools for routine surveillance of the quality ofmeasurement in a laboratory. Control charts are visual tools for checking that the process isunder statistical control, for the surveillance of the measurement process and for diagnosingmeasurement problems. Furthermore it serves for documentation of bias (or preferably, lack ofbias), precision, and limit of detection.
Principle of control charts
The concept of control charting was developed by Walter Shewhart in the 1930's for use inproduction processes. Inthe late 1960's their use for surveillance of measurement processes wasdescribed. Various types of control charts have been developed but those in general use inmeasurement laboratories are the Shewhart control charts. The most commonly used are calledX-charts and R-charts.
Definitions
Control sample : A sample used for the purpose of internal quality control and subjected to thesame (or part of the same) measurement procedure as that used for test materials.
Control value : Value entered on the control chart.
Response value : Value obtained by application of the measurement process.
Batch (or run, or series) : Set of measurements performed under repeatability conditions.
Central line (or center line) : Defines the best estimate of the variable plotted.
Warning limit : Upper and lower limits within which there is 95% probability for finding allcontrol values. Thus, one control value out of every 20 can be expected to be outside thewarning limits.
Action limit (or control limit) :Upper and lower limit within which the majority (that is 99.7%) ofcontrol values are expected to be. Thus three control values out of every 1000 (or one out ofevery 333) can be expected to be outside the action limits.

X -chart
An X -chart is a control chart in which the mean of a number of control values obtained over asuitably long period of time is used as the central line in the chart.
The control values for the chosen control sample is entered into the chart as they are produced.Control values can be either one response value (X-chart) for a control sample or the mean of
two or more response values (X -chart) for a control sample in one batch. In this manual, the
use of X -charts is recommended since the means are less influenced by extreme values than
would be a single value. Furthermore, the use of X -charts is the logical choice when applyingR-charts (see below) which are also recommended. The following text is therefore only
concerned with X -chart.
On the X -chart there are the central line, the upper and lower warning limits and upper andlower action limits. The limits are based on two and three times the between batch standarddeviation, respectively.
An X -chart can also be constructed using a known, possibly certified, value as the central lineand warning and action limits based on acceptable limits of uncertainty.
A special case of the X -chart is based on recovery checks. In this case the control value is therecovery from a spiked sample and the control charts are named D-charts. The recovery iscalculated as the difference (hence the name of the chart) between response values of a naturalsample and that of the sample spiked with a known amount of a standard substance.
12

Table 1 - Data for the construction of X-chartN° sample
1234567891011121314151617181920
X mean
Standard Deviation (SD)Upper Control Limit (UCL)Upper Warning Limit (UWL)MeanLower Warning Limit (LWL)Lower Control Limit (LCL)
COD, mg/L491497498492498510506492491497500506506487491500491495502495
497.3
6.3
516.2
509.9
497.3
484.6
478.3
550
540
530
520
510Q
8 500
490
480
470
Figure 1 - Shewhart Control X-chart for COD
__^.GppVr Control Limit = mean + 33<SDUpper Warning Limit = Mean + 2xSDMean PLow er Warning Limit = mean - 2xSD
_ _ _ L o w er Control Limit = mean - 3xSD
13 15 17 19 21
Sam pie number
23 25 27 29 31 33 35
13

R-chart
An R-chart is a control chart in which the mean range of repeated measurements is used as thecentral line, the control value being the difference between highest and lowest response value fora control sample in one batch.
R-charts are normally used only with action limits, which are based on the within batch (orrepeatability) standard deviation. In practice, action limits are often based on the range, which isproportional to the within batch standard deviation.
When using natural samples as control samples the r-chart (relative range chart) is normally usedinstead of R-chart. The reason is that the range is normally proportional to sample concentration.When using natural samples, which for stability reasons are not the same in each batch, it will bemore appropriate to use a control chart where the control value is the relative range.
Table 2 - Data for the construction of an R-chart
Batch123456789
1011121314151617181920
Duplicates
x,491497498492498510506492491497500506506487
491500491495502495
R % mean =
x2493497501485493508512487488503494511501497491499507498500492
Control Limit = 3.267xR% mean =
RangeR = |X,-X2|
2037526536655
1001
16323
X mean492.0497.0499.5488.5495.5509.0509.0489.5489.5500.0497.0508.5503.5492.0491.0499.5499.0496.5501.0493.5
R%lOOxR/Xmean
0.410.000.601.431.010.391.181.020.611.201.210.980.992.030.000.203.210.600.400.61
0.92
3.01
14

Figure 2 - Shewhart Control R-chart for COD
3
2
1
n
*\ r
\ i*
: ; % . . . . . - • • • : - : - •
V
1 3 5 7 9 11 13
Sample number____Con f6 i Limit = 3,267 xR% mean
...R%mean
Use of results from control charting
Daily interpretation of control charts
The daily use of the data from control charts is an immediate, visual overview whether themeasurement is in a state of statistical control or not, and thus if a large change in random orsystematic error is taking place.
The following criteria are recommended to detect if an out-of-control situation exists:
1 control value outside the action limits;2 consecutive control values outside the warning limits;7 consecutive values with rising or falling tendency.
For X-charts the following criterion also applies :
10 out of 11 consecutive control values on one side of the central line;
and for R-charts an additional criterion is :
7 consecutive values lie above the central line.
If the measurement of the control samples is seen to be out of statistical control it is probable thatthe same will be the case for analysis of real test samples. It is therefore important to find andremove the cause of the error in order to bring the measurement back into the state of statisticalcontrol.
When an out-of-control situation is detected the problem arises what to do with the results of testmaterials analysed in the period when out-of-control situation was detected. If the error can becorrected immediately, e.g. by correcting a calculation error, this should be done. When the
15

problem is not that simple, no general advice can be given. The possibilities are repeatedmeasurement after correction of the problem, giving results with a note on the decreasedreliability of the data, giving no results for the samples or other action. The interpretation is notonly a question of statistics but also of the experience and judgement of the analyst. However,one course of action which must never be taken, is attempting to prepare correction factors fromthe quality control data for that particular batch. It is an unsound practice to use the control datafor correction. Thenumber of control values from one batch will be so small that the uncertaintyof any correction factor will be very large. This will be reflected on the uncertainty of the"corrected" values but chances are, that there will be no improvement of accuracy.
Long-term use of control data
Data from internal quality control should be used on a daily basis as described in the previoussection. However, much useful information on the analytical quality can be gained by a periodicstatistical analysis of internal control data. The statistical analysis should be prepared at fixedintervals, e.g. for every 20 observations. The mean, within batch and between batch standarddeviation can be calculated and compared with those from the previous period to see if a changeis occurring.
The statistical tests to be performed are as follows:comparison of means for the two latest periods using the Student's t-distribution;comparison of ranges for the two latest periods by comparing the corresponding standarddeviations using the F-test.
If a significant difference in any of these tests is detected, the warning and action limits of thecontrol charts may be updated, and possibly the data on performance characteristics of themethods can be updated as well. Any change should be evaluated in relation to requirements fordata quality. If updating of performance characteristics is contemplated, the followingcalculations are made.
comparison of the mean (X-charts and D-charts) of the preceding period with the assigned("true") value of the control sample. This gives a measure of the systematic error;calculation of the standard deviation within the batch from R-charts. This gives therepeatability of the standard deviation;calculation of the standard deviation between batches from combined data from X- (orD-)chart and R-chart for the same control sample;calculation of the limit of detection from an R-chart for blank samples.
16
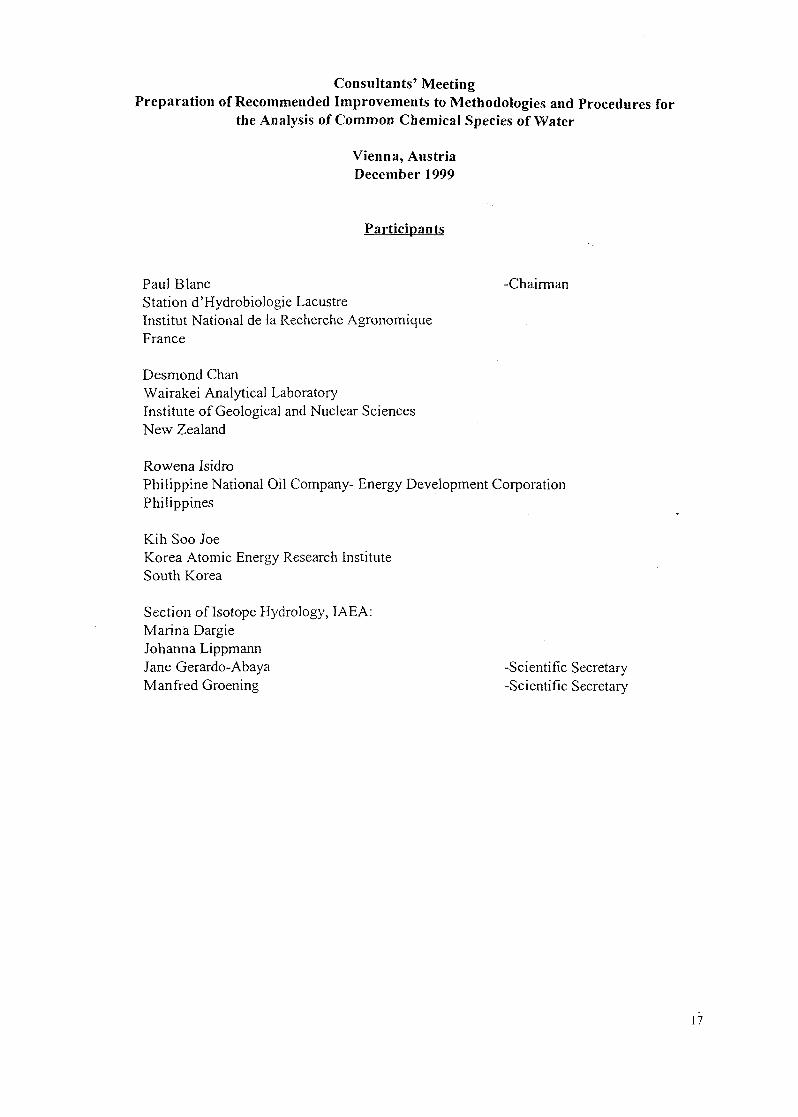
Consultants' MeetingPreparation of Recommended Improvements to Methodologies and Procedures for
the Analysis of Common Chemical Species of Water
Vienna, AustriaDecember 1999
Participants
Paul Blanc -ChairmanStation d'Hydrobiologie LacustreInstitut National de la Recherche AgronomiqueFrance
Desmond ChanWairakei Analytical LaboratoryInstitute of Geological and Nuclear SciencesNew Zealand
Rowena IsidroPhilippine National Oil Company- Energy Development CorporationPhilippines
Kih Soo JoeKorea Atomic Energy Research InstituteSouth Korea
Section of Isotope Hydrology, IAEA:Marina DargieJohanna LippmannJane Gerardo-Abaya -Scientific SecretaryManfred Groening -Scientific Secretary
17

KAERI/TR-
*]]S./Jf;*l]
* l ^ H r ^ - S - 1999 IAEA « l 3
<3 ^ * } 5J > Ai Tj|
# # *lsfl °l *l 71p.
2 7] 4SWR
sa-s-c v) , §i#( )
INIS ^ ^ l l S J E
2 71
2000. 8
A4
rtd , / ol E I - ~7l "n2-
^ s . (15-20 # ^ 5 l )
IAEA Hydrology Laboratory ^=-
«V« pH, ? 1 7 ] ^ 5 . £ . HCO^. Cl.
Hydrology
SOi. NO,.
K # 397]] 7 ] ^ : ^ KAERI ^
Laboratory ^•^r'3'l-fe- •^.-§•7]- •*]-•§
1
(
L999 IAEA ^ l ^ ^ r U l H ^ - ^ ,
Dhromatography, Consultants'
^ * #
SiO2, B, Li, Na
^ l ^ H r ^ •&•§• •*}
meeting, Isotope
K, Ca, M
*AS/8/084H ^-7}
s «• 137fl «-S»a-
•^ 10%<% #«>^c}- . IAEA
, ICP-AES,
Hydrology,
AAS, Ion

BIBLIOGRAPHIC INFORMATION SHEET
Performing Org.
Report No.
Sponsoring Org.
Report No.Stamdard Report No. INIS Subject Code
KAERJ/MR-
Title/SubtitleParticipation in the 1999 IAEA Interlaboratory Comparison on Chemical
Analysis of Groundwater
Project Manager
and DepartmentKih Soo Joe, Service Activities of the Chemistry Research Facility
Researcher and
Department
Kwang Soon Choi, Sun Ho Han, Moo Yul Suh, Kyung Kyun Park,
Ke Chun Choi, Won Ho Kim
Nuclear Chemistry Research Team
Publication
PlaceTaejeon Publisher KAERI
Publicatio
n
Date
2000. 8
Page 71p. 111. & Tab. Yes( V ) , No ( ) Size A4
Note
Classified Open( V ), Restricted( ),
Class DocumentReport Type Technical Report
Sponsoring Org. Contract No.
Abstract (15-20 Lines)
KAERI Analytical laboratory participated in the 1999 IAEA InterlaboratoryComparison on chemical analysis of groundwater organized by IAEAHydrology Laboratory(RAS/8/084). 13 items such as pH, electroconductivityHCO3, Cl, SO4, NO3, SiO2, B, Li, Na, K, Ca, Mg were analyzed. The result of thisprogram showed that KAERI laboratory was ranked within 10% range fromtop level. An analytical expert in KAERI attended the "Consultants' Meeting"at IAEA headquater and prepared the guideline for chemical analysis ogroundwater.
Subject Keywords(About 10 words)
1999 IAEA Interlaboratory Comparison, groundwater.chemical analysis, ICP-AES, AAS, Ion Chromatographyconsultants' meeting, Isotope hydrology, guideline forchemical analysis, quality control, pH, conductivity