1h2018 results presentation - yoma strategic holdings ltd
TRANSCRIPT
1H2018 Results Presentation

2
24.925.8
33.1
10.310.5
14.88.5
2.8 3.7
41.4%
40.6%
44.7%
38%
39%
40%
41%
42%
43%
44%
45%
46%
0
5
10
15
20
25
30
35
2Q17 1Q18 2Q18
Revenue Gross Profit
Net Profit attributable to Equity Holders Gross Margins
S$ million
2Q2018 FINANCIAL HIGHLIGHTS
2
▪ Stronger operating results saw revenue and gross profit increase quarter-on-quarter and year-on-year
▪ Lower year-on-year net profit was largely due to the absence of fair value gains from the
telecommunications towers investment recorded in 2Q2017
3
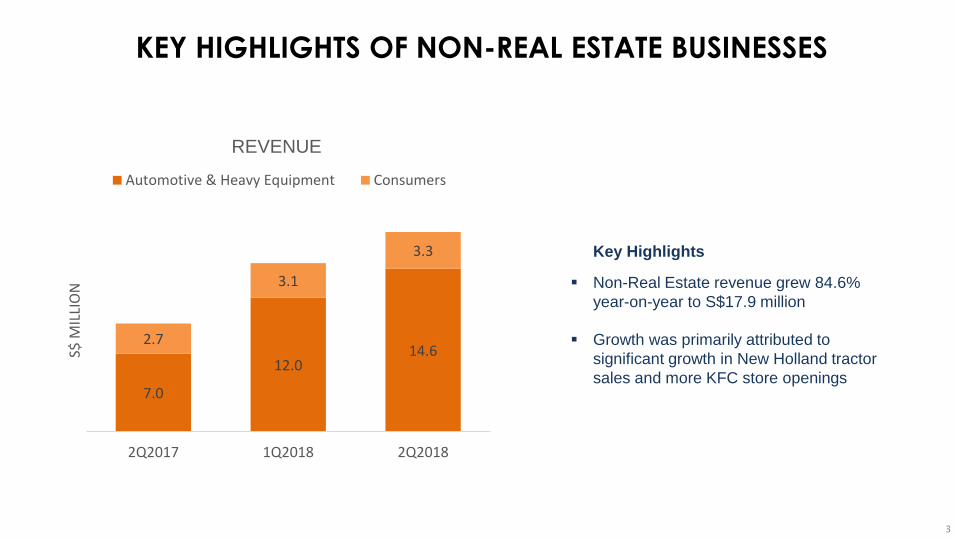
KEY HIGHLIGHTS OF NON-REAL ESTATE BUSINESSES
Key Highlights
▪ Non-Real Estate revenue grew 84.6%
year-on-year to S$17.9 million
▪ Growth was primarily attributed to
significant growth in New Holland tractor
sales and more KFC store openings7.0
12.014.6
2.7
3.1
3.3
2Q2017 1Q2018 2Q2018
S$ M
ILLI
ON
REVENUE
Automotive & Heavy Equipment Consumers

4
Key Highlights
▪ Overall Real Estate revenue improved
from 1Q2018 and was stable on a year-on-
year basis
▪ Revenue in 2Q2018 was driven by the
profits from sales of residences in Galaxy
Towers and the additional share of profits
in StarCity Zone B following its completion
9.9
6.2
9.8
5.4
4.6
5.4
2Q2017 1Q2018 2Q2018
S$ M
ILLI
ON
REVENUE
Sale of Residences & LDRs Real Estate Rental & Services
KEY HIGHLIGHTS OF REAL ESTATE BUSINESS

1H2018 PROFIT AND LOSS ITEMS
S$ million 2Q2018 2Q2017 1H2018 1H2017
Revenue 33.1 24.9 59.0 42.6
Cost of sales (18.3) (14.6) (33.8) (25.5)
Gross profit 14.8 10.3 25.2 17.1
Other income, net 7.6 16.3 16.5 28.0
Expenses
- Administrative (13.5) (12.4) (25.8) (24.4)
- Finance (0.3) (3.9) (2.2) (6.2)
Share of losses of associated
companies(0.5) (0.9) (0.5) (1.5)
Share of losses of joint ventures (0.4) (1.1) (0.7) (1.5)
Profit before income tax 7.7 8.3 12.5 11.4
Income tax expense (0.4) (0.1) (0.5) (0.7)
Profit from continuing operations 7.3 8.2 12.0 10.8
Net Loss from discontinued
operations(0.7) (0.6) (1.5) (1.1)
Total Profit 6.6 7.6 10.5 9.65
Results of the tourism
business are now
classified as Disposal
Group Classified as Held
for Sale

KEY BALANCE SHEET ITEMS
S$ million 30 Sep 2017 31 Mar 2017
Cash and cash equivalents 67.0 34.8
Development properties 337.3 262.8
Land development rights 219.3 219.3
Investment properties 254.4 219.3
Trade and other receivables 58.6 138.7
Financial asset at fair value through profit or loss 48.4 49.8
Trade and other payables 158.7 147.7
Bank borrowings 197.1 165.9
Net assets attributable to equity shareholders 658.7 664.2
NAV/Share (cents) 37.9 38.2
Includes net value of restructured tourism
group at S$45.5 million as at 30 September
2017
− Yoma Strategic has a 63.1% interest
in the restructured tourism group
− Expected to book a gain on disposal
upon the completion of the tourism
spin-off exercise
6
Net financial gearing ratio currently standing
at 13.6% as at 30 September 2017
The financial gearing ratio is calculated as net debt divided by total capital. Net debt is calculated as borrowings (excluding loans from non-controlling interests) less cash and cash equivalents. Total capital is calculated as total equity plus net debt
Additional development properties from the
buyback of Galaxy Towers
Decline is due to the buyback of Galaxy
Towers owing by the investors

TRANSFORMING INTO A DISCIPLINED CONGLOMERATE
6
7
Ahead of our 2020 Target
Non-real-estate businesses
contributed 47% of FY2017 revenue
and 56% of 1H2018 revenue with
improved gross margins
2020 Vision
Target is to have at least 50%
of the revenue generated
by non-real estate
businesses and to increase
real estate rental income
6%15%
39%47%
56%3%
7%
16%
16%
17%
91%
78%
45%
37%
27%
FY2014 FY2015 FY2016 FY2017 1H2018
Non-Real Estate Businesses Real Estate Rental & Services Sales of residences & Land Development Rights

8
TARGET TO TRIPLE OUR SIZE BY 2023
Building dominant positions and nationwide footprints
Enhance autonomy and capabilities of each business unit
Rationalise non-core businesses and assets
FOOD MOTOR LAND

Business Updates

13 KFC STORES IN YANGON
Domestic Terminal
Junction MawtinJunction Square
ONE
Shopping Malls
• Myanmar Plaza
• Junction Mawtin
• Capital Thaketa
• Dagon Centre
• Junction City
• AEON Orange Waizayantar
• SuperOne Hlaing Tharyar
Airports
• International &
Domestic Terminals
Residential Estates
• StarCity
Standalone Stores
• ONE
• Junction Square
• Hledan
10

Massive opening day turnout for our Mandalay and Taunggyi stores
11
2 KFC STORES IN MANDALAY & 1 KFC STORE IN TAUNGGYI

12
12
16
22
50+
Revenue S$11 million
Store count
March
2017
September
2017
March
2018
2020+
FOOD & BEVERAGE EXPANSION STRATEGY
Phase I:
Nationwide build for
KFC stores
Phase II:
Acquire and develop
new brands

13
147120
202138
119 119
181
273244
290264
241
221
159238
228
549
484
457
457
5.84.7
7.16.0 5.6
5.3
8.2
11.09.8
12.5
0
2
4
6
8
10
12
14
1Q16 2Q16 3Q16 4Q16 1Q17 2Q17 3Q17 4Q17 1Q18 2Q18
S$ million
Tractors Implements Spare Sparts Services
Number of
tractors sold
Number of
implements sold
NEW HOLLAND TRACTORS2Q2018 revenue jumped by138% year-on-year

14
NEW HOLLAND TRACTORS
607692
534
151
500
0
200
400
600
800
1,000
1,200
1,400
FY2016 FY2017 FY2018
No.
Remaining units
from the 1st AMD
organized sale
500 units from the 2nd
AMD organized sale to
be delivered in the
coming months
Sale of New Holland tractors is expected to
continue to see strong growth
Potential Retail Sales

YOMA FLEETStable cashflows and growth from fleet
15
No. of units
124 149 152
280313 332
359
491 509540 560 565
20
0
100
200
300
400
500
600
700
Dec-14 Mar-15 Jun-15 Sep-15 Dec-15 Mar-16 Jun-16 Sep-16 Dec-16 Mar-17 Jun-17 Sep-17
Net units Disposal of units
In 2Q2018, fleet size expanded to 585 units, however 20 units were sold in the used car
market resulting in a net fleet size of 565 units

16
INCREASING RECURRING RENTAL INCOMEPortfolio of Investment Properties
StarCity International SchoolPun Hlaing International School The Campus

17
THE PENINSULA RESIDENCES
Target to launch in the coming months

18